Embed Size (px)
Citation preview

I-264 Corridor Evaluation Study July 2016 Final Report Norfolk & Virginia Beach, Virginia Page III-1
III. Military Highway Interchange
III.1 Existing Conditions
Existing conditions present at the Military Highway interchange are described focusing on roadway geometry, volumes, capacity analysis, and crash history.
III.1.1 Geometry, Speeds, Lanes, Traffic Control
Figure III.1 displays a summary of the existing roadway geometry. The Military Highway interchange is configured in a typical cloverleaf geometry with collector-distributor (CD) lanes running along I-264 through the interchange. The CD lanes continue to the east through the I-64 and Newtown Road interchanges. Concurrent flow HOV lanes extend through theinterchange on the mainline freeway, located on the innermost lane of each direction of travel.Geometric deficiencies have been identified and the more notable deficiencies include:
2 lane exit ramp design from EB 264 exit to CD is non-compliant Ramp speeds are non-compliant at 8 locations Ramp spacing is non-compliant at 4 locations Ramp gores are non-compliant at 3 locations Lane reduction length is non-compliant on WB CD to WB 264
Additional details on the existing conditions geometry at the Military Highway interchange can be found in the Technical Appendix.
III.1.2 Volumes & Operations
Figure III.2: Existing Volumes displays the existing volumes for the Military Highway interchange for the year 2014. Traffic counts were conducted during early December 2014, with counts conducted on Tuesdays, Wednesdays and/or Thursdays. The peak hour counts document the typical commuter pattern on I-264, with heavier volumes in the westbound direction during the AM peak period and in the eastbound direction during the PM peak period. On Military Highway, the heavier volumes are in the northbound direction in the AM peak period and in the southbound direction in the PM peak period.
Table 3.1 displays a summary of the results of the capacity analysis of existing conditions using the Highway Capacity Manual software (HCS) package, and as shown in the results, the interchange exhibits a number of deficiencies. Specifically, West of Military Highway, westbound I-264 mainline freeway lanes operates at LOS E in the AM peak hour and conversely eastbound I-264 mainline freeway lanes operates with LOS E in the PM peak hour. The only deficiency involving a ramp movement is the diverge movement from eastbound I-264 mainline to eastbound I-264 C-D lanes, which operates at LOS E in the PM peak hour. While the analysis documents these deficiencies, their relative severity is low since the threshold for LOS E begins at a density of 35.0 pc/ln/mi. None of the individual ramp movements exhibit deficiencies and operate with adequate capacity.
Deficiencies
Insufficient freeway capacity west of
interchange
Tight weaving areas
Non-compliant ramp speeds and spacing
Design Challenges
Access to CD system
Access to I-64 Interchange
Proximity to Tide LRT Station
HOV lanes
Proposed Alternatives
Diverging Diamond Figure III.4
Modified Partial Cloverleaf
Figure III.5
Preferred Partial Cloverleaf
Figure III.6
Table 3.1 Summary of 2014 Existing Conditions HCS Capacity Analysis
I-264 & Military Highway Interchange
Movement (Type) AM Peak Hour PM Peak Hour
Density (pc/mi/ln) LOS Density
(pc/mi/ln) LOS
EB I-264 West of Military Highway (Freeway) 18.7 C 39.7 E
EB I-264 ML to EB I-264 CD (Diverge) 25.0 C 37.8 E
EB I-264 CD to SB Military Hwy (Diverge) 16.0 B 20.7 C NB/SB Military Hwy & EB I-264 CD (Weave) 11.5 A 18.4 B NB Military Hwy to EB I-264 CD (Merge) 22.6 C 26.4 C
EB I-264 ML between Military Hwy and I-64 (Freeway) 16.4 B 25.4 C
WB I-264 ML between Military Hwy and I-64 (Freeway) 26.8 D 12.5 B EB I-64 to WB I-264 CD & WB I-264 CD to NB Military Hwy (Weave) 18.2 B 12.7 B
NB/SB Military Hwy & WB I-264 CD (Weave) 16.3 B 11.6 A SB Military Hwy to WB I-264 CD (Merge) 19.0 B 16.3 B
WB I-264 West of Military Highway (Freeway) 35.2 E 18.0 B

2014

2014

I-264 Corridor Evaluation Study July 2016 Final Report Norfolk & Virginia Beach, Virginia Page III-4
Table 3.2 displays a summary of the results of the existing conditions CORSIM capacity analysis for the interchange of I-264 and Military Highway. CORSIM results show an array of results ranging from LOS A to LOS D throughout the interchange. The results are similar to the HCS analysis, but they are not identical. While there are LOS D movements, there are no LOS E or LOS F movements. The LOS D movements are found in the peak direction of flow – eastbound in the PM peak hour.
Table 3.2 Summary of 2014 Existing Conditions CORSIM Capacity Analysis
I-264 & Military Highway Interchange
Movement (Type) AM Peak Hour PM Peak Hour Density
(pc/mi/ln) LOS Density (pc/mi/ln) LOS
EB I-264 West of Military Hwy (Freeway) 17.6 B 29.1 D EB I-264 ML to EB I-264 CD (Diverge) 16.9 B 31.5 D EB I-264 CD to SB Military Hwy (Diverge) 10.8 B 14.6 B NB/SB Military Hwy & EB I-264 CD (Weave) 10.5 A 15.1 B NB Military Hwy to EB I-264 CD (Merge) 20.4 C 22.0 C EB I-264 ML between Military Hwy and I-64 (Freeway) 11.7 B 20.3 C
WB I-264 ML between Military Hwy and I-64 (Freeway) 17.5 B 10.2 A
EB I-64 to WB I-264 CD (Merge) 12.2 B 8.8 A WB I-264 CD to NB Military Hwy (Diverge) 14.2 B 10.3 B NB/SB Military Hwy & WB I-264 CD (Weave) 13.1 B 8.7 A SB Military Hwy to WB I-264 CD (Merge) 13.3 B 10.4 B WB I-264 CD to WB I-264 ML (Merge) 24.5 C 14.6 B WB I-264 West of Military Hwy (Freeway) 24.8 C 15.8 B
III.1.3 Crashes
Figure III.3 displays the 4-year crash history at Military Highway for the years 2009-2012. It illustrates a large number of crashes throughout the interchange and to the east of the interchange on both the CD and mainline lanes. Crashes in both directions of travel appear to be evenly distributed. The off-ramp loop ramps in both directions of travel show a high density of crashes, which are likely related to a combination of moderate congestion and geometric deficiencies. The southbound Military Highway ramp to westbound I-264 also shows a high density of crashes nearest Military highway.
Table 3.3 summarizes the crash history by direction and type of freeway facility (Ramp, CD or mainline) at the Military Highway interchange for the period 2009-2012. A total of 149 crashes occurred in the interchange vicinity and a majority of the crashes (75) involved fixed object off-road crashes and similar majority (81) occurred on the ramps. There were 55 injury crashes and 1 fatal crash.
70% of the total crashes are a result of the two most frequent types of crashes, Rear End and Fixed Object Off-Road.
Referring to Figure III.3, most of the crashes within the interchange area are not located to the west where capacity analysis indicated operations were the most congested. In contrast, crash frequencies are much higher to the east and many of these involve movements associated with the I-64 interchange.
Table 3.3 Summary of Crash History at I-264 and Military Highway
2009-2012
Loca
tion
Type of Crash Severity
Rea
r En
d
Angl
e
Hea
d O
n
Side
swip
e -
Sam
e D
ir.
Non
-Col
lisio
n
Fixe
d O
bjec
t O
ff-R
oad
Bicy
clis
t
Mis
c
Tota
l
Prop
erty
Dam
age
Onl
y
Inju
ry
Fata
l
EB CD 6 0 0 3 0 7 0 0 16 9 7 0
WB CD 3 2 0 2 0 2 0 0 9 5 3 1
EB ML 10 4 0 3 0 7 0 0 24 14 10 0
WB ML 3 1 0 1 0 14 0 0 19 9 10 0
Ramps 7 7 7 5 6 45 1 3 81 56 25 0
Total 29 14 7 14 6 75 1 3 149 93 55 1
Capacity Analysis indicates that all ramps at the Military Highway interchange are
currently operating with adequate capacity

Curlew DrSt
Bartee St
Sellger Dr
Adderley St
Chambers St
Orion Ave
Jerry Rd
Hargrove St
Poplar Hall Dr
ramp
Brinda Ave
Lathan Rd
Pebble Ln
Sandpiper Ln Finney St
Corporate BlvdHunts
man R
d
Hick
s Ave
Frizz
ell Av
e
Pine Grove Ave
Welaka Rd
Hona
ker A
veLy
dia Av
e
Kidd B
lvd
Wellm
an St
Broc
kwell
Ave
Kimberly Ln
Piping Rock Rd
Glen
rock
Rd
Luca
s Ave
Mcgin
nis C
ir
Beacon Hill Cir
Effie A
ve
Pefle
y Dr
Pepper Mill Ln
Valle
au Rd
Inez A
ve
Betty
Ct
Lucian Ct
Faulk
RdSaddle Rock Rd
Poplar Hall Cir
Holton Ct
Jerry
Ct
Driveway
Beac
on H
ill Ct
Pepp
er Mi
ll Ct
St
Frizz
ell Av
e
Broc
kwell
Ave
Hick
s Ave
Wellm
an St
Finney St
Luca
s Ave
£¤13
£¤13
§̈¦264
§̈¦264
Milit
ary H
wy
I-264 Corridor Evaluation Study
Figure XX July 2016
Crash Type Map (2009-2012)I-264 & Military Hwy Interchange
0 400200Feet
¢
LEGENDCRASH TYPE
Rear EndAngleHead OnSideswipe - Same DirectionSideswipe - Opposite DirectionFixed Object in RoadTrainNon-CollisionFixed Object - Off RoadBicyclistMotorcyclistBacked IntoOther
I-264 Corridor Evaluation Study July 2016 Final Report Norfolk & Virginia Beach, Virginia Page III-6
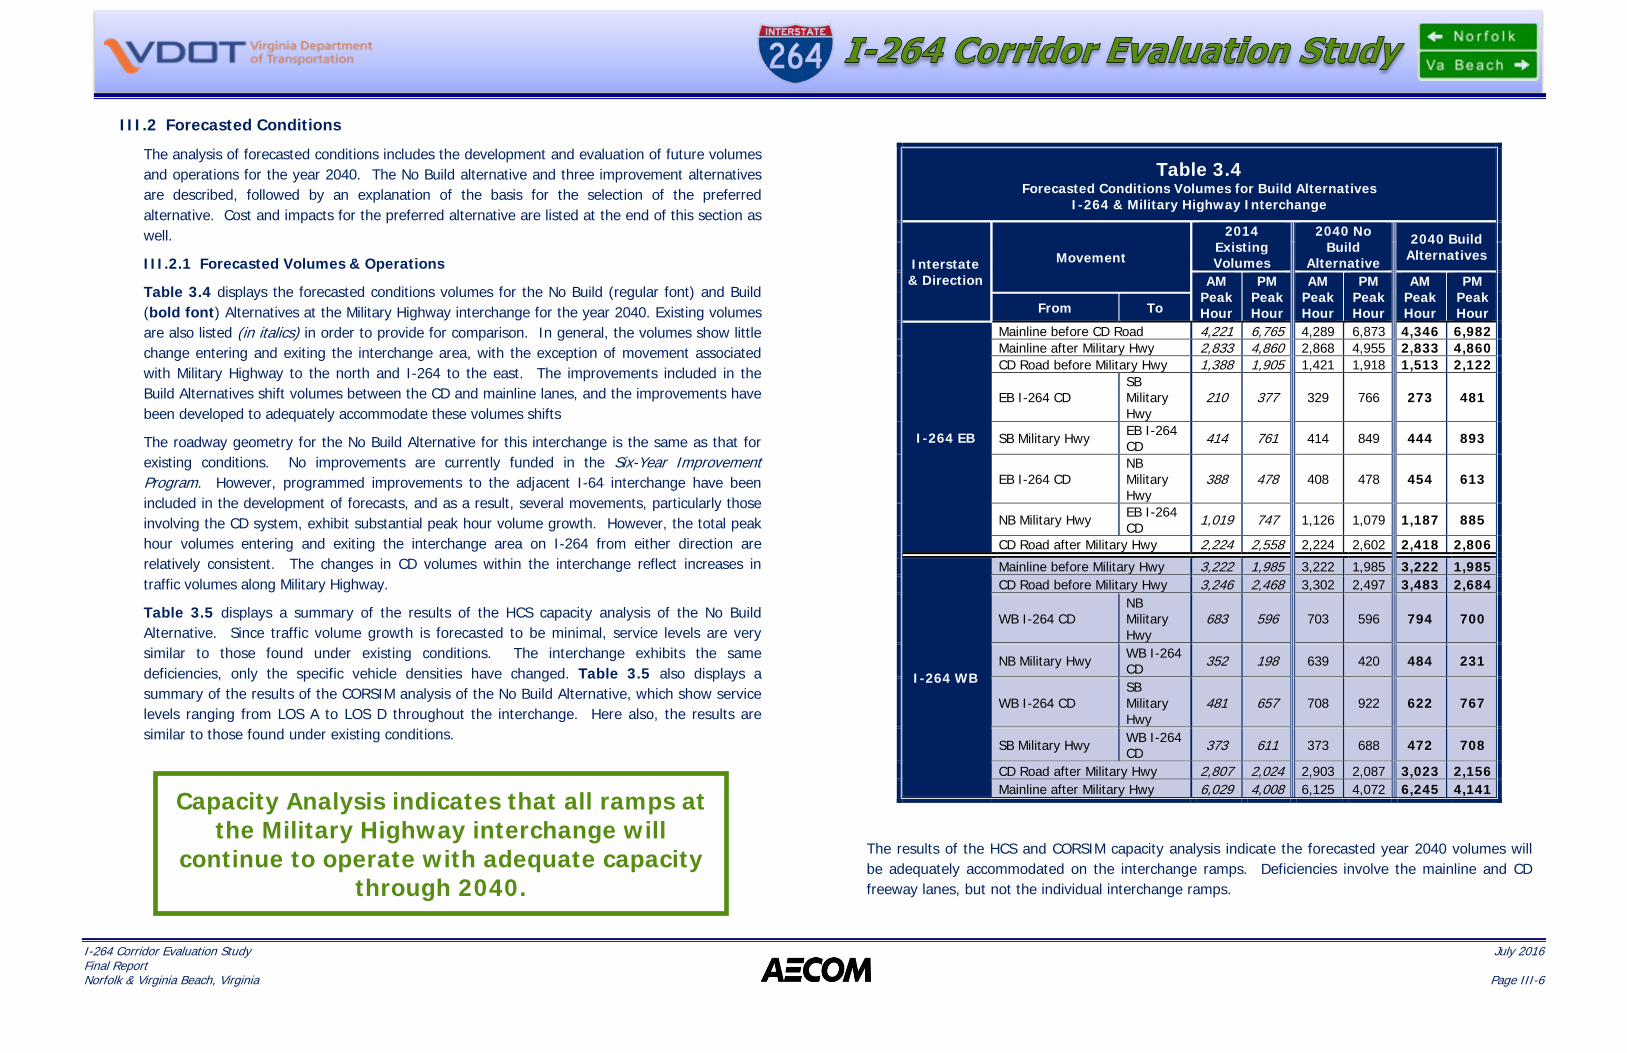
III.2 Forecasted Conditions
The analysis of forecasted conditions includes the development and evaluation of future volumes and operations for the year 2040. The No Build alternative and three improvement alternatives are described, followed by an explanation of the basis for the selection of the preferred alternative. Cost and impacts for the preferred alternative are listed at the end of this section as well.
III.2.1 Forecasted Volumes & Operations
Table 3.4 displays the forecasted conditions volumes for the No Build (regular font) and Build (bold font) Alternatives at the Military Highway interchange for the year 2040. Existing volumes are also listed (in italics) in order to provide for comparison. In general, the volumes show little change entering and exiting the interchange area, with the exception of movement associated with Military Highway to the north and I-264 to the east. The improvements included in the Build Alternatives shift volumes between the CD and mainline lanes, and the improvements have been developed to adequately accommodate these volumes shifts
The roadway geometry for the No Build Alternative for this interchange is the same as that for existing conditions. No improvements are currently funded in the Six-Year Improvement Program. However, programmed improvements to the adjacent I-64 interchange have been included in the development of forecasts, and as a result, several movements, particularly those involving the CD system, exhibit substantial peak hour volume growth. However, the total peak hour volumes entering and exiting the interchange area on I-264 from either direction are relatively consistent. The changes in CD volumes within the interchange reflect increases in traffic volumes along Military Highway.
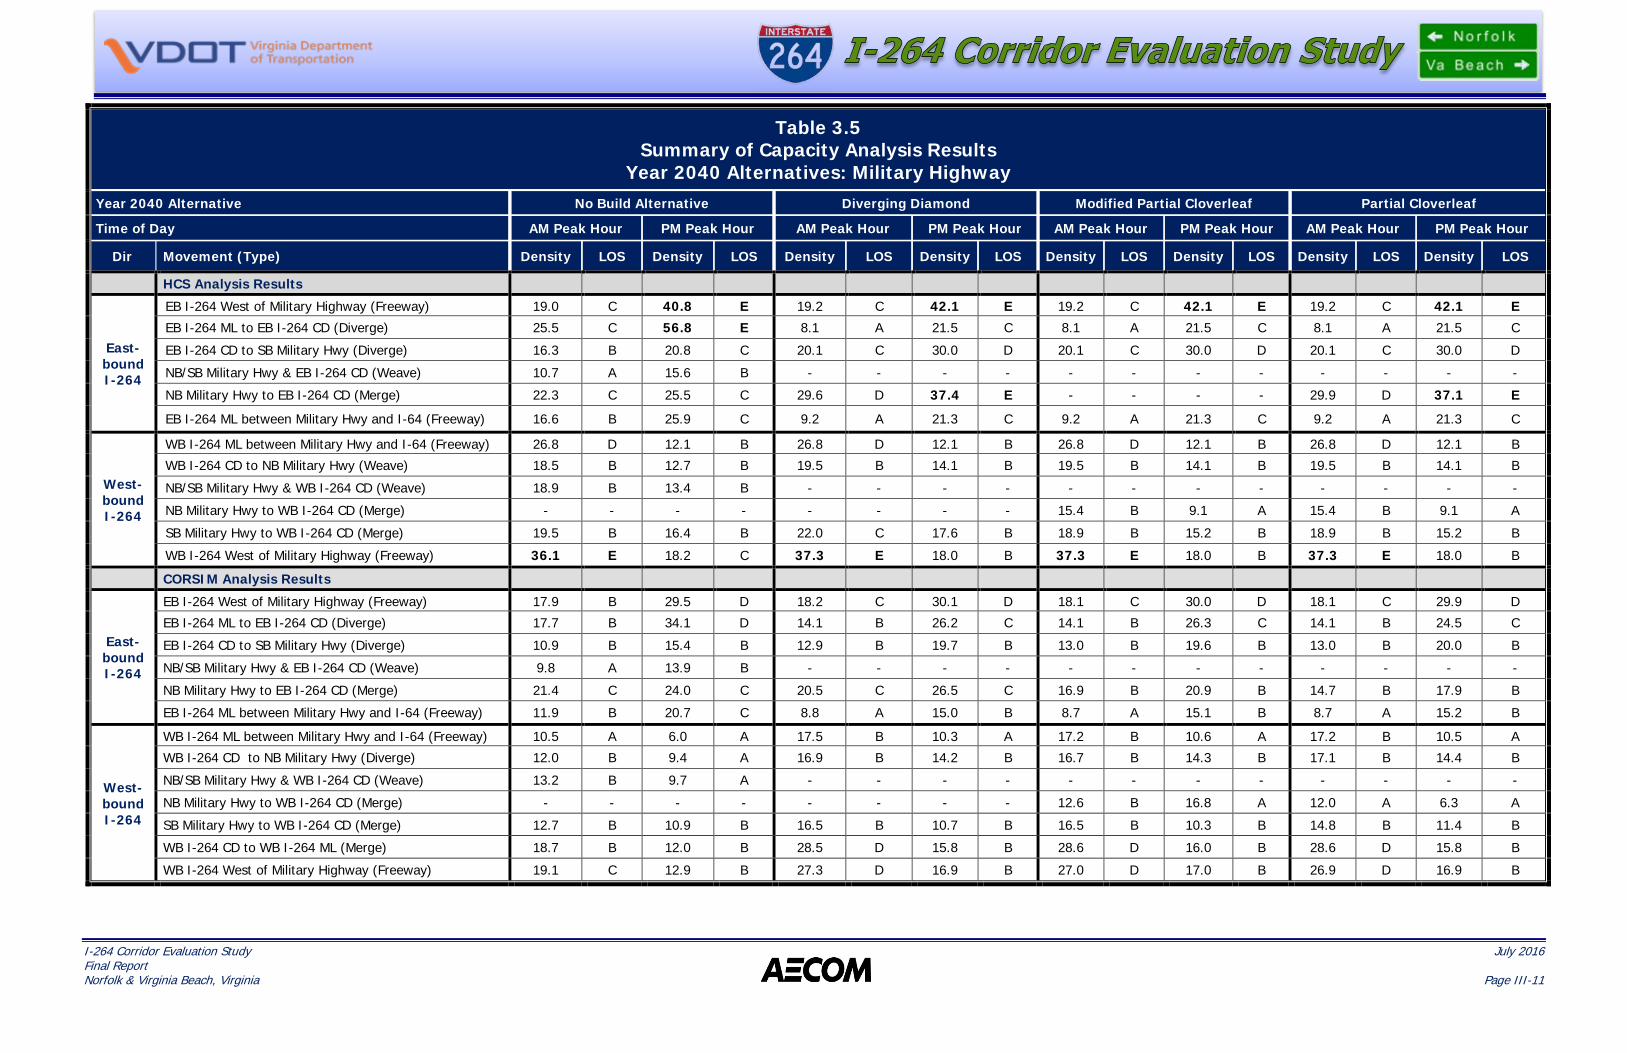
Table 3.5 displays a summary of the results of the HCS capacity analysis of the No Build Alternative. Since traffic volume growth is forecasted to be minimal, service levels are very similar to those found under existing conditions. The interchange exhibits the same deficiencies, only the specific vehicle densities have changed. Table 3.5 also displays a summary of the results of the CORSIM analysis of the No Build Alternative, which show service levels ranging from LOS A to LOS D throughout the interchange. Here also, the results are similar to those found under existing conditions.
Table 3.4 Forecasted Conditions Volumes for Build Alternatives
I-264 & Military Highway Interchange
Interstate & Direction
Movement
2014 Existing Volumes
2040 No Build
Alternative
2040 Build Alternatives
AM Peak Hour
PM Peak Hour
AM Peak Hour
PM Peak Hour
AM Peak Hour
PM Peak Hour From To
I-264 EB
Mainline before CD Road 4,221 6,765 4,289 6,873 4,346 6,982 Mainline after Military Hwy 2,833 4,860 2,868 4,955 2,833 4,860 CD Road before Military Hwy 1,388 1,905 1,421 1,918 1,513 2,122
EB I-264 CD SB Military Hwy
210 377 329 766 273 481
SB Military Hwy EB I-264 CD 414 761 414 849 444 893
EB I-264 CD NB Military Hwy
388 478 408 478 454 613
NB Military Hwy EB I-264 CD 1,019 747 1,126 1,079 1,187 885
CD Road after Military Hwy 2,224 2,558 2,224 2,602 2,418 2,806
I-264 WB
Mainline before Military Hwy 3,222 1,985 3,222 1,985 3,222 1,985 CD Road before Military Hwy 3,246 2,468 3,302 2,497 3,483 2,684
WB I-264 CD NB Military Hwy
683 596 703 596 794 700
NB Military Hwy WB I-264 CD 352 198 639 420 484 231
WB I-264 CD SB Military Hwy
481 657 708 922 622 767
SB Military Hwy WB I-264 CD 373 611 373 688 472 708
CD Road after Military Hwy 2,807 2,024 2,903 2,087 3,023 2,156 Mainline after Military Hwy 6,029 4,008 6,125 4,072 6,245 4,141
The results of the HCS and CORSIM capacity analysis indicate the forecasted year 2040 volumes will be adequately accommodated on the interchange ramps. Deficiencies involve the mainline and CD freeway lanes, but not the individual interchange ramps.
Capacity Analysis indicates that all ramps at the Military Highway interchange will
continue to operate with adequate capacity through 2040.

I-264 Corridor Evaluation Study July 2016 Final Report Norfolk & Virginia Beach, Virginia Page III-7
III.2.2 Improvement Alternatives
Although capacity analysis of the Military Highway interchange indicates that no ramp deficiencies are forecasted to occur, the interchange still exhibits geometry deficiencies. Consequently, any major maintenance activities (such as bridge replacement) should be designed to incorporate consideration of a plan for future improvements. To that end, three improvement alternatives have been developed and analyzed. These are shown in Figures III.4, III.5 and III.6. Geometric compliance has been intentionally provided with all proposed improvements.
The first improvement alternative in Figure III.4 - Diverging Diamond - consists of converting the Military Highway approaches into a diverging diamond configuration. This improvement alternative removes all weave movements and stays within the existing right of way.
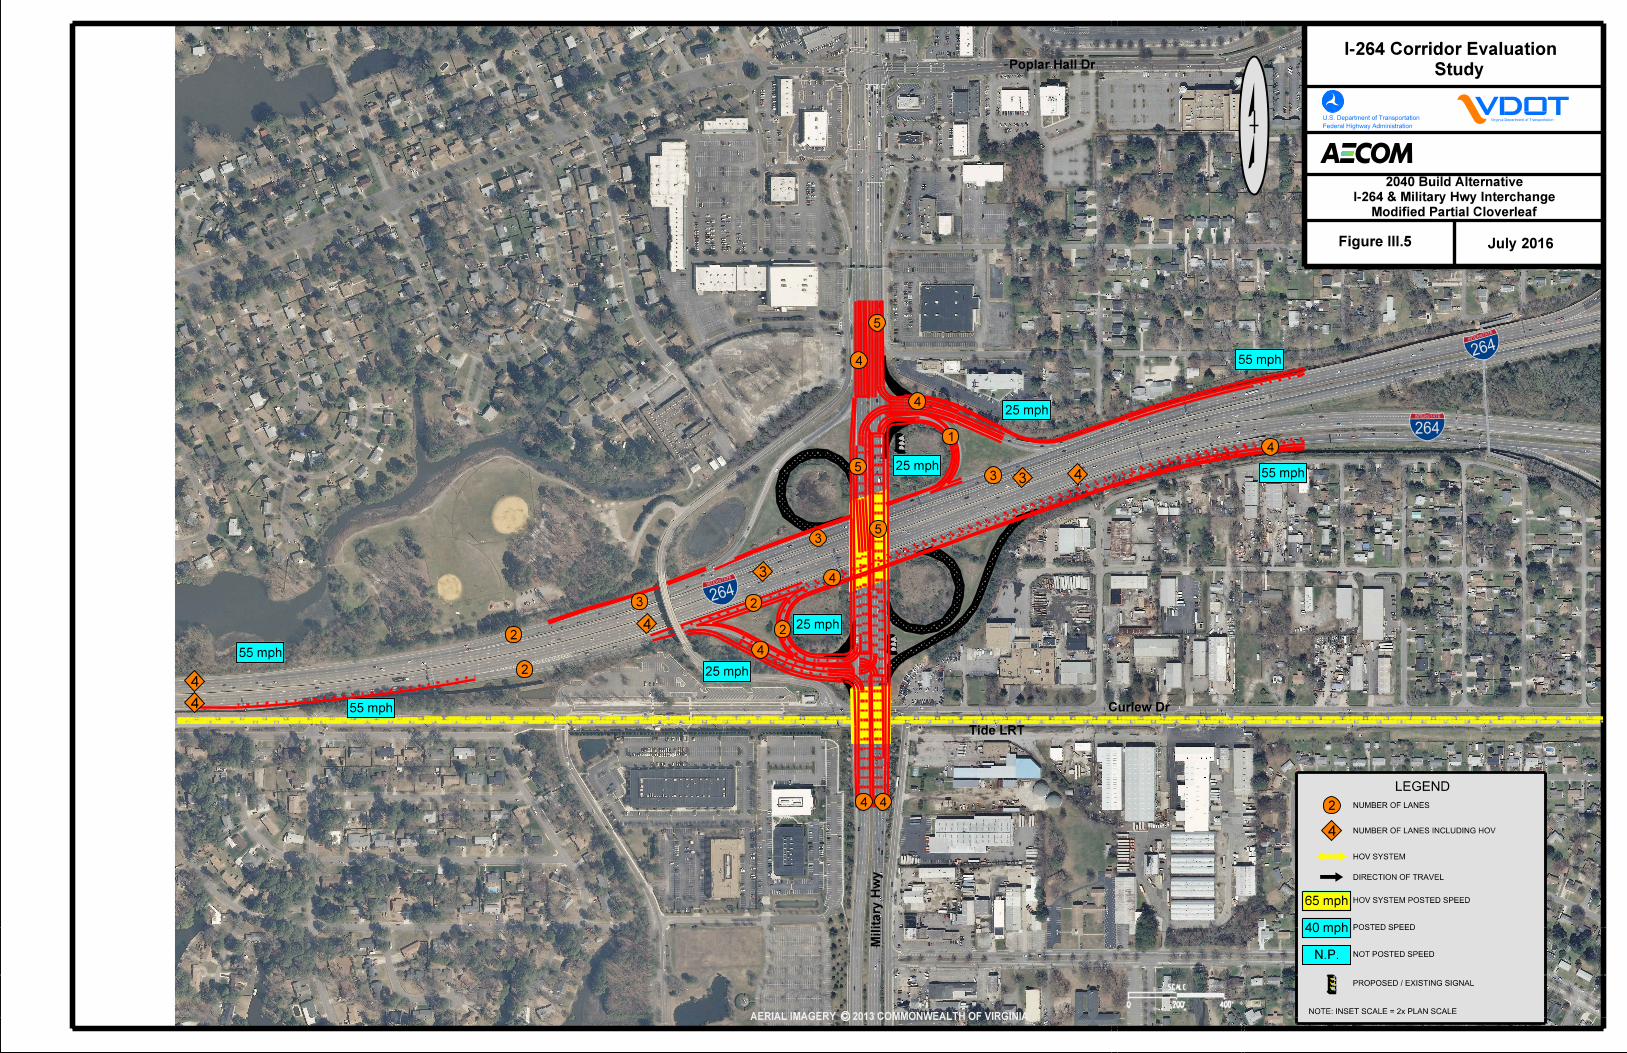
The second improvement alternative in Figure III.5 - Modified Partial Cloverleaf - consists of converting the interchange into a partial cloverleaf configuration. All weave movements are eliminated and all movements are removed from the southeast quadrant.
The third improvement alternative in Figure III.6 - Partial Cloverleaf - also provides for a partial cloverleaf configuration. In contrast with the second improvement alternative, the on-ramp from northbound Military Highway to eastbound I-264 is maintained.
The improvement alternatives have been analyzed using the same procedures – HCS and CORSIM - used in the analysis of existing conditions and No Build Alternative. The results of the capacity analysis for all the forecasted year 2040 alternatives (including the No Build Alternative) are shown in Table 3.5. In addition, SimTraffic simulation software capacity and queue analysis was conducted for each improvement alternative at signalized intersections and the results for all the year 2040 improvement alternatives are shown in Table 3.6 and Table 3.7.
Diverging Diamond
The Diverging Diamond removes all weave movements but adds two traffic signals at the ramp junctions. The results in Table 3.5 show that all of the movements associated with the interchange ramps exhibit adequate service levels of D or better, except the merge from northbound Military Highway to eastbound I-264 CD which exhibits LOS E in the PM peak hour. The adjacent mainline freeway sections exhibit LOS E in the westbound direction in the AM peak hour and in the eastbound direction in the PM peak hour.
For the two signalized intersections, the SimTraffic capacity analysis summarized in Table 3.6 indicates all services levels will be C or better with the exception of the intersection of the westbound I-264 CD off-ramp, which is forecasted to operate at LOS D.
Table 3.7 presents a summary of the SimTraffic queueing analysis, and the results show that vehicle queues extending from the traffic signals will be easily accommodated by the storage available on the respective off-ramps.
Modified Partial Cloverleaf
The second improvement alternative provides for a partial cloverleaf interchange by removing the I-264 off-loops and adding traffic signals at the off-ramp junctions with Military Highway. The term “modified” was applied because in addition to removal of the off-loops, the eastbound I-264 CD on-ramp from northbound Military Highway is also removed. The purpose of removing the on-ramp was to evaluate the operation of the eastbound I-264 CD between Military Highway and I-264 with a longer weave section. By routing all traffic to the on loop in the southwest quadrant of the interchange (See Figure III.5), the distance from the downstream ramp to eastbound I-64 is extended by approximately 1,000 feet.
The results in Table 3.5 show that all of the movements associated with the interchange ramps exhibit adequate service levels of C or better. The adjacent mainline freeway sections exhibit LOS E in the westbound direction in the AM peak hour and in the eastbound direction in the PM peak hour.
For the two signalized intersections, Table 3.6 indicates all services levels will be C or better with the exception LOS D at the intersection of the eastbound I-264 CD off-ramp. With an average vehicle delay of 49.5 seconds, this intersection is strained to accommodate all of the PM peak hour volumes destined for eastbound I-264 from Military Highway while adequately servicing the other three approach movements.
Table 3.7 presents a summary of the SimTraffic queueing analysis, and the results show that vehicle queues extending from the traffic signals will be accommodated by the storage available on the respective off-ramps. The eastbound left turn to northbound Military Highway exhibits a 95% queue length of 453 feet on an approach providing triple left turn lanes.
Partial Cloverleaf
The third improvement alternative provides for a partial cloverleaf interchange by removing the I-264 off-loops and adding traffic signals at the off-ramp junctions with Military Highway.
The results in Table 3.5 show that all of the movements associated with the interchange ramps exhibit adequate service levels of D or better, except the merge from northbound Military Highway to eastbound I-264 CD which exhibits LOS E in the PM peak hour. The adjacent mainline freeway sections exhibit LOS E in the westbound direction in the AM peak hour and in the eastbound direction in the PM peak hour.
For the two signalized intersections, Table 3.6 indicates all services levels will be C or better.
Finally, the results in Table 3.7 show that vehicle queues extending from the traffic signals will be accommodated by the storage available on the respective off-ramps. Here again, the eastbound left turn to northbound Military Highway exhibits the longest 95% queue length, but on dual left turn lane approach, it is still shorter than the same approach on the Modified Partial Cloverleaf alternative.


I-264 Corridor Evaluation Study July 2016 Final Report Norfolk & Virginia Beach, Virginia Page III-11
Table 3.5 Summary of Capacity Analysis Results
Year 2040 Alternatives: Military Highway Year 2040 Alternative No Build Alternative Diverging Diamond Modified Partial Cloverleaf Partial Cloverleaf
Time of Day AM Peak Hour PM Peak Hour AM Peak Hour PM Peak Hour AM Peak Hour PM Peak Hour AM Peak Hour PM Peak Hour
Dir Movement (Type) Density LOS Density LOS Density LOS Density LOS Density LOS Density LOS Density LOS Density LOS
HCS Analysis Results
East-bound I-264
EB I-264 West of Military Highway (Freeway) 19.0 C 40.8 E 19.2 C 42.1 E 19.2 C 42.1 E 19.2 C 42.1 E
EB I-264 ML to EB I-264 CD (Diverge) 25.5 C 56.8 E 8.1 A 21.5 C 8.1 A 21.5 C 8.1 A 21.5 C
EB I-264 CD to SB Military Hwy (Diverge) 16.3 B 20.8 C 20.1 C 30.0 D 20.1 C 30.0 D 20.1 C 30.0 D
NB/SB Military Hwy & EB I-264 CD (Weave) 10.7 A 15.6 B - - - - - - - - - - - -
NB Military Hwy to EB I-264 CD (Merge) 22.3 C 25.5 C 29.6 D 37.4 E - - - - 29.9 D 37.1 E
EB I-264 ML between Military Hwy and I-64 (Freeway) 16.6 B 25.9 C 9.2 A 21.3 C 9.2 A 21.3 C 9.2 A 21.3 C
West-bound I-264
WB I-264 ML between Military Hwy and I-64 (Freeway) 26.8 D 12.1 B 26.8 D 12.1 B 26.8 D 12.1 B 26.8 D 12.1 B
WB I-264 CD to NB Military Hwy (Weave) 18.5 B 12.7 B 19.5 B 14.1 B 19.5 B 14.1 B 19.5 B 14.1 B
NB/SB Military Hwy & WB I-264 CD (Weave) 18.9 B 13.4 B - - - - - - - - - - - -
NB Military Hwy to WB I-264 CD (Merge) - - - - - - - - 15.4 B 9.1 A 15.4 B 9.1 A
SB Military Hwy to WB I-264 CD (Merge) 19.5 B 16.4 B 22.0 C 17.6 B 18.9 B 15.2 B 18.9 B 15.2 B
WB I-264 West of Military Highway (Freeway) 36.1 E 18.2 C 37.3 E 18.0 B 37.3 E 18.0 B 37.3 E 18.0 B
CORSIM Analysis Results
East-bound I-264
EB I-264 West of Military Highway (Freeway) 17.9 B 29.5 D 18.2 C 30.1 D 18.1 C 30.0 D 18.1 C 29.9 D
EB I-264 ML to EB I-264 CD (Diverge) 17.7 B 34.1 D 14.1 B 26.2 C 14.1 B 26.3 C 14.1 B 24.5 C
EB I-264 CD to SB Military Hwy (Diverge) 10.9 B 15.4 B 12.9 B 19.7 B 13.0 B 19.6 B 13.0 B 20.0 B
NB/SB Military Hwy & EB I-264 CD (Weave) 9.8 A 13.9 B - - - - - - - - - - - -
NB Military Hwy to EB I-264 CD (Merge) 21.4 C 24.0 C 20.5 C 26.5 C 16.9 B 20.9 B 14.7 B 17.9 B
EB I-264 ML between Military Hwy and I-64 (Freeway) 11.9 B 20.7 C 8.8 A 15.0 B 8.7 A 15.1 B 8.7 A 15.2 B
West-bound I-264
WB I-264 ML between Military Hwy and I-64 (Freeway) 10.5 A 6.0 A 17.5 B 10.3 A 17.2 B 10.6 A 17.2 B 10.5 A
WB I-264 CD to NB Military Hwy (Diverge) 12.0 B 9.4 A 16.9 B 14.2 B 16.7 B 14.3 B 17.1 B 14.4 B
NB/SB Military Hwy & WB I-264 CD (Weave) 13.2 B 9.7 A - - - - - - - - - - - -
NB Military Hwy to WB I-264 CD (Merge) - - - - - - - - 12.6 B 16.8 A 12.0 A 6.3 A
SB Military Hwy to WB I-264 CD (Merge) 12.7 B 10.9 B 16.5 B 10.7 B 16.5 B 10.3 B 14.8 B 11.4 B
WB I-264 CD to WB I-264 ML (Merge) 18.7 B 12.0 B 28.5 D 15.8 B 28.6 D 16.0 B 28.6 D 15.8 B
WB I-264 West of Military Highway (Freeway) 19.1 C 12.9 B 27.3 D 16.9 B 27.0 D 17.0 B 26.9 D 16.9 B

I-264 Corridor Evaluation Study July 2016 Final Report Norfolk & Virginia Beach, Virginia Page III-12
Table 3.6 Summary of 2040 Build SimTraffic Capacity Analysis I-264 at Military Highway Improvement Alternatives
Intersection AM Peak Hour PM Peak Hour
Delay (sec/veh) LOS Delay
(sec/veh) LOS
Diverging Diamond (Figure II I .4) Military Highway/I-264 WB CD Off-Ramp 25.1 C 36.7 D
Military Highway/I-264 EB CD Off-Ramp 20.9 C 20.0 B
Modified Partial Cloverleaf (Figure III .5) Military Highway/I-264 WB CD Off-Ramp 27.0 C 33.6 C
Military Highway/I-264 EB CD Off-Ramp 36.9 D 49.5 D
Partial Cloverleaf (Figure III .6) Military Highway/I-264 WB CD Off-Ramp 22.7 C 34.0 C
Military Highway/I-264 EB CD Off-Ramp 27.5 C 19.6 B
III.2.3 Alternative: Cost
Planning level cost estimates were developed for the three improvement alternatives for the Military Highway Interchange. Detailed calculations have been included in the Technical Appendix. It should be noted that the estimates do not include costs associated with complete removal of existing I-264 through lanes and inflation/escalation. A 4” overlay was assumed over portions of I-264 that are not being completely removed. The cost estimates in year 2015 dollars are:
Alternative Cost (in $million)
Diverging Diamond $75.4
Modified Partial Cloverleaf $145.7
Partial Cloverleaf $147.2
III.2.4 Stakeholder Coordination
Coordination meetings were held with staff from the City of Norfolk and Hampton Roads Transit (HRT). In general, representatives from both agencies were supportive of the evaluation process and the selection of the Partial Cloverleaf as the preferred alternative.
HRT staff conveyed their concern for potential access enhancements to the LRT station on Curlew Drive, and they expressed concern that the Diverging Diamond alternative would not be as accommodative of future improvements.
Norfolk staff echoed the concern on LRT station access. Regarding the preferred alternative, they recognize addressing many issues better than the other alternatives, and accept that it
Table 3.7 Summary of 2040 Build SimTraffic Queue Analysis
I-264 at Military Highway Improvement Alternatives
Intersection Ramp Length (feet)
AM Peak Hour PM Peak Hour
Left Movement Right Movement Left Movement Right
Movement
Avg (feet)
95th % (feet)
Avg (feet)
95th %
(feet)
Avg (feet)
95th %
(feet)
Avg (feet)
95th % (feet)
Diverging Diamond (Figure II I .4)
WB I-264 CD Off-Ramp to Military Highway
1,230 70 126 192 273 146 223 117 178
EB I-264 CD Off-Ramp to Military Highway
1,280 83 134 41 79 74 131 119 182
Modified Partial Cloverleaf (Figure III .5) WB I-264 CD Off-Ramp to Military Highway
1,230 213 301 242 330 278 381 209 302
EB I-264 CD Off-Ramp to Military Highway
1,280 185 264 75 148 334 453 245 395
Partial Cloverleaf (Figure III .6) WB I-264 CD Off-Ramp to Military Highway
1,230 213 311 249 346 302 417 285 194
EB I-264 CD Off-Ramp to Military Highway
1,280 187 273 64 109 243 342 153 223

I-264 Corridor Evaluation Study July 2016 Final Report Norfolk & Virginia Beach, Virginia Page III-13
would be a good starting point for commencing an Interchange Modification Report once improvements have been funded.
III.2.5 Impacts
Identification of potential impacts on key resources from construction of the three improvement alternatives was evaluated using desktop GIS mapping analysis. Detailed exhibits are in the Technical Appendix. Summarized in Table 3.8, the results show that all three alternatives would impact water resources (wetlands, for example) and would also potentially impact Section 4(f) properties (public parks, for example). Only the Diverging Diamond alternative would not impact adjacent buildings and residences.
Table 3.8 Military Highway Interchange Improvement Alternative Impacts
Improvement Alternative WATER BUILDINGS RESIDENTIAL POTENTIAL
SECTION 4F
Diverging Diamond Y 0 0 N
Modified Partial Cloverleaf
Y 1 8 Y
Partial Cloverleaf Y 1 8 Y
III.3 Recommendation
Although on the basis of cost and resource impacts, the Diverging Diamond would be the most likely candidate for the preferred alternative, the weight of the concerns expressed by the City of Norfolk staff related to access to the Tide LRT station on Curlew Drive must be respected.
As discussed earlier in this section, neither existing nor forecasted traffic operations of the individual interchange ramps exhibit major deficiencies. In contrast, the principal deficiencies involve roadway geometry, and it is unlikely that funding for improvements based on geometric issues will receive a high ranking when competing with local, regional or state project that show substantial congestion relief. Consequently, unless current priorities change, funds for major improvements to this interchange are unlikely to be programmed by the year 2040.
However, while the roadway improvements may not be imminent, improvements to other transportation modes may be likely in the nearer term. The City of Norfolk is evaluating an extension of transit service alternative from the LRT to the Naval Station, and one alternative route may potentially use the LRT station at Curlew Drive as a transfer point. Until the transit
extension analysis has been completed, adopting any plan that could be interpreted as limiting access to the LRT station would likely be counterproductive.
To provide for addressing the major geometric deficiencies in the interchange – the weave movements – and to provide future transit service alternatives analysis with flexibility for accessing the LRT station on Curlew Drive, the recommended Preferred Alternative for the Military Highway Interchange is the Partial Cloverleaf.