Embed Size (px)
Citation preview
PROFILE ON THE PRODUCTION OF ABSORBENT
COTTON

Table of ContentsI. SUMMARY..........................................................................................................................1II. PRODUCT DESCRIPTION AND APPLICATION...............................................................3III. MARKET STUDY AND PLANT CAPACITY...................................................................3IV. RAW MATERIALS AND INPUTS....................................................................................7V. TECHNOLOGY AND ENGINEERING..........................................................................8VI. HUMAN RESOURCE AND TRAINING REQUIREMENT............................................14VII. FINANCIAL ANALYSIS.................................................................................................16FINANCIAL ANALYSES SUPPORTING TABLES..................................................................21
ii
I. SUMMARY
This profile envisages the establishment of a plant for the production of absorbent cotton with a
capacity of 300 tons per annum. Absorbent cotton is used in for sanitary purposes and surgical
operations as well as for ordinary daily use.
The demand for absorbent cotton is met through import. The present (2012) demand for
absorbent cotton is estimated at 305 tons. The demand for absorbent cotton is projected to
reach 408 tons and 546 tons by the year 2017 and 2022, respectively.
The principal raw materials required is either virgin cotton or waste cotton which is available
locally.
The total investment cost of the project including working capital is estimated at Birr 17.56
million. From the total investment cost the highest share (Birr 13.38 million or 76.19%) is
accounted by fixed investment cost followed by initial working capital (Birr 2.12 million or
12.09%) and pre operation cost (Birr 2.06 million or 11.72%). From the total investment cost
Birr 7.68 million or 38.28% is required in foreign currency.
The project is financially viable with an internal rate of return (IRR) of 31.29% and a net present
value (NPV) of Birr 18.50 million discounted at 10%.
The project can create employment for 25 persons. The establishment of such factory will have a
foreign exchange saving effect to the country by substituting the current imports. The project
will also create backward linkage with agricultural sector and forward linkage with the
pharmaceutical and medical supplies sub sectors and also generates income for the Government
in terms of tax revenue and payroll tax.
iii
II. PRODUCT DESCRIPTION AND APPLICATION
Absorbent cotton is cleaned, de-oiled and bleached cotton packed in different sizes. Since
absorbent cotton is a material which comes in direct contact with the human body, its quality is
very important and should satisfy the required pharmaceutical parameters.
Either virgin cotton or waste cotton can be used as raw material. Combed waste cotton is
desirable in case of waste cotton. The fiber of absorbent cotton is very elastic. It consists of
(98-99.5%) cellulose which has a diameter of 16.30 mm, and a length of 12-40 mm. Absorbent
cotton is mainly used for sanitary purposes and surgical operations as well as for ordinary daily
use.
III. MARKET STUDY AND PLANT CAPACITY
A. MARKET TSUDY
1. Past Supply and Present Demand
Absorbent cotton is mostly used for medical purposes in hospitals, clinics and health stations. In
addition, it is used in pharmacies, barbers shops, beauty salons and business organizations and
households for various purposes. Currently, almost the entire requirement of absorbent cotton is
met through import. However, the imported quantity is not distinctly stated in the data of the
Ethiopian Revenues & Customs Authority. It is lumped with other absorbent fabrics that are used
for plugging wounds or for controlling blood flow in body cavities such as tampons.
Due to the reasons mentioned above the end use approach have been utilized to estimate the
demand for the product. Accordingly, data obtained on the number of health facilities and their
corresponding requirement has been utilized. Based on a study made by IPS, the average
requirement of absorbent cotton by different types of health facilities is as follows:
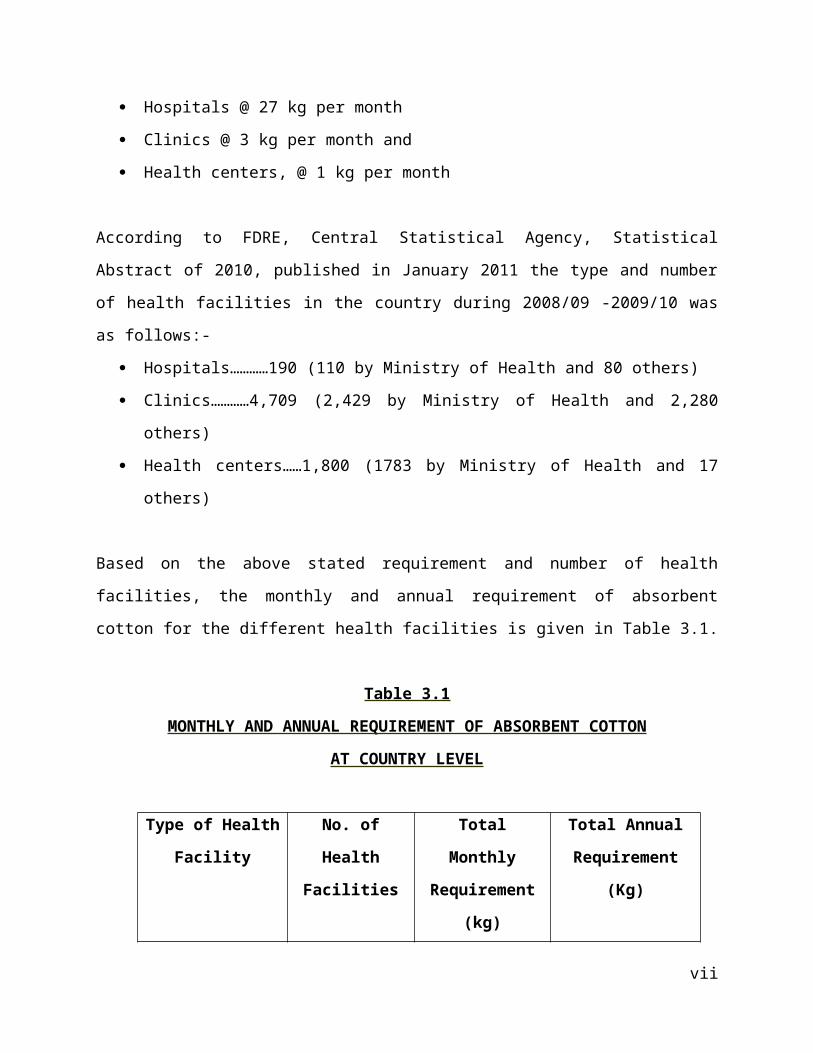
Hospitals @ 27 kg per month
Clinics @ 3 kg per month and
Health centers, @ 1 kg per month
iv
According to FDRE, Central Statistical Agency, Statistical Abstract of 2010, published in
January 2011 the type and number of health facilities in the country during 2008/09 -2009/10
was as follows:-
Hospitals…………190 (110 by Ministry of Health and 80 others)
Clinics…………4,709 (2,429 by Ministry of Health and 2,280 others)
Health centers……1,800 (1783 by Ministry of Health and 17 others)
Based on the above stated requirement and number of health facilities, the monthly and annual
requirement of absorbent cotton for the different health facilities is given in Table 3.1.
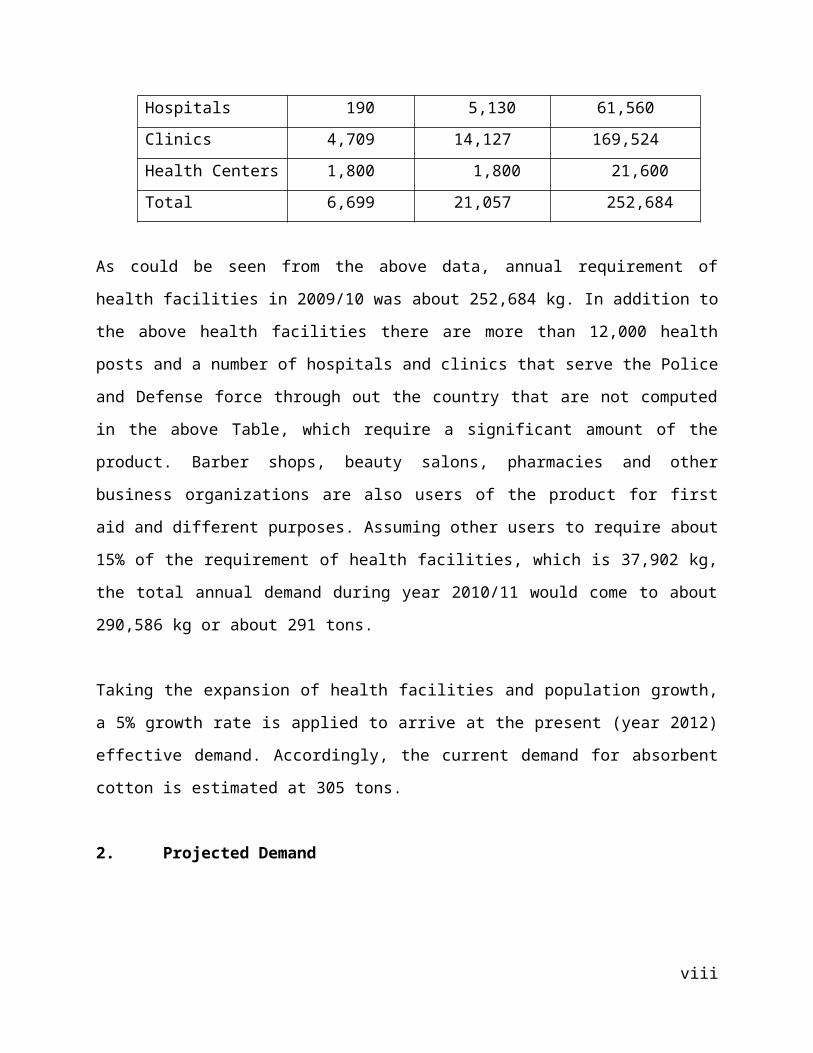
Table 3.1
MONTHLY AND ANNUAL REQUIREMENT OF ABSORBENT COTTON
AT COUNTRY LEVEL
Type of Health
Facility
No. of Health
Facilities
Total Monthly
Requirement (kg)
Total Annual
Requirement (Kg)
Hospitals 190 5,130 61,560
Clinics 4,709 14,127 169,524
Health Centers 1,800 1,800 21,600
Total 6,699 21,057 252,684
As could be seen from the above data, annual requirement of health facilities in 2009/10 was
about 252,684 kg. In addition to the above health facilities there are more than 12,000 health
posts and a number of hospitals and clinics that serve the Police and Defense force through out
the country that are not computed in the above Table, which require a significant amount of the
product. Barber shops, beauty salons, pharmacies and other business organizations are also users
of the product for first aid and different purposes. Assuming other users to require about 15% of
the requirement of health facilities, which is 37,902 kg, the total annual demand during year
2010/11 would come to about 290,586 kg or about 291 tons.
v
Taking the expansion of health facilities and population growth, a 5% growth rate is applied to
arrive at the present (year 2012) effective demand. Accordingly, the current demand for
absorbent cotton is estimated at 305 tons.
2. Projected Demand
The demand for absorbent cotton is directly related with the development and expansion of
health facilities in the country. The Federal and Regional Governments have given high attention
for expansion of health facilities to increase the coverage. Hence, considering the population
growth and the high attention given by the Federal and Regional Governments, the demand for
absorbent cotton is assumed to grow by 6%, annually. Based on this assumption, the projected
demand at country level is given in Table 3.2.
Table 3.2
PROJECTED DEMAND FOR ABSORBENT COTTON (TONS)
Year Quantity
2013 323
2014 343
2015 363
2016 385
2017 408
2018 432
2019 459
2020 486
2021 515
2022 546
2023 579
The demand for absorbent cotton will increase from 323 tons in the year 2013 to 432 tons and
579 tons in the year 2018 and 2023, respectively.
vi
3. Pricing and Distribution
The current retail price of absorbent cotton ranges from Birr 30 to Birr 48 per pack of 500 gram
or on the average Birr 78kg at Addis Ababa. Assuming a 35% margin for distributors, the
recommended price for the envisaged project is Birr is 29 per pack of 500 gram or Birr 58per kg.
The distribution of absorbent cottons could be handled through the existing distributors of drug
and medical supplies enterprises.
B. PLANT CAPACITY AND PRODUCTION PROGRAM
1. Plant Capacity
The basic determinant factors to be considered prior to determining the plant capacity are the
outcome of the market study, available supply volume of raw materials and other technical
factors. Accordingly, having considered all these factors, an annual production capacity of 300
tons is selected for the envisaged factory. This capacity is proposed to be achieved on the basis
of 250 working days per annum and one shifts of 8 hours each per day.
2. Production Program
Due to technical reasons such as skill upgrading of the operators and acquaintance with the
production machinery, it would be advisable and more appropriate to start production at lower
capacity at the initial stage. Hence, it is suggested that the envisaged plant will go into full
capacity utilization in three years time starting with 75% capacity in the first year, 85% during
the second year and then to full (100%) capacity during the third year and then after. The detail
production program is shown in Table 3.3
Table 3.3
PRODUCTION PROGRAM
Sr.
No. Description
Production Year
1 2 3
1 Capacity utilization rate ( %) 75 85 100
2 Annual production (Tons) 225 255 300
vii
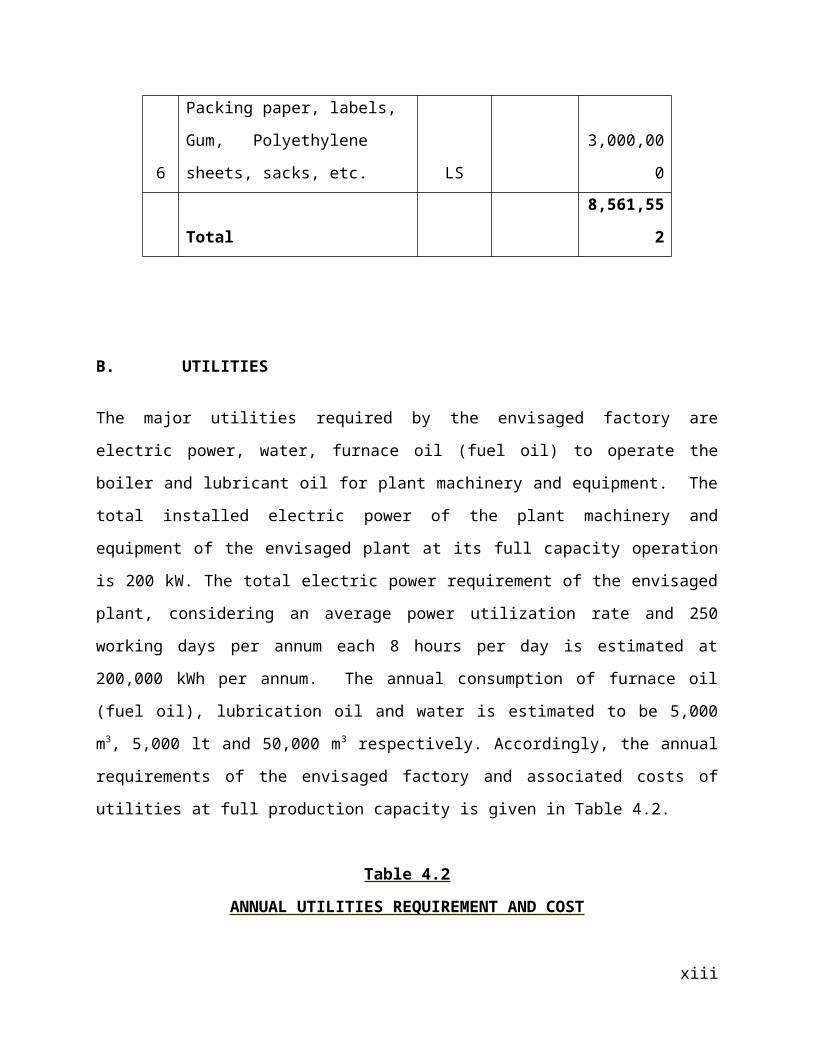
IV. RAW MATERIALS AND INPUTS
A. RAW MATERIALS
The major raw material required for manufacturing of absorbent cotton is either virgin cotton or
waste cotton which is available locally. Combed waste cotton is desirable in case of waste
cotton. The fiber of absorbent cotton is very elastic. It consists of (98-99.5%) cellulose which
has a diameter of 16.30 mm, and a length of 12-40mm.
From the experience of operating textile industries in the country, there is a loss of up to 25%
depending on the content of short fiber and foreign matters. Therefore, up to 1.25 tons of raw
cotton is required to manufacture one ton of finished goods. Hence, the total annual requirement
of raw ginned cotton at full capacity production of the envisaged factory is estimated at 375 tons.
Soda ash and caustic soda are other raw materials required, which can also be procured locally.
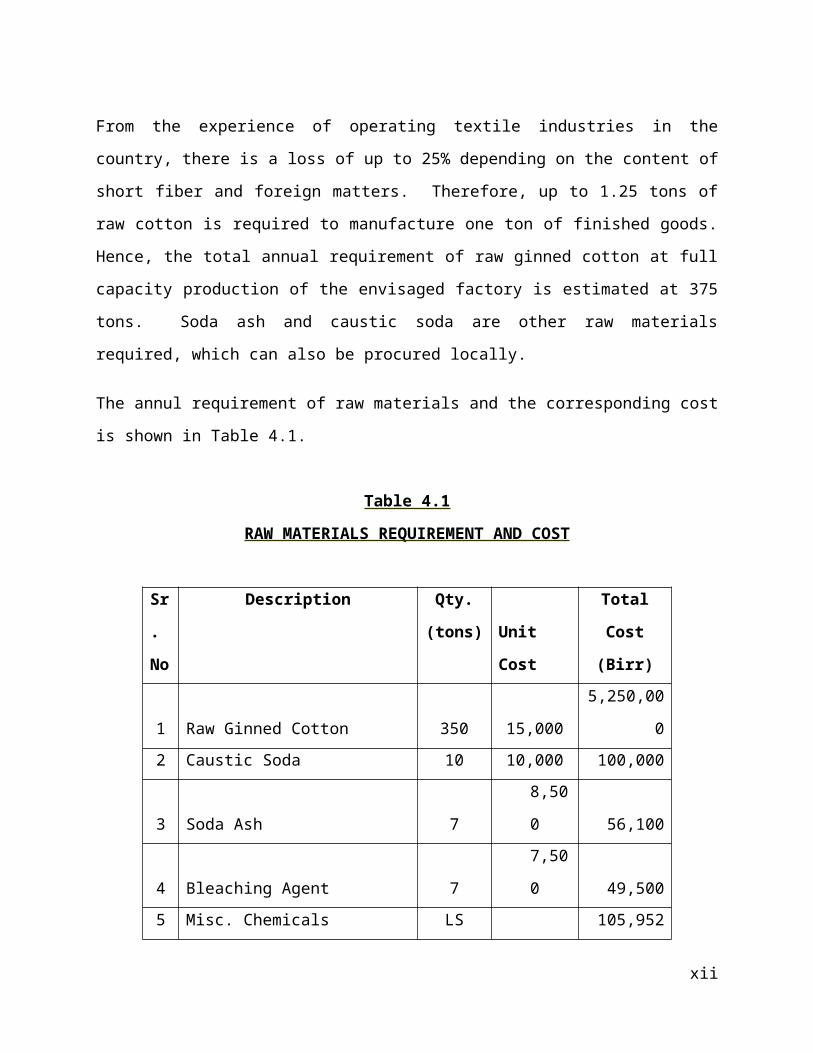
The annul requirement of raw materials and the corresponding cost is shown in Table 4.1.
Table 4.1
RAW MATERIALS REQUIREMENT AND COST
Sr.
No
Description Qty.
(tons) Unit Cost
Total Cost
(Birr)
1 Raw Ginned Cotton 350 15,000 5,250,000
2 Caustic Soda 10 10,000 100,000
3 Soda Ash 7 8,500 56,100
4 Bleaching Agent 7 7,500 49,500
5 Misc. Chemicals LS 105,952
6
Packing paper, labels, Gum,
Polyethylene sheets, sacks, etc. LS 3,000,000
Total 8,561,552
viii

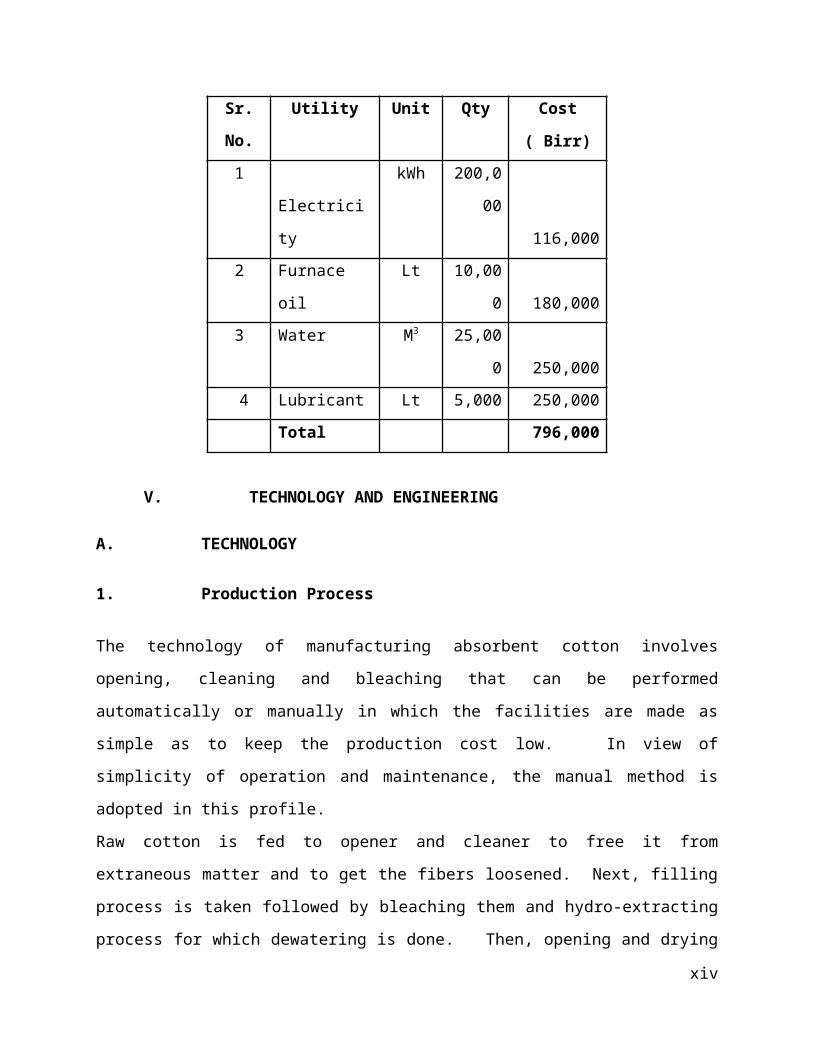
B. UTILITIES
The major utilities required by the envisaged factory are electric power, water, furnace oil (fuel
oil) to operate the boiler and lubricant oil for plant machinery and equipment. The total installed
electric power of the plant machinery and equipment of the envisaged plant at its full capacity
operation is 200 kW. The total electric power requirement of the envisaged plant, considering an
average power utilization rate and 250 working days per annum each 8 hours per day is
estimated at 200,000 kWh per annum. The annual consumption of furnace oil (fuel oil),
lubrication oil and water is estimated to be 5,000 m3, 5,000 lt and 50,000 m3 respectively.
Accordingly, the annual requirements of the envisaged factory and associated costs of utilities at
full production capacity is given in Table 4.2.
Table 4.2
ANNUAL UTILITIES REQUIREMENT AND COST
Sr. Utility Unit Qty Cost ( Birr)
No.
1 Electricity kWh 200,000 116,000
2 Furnace oil Lt 10,000 180,000
3 Water M3 25,000 250,000
4 Lubricant Lt 5,000 250,000
Total 796,000
V. TECHNOLOGY AND ENGINEERING
A. TECHNOLOGY
1. Production Process
The technology of manufacturing absorbent cotton involves opening, cleaning and bleaching that
can be performed automatically or manually in which the facilities are made as simple as to keep
ix
the production cost low. In view of simplicity of operation and maintenance, the manual
method is adopted in this profile.
Raw cotton is fed to opener and cleaner to free it from extraneous matter and to get the fibers
loosened. Next, filling process is taken followed by bleaching them and hydro-extracting
process for which dewatering is done. Then, opening and drying are carried out in order to
facilitate the subsequent carding process. The dried cotton is further loosened finally by the
opening machine and tested and carded. Finally winding, cutting and packing is performed.
2. Environmental Impact
Since the process uses hazardous chemicals like caustic soda and bleaching powder, a liquid
waste treatment plant is necessary to control pollution of the environment. Therefore, the
envisaged plant will implement a mechanism to prevent environmental hazardous with an expense
of Birr 350,000.
B. ENGINEERING
1. Machinery & Equipment
The total cost of machinery and equipment is estimated at Birr 8,838,900; out of which Birr
7,686,000 is required in foreign currency. The list of machinery and equipment required for the
production of absorbent cotton with their corresponding cost is given Table 5.1.
x
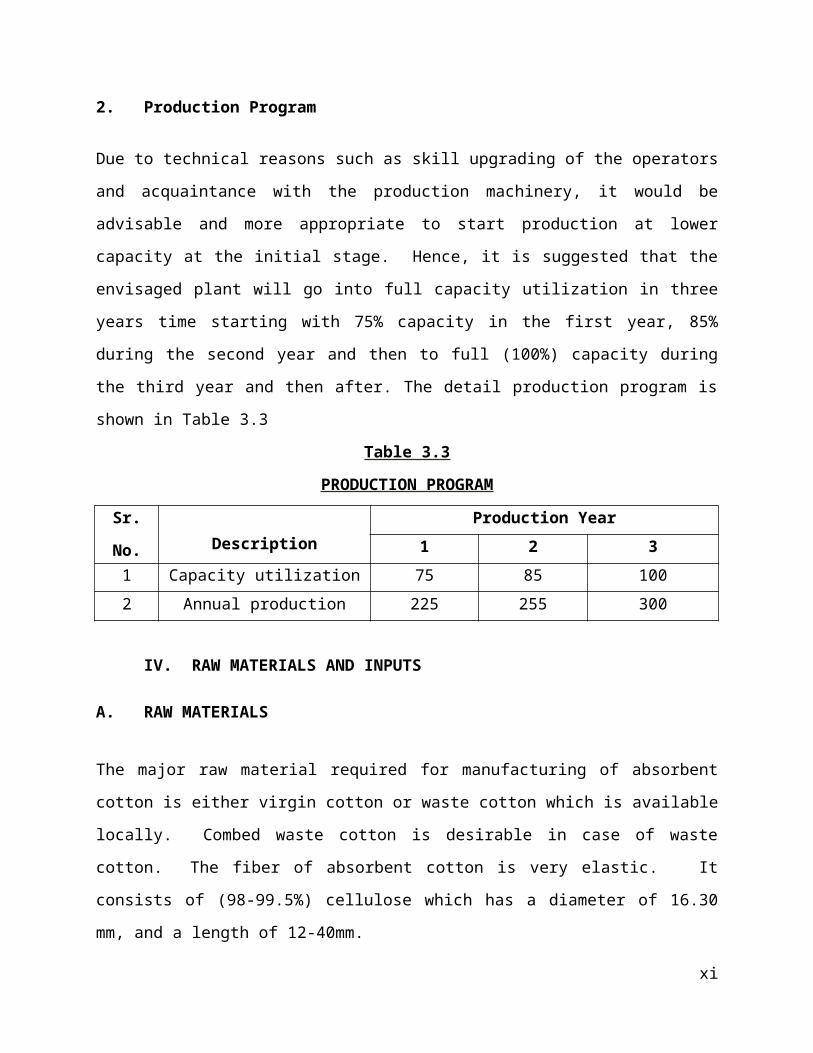
Table 5.1
LIST OF MACHINERY & EQUIPMENT AND COST
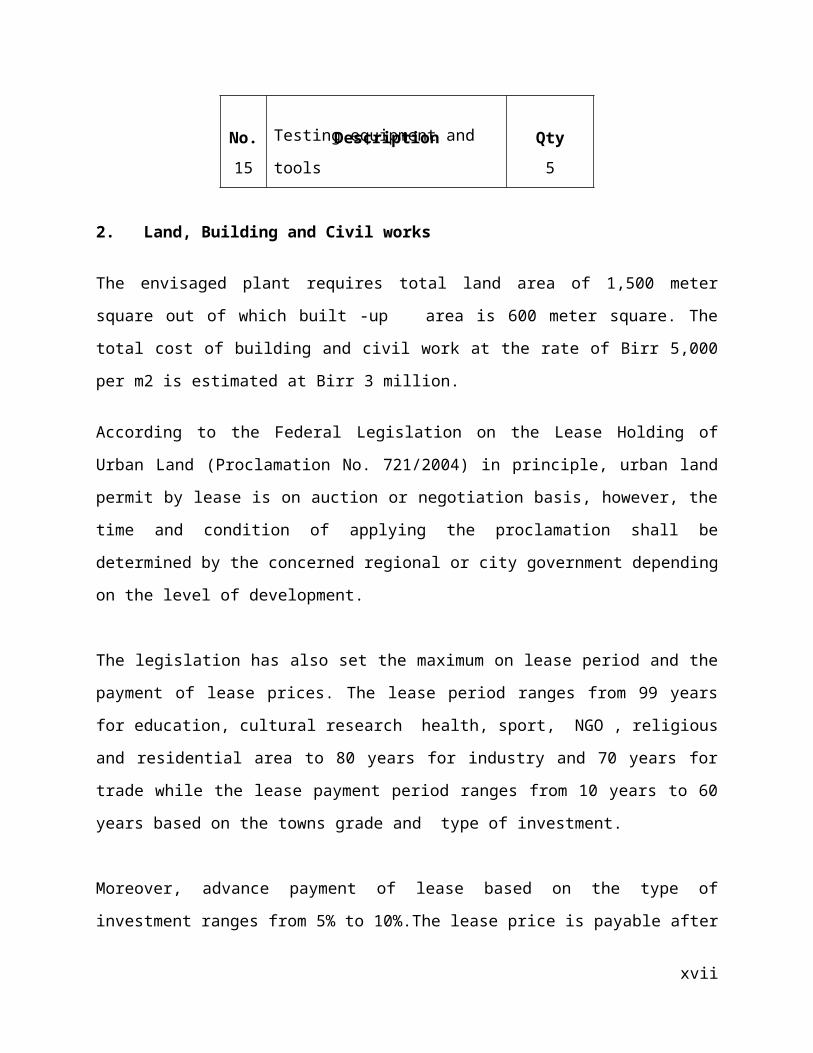
No. Description Qty
1 Opening and cleaning unit 1 set
2 Filling unit "
3 Bleaching unit "
4 Hydro-extracting unit "
5 Opening (for wet cotton) "
6 Drying unit "
7 Opening unit (for dried cotton) "
8 Reserving unit "
9 Carding unit "
10 Winding and cutting "
11 Packing machine 1
12 Air conditioning equipment 2
13 Boiler-1 tone per hour; 3
14
Water treatment facilities for fresh
water (12 tone/day) softener 4
15 Testing equipment and tools 5
2. Land, Building and Civil works
The envisaged plant requires total land area of 1,500 meter square out of which built -up area is
600 meter square. The total cost of building and civil work at the rate of Birr 5,000 per m2 is
estimated at Birr 3 million.
According to the Federal Legislation on the Lease Holding of Urban Land (Proclamation No.
721/2004) in principle, urban land permit by lease is on auction or negotiation basis, however,
xi
the time and condition of applying the proclamation shall be determined by the concerned
regional or city government depending on the level of development.
The legislation has also set the maximum on lease period and the payment of lease prices. The
lease period ranges from 99 years for education, cultural research health, sport, NGO , religious
and residential area to 80 years for industry and 70 years for trade while the lease payment
period ranges from 10 years to 60 years based on the towns grade and type of investment.
Moreover, advance payment of lease based on the type of investment ranges from 5% to
10%.The lease price is payable after the grace period annually. For those that pay the entire
amount of the lease will receive 0.5% discount from the total lease value and those that pay in
installments will be charged interest based on the prevailing interest rate of banks. Moreover,
based on the type of investment, two to seven years grace period shall also be provided.
However, the Federal Legislation on the Lease Holding of Urban Land apart from setting the
maximum has conferred on regional and city governments the power to issue regulations on the
exact terms based on the development level of each region.
In Addis Ababa, the City’s Land Administration and Development Authority is directly
responsible in dealing with matters concerning land. However, regarding the manufacturing
sector, industrial zone preparation is one of the strategic intervention measures adopted by the
City Administration for the promotion of the sector and all manufacturing projects are assumed
to be located in the developed industrial zones.
Regarding land allocation of industrial zones if the land requirement of the project is below
5,000 m2, the land lease request is evaluated and decided upon by the Industrial Zone
Development and Coordination Committee of the City’s Investment Authority. However, if the
land request is above 5,000 m2, the request is evaluated by the City’s Investment Authority and
passed with recommendation to the Land Development and Administration Authority for
decision, while the lease price is the same for both cases.
xii
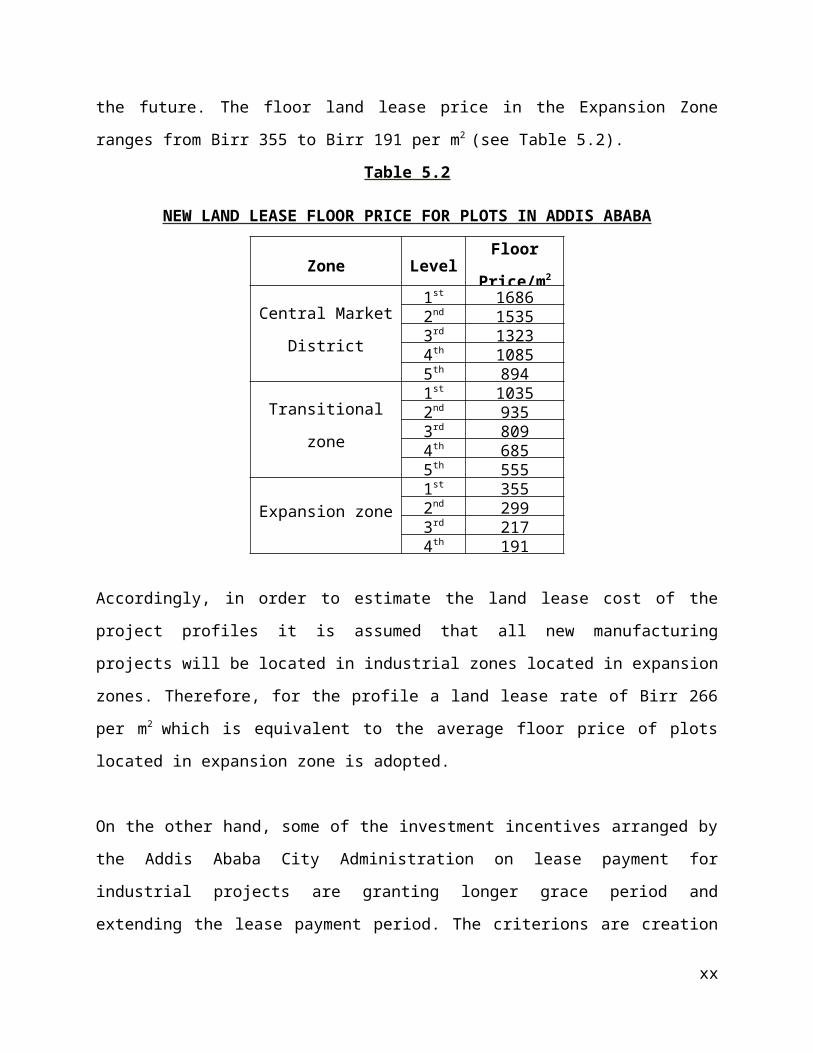
Moreover, the Addis Ababa City Administration has recently adopted a new land lease floor
price for plots in the city. The new prices will be used as a benchmark for plots that are going to
be auctioned by the city government or transferred under the new “Urban Lands Lease Holding
Proclamation.”
The new regulation classified the city into three zones. The first Zone is Central Market District
Zone, which is classified in five levels and the floor land lease price ranges from Birr 1,686 to
Birr 894 per m2. The rate for Central Market District Zone will be applicable in most areas of the
city that are considered to be main business areas that entertain high level of business activities.
The second zone, Transitional Zone, will also have five levels and the floor land lease price
ranges from Birr 1,035 to Birr 555 per m2 .This zone includes places that are surrounding the city
and are occupied by mainly residential units and industries.
The last and the third zone, Expansion Zone, is classified into four levels and covers areas that
are considered to be in the outskirts of the city, where the city is expected to expand in the future.
The floor land lease price in the Expansion Zone ranges from Birr 355 to Birr 191 per m2 (see
Table 5.2).
Table 5.2
NEW LAND LEASE FLOOR PRICE FOR PLOTS IN ADDIS ABABA
Zone LevelFloor
Price/m2
Central Market
District
1st 16862nd 15353rd 13234th 10855th 894
Transitional zone
1st 10352nd 9353rd 8094th 6855th 555
Expansion zone 1st 3552nd 2993rd 2174th 191
xiii
Accordingly, in order to estimate the land lease cost of the project profiles it is assumed that all
new manufacturing projects will be located in industrial zones located in expansion zones.
Therefore, for the profile a land lease rate of Birr 266 per m2 which is equivalent to the average
floor price of plots located in expansion zone is adopted.
On the other hand, some of the investment incentives arranged by the Addis Ababa City
Administration on lease payment for industrial projects are granting longer grace period and
extending the lease payment period. The criterions are creation of job opportunity, foreign
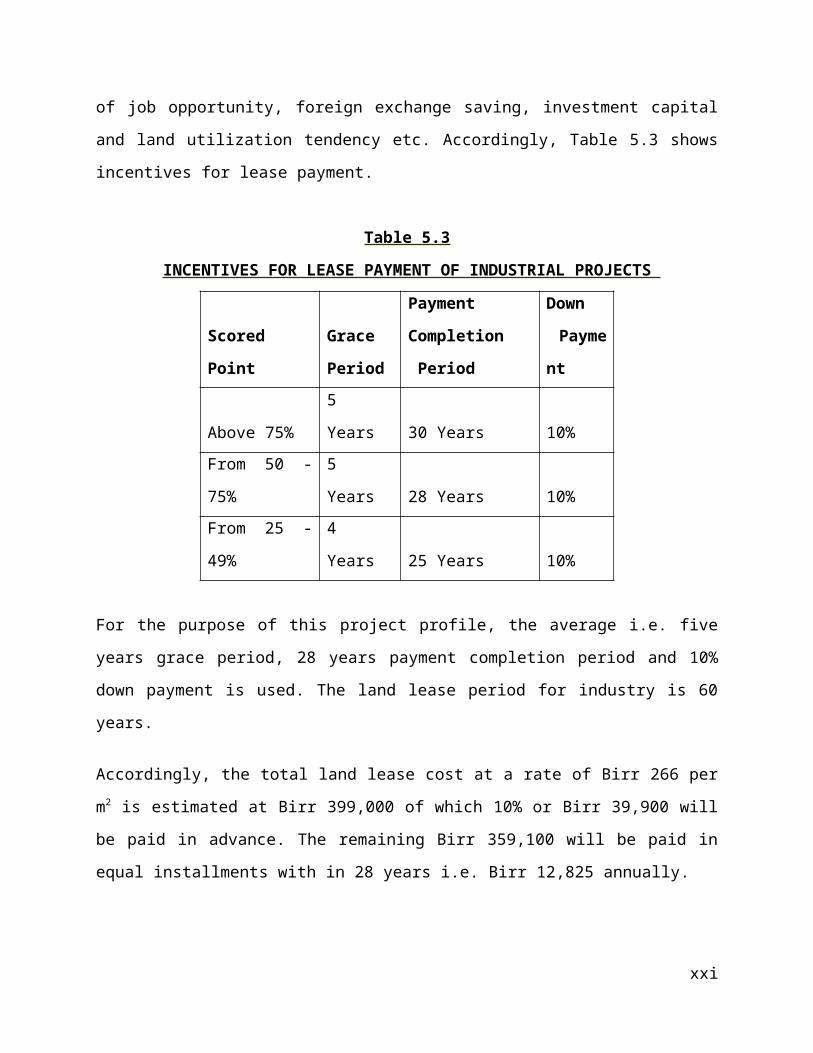
exchange saving, investment capital and land utilization tendency etc. Accordingly, Table 5.3
shows incentives for lease payment.
Table 5.3
INCENTIVES FOR LEASE PAYMENT OF INDUSTRIAL PROJECTS
Scored Point
Grace
Period
Payment
Completion
Period
Down
Paymen
t
Above 75% 5 Years 30 Years 10%
From 50 - 75% 5 Years 28 Years 10%
From 25 - 49% 4 Years 25 Years 10%
For the purpose of this project profile, the average i.e. five years grace period, 28 years payment
completion period and 10% down payment is used. The land lease period for industry is 60
years.
Accordingly, the total land lease cost at a rate of Birr 266 per m2 is estimated at Birr 399,000 of
which 10% or Birr 39,900 will be paid in advance. The remaining Birr 359,100 will be paid in
equal installments with in 28 years i.e. Birr 12,825 annually.
xiv
NB: The land issue in the above statement narrates or shows only Addis Ababa’s city
administration land lease price, policy and regulations.
Accordingly the project profile prepared based on the land lease price of Addis Ababa region.
To know land lease price, police and regulation of other regional state of the country updated
information is available at Ethiopian Investment Agency’s website www.eia.gov.et on the factor
cost.
VI. HUMAN RESOURCE AND TRAINING REQUIREMENT
A. HUMAN RESOURCE REQUIREMENT
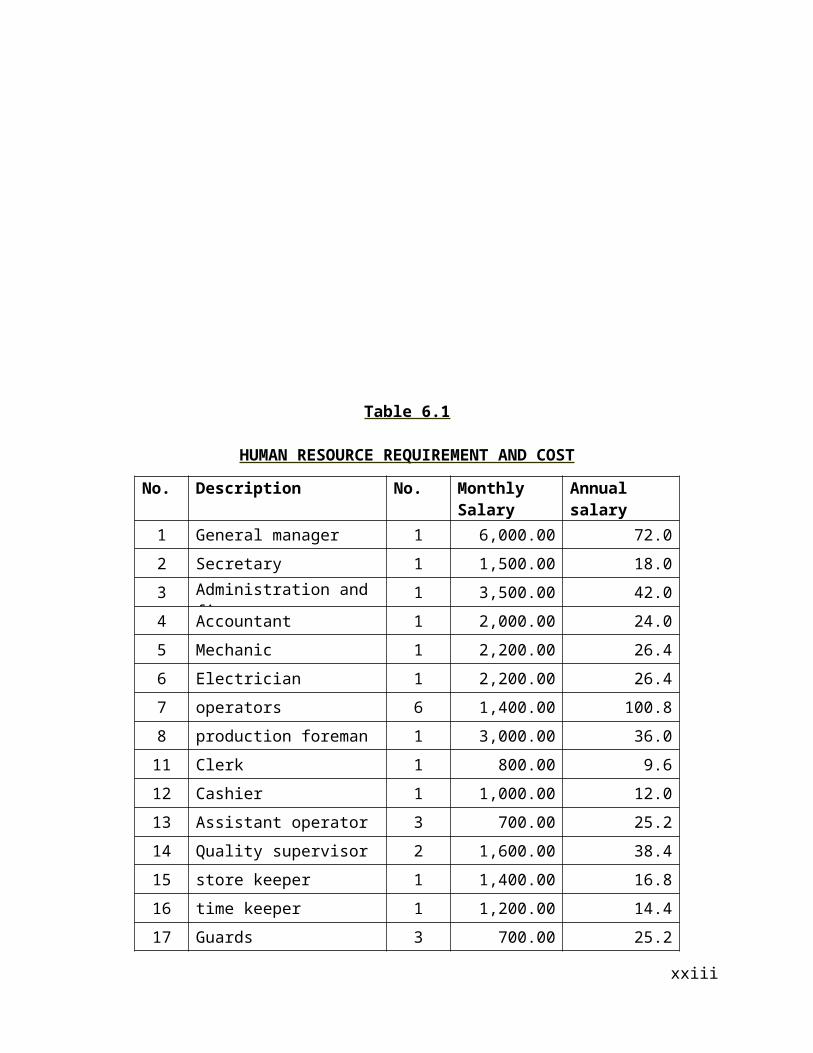
The envisaged project requires a total of 25 employees. The annual salary and wages including
fringe benefits and allowances is estimated at Birr 584,640. The details of human resource
requirement and the estimated annual cost including employees' benefits are shown in Table 6.1.
xv
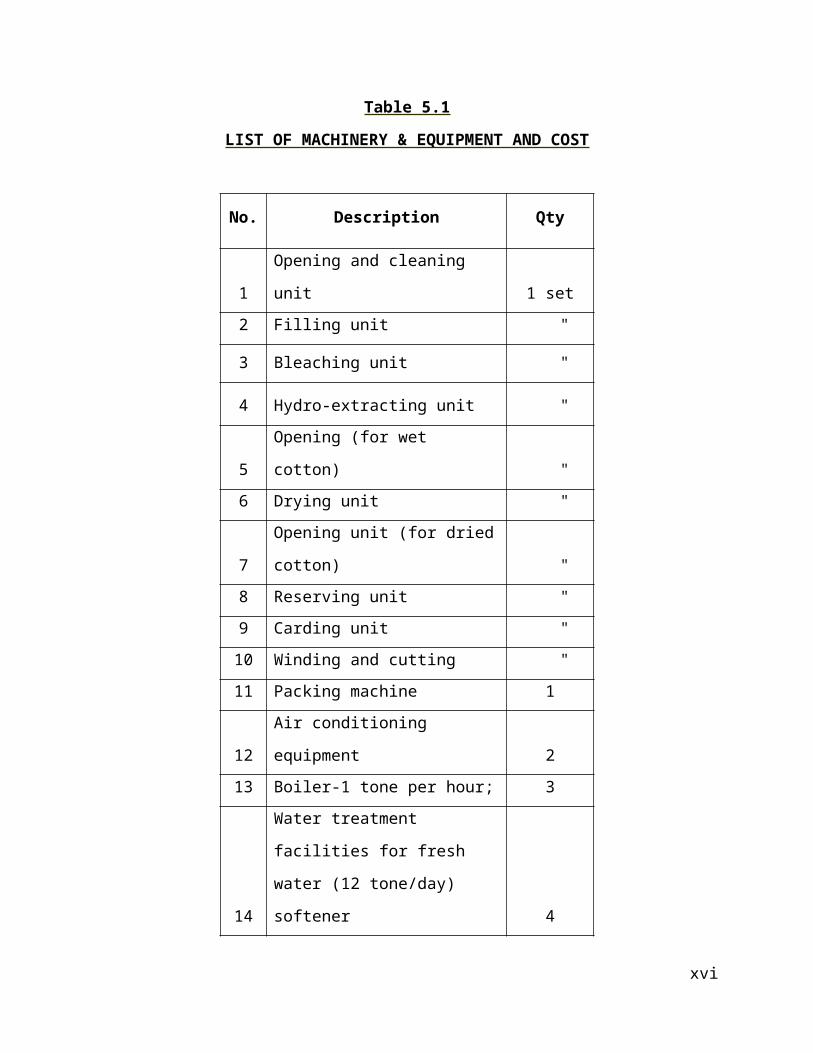
Table 6.1
HUMAN RESOURCE REQUIREMENT AND COST
No. Description No. Monthly Salary (Birr)
Annual salary ( `000 ) Birr
1 General manager 1 6,000.00 72.0
2 Secretary 1 1,500.00 18.0
3 Administration and finance 1 3,500.00 42.0
4 Accountant 1 2,000.00 24.0
5 Mechanic 1 2,200.00 26.4
6 Electrician 1 2,200.00 26.4
7 operators 6 1,400.00 100.8
8 production foreman 1 3,000.00 36.0
11 Clerk 1 800.00 9.6
12 Cashier 1 1,000.00 12.0
13 Assistant operator 3 700.00 25.2
14 Quality supervisor 2 1,600.00 38.4
15 store keeper 1 1,400.00 16.8
16 time keeper 1 1,200.00 14.4
17 Guards 3 700.00 25.2
Total 25 29,200.00 487.2
18 Employees benefit and allowances 20% 5,840.00 97.4
Total Annual Labor cost (Direct +Indirect) 584.64
B. TRAINING REQUIREMENTS
The supervisor, skilled workers and quality control workers need at least two weeks training on
the technology, maintenance and quality control. For the rest, on-the-job training will be
sufficient on the start-up period. Training program will be part of contractual agreement with
machinery supplier and cost will be covered by the supplier.
xvi
VII. FINANCIAL ANALYSISThe financial analysis of absorbent cotton project is based on the data presented in the previous
chapters and the following assumptions:-
Construction period 1 yearSource of finance 30 % equity & 70% loanTax holidays 5 yearsBank interest 10%Discount cash flow 10%Accounts receivable 30 daysRaw material local 30 daysWork in progress 1 dayFinished products 30 daysCash in hand 5 daysAccounts payable 30 daysRepair and maintenance 5% of machinery cost
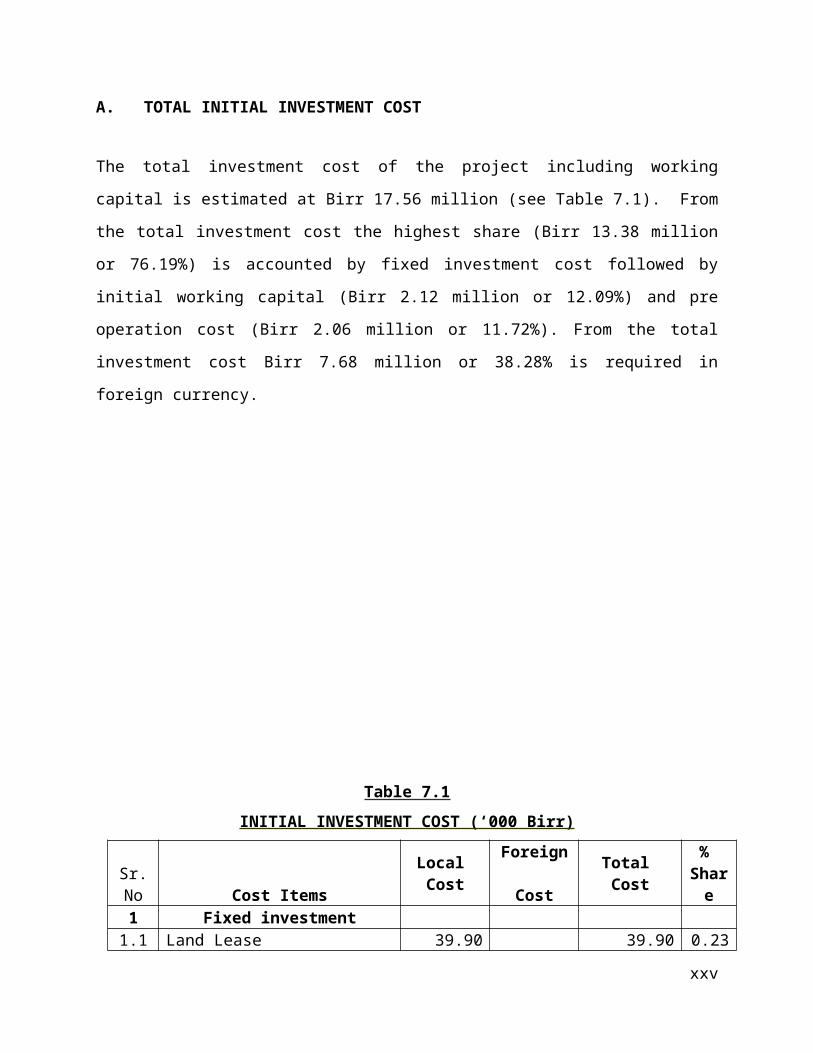
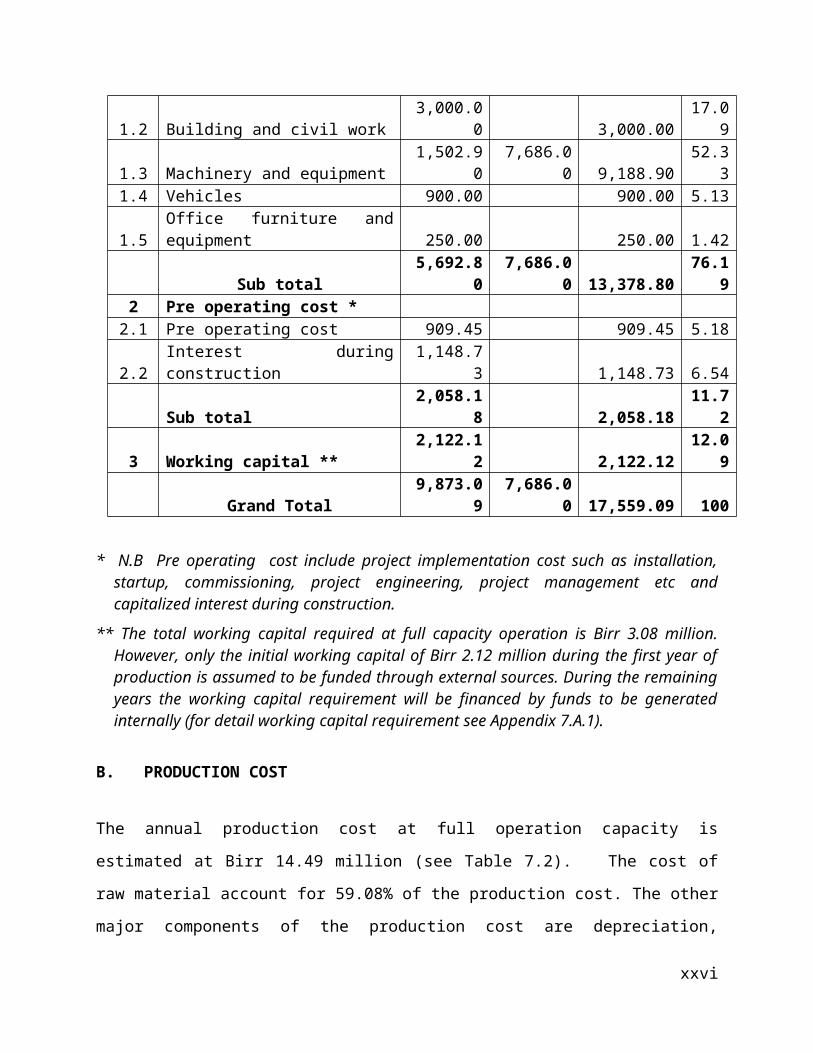
A. TOTAL INITIAL INVESTMENT COST
The total investment cost of the project including working capital is estimated at Birr 17.56
million (see Table 7.1). From the total investment cost the highest share (Birr 13.38 million or
76.19%) is accounted by fixed investment cost followed by initial working capital (Birr 2.12
million or 12.09%) and pre operation cost (Birr 2.06 million or 11.72%). From the total
investment cost Birr 7.68 million or 38.28% is required in foreign currency.
xvii
Table 7.1
INITIAL INVESTMENT COST (‘000 Birr)
Sr.No Cost Items
Local Cost
Foreign Cost
Total Cost
% Share
1 Fixed investment 1.1 Land Lease 39.90 39.90 0.231.2 Building and civil work 3,000.00 3,000.00 17.091.3 Machinery and equipment 1,502.90 7,686.00 9,188.90 52.331.4 Vehicles 900.00 900.00 5.131.5 Office furniture and equipment 250.00 250.00 1.42 Sub total 5,692.80 7,686.00 13,378.80 76.192 Pre operating cost *
2.1 Pre operating cost 909.45 909.45 5.182.2 Interest during construction 1,148.73 1,148.73 6.54 Sub total 2,058.18 2,058.18 11.723 Working capital ** 2,122.12 2,122.12 12.09 Grand Total 9,873.09 7,686.00 17,559.09 100
* N.B Pre operating cost include project implementation cost such as installation, startup, commissioning, project engineering, project management etc and capitalized interest during construction.
** The total working capital required at full capacity operation is Birr 3.08 million. However, only the initial working capital of Birr 2.12 million during the first year of production is assumed to be funded through external sources. During the remaining years the working capital requirement will be financed by funds to be generated internally (for detail working capital requirement see Appendix 7.A.1).
B. PRODUCTION COST
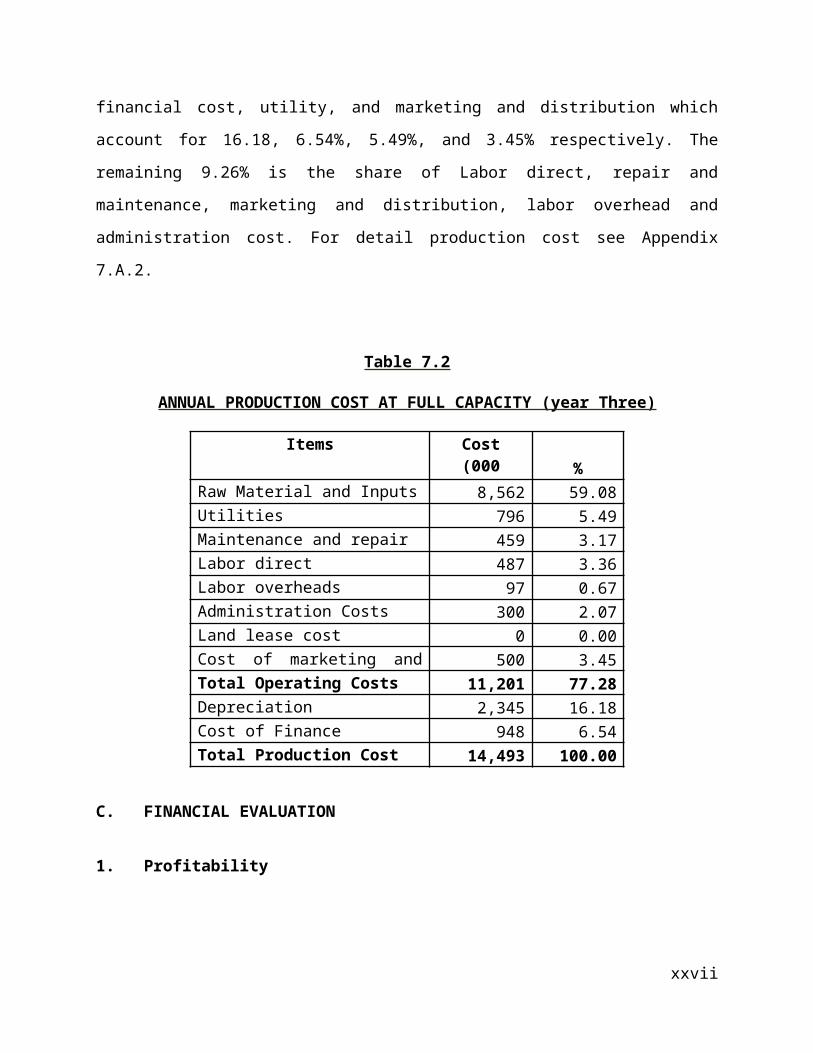
The annual production cost at full operation capacity is estimated at Birr 14.49 million (see Table
7.2). The cost of raw material account for 59.08% of the production cost. The other major
components of the production cost are depreciation, financial cost, utility, and marketing and
distribution which account for 16.18, 6.54%, 5.49%, and 3.45% respectively. The remaining
9.26% is the share of Labor direct, repair and maintenance, marketing and distribution, labor
overhead and administration cost. For detail production cost see Appendix 7.A.2.
xviii
Table 7.2
ANNUAL PRODUCTION COST AT FULL CAPACITY (year Three)
Items Cost(000 Birr) %
Raw Material and Inputs 8,562 59.08Utilities 796 5.49Maintenance and repair 459 3.17Labor direct 487 3.36Labor overheads 97 0.67Administration Costs 300 2.07Land lease cost 0 0.00Cost of marketing and distribution 500 3.45Total Operating Costs 11,201 77.28Depreciation 2,345 16.18Cost of Finance 948 6.54Total Production Cost 14,493 100.00
C. FINANCIAL EVALUATION
1. Profitability
Based on the projected profit and loss statement, the project will generate a profit throughout its
operation life. Annual net profit after tax will grow from Birr 3.79 million to Birr 4.23 million
during the life of the project. Moreover, at the end of the project life the accumulated net cash
flow amounts to Birr 39.57 million. For profit and loss statement and cash flow projection see
Appendix 7.A.3 and 7.A.4, respectively.
2. Ratios
In financial analysis, financial ratios and efficiency ratios are used as an index or yardstick for
evaluating the financial position of a firm. It is also an indicator for the strength and weakness of
the firm or a project. Using the year-end balance sheet figures and other relevant data, the most
important ratios such as return on sales which is computed by dividing net income by revenue,
xix
return on assets (operating income divided by assets), return on equity (net profit divided by
equity) and return on total investment (net profit plus interest divided by total investment) has
been carried out over the period of the project life and all the results are found to be satisfactory.
3. Break-even Analysis
The break-even analysis establishes a relationship between operation costs and revenues. It
indicates the level at which costs and revenue are in equilibrium. To this end, the break-even
point for capacity utilization and sales value estimated by using income statement projection are
computed as follows.
Break -Even Sales Value = Fixed Cost + Financial Cost = Birr 7,308,000 Variable Margin ratio (%)
Break- Even Capacity utilization = Break even Sales Value X 100 = 36.62 %
Sales revenue
4. Pay-back Period
The pay- back period, also called pay – off period is defined as the period required for recovering
the original investment outlay through the accumulated net cash flows earned by the project.
Accordingly, based on the projected cash flow it is estimated that the project’s initial investment
will be fully recovered within 3 years.
5. Internal Rate of Return
The internal rate of return (IRR) is the annualized effective compounded return rate that can be
earned on the invested capital, i.e., the yield on the investment. Put another way, the internal rate
of return for an investment is the discount rate that makes the net present value of the
investment's income stream total to zero. It is an indicator of the efficiency or quality of an
investment. A project is a good investment proposition if its IRR is greater than the rate of return
that could be earned by alternate investments or putting the money in a bank account.
xx
Accordingly, the IRR of this project is computed to be 31.29% indicating the viability of the
project.
6. Net Present Value
Net present value (NPV) is defined as the total present (discounted) value of a time series of cash
flows. NPV aggregates cash flows that occur during different periods of time during the life of a
project in to a common measuring unit i.e. present value. It is a standard method for using the
time value of money to appraise long-term projects. NPV is an indicator of how much value an
investment or project adds to the capital invested. In principle, a project is accepted if the NPV is
non-negative.
Accordingly, the net present value of the project at 10% discount rate is found to be Birr 18.50
million which is acceptable. For detail discounted cash flow see Appendix 7.A.5.
D. ECONOMIC AND SOCIAL BENEFITS
The project can create employment for 25 persons. The project will generate Birr 8.60 million in
terms of tax revenue. The establishment of such factory will have a foreign exchange saving
effect to the country by substituting the current imports. The project will also create backward
linkage with agricultural sector forward linkage with the pharmaceutical and medical supplies
sub sectors and also generates other income for the Government.
xxi
Appendix 7.A
FINANCIAL ANALYSES SUPPORTING TABLES
xxii
Appendix 7.A.1NET WORKING CAPITAL ( in 000 Birr)
Items Year 2 Year 3 Year 4 Year 5 Year 6 Year 7 Year 8 Year 9 Year 10 Year 11
Total inventory1,498.3
51,712.4
01,926.4
52,140.5
02,140.5
02,140.5
02,140.5
02,140.5
02,140.5
02,140.5
0
Accounts receivable 665.89 755.07 844.24 933.42 934.49 934.49 934.49 934.49 934.49 934.49
Cash-in-hand 13.06 14.92 16.79 18.65 18.83 18.83 18.83 18.83 18.83 18.83
CURRENT ASSETS2,177.3
02,482.3
92,787.4
83,092.5
73,093.8
23,093.8
23,093.8
23,093.8
23,093.8
23,093.8
2
Accounts payable 55.18 63.07 70.95 78.83 78.83 78.83 78.83 78.83 78.83 78.83
CURRENT LIABILITIES 55.18 63.07 70.95 78.83 78.83 78.83 78.83 78.83 78.83 78.83
TOTAL WORKING CAPITAL
2,122.12
2,419.32
2,716.53
3,013.74
3,014.98
3,014.98
3,014.98
3,014.98
3,014.98
3,014.98
21
Appendix 7.A.2PRODUCTION COST ( in 000 Birr)
Item Year 2 Year 3 Year 4 Year 5 Year 6 Year 7 Year 8 Year 9 Year 10 Year 11
Raw Material and Inputs 5,993 6,850 7,706 8,562 8,562 8,562 8,562 8,562 8,562 8,562
Utilities 557 637 716 796 796 796 796 796 796 796
Maintenance and repair 321 367 413 459 459 459 459 459 459 459
Labour direct 341 390 438 487 487 487 487 487 487 487
Labour overheads 68 78 87 97 97 97 97 97 97 97
Administration Costs 210 240 270 300 300 300 300 300 300 300
Land lease cost 0 0 0 0 13 13 13 13 13 13Cost of marketing and distribution 500 500 500 500 500 500 500 500 500 500
Total Operating Costs 7,991 9,061 10,131 11,201 11,214 11,214 11,214 11,214 11,214 11,214
Depreciation 2,345 2,345 2,345 2,345 2,345 145 145 145 145 145
Cost of Finance 0 1,264 1,106 948 790 632 474 316 158 0
Total Production Cost 10,335 12,669 13,581 14,493 14,348 11,991 11,833 11,675 11,517 11,359
22
Appendix 7.A.3INCOME STATEMENT ( in 000 Birr)
ItemYear 2
Year 3
Year 4
Year 5
Year 6
Year 7
Year 8
Year 9
Year 10
Year 11
Sales revenue12,18
015,66
017,40
017,40
017,40
017,40
017,40
017,40
0 17,400 17,400
Less variable costs 7,491 8,561 9,63110,70
110,70
110,70
110,70
110,70
1 10,701 10,701
VARIABLE MARGIN 4,689 7,099 7,769 6,699 6,699 6,699 6,699 6,699 6,699 6,699
in % of sales revenue 38.50 45.33 44.65 38.50 38.50 38.50 38.50 38.50 38.50 38.50
Less fixed costs 2,845 2,845 2,845 2,845 2,857 658 658 658 658 658
OPERATIONAL MARGIN 1,845 4,255 4,924 3,854 3,842 6,041 6,041 6,041 6,041 6,041
in % of sales revenue 15.14 27.17 28.30 22.15 22.08 34.72 34.72 34.72 34.72 34.72
Financial costs 1,264 1,106 948 790 632 474 316 158 0
GROSS PROFIT 1,845 2,991 3,819 2,907 3,052 5,409 5,567 5,725 5,883 6,041
in % of sales revenue 15.14 19.10 21.95 16.70 17.54 31.09 32.00 32.90 33.81 34.72
Income (corporate) tax 0 0 0 0 0 1,623 1,670 1,718 1,765 1,812
NET PROFIT 1,845 2,991 3,819 2,907 3,052 3,787 3,897 4,008 4,118 4,229
in % of sales revenue 15.14 19.10 21.95 16.70 17.54 21.76 22.40 23.03 23.67 24.30
23
Appendix 7.A.4CASH FLOW FOR FINANCIAL MANAGEMENT ( in 000 Birr)
Item Year 1 Year 2 Year 3 Year 4 Year 5 Year 6 Year 7 Year 8 Year 9 Year 10 Year 11 Scrap
TOTAL CASH INFLOW 14,288 15,506 15,668 17,408 17,400 17,400 17,400 17,400 17,400 17,400 17,400 6,004
Inflow funds 14,288 3,326 8 8 0 0 0 0 0 0 0 0
Inflow operation 0 12,180 15,660 17,400 17,400 17,400 17,400 17,400 17,400 17,400 17,400 0
Other income 0 0 0 0 0 0 0 0 0 0 0 6,004TOTAL CASH OUTFLOW 14,288 11,317 12,209 13,121 14,033 13,584 15,048 14,937 14,827 14,716 13,026 0Increase in fixed assets 14,288 0 0 0 0 0 0 0 0 0 0 0
Increase in current assets 0 2,177 305 305 305 1 0 0 0 0 0 0
Operating costs 0 7,491 8,561 9,631 10,701 10,714 10,714 10,714 10,714 10,714 10,714 0Marketing and Distribution cost 0 500 500 500 500 500 500 500 500 500 500 0
Income tax 0 0 0 0 0 0 1,623 1,670 1,718 1,765 1,812 0Financial costs 0 1,149 1,264 1,106 948 790 632 474 316 158 0 0Loan repayment 0 0 1,579 1,579 1,579 1,579 1,579 1,579 1,579 1,579 0 0
SURPLUS (DEFICIT) 0 4,189 3,459 4,287 3,367 3,816 2,352 2,463 2,573 2,684 4,374 6,004
CUMULATIVE CASH BALANCE 0 4,189 7,648 11,935 15,302 19,117 21,469 23,932 26,505 29,189 33,563 39,566
24
Appendix 7.A.5DISCOUNTED CASH FLOW ( in 000 Birr)
Item Year 1Year
2 Year 3Year
4 Year 5Year
6 Year 7Year
8 Year 9Year
10 Year 11Scra
p
TOTAL CASH INFLOW 0 12,180 15,660 17,400 17,400 17,400 17,400 17,400 17,400 17,400 17,400 6,004
Inflow operation 0 12,180 15,660 17,400 17,400 17,400 17,400 17,400 17,400 17,400 17,400 0
Other income 0 0 0 0 0 0 0 0 0 0 0 6,004
TOTAL CASH OUTFLOW 16,410 8,288 9,358 10,428 11,202 11,214 12,837 12,884 12,931 12,979 13,026 0
Increase in fixed assets 14,288 0 0 0 0 0 0 0 0 0 0 0
Increase in net working capital 2,122 297 297 297 1 0 0 0 0 0 0 0
Operating costs 0 7,491 8,561 9,631 10,701 10,714 10,714 10,714 10,714 10,714 10,714 0
Marketing and Distribution cost 0 500 500 500 500 500 500 500 500 500 500 0
Income (corporate) tax 0 0 0 0 0 1,623 1,670 1,718 1,765 1,812 0
NET CASH FLOW -16,410 3,892 6,302 6,972 6,198 6,186 4,563 4,516 4,469 4,421 4,374 6,004
CUMULATIVE NET CASH FLOW -16,410-
12,518 -6,216 756 6,953 13,140 17,703 22,219 26,687 31,109 35,48341,48
6
Net present value -16,410 3,538 5,208 5,238 4,233 3,841 2,576 2,317 2,085 1,875 1,686 2,315
Cumulative net present value -16,410-
12,872 -7,664 -2,426 1,807 5,649 8,224 10,542 12,626 14,501 16,18818,50
2
NET PRESENT VALUE 18,502INTERNAL RATE OF RETURN 31.29%NORMAL PAYBACK 3 years
25