Embed Size (px)
Citation preview
AD-AO93 688 STANFORD UNIV CA EDWARD L GINZTON LAS OF PHIYSICS F/S 20/5TUNABLE OPTICAL SOURCES. (U)NOV 80 R L BYER DAA629-79-C-ol8I
UNCLASSIFIED GL-3209 ARO-15278.11-P I&.
IIEIIIEIIEEEEENIIIlfflfflfflfflf IIfflfIIlfflfflfflfflfflfflfEIEIhEEEEEIIII!IIIIIIEEEIIEEII
MIMI1 11112.
1111 . *2 12.2
111111L 25
MICROCOPY RESOLUTION TEST CHART
P BE OPTICAL SOURCES-
W __ Final R'epmt.
0ewe:)1 Sepamhw. 10791- "Jl Augt 180'.,,
ge Robert L.,' Byer
ov,,,w 8r
U.S. ARMY RESEARCH OFFICE
L?
Contract: DAAG29-79-C-A1811v
Edward L. Ginzton Laboratory
Stanford University
Stanford, California 94305
CJ1
Approved for Public Release;
Distribution Unlimited1'I i j 9
I
The views, opinions, and/or findings contained In this r~port are
those of the author(s) and should not be construed as an official
Department of the Army position, policy, or decision, unless so
designated by other documentation.
ii
'4 UNCLASSIFIEDSECURITY CLASSIFICATION OF THIS PAGE (When Date Entered)
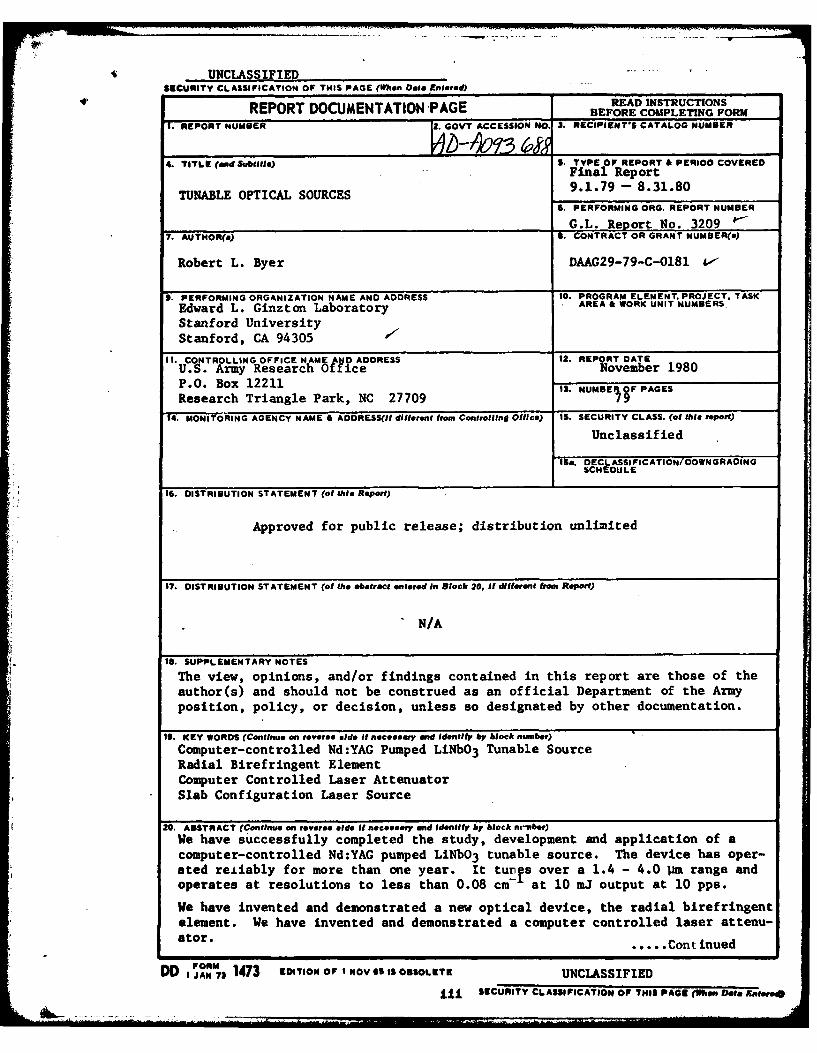
READ INSTRUCTIONSREPORT DOCUMENTATIONPAGE BEFORE COMPLETING FORM1. REPORT NUMBER 2. GOVT ACCESSION NO. 3. RECIPIENT'S CATALOG NUMBER
4. TITLE (an~d Subtitle) S. TYPE OF REPORT & PERIOD COVEREDFinal Report
TUNABLE OPTICAL SOURCES 9.1.79 - 8.31.806. PERFORMING ORG. REPORT NUMBER
G.L. Report No. 3209 '_7. AUTHOR(q) S. CONTRACT OR GRANT NUMBER(&)
Robert L. Byer DAAG29-79-C-0181 -
S. PERFORMING ORGANIZATION NAME AND ADDRESS 10. PROGRAM ELEMENT. PROJECT. TASK
Edward L. Ginzton Laboratory AREA& WORK UNIT NUMBERS
Stanford UniversityStanford, CA 94305
I1. CONTROLLING OFFICE NAMEtAN ADDRESS REP TU.S. Army Research Ofice R ovember 1980P.O. Box 12211 is. NUMBEROF PAGES
Research Triangle Park, NC 27709 7914. MONITORING AGENCY NAME & ADDRESS(II dlllerent from Controlliln Office) IS. SECURITY CLASS. (of thie report)
Unclassified
IS.. DECL ASSI F1CATION/DOWN GRADINGSCH EDU LE
16. DISTRIBUTION STATEMENT (of this Report)
Approved for public release; distribution unlimited
17. DISTRIBUTION STATEMENT (of the abstract entered in Block 20, if different from Report)
N/A
IS. SUPPLEMENTARY NOTES
The view, opinions, and/or findings contained in this report are those of theauthor(s) and should not be construed as an official Department of the Armyposition, policy, or decision, unless so designated by other documentation.
19. KEY WORDS (Continue on reverte side It necesary and Identify by block number)
Computer-controlled Nd:YAG Pumped LiNbO3 Tunable SourceRadial Birefringent ElementComputer Controlled Laser AttenuatorSlab Configuration Laser Source
20. ABSTRACT (Continue on reveree elde It neceery end Identify by block nm-nber)
We have successfully completed the study, development and application of acomputer-controlled Nd:YAG pumped LiNbO3 tunable source. The device has oper-ated re±iably for more than one year. It tunfs over a 1.4 - 4.0 Um range andoperates at resolutions to less than 0.08 cm- at 10 mJ output at 10 pps.
We have invented and demonstrated a new optical device, the radial birefringentelement. We have invented and demonstrated a computer controlled laser attenu-ator. .... Cont inued
DD Il 7 1473 EDITION OF I NOV 01 IS OBSOLETE UNCLASSIFIEDAN CR CLASSIFISE!,IICURITY CLASSIFICATION OF THIS PACE (t'hen, Des Kneen"*
UNCLASSIFIEDSECURITY CLASSIFICATION Of THIS5 PAGE(When Data ENt.,.d9
20. (continued)
During the past year we have developed the theory for a slab configurationlaser source. We have successfully demonstrated-the slab geometry as appliedto Nd:Glass. Work is continuing on the understanding and implementation ofthis high energy, high repetitional rate Nd:Glass slab laser source.
IV UNCLASSIFIEDSECURITY CLASSIFICATION OF THIS1 PAGEVWhf De 14mWE
TABLE OF CONTENTS
Page
Abstract ........... .. .. . . . . . . . . . . . . .. vi
Tunable Optical Sources . . . . .... . ... 1
A. Statement of the Problem Studied . . . . . . . .
B. Suamary of Results ........ . 2
C. List of Publications and Technical Reports ...... ... 4
D. Papers Submitted for Publication ...... .......... 4
E. Participating Scientific Personnel. ......... 5
Reprint: "Remote Single-Ended Measurements of Atmospheric
Temperature and Humidity at 1.77 pm Using a Continuously
Tunable Source," by Endemann and Byer ............. . 6
Reprint: "Computer-Controllable Wedged-Plate Optical Variable
Attenuator," by Bennett and Byer ....... .. ............. 9
Reprint: "Radial Birefringent Element and its Application to
Laser Resonator Design," by Giuliani, Park, and Byer . . . . 14
Appendix A --"Remote Atmospheric Measurements in the Near
Infrared Using a Reliable OPO-Source" .. . . . ....... 17
Appendix B --"Growth of High Phasematching Temperature LiNbO3
Single Crystals and Application to Efficient Second
Harmonic Generation of Nd:YAG" . . . . . . . . . . . . . 45
v
TUNABLE OPTICAL SOURCES
Robert L. ByerApplied Physics Dept.,Stanford University
ABSTRACT / x
We have successfully completed tle study, OvelopmentI /, ' ,
and application of a computer contr$led NdX34G pumped LiNbO3
tunable source. The device has op rated eliably for more than
one year. It tunes over a 1.4 - 0 range and operates at
resolutions to less than 0.08 4- at 10 mJ output at 10 pps.
We have invented and demonstrated a new optical device,
the radial birefringent element. We have invented and demonstrated
a computer controlled laser attenuator.
During the past year we have developed the theory for a
slab configuration laser source. We have successfully demonstrated
the slab geometry as applied to Nd:Glass. Work is continuing on
the understanding and implementation of this high energy, high
repetitional rate Nd:Glass slab laser source.
vi
TUNABLE OPTICAL SOURCES
Robert L. Byer
FORWARD
During the past year we have made significant progress
in three aspects of tunable laser physics :operation and
measurements with a Nd:YAG pumped LiNbO3 Optical Parametric
Oscillator Source (OPO);invention, development and demonstration
of a new optical element called the Radial Birefringent Element
(RBE), and the design and demonstration of a slab configuration
Nd:Glass laser oscillator/amplifier system,
We have also invented and developed a computer controlled
attenuator and have transferred that technology to industry through
the Stanford University License and Technology Office. We have
also grown hot phasematching LihbO 3 and have demonstrated efficient
second harmonic generation of a cw lamp pumped Nd:YAG laser source.
TUNABLE OPTICAL SOURCES
A. Statement of the Problem Studied
The work during the past year aimed at using nonlinear
processes to generate trunable coherent radiation. The work
centered on the pump laser sources and improvements in- laser source
capability. In addition, work progressed on the generation of
computer controlled coherent tunable radiation via the Nd:YAG
pumped LiNbO3 OPO.
ii
Work began on the study of Nd:Glass as a tunable source.
The slab configuration was studied with a design goal of 6 J
per pulse at 10 pps tunable output at 1.055. u ± 100 cm-1 .
Stimulated Raman shifting is planned for frequency extension to
the infrared.
LIST OF APPENDICES
1. M. Endemann and R.L. Byer, "Remote Atmospheric
Measurements in the Near Infrared Using a Reliable
OPO Source".
Ir. Y.K. Park, R.L. Byer, R.S. Feigelson and W. Kway,
"Growth of High Phasematching Temperature LiNbO3
Single Crystals and Application to Efficient Second
Harmonic Generation of Nd:YAC".
B. Summary of Results
During the past year we completed work on the high resolution
operation of the computer controlled Nd:YAG pumped LiNbO3 tunable
source. We have demonstrated a 4500 cm"- tuning range at 0.6 cm-1
resolution; a 0.08 cm- resolution tunable over a 20 cm- range;
more than one year of operation without optical damage problems,
and the capability to make precise atmospheric species, temperature
and humidity measurements. The results are summarized in Appendix I
and have been presented at recent conferences. M. Endemann's Ph.D.
thesis, in preparation, will describe the tunable source in detail.
This source was the first computer controlled tunable device.
i- 2-
|4
It now provides the widest tuning range of any tunable source
and has operated trouble-free for more than one year. A number
of LiNbO3 OPO sources are in operation around the world for remote
measurement and laser chemistry research applications. This work
is now completed. The four years of research and development
have led to a major advance in tunable source science and technology.
Research into methods of improving laser sources continued
during the past year. We invented a new.ortical cnmrnnent, the
radiil birefringent element, and applied it to laser resonator design.
We invented a new computer controlled laser attenuator and demonstrated
its capability.
We studied the growth of hot phasematching LiNbO3 for SHG
of Nd:YAG. Our work led to the solution a decade old'growth
problem and to the successful SHG of a Nd:YAG laser at 40% efficiency.
This work is summarized in Appendix II.
Our major area of emphasis was the theoretical study of the
slab configuration Nd:Glass laser source. We have completed a
theoretical description of the slab laser and have developed a
first generation numerical program for design calculations. We
have designed and constructed a slab glass oscillator. The
oscillator verified the theoretical design calculations. It
clearly showed the advantages of the slab geometry for glass as
well as for high average power Nd:YAG and other crystalline laser
materials.
We are actively continuing the experimental and theoretical
program on the slab geometry laser approach. We expect to complete
-3-
experimental demonstration of the slab glass system in the near
future using high quality, optimum finished LHG-5 Hoya glass slabs.
This work will then be written as a theoretical/experimental paper
on the slab geometry laser approach.
C. List of Publications and Technical Reports
1. M. Endemann and R.L. Byer, "Remote Atmospheric
Measurements with a Reliable Tunable OPO Source,"
Optics Letters, October 1980.
2. K. Bennett and R.L. Byer, "A Computer Controlled
Wedged Plate Laser Attenuator," Applied Optics,
August 1980.
3. G. Giuliana, Y.K. Park, and R.L. Byer, "Radial
Birefringent Element and Its Application to Laser
Resonator Design," Optics Letters, November 1980.
D. Papers Submitted for Publication
M. Endemann and R.L. Byer, "Remote Atmospheric
Measurements in the Near Infrared Using a Reliable
OPO Source."
Y.K. Park, R.L. Byer, R.S. Feigelson, and W. Kway,
"Growth of High Phasematching Temperature LilbO3 Single
Crystals and Application to Efficient Second Harmonic
Generation of Nd:YAG."
-4-
E. Participating Scientific Personnel
Principal Investigator: Robert L. Byer
Visiting Scholar: Dr. G. GiulianiUniversity of RomeItaly.
Graduate Student: Dr. Y.K. Park, Ph.D. earnedin the summer of 1980.
Graduate Student: M. Endemann, Ph.D. expectedDecember, 1980.
Graduate Student: K. Bennett.
-5-
452 OPTICS LETTERS / Vol. 5. No. 10 / October 1980
Remote single-ended measurements of atmospheric temperatureand humidity at 1.77 jim using a continuously tunable source
M. Endemann and R. L. Byer
Applied Physics Department, Edward L. Ginzton Laboratory. Stanford University, Stanford, California 94305
Received June 9, 1980
Simultaneous remote measurements of temperature and humidity using a narrow-linewidth, continuously tunable,LiNbO3 optical parametric oscillator as a transmitter source are reported. Relative measurement errors of 1.0°Cfor temperature and better than 1% for humidity over a 45-sec averaging time are observed. The absolute accuracyis limited by the accuracy of available spectroscopic data.
This Letter describes the application of our widely T = CT + D, (4)tunable IR air-pollution monitoring system".2 to thesimultaneous measurement of atmospheric temperature with T = In A (T) - In A2(T), C = k T2(E1 - E;), andand humidity. Simultaneous remote measurement of D = C[ln a 2(To) - In o-,(To)] + To(k).these two important meteorological parameters-prom- As expected, the accuracy of the temperature mea-ises to be a useful tool for atmospheric research. surement is inversely proportional to the difference in
A number of groups have proposed and analyzed lower-state energies, E - E. Once the temperaturemethods of making remote temperature measurements, is known, it is straightforward to calculate the densityand preliminary remote temperature measurements of the species.have been reported using Raman lidar 3 and a two-fre- Using selected H20 transitions permits the simul-quency absorption measurement have been reported.4 taneous measurement of temperature and H20 con-Remote temperature measurements using atmo- centration and thus of relative humidity. Because ofspheric-transmittance measurements of three wdve- the complexity of the spectrum, we used tapes suppliedlengths have been analyzed by Mason5 and by by the U.S. Air Force Cambridge Research LaboratorySchwemmer and Wilkerson.6 Two wavelengths PI and (AFCRL) to select H20 lines with appropriate absorp-V2 are selected to coincide with two absorption lines of tion cross-section and ground-state energy differences.one species with different ground-state energy E;. A For our measurements, the optimum absorption linesthird wavelength voff is tuned away from the absorption were found in the 1.9-pmo-band region. The J = 11 Jinelines and is used to normalize the other two measure- at 5651.33 cm - 1, with a lower-state energy of 1999 cm- 1,ments. The absorbance Ai is given by and a nearby J = 6 line at 5650.41 cm - 1, with a 543 cm - '
lower-state energy, were selected since their absorptionAi(T) = NL ai(T) = ln(Soff) - ln(Si), (1) cross sections at room temperature are of similar
where strength and their absorbaice is approximately unityat average H20 concentrations over a 1-km path. The
Si is the signal received at wavelength vi, 1456-cm - ' difference in lower-state energy yields aN is the density of the species, 0.8°C temperature error for a 1 % accuracy in deter-L is the pathlength, and mining the absorbance at P' and t.ui(T) is the absorption cross section at T. and One problem does arise with thi.r selection of lines.
temperature T. At each wavelength, not only do the sek'c'ed lines con-The temperature dependence of the absorption cross tribute to the measured absorbance; the wings fromsection is given by the Boltzmann distribution and a some strong nearby lines and many weaker, but notpartition function Q(T) as negligible, lines also contribute. We used the spectro-
= (To)Q(T)exp(E/k)(1/To - 1/T)j (2) ..scopic data contained in AFCRL tapes7 in a computer(T) = ()program to simulate this interference. Figure 1 shows
for an arbitrary reference temperature T0, where E7 is a simulation of a temperature measurement using thethe lower-state energy of the transition at vi and k is the same three wavelengths as were used in the actual ex-Boltzmann constant. periment. Here T Isee Eq. (4)] is plotted against the
From the two measured values Ai(T), we can deter- actual temperature 1'. Overlapping of the two mainmine the temperature 7' as absorption lines and the influence of other lines and
second-order effects make T a nonlinear function of T.T TO (3) However, the linear approximation Eq. (4) holds tokTo , TT) l g1(TO better than I* accuracy from -20 to 309C. Variation1 E - In _2( of the spectral resolution in the computer simulation
A2(T@ Ashows only small changes of the constanft C and ) for
or, for (T - To)/To << 1, temperatures above -20*C. Spectroscopic data usedReprinted from Optics Letters, Vol. 5, page 452,. October 1980
Copyright CD 1980 by the Optical ,ociety of America and reprinted by permission of the copyright owner.
October 1980 / Vol. 5. No. 10 / OPTICS LEITERS 453
trace in Fig. 2 shows an example of an atmospheric-transmission spectrum with a 0. 1-cm resolution tuned
• .%SI.os,-"' over a 17-cm - ' range. The upper trace is a simulated
0 transmission spectrum made by using the AFCRLY tapes.7 We used scans similar to this to calibrate the
r - 40$OCT tuning of the OPO and to identify the temperature-
C
*40
0 • s4 sensitive lines.
-, /Once the wavelengths of these lines are determinedand the OPO aligned, temperature and humidity mea-
SOLUT 0., " surements are made under computer control. The re-turn signal at each frequency is averaged over several
-2- -KRSOLuTO, O.2clW" shots before we tune to another line. The time of thisaverage has been optimized to minimize errors that aredue to water-vapor fluctuations but to achieve maxi-
-3 ,0 mum time resolution of the measurement. The OPO-40 20 0 20 is now tuned after 30 shots or 3 sec, which is a good
compromise in calm atmospheric conditions. After allFig. 1. Temperature calibration using spectroscopic data. three lines are probed, temperature and humidity areFor only two absorption lines, the temperature dependence calculated, displayed, and stored. Further averagingis T = CT + D. The interference of other lines and the sec- can be done later; this reduces the storage space re-ond-order effects of the approximation lead to the slightly quired. Also, the standard deviation of each quantitycurved calibration line. Different probing resolutions changethe calibration, but temperature shifts are small above resulting from return-signal fluctuations is determined_20oc. and stored.
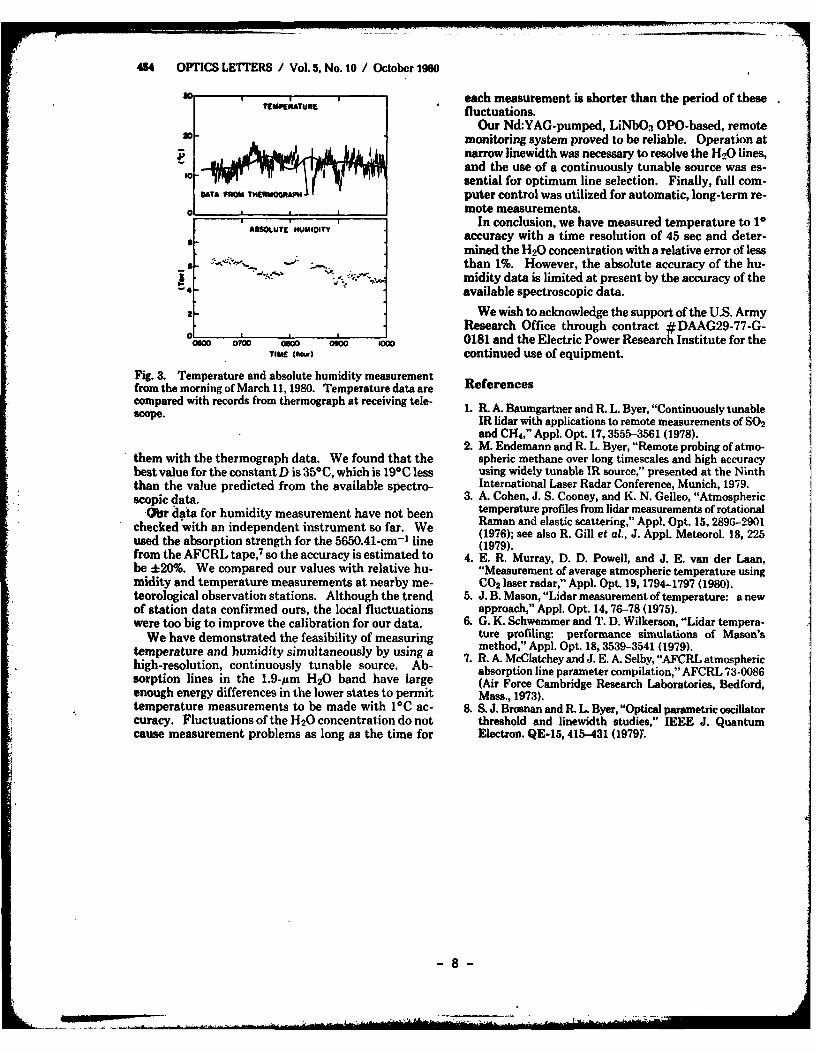
Figure 3 shows the record of temperature and hu-midity from the morning of March 11, 1980. Each point
in this simulation have line-strength errors of about represents 150 shots/line or averaging over 45 sec. The20%, whereas the lower-state energies are known to 0.02 standard deviation was 1.1°C in the beginning but in-cm-. The line-strength error affects the constant D, creased to 1.4*C at 0800 h. The outside weather waswhereas the value for the proportionality constant C is cloudy at first, with rain startiig at 0740. The rain thenaccurate. In actual measurement, we had to use a value increased until it was so strong at 0810 that the mea-for D that is 20*C less than that predicted in the simu- surement had to be interrupted. At 0820 the rainlation. We are working to improve the spectroscopic stopped, the cloud cover slowly dissipated, and the winddata by using our tunable source. increased. The remotely measured temperature is
The experimental setup is an improved version of the compared with a record of a thermograph at the tele-LiNbO3 optical parametric-oscillator (OPO)-based scope. The general agreement is good. Some dis-air-pollution monitoring system.1 .2 An unstable reso- crepancies in the two measurements are expected sincenator-Nd:YAG laser is used to pump an angle phase- the remote measurement averages over a path from 10matched LiNbO3 OPO. The OPO is continuously to 60 in above the ground and 775 m in length, whereastunable over a 4500-cm-I-wide range, from 1.42 to 4.0 the thermograph is located on the roof of a building.pum. It generates 10-mJ output energy in a 15-nsec-long The calibration of our data is done by using a largepulse with a 10-Hz repetition rate. It has operated re- number of remotely measured temperature values (weliably for more than one year. Details of the tunable have accumulated a total of 10 h of data) and comparingsource have been reported earlier. 2.8
The linewidth of the OPO is narrowed to 0.7 cm- 1 by ATMOSPHERIC TRANSMISSION OVER 1.55km LONG PATH
using an intracavity grating. A tilted 6talon furtherreduces the output linewidth to 0.1 cm - 1 . Thissource i--is continuously tunable by using a PDP11 EIO mini- I""computer to set crystal angle, grating, and 6talon. The LOPO output is expanded to a 2.5-cm-diameter beam [,\and directed to the roof of our laboratory, where it is Zcoaxially transmitted through the telescope. The f40-cm-diameter receiving telescope focuses the receivedlight onto a liquid-nitrogen-cooled InSb detector. Z
Since the output energy of the O1O is not adequate [ n' ss5I"s3em' \ ifor differential absorption measurement- using Mie r -*99cm,
backscattering, we were limited to long-path absorption I -"measurements using a building at a distance of 775 m L •5650.4cm- y4as a backscattering target. The height above ground _ - 543 e m"
level of this path varies from 10 to 60 m. 5650 5655 544A computer was used to tune the OPO and for data FREQUENCY (emW")
taking, averaging, storage, and display. An extensive Fig. 2. High-resolution atmospheric scan over 1.5.-km path.interactive routine was developed to obtain atmo- TheOPO linewidthis0.1cm-i. The OPO transmission scanspheric-transmission spectra and to make automatic (lower trace) i% compared with a simulation using AFCIL filetemperature and humidity measurements. The lower data (upper trace).
454 OPTICS LETTERS / Vol. 5. No. 10 / October 190
0 ,,each measurement is shorter than the period of thesefluctuations.
Our Nd:YAG-pumped, LiNbO3 OPO-based, remote0, .,monitoring system proved to be reliable. Operation at
narrow linewidth was necessary to resolve the H20 lines,I and the use of a continuously tunable source was es-'0 sential for optimum line selection. Finally, full com-
_W "OWAMPM 1puter control was utilized for automatic, long-term re-0 mote measurements.
ABsoLuTE' nuuoIv In conclusion, we have measured temperature to 1 °
accuracy with a time resolution of 45 sec and deter-mined the H20 concentration with a relative error of less
* " "_ '-'" than 1%. However, the absolute accuracy of the hu-midity data is limited at present by the accuracy of theavailable spectroscopic data.
2 We wish to acknowledge the support of the U.S. ArmyResearch Office through contract #DAAG29-77-G-
e 0 0181 and the Electric Power Research Institute for theTIME (Mw) continued use of equipment.
Fig. 3. Temperature and absolute humidity measurementfrom the morning of March 11, 1980. Temperature data are Referencescompared with records from thermograph at receiving tele- 1. R. A. Baumgartner and R. L. Byer, "Continuously tunablescope. IR lidar with applications to remote measurements of SO2
and CH 4," Appl. Opt. 17, 3555-3561 (1978).2. M. Endemann and R. L. Byer, "Remote probing of atmo-
them with the thermograph data. We found that the spheric methane over long timescales and high accuracybest value for the constant D is 350C, which is 19*C less using widely tunable IR source," presented at the Ninththan the value predicted from the available spectro- International Laser Radar Conference, Munich, 1979.scopic data. 3. A. Cohen, J. S. Cooney, and K. N. Gelleo, "Atmospheric
-Obr data for humidity measurement have not been temperature profiles from lidar measurements of rotationalchecked with an independent instrument so far. We Raman and elastic scattering," Appl. Opt. 15, 2896--2901
(1976); see also R. Gill et al., J. Appl. Meteorol. 18, 225used the absorption strength for the 5650.41-cm- 1 line (1979).from the AFCRL tape,7 so the accuracy is estimated to 4. E. R. Murray, D. D. Powell, and J. E. van der Laan,be 120%. We compared our values with relative hu- "Measurement of average atmospheric temperature usingmidity and temperature measurements at nearby me- CO2 laser radar," Appl. Opt. 19,1794-1797 (1980).teorological observation stations. Although the trend 5. J. B. Mason, "Lidar measurement of temperature: a newof station data confirmed ours, the local fluctuations approach," Appl. Opt. 14, 76-78 (1975).were too big to improve the calibration for our data. 6. G. K. Schwemmer and T. D. Wilkerson, "Lidar tempera-
We have demonstrated the feasibility of measuring ture profiling: performance simulations of Mason'sand humidity simultaneously by using a method," Appl. Opt. 18,3539-3541 (1979).
temperature cnuouly unabneouc ab 7 R. A. McClatchey and J. E. A. Selby, "AFCRL atmospherichigh-resolution, continuously tunable source. Ab- absorption line parameter compilation," AFCRL 73-0086sorption lines in the 1.9-pm H20 band have large (Air Force Cambridge Research Laboratories, Bedford,enough energy differences in the lower states to permit Mass., 1973).temperature measurements to be made with IOC ac- 8. S. J. Brosnan and R. L. Byer, "Optical parametric oscillatorcuracy. Fluctuations of the H20 concentration do not threshold and linewidth studies," IEEE J. Quantumcause measurement problems as long as the time for Electron. QE-15, 415-431 (1979).
-8-
Reprinted from APPLIED OPTICS, Vol. 19, page 2408 -July 15, 1980Copyright ( 1980 by the Optical Society of America and reprinted by permission of the copyright owner.
Computer-controllable wedged-plate optical variableattenuator
K. Bennett and R. L. Byer
A computer-controllable variable optical attenuator has been developed and tested that has a wide dynamicrange, wide spectral range, and is suitable for applications with high peak and average power laser sources.The device is based on Fresnel transmission through two pairs of wedged plates. A 35-dB dynamic range.an insertion loss of 1%, a precision of better than 1% and beam offset and deflection of <0.5 mm and 0.5mrad, respectively, are demonstrated.
I. Introduction reflection meets all of the above design criteria whenThe ideal optical variable attenuator should provide properly executed; beam deflection and offset are lim-
wide dynamic range, wide spectral range, resettability, ited only by fabrication errors.and high accuracy, yet exhibit a simple optical and The theory, design, and performance of themechanical design. We added the additional require- wedged-plate optical attenuator are described in Secs.ments that the optical variable attenuator operate with II-AV.high peak and average power inputs produced by Q-switched laser sources and not significantly alter the It Theorybeam profile, position, or direction.
With these constraints in mind, we reviewed possible The power transmittance (Ts) for a single surface
methods of applying the three fundamental interactions depends upon the polarization, the ratio of the indicesthat can be used to attenuate optical radiation: ab- of refraction n, and the angle of incidence 0i. Thesorption; Fresnel reflection at a surface; and interfer- transmittance for light polarized parallel and perpen-ence. Attenuation by absorption and interference were dicular to the plane of incidence is 3
eliminated as not being consistent with the require- sin(20i) sin(26) (1)ments for high peak and average power and wide spec- Ts± (91.n) sin2(Oi + O)(tral range. Ts±(P,n)
Fresnel reflection is the basis for many forms of at- Tst(O.n) - os ,( ) (2)tenuators including those based on birefringent crystalsand polarization-dependent total internal reflection.' where Snell's law in the formWe chose to avoid the use of crystals because of limited n sin0i = sin0i (3)spectral range and optical quality. Instead we con-centrated on Fresnel reflection near the critical angle applies, and n = nj/ni is the index ratio with ni and n,in a homogeneous dielectric medium. the refractive indices of the incident and transmitting
The variable gap spacing total internal reflection media.attenuator 2 is spectrally sensitive and requires tight Snell's law leads to total internal reflection when nofabrication tolerances. On the other hand, a variable real solution for #t exists and occurs only if nt < ni orincident angle wedged-plate attenuator utilizing Fresnel when n < 1. To achieve total internal reflection we
designed the attenuator to use wedged plates of wedgeangle cY.
The transmittance of a single wedged plate T,, is theproduct of the transmittance of two surfaces,
The authors are with Stanford University. Edward L. Ginzton T,(O..n.gr) - T.(Oi,n)T..(Or + tv, 1/n), (4)Laboratory of Physics. Stanford. California mi305.
Received 2 February 1980. and the transmittance of the entire attenuator T is the000,-693:./80/142498-O550$0.))/0. product of the t ransmittances of each of the four iden-0 190 Optical Society of America. tical wedges:
2408 APPLED OPTICS / Vol. 19. No. 14 / 15 July 1980
-9-
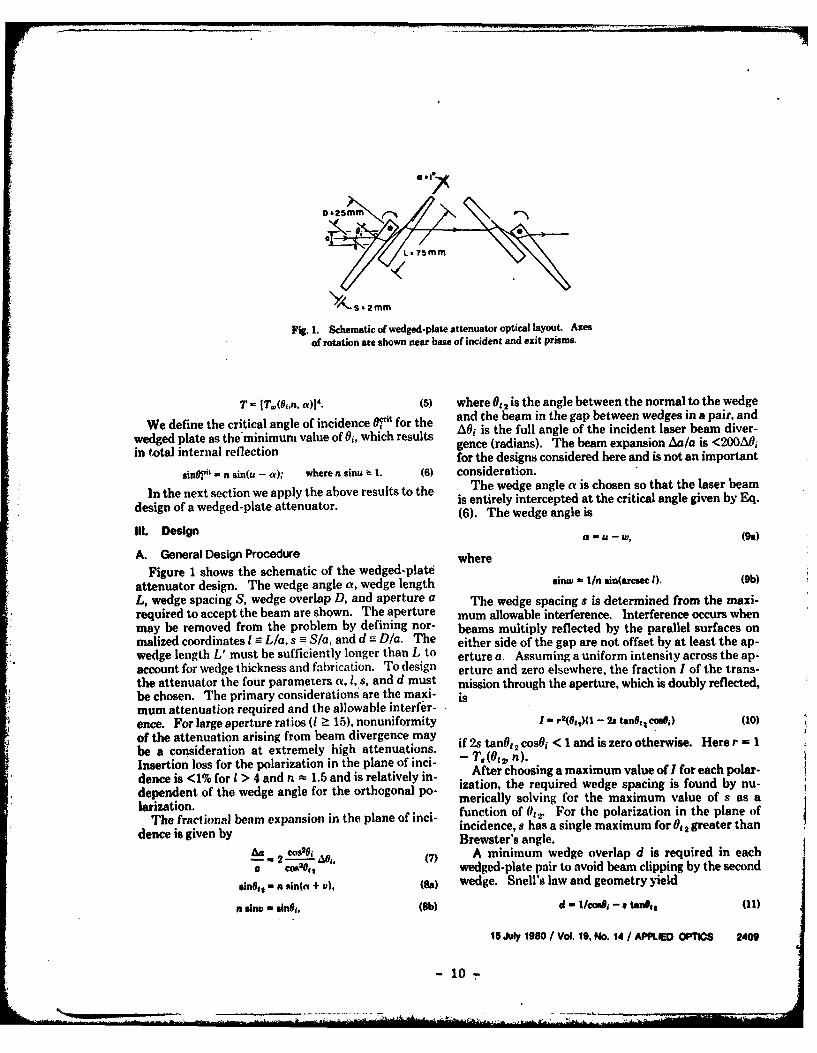
0025"1
"' S 2 mm
Fig. 1. Schematic of wedged-plate attenuator optical layout. Axes
of rotation are shown near base of incident and exit prisms.
T = [T,(9,n, a)]'. (5) where Ot2 is the angle between the normal to the wedge
We define the critical angle of incidence 07it for the and the beam in the gap between wedges in a pair, and
wedged plate as the minimum value of Oi, which results AOi is the full angle of the incident laser beam diver-
in total internal reflection gence (radians). The beam expansion Aa/a is <200AOifor the designs considered here and is not an important
sin, t - n sin(u - a); where n sinu z 1. (6) consideration.
In the next section we apply the above results to the .The wedge angle a is chosen so that the laser beam
design of a wedged-plate attenuator. is entirely intercepted at the critical angle given by Eq.(6). The wedge angle is
Ill. Design
A. General Design Procedure whereFigure 1 shows the schematic of the wedged-plate
attenuator design. The wedge angle a, wedge length sinw - I/n sin(arcsec 1). (9b)
L, wedge spacing S, wedge overlap D, and aperture a The wedge spacing s is determined from the maxi-required to accept the beam are shown. The aperture mum allowable interference. Interference occurs whenmay be removed from the problem by defining nor- beams multiply reflected by the parallel surfaces onmalized coordinates I = L/a, s -S/a, and d -Dia. The either side of the gap are not offset by at least the ap-wedge length L' must be sufficiently longer than L to erture a. Assuming a uniform intensity across the ap-account for wedge thickness and fabrication. To design erture and zero elsewhere, the fraction I of the trans-the attenuator the four parameters a, l, s, and d must mission through the aperture, which is doubly reflected,be chosen. The primary considerations are the maxi- ismum attenuation required and the allowable interfer-ence. For large aperture ratios (I ?: 15), nonuniformity I - r2(0t,)(1 - 21 tan9t1 cos9,) (10)
of the attenuation arising from beam divergence maybe a consideration at extremely high attenuations. if 2s tanot 2 cosOi < 1 and is zero otherwise. Here r = 1
Insertion loss for the polarization in the plane of inci- - T,(01 2, n).
dence is <1% for I > 4 and n - 1.5 and is relatively in- After choosing a maximum value of I for each polar-
dependent of the wedge angle for the orthogonal po- ization, the required wedge spacing is found by nu-
larization. merically solving for the maximum value of s as a
The fractional beam expansion in the plane of inci- function of 012 . For the polarization in the plane ofThnce friena bem incidence, s has a single maximum for It 2 greater than
dence is given by Brewster's angle.
27 A minimum wedge overlap d is required in eachCos9 0t, wedged-plate pair to avoid beam clipping by the second
sine,, - n sin(a + v), (8a) wedge. Snell's law and geometry yield
n slav - sini, (8b) d - 1/cor~i - a tanit (11)
16 July 1980 / Vol. 10, No. 14 / APPLED OPTICS 2409
- 10-
for the beam walk where the thickness of the optic has so
been neglected. This function has a single maximum,in the domain of interest and is again computed nu- POLARIZATION I TO
merically using the value of s determined above. 0- PLANE OF INCIDENCE
The maximum attenuation is limited by clipping of -
the outside edge of the second wedge. This occurs 0for ; 40
tan,, ? ((I - d)/ls. (12)
The maximum attenuation is found by applying Eq. (5) ' 20 POLARIZATION If TO
with 0i calculated from Eqs. (8a) and (8b).0; 5 IL IL L 2-
NORMALIZEO WEDGE LENGTH (M)
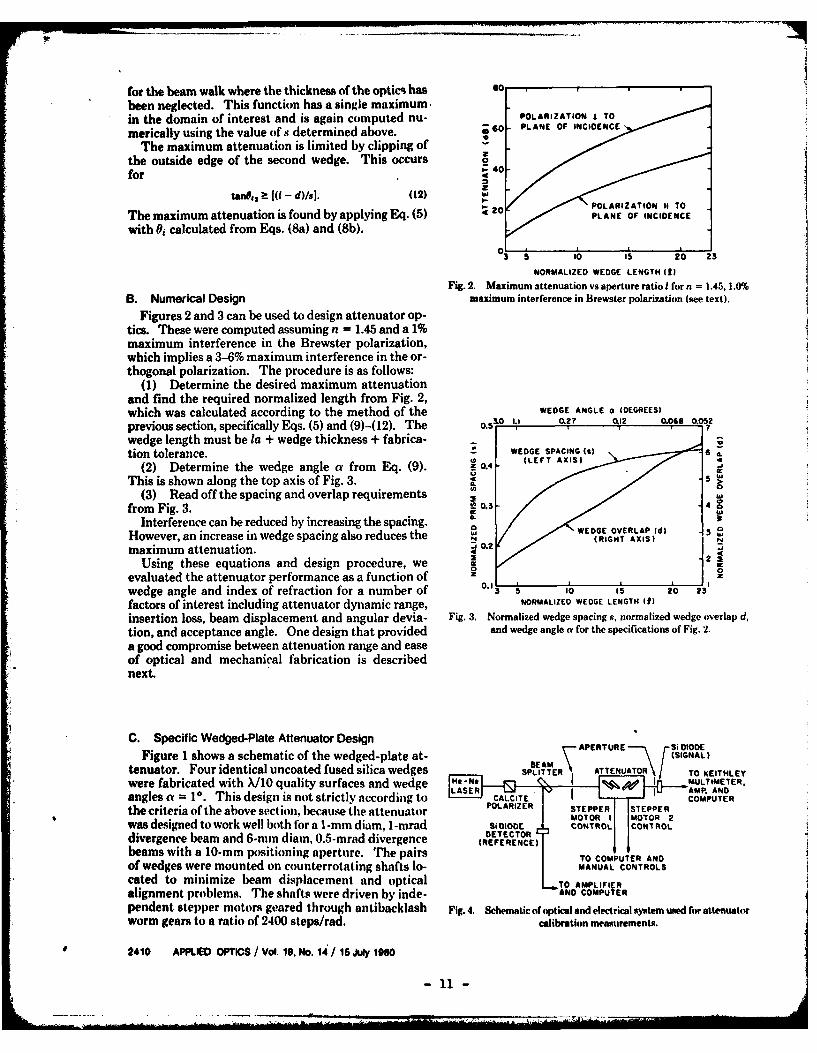
Fig. Maximum attenuation vs aperture ratio I for n 1 1.45, 1.0%B. Numerical Design maximum interference in Brewster polarization (see text).
Figures 2 and 3 can be used to design attenuator op-tics. These were computed assuming n = 1.45 and a 1%maximum interference in the Brewster polarization,which implies a 3-6% maximum interference in the or-thogonal polarization. The procedure is as follows:
(1) Determine the desired maximum attenuationand find the required normalized length from Fig. 2,which was calculated according to the method of the WEDGE ANGLE a (OEGREES)
previous section, specifically Eqs. (5) and (9)-(12). The 0.5 0. 7 o.12 o06s c2wedge length must be la + wedge thickness + fabrica- wEDGe SPACING (sItion tolerance. -
(2) Determine the wedge angle a from Eq. (9). F 0 4
This is shown along the top axis of Fig. 3.(3) Read off the spacing and overlap requirements 3
from Fig. 3. L 0.3 4
Interference can be reduced by increasing the spacing. A
However, an increase in wedge spacing also reduces the wEEGEGOVLAP ()maximum attenuation. 0.2
Using these equations and design procedure, we 0evaluated the attenuator performance as a function ofwedge angle and index of refraction for a number of o. - 1 Is 20 23factors of interest including attenuator dynamic range, NORMALIZED WEDGE LENGTH (t)
insertion loss, beam displacement and angular devia- Fig. 3. Normalized wedge spacing s, normalized wedge overlap d,
tion, and acceptance angle. One design that provided and wedge angle a for the specifications of Fig. 2.
a good compromise between attenuation range and easeof optical and mechanical fabrication is describednext.
C. Specific Wedged-Plate Attenuator Design APERTURE Si DODEFigure 1 shows a schematic of the wedged-plate at- (SIGNAL)BEAM
tenuator. Four identical uncoated fused silica wedges SPLITTER ATTENUATOR TO KEITHLEY
were fabricated with X/10 quality surfaces and wedge He-No I -ULTMETER.angles a = 10. This design is not strictly according to L CALCITE , AND
the criteria of the above sect ion, because the attenuator OSTEPPER I STPPERMOTOR I1 MOTOR2
was designed to work well both for a 1-mm diam, 1-mrad SI DIODE CONTROL CONTROL
divergence beam and 6-man dian, 0.5-mrad divergence (REFERENCE)
beams with a 10-mm positioning aperture. The pairs TO COMPUTER ANDof wedges were mounted on counterrotating shafts lo- MANUAL CONTROLS
cated to minimize beam displacement and optical TO AMPLIFIERalignment problems. The shafts were driven by inde- AND COMPUTER
pendent stepper motors geared through antibacklash Fig. 4. Schematic of optical and electrical system used for attenuatorworm gears to a ratio of 2400 steps/rad. calibration measurements.
2410 APPLED OPTICS / Vol. 19, No. 14 / 15 July 19e0
-11 -
0.
4-
_ 00
0.2
s 40 80 120 iMo 200
INDEX N
Fig. 5. Measured transmittance TN 0.6 sin(Nxr/200) vs stepper motor position N:0, data points; -, theoretical transmittance; rms error is 0.008.
The wedges were fabricated 75 mm in length. To show the versatility and the dynamic range of theAlignment of the wedges within a pair must be within attenuator, two driving patterns were chosen. The firstthe diffraction angle of the incident beam to avoid sig- in a sine attenuation curve, and the second is a scan atnificant beam deflection. The wedges do induce some constant angular rate. The sine attenuation routinebeam expansion in the plane of incidence. However, calculates the proper number of motor steps to generatefor incident light polarized perpendicular to the plane a power transmittance function TN = 0.6 sin(Nxr/200)of incidence, beam expansion is <0.5 mm for a 1-mrad accurate to +0.0025. The data obtained by this routinedivergence input beam at the 38-dB attenuation level are shown in Fig. 5 for polarization perpendicular to theand decreases rapidly at lower attenuations. The cal- plane of incidence. The theoretical curve, which isculated insertion loss is 24% for a dynamic range of 35 drawn as a solid line in Fig. 5, is calculated according todB in this polarization. the actual motor setting and scaled to account for a
For a beam polarized parallel to the plane of incidence measured 1% scatter loss. The average rms error be-and incident at Brewster's angle, the calculated inser- tween the actual and calculated attenuation istion loss of the attenuator is <0.1%. The attenuator - n) 0.008.provides 15-dB dynamic range in this polarization. n 0.0 0.
The error agrees well with the average standard devia-tion of the data of 0.01 and the expected average digi-tization uncertainty of 0.005.
WV. Measurement Results Figure 6 shows the attenuation obtained for polar-The performance of the attenuator was verified using ization perpendicular to the plane of incidence as a
a polarized He-Ne laser source and a wide dynamic function of scan angle relative to the critical angle. Forrange silicon diode detector. The attenuator was con- the fused silica wedges used, n = 1.45 and 0 f 'it = 79.00trolled by a PDPII/10 minicomputer that set the for a = 10. The attenuation is plotted on a semilogstepper motors and recorded the transmitted and ref- scale to illustrate the wide dynamic range. To retainerence powers at 1-see intervals for each stepper motor signal levels for accurate digitization, the amplifier gainposition. A schematic of the experimental setup is settings were changed and normalization chosen forshown in Fig. 4. each setting to match the data points in overlapping
The attenuator was placed in the He-Ne beam path regions. The maximum attenuation was -4000:1, andin approximate alignment. Final angular alignment of the insertion loss for this polarization was 25%, whichthe prisms was accomplished to within 0.5 mrad by yields a dynamic range of 35dB. The average rms errormanually stepping the motors to critical angle inde- ( was 7,1.5,2, and 0.7% for the >30-, 20-30-, 10-20-, andpendently. This procedure provided an absolute or- 10-dB attenuation ranges. The error is larger in theientation for the prisms and proved to be very repeat- 10-20-dB range, because the amplified signal wasable. smaller, which led to increased electrical noise and di-
The laser output was then blocked, and the dark gitization errors. Data in the 15-20-dB range werecurrent was measured for the signal and reference taken at a higher amplifier gain setting and had an rmschannels. These levels were used as the zero signal error of 1%. All averages are within one standard de-levels for the subsequent measurements. viation of the theoretical values.
15 July 1980 / Vol. 19, No. 14 / APPLIED OPTICS 2411
- 12-
40
-30,20
a
0-
I-
0 1o 20 30 40 50 6o 70 oANGLE FROM CRITICAL ANGLE (DEGREES)
Fig. 6. Attenuation in dB vs angle from critical angle for incident He- Ne beam polarized per-pendicular to the plane of incidence: I, measured data points; -, theoretical attenuation.
In addition, all points in the >30-dB range showed The attenuation has a scatter-limited insertion lossa transmittance in excess of the theoretical value. This for the Brewster polarization of <1% and a dynamicis due to some residual component of the orthogonal range of 15 dB. The non-Brewster polarization inser-polarization. For example, an orthogonal polarization tion loss is 25% with a dynamic range of 35 dB. Beamcomponent of only one part in seven hundred would deflection and offset are limited by fabrication andaccount for the 7% extra transmittance in the >30-dB optical alignment tolerances. A simple hand assemblyrange. technique resulted in negligible beam offset and de-
Similar data were taken for the Brewster polarization, flection except at the highest attenuation levels whereand a maximum attenuation of 15 dB was measured as the measured offset is <0.5 mm and deviation <0.5expected. The measured insertion loss was near 1%, mrad at attenuations >35 dB.which is significantly greater than the expected 0.1% We designed the attenuator to meet a number of cwloss. However, eight wedge surfaces provide ample and pulsed laser attenuation requirements in our lab-opportunity for scatter losses to contribute to the at- oratory. We expect that the wedged-plate attenuatortenuation. has many uses, including nonlinear optical studies,
The attenuator performance was also verified with detector linearity and calibration measurements, ab-a Q-switched Nd:YAG laser source operating at 70 solute phototube calibration, tunable laser intensitymJ/pulse in a 6-mm diam beam. Since only uncoated control, and in absorption spectroscopy as part of a nullfused silica surfaces are employed, the attenuator detector servo system.should operate at incident energy densities limited onlyby the surface damage threshold of fused silica >3 J/cm 2 .
V. Conclusion We would like to thank George Kolter for fabricating
We developed a simple but versatile computer-con- the optics, Martin Endemann for his assistance with the
trollable optical variable attenuator suitable for use with computer, and S. Byer for data tabulation.virtually all collimated light sources, including highpower Q-switched lasers. The spectral response is ex-tremely flat anl can be accurately calculated from therefractive index. The useful spectral range is very This work was supported by the Air Force Office ofbroad limited only by the transmittance range of the Scientific Research under contract AF49620-77-C-0092wedge material. The optical fabrication and mechan- and by the Army Research Office. under contractical design are straightforward. and the attenuator does DAAG29-77-G-0221.not require dielectric or metallic coatings. Fresnel'sequations and a knowledge of the wedged-plate indicesof refraction lead to an absolute value of attenuationwith an accuracy limited by the knowledge of incident Referencespolarization. Transmittances precise to <2% are easily I. F. A. Jenkins and H. E. White. Fundamentals of Opticsobtained. Absolute accuracy can be improved by using (McGraw-Hill. New York, 1957).two attenuators in tandem with relative planes of inci- 2. T. Osehi aid S. Saito. Appl. Opt. 10. 144 (1971).dence rotated by precisely 90* to eliminate polarization :1. M. Ksrn and F. Wolf. Principles of Optics (Macmillan, Nvw York.dependence. 1975), p. 42.
2412 APPLIED OPTICS / Vol. 19. No. 14 /15 uly 1980
- 13 -
I±
"~55~Vt~tn * v~w.. UM -,. Sp -- w . Z
Radial birefringent element and its application to laser resonatordesign
G. Giullani,* Y. K. Parkt and R. L. Byer
Edward L. Ginzton Laboratory. Applied Physics Department. Stanford University. Stanford, California 94305
Received July IS, 1980
We have invented a quasi-Gaussian profile-transmittance filter based on radially varying the phase retardationin a birefringent element. The radial birefringent element has been applied to resonator design and has demon-strated its usefulness in generating an improved resonator spatial-mode profile.
It has been known for more than one decade that reso- principal axis of the birefringent plate. To a good ap-nators constructed with a Gaussian profile-reflector proximation,element offer the possibility of arbitrary large modediameters," - thus overcoming the small-mode-volume 0(r) 2irAnn(r)limitation of TEM0o mode resonators. To date, ex-perimental verification of the theory has not been 2rAn I r_1kdemonstrated. It has also been recognized that un- 0). (2)stable resonators5 offer an advantage of large modevolume, but at a sacrifice of mode quality because of wther he radial position and p is the curvature, thaperture-generated Fresnel fringes.6.7 Furthermore, the upper and lower signs corresponding to convex orthe stability of unstable resonators improves with in- concave curvatures, respectively. Equation (la) can becreasing magnification and thus with higher outputcoupling. Thus unstable resonators have been limited R(r) = cos0 2 20 + sin 2 20 cos 2 0(r),to relatively high-gain laser media, such as CO2 (Ref. 8)and Nd:YAG. 9 which explicitly shows that the reflectance is given by
We propose an elegant yet simple optical device, the a constant factor depending on 0 modulated by a termradial birefringent element (RBE), as a method of varying as cos 2 0(r) with amplitude sin2 20. ForO = 450,realizing a Gaussian reflectance profile. We show that we find that R(r) = cos 2 0(r), orthe RBE can be used in both stable and unstable reso- [2rnI r2)]nators to realize the advantages predicted by theory. In R(r) - cos 2 - 10 ±-. (3)particular, the RBE, in conjunction with an unstableresonator, provides a smooth spatial-mode profile and If we want to set R(r) = 0 at a specific radius re, de-arbitrary output coupling and yet maintains the sta- termined, for example, by an aperture or rod radiusbility associated with large-magnification unstable within the resonator, then Eq. (3) can be inverted toresonators. give
The RBE is shown schematically in Fig. I as the end 1 Xreflector of a resonator. The element consists of a bi- = rAn IcOs- 1[R(0)]112 + murt,refringent crystal with a radius of curvature polished ro2An2iron Zne surface situated between a polarizer and an end p = - cos-t[R(ro)]t/2 - cos-1[R(0)]1/21-1.mirror. The reflectance at the center of the element isdetermined by the net phase retardation 00 = (4)2,r %n10/X, where An is the birefringence, 10 is the where m is an integer.physical thickness, and X is the wavelength. Since thephase retardation 0(r) is a function of radial position,the reflectance also varies radially. If we assume thatthe reflected beam retraces the optical path of the for- o-,.€ l*A CL(M,
ward beam at the element, an analysis of the mirror,polarizer, and RBE combination using Jones's matrixapproach' shows that the reflectance and transmit-tance of the device are given by
R - cos2 0(r) + sin 2 0(r)cos 2 20, (Ia) OUTPU
T - sin 2 o(r)sin 2 20, (Ib) Fig. 1. The radial birefringent element consisting of a pIo-larizer and a birefringent plate with curvature p, within an
wher 1 is the angle between the polarizer and the unstable resonator cavity.
0146-9592/80/I 10491.0:.$0.r)/O0 * 1980. Optical Soiety of America
-14-
492 OPTICS LETERS / Vnl. 5. No. 11 / Novmbcr 1980
-D-tures p. This variation of the RRE was used in the'254. resonator studies described next.
b. 0.0o8, ,0",1, We have constructed both stable and unstable reso-
* .nators using the RBE for a Nd:YAG gain medium. The'." resonators with the geometric magnification larger than
2 demonstrated that large TEMN mode spot sizes couldbe supported, as expected from previous theoretical
,. analysis. 1 3.4 However, when the mode size is bigenough to extract high energy from the rod, the dif-fraction loss that is due to the rod causes the stabilityof such a resonator to be marginal.
The RBE in combination with an unstable resonatoroffers the advantages of good alignment stability, ex-cellent output spatial-mode profile, and good discrim-ination against higher-order modes. The RBE wasconstructed by combining a convex and a concavecrystal quartz lens with equal p = 25-cm curvatures.
*o o. IThe mirror curvatures of the RBE resonator were cho-R,,,s 04,,NCE ,.,,., sen to form an unstable resonator with the thermal fo-
tal- cusing of the rod taken into account. Best collimationFig. 2. Reflectance profiles of the RBE using two crys at the output was achieved with the combination of aquartz elements. Two elements have equal but oppositecurvature p. 01 and 02 are the angles between the principal -400-cm-curvature mirror and a -200-cm-curvatureaxis of the quartz elements and the polarizer axis. The mode mirror. The resonator length was 65 cm. In this res-radius ro is chosen equal to the radius of the Nd:YAG rod. onator, the output coupling was changed by rotating the
RBE. The optimum performance was found when 01= 45* and 62 = 1000, although the angles were relatively
It is convenient to define the equivalent Gaussian uncritical with A0 1 = :L50 and A0 2 = +10 ° .spot size of the RBE w,., as We chose to compare the RBE resonator performance
S 2 cosf'[R(O)/eJ/ 2 _ cos-[R(0)j" 2 against the standard 60-cm-long, M = 3.3 Nd:YAGWm 2 = ro 2 cos_fiR(t)ill 2 - cs- 1[R(0)/2, (5) confocal unstable resonator.9 Figure 3 shows thecosfR(ro)1/2 - cos'1 [R(0)J1/ 2 transverse-mode quality of the RBE unstable resonator
where e is the Neper number. Note that for R(0) = 1 and the confocal unstable resonator with a 1.8-mm-and R(ro) = 0, W. 2 = 0.58 wo, and that, unlike for a diameter polka-dot-coated output coupler. The videoGaussian reflector, we can arrange R(ro) > R (0). Thus scans clearly show the flat-top profile of the RBE res-the RBE is a pseudo-Gaussian mirror with reflee- onator compared with strongly Fresnel-modulatedtance unstable.resonator output.7 The RBE, with its
V/--e - r21,,), cos2 O(r) reflectance profile, effectively eliminates
Equation (5) can be used with previous analyses ofresonators' with Gaussian reflectance elements as theeffective spot size of the Gaussian reflector.
Finally, for ABCD resonator analysis of the cavityshown in Fig. 1, the radius of curvature of the equivalent
mirror is given by
R__ f +1-1, 'llil IlR, = 1 +(6)
where f is the focal length of the birefringent plate with RBE UNSTABLE RESONATOR-- curvature p and R,, is the end mirror's radius of cur-
vature. This is a good approximation when the elementis a distance from the end mirror that is small comparedwith the mirror's curvature or the element's focallength.
We have also designed, constructed, and analyzed"other variations of the RBE. Of interest for resonatorstudies is a two-element RBE consisting of a positive- CONFOCAL UNSTABLE RESONATORcurvature element next to a negative-curvature element.By varying the angles 01 and 02, which are the angles Fig. 3. Transverse-mode profiles of the RBE and standardbetween the polarizer and the principal axis of the bi- confocal unstable resonator configurations. The Polaroidrefringent elements, various reflectance profiles can be exposures of the output are at the right side and the vidicon-generated. Figures 2 shows some reflectance profiles scanned profiles are at the left side. The slightly asymmetricfor various 02 and fixed 01. Here both elements have patterns are due to a damage spot on one end of the Nd:YAGequal refractive indices and equal but opposite curve- rod.
- 15 -
November 1980 / Vol. 5. No. II / Olyl'I(S I.EIi'RS 493
We wish to acknowledge the support provided by the
RIC UNSTABE 0soNAIOP- U.S. Air Force Office of Scientific Research undergrant# AFOSR-80-0144 and the support provided one of usby the NATO Fellowship Program.
20 *Visiting scholar from the University of Rome,
Italy.t Present address, System & Research Center, Hon-
95, eywell, Minneapolis, Minnesota.-€oroc*. USTASL RISOAlToR
- 'ReferencesL~ , IL _ L I IL L _LI
200 40 Lo o ,oo ,2o 1. L. W. Casperson. "Mode stability of lasers and periodicINPUT PUMP ENERGY ,.JPULSE optical systems," IEEE J. Quantum Electron. QE-IO,
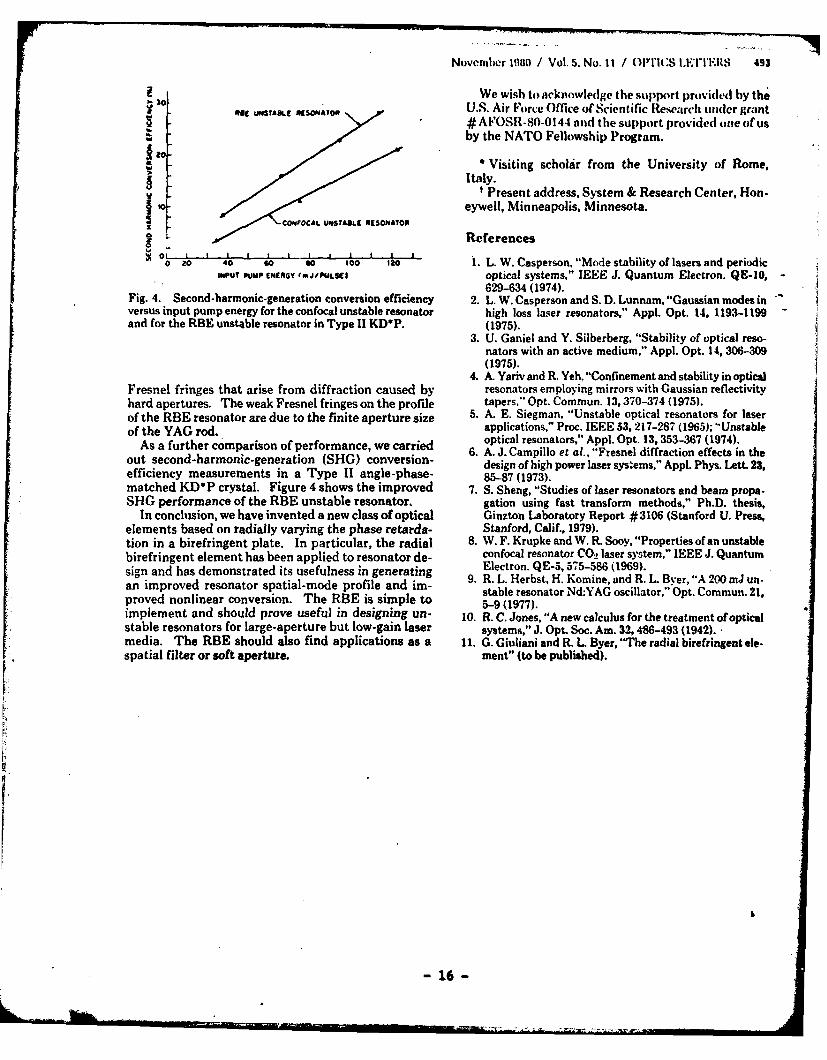
629-634 (1974).Fig. 4. Second-harmonic-generation conversion efficiency 2. L. W. Casperson and S. D. Lunnam, "Gaussian modes inversus input pump energy for the confocal unstable resonator high loss laser resonators," AppL. Opt. 14, 1193-1199 -and for the RBE unstable resonator in Type I1 KD° P. (1975).
3. U. Ganiel and Y. Silberberg, "Stability of optical reso-nators with an active medium," Appl. Opt. 14, 306-309(1975).
4. A. Yariv and R. Yeh. "Confinement and stability in opticalFresnel fringes that arise from diffraction caused by resonators employing mirrors with Gaussian reflectivityhard apertures. The weak Fresnel fringes on the profile tapers," Opt. Commun. 13,370-374 (1975).of the RBE resonator are due to the finite aperture size 5. A. E. Siegman, "Unstable optical resonators for laserof the YAG rod, applications," Proc. IEEE 53, 217-287 (1965); "Unstable
optical resonators," Appl. Opt. 13, 353-367 (1974).As a further comparison of performance, we carried 6. A. J. Campillo et al., "Fresnel diffraction effects in theout second-harmonic-generation (SHG) conversion- design of high power laser systems," Appl. Phys. Lett. 23,efficiency measurements in a Type II angle-phase- 85-87 (1973).matched KD*P crystal. Figure 4 shows the improved 7. S. Sheng, "Studies of laser resonators and beam prope-SHG performance of the RBE unstable resonator. gation using fast transform methods," Ph.D. thesis,
In conclusion, we have invented a new class of optical Ginzton Laboratory Report #3106 (Stanford U. Press,elements based on radially varying the phase retarda- Stanford, Calif., 1979).tion in a birefringent plate. In particular, the radial 8. W. F. Krupke and W. R. Sooy, "Properties of an unstablebirefringent element has been applied to resonator de- confocal resonator CO2 laser system," IEEE J. Quantumsign and has demonstrated its usefulness in generating Electron. QE-5, 575-586 (1969).an improved resonator spatial-mode profile and ir- 9. R. L. Herbst, H. Komine, and R. L. Byer, "A 200 mJ un-anmproved onneaonveorsptin. mThe roEise s im stable resonator Nd:YAG oscillator," Opt. Comnun. 21,proved nonlinear conversion. The RBE is simple to 5-9 (1977).implement and should prove useful in designing un- 10. R. C. Jones, "A new calculus for the treatment of opticalstable resonators for large-aperture but low-gain laser systems," J. Opt. Soc. Am. 32, 486-493 (1942). •media. The RBE should also find applications as a 11. G. Giuliani and R. L. Byer, "The radial birefringent ele-spatial filter or soft aperture. ment" (to be published).
16
- 16 -
APPENDIX A
Edward L. Ginzton Laboratories of PhysicsStanford UniversityStanford, Ca 94305
REMOTE ATMOSPHERIC MEASUREMENTS IN THE NEAR INFRAREDUSING§ A RELIABLE GPO-SOURCE
11. Endemann, R.L.ByerApplied Physics Departement
Stanford University
October 2, 1980
-17-
REMOTE AT1OSPIIER!C MEASUREMENTS It THE NEAR INFRAREDUSING A RELIABLE OPO-SOURCE
M.Endemann, R.L.Byer
Applied Physics DepartementStanford University
ABSTRACT
A reliable single ended remote monitoring LIDAR operating in the infrared is
described. The system uses a 1.4 to 4.0 pm tunable OPO source as transmitter. Con-
tinuous remote monitoring of atmospheric methane over a 17 hour period demonstrates
the reliability of the system. Simultaneous remote measurements of temperature and
humidity using absorption lines of the 1.9 lrm water band achieve relative accuracies
of 1.00 C and 1 X respectively over a 45 sec. averaging period. The expected sensitiv-
ity for the measurement of other pollutants with absorption lines within the tuning
range of the transmitter is discussed.
1. INTRODUCTION path absorption a narrow bandwidth laserbeam is transmitted through the atmos-
The need for single ended air pollution phere to a distant topographic target.monitoring systems is now well estab- Some portion p of this beam is scattered
lished and the methodology of making back by the non cooperative target, andremote measurements is understood'. The is collected by a telescope at the
monitoring of industrial pollution and transmitter end. The received energythe measurement of trace constituents S(v) is determined by using conservation
are efficiently done using a single- of energy leading to the LIDAR-equationended remote probing technique. Fur- R
thermore, remote probing is evolving -2f(csca(r)+N(r)o(v))dr
into an important research tool for S(v)=Eo(v)OA/Rlp*e 0studying transport, mixing and chemistry [1]of trace constituents in the atmosphere. whereRecent experiments have also shown the Eo=transmitted light-energy of fre-
potential for simultaneous remote humid- quency v
Ity and temperature measurements for t):efficiency of optical system
metereology. A=area of receiving'telescope
R=distance to backscattering targetIn their review article Kildal and Byer2 p(R)=backscattering due to target atfound that remote measurements using distance R
absorption promised the highest sensi- a5 0e=attenuation coefficient due totivity and lowest required powerlevels. atmospheric scattering-losses
In a later paper, Byer and Garbuny 3 ana- N(r)=numberdensity of species to be
lyzed remote measurement methods includ- 'probeding single ended absorption with topo- 9(v)=absorption cross section of
graphic targets and depthresolved species at wavelength vabsorption using Mie scattering as adistributed retroreflector. For long
- 18 -
in the near infrared, topographic tar- tunable from 1.4 to 4.0 Im. Initialgets scatter I to 10 2 of the incident measurements of SOz1" and also CH%1 3
light back toward the receiving tele- with this system have been reported by
scope. The average concentration of a Baumgartner and Byer. Improvements inpollutant along the lightpath the design of the OPO transmitter whichN=NH(r)dr/R is measured by transmitting increased the reliability and spectraltwo pulses with different frequencies v. resolution considerably were describedIf the frequency change is small, only by Brosnan and Dyer1 4. increased outputthe absorption cross section of the pol- energy up to 70 mJ per pulse at 10 Hzlutant changes, so that the concentra- was achieved with an Optical Parametriction N derived from (1) is Amplifier (OPA) discussed by Baumgartner
and Byerl s . Extensive software devel-ln{S(yl)/S(v2 )) opement has enabled automatic pollution
N= measurements to be made over timescales2R{ (vz)-a( 1 )} of many hours as demonstrated by recent
121 CH4 measurements 16 .
where the absorption cross sectionsu(vi) have been previously determined.Fixed frequency lasers have only a few 11. SYSTEM DESCRIPTIONcoincidences with absorption lines ofinterest4 so that for most applications The Stanford LIDAR transmitter is ana tunable laser is preferred, angle phasematched, singly resonant
LitbO 3 Optical Parametric OscillatorFrom 1974 on many remote monitoring sys- (OPO). For the methane measurements thetems have been developed and tested OPO was amplified by an Optical Parame-using tunable dye laserss/6 . Initially tric Amplifier (OPA). OPO and OPA arethe reliability of many of these systems described in detail by Brosnan and
was marginal, but recently a number of Byer" and Baumgartner and Byerl s
systems with excellent reliability usingcommercially available Hd:Yag pumped dye Fig.1 shows a diagram of the transmit-
lasers have been reported" 8 . A series ter. The Q-switched unstable resonatorof field measurements have demonstrated Nd:Yag laser generates 220 mJ energy per
the usefulness of remote pollution pulse with a 10 Hz repetition rate. ThedetectionO. However, dye laser measure- length of the resonator is 1.40 m to
ments in the visible and ultra-violet generate 18 nsec long Q-switched pulses.
region is limited to the measurement of This pulselength is ideal to pump the
only three pollutants: SOz, NOz, and 03. OPO, since the optical intensity of thepumpbeam is low enough to avoid damage
To extend the LIDAR measurements to of the LilbO 3 crystal due to self focus-other atmospheric constituents, the ing, but the oscillition threshold of
infrared spectral region must be used. the OPO still is low due to decreasing
Line tunable COz, recently doubled COz build-up losses'?.and UF lasers have been used9 / 1°/ 1 1, but
are limited to spectral coincidences The output of the 11d:Yag laser iswith absorption lines of pollutant mole- slightly demagniiied to a 5 mm diameter
cules. To achieve wider pollutant beam and directed into a folded 15 mselection and better measurement sensi- long path. This distance is adequate,tivity, we have developed a continuously to transform the unstable resonator 1.06
tunable high power infrared source which tm beam into the far field Airy-diskis used as transmitter for a single m4de with 60. of the beam energy in the
ended remote measurement system. The central lobe. Oscillation threshold of
transmitter is an Optical Parametric the OPO is considerably decreased with
Oscillator (OPO), which is continuously
- 19 -
this pump beam compared to pumping with range. Due to the absorption losses of
the near field unstable mode. The dan- the idler wave in the LiNb0 3 crystal,ger of surface damage to the LiNb03 the threshold increases near the end ofcrystal is also removed. The pointing the tuning range and the output energy
stability of the long-cavity Hd:Yag decreases. The energy of the idler out-
laser and the far field converter is put is equal to the energy in the signal
critical for the reliabitlity of the wave multiplied by the ratio of the pho-
system. We used fused silica rods to ton energies.
stabilize the 14d:Yag resonator struc-
ture, and mounted the steering mirrors Astigmatic beam divergence was observed
for the folded 15 m path length far in the OPO output beams when the grat-
field converter directly onto the laser ing-prism beam expander is used for
resonator structure. This arrangement lineuidth control. With the etalon the
gives excellent pointing stablilty of output beam has a symmetrical divergence
the beam. and can be collimated.
For operation of the OPA 40X of the 130 The OPA consists of a Nd:Yag pumped 50mm
mJ of 1.06 gm energy is split off into a x 20 mm angle phasematched Li~bO 3 crys-
Nd:Yag amplifier, while the mainpart is tal. It increases the output energy
directed through a 2.2X demagnifying from the OPO to more than 12 mJ in the
telescope to pump the OPO. The OPO uses signal wave. However, for the tempera-
a 50 mm long, 20 mm diameter Li~bO 3 ture and humidity measurements only the
crystal to generate the signal and idler OPO was used. This simplified the set
output. The signal wave tunes from 2.1 up, and yet provided enough energy to
to 1.4 pIm, while the idler wave tunes see a strong backscattering signal from
from 2.1 to 4.0 pm for a 40 change in topographic targets. Table I summarizes
the Li11b0 3 phase matching angle. The the transmitter parameters for the dif-
tuning range is limited by absorption of ferent measurements.the idler wave in the LiMbO 3 crystal at
4 pm. The OPO uses an L-shaped resona- About 1X of the tunable light energy is
tor which reflects only the signal wave. used for diagnostic purposes. The lack
The resonator uses a flat outputcoupler of wavelength resettability of the OPO
with 50% reflectivity between 1.4 and in early experiments led to the intro-2.1 pm, and a 600 gr/mm grating. In duction of a photo-acoustic cell to mon-
order to improve the resolution of the itor the proper tuning of the OPO by
grating, a 10:1 ZnSe prism beam observing the absorption cross section
expander'' is inserted into the cavity, during an extended measurement.
With grating and prism beam expander the Improvements of the tuning mechanism
linewiIth at half intensity points is made continuous monitoring of the cross
less than 0.8 cm-1 for the signal wave. section superfluous and later the cell
To improve the resolution further, a was used only for spec-troscopic measure-
tilted etalon can be inserted into the ments. An InSb detector is used as ref-
cavity. For a 2 mm thick etalon the erence detector to ratio out energysignal output linewidth is less than 0.1 fluctuations of the OPO/OPA. An absorp-
cm'1 ; The linewidth of the idler output tion cell follows to determine theis about equal to the sum of the widths absorption cross section of a pollutantof signal and pump beam. The Nd:Yag at a given wavelength.
laser has a linewidth of 0.4 cm-1, but
can easily be reduced to 0.01 cm " 1 by The main portion of the beam is expanded
inserting a tilted etalon. in a 10:1 telescope to about 2.5 cm
diameter and transmitted coaxially from
Output energy of the OPO is 5 mJ in the the receiving telescope on the roof of
signal wave over most of the tuning our laboratory. This receiving tele-
20j•" - 20 -
scope is a 40 cm diameter, f=3 Newtonian 1.55 km. The scan covers a 450 cm"!
design. It collects and focuses the range from 2850 to 3300 cm" 1, whichbackscattered light onto a liquid nitro- includes numerous absorption linesgen cooled InSb detector. mainly due to water vapor and methane,
although many other trace constituentsFig.2 shows a diagram of the electron- have absorption lines in this region.ics. The amplified signal and reference To confirm the accuracy of our scan andpulses are integrated and digitized for to identify lines we use the AFCRL datathe computer, which ratios and averages base'$ . The upper trace in fig.3 showsthe signals. The signal from the photo- a simulated transmission spectrum usingacoustic cell is amplified in a Lock-in the AFCRL data. For this simulation weamplifier, which is tuned to the reso- assumed 6 torr Iz0 and 3 ppm CH% in thenance frequency of the cell and syn- atmosphere. The linewidth was assumedchronized from the trigger signal of the to be 1.5 cm-1 However, the program thatlaser. calculates the transmission from the
AFCRL data uses a rectangular slit func-Wavelength selection of the OPO is con- tion, which is not a very good approxi-trolled by a PDP-I1/IO minicomputer. mation of the OPO lineshape, and resultsCrystal and grating are set according to in discrepancies between the calculatedvalues in a table, while the position of and the observed spectrum. But the gen-the etalon is calculated from a set of oral agreement of both traces in fig.3parameters. An: interactive program was confirms the usefulness of the OPO-developed to simplify operation of the source for spectroscopic applications.OPO LIDAR, and to make automatic meas-urements possible. Besides service rou- It is considerable more complex to con-tines for calibration and alignment of trol continuous scans with the etalonthe OPO, the program enables automatic inserted into the OPO cavity. Gratingscans of the OPO, increasing or decreas- and etalon position have to be synchron-ing the wavelength in predetermined ized to within 0.1 cm "1. This requiressteps. In another mode the program excellent stability of the tuning mecha-tunes the OPO between two or three pre- nism. Furthermore, if a scan over moredetermined wavelengths, averages the than one free spectral range of thereceived signals from each wavelenth and etalon is required, the etalon has to bealso calculates the rms-variation of reset to its zero position during thethis average for later error analysis, scan. The length of a scan is deter-It then calculates the concentration of mined by the accuracy with which thea pollutant using eqn.(2). This value etalon free spectral range and the tun-is displayed in real time as well as ing rate of the grating are known. Westored for later use. This control rou- developed extensive software to measuretine proved to be essential for the semi-automatically the etalon parametersmeasurements reported in later sections and so enable scans Aver many etalonof this paper. free spectral ranges. We demonstrated
scans over more than 10 free spectralWithout the etalon in the cavity, the ranges, which in the case of a 2 mmOPO can be scanned under computer con- thick fused silica etalon is about 20trol continuously from 1.4 to 4.0 Im, a cm 1. For our applications, this scanrange of more than 4500 cm-t . Fig.3 range is more than adequate. rig.4 dem-shows an example of the scan capabili- onstrates the scanning capabilities andties of the OPO. In the lower trace it the linewidth of our OPO source with andshows an atmospheric transmission spec- without intracavity etalon. It showstrum from 31 May 1979. We used a build- the spectrum of the Q-branch of the 2v3ing 775 m away as backscattering target, overtone transition in CII,, at low pros-so the total atmospheric pathlength is sures obtained in a photo acoustic cell
- 21 -
Isee also the high resolution spectrum interference-free absorption bands and'obtained by Bobin''l. The resolution of to verify-the location of spectral linesthe OPO with and without the etalon by scanning the spectrum is a majorinserted is apparent. The etalon nar- advantage of the tunable source.roved the OPO linewidth to 0.08 cm-1 .
We selected the P(1O) transition for ourThe reliability of the Nd:Yag OPO trans- measurements because it has the propermitter has been demonstrated by more absorption strength for CH4 measurementsthan a year of operation without damage over the selected 775 m long path. Forto the pumplaser or the OPO. Since the measurements over shorter paths, theLIDAR consists only of solid state com- P(7) line with a much larger cross sec-ponents, no periodic maintenance is tion can be used. The computer was pro-required. grammed to tune on and off the P(1O)
line every 20 pulses or 2 seconds. Thedata were normalized and processed toshow the concentration of methane. An
111. ME7HANE MEASUREMENTS effective cross section for the CH%P(1O) line was used based on the resolu-
Ne selected the measurement of methane tion of the OPO/OPA source. To correctconcentration to demonstrate the relia- for any long-term drift, the cross sec-bility of our system. The atmospheric tion was measured continuously during amethane concentration is recorded at the run by the photo acoustic cell. TheBay Area Air Quality Management District measured value of the cross sect'ion waspoint monitoring station in Redwood City used to calculate the methane concentra-10 km from our laboratory. This allows tion in real time.the possibility of comparing the accu-racy of our system with an independent Fig.6 shows a segment of a 17 h CH4station. measurement run. Here, the raw measure-
ments are shown for 20 shots/line aver-Fig.5 shows two transmission spectra aging or 4 sec per point. The rms fluc-near the CH% absorption region at 3.4 tuations are calculated to be 0.6 ppm.pm. Both spectra were obtained with the To improve the precision of the measure-idler output of the OPO/OPA. The linew- ment, longer averaging times can beidth of *the output was 1.4 cm-t . The used. The heavy line in Fig.6 shows theupper trace shows the atmospheric trans- same data after later averaging tomission betueen our system and a build- increase the relative accuracy to 0.09ing at 775 m distance, which was used as ppm. The time resolution is 80 sec. pernon cooperative backscattering target. point in this case.Both C11% and H20 absorption lines arepresent. To clearly identify the CH% Fig.7 shows the full 17 hour long meas-lines and to aid in selecting a trans- urement during which the system wasition that is free of water vapor inter- operating automatically under computerference, an absorption spectrum of C11% control. During the measurements con-was measured in the laboratory. A sec- cern developed that the mesasured CH%tion of the scan centered on the levels were high since the global aver-P-branch is also shown in the lower age CH% level is close to 1.5 ppm.trace in rlg.5. The two scans in this Hourly CH% average measurements werefigure can be overlaid to show that the obtained from the Redwood City Day AreaP(2), P(7), P(9) and P(IO) methane Air Quality Mianagoment District pointtransitions are nearly water vapor free. monitoring station 10 km from our lidarAdditional confirmation is also obtained at Stanford. The concentration measure-from the spectroscopic information in ments from this point monitoring stationthe AFCRL data"$. The ability to select are indicated by open circles in Fig.7.
-22
The agreement between the concentration, analyzed methods of making remote temp-values from both measurements is as good erature measurements, and preliminaryas it can be expected considering the remote temperature measurements havephysical seperation between Stanford been reported using Raman LIDAR Z ° and aLdar system and the Redwood City moni- two frequency absorption measurement z .
toring station. Remote temperature measurements usingatmospheric transmittance measurements
To check further on the correlation of three wavelengths have been analyzedbetween the Stanford and the Redwood by Mason2 2 , Schwemmer and Wilkerson"3 .City station measurements, a second The temperature dependence of theextended CH% measurement was made on absorption cross section is given by theJune 6, 1979. Fig.8 shows the results. Boltzmann distribution and a partitionin this case, the mind was bloting down function Q(T) asthe bay from Redwood City toward Stan-
ford. The mind velocity and distance oavi,T)= a(vi,To)Q(T)exp[(E'i/k)(I/To-l/T)}gave a 20- to 30- min delay time from 131Redwood City to Stanford. This delaycorrelates with the peak CH% mesurement for an arbitrary reference temperatureat 2200 at Redwood City and at Stanford To, where Ei is the lower state energyat 2230. Later in the evening when the of the transition at frequency vi, and kmind ceased, Stanford measurements is the Boltzmann constant.became independent of the Redwood Citystation measurements. Measuring the absorbance
A(vi,T) =N a(vi,T)RI
These measurements demonstrate the reli- for two lines of one species with dif-ability and accuracy of remote air pol- ferent lower state energy E0 j we can uselution measurements. Other pollutants eqn.(3) to determine the temperature Twith absorption lines within the tuning asrange of the OPO source can be measuredwith the same relative accuracy. The Tomeasurement of other species is dis- T=cussed in section V. kTo A(01 ,T) g(v1,T)
1- {ln( )-In(
E0 -E02 A(v2,T) v(v 2 ,T 0 )
141IV. TEMPERATURE MEASUREMENT
This expression simplifies for T-To ((Toror accurate pollutant measurements it tois important to determine the tempera-ture of the pollutant, since the absorp- kTo2 A0v1 ,T)tion cross section is temperature T= *In( )+Ddependent. This effect is usually neg- E0 -E'Z A(v2 ,T)lected for the measurement of pollutants 1at atmospheric temperatures. However withfor emissions from sources at elevatedtemperatures the temperature correction kTo 2 (v2,To)can become very important. By properly D=*(In( - ))+Toselecting appropriate lines of a molecu- Ee -Ej a(vj,To)lar species it is possible to makeremote temperature and concentration The constant D can be found either usingmeasurements of the species simultane- spectroscopic data, or it can be deter-ously. mined empirically with calibrated temp-
erature measurements. Once theA number of groups have proposed and
- 23 -
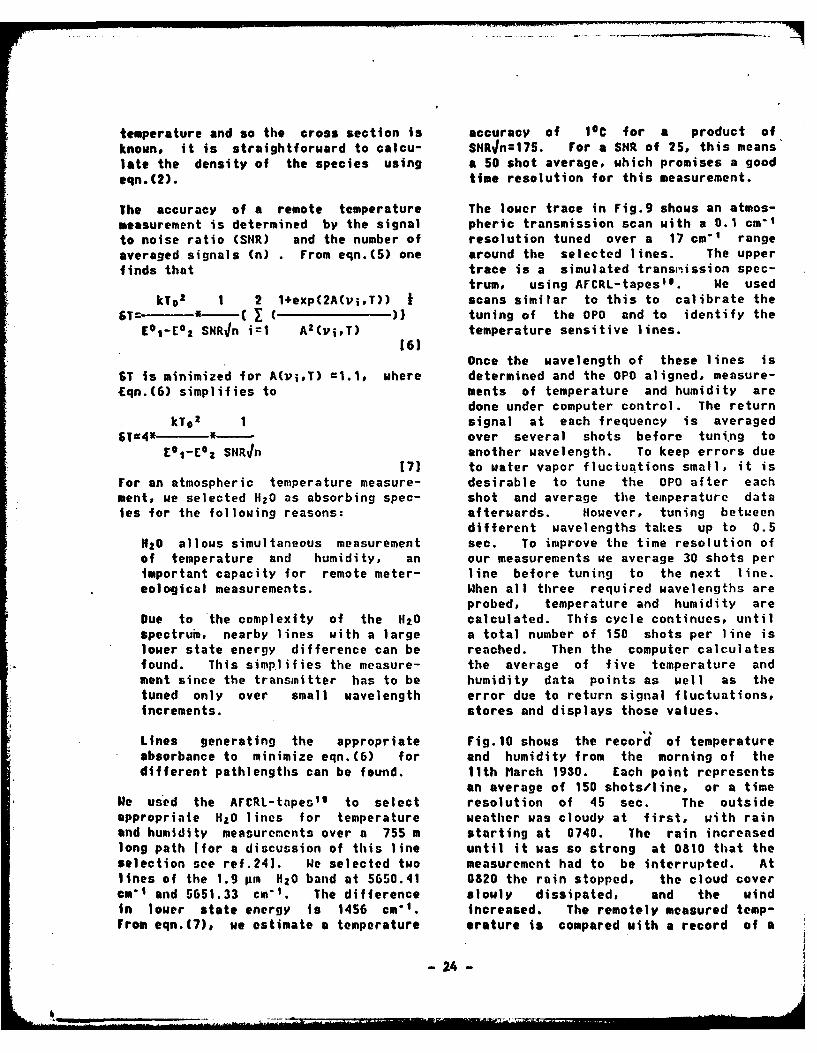
temperature and so the cross section is accuracy of 16C for a product ofknown, it is straightforward to calcu- SNRn=175. For a SNR of 25, this meanslate the density of the species using a 50 shot average, which promises a good
eqn.(2). time resolution for this measurement.
The accuracy of a remote temperature The lower trace in Fig.9 shows an atmos-measurement is determined by the signal pheric transmission scan with a 0.1 cm-1
to noise ratio (SHR) and the number of resolution tuned over a 17 cm" rangeaveraged signals (n) . From eqn.(5) one around the selected lines. The upperfinds that trace is a simulated transm'ission spec-
trum, using AFCRL-tapesIS. We usedkTo 2 1 2 l+exp(2A(vi,T)) I scans similar to this to calibrate the
GT= C ( ) tuning of the OPO and to identify theCI-E02 SNRJn i=l Az(viT) temperature sensitive lines.
161Once the wavelength of these lines is
ST is minimized for A(viT) =1.1, where determined and the OPO aligned, measure-Eqn.(6) simplifies to ments of temperature and humidity are
done under computer control. The returnkTo 2 I signal at each frequency is averaged
6T4 4 over several shots before tuning toECI-E 0
2 SNR~n another wavelength. To keep errors due171 to water vapor fluctuations small, it is
For an atmospheric temperature measure- desirable to tune the OPO after eachment, we selected H20 as absorbing spec- shot and average the temperature dataies for the following reasons: afterwards. However, tuning between
different wavelengths takes up to 0.5H20 allows simultaneous measurement sec. To improve the time resolution ofof temperature and humidity, an our measurements we average 30 shots perimportant capacity for remote meter- line before tuning to the next line.eological measurements. When all three required wavelengths are
probed, temperature and humidity areDue to the complexity of the 1zO calculated. This cycle continues, untilspectrum, nearby lines with a large a total number of 150 shots per line islower state energy difference can be reached. Then the computer calculatesfound. This simplifies the measure- the average of five temperature andment since the transmitter has to be humidity data points as well as thetuned only over small wavelength error due to return signal fluctuations,increments. stores and displays those values.
Lines generating the appropriate Fig.10 shows the record of temperatureabsorbance to minimize eqn.(6) for and humidity from the morning of thedifferent pathlengths can be found. Ilth March 1930. Each point represents
an average of 150 shots/line, or a timeie used the AFCRL-tapes l" to select resolution of 45 sec. The outsideappropriate H20 lines for temperature weather was cloudy at first, with rainand humidity measurements over a 755 m starting at 0740. The rain increasedlong path Ifor a discussion of this line until it was so strong at 0810 that theselection see ref.241. We selected two measurement had to be interrupted. Atlines of the 1.9 pm HzO band at 5650.41 0820 the rain stopped, the cloud coverem" and 5651.33 cm"1. The difference slowly dissipated, and the wind
in lower state energy is 1456 cm" . increased. The remotely measured temp-
From eqn.(7), we estimate a temperature erature is compared with a record of a
-24-
thermograph at the telescope. The Y. MEASIJREMENT OF OTHER ATMOSPHERICgeneral agreement is good. Some discre- TRACE CONSTITUENTSpancies of the two measurements areexpected since the remote measurement In this section we discuss the possibil-averages over a path from 10 to 60 m ity of measuring other trace constitu-above the ground and 775 m length, while ents in the atmosphere with the OPOthe thermograph is located on the roof LIDAR. Most pollutants have absorptionof a building. The rms-deviation for bands in the 1.4 to 4.0 1im tuning rangeeach temperature measurement is calcu- of the OPO. However, some of the lineslated from the return signal fluctua- are too weak to measure atmospheric con-tions. It varies with the metereologi- centrations, while others lie in regionstal conditions: in the early morning, of strong water vapor absorption, whichthe SNR was measured to be 25. The var- makes measurements over long pathsiance of the temperature measurements impossible.then is 1.10C, which is only slightlyworse than the estimate in eqn.(7). The To estimate the sensitivity of a meas-SNR decreases later due to the rain, and urement of a certain species it isaccordingly the rms-deviations increase assumed that a 1X change in transmissionto 1.60C. After the rain stopped, the can be measured. For the reported meas-SNR improved again to about 25. How- urements this is true for averagesever, the temperature uncertainety stays between 150 laser pulses per line forat 1.50C The reason for this increased the H20 measurements, to 2000 pul.ses pererror can be found in the stronger line for the CH% measurements, whichhumidity fluctuations due to the wind. means averaging times between 30 and 400Any variation in absolute humidity dur- sec. The variation of the averaginglng the 10 sec. measurement cycle for time is due to the variation of the out-each temperature point increases the put energy and pulse to pulse stabliltyuncertainety of this measurement. of the OPO over its tuning range, butShorter measurement cycles will improve also due to water vapor continuumthe accuracy of the measurement, absorption around 3.4 umne.
The calibration of our temperature data We discuss measuremeitt capabilities ofis done by minimizing the difference the major pollutants as identified bybetween the remote temperature data and Wright et al. in ref.25.. Spectroscopicthe thermograph data. We have collected information uas obtained from differentmore than 10 hours of temperature data, sources, the AFCRL data base" being theand have determined a value for the con- most important one since it contains thestant D as 350C, which is 190C less than major atmospheric constituents and ispredicted from the available spectro- ideally suited to check for interfer-scopic data. ences of different species. An overview
over the measurement capabilities isHe have demonstrated the feasibility to summarized in table 2.measure temperature and humidity simul-taneously. The 1.9gm H20 band makes HIO: The influence of water vapor ontemperature measurements with 1.0°C atmospheric processes and measurementsaccuracy possible. For the present is so important, that it must be-dis-measurements of atmospheric tvinperature cussed first. The measurement of humid-the selected lines are optimal. Iow- ity is easily possible in the infrared,ever, for temperature measurements at as was demonstrated in section IV. Aelevated temperatures such as encoun- large number of lines exists, whichtered in stack exhausts a different makes it possible to select one with theselection of lines has to be made. ideal cross section for a specific meas-
urement. The two water vapor absorptionbands of importance for measurements
- 25 -
with the OPO transmitter are the 1.9 iim mately 0.4 [atm cm "l I uhich leads toand 2.7 jIm bands. These bands absorb so a measurement sensitivity of 0.3 ppmkm.strongly, that measurements over long The measurement of atmospheric back-paths in the regions from 1.8 to 2.0 tim ground concentrations of CO in unpol-and 2.4 to 3.2 um are not possible. The luted atmospheres difficult, but thesurrounding regions contain lines of observation of pollution and measure-ideal strengths for atmospheric humidity ments of source emissions are possible.measurements. The large number of watervapor lines leads to interference prob- SOz: Sulfur dioxide is the major pollu-lems in the measurements of many other tant in sulfurous smog. It has beenpollutants. Thus it is necessary to recognized as a health hazard, and themeasure the absolute humidity first in Clean Air Act requires annual averageorder to correct absorption measurements SOZ concentrations of less than 0.03on pollutant lines influenced by nearby ppm, although over a 3 hour period theHzO lines, average may be as high as 0.50 ppm. We
have demonstrated the possiblity toCOZ: On a global scale, carbondioxide is measure sulfur dioxide with the OPOimportant to monitor due to its effect LIOAR earlier'z . The v1+v3 combinationon the thermal balance of the band around 2499 cm" 1 has linestrengthsatmosphere2 6. On a local scale, COz can of 0.4 [atm cm|-l 29, which makes meas-he used as a tracer for emissions from urements of concentrations of 0.25 ppmkmcombustion processes, and to measure the possible. However, this measurement hastemperature of these emissions. The to be made near the end of the tuningatmospheric background of CO2 is 330 ppm range of the LitlbO 3 . OPO, where thein an unpolluted atmosphere, and ranges energy output is low and pulse energyup to 350 ppm in polluted regions. For fluctuations are increased. Thus aremote measurements with the OPO trans- large number of laser pulses have tomitter, the vi+2vz+v 3 -combination band averaged to achieve the desired sensi-at 4983 cm-1 is ideal. Using the AFCRL tivity. However, measurements of sourcedata base'$ and our own atmospheric emissions and monitoring of SOz pollutedtransmission spectra we determined that atmospheres is possible.the P(8), P(lO) and P(36) lines areinterference free from water vapor 03: Ozone is a major constituent in pho-absorption. These lines are well suited tochemical smog. There is a naturalto measure atmospheric background as ozone background of 0.01 ppm, but itsvell as source emissions of CO2 . Using concentration reaches 0.3 ppm in photo-the 570 cm* 1 lower level energy differ- chemical smog2 s . Within the tuningence of the P(8) and the P(36) lines, range of the OPO, the strongest absorp-temperature of sources can be determined tion band is the 3v3 band at 3050 cm-1with a 50C accuracy. The strongest lines are about 0.3 [atm
cm[-' 10, which leads to a sensitivityC0: Carbon monoxide is known to be a of 0.3 ppmkm. This value is not ade-health hazard in high concentrations. quate to measure atmospheric ozone withThe Clean Air Act sets the CO exposure the OPO LIDAR.limit to an average value of less than35 ppm over one hour or 9 ppm over 24 NOx: Nitrogen oxides are important inhours. Remote monitoring simplifies the photochemical smog. Their primarytask of measuring ambient concentrations anthropogenic source is combustion. Inand emissions. Measurements of CO with polluted urban regions the concentrationthe OPO is possible at the overtone band of NO, may be 0.1 ppm, or even higher inat 4260 cm-1 27. Many lines without exceptional circumstances. The measure-water vapor interference can be found. ment of NO is not possible with the OPOThe absorption cross section is approxi- LIDAR, since only a weak overtone trans-
- 26 -
iton exists at 4746 cm'1. But NOZ has the spectrum in ref.29 we determinerelatively strong lines in the vi+v3 cross sections of 10 tatm cml', whichband at 2910 cm- t. From spectra in allows sensitivities of 0.01 ppmkm.ref.29, the strongest line has a Since several lines can be selected,strength of 3.2 [atm cmi|" , which allous interference from Mater vapor and hydro-measurements with a 0.03 ppmkm sensitiv- carbons can be minimized. Measurementsity. Measurements of sources as well as of HCl are possible with the oPO LIDAR.monitoring of polluted regions is possi-ble. However, Potential interference Hydrocarbons: Hydrocarbons are importantfrom water and hydrocarbon lines makes in photochemical processes. Only meth-careful line selection necessary to min- ane has a large background in unpollutedimize interference with those species. atmospheres, all other hydrocarbons
arise mainly from anthropogenicH2 O: Another nitrogen compound in the sources2S . The major sources are com-atmosphere is Nitrous Oxide. There is bustion and chemical processes. Allan atmospheric N20 concentration of 0.29 hydrocarbons have a very strong v3ppm, which is mainly caused by biologi- vibration band, but interferences withcal action in soil. It is inert in the water vapor lines as well as othertroposhpere but of interest due to its hydrocarbons cause problems for theinteraction with ozone in the measurements of some of them. Methanestratosphere3". The absorption band at has a background concentration in an2545 cm" 1 is strong enough, to promise a unpolluted atmosphere of 1.5 ppm. Wesensitivity of 0.05 ppmkm, and interfer- have discussed the measurement of CH4ence free lines can be found". This with the OPO LIDAR in section 3 and dem-allows measurements of atmospheric back- onstrated the sensitivity in such aground concentrations of nitrous oxide. measurement.
The other hydrocarbon components play aNH3: Another pollutant of importance is more important role in photochemicalAmmonia. Its strongest absorption bands smog than methane. However, due to thewithin the tuning range of the OPO are difficulties to measure them independ-around 3400 cm 1 31. However, we have ently, little is known about reactionsnot found spectra of adequate accuracy of specific components in the atmos-to determine, if absorption measurements phere. With the OPO LIDAR a large num-are possible using lines located in the ber of hydrocarbons can be measured withstrong surrounding water vapor absorp- good sensitivity. However, water vapor,tion region. methane and other components all have to
be measured simultaneously due to inter-HCHO: Formaldehyde also is a component ference of lines. Using high resolutionof photochemical smog. Its atmospheric spectra obtained with the EPA ROSEconcentration varies between 1 and 50 System 32 , we identified measurement pos-ppb 2s . The cross sections of lines sibilities for Ethane, Propane and Ethy-around 2800 cm-t from ref.29 promise a lene.sensitivity of 0.01 ppmkm, which makes Ethane can be measured at 2976.8 cm1I,long path measurements suitable to moni- where it has an absorption line with ator formaldehyde concentrations in smog strength of 13 [atm cml -1. This line isconditions. overlapped by a water vapor line, but
transmission on this wavelength is ade-HCls The natural background of Hydrogen quate for the use of long paths. Thiscloride is negligibly small, but anthro- line promises a sensitivity of 8 ppbkm,pogenic sources can release HCI in large if errors due to the measurement of HzOquantities that lead to concentrations concentration can be neglected.of I to 5 ppm 25. IlCl has very strong Propane has a very strong line atabsorption lines around 2900 cm" 1. From 2967.6 cm" 1, the absorption cross sec-
- 27 -
tion was determined as 83 latm cml'. taneously average temperature and
NomeverHzO, CH%, and other hydrocarbons humidity over the 775 m long path. we
have absorption lines close to this way- selected for this measurement two nearby
elength, and their interference reduces lines in the 1.9 pim water band, which
the sensitivity. But a 10 ppbkm sensi- have a 1456 cm "! lower level energy dif-
tivity still can be expected. ference and so promise a good
Ethylene has a relatively strong line temperature sensitivity, and are of sim-at 2980 cm-1, but this line is com- ilar strength. Using those lines, wepletely obscured by a strong water vapor measured temperature with a 10C relativeline. Measurement is possible at 2962.5 error, while humidity data have a rela-
cm" , but linestrength here is only 1.7 tive error of 1%.[atm cml " |, which does not promise themeasurement of traces in the atmosphere. In addition to the described measure-Other hydrocarbon components have to be ments, a large number of other trace
evaluated in detail. constituents can be measured. We usedavailable spectroscopic data to identifythe sensitivity for measurements of themost important trace constituents in the
VI. CONCLUSIONS troposphere. We found, that backgroundconcentrationes of some pollutants can
Re demonstated the capabilities of a be measured. Source emission monitoringLiHbO3 OPO as a LIDAR transmitter. The is feasable for most important, pollu-OPO has a tuning range of 4500 cm "1 from tants with the 0PO LIDAR.1.4 to 4.0 ttm. The linewidth is lessthan I cm-1, and can be reduced to 0.1 The transmitter source can be improved.cm-0 by insertion of a tilted etalon. An. increase of output energy to moreNavelength selection of the OPO is done thhn .70 mJ is possible. With thisunder computer control. An extensive amount of transmitted energy, depthre-software routine was developed to con- solved measurements using Mie scatteringtrol automatic measurements. as distributed reflector are possible.
This will have advantages for sourceReliability of the system was demon- monitoring applications. For the meas-strated in a series of remote methane urement of ambient background concentra-measurements at 3.4 Im over a 775 m long tions, however, a monostatic system likeatmospheric path, using a building as the one described here promises thenon cooperative backscattering target. highest sensitivity.The longest of these measurements wasover a period of 18 hours, during whichthe system operated automatically undercomputer control. Our concentration ACKNOWLEDGEMVEITSmeasurements were compared with those ofa nearby point monitoring station. The le want to acknowledge helpful discus-agreement was excellent. sions with E.R.Murray of SRI Interna-
tional and N.F.Herget of E.P.A. We wantThe advantages of a continuously tunable also acknoledge the loan of the receiv-infra red transmitter were further dem- ing telescope by EPRI and support foronstrated with a measurement of metereo- this program by ARO under the contractlogical importance. We measured simul- #DAAG29-77-G-0181.
- 28 -
RErERE#CE-S
III C.D.Hlnkley ed.: "Remote Probing of the Atmosphere" Springer Ver-
log, Berlin 1976
121 N.Kildal, R.L.Byer: "Comparison of Laser Methods for Remote Detec-
tion of Atmospheric Pollutants",Proc.IEEE 59,p. 1633-1644, 1971
13) R.L.Byer,M.Garbuny: "Pollutant Detection by Absorption Using MieScattering and Topographic Targets as Retroreflectors" AppliedOptics 12, p.1496-1505, 1973
[41 R.L.Byer, E.R.Murray: "Remote Monitoring Techniques" in "Handbookof Airpollution Analysis", ed.R.Perry and R.Young, Chapman Hall,London, 1977
151 K.14.Rothe, U.Brinkmann, H.tjalther: "Applications of Tunable DyeLasers to Air Pollution Detection: Measurement of Atmospheric N02Concentrations by Differential Absorption", Appl.Phys.3, p.115-119,1974
161 l.B.Grant, R.D.Hake Jr., E.M.Liston, R.C.Robbins, E.K.Proctor Jr.:"'Calibrated Remote Measurement of H02 Using the DifferentialAbsorption Backscatter Technique", Appl.Phys.Lett.24, p.550-552,1974
17) IK.Frederikson,B.Gaile, N.Hystrom, S.Svanberg: "A Mobile LIOAR Sys-tem for Measurements of 1402, SO2z, 03, and particles" IX ILRC.Munich, 1979
18) J.G.Hauley, L.D.Fletcher, G.r.Wallace, M.Herron: "A Mobile Differ-ential Absorption Lidar (DIAL) for Range Resolved Measurements ofS0Z, 03, and HO02", X. ILRC, Univ. of Maryland, 1980
191 14.Bautner, K.W.Rothe, H.Walter: "Range Resolved Measurements ofAtmospheric Pollutants", IX ILRC, Munich, 1979
1101 D.K.Killinger, N.Meynuk, W~.E.Oereo: "Remote Sensing of CO UsingFrequency-Doubled C02 Laser Radiation", To be published inAppl .Phys.Lett.
1111 J.Altniann,1.Lamanni,C.Weitkamp: "Remote Measurement of AtmosphericW20 with a DF Laser Lidar", Applied Optics, to be published
1121 R.A.Baumgartner, R.L.Byer: "Remote S02 Measurements at 4 t±m with aContinuously Tunable Source", Optics Letters 2. p.163-165, 1978
[131 R.A.Daunigartner, R.L.Byer:, "Continuosly tunable IR LIDAR withApplications to Remote Measurements of S02 and CI%"pApplied Optics17, P.3555--3561, 1978
1141 S.J.Drosnn R.L.Byer: "Optical Parametric oscillator Thresholdand Linewidth Studies", IEEE Journ. Quant. Electr. 4E-15,p.405-4.31, 1979
-29-
115) R.A. Baumgartner, R.L.Byer: "Optical Parametric Amplifiers"# IEEEJourn. Quaint. Electr. QE-iS, P. 432-444, 1979
1161 11.Endemann, R.L.Byer: "Remote Probing of Atmospheric Methane overLong Timescales Using a Widely Tunable Source"# Post Deadline PaperIX ILRC, Munich, 1979
1171 G.K.Klauminzer: "Newa High Performance Short Cavity Dye LaserDesign", Post Deadline Paper at CLEA, Washington D.C., 1977
1181 R.A.McClatchey, W.S.Benedict, S.A.Burch, R.F.Calfee, K.Fox,L.S.Rothman, J.S.Garing: "1AFCRL Atmospheric Absorption Line Parame-ter Compilation", AFCRL Report-TR-73-0096, 1973
1191 B.Bobin: "Interpretation de la Sande Harmonique 2v3 du Methane12CH%. (De 5890 a 6107 cm'1)", Journ.du Phys. 33. p 345-352, 1972
1201 A.Cohen, J.S.Cooney, K.H.Gelleo: "Atmospheric Temperature Profilesfrom LIDAR Measurements of Rotational Raman and Elastic Scatter-ing", Applied Optics 15, p.2896-2901,1979 see also, R.Gill,K.Geller, J.Farinas J.Cooney, A.Cohen, Journ. of Appl.Met. 18,p.225, 1979
1211 E.R.Murray, D.D.Pouell, J.E.van der Laan: "Measurement of AverageAtmpspheric Temperature Using C02 Laser Raciarf",Applied Optics 18,June 1980
[221 J.B.Mason: "LIDAR Measurement of Temperature: A New Approach",Applied Optics 14, p.76-78, 1975
1231 G.K.Schwemmer, T.D.Wilkerson: "LIDAR Temperature Profiling: Per-formance Simulations of Mason's Method", Applied Optics 18,p.3539-3541, 1979
1241 f.Endemann, R.L.Byer: "Remote Single-Ended Measurements of Atmos-pheric Temperature and Humidity at 1.9 gim Using a Continuously Tun-able Source", to be published in Optics Letters, Oct.1930
125) M.L.Wright, E.K.Proctor, L.S.Gasiorek, E.M.Liston: "fA PreliminaryStudyof Air Pollution Measurements by Active Remote-Sensing Tech-niques", NASA CR-132 724, 1975
1261 r.rloeller: "On the influence of Changes in the C02 Concnetration inAir on the Radiation Balance of the Earth's Surface and on the Cli-mate", J.Geophys.Res.68, p.3877, 1963
127) T.Henningson, M.Garbuny, R.L.Byer: "Remote Detection of CO by Par-ametric Tunable Laser", App.Phys.Lett.24, p.242-245, 1974
1281 A.S.Pine, P.r.moulton: "Doppler Limited and Atmospheric Spectra ofthe 4 gIn Vj4V3 Combination Band of SO2".1 Journ. of Molec. Spectra.64, 15-30, 1977
-30-
1291 P.L.Hanst: "Spectroscopic Methods for Air Pollution Measurement",chapter in "Advances in Cnvironrnental Science and Technology,vol.2"1, J.N.Pitts,Jr. and R.L.fletcalf ed., Wiley Interscience, N.Y.
1301 C.L.Ilutchinson, A.R.tlorier: "'Nitrous Oxide Emissions from an Irri-gated Cornfield", Science 205, p.1125-1126, 1979
1311 G.Ilerzberg: "Molecular Spectra and Molecular Structure: 11. Infra-red and Raman Spectra of Polyatomic Molecules", D.van Nostrand Com-pany, Inc., 1943
1321 w.F.Herget, Private Communication
-31-
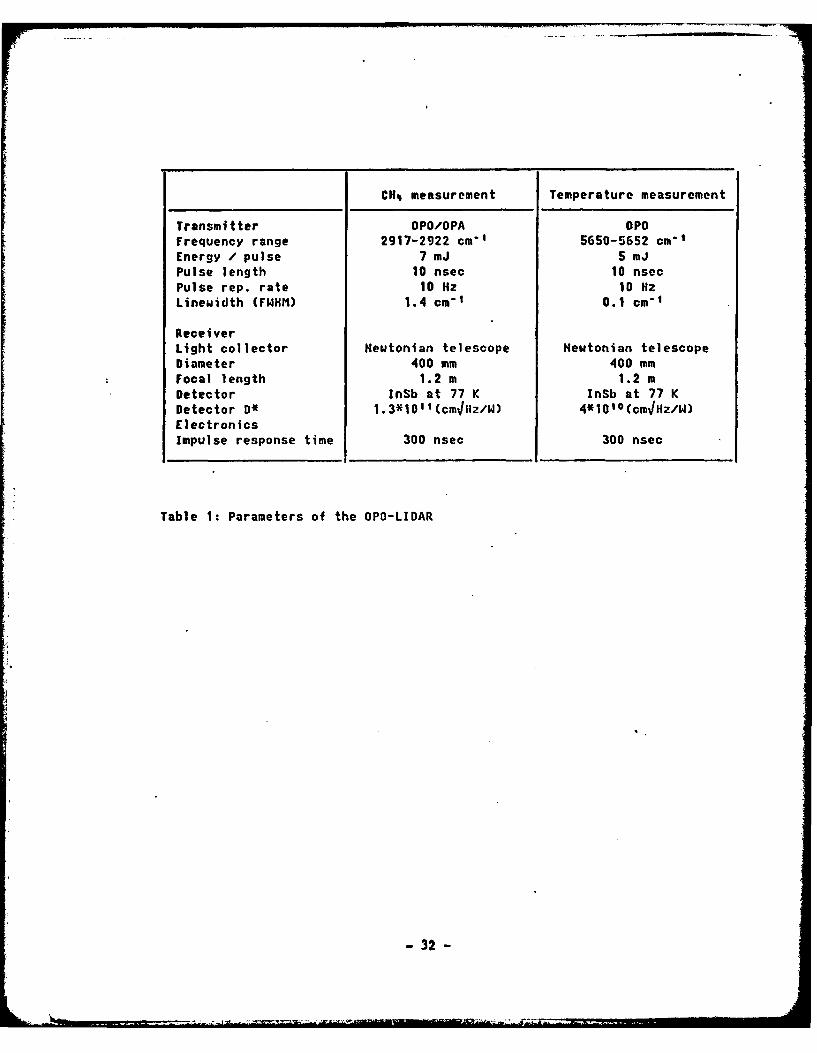
CH% measurement Temperature measurement
Transmitter OPO/OPA OPOfrequency range 2917-2922 cmtI 5650-5652 cm-1
Energy / pulse 7 mJ 5 mPulse length 10 nsec 10 nsecPulse rep. rate 10 Hz 10 NzLinewidth CFWHII) 1.4 cm-t 0.1 cm-1
ReceiverLight collector Newtonian telescope Newtonian telescopeDiameter 400 mm 400 mmFocal length 1.2 m 1.2 mDetector InSb at 77 K InSb at 77 KDetector D* 1.3*1011(cm~iz/W) 4*1010(cm4/HZ/W)Electronicsimpulse response time 300 nsec 300 nseo
Table 1: Parameters of the OPO-LIDAR
-32-
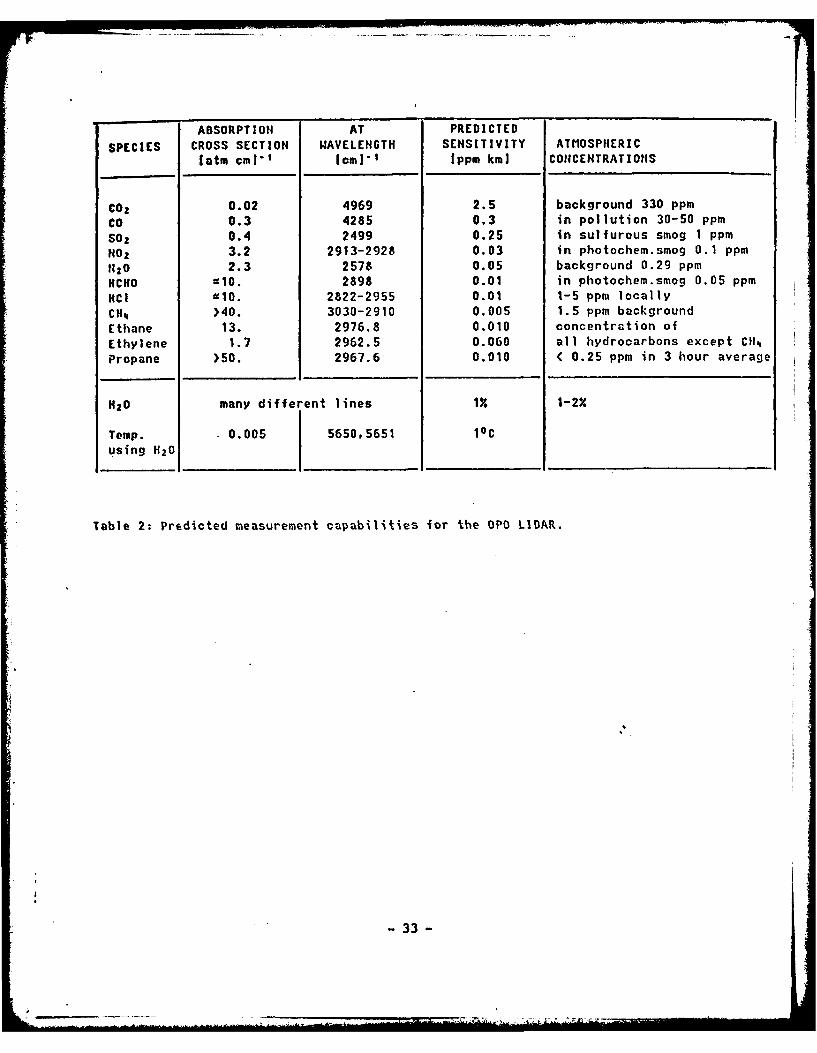
ABSORPTION AT PREDICTED
SPECIES CROSS SECTION WAVELENGTH SENSITIVITY ATMOSPHERIC
latm cmI'' [omi]1 Ippm km) CONCENTRATIONS
COZ 0.02 4969 2.5 background 330 ppm
Co 0.3 4285 0.3 in pollution 30-50 ppm
SOz 0.4 2499 0.25 in sulfurous smog 1 ppm
HO 3.2 2913-2928 0.03 in photochem.smog 0.1 ppm
11O 2.3 2578 0.05 background 0.29 ppm
HCHO CIO. 2898 0.01 in photochem.smog 0.05 ppm
HCI &1O. 2822-2955 0.01 1-5 ppm locally
CH4 >40. 3030-2910 0.005 1.5 ppm background
Ethane 13. 2976.8 0.010 concentration of
Ethylene 1.7 2962.5 0.060 all hydrocarbons except CH14
Propane >50. 2967.6 0.010 ( 0.25 ppm in 3 hour average
H2 0 many different lines 1Y 1-2%
Temp. 0.005 5650,5651 10C
using H20
Table 2: Predicted measurement capabilities for the OPO LIDAR.
- 33 -
FI0URE CAPTIONS
Fig.A Schematic of the 1.4 to 4.0 tum tunable transmitter.
Fig.2 Schematic of the electronics and data processing based onPDP-11/10 minicomputer.
Fig.3 450 cm" ! scan with the OPO LIDAR around 3.0 gm. The lower traceshows the measured transmission, using a building 775 m away asbackscattering target. The upper trace shows a simulation of thesame transmission spectrum using the AFCRL data base. A lineu-ldth of 1.5 cm" 1 was assumed for the simulation. But the rectan-gular lineshape in the simulation does not fit the OPO lineshapevery well.
Fig.4 Photo acoustic spectrum of 2V3 CH% Q branch at 1.66 gm.. The scanis repeated with and without the tilted etalon in the OPO cavity.The linewidth of the OPO in each case is apparent.
Fig.5 Transmission spectrum around 3.4 Itm. Upper trace shows theatmospheric transmission over a 1.55 km long path. The lowertrace is transmission through a 1.2 m long absorption cell filledwith C1l and N.? and is used to identify CH4 lines in the atmos,-pheric spectrum.
Flg.6 One hour segment of remote methane measurement, showing CH con-centration vs. time. Each point represents a 20 shot or 4 secaverage, and has a rms-fluctuation of 0.6 ppm. The heavy lineshows same data after later averaging, reducing rms-erros to 0.09ppm.
Fig.7 CH% concentration vs. time over a 17 hour period. Each point isan average over 80 sec, reducing rms-deviations to 0.09 ppm,uhich is less than the measured CH% fluctuation in theatmos-phere. Open circles indicate measured concentrations in RedwoodCity point monitoring station.
rig.8 CH% concentration vs. time. Stanford LIDAR data are compared tovalues from Redwood City point monitoring station 10 km away.Here a prevailing wind yielded a 30 min delay between the atmos-phere at point monitoring station and its arrival in Stanford.
Fig.9 High resolution atmospheric scan over 1.55 km path. The OPOllnewidth is 0.1 cm" |. The OPO transmission scan (lower trace)is compared to a simulation using AFCRL tapes (upper trace).
rig.1O Temperature and absolute humidity vs. time. Measurement frommorning of 11th march 1980. Temperature data are compared withrecord from thermograph at receiving'telescope.
- 34 -
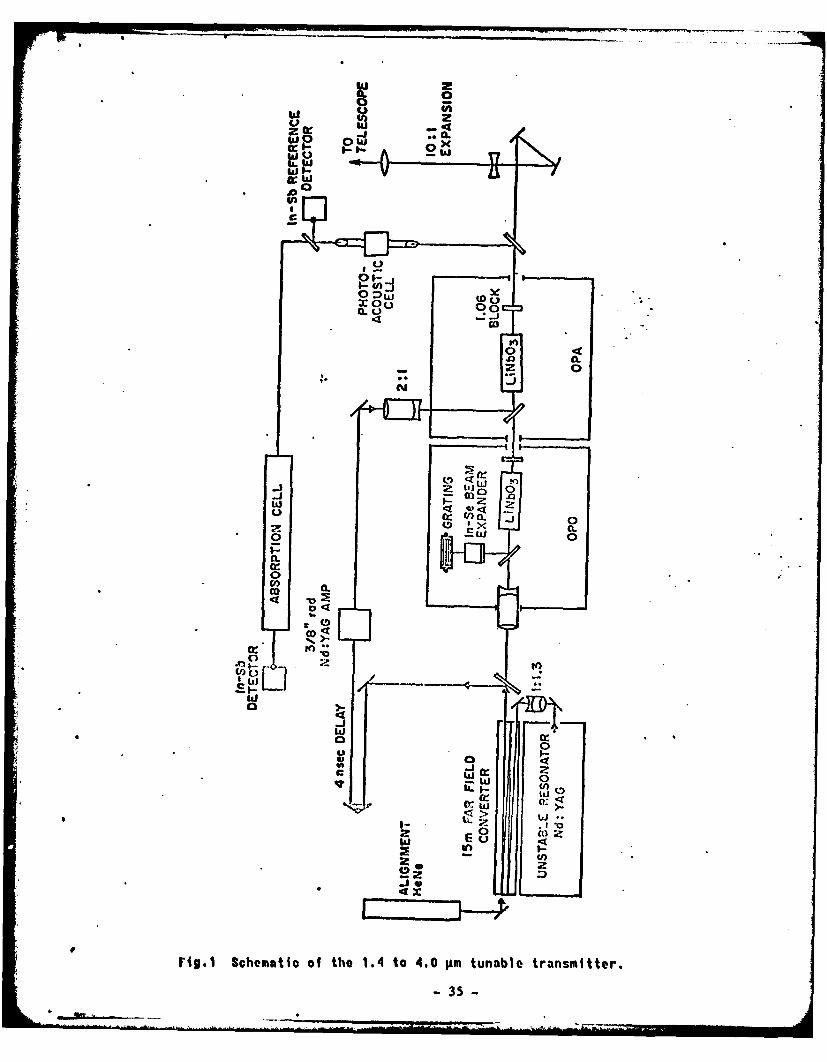
W:O oId.o
0 o
*i COC
II
Ii~ Shmai o he14 o4. m uabetrnWitr0 5
w L
bi 0 0
0.L Cl)
0-0
CLI
w C-,
0j0
0-z
(9C I -I Wz
,,w: U)LLil Nr _
~w-W 1- 0 cc- 0
0:(-
rio.2 Schematic of the electronics and data processing based onPDP-11/10 minicomputer.
ATMOSPHERIC TRANSMISSIONOVER 1.551km LONG PATH
I I I
SIMULATION FOR 6 Torr H2 0
3 ppm CH4
Z"• (o)01.0
ii .i: i i
MEASURED WITH OPO ON*.. 31 MAY 1.979l 0200 HOURS.
z 1.0- (b)S I "31, 197,00 OR
*~~~ J j [ ~J II
2900 3000 3100 3200
c s w FREQUENCY (cm" 1 )Fig. 3. 450 cm-' scan with the OPO LIDAR around 3.0 Uim. The lower trace shows the
measured transmission, using a building 775 m away as backscattering target.The upper trace shows a simulation of the sate transmission spectrum usingthe AFCRL data base. A linewidth of 1.5 cm' was assumed for the simulation.But the rectangular lineshape in the simulation does not fit the OPO lineshapevery well.
- 37 -
-C
o
oD W
L ..
-4-
oo CCE. - vi40D 0 0 T q E 53
A.-
CU) 0
zz
38o -jig"
WAVELENGTH (,.m)3.45 3.40 3.35
-I i 'i
ATMOSPHERIC TRANSMISSIONMAY 25,1979 8:00 PSTPATHLENGTH 1.55 km
z
P13P12
P11 P2
PlO P8P5 P4P8 P7 P6
CH4 ABSORPTION IN LAB
20Otorr L 1.2 M
-I I a I
2880 2900 2920 2940 2960 2980 3000
FREQUENCY (CM - )Fig. 5. Transmission spectrum around 3.1. pm. Upper trace shows the atmospheric
transmission over a 1.55 km long path. The lower trace Is transmissionthrough a 1.2 m long absorption cell filled with CH1. and N2 and Is used toIdentify CH4 lines In the atmospheric spectrum.
P 39 P
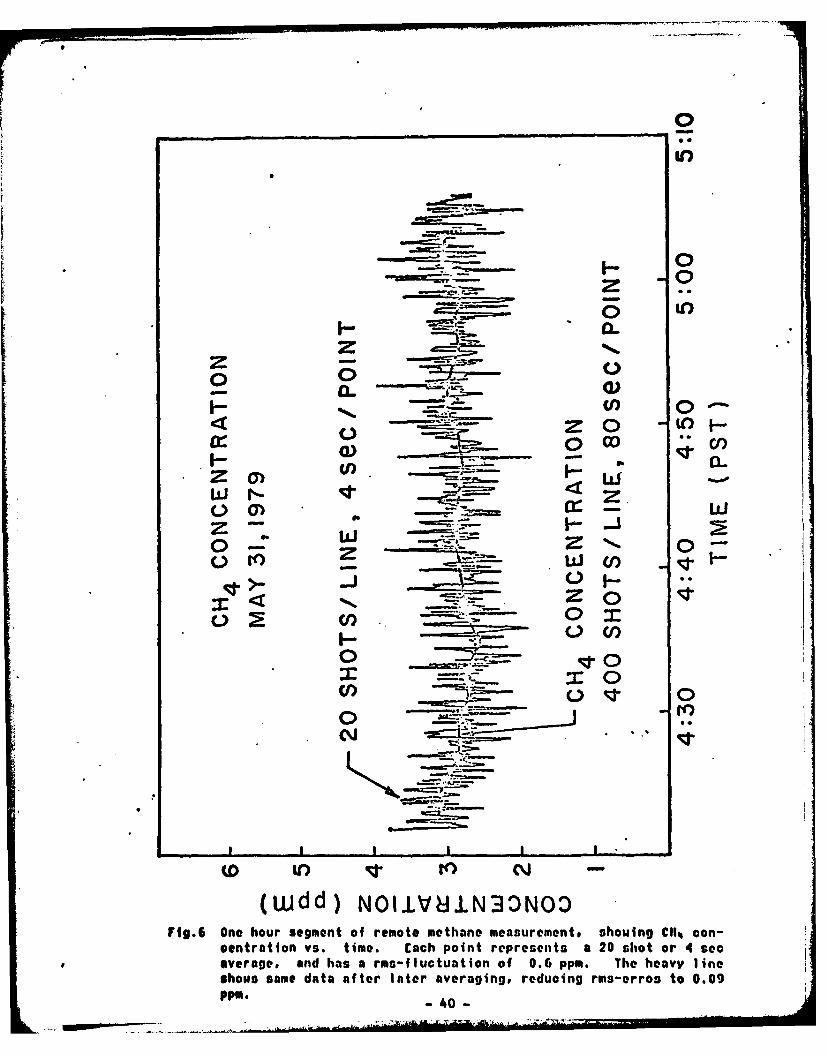
L0 -
_ 0 _
z a)
Ui. 0)C
0- z j0 M z- Wcnf F
CI) 0
0
CM)
oo I~
(Wdd) NOL.LVU±.NJONO3)N93. One hour segment of remote methane measurements showing C11% con-
centration vs. time. Each point represents a 20 shot or 4 secaverage, and has a run-fluctuation of 0.6 ppm. The heavy lineshows came data after later averaging, reducing rms-erros to 0.09PPM. --- 40 - i
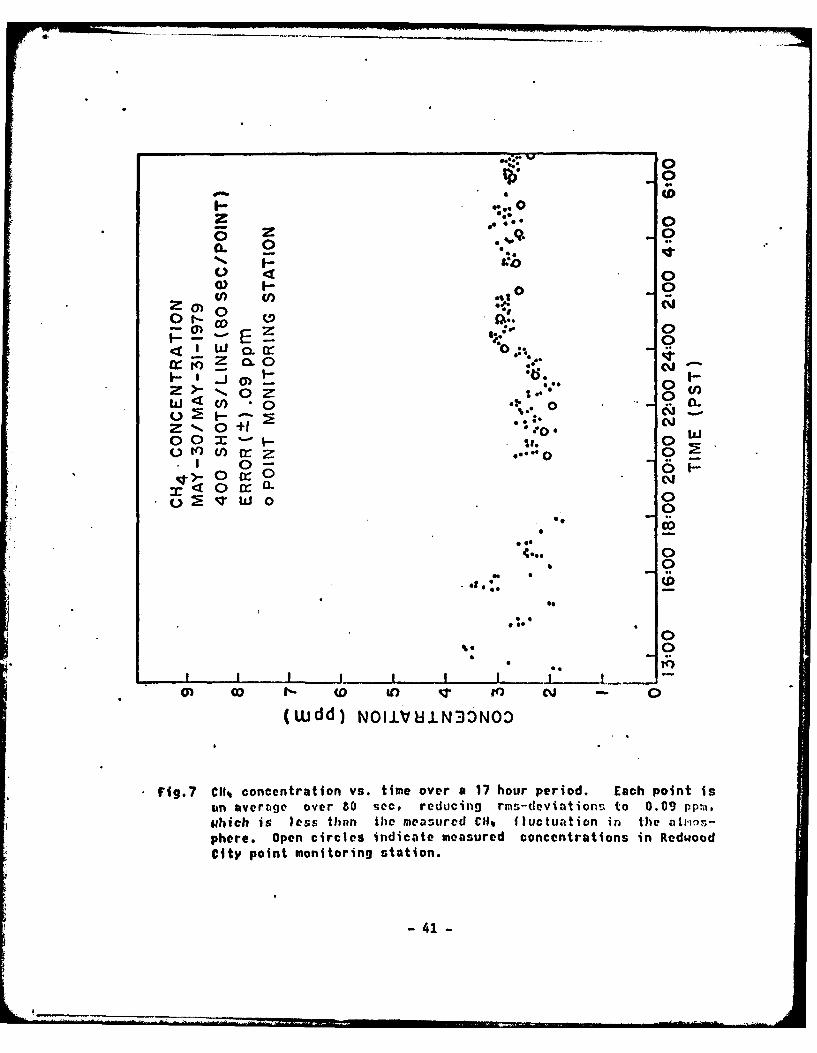
*0
000
Z C)CD 0::
0. 0E z
I ) F- .1)3 0cc CL) 0, N
CD_ o
_j 1-JF- 0* IF-:.-, 0 U)
W U) 0 _0 0 O
O
z 0 +1 *0o0
0~~~ Cr0
3:* 0 C
00
4 O ... 0
.°..
0
M O- f- W to'"t
(Wdd) NOIIVULNIONOD
rig.7 CIf% concentration vs. time over a 17 hour period. Each point issan averge over 80 sec, reducing rms-eviations to 0.09 pplpihich is less than tbe measured CIN fluctuation in the atmos-phere. open circles indicate measured concentrations in RedwoodCity point monitoring station.
-41 -
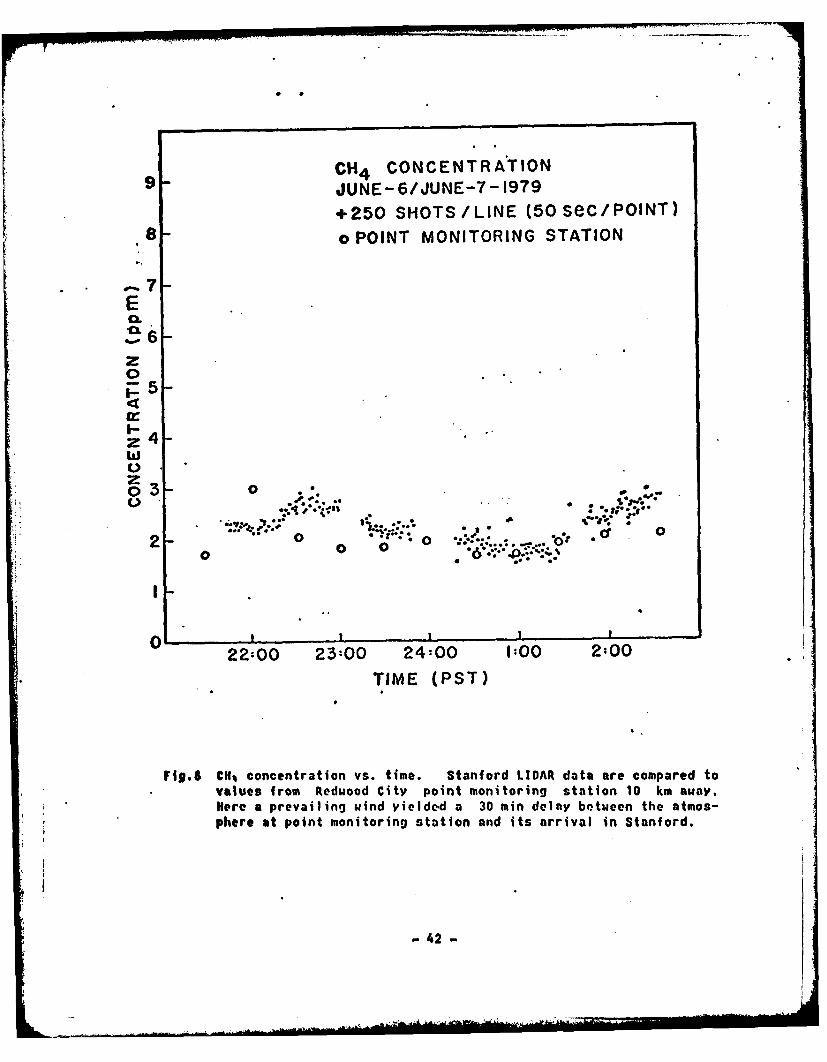
CH 4 CONCENTRATION
JUNE- 6/JUNE-7-1979+250 SHOTS/LINE (50sec/POINT)
8 oPOINT MONITORING STATION
'-7E
z0
z 4 -
20 o 0 C 0
0 0 0 C . *
22:00 23:00 24:00 1:00 2:00TIME (PST)
ri9.8 CH% concentration vs. time. Stanford LIDAR data are compared to
Values from Redwood City point monitoring station 10 km away.
Here a prevailing wind yielded a 30 min delay between the atmos-
phere at point monitoring station and its arrival in Stanford.
- 42 -
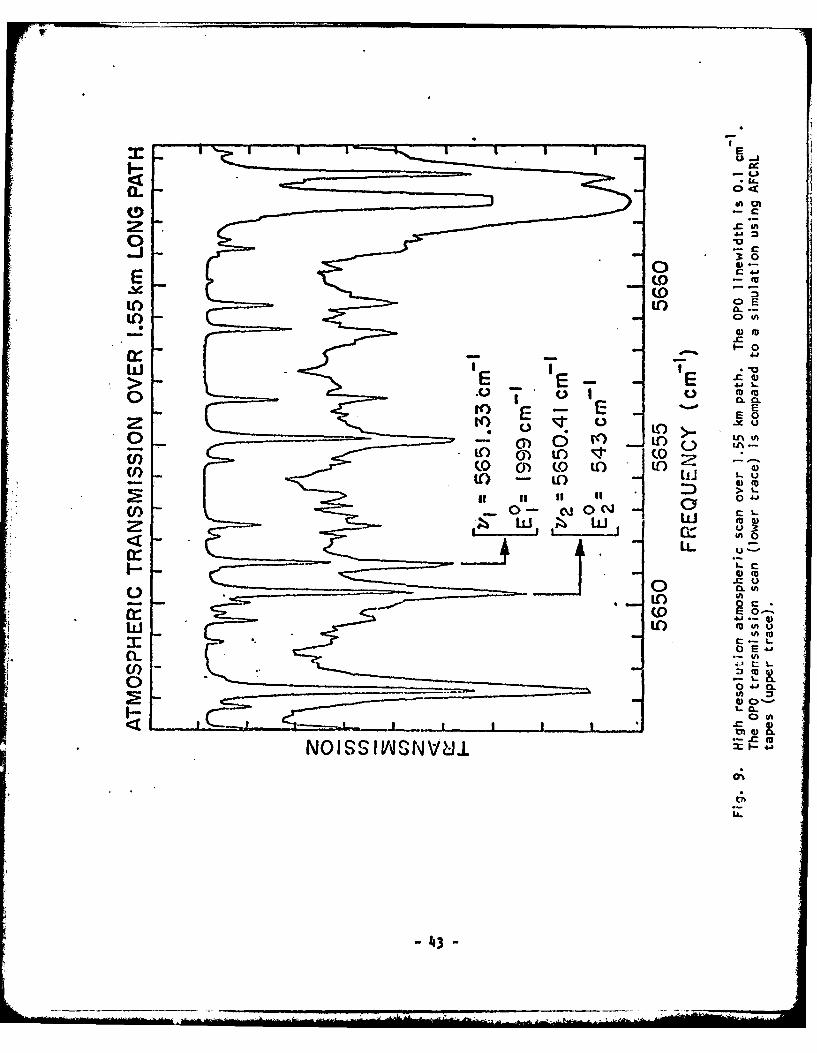
3:
3l0.EE 8
LO o) U- Jt (.0(o 0g) U' L
D > I-Cy E
cc. .0.
08 C
0
zi
0 0 LO.. .43
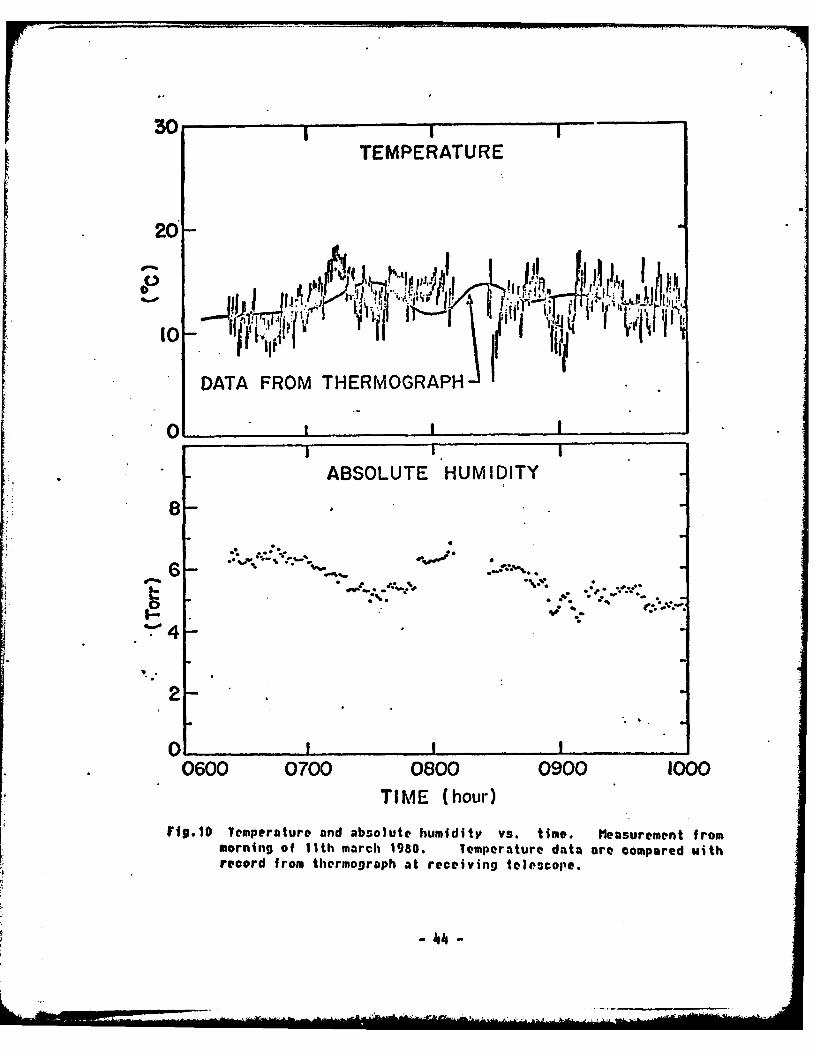
30TEMPERATURE
20
10,o iv1tt f It'H
DATA FROM THERMOGRAPH
0III I
ABSOLUTE HUMIDITY
8
6S. *f .
a.- S-, .
"4-
0 0 I I
0600 0700 0800 0900 1000TIME (hour)
rig.1O Temperature and absolute humidity vs. time. Measurement frommorning of l1th march 1980. Temperature data are compared withrecord from thermograph at receiving telescope.
- 44!
APPENDIX B
GROWTH OF HIGH PHASEMATCHED TEMPERATURE LiNbO3 SINGLE CRYSTALSAND APPLICATION TO EFFICIENT SECOND HARMONIC
GENERATION OF Nd:YAG
Robert L. Byer and Yong Kwan ParkEdward L. Ginzton Laboratory
andRobert S. Feigelson and Wayne L. Kway
Center for Materials ResearchStanford University
Stanford, California 94305
I. INTRODUCTION
Optically induced refractive index damage in LiNbO3 has been1
known for.over ten years. When LiNbO3 crystals are used in non-
linear devices involving second harmonic generation (SHG) refrac-
tive index changes are induced which greatly reduce the conversion
efficiency and, therefore, the usefulness of the material. The
large nonlinearity of LiNbO3 along with its ability to achieve
non-critical phasematched SHG of the Nd:YAG laser wavelength at
1.064 m2 has led to considerable effort to overcome the induced
refractive index damage.
It was experimentally discovered that the optical index damage
in LiNbO3 crystals is annealed at temperatures above approximately170-20°C 1 ,3-5
170 -2000C. Therefore, if LiNbO is grown such that the4 3phasematching temperature is above the annealing temperature the
index of refraction damage is essentially eliminated and efficient
SHG of Nd:YAG is possible.
- 45 -
6 7Fay et.al., and Bergman et.al., reported that the phase-
matching temperagure of LiNbO3 could be increased by increasing
the Li20 concentration in the melt. They showed that the SHG
phasematching temperature for 1.06 Ujm could be increased from
40C for congruently grown crystals with 48.6 mole % L20 to greater
than 180°C for 54 mole % Li20. However, it was also found that
the Li20 concentration and thus SHG phasematching temperature in
the crystal varied along the crystal growth axis for growth5!
conditions away from the congruent melt composition.5 Congruently
grown crystals do not exhibit this variation.8
The cause of optical index damage in LiNbO3 has been extensively
studied not only because it is detrimental for nonlinear optical~9 - 13applications, but also because it can be used as a basis
for volume holographic storage;4 ' l4-1
Chen4 porposed that the index damage was due to a modulation
of the index of refraction via the electro-optic effect. The
electric field was generated by an internal space-charge due to
the drift of photo-excited electrons from the region of high light
intensity to trap sites in the area of low light intensity. Johnston17
later modified Chen's model by proposing that the internal field
in the crystal could be due to the change in spontaneous polar-
ization in the illuminated region as a result of charged latticc
defects and that the divergence of the polarization was the source
of the electric field. The defect in LiNbO3 was identified as Fe2+
-46 -
impurity ions present in nominally pure crystals and the
optical index damage was attributed to the Fe2+ to Fe3+
" 17-20reduction.
This model led to efforts to eliminate iron impurities
in LiNbO3 and thus to eliminate or reduce the magnitude of the
optical index damage. It was found, however, that even very pure
LiNbO3 crystals showed optical damage. In an extension of the
above model, Zverev et.al.,21,22 suggested that the reduction of
niobium in the crystal could account for residual index of
refraction damage for even pure crystals. However, it was
expected that the annealing temperature should be lower due to
the smaller trapping energy of the reduced niobium site compared
to the iron site.
The efforts to reduce or eliminate the index damage effect
while maintaining crystal optical quality included both the
18reduction of the iron impurity concentration and the growth
of thehigh phasematching temperature LiNbO3 (hot phasematching• 23
LiNbO3 ) from special melt. compositions. .Bridenbaugh et.al.,
showed that MgO could be used as a co-dopant along with Li2O to
raise the phasematching temperature and simultaneously to compensate
for excess Li20 segregation. However, it was found that the effect
of MgO appeared to saturate near 1.0 mole %. Another suggested
approach was to grow LiNbO3 at the congruent melting point in order
to maintain crystal hozmogeniety and then to diffuse lithium into24-26
the single crystal to increase the phasematching temperature.
- 47 -
After a careful review of the earlier LiNbO3 crystal
, growth studies, we initiated a program to grow hot phasematched
LiNbO3 crystals with high optical quality for efficient SHG of
the 1.064 p m Nd:YAG wavelength. The program had the following
objectives: i) to grow LiNbO3 with excess Li2O co-doped with MgO
to arrive at a composition that yielded high optical quality
crystals with a phasematching temperature in excess of 1800 C ;
1i) to vary the growth parameters including temperature gradients,
pull rate, and rotation rate to obtain optimum crystal quality;
Iii) to re-examine the optical damage annealing temperature to re-
define the minimum allowable phasematching temperature; iv) to test
crystals to correlate SHG nonlinear conversion efficiency with
growth parameters; and v) to optimize and define an optimum growth
"" process for the production of hot phasematching LiNbO3 crystals
for device applications.
* II. CRYSTAL GROWTH PROCEDURES
Crystal growth was carried out by the standard Czochralski
technique for LiNbO3 utilizing an RF induction furnace. The
furnace set up is shown in Fig. 1. The platinum crucible" used
was either 2" dia. by 2" high or 21" in dia. by 2J" in height.
The charge size ranged between 259 g and 280 g for the former and
510 g to 580 gfor. the latter. The growth parameters which
differed from those for standard LiNbO3 were mainly the pull rate
and the rotation rate.
-48-
4*
For the present testing and immediate device application
the crystal samples were fabricated with cross-sections of 5 mm
square and with lengths of 1 cm minimum oriented with the long
axis perpendicular to the crystal optic axis. This means that
the brystals could be grown in either the a- or the c- direction.
However, the a-axis grown crystal proved to be less desirable
because of larger compositional variations and resultant lower
optical quality. Thus the c-axis was chosen as the standard
growth axis in this investigation.
The selection of temperature gradients, pull rate, and
crystal rotation rates is commonly governed by the melt composition
and growth interface morphology. Since the crystals were grown
from melts containing excess Li20, interlace partitioning and
build-up was expected. To prevent breakdown and constitutional
supercooling, 'both axial and radial temperature were interested
and the growth rates used were decreased. For the present system,
the temperature gradients necessary for stable growth were regulated
by both the RF coil position and an after-heater where the
temperature was set at 8000C, such that the temperature increases
below the melt surface and decreases along the radial direction in
the melt surface. The pull rates used were from 1.6-4.3 mm/hr, which
resulted in growth rates of approximately 1.8 - 5.0 mm/hr. The crystal
rotation rates were varied between 10 and 50 rpm. Since varying
the pull rate and rotation rate modified the interface shape and
thus the temperature gradient and compositional characteristics
-49 -
i-
of the crystal and, therefore, the resultant optical quality,
the rotation and pull rate changes were made together.
Crystal quality evaluation was based on SHG conversion
efficiency tests, phasematching temperature, and optical homogeniety.
These optical tests were correlated with the interface shape which;
In turn was correlated with the pull rate and crystal rotation rate.
The optimum results were obtained on crystals with a planar
interface grown with a pull rate of 1.6 mm/hr and a crystal -
rotation rate of 50 rpm. Under these conditions the SHG vs
temperature phasematching curve showed a clean single peak with
a width of 0.50C, and a conversion efficiency of 35%. The crystal
contained essentially no striations or banding and had an .un-
•" distorted'isogyre pattern indicating few optical inhomogenienties.
The most important aspect in this investigation was determining
the most appropriate melt-composition to yield a high phasematched
temperature, good optical quality and compositionally uniform crystal.
Raising the phasematching temperature was based on the incorporation
of 48.6 mole % Li2 0. Crystals were, therefore, grown from melts
containing L12 O much. in excess of the congruent composition.
Furthermore, MgO was added to the melt so that an excess amount
of Li20 would be incorporated into the crystal.'
- 50 -
As shown by the phase diagram in Fig. 2 and previous work,5
Li2O in excess of the congruent composition is incorporated
in the crystal according to the equilibrium distribution coefficient
kM(EXC. Li20) - 2S(Exc Li20) - 0.3 (1)CL(Exc. Li 2 O)
Of course, the actual incorporation is a function of the growth
parameters involved. The segregation of excess Li2O and melt
composition variation during growth and consequently the phase-
matching'temperature variation along the length of the crystal
is large as governed by the equation for normal freezing,
Cs kCo( - g)ki (2)
where Cs is the concentration of a component in the solid, CO
the concentration in the melt, k the distribution coefficient,
and g the fraction solidified. As mentioned before, the
addition of MgO to the melt, results in an excess amount of Li20
over the congruent composition in the drystal. As pointed out
by Bridonhaugh, an addition of I mole % MgO to the melt results
in the initial LiNbO3 composition containing 0.6 mole % excess Li20
Since the distribution coefficient for MgO in LiNbO3 is 1.3, it
is being rapidly depleted from the melt as the crystal is grown.
- 51 -
Since the excess Li20 is determined by the M concentration,
the contribution for M 0 decreases in its concentration in thegmelt decreases: The Li20 concentration in the crystal, which
is due to excess Li20 added to the melt, increases as growth
proceeds and because of these two compensating effects, a flat
Li20 profile along the crystal length results.
The amount of excess Li20 and MgO to be added to the melt
for the desired phasematching temperature hs based on available7
literature data. From the results of Bergman et.al., and
Fay et.al., the slope of the phasematching temperature vs
excess Li20 was determined. Together with MgO doping experiment,
done at Stanford and those reported by Bridenbaugh,23 '2 8 extra-
polated curves were plotted to estimate the initial melt compositions.
Crystals were grown from Li20-rich melts at different Li20
concentrations with MgO doping ranging from 1.0 to 2.5 mole %.
Early results showed that MgO did not contribute to increasing
the phasematching temperature beyond 1.0 mole %. Consequently
the MgO'doping was kept at 1.0 mole % for all experimental runs
with different Li20 concentrations . The results were generally
predictable with respect to the phasematching temperature vs
concentration and fitted closely the initially extrapolated
curves. The proper Li20 concentration to achieve a phasematching
femperature of 180 0C along with a fixed 1.0 mode % MgO concentration
was determined. The Li20 concentration vs phasematching temperature
Is shown in Fig. 3.
-52-
• S
Aside from the growth problems, poling is difficult in
hot phasematch crystals. As the phasematching temperature
reaches 180 0C or above, the margin of error for poling temperature
is only 200 C. At too low a temperature the crystal will not be
completely poled and if too high the crystal will melt. For
these reasons it is desirable to go tda lower phasematch temperature
where both growth and poling can be carried out with greater ease.
Although no attempt has been made in the reduction or
elimination of the Fe+2 impurity, the re-evaluation of the self-
annealing temperature was carried out because it was-believed that
the LINbO3 crystals grown at Stanford have been handled with great
care to achieve low impurity content. The measurements showed
that the self-annealing temperature wa* indeed at an unexpected
low value of about 1200 C. With this information, crystals were
grown with the new phasematching temperature target of 1200C - 1300C.
The crystals with phasematching at about 1200 C showed all
parameters to be as good as or better than the high phasematch
crystals produced earlier. The growth procedures were thus finalized
for producing crystals with the target phasematching temperature
of 1300C. The following is the summary of procedures for the
routine production and testing of high phasematch LiNbO3 crystals
for high power laser applications.
The starting materials were high purity Li2CO3
Nb205, and MgO. They were weighed out in the proper proportion
to yield'the composition of .505 Li2 0,,..495 Nb205 and 1.0 mole % MgO,
-53-
S.
for a phasematching temperature of 130PC, well mixed,and melted
down In a platinum curcible utilizing a low temperature gradient
furnace. Generally, the reaction and melt down is carried out
in a box type of SiC furnace heated at a rate of approximately
300OC/hr to 1,280 0C and soaked at that temperature for thirty
minutes. At the end of the cycle the furnace was shut down and
the material was allowed to cool in the furnace to room temperature.
This procedure was-repeated until the crucible was filled at 260-
280 for the 2" crucible and 560 - 580 for the 2J'" crucible.
Crystal growth was accomplished in an RP induction heated furnace
with.the platinum curcible as susceptor. The furnace was set up
with the proper size coil and alumina parts for either the 2" dia.
by 2" height or 21" dia. by 2J" height crucible. Together with
an after-heater maintained at 8000C, the coil, crucible, and
furnace parts were positioned and adjusted to produce positive
temperature gradients in the furnace with radial gradient of +5oC
from center to edge at the melt surface. Crystal growth was
commenced with a c-axis seed, allowed to come out to a proper
diameter and proceeded with that diameter until a desired length
was reached. During the growth cycle, the temperature was
controlled at a programmed cooling rate of 5- 70 /hr. for shouldering
and a rate of .2 -10 /hr. for the body of the crystal. At the end
of the growth cycle, the crystal was tapered off by heating rapidly
at lO-20O/hr,pulled into the after-heater, and heated to 1,100oC.
-54-
With the main furnace power (RF) turned off slowly (taking about
: thirty minutes), the crystal was cooled in the covered after-
heater to room. temperature at a rate of lOOO/hr.
The poling was accomplished with a flat temperature profile
tubular SiC furnace. The crystal was prepared for poling by
cutting off the ends and attaching the platinum electrode with
platinum paste. The crystal was placed in the furnace with leads
attached, was heated up to 1,1700C at 2000 /hr, and at that point,
the polingfield was applied.The poling voltage was adjusted for
2 V/cm and the temperature was maintained at l,2000C for a period
of two hours. At the end of this period the temperature was
lowered at a moderate rate from 1,2000C to 1,1000C in fifteen
minutes. At that point the poling field was turned off and the
furnace.temperature was programmed to lower at a rate of 1000 /hr
all the way to room temperature. During the entire poling cycle
oxygen flow was maintained. The flow rate was 3 cfh from room
temperature to 1,1700 C, 2 cfh for poling and 3 cfh from 1,2000 C
to room-temperature. When the crystal was removed from the
furnace after poling, the electrodes were stripped ;and the ends
were re-cut and polished. The Domain structte was checked by
etching the crystal in a 3 : L HNO3 /IIF solution at approximately
700C for thirty minutes. By examing the etched surfaces under a
microscope, the ferro-electric domain pattern was. revealed. If
the crystal still contained multi-domain structure,.the poling
cycle was repeated. In some cases higher voltage or longer poling
- 55 -
time was used. If the crystal was completely poled and showed
a good distortion-free optical isogyre pattern, it was ready
for fabrication and testing. Figure 4 shows photographs of
boules 515 and 528 which were grown and poled by this procedure.
III. CRYSTAL EVALUATION
It was realized at the outset of .this program that progress
in the growth of hot phasematching LiNbO3 crystals would depend
upon rapid testing and evaluation. In addition to optical quality
evaluation, each boule was tested by SHG usihg a cw lamp pumped,
acousto-optically Q-switched Nd:YAG laser. The temperature phase-
matching curve was obtained and the SHO efficiency was measured
when appropriate..
Initially crystals were prepared with phasematching temperatures
at or above the expected annealing temperature range of 180-200oC.
Table 1 summarizes crystal parameters for a set of hot phasematching
crystals initially tested. Among thie crystals in Table I, crystal
#515 shows the expected high phasematching temperature and single
narrow phasematching peak as shown in Fig. 5a. The reasonably good
optical quality of crystal #515 was also-verified by SHG conversion
efficiency results. However, the phasematching temperature of
the crystal increased by 100C from the seed to the bottom end of
the boule.This result was. consistent with an. earlier report6
and implied an inhomogeneous lithium concentration along the
crystal growth axis. 5,6,7
- 56 -
to 14G0 co 0) moI) ~ g
4) 0
C.a 0 _ _ _ _
o6 1*
C.) C4 c0 0' 0 ~ P- 4Jo) 0. - g91igo 0
4J .4.s pob -.
Aa -= -. t-
0 43I014 0I0C q 0'4 40 fmE4 *. U
.3 +* 44) +k 1 - % Mo b- cao 0w 0. 0f tO -r4 v
0- f4-.I p4 0. 6~
E-4 0
S3 it > . .0) 03 4)
o to 0' 0k0.p2 0a.4~ .0
04 -H 1+A 004-) 4 ) 0 4
~02'. 0. 0q 4
C 00
* E 34 C % 0.0
4 4~~0fl31 k ~ i o t , :
4A 0 cod W - 03 030 0 04
=4 C4 144 0
1 4 .0. 4.)oL) -0q
4) 4 C C ; 1 .0 4)
P4414 '4 0 4
41 0 m .0 0
1 4 . 0" 0 0f P-4 0 05
*h :p 3 G14
-57-
* Crystal #528 was an attempt to duplicate crystal #515.
The phasematching temperature tuning curve shown in Fig. 5b
and the SHG conversion efficiency of crystal #528 showed
comparable optical quality with that of crystal #515. However,
the discrepancy in phasematching temperature from crystal #515
indicated that the duplication of hot phasematching LiNbO3
crystals has not been consistently obtained mainly due to the
difficulty involved in growing these crystals from the highly
non-congruent melt.
Another suggested hot phasematching crystal preparation
approach was the growth and indiffusion'of LiNbO3 . This approach
was briefly attempted for some crystals. The crystals were grown
at the congruent melting point and then'were diffused with 55
mole % Li20 mixture powder at .1000C f6r. five or ten hours.
The crystals showed significant increase of the phasematching
temperature but severe deterioration of the optical quality.
Following the initial growth of high-phasematching
temperature crystals a re-evaluation of the annealing temperature
was undertaken to attempt to define an optimum phasematching
condition. The annealing tests were. accomplished with a high
average power cw argon ion laser operating at 0.5145 u m which is
near the 0.532 Um second harmonic wavelength~of Nd:YAG
The optical damage was observed in two ways; by the distorted
beam shape of the transmitted beam for a preliminary observation;
and by the dynamic light scattering pattern of the transmitted
beam for a quantitative measurement. Both effects were caused
- 58 -
"_________I _ - - r z ' - - : -
by the optical index damage of the crystal due to the incident
.5145 Um beam. In the preliminary observation the distorted
transmitted beam was imaged on polaroid film at various crystal
temperatures. Consistent with the earlier reports, I we
have observed that index damage occurred much more severely
on the extrabrdinary refractive index (ne) than on the ordinary
refractive index (n). Thus the measurement of the beam distortion
due to the index damage was made mainly for "he wave. As an
example, Fig. 6 shows the evolution of the beam distortion for
crystal #528. It demonstrates that the beam distortion, in turn
optical index damage, is eliminated at the unexpectedly low
crystal temperature of approximately 1200C. Other recently grown
LiNbO3 crystals showed similar results. However, crystals grown
pproximately ten years earlier showed annealing temperatures near
the expected 170 -1800 range.
To measure the annealing temperature of the crystals more
accurately under high power density conditions, the cw .5i45 m
beam was focused very tightly into the crystal and the scattered
light pattern of the transmitted-beam was observed on the screen.
The transmitted beam initially showed a dynamic scattered light
pattern at low crystal temperatures. An increase of the crystal
temperature changed the dynamic light scattering pattern to a
Static light scattering pattern because of the self-annealing
.of the optical index damage. The temperature at which the dynamic
pattern changed into. the static pattern was defined to be the
optical index damage annealing temperature. The annealing
temperatures were measured for both the 0.488 and 0.5145 Itm
argon ion laser lines. The annealing temperature
- 59 -
difference was negligibly small as observed in
previous reports. Since the index damage is reduced for longer
e wavelengths 29 it is reasonable to consider that the annealing
temperature at .5145 pm and at .5320 jim are similar.
Figure 7 shows a plot of the annealing temperature vs
incident power density for a hot phasematching LiNbO3 crystal
#528 and a congruently grown LiNbO3 crystal. Other hot phasematching
LiNbO3 crystals showed the similar results. Although the required
annealing temperature of the hot LiNbO3 crystal is increased as
the incident power density increases, it saturates at a 0.1 MW/cm2
power density and eventually clamps strongly below approximately
1100C up to 1.2 MW/cm2 power density. Furthermore, the extra-
polation of the plot shows that the crystal temperature of 1200 C
should be high enough to anneal the index damage even at higher
power densities. Therefore, contrary to the earlier LiNbO3 crystals
which showed annealing temperatures near 1700C, the recently
Stanford grown hot phasematching LiNbO3 crystals show lower
annealing temperatures of 1200C.. The low annealing temperature
is consistent with an extremely low Fe2+ impurity concentration of
13 2 ppm in the Stanford crystals.' 2
The discovery of the low 120 0C annealing temperature
immediately led to the growth of crystals.with phasematching
temperatures just above that value. The lower annealing temperature
allowed a reduction of the excess lithium in the melt and thereby
greatly lessenedthe growth difficulty and enhanced. the possibility
for growth of larger high optical quality crystals needed for
efficient S1IG.
- 60 -
Table II lists the good optical quality hot phasematching
LiNbO3 crystals grown at Stanford whose phasematching temperatures
' were lower but still high enough to anneal the optical index
damage produced by the generated second harmonic of the 1.06 um
2beam at approximately 20 MW/cm peak power density. The second
harmonic phasematching curves of crystals #557 and #558 are shown
in Fig. 8 . Among the crystals listed, crystal #557 shows the
lowest phasematching temperature. It also shows that the inhomogeneity
of the lithium concentration along the crystal growth axis is
greatly reduced since the phasematching temperature variance
from the seed to the bottom end of the boule is decreased from
100C for the previously grown hot LiNbO3 crystals to 20C for
crystal #557. Crystal #558 is an attempt to duplicate the
. crystal #557 and shows that a consistent duplication with high
optical quality is indeed possible at this melt composition.
The 2 ~ 3° C phasematching temperature difference between two
crystals is mainly due to the SHG temperature measurement error
of the crystal oven controller.
In addition to complete index damage annealing and the low
Li20 composition inhomogeneity, the high optical quality of
these crystals is supported by high SHG conversion efficiency.
The SIG conversion efficiency of the crystals was measured by
both TEMoo mode and multi-transverse mode beam from the 1.06 Um
Nd:YAG source. When a TEo00 mode beam ,ith 3 watts average power
and I KIz pulsed Q-switch repetition rate was focussed into the
- 61 -
-r n -
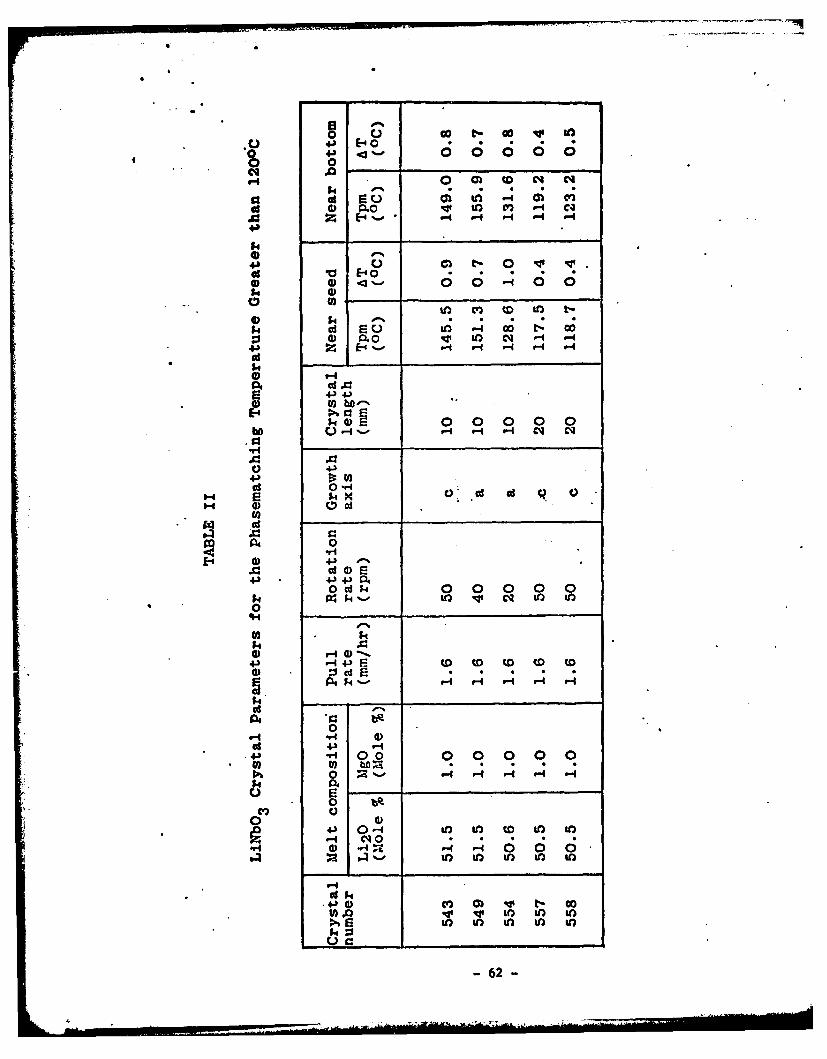
4J~~0
Cq .-40 0) C l C
OS0 "0 v o 0 m --4 C
4)
4) 040
4J 0J 4-)- 0
* ).~'0 0 -4 0 0
54 4)CC
to C4) SD to
14 ~ ~ ~ - 4-) 04t -i ~ ~4)0 qi ko 0l 0- 0 0
14-
0 w-0
F- 0 0 0
4.)
II 0
4-)4
[-44 C%3 0.
4.3. 4 4.4)D?A .0 0o 0 0 0
02 62
• : 2 cm length crystals at approximately 20 MW/cm2 peak power
density, the crystals showed a 40% average power conversion
efficiency.
A 10 mrad divergence multi-transverse mode beam with the
same peak power density level produced a 33% average power
conversion efficiency. The acceptance angle of a 2 cm long
31LiNbO3 crystal is calculated to be 15 mrad. The comparable
SHG conversion efficiency of the crystals for the multi-transverse
mode to that for the TEM 0 mode verifies that advantage of non-
critical phasematching is fully utilized.
The measurements of phasematching temperature tuning curves,
annealing temperatures, phasematching temperature variance along
the crystal growth axis, and SHG conversion efficiency demonstrates
* i that high quality hot phasematching LiNbO3 crystals can be grown
with consistent SHG performance.
IV. CONCLUSION
During the course of this program, we have demonstrated that
hot phasematching LiNbO 3 crystals can be grown with the optical
quality, reproducibility and size required for device applicatiens
by the proper choice of composition and growth parameters.
More significantly and specificially, we have demonstrated
that LiNbO3 crystals with a phasematching temperature greater
than 180 0 C can be grown with small concentration gradients from
a melt doped with MgO and excess Li2 0 together with a planar
growth interface; that the phasematch temperature can be readily
-63-
adjusted simply by changing the excess Li20 concentration
proportional to the phasematch temperature desired; that the
crystal quality and SHG characteristics can be maintained as
long as the MgO concentration and growth parameters are held
constant. We have also found that the self-annealing temperature
is much lower, near 1200 C for the Stanford grown crystals, as
compared to the previously reported value of 170-1800 C.
Taking advantage of the lower self-annealing temperature,
the crystals grown with phasematching temperature of approximately
120 0C showed exceptional optical homogeneity, and a.40% average
power SHG conversion efficiency.
The improved hot phasematching LiNbO3 crystals along with
the electro-optical or piezo-optical compensation for self
32heating effects should greatly enhance crystal device
applications to high average power second harmonic generation of
the Nd:YAG source.
ACKNOWLEDGEMENT
We want to acknowledge the support provided by theDepartment of Energy through contract #LLL 3488009..
- 64 -
.. ..... ~~~ ~~~~~~~~~... . . ....... . ... ... . .' ' . '. . .. ' "
REFERENCES
1. A. Ashkin, G.D. Boyd, J.U. Dziedzic, R.G. Smith,
A.A. Baliman, J.J. Levinstein and K. Nassau, "Optically
Induced Refractive Index Inhomogeneities in LiNbO3 and
LiTaO3"', Appi. PHys. Letts. 9(lY, p.72-74 (1966).
* 2. G.D. Boyd and A. Ashkin, "Theory of Parametric Oscillator
* Threshold with Single Mode Optical Masers and Observation
of Amplification in LiNbO 3" Phys. Rev. 146(l), p.187-198
(1965).
3. J.E; Midwinter, "Assessment of Llthium-1Meta-Niobate for
Nonlinear Optics", Appi. Phys. Letts. 11(4), 128-130 (1967).
4. P.S.*Chen, "Optically Induced Change of Refractive Indices
in LiNbO3 and LiTaO3 ", Jounr. Appi. Phys. 40(8), p.3389--3396
* (1969).
5. J.R. Carruthers, G.E. Peterson and M. Grasso, "Non-
* stoichiometry and Crystal Growth of Lithium Niobate",
Journ. Appl. Pilys. 425) p.1846-1851 (1971).
6. Romer Fay, W.J. Alford and H.M. Dess, "Dependence of
Second Harmonic Phasematching-Temperature in LiNbO 3
Crystals on Melt Composition", Appl. Phys. Letts.
12(3), p.89-92 (106S).
-65-
7. J.G. Bergman, A. Ashkin, A.A. Ballznan, J.M. Dziedzic,
N.J. Levinstein and R.G. Smith, "Curie Temperature,
Birefringence and Phasematching Temperature Variation
in LiNbO 3 as a Function of Melt Stoichiometry", Appi.
Phys. Letts. 123) p.92-94 (1968).
8. R.L. Byer, J.F. Young and R.S. Feigelson, "Growth of
High Quality LiNbO3 Crystals from the Congruent Melt",
Journ. Appi. Phys. 41(6), p.2320-2325 (1970).
9. J.E. Midwinter, "Lithium Niobate:Effects of Composition
on the Refractive Indices and Optical Second Harmonic
Generation", Journ. Appi. Phys. 39(7), p.3035-3038 (1968).
10. H. Tsuya, Y. Fujino and K. Sugibuchi, "Dependence of
Second Harmonic Generation on Crystal Inhomogeneity",
Journ. Appl. Phys. 41(6), p.2557-2563.
11. F.R. Nash, G.D. Boyd, M. Sargent III and P.M. Bridenbaugh,
"Effect of Optical Inhomgeneities oni Phase Matching in
Nonlinear. Crystals", Journ. Appi. Phys. 41(6), p.256 4--2576
(1970).
12. R.G. Smith, "Effect of Index Inhomogeneities on Optical
Second Harmonic Generation", Journ. Appi. Phys. 41(7),
p.3014-3017 (1970).
-66-
*13. N.B. Angert, V.A. Pashkov and N.M. Solovera, "Optically
Induced Inhomogeneity of the Refractive Index of LiNbO3
Crystals", Soviet Physics JETP, 35(5), p.867-869 (1972).
14. D.L. Staebler and J.J. Amodei, "Coupled Wave Anialysis of
Holographic Storage in LiNbO 3 1" Journ. Appl. Phys. 43(3),
p.1042-1049 (1972).
15. D. von der Linde, A.M. Glass and K.F. Rodgers, "Multi-
photon Photo-refractive Processes for Optical Storage in
LiNbO3'-, Appl. Phys. Letts..25(3), p.155-157 (1974).
16. Rajiv R. Shah, Dae M. Kim, T.A. Rabson and F.K. Tittel,
"Characterization of Iron-doped Lithium Niobate for
Holographic Storage Applications", Journ. Appl. Phys.
47(12)., p.5421-5431 (1976).
17. W.D. Johnston, Jr., "Optical'Index Damage in LiNbO3 and
Pyroelectric Insulators", Journ. Appi. Phys. 41(8),
p.3279-3285 (1970).
18. A.M. Glass, G.E. Peterson and T.J. Negran, "Optical Index
Damage in Electro-optic Crystals", Proceedings of the NES
Symposium on Damage in Laser Material, NES. Spec. Pubi.
372, p.15-26 (1972).
19. A. Zylbersztcjn, "Thermally Activated Trapping in Pc-Doped
LiNbO 3" AppI. Phys. Letts. 29( 12), p.778-780 (1976).
-67 -
20. A.M. Glass, D. von der Linde and T.J. Negran, "High
Voltage Bulk Photovoltaic Effect and the Photorefractive
Process in LiNbO 3 1, Appi. Phys. Letts. 25(4), p.233-235
(1974).
21. G.M. Zverev, E.A. Levchuk, V.A. Pashkov and Yu.D. Poryadin,
"Laser Radiation induced Damage to the Surface of Lithuum
Niobate and Tantalate Single Crystals", Soviet Journ. Quant.
Elect. 2jj p.167-169 (1972).
22. G.M. Zverev, S.A. Kolyadin, E.A. Levchuk and L.A. Skvortsov,
"Influence of the Surface Layer on the Optical Strength of
* Lithium Niobate", Soviet Journ.of Quant. Elect. 7(9)
p.1071-1075 (1977).
23. P.M. Bridenbaugh, J.R. Carruthers, J.M. Dziedzic and
F.R. Nash, "Spatially Uniform and Alterable SEG Phase-
matching Temperature in LiNbO 3" Appl. Phys. Letts. 17(3)
p.104-106 (197.0).
24. 5. .Miyazawa, R. Guglielmi and A. C arenco, "A Simple
Technique ,for Suppressing L12O Out-Diffusion in Ti:LiNbO3
Optical lWaveguide", Appl. Phys. Letts. 31(11), p.742-744 (1977).
25.- R.L. Holman, P.J. Cressman and J.F. Ravelli, "Chemical
Control.of Optical Damage in Lithiumn Niobate", Appi. Phys.
Letts. 32(5), p.280-283 (1978).
-68
26. B.U. Chen and A.C. Pastor', "Elimination of L12O Out-Diffusion
Waveguide in LiNbO3 and LiTaO3', Appi. Phys. Letts. 30(11),
p.570-571 (1977).
27. R.L. Byer and R.L. Herbst, private communication.
28. P.M!. Bridenbaugh,' "Factor Affectinig the Growth of LiNbO3
Useful for Nonlinear Optical Applications", Journ. Crystal
Growth, 19, p.45-52 (1973).
29. H.E. Serreze and R.B. Goldner, "Study of the Wavelength
Dependence of Optically Induced Birefringence Change in
Undoped LiNbO 3", Appl. Phys. Letts. 22(12), p.626-627 (1973).
30r. D. Rddfield and W.J. Burke, "Optical Absorption Edge of
LiNbO 3 111 Journ. of Appi. Phys. 45(10), p.4566-4571 (1974).
31. R.L. Byer and R.L. Herbst, "parametric Oscillation and
Mixing", published in Nonlinear Infrared Generation, ed.
by Y.R. Shen, Springer-Verlag, p.81 (1977).
32. D.T. Hon, "Electro-optic and Piezo-optic Tuning of Second
*Order Nonlinear Processes in Cryastals". Journ. of Appl.Phys.
49(1), p.396-'402 (1978) ; "Electro-optical Compehsation for
Self Heating in CD*A During 5110", IEEE, Journ. Quant. Electr.
QE-12(2), p.148-151 (1976).
-69-
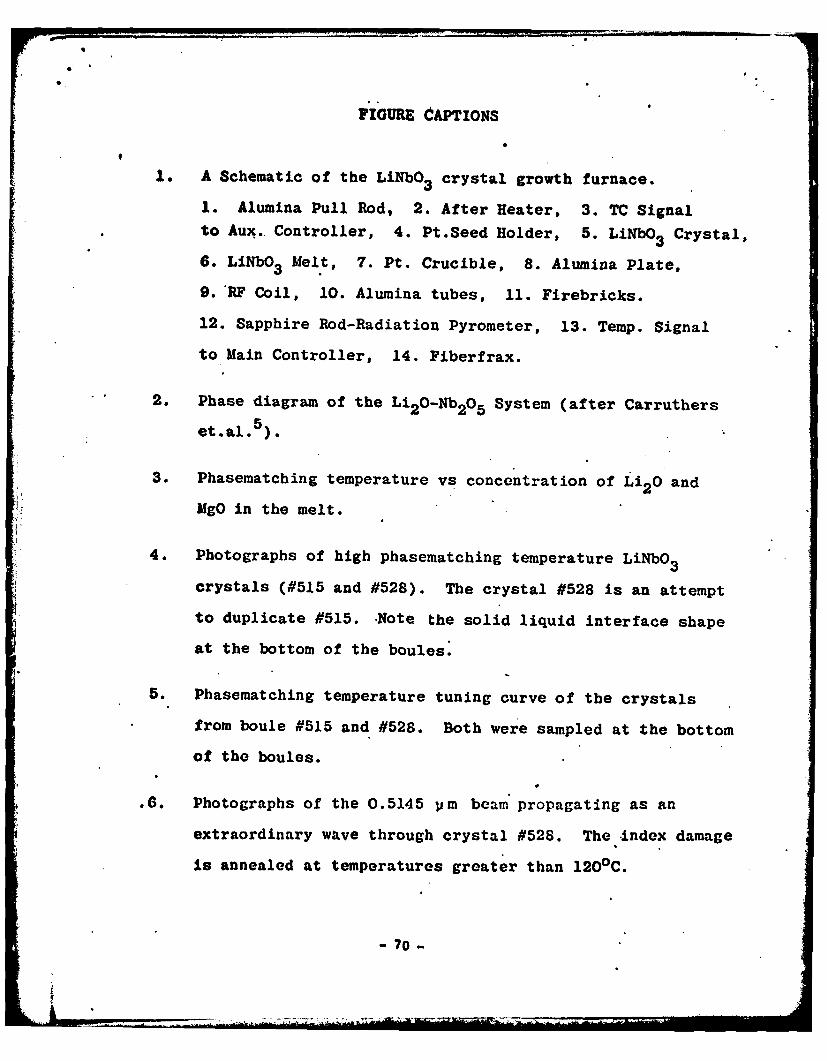
FIGURE dAPTIONS
1. A Schematic of the LiNbO3 crystal growth furnace.
1. Alumina Pull Rod, 2. After Heater, 3. TC Signalto Aux.. Controller, 4. Pt.Seed Holder, 5. LiNbO3 Crystal,
6. LiNbO3 Melt, 7. Pt. Crucible, 8. Alumina Plate,
9.'RF Coil, 10. Alumina tubes, 11. Firebricks.
12. Sapphire Rod-Radiation Pyrometer, 13. Temp. Signal
to Main Controller, 14. Fiberfrax.
2. Phase diagram of the Li2O-Nb2O5 System (after Carruthers
et.al.5).
3. Phasematching temperature vs concentration of Li2o and
MgO in the melt.
4. Photographs of high phasematching temperature LiNbO3
crystals (#515 and #528). The crystal #528 is an attempt
to duplicate #515. -Note the solid liquid interface shape
at the bottom of the boules.
5. Phasematching temperature tuning curve of the crystals
from boule #515 and #528. Both were sampled at the bottom
of the boules.
.. Photographs of the 0.5145 pjm beam propagating as an
extraordinary wave through crystal #528. The index damage
is annealed at temperatures greater than 1200C.
- 70 -

7. Annealing temperature vs power density for 0.5145 Um
incident on recently grown LiNbO3 crystals.
8. Phasematching temperature tuning curve of the crystals
from boules #557 and #558. Upper traces are sampled near
the seed of the boules and lower ones from the bottom.
71
- 71 -
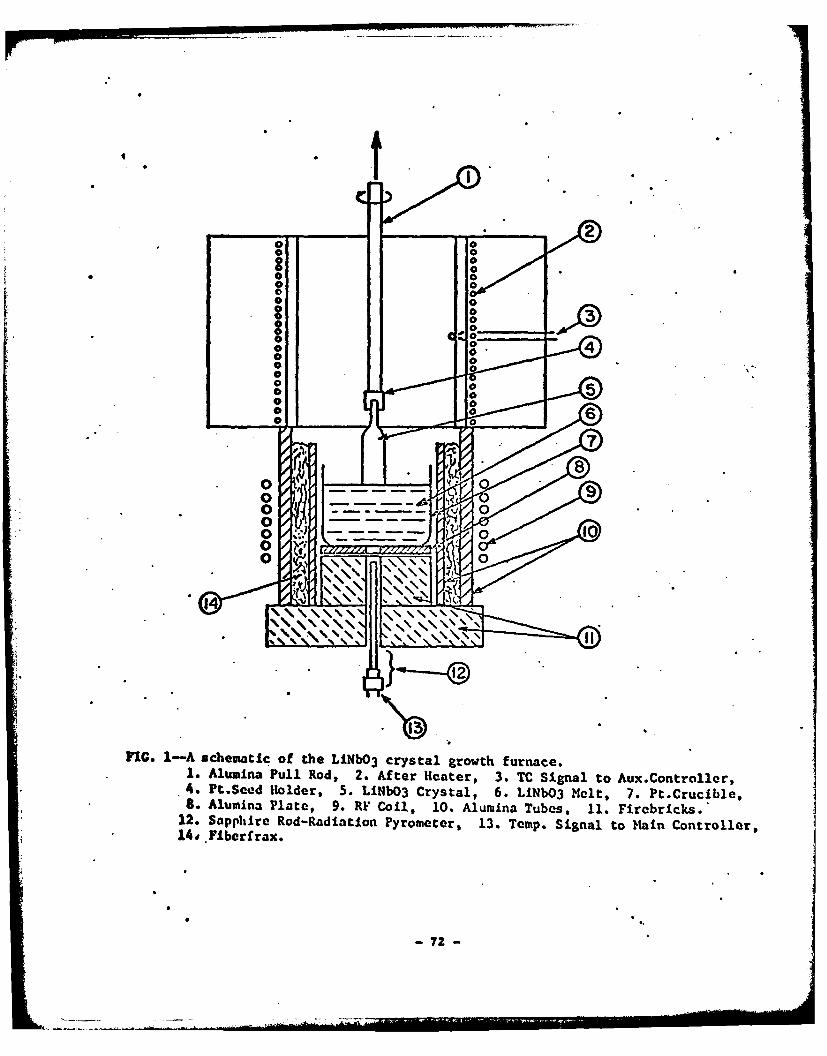
0
000
0".
o 0~0
110. 1-A schematic of the LiNbO3 crystal growth furnace.1. Alumina Pull Rod, 2. After Hecater, 3. TC Signal to Aux.Controller,4. Pt.Sead Holder, 5. LiNbO3 Crystal, 6. LiNbO3 Malt, 7. Pt.Crucible,S . Alumina Plate, 9. RE Coil, 10. Alumina Tubes, 11. Firebricks.*12. Sapphire Rod-Radiation Pyrometer, 13. Temp. Signal to Main Controller.
14i Fiberfrax.
-72-
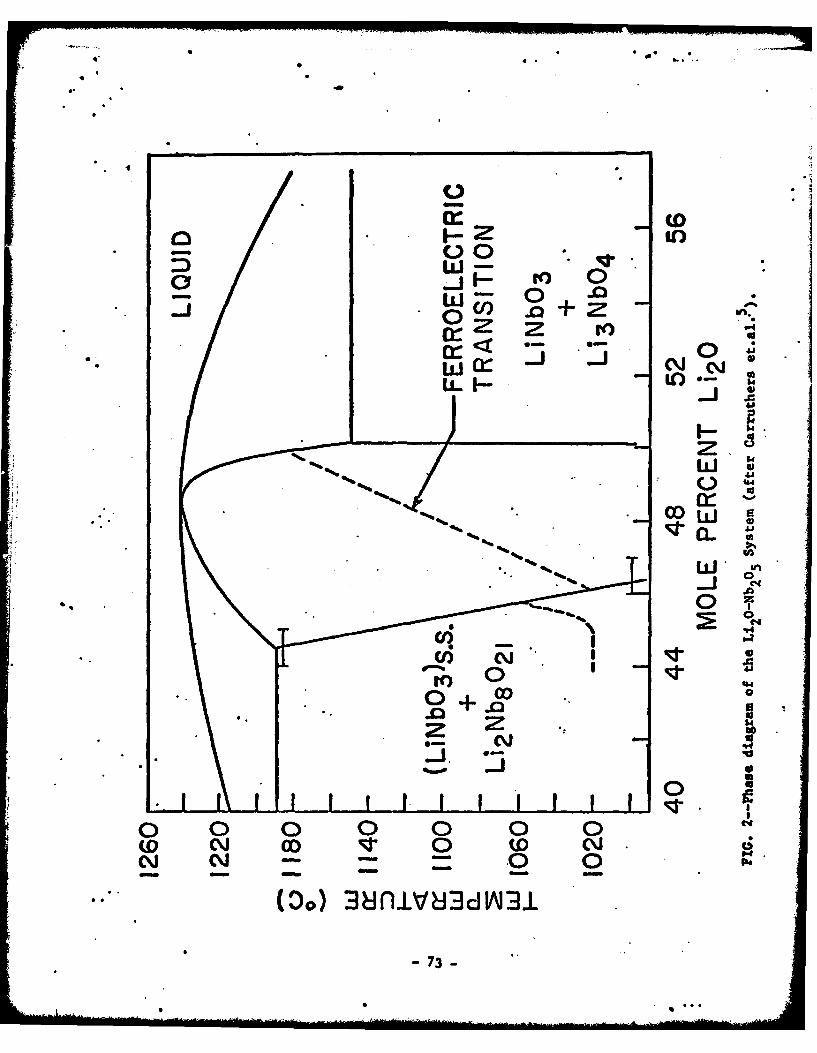
**4 4'4
(00
#M 00o0 +.d OD-~~ z~- Q .
0 *
ti. 00
73 -
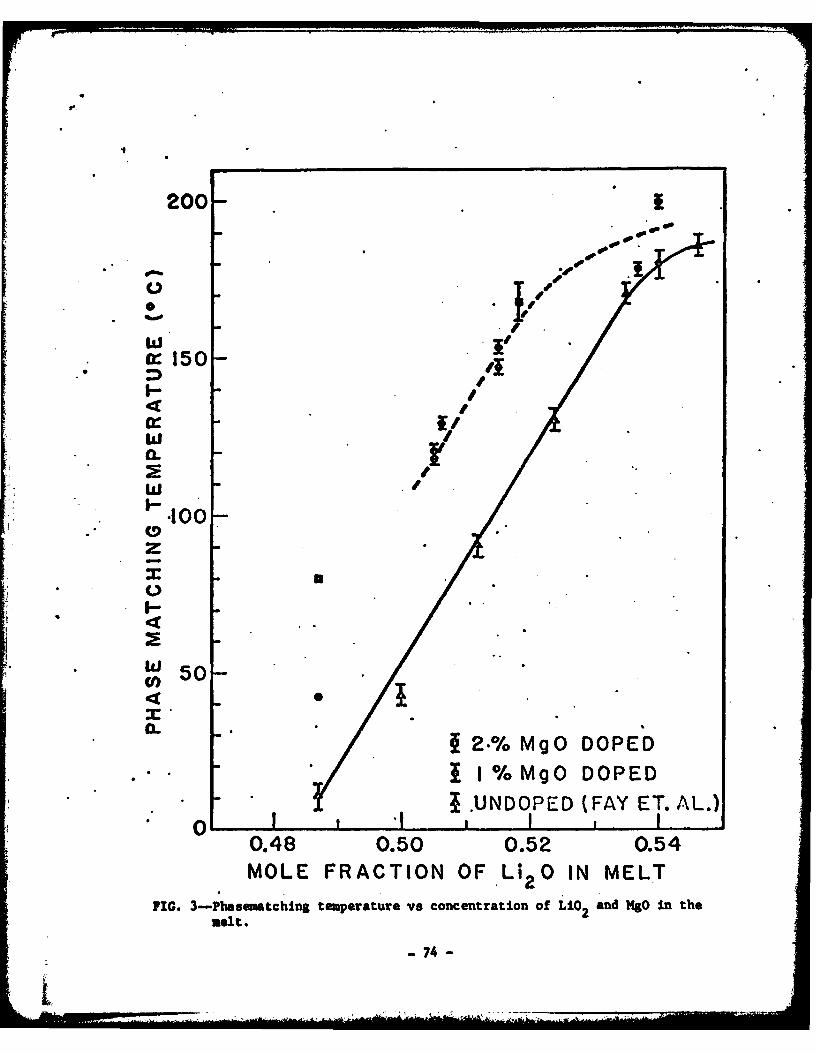
200-
0
1I50 4
I- /
* 00
4~ ~ 00 . 80 5 . 2 - - 0 5
47
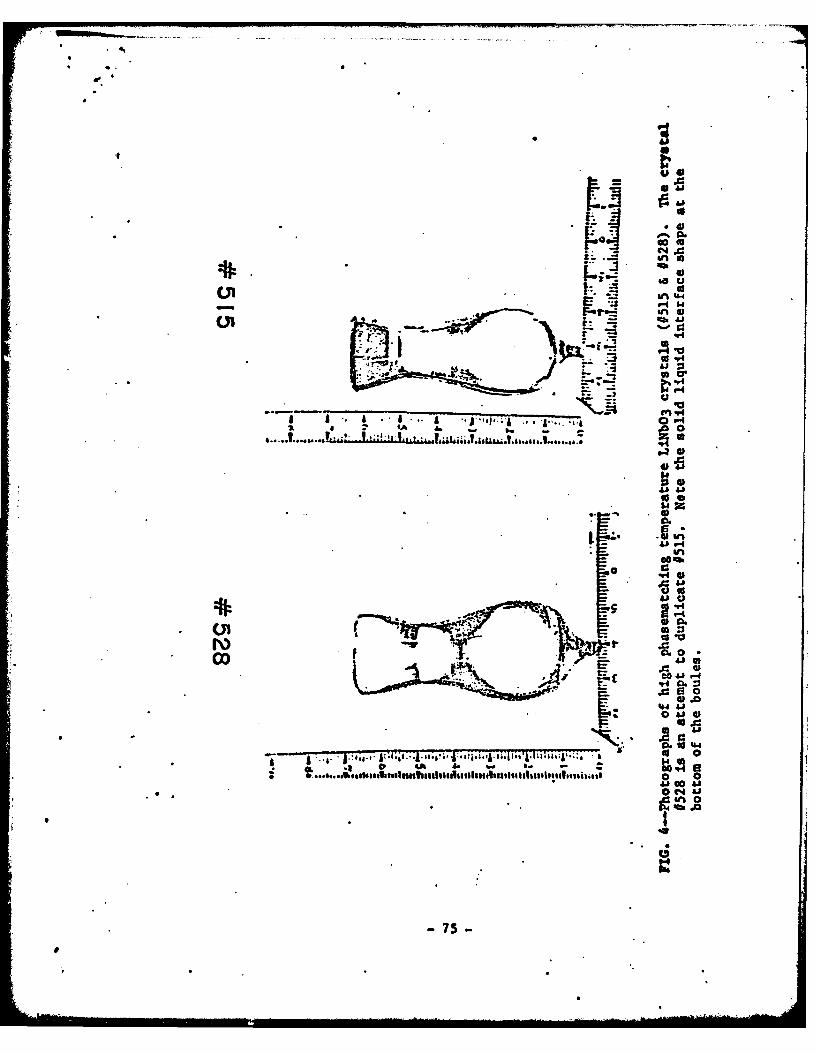
C4J
4*IKAM 440
01IC 41
01
.n -k
A41
A 041 .0
.. C4 .4
750
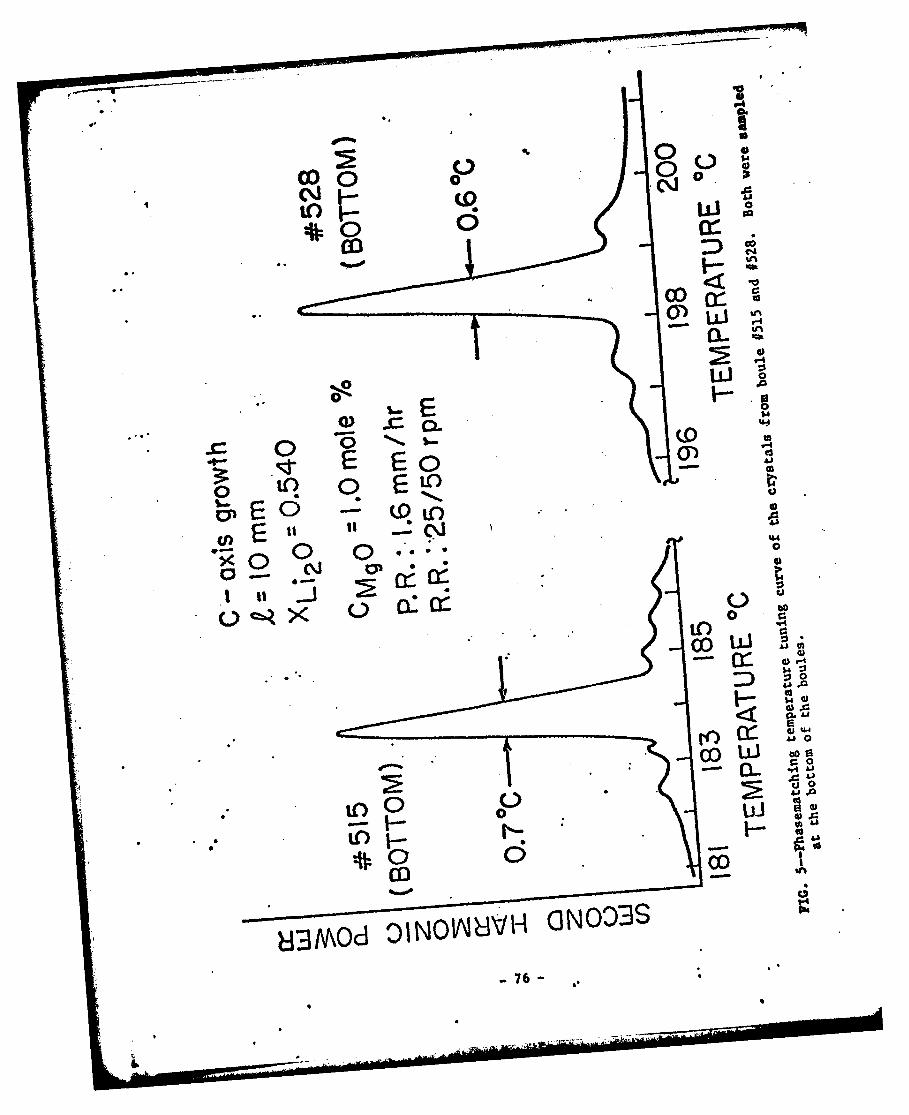
00 0,. 0*
p .J
oo 0o
L
uji.04
I-- '44 ,
0 0F o --- LO .••"
0) 0
' _, - : 6).-
.o(; o \wI 4)
410
U4
to 0
0l
U3N\O6 O1NON8VI ON003S
-76-
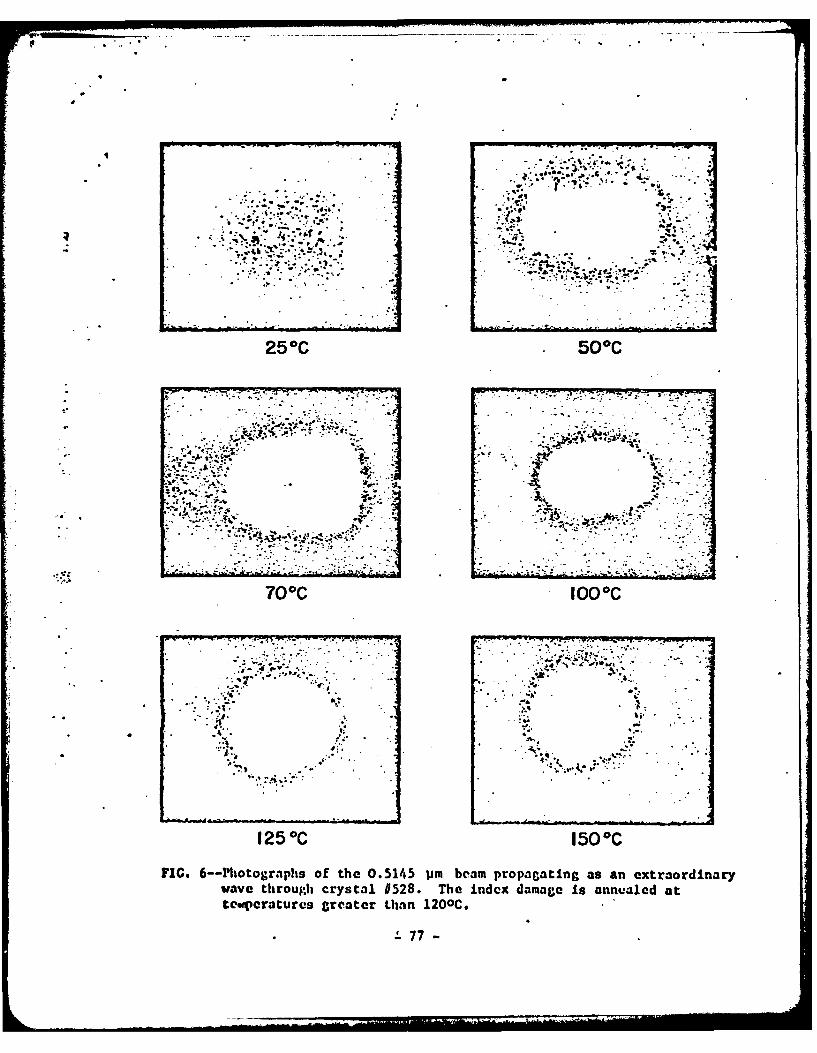
7., 't. .* .4 .
7.'.
12 *C 1500C
PIC.~~~~~~' .. 4..grph ofte054 empoagtn sa xrodnr
waethoghcyta 52.Te nexdmaeI analda
tefteratres reaer Lan 100C
772
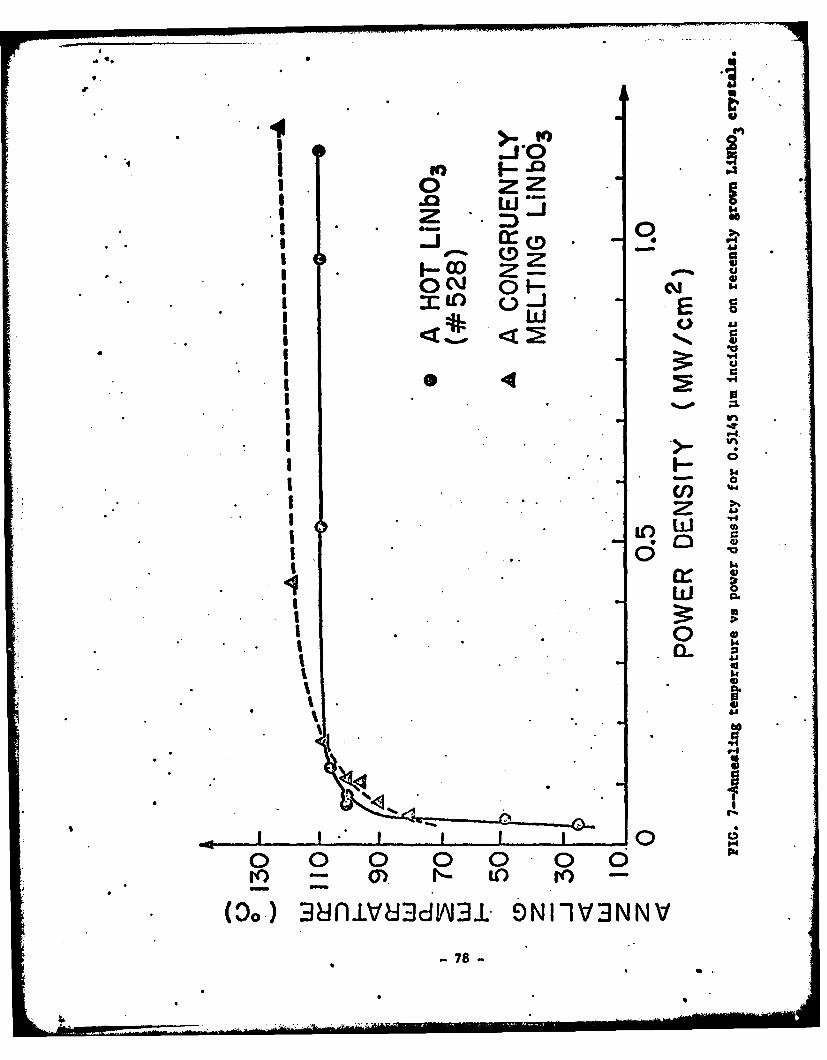
00
(D Z
0 C. o0-3: L -~JE
I _IA
IO. w8i83l3 00 -l3
* -78 -
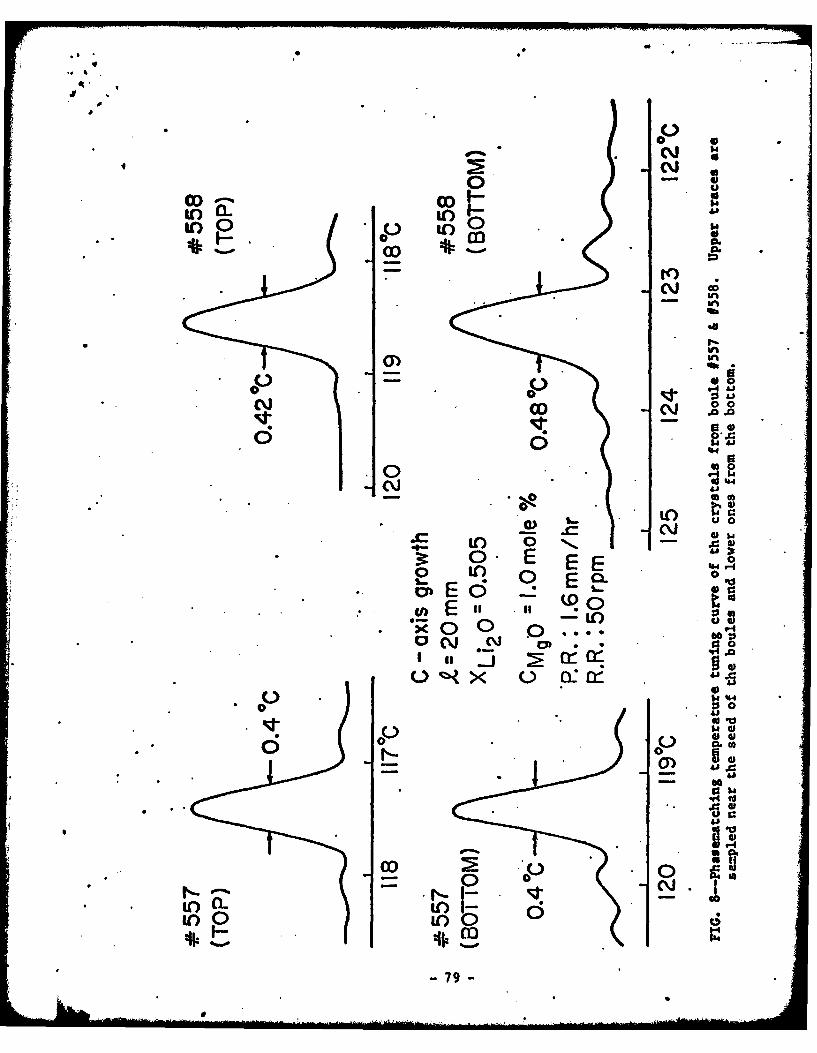
*1) 0 to
0 a
0=
o'4'
Q 0 0o 00 .~ .0.1q. 68.0
- r().08
i2%
0- E E E % -f0 00
C) 0
*40.
'iff
.0 SO
Nw
Ioo 0
oto to*o .. rc5 B(
79 E i II