Embed Size (px)
Citation preview
California PATH—Partners for Advanced Transit and Highways—is a collaboration between the California Department of Transportation (Caltrans), the University of California, other public and private academic institutions, and private industry.
PATH’s mission: applying advanced technology to increase highway capacity and safety, and to reduce traffic congestion, air pollution and energy consumption.
Intellimotion
Volume 11, No. 3 2005
Vol. 11 no. 3 2005
continued on page 8
Reflections on My Two Years as PATH DirectorSamer Madanat
When I was appointed Director of California PATH in summer 2003, it was with the spe-
cific mandate to help re-structure the research center, to align more closely with the objectives of our main sponsor, Caltrans. The re-organized PATH includes four research programs: Traffic Operations, Transit Operations, Traffic Safety and Policy. The reason for this restructuring was to provide a more direct link between the Caltrans customers and the research thrusts at PATH.
It can be safely said that this objective has been achieved. There is now a much better match between PATH’s research activities and Caltrans’ customer needs. Partly, this is due to the fact that the process for defining PATH Research Problem Statements was also radically changed. Instead of initiating with research-ers, the process now starts with the Caltrans custom-ers: the Traffic Operations, Modal, Safety, Planning and other Caltrans headquarters staff, as well as the districts staff. These are the people who must solve the congestion, safety and mobility problems faced by millions of Californians, and who are thus most aware of the research needs of the organization.
PATH Welcomes Alexander Skabardonis as New DirectorA Message From Alexander Skabardonis
California PATH is a unique research organization. It focuses on solving California’s and the nation’s
transportation problems by conducting relevant and high-quality research that advances the state-of-the-art. The research is performed by a statewide group of faculty, graduate students and research staff of diverse background and expertise working closely together. At the same time, PATH produces the next generation of leaders in academia and the transportation profes-sion.
PATH ongoing research directly addresses the mobility, reliability, and safety goals of our Caltrans partners and will place major emphasis on field testing of the most promising strategies for traffic control, traveler infor-mation, intersection safety, transit and other mobility options. We are also engaged in shaping the direction and playing a major role on several national ITS initia-tives on integrated corridor management, vehicle in-frastructure integration (VII), intelligent intersection safety, intelligent vehicles and bus rapid transit.
Next year will be the 20th anniversary of the launch of the PATH program. PATH has made major contribu-
continued on page 5
Page 1Change of Leadership at PATH
Page 2A Vehicle-Infrastructure Integration (VII) Approach for Pedestrian Dectection
Page 6Transit Agencies See Benefits from Integrating Services
Page 9Extracting Vehicle Trajectories from Video Data: The NGSIM Prototype Data Set
Page 10PATH on Paper
Page 12ITS America Best of ITS Research Award
Outgoing ITS Director Marty Wachs presents outgoing PATH Director Samer Madanat with Plaque
Outgoing PATH Director Samer Madanat welcomes new PATH Director Alex Skabardonis
2 Intellimotion vol. 11 no. 3 2005
Given the challenging operating environment in an urban environment, a complete and reliable sensing system for pedestrian detection can ben-
efit from the combined use of multiple sensors. Any one particular type of technology may have difficulties meeting all necessary requirements in various lighting conditions, or rainy and foggy and inclement weather conditions, not to mention that most sensors have limited fields of view to monitor traffic in all directions. Furthermore, the cluttered background and complex moving patterns of all objects on urban streets demand sophisticated processing of sensor in-puts to avoid false detection and recognition.
In order to overcome the technical challenges of the afore-mentioned problem, a sensor-fusion and segmented ap-proach is necessary. For example, ultrasonic sensor arrays and infrared detectors can be used for alerting drivers of pedestrians near the vehicle. On the other hand, infrared camera, laser scanner, camera and radar can help provide long-range detection in situations when drivers are unaware of pedestrians at a distance.
Another promising approach has recently emerged with the advancement of wireless communication technologies. The US Federal Communications Commission recently an-nounced the allocation of radio frequencies for Dedicated Short Range Communications (DSRC) in the 5.9 GHz band. DSRC can be applied for many applications, a primary one of which is roadway safety. Based on the availability of com-munication links, a vehicle-infrastructure solution (VII) can be constructed. In conditions where drivers have obstructed views or limited visibility to pedestrian crossings, an infra-structure sensor can be used to detect objects. As a vehicle approaches the pedestrian crossing location, a wireless sig-nal can be sent to a receiver on the vehicle with a visual or auditory alert given to the driver. This approach is particu-larly sensible for transit buses because they run on fixed routes and the suggested safety solutions can be selectively deployed at high-risk locations along the transit routes. We have carried out a demonstrative study at PATH and this report provides a summary of the feasibility testing.
Experimental Platform and Testing ScenarioThe testing scenario for the demonstrative system is as fol-lows:
A pedestrian detector (a microwave radar device) senses a pedestrian walking in a crosswalk and sends a signal to an infrastructure computer (a PC-104 located in the intersec-tion controller cabinet figure 5). While the pedestrian is crossing the street and if a vehicle is approaching the in-tersection within 20 meters or two seconds of travel (the parameter values can be adjusted for specific design), the infrastructure computer broadcasts a wireless signal (using 802.11b unit). An on-board computer (another PC-104) on the bus receives the broadcast signal and illuminates a driver-vehicle interface (DVI) to alert the driver of the pe-destrian presence. Alternatively, the infrastructure computer can also illuminate a driver-infrastructure interface (DII) at a corner of the intersection (figure 8).
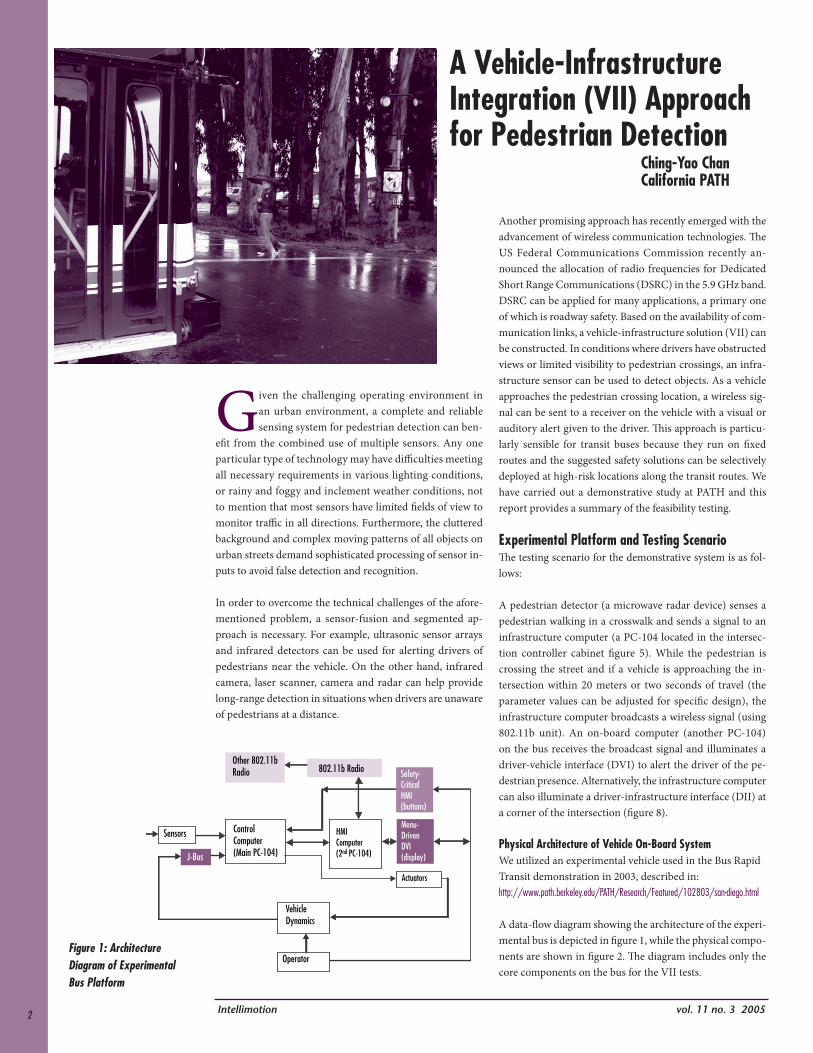
Physical Architecture of Vehicle On-Board System We utilized an experimental vehicle used in the Bus Rapid Transit demonstration in 2003, described in: http://www.path.berkeley.edu/PATH/Research/Featured/102803/san-diego.html
A data-flow diagram showing the architecture of the experi-mental bus is depicted in figure 1, while the physical compo-nents are shown in figure 2. The diagram includes only the core components on the bus for the VII tests.
A Vehicle-Infrastructure Integration (VII) Approach for Pedestrian Detection
Other 802.11bRadio 802.11b Radio Safety-
CriticalHMI(buttons)
Menu-DrivenDVI(display)
Actuators
HMIComputer(2nd PC-104)
ControlComputer(Main PC-104)
Vehicle Dynamics
Operator
Sensors
J-Bus
Figure 1: Architecture Diagram of Experimental Bus Platform
Ching-Yao ChanCalifornia PATH
�Intellimotionvol. 11 no. 3 2005
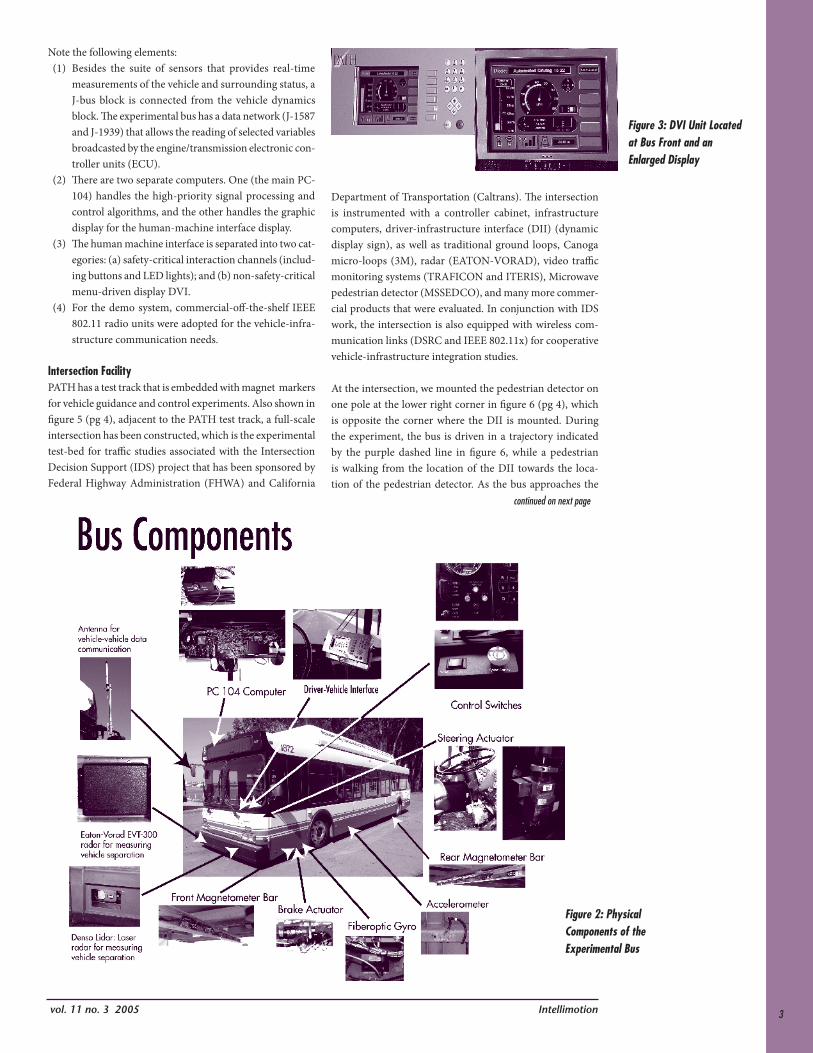
Note the following elements:(1) Besides the suite of sensors that provides real-time
measurements of the vehicle and surrounding status, a J-bus block is connected from the vehicle dynamics block. The experimental bus has a data network (J-1587 and J-1939) that allows the reading of selected variables broadcasted by the engine/transmission electronic con-troller units (ECU).
(2) There are two separate computers. One (the main PC-104) handles the high-priority signal processing and control algorithms, and the other handles the graphic display for the human-machine interface display.
(3) The human machine interface is separated into two cat-egories: (a) safety-critical interaction channels (includ-ing buttons and LED lights); and (b) non-safety-critical menu-driven display DVI.
(4) For the demo system, commercial-off-the-shelf IEEE 802.11 radio units were adopted for the vehicle-infra-structure communication needs.
Intersection FacilityPATH has a test track that is embedded with magnet markers for vehicle guidance and control experiments. Also shown in figure 5 (pg 4), adjacent to the PATH test track, a full-scale intersection has been constructed, which is the experimental test-bed for traffic studies associated with the Intersection Decision Support (IDS) project that has been sponsored by Federal Highway Administration (FHWA) and California
Department of Transportation (Caltrans). The intersection is instrumented with a controller cabinet, infrastructure computers, driver-infrastructure interface (DII) (dynamic display sign), as well as traditional ground loops, Canoga micro-loops (3M), radar (EATON-VORAD), video traffic monitoring systems (TRAFICON and ITERIS), Microwave pedestrian detector (MSSEDCO), and many more commer-cial products that were evaluated. In conjunction with IDS work, the intersection is also equipped with wireless com-munication links (DSRC and IEEE 802.11x) for cooperative vehicle-infrastructure integration studies.
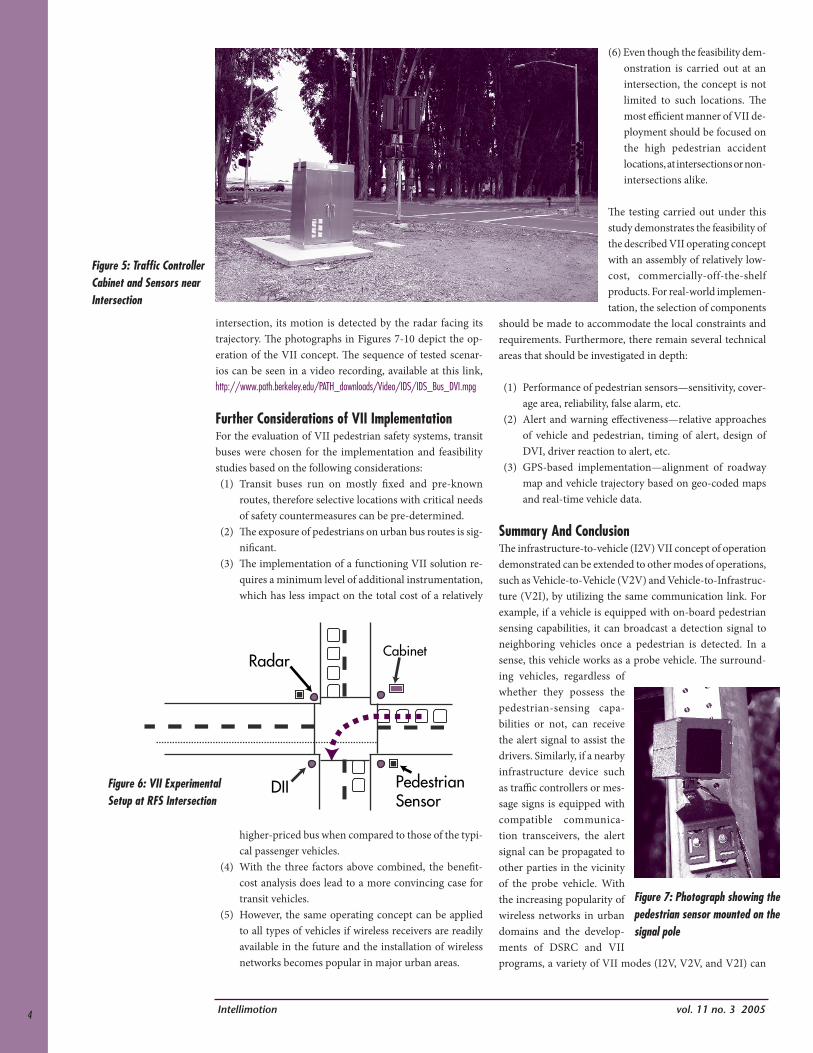
At the intersection, we mounted the pedestrian detector on one pole at the lower right corner in figure 6 (pg 4), which is opposite the corner where the DII is mounted. During the experiment, the bus is driven in a trajectory indicated by the purple dashed line in figure 6, while a pedestrian is walking from the location of the DII towards the loca-tion of the pedestrian detector. As the bus approaches the
Figure 3: DVI Unit Located at Bus Front and an Enlarged Display
Figure 2: Physical Components of the Experimental Bus
continued on next page
� Intellimotion vol. 11 no. 3 2005
(6) Even though the feasibility dem- onstration is carried out at an intersection, the concept is not limited to such locations. The most efficient manner of VII de- ployment should be focused on the high pedestrian accident locations, at intersections or non- intersections alike.
The testing carried out under this study demonstrates the feasibility of the described VII operating concept with an assembly of relatively low-cost, commercially-off-the-shelf products. For real-world implemen-tation, the selection of components
should be made to accommodate the local constraints and requirements. Furthermore, there remain several technical areas that should be investigated in depth:
(1) Performance of pedestrian sensors—sensitivity, cover-age area, reliability, false alarm, etc.
(2) Alert and warning effectiveness—relative approaches of vehicle and pedestrian, timing of alert, design of DVI, driver reaction to alert, etc.
(3) GPS-based implementation—alignment of roadway map and vehicle trajectory based on geo-coded maps and real-time vehicle data.
Summary And ConclusionThe infrastructure-to-vehicle (I2V) VII concept of operation demonstrated can be extended to other modes of operations, such as Vehicle-to-Vehicle (V2V) and Vehicle-to-Infrastruc-ture (V2I), by utilizing the same communication link. For example, if a vehicle is equipped with on-board pedestrian sensing capabilities, it can broadcast a detection signal to neighboring vehicles once a pedestrian is detected. In a sense, this vehicle works as a probe vehicle. The surround-ing vehicles, regardless of whether they possess the pedestrian-sensing capa-bilities or not, can receive the alert signal to assist the drivers. Similarly, if a nearby infrastructure device such as traffic controllers or mes-sage signs is equipped with compatible communica-tion transceivers, the alert signal can be propagated to other parties in the vicinity of the probe vehicle. With the increasing popularity of wireless networks in urban domains and the develop-ments of DSRC and VII programs, a variety of VII modes (I2V, V2V, and V2I) can
Cabinet
DII
Radar
PedestrianSensor
intersection, its motion is detected by the radar facing its trajectory. The photographs in Figures 7-10 depict the op-eration of the VII concept. The sequence of tested scenar-ios can be seen in a video recording, available at this link, http://www.path.berkeley.edu/PATH_downloads/Video/IDS/IDS_Bus_DVI.mpg
Further Considerations of VII ImplementationFor the evaluation of VII pedestrian safety systems, transit buses were chosen for the implementation and feasibility studies based on the following considerations: (1) Transit buses run on mostly fixed and pre-known
routes, therefore selective locations with critical needs of safety countermeasures can be pre-determined.
(2) The exposure of pedestrians on urban bus routes is sig-nificant.
(3) The implementation of a functioning VII solution re-quires a minimum level of additional instrumentation, which has less impact on the total cost of a relatively
higher-priced bus when compared to those of the typi-cal passenger vehicles.
(4) With the three factors above combined, the benefit-cost analysis does lead to a more convincing case for transit vehicles.
(5) However, the same operating concept can be applied to all types of vehicles if wireless receivers are readily available in the future and the installation of wireless networks becomes popular in major urban areas.
Figure 5: Traffic Controller Cabinet and Sensors near Intersection
Figure 7: Photograph showing the pedestrian sensor mounted on the signal pole
Figure 6: VII Experimental Setup at RFS Intersection

5Intellimotionvol. 11 no. 3 2005
continued from page 1
Figure 10: Exemplar Design of DVI Display Showing Pedestrian Crossing
Figure 8: Photograph showing a pedestrian crossing and the bus entering the intersection with the DII illuminated
Figure 9: View of DVI from the Inside of Bus and the Illuminated DII Ahead
ITS DecisionAnalysis of Implementation of Intel-
ligent Transportation Systems
www.calccit.org/itsdecision/
tions to ITS that have been recognized worldwide. We plan to celebrate “PATH at 20” by demonstrating the benefits of our current research through real-world testing, leading the way on the national ITS research efforts, and formulating new innovative research ideas.
I am thrilled with the opportunity to help shape the future of PATH. •
New Director
be jointly pursued with the most suitable strategies deployed for specific locations.
One critical issue that should systematically be evaluated is the human-factor elements involved in the implementation of the suggested safety systems. The technical problems en-countered in the developments can be relatively easy to solve, yet the effectiveness of the safety systems hinges completely on the timeliness and the communication of an alert signal to the driver. The design and evaluation of DVI remain a critical area for future studies.
AcknowledgementsThis report describes the work conducted under Task Or-der 5200, Experimental Vehicle Platform for Pedestrian Detection, sponsored by the Caltrans-PATH program. The author wishes to recognize the team effort by Jeffery A. Ko, Swe-Kuang Tan, Thang Lian, Susan Dickey, David Nelson, Fanping Bu, and David Marco in the implementation of the VII testing described in this article. Certain sections of the materials herein have been published in the related refer-ences below, where more detailed descriptions of literature review and technical discussions can be found. •
Fanping Bu, C-Y Chan, “Pedestrian Detection in Transit Bus Application: Sensing Technologies and Safety Solutions”, IEEE Intelligent Vehicles Symposium 2005, Las Vegas, June 2005.
Chan, C-Y, Fanping Bu, “Vehicle-Infrastructure Integrated Ap-proach for Pedestrian Detection”, submitted for the Transpor-tation Research Board Annual Meeting 2006.
6 Intellimotion vol. 11 no. 3 2005
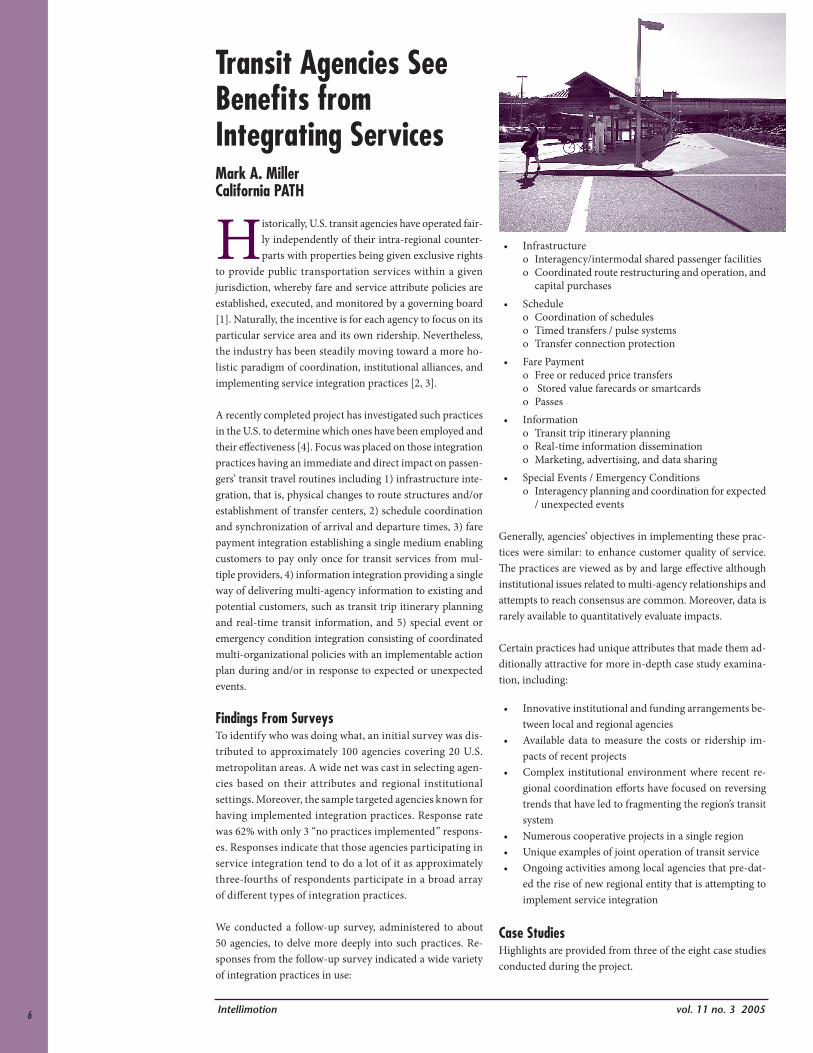
Historically, U.S. transit agencies have operated fair-ly independently of their intra-regional counter-parts with properties being given exclusive rights
to provide public transportation services within a given jurisdiction, whereby fare and service attribute policies are established, executed, and monitored by a governing board [1]. Naturally, the incentive is for each agency to focus on its particular service area and its own ridership. Nevertheless, the industry has been steadily moving toward a more ho-listic paradigm of coordination, institutional alliances, and implementing service integration practices [2, 3].
A recently completed project has investigated such practices in the U.S. to determine which ones have been employed and their effectiveness [4]. Focus was placed on those integration practices having an immediate and direct impact on passen-gers’ transit travel routines including 1) infrastructure inte-gration, that is, physical changes to route structures and/or establishment of transfer centers, 2) schedule coordination and synchronization of arrival and departure times, 3) fare payment integration establishing a single medium enabling customers to pay only once for transit services from mul-tiple providers, 4) information integration providing a single way of delivering multi-agency information to existing and potential customers, such as transit trip itinerary planning and real-time transit information, and 5) special event or emergency condition integration consisting of coordinated multi-organizational policies with an implementable action plan during and/or in response to expected or unexpected events.
Findings From SurveysTo identify who was doing what, an initial survey was dis-tributed to approximately 100 agencies covering 20 U.S. metropolitan areas. A wide net was cast in selecting agen-cies based on their attributes and regional institutional settings. Moreover, the sample targeted agencies known for having implemented integration practices. Response rate was 62% with only 3 “no practices implemented” respons-es. Responses indicate that those agencies participating in service integration tend to do a lot of it as approximately three-fourths of respondents participate in a broad array of different types of integration practices.
We conducted a follow-up survey, administered to about 50 agencies, to delve more deeply into such practices. Re-sponses from the follow-up survey indicated a wide variety of integration practices in use:
• Infrastructure o Interagency/intermodal shared passenger facilities o Coordinated route restructuring and operation, and
capital purchases• Schedule o Coordination of schedules o Timed transfers / pulse systems o Transfer connection protection• Fare Payment o Free or reduced price transfers o Stored value farecards or smartcards o Passes• Information o Transit trip itinerary planning o Real-time information dissemination o Marketing, advertising, and data sharing• Special Events / Emergency Conditions o Interagency planning and coordination for expected
/ unexpected events
Generally, agencies’ objectives in implementing these prac-tices were similar: to enhance customer quality of service. The practices are viewed as by and large effective although institutional issues related to multi-agency relationships and attempts to reach consensus are common. Moreover, data is rarely available to quantitatively evaluate impacts.
Certain practices had unique attributes that made them ad-ditionally attractive for more in-depth case study examina-tion, including:
• Innovative institutional and funding arrangements be-tween local and regional agencies
• Available data to measure the costs or ridership im-pacts of recent projects
• Complex institutional environment where recent re-gional coordination efforts have focused on reversing trends that have led to fragmenting the region’s transit system
• Numerous cooperative projects in a single region• Unique examples of joint operation of transit service• Ongoing activities among local agencies that pre-dat-
ed the rise of new regional entity that is attempting to implement service integration
Case StudiesHighlights are provided from three of the eight case studies conducted during the project.
Transit Agencies See Benefits from Integrating Services Mark A. MillerCalifornia PATH
�Intellimotionvol. 11 no. 3 2005
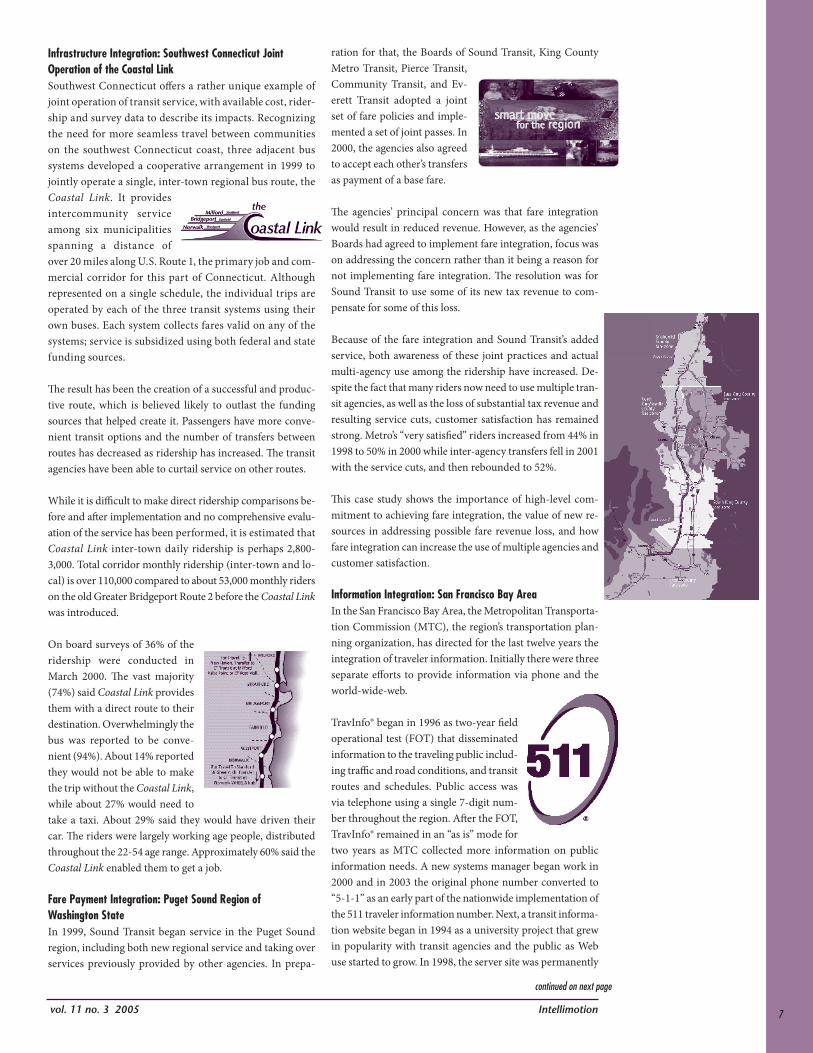
Infrastructure Integration: Southwest Connecticut Joint Operation of the Coastal LinkSouthwest Connecticut offers a rather unique example of joint operation of transit service, with available cost, rider-ship and survey data to describe its impacts. Recognizing the need for more seamless travel between communities on the southwest Connecticut coast, three adjacent bus systems developed a cooperative arrangement in 1999 to jointly operate a single, inter-town regional bus route, the Coastal Link. It provides intercommunity service among six municipalities spanning a distance of over 20 miles along U.S. Route 1, the primary job and com-mercial corridor for this part of Connecticut. Although represented on a single schedule, the individual trips are operated by each of the three transit systems using their own buses. Each system collects fares valid on any of the systems; service is subsidized using both federal and state funding sources.
The result has been the creation of a successful and produc-tive route, which is believed likely to outlast the funding sources that helped create it. Passengers have more conve-nient transit options and the number of transfers between routes has decreased as ridership has increased. The transit agencies have been able to curtail service on other routes.
While it is difficult to make direct ridership comparisons be-fore and after implementation and no comprehensive evalu-ation of the service has been performed, it is estimated that Coastal Link inter-town daily ridership is perhaps 2,800-3,000. Total corridor monthly ridership (inter-town and lo-cal) is over 110,000 compared to about 53,000 monthly riders on the old Greater Bridgeport Route 2 before the Coastal Link was introduced.
On board surveys of 36% of the ridership were conducted in March 2000. The vast majority (74%) said Coastal Link provides them with a direct route to their destination. Overwhelmingly the bus was reported to be conve-nient (94%). About 14% reported they would not be able to make the trip without the Coastal Link, while about 27% would need to take a taxi. About 29% said they would have driven their car. The riders were largely working age people, distributed throughout the 22-54 age range. Approximately 60% said the Coastal Link enabled them to get a job.
Fare Payment Integration: Puget Sound Region of Washington StateIn 1999, Sound Transit began service in the Puget Sound region, including both new regional service and taking over services previously provided by other agencies. In prepa-
ration for that, the Boards of Sound Transit, King County Metro Transit, Pierce Transit, Community Transit, and Ev-erett Transit adopted a joint set of fare policies and imple-mented a set of joint passes. In 2000, the agencies also agreed to accept each other’s transfers as payment of a base fare.
The agencies’ principal concern was that fare integration would result in reduced revenue. However, as the agencies’ Boards had agreed to implement fare integration, focus was on addressing the concern rather than it being a reason for not implementing fare integration. The resolution was for Sound Transit to use some of its new tax revenue to com-pensate for some of this loss.
Because of the fare integration and Sound Transit’s added service, both awareness of these joint practices and actual multi-agency use among the ridership have increased. De-spite the fact that many riders now need to use multiple tran-sit agencies, as well as the loss of substantial tax revenue and resulting service cuts, customer satisfaction has remained strong. Metro’s “very satisfied” riders increased from 44% in 1998 to 50% in 2000 while inter-agency transfers fell in 2001 with the service cuts, and then rebounded to 52%.
This case study shows the importance of high-level com-mitment to achieving fare integration, the value of new re-sources in addressing possible fare revenue loss, and how fare integration can increase the use of multiple agencies and customer satisfaction.
Information Integration: San Francisco Bay AreaIn the San Francisco Bay Area, the Metropolitan Transporta-tion Commission (MTC), the region’s transportation plan-ning organization, has directed for the last twelve years the integration of traveler information. Initially there were three separate efforts to provide information via phone and the world-wide-web.
TravInfo® began in 1996 as two-year field operational test (FOT) that disseminated information to the traveling public includ-ing traffic and road conditions, and transit routes and schedules. Public access was via telephone using a single 7-digit num-ber throughout the region. After the FOT, TravInfo® remained in an “as is” mode for two years as MTC collected more information on public information needs. A new systems manager began work in 2000 and in 2003 the original phone number converted to “5-1-1” as an early part of the nationwide implementation of the 511 traveler information number. Next, a transit informa-tion website began in 1994 as a university project that grew in popularity with transit agencies and the public as Web use started to grow. In 1998, the server site was permanently
continued on next page
8 Intellimotion vol. 11 no. 3 2005
re-located to MTC. Lastly, the transit itinerary planner was originally part of another project that MTC implemented for use by information operators at transit agency call centers. In 2001, MTC developed a Web interface for it.
These three separate integration activities matured and merged when, in 2003 the single integrated information source via phone (5-1-1) or web (www.511.org) from all the region’s transit agencies was complete. MTC has evalu-ated the usage of and level of customer satisfaction for 511 services via surveys and focus groups, however, there has not yet been an assessment of behavioral/ridership changes. Customer satisfaction is very high for both phone and web services especially relative to the accuracy of public transpor-tation information received by phone, the easy-to-remember web address, the simple and straightforward process of navi-gating the web for experienced users, and a very useful trip planner. Improvements, however, are needed including more links and fewer clicks.
Lessons Learned And ConclusionsService integration experiences have taught participating agencies several lessons:
• Having a regional transit agency champion of integra-tion, while certainly beneficial, is not a prerequisite to successful implementation
• There are multiple tradeoffs among the number of par-ticipating organizations, level of customer benefits, and the complexity of institutional issues
• Incremental and small steps are favored over a do-all-at-once approach
• Coordinated schedules involve a convenience versus productivity tradeoff
• User training is essential with new fare payment tech-nologies
• Alternatives should be considered when dealing with a proprietary fare technology controlled by a single ven-dor
• It is difficult for a single agency to regulate discounted fare media in an integrated environment
• Revenue neutrality and costs are key concerns for agen-cies introducing integrated fare payment
• A regional authority, if it exists, does not necessarily have to use a “stick”, e.g., withholding of state funding
from operators unwilling to cooperate with regional service integration efforts, to promote fare payment integration
• Dry-runs are essential to hone skills for special events and emergencies
Using these lessons as an integral part of an agency’s ap-proach can help overcome certain barriers it is likely to encounter and help foster successful integration practices. Overall, customers appear satisfied with transit service inte-gration practices and there is a strong sense among transit managers that customer level of service has improved and ridership has increased as a result. It has, however, due to exogenous factors, been difficult to attribute specific benefits to particular integration practices. To be able to objectively and quantitatively evaluate the effectiveness of a particular service integration practice will require better data. This is an area where transit agencies must take a pro-active role. The measures of performance and data requirements will vary by service integration type.
The author would like to acknowledge his colleagues at Tran-Systems Corporation (Medford, MA) for their enormously valuable contribution to the research project reported on in this article. The author would also like to acknowledge Cal-trans Division of Research and Innovation for sponsoring this research. •
References1. Giuliano, G., et al, “San Gabriel Valley Smart Shuttle Tech-
nology (SGVSST) Field Operational Test Evaluation: Final Report”, California PATH Research Report, California PATH Program, University of California, Berkeley, UCB-ITS-PRR-2002-5, February 2002.
2. Transit Cooperative Research Program, “TCRP Report 53. New Paradigms for Local Public Transportation Organi-zations. Task 1 Report: Forces and Factors that Require Consideration of New Paradigms”, Transportation Research Board, National Research Council and Federal Transit Administration, Washington, D.C. 2000.
3. Transit Cooperative Research Program, “TCRP Report 58. New Paradigms for Local Public Transportation Organiza-tions. Task 5 Report: Opening the Door to Fundamental Change”, Transportation Research Board, National Research Council and Federal Transit Administration, Wash-ington, D.C. 2000.
4. Miller, M.A., L.S. Englisher, R. Halvorsen, and B. Kaplan, “Transit Service Integration Practices: An Assessment of U.S. Experiences”, California PATH Program, University of California, Berkeley, UCB-ITS-PRR-2005-7, March 2005.
However, a research process that is only “bottom-up” runs the risk of becoming too focused on solving the day-to-day problems of the organization and missing the opportunities provided by taking a more strategic, longer-term view. This is why PATH has taken a more active role in helping Caltrans synthesize its various research needs into cohesive and sus-tained research programs. Examples of such programs are PATH’s research in traffic performance measurement and operational strategies, bus rapid transit, intersection safety and smart parking.
At the same time, PATH continues to fund, small innovative research topics, proposed by the faculty and researchers, to explore new ideas that are not on Caltrans’ radar screen yet. This combination of customer-driven research topics, pro-grammatic organization by PATH, and faculty-defined ideas makes it possible to maintain a research agenda that is both relevant and of high-quality.
I look forward to PATH’s continuing success under the lead-ership of Dr. Alex Skabardonis. I am confident that he will take the center to bigger and better achievements. •
continued from page 1Samer
9Intellimotionvol. 11 no. 3 2005
Traffic simulation models offer significant potential for evaluating existing operating conditions on transportation facilities, and analyzing alternative
operational and ITS improvements. However, after 35 years of development and application of traffic simulation tools, there are still gaps in the functionality of traffic simulation tools that require new algorithm development. Further-more, the algorithms used in existing models have not been properly validated due to the lack of comprehensive datasets on vehicle movement and interactions.
In response to these needs, the Next Generation Simulation (NGSIM) program was initiated by the Federal Highway Administration (FHWA). The objective of NGSIM is to de-velop behavioral algorithms in support of microscopic traffic simulation, with supporting documentation and validation data sets.
Data requirements for validating microscopic simulation algorithms (e.g., car-following or lane-changing) consist of vehicle trajectories over extended freeway segments under various traffic conditions (from free-flow to congestion). Vehicle trajectories can be manually extracted from video recordings, which is a very time consuming and expensive process or automatically using a machine vision algorithm.
Following a comprehensive survey of existing machine vi-sion algorithms worldwide, the NGSIM team selected the algorithms produced as part of ongoing research at PATH to produce a prototype data set of vehicle trajectories and to assess the viability of emerging technologies to automate the trajectory generation process.
For over a decade, researchers at UC Berkeley have collected and processed video data. One valuable result is the Berkeley Highway Lab (BHL), a unique testbed for collecting traffic
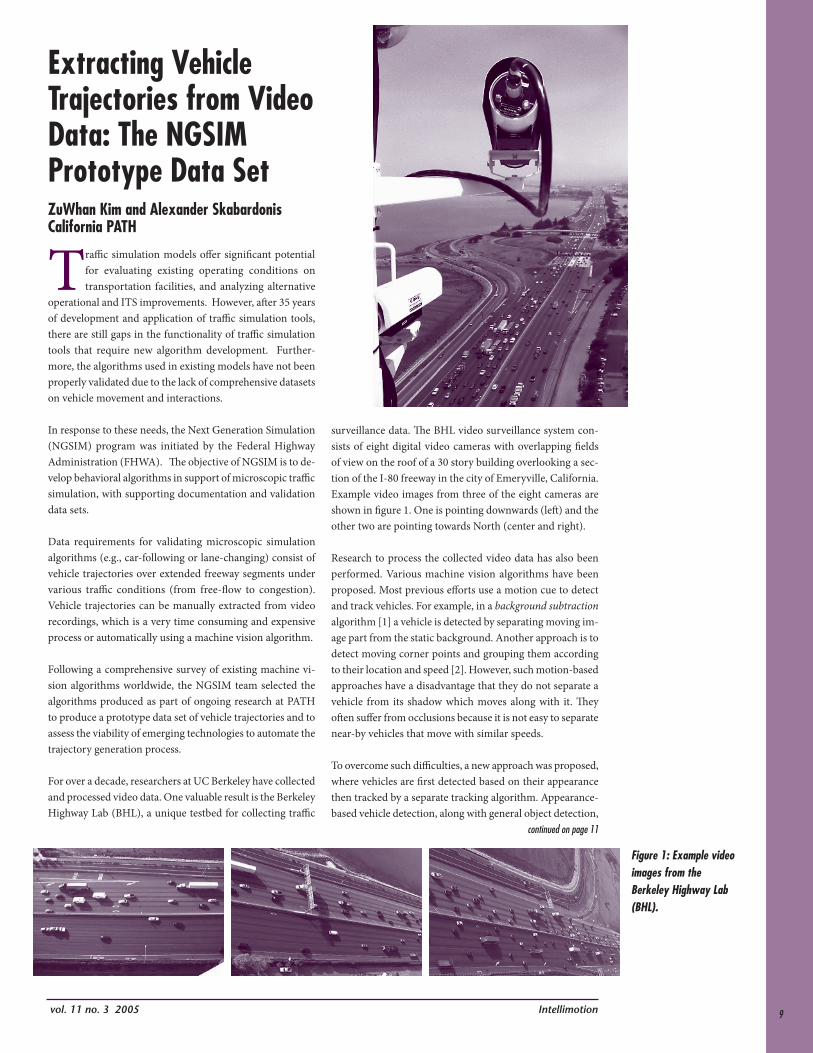
surveillance data. The BHL video surveillance system con-sists of eight digital video cameras with overlapping fields of view on the roof of a 30 story building overlooking a sec-tion of the I-80 freeway in the city of Emeryville, California. Example video images from three of the eight cameras are shown in figure 1. One is pointing downwards (left) and the other two are pointing towards North (center and right).
Research to process the collected video data has also been performed. Various machine vision algorithms have been proposed. Most previous efforts use a motion cue to detect and track vehicles. For example, in a background subtraction algorithm [1] a vehicle is detected by separating moving im-age part from the static background. Another approach is to detect moving corner points and grouping them according to their location and speed [2]. However, such motion-based approaches have a disadvantage that they do not separate a vehicle from its shadow which moves along with it. They often suffer from occlusions because it is not easy to separate near-by vehicles that move with similar speeds.
To overcome such difficulties, a new approach was proposed, where vehicles are first detected based on their appearance then tracked by a separate tracking algorithm. Appearance-based vehicle detection, along with general object detection,
Figure 1: Example video images from the Berkeley Highway Lab (BHL).
Extracting Vehicle Trajectories from Video Data: The NGSIM Prototype Data SetZuWhan Kim and Alexander SkabardonisCalifornia PATH
continued on page 11
10 Intellimotion vol. 11 no. 3 2005
Get on the Mailing List!FAX, mail or e-mail us the following information for a free subscription to Intellimotion: Name & Title Address E-mail address
If you wish to be notified by email when the next issue is ready online, and not receive a paper copy, please let us know.
Please mention the Intellimotion mailing list. See this page for our address and fax number.
Due to mailing costs we can no longer send paper copies inter-nationally. Please send us your email and we will notify you when the next issue is ready online.
Improved Grade Crossing Safety with In-Pavement Warning Lights, Theodore E. Cohn, 60 pp, UCB-ITS-PRR-2005-10
California Intersection Decision Support: A Systems Approach to Achieve Nationally Interoperable Solutions, Ching-Yao Chan, et al, 218 pp, UCB-ITS-PRR-2005-11
Development of the Capability-Enhanced PARAMICS Simulation Environment, Lianyu Chu, Henry Liu, Michael McNally, Will Recker, 114 pp, UCB-ITS-PRR-2005-12
Dynamic Path-Based Equilibrium Assignment With Microscopic Traffic Simulation, Henry Liu, Lianyu Chu, Will Recker, 17 pp, UCB-ITS-PRR-2005-13
Estimating and Validating Models of Microscopic Driver Behavior with Video Data, Alex Skabardonis, 43 pp, UCB-ITS-PRR-2005-14
Safety Performance and Robustness of Heavy Vehicle AVCS, R. Jemonde Taylor, Paul Yih, J. Christen Gerdes, 30 pp, UCB-ITS-PRR-2005-15
Mobile Traffic Management System Test Deployment, Jeffrey Brian Gerfen, 31 pp, UCB-ITS-PRR-2005-16
Freeway Analysis Manual: Parts 1 and 2, Dolf May, Lannon Leiman, 70 pp, UCB-ITS-PRR-2005-17
High Coverage Point to Point Transit (HCPPT): A New Design Concept and Simulation - Evaluation of Operational Schemes, R. Jayakrishnan, Cristian E. Cortes, Laia Pages, Riju Lavanya, Amelia C. Regan, 280 pp, UCB-ITS-PRR-2005-18
Safety Assessment of Advanced Vehicle Control and Safety Systems (AVCSS), Ching-Yao Chan, 106 pp, UCB-ITS-PRR-2005-19
The Naturalistic Driver Model: Development, Integration, and Verification of Lane Change Maneuver, Driver Emergency and Impairment Modules, Delphine Cody, Swekuang Tan, Jeff K. Caird, M. Lees, C. Edwards, 69 pp, UCB-ITS-PRR-2005-20
Human Driver Model Development, Delphine Cody, Swekuang Tan, Aurelien Garcia, 88 pp, UCB-ITS-PRR-2005-21
Spatial and Temporal Utility Modeling to Increase Transit Ridership, Richard L. Church, Val Noronha, Ting Lei, Wils Corrigan, Shaunna Burbidge, Jim Marston, 77 pp, UCB-ITS-PRR-2005-22
Demonstration of Automated Heavy-Duty Vehicles, Steven E. Shladover, Xiao-Yun Lu, Bongsob Song, Susan Dickey, Christopher Nowakowski, Adam Howell, Fanping Bu, David Marco, Han-Shue Tan, David Nelson, 459 pp, UCB-ITS-PRR-2005-23
Berkeley Highway Laboratory Project: Final Report, Dolf May, Randall Cayford, Lannon Leiman, Greg Merritt, 303 pp, UCB-ITS-PRR-2005-24
PATH on PaperAn Updated List of PATH Research Publications
PATH publications (which include research re-ports, working papers, technical memoranda, and technical notes) can be obtained from:
Institute of Transportation Studies Publica-tions OfficeUniversity of California109 McLaughlin HallBerkeley, CA 94720-1720
510-642-3558, FAX: 510-642-1246
http://www.its.berkeley.edu/publications/publications.html
A searchable database of PATH publications is available via the PATH World Wide Web site at:http://www.path.berkeley.edu
All papers available online at:http://www.path.berkeley.edu/PATH/Publications/index.html
11Intellimotionvol. 11 no. 3 2005
continued from page 9
has long been an important research topic in machine vision, and various appearance-based vehicle detection algorithms have been proposed. However, most require too much com-putation for realtime or pseudo-realtime applications. Al-though the vehicle trajectory generation is not a realtime application, it still requires fast processing for the following reasons. First, it needs to process a huge amount of video data. Second, it requires human supervision to ensure a complete set of trajectories, and a slow running system will cost more human operator’s time.
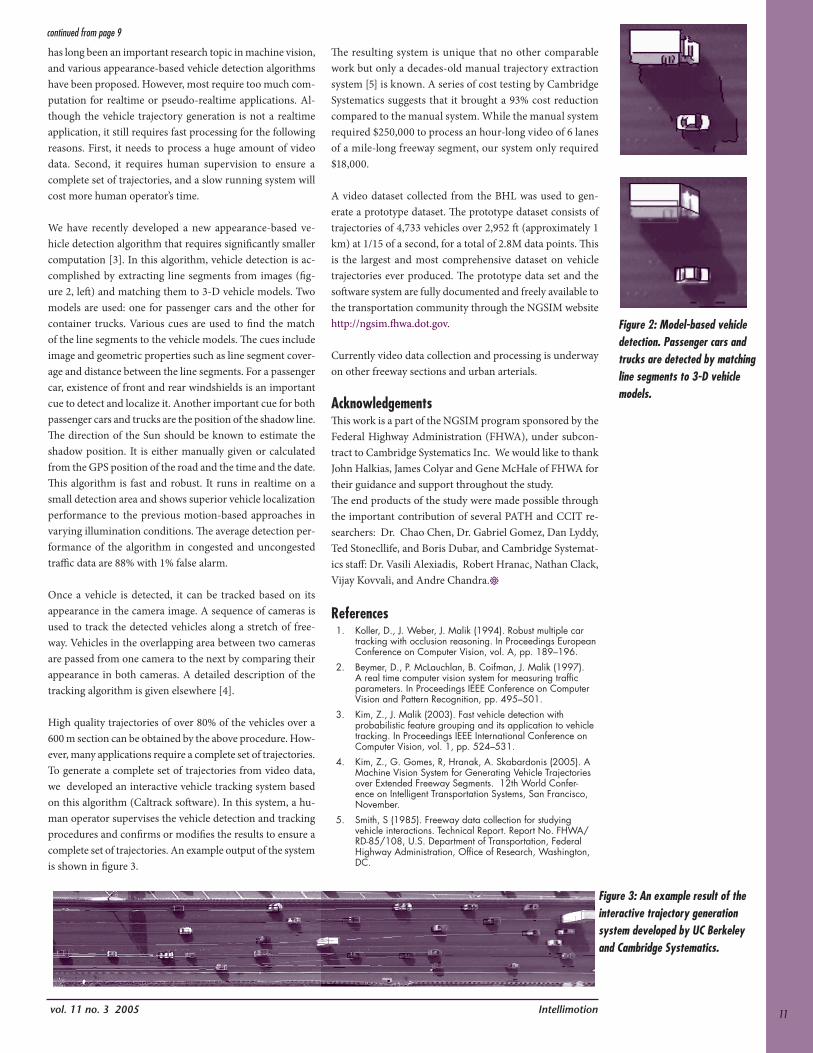
We have recently developed a new appearance-based ve-hicle detection algorithm that requires significantly smaller computation [3]. In this algorithm, vehicle detection is ac-complished by extracting line segments from images (fig-ure 2, left) and matching them to 3-D vehicle models. Two models are used: one for passenger cars and the other for container trucks. Various cues are used to find the match of the line segments to the vehicle models. The cues include image and geometric properties such as line segment cover-age and distance between the line segments. For a passenger car, existence of front and rear windshields is an important cue to detect and localize it. Another important cue for both passenger cars and trucks are the position of the shadow line. The direction of the Sun should be known to estimate the shadow position. It is either manually given or calculated from the GPS position of the road and the time and the date. This algorithm is fast and robust. It runs in realtime on a small detection area and shows superior vehicle localization performance to the previous motion-based approaches in varying illumination conditions. The average detection per-formance of the algorithm in congested and uncongested traffic data are 88% with 1% false alarm.
Once a vehicle is detected, it can be tracked based on its appearance in the camera image. A sequence of cameras is used to track the detected vehicles along a stretch of free-way. Vehicles in the overlapping area between two cameras are passed from one camera to the next by comparing their appearance in both cameras. A detailed description of the tracking algorithm is given elsewhere [4].
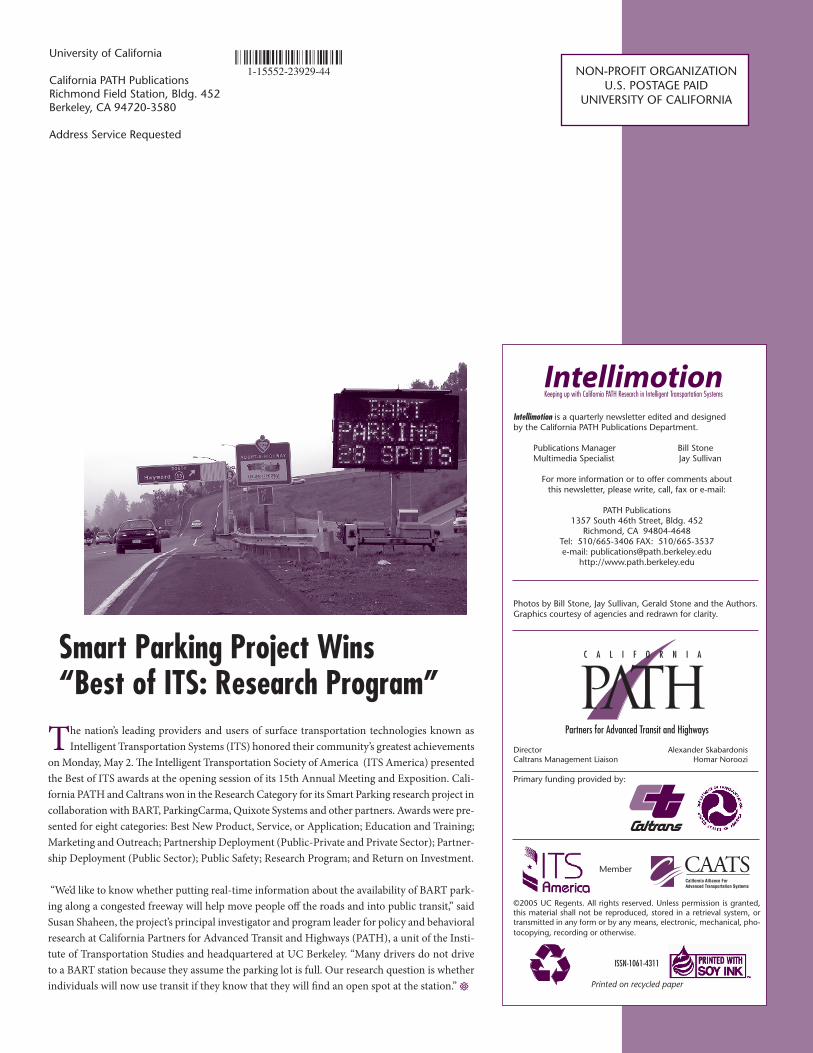
High quality trajectories of over 80% of the vehicles over a 600 m section can be obtained by the above procedure. How-ever, many applications require a complete set of trajectories. To generate a complete set of trajectories from video data, we developed an interactive vehicle tracking system based on this algorithm (Caltrack software). In this system, a hu-man operator supervises the vehicle detection and tracking procedures and confirms or modifies the results to ensure a complete set of trajectories. An example output of the system is shown in figure 3.
The resulting system is unique that no other comparable work but only a decades-old manual trajectory extraction system [5] is known. A series of cost testing by Cambridge Systematics suggests that it brought a 93% cost reduction compared to the manual system. While the manual system required $250,000 to process an hour-long video of 6 lanes of a mile-long freeway segment, our system only required $18,000.
A video dataset collected from the BHL was used to gen-erate a prototype dataset. The prototype dataset consists of trajectories of 4,733 vehicles over 2,952 ft (approximately 1 km) at 1/15 of a second, for a total of 2.8M data points. This is the largest and most comprehensive dataset on vehicle trajectories ever produced. The prototype data set and the software system are fully documented and freely available to the transportation community through the NGSIM website http://ngsim.fhwa.dot.gov.
Currently video data collection and processing is underway on other freeway sections and urban arterials.
AcknowledgementsThis work is a part of the NGSIM program sponsored by the Federal Highway Administration (FHWA), under subcon-tract to Cambridge Systematics Inc. We would like to thank John Halkias, James Colyar and Gene McHale of FHWA for their guidance and support throughout the study. The end products of the study were made possible through the important contribution of several PATH and CCIT re-searchers: Dr. Chao Chen, Dr. Gabriel Gomez, Dan Lyddy, Ted Stonecllife, and Boris Dubar, and Cambridge Systemat-ics staff: Dr. Vasili Alexiadis, Robert Hranac, Nathan Clack, Vijay Kovvali, and Andre Chandra.•
References1. Koller, D., J. Weber, J. Malik (1994). Robust multiple car
tracking with occlusion reasoning. In Proceedings European Conference on Computer Vision, vol. A, pp. 189–196.
2. Beymer, D., P. McLauchlan, B. Coifman, J. Malik (1997). A real time computer vision system for measuring traffic parameters. In Proceedings IEEE Conference on Computer Vision and Pattern Recognition, pp. 495–501.
3. Kim, Z., J. Malik (2003). Fast vehicle detection with probabilistic feature grouping and its application to vehicle tracking. In Proceedings IEEE International Conference on Computer Vision, vol. 1, pp. 524–531.
4. Kim, Z., G. Gomes, R, Hranak, A. Skabardonis (2005). A Machine Vision System for Generating Vehicle Trajectories over Extended Freeway Segments. 12th World Confer-ence on Intelligent Transportation Systems, San Francisco, November.
5. Smith, S (1985). Freeway data collection for studying vehicle interactions. Technical Report. Report No. FHWA/RD-85/108, U.S. Department of Transportation, Federal Highway Administration, Office of Research, Washington, DC.
Figure 3: An example result of the interactive trajectory generation system developed by UC Berkeley and Cambridge Systematics.
Figure 2: Model-based vehicle detection. Passenger cars and trucks are detected by matching line segments to 3-D vehicle models.
Member
Intellimotion is a quarterly newsletter edited and designed by the California PATH Publications Department.
Publications Manager Bill Stone Multimedia Specialist Jay Sullivan
For more information or to offer comments about this newsletter, please write, call, fax or e-mail:
PATH Publications1357 South 46th Street, Bldg. 452
Richmond, CA 94804-4648Tel: 510/665-3406 FAX: 510/665-3537e-mail: [email protected]
http://www.path.berkeley.edu
Photos by Bill Stone, Jay Sullivan, Gerald Stone and the Authors.Graphics courtesy of agencies and redrawn for clarity.
Partners for Advanced Transit and Highways
Director Alexander SkabardonisCaltrans Management Liaison Homar Noroozi
Primary funding provided by:
©2005 UC Regents. All rights reserved. Unless permission is granted, this material shall not be reproduced, stored in a retrieval system, or transmitted in any form or by any means, electronic, mechanical, pho-tocopying, recording or otherwise.
ISSN-1061-4311
Printed on recycled paper
NON-PROFIT ORGANIZATIONU.S. POSTAGE PAID
UNIVERSITY OF CALIFORNIA
University of California
California PATH PublicationsRichmond Field Station, Bldg. 452Berkeley, CA 94720-3580
Address Service Requested
1-15552-23929-44
The nation’s leading providers and users of surface transportation technologies known as Intelligent Transportation Systems (ITS) honored their community’s greatest achievements
on Monday, May 2. The Intelligent Transportation Society of America (ITS America) presented the Best of ITS awards at the opening session of its 15th Annual Meeting and Exposition. Cali-fornia PATH and Caltrans won in the Research Category for its Smart Parking research project in collaboration with BART, ParkingCarma, Quixote Systems and other partners. Awards were pre-sented for eight categories: Best New Product, Service, or Application; Education and Training; Marketing and Outreach; Partnership Deployment (Public-Private and Private Sector); Partner-ship Deployment (Public Sector); Public Safety; Research Program; and Return on Investment.
“We’d like to know whether putting real-time information about the availability of BART park-ing along a congested freeway will help move people off the roads and into public transit,” said Susan Shaheen, the project’s principal investigator and program leader for policy and behavioral research at California Partners for Advanced Transit and Highways (PATH), a unit of the Insti-tute of Transportation Studies and headquartered at UC Berkeley. “Many drivers do not drive to a BART station because they assume the parking lot is full. Our research question is whether individuals will now use transit if they know that they will find an open spot at the station.” •
Smart Parking Project Wins“Best of ITS: Research Program”

![Õ V>Ì ÃÊÊ -ÞÃÌi Ê > ÞâiÀà - Freedom CT · 2020. 10. 22. · / iÊ iÜÊ,ÓÈääÊ-iÀ iÃ]Ê V Õ` }Ê,ÓÈää]Ê,ÓÈÓxÊ> `Ê,ÓÈÇä Õ V>Ì ÃÊÊ-ÞÃÌi Ê](https://img.pdfslide.us/doc/110x75/612d1a411ecc51586941faff/-voe-f-foei-if-freedom-ct-2020-10-22-i.jpg)
![4!,%/&/.4% - Future City Competition · w }iÀÌ «Ã°Ê9 ÕÀÊV ÌÞÊÃÌ>Ì ÃÌ V > ÃÊÜ À ÊÌ Ài iÃà ÞÊÌ Ê«À Û `iÊÞ ÕÊÜ Ì Ê`>Ì>]Ê}À>« Ã]](https://img.pdfslide.us/doc/110x75/5ae5eee47f8b9a8b2b8c905e/44-future-city-i-9-v-v-i-i-i-.jpg)
![* Ê ,/] * Ê ] · i Ì> Ê i> Ì Ê-iÀÛ viÃÊ vÌÊ Ê vÌ !lmansor#ourt 3 !lmansor3t !lhambra #alifornia 7ednesday /ctober !-n 0-](https://img.pdfslide.us/doc/110x75/60c66d7c3c847420d37b70d1/-i-oe-i-oe-i-vif-voe-voe-lmansorourt.jpg)
![CCCC----19119919 &É Û%Ê'22 /õ 5 %Ê'2 B Ý Ì i&É Û%Ê'22 /õ 5 · ] ' ] ] ' ' ] 'CCCC----19119919 &É Û%Ê'22 /õ 5 %Ê'2 B Ý Ì i&É Û%Ê'22 /õ 5 %Ê'2 B Ý Ì i ¹ B>0>1](https://img.pdfslide.us/doc/110x75/5fd823604c255a262857fc41/cccc-19119919-22-5-2-b-oe-i-22-5-.jpg)
![ÀiÜ À` - Glasgow Airport · -V Ì > `ÊÜi V iÃÊ>À Õ `Ê£xÊ Ê1 Ê> `Ê ÛiÀÃi>ÃÊÛ Ã Ì ÀÃ iÛiÀÞÊÞi>À]Ê}i iÀ>Ì }ÊÃ iÊË{L Êv ÀÊÌ iÊiV ÞÊ> `](https://img.pdfslide.us/doc/110x75/6032140f054f565a9814f46f/ioe-glasgow-airport-v-oe-oei-v-if-x-1-.jpg)


![CCCC----19119919 &É Û%Ê'22 /õ 5 %Ê'2 B Ý Ì i&É Û%Ê'22 /õ … · ] ' ] ] ' ' ] 'CCCC----19119919 &É Û%Ê'22 /õ 5 %Ê'2 B Ý Ì i&É Û%Ê'22 /õ 5 %Ê'2 B Ý Ì i ¹](https://img.pdfslide.us/doc/110x75/5b0d917f7f8b9a952f8db035/cccc-19119919-22-5-2-b-i-22-cccc-19119919-22-5.jpg)


![Ê V>`i ÞÊ-Ì>Ìi v Ì i -V i ViÊ viÀi Vi€ V> Ê V>`i ÞÊ vÊ"ÀÌ Ì ÃÌÃÊ> `Ê*À ÃÌ iÌ ÃÌÃÊNÊxÓÈÊ }Ê-Ì]Ê-ÌiÊÓä£ÊNÊ iÝ> `À >]Ê6 ÊÓÓΣ{ÊNÜÜÜ°](https://img.pdfslide.us/doc/110x75/5b0a3a9d7f8b9ae61b8bc4b8/vi-i-v-i-v-i-vi-vii-vi-v-vi-v-i-nx-in-i-6-n-.jpg)


![>ÀÌÊEÊ Àii Ê Õ ` }Ê Ê Ê ÊÊÊÊ ià } ]Ê ÃÌÀÕVÌ ÊEÊ > >}i i Ì · PDF file- >ÀÌÊEÊ Àii Ê Õ ` }Ê Ê Ê ÊÊÊÊ ià } ]Ê ÃÌÀÕVÌ ÊEÊ > >}i i Ì Registration](https://img.pdfslide.us/doc/110x75/5aba34ed7f8b9aa6018ec7de/-e-ii-i-v-e-i-i-e-ii-i-v-e-i-i-registration-form-the-hkie-.jpg)