Embed Size (px)
Citation preview
Scientific Papers of the R.I.F.G. Pitesti, Vol. XXVI, 2010_________________________________________________
55
II. TEHNOLOGII POMICOLE DURABILE – PROTECŢIA MEDIULUI FRUIT SUSTAINABLE TECHNOLOGIES – ENVIRONMENT PROTECTION ANALIZA RISCULUI DE EROZIUNE IN ZONELE HORTICOLE FOLOSIND PROGRAME GRATUITE SI MODELE DIGITALE EROSION RISK ANALYSIS IN HORTICULTURAL AREAS USING FREE SOFTWARE AND DIGITAL MODELS
Petru Cârdei, Virgil Muraru, Raluca Sfiru, Ion Pirna INMA Bucharest Abstract
This paper present result obtained using a method of analysis included in the MPREPAT Methodology in aim to assess of the soil erosion and landslide risk. MPREPAT is the Methodology for prognosis of the soil sheet erosion and landslide risk and for prevention and remediation of these phenomena. These results are obtained for the geographic zone of Maracineni and ICDVV Valea Calugarească territory. Keywords: Soil, Erosion, Risk, Analysis Cuvinte cheie : Sol, Eroziune, Risc, Analiza 1. Introduction
The prognosis of the risk of erosion of agricultural land is an activity that comes to support land management, in direct connection with natural resource conservation and agricultural production. The prognosis risk of erosion is also a method of prevention, indicating an annual rate of erosion and its spatial distribution. The map of the soil erosion risk spatial distribution indicates locations where land managers need additional preventive actions or corrective actions. These maps have become the tools necessary for modern land management. Method of risk analysis and remedial actions based on it are tools of precision agriculture management. Since the method used in this work includes analysis of the risk of landslides we consider useful and appropriate presentation of the results of this phenomenon. The method used was developed in a research project in partnership INMA, ICDVV, ICPA and PUB-CCEPM. 2. Material and methods
The method used to create maps presented in this paper, is described partly in INMA, 2010 and fully by Sfiru et. al., 2010.
For the marking of territories mapped is used a GPS device. We used Google Earth (free version) to select area of interest marked. With AutoCAD Civil 3D maps we extract from the archive of the Google Earth image area of interest, as well as information on terrain elevation. It was then used AutoCAD Civil 3D to generate digital models (DEM) as tiff files. These files were processed using Matlab and Mathcad programs obtaining terrain elevation map and the spatial distribution of the land slope. Using these geometric features of the land was calculated amount of soil lost by erosion using USLE model, Wischmeier and Smith, 1978, and the safety factor of slopes using the Coulomb model for non-cohesive soil, like Pantelidis, 2008 or Manandhar, 2007. The two measures of risk of the two phenomena were calculated for each cell (20x20 m) corresponding to 20 m resolution that we agreed to obtain a digital model.
For the USLE model parameters we took the following values: rain erosivity, R = 587 kg m s-4, soil erodibility, K = 0.033 m-3s3, soil management factor, C1 = 0.7, vegetation factor, C2=0.19. The soil internal friction angle (used to calculate landslide risk) got value 23o, Mihai and Ionescu, 1968, for example. These values are average values, are considered acceptable for the small area compared to areas in which these parameters vary appreciably.
If they accept a smaller geometric precision, this procedure can be performed entirely by free software. Is using Google Earth software, free version. Is obtaining maps of the type shown in Figure 9 and Figure 10. Accuracy is much smaller than when using DEM models, but the work time is appreciably longer.
Scientific Papers of the R.I.F.G. Pitesti, Vol. XXVI, 2010_________________________________________________
56
3. Results and discussion
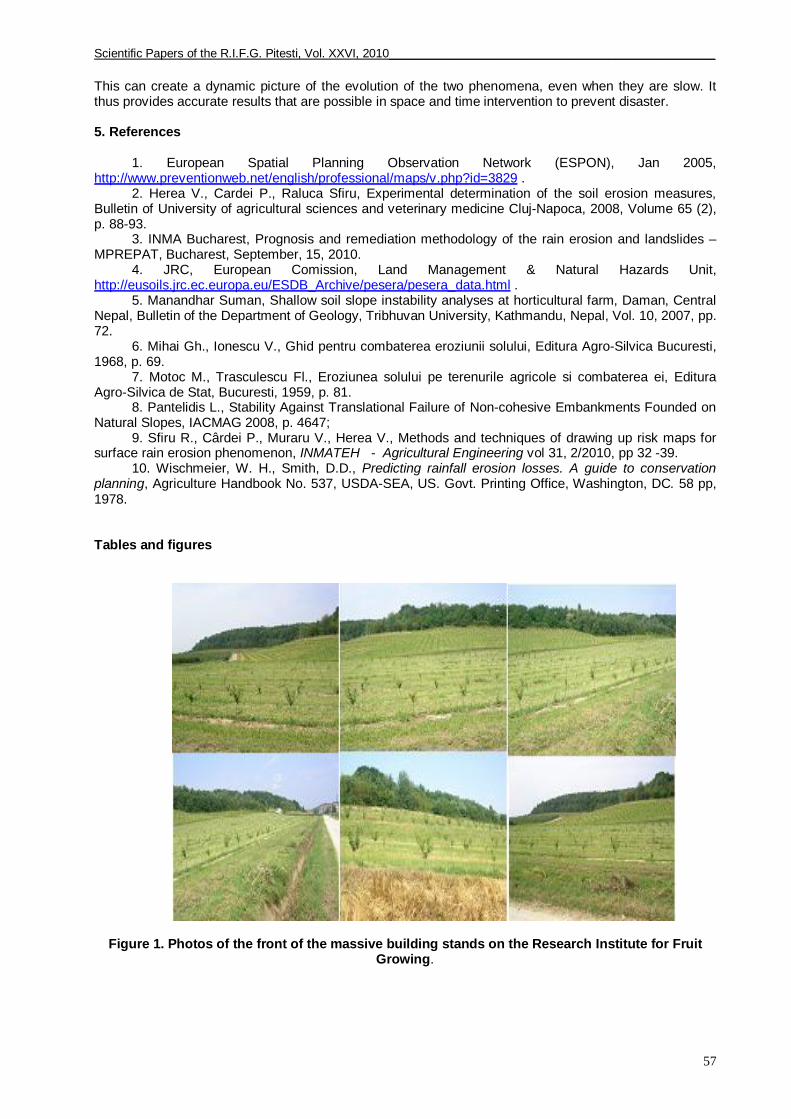
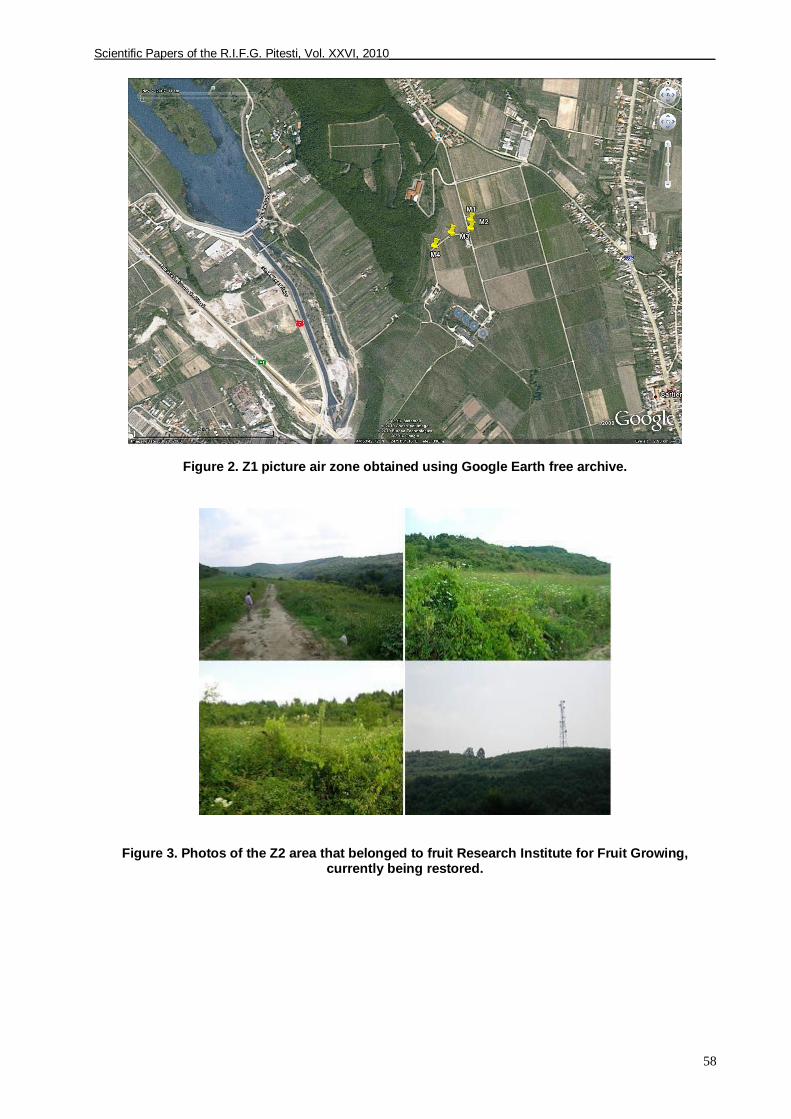
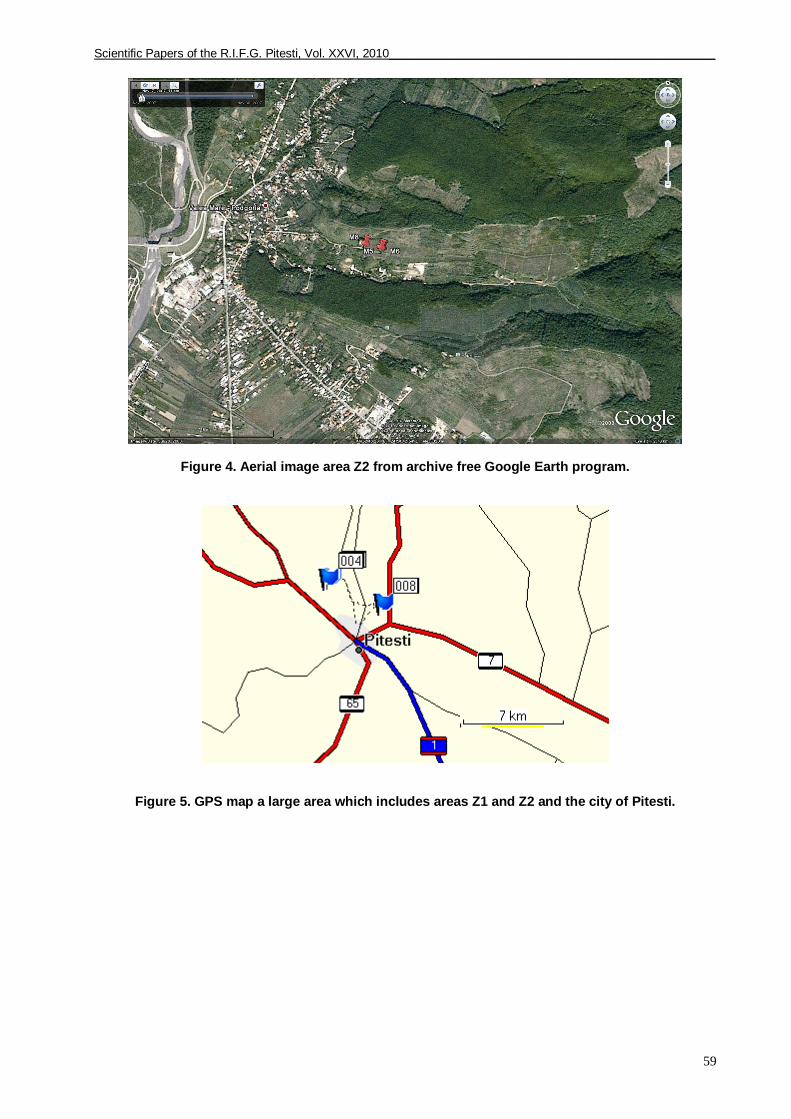
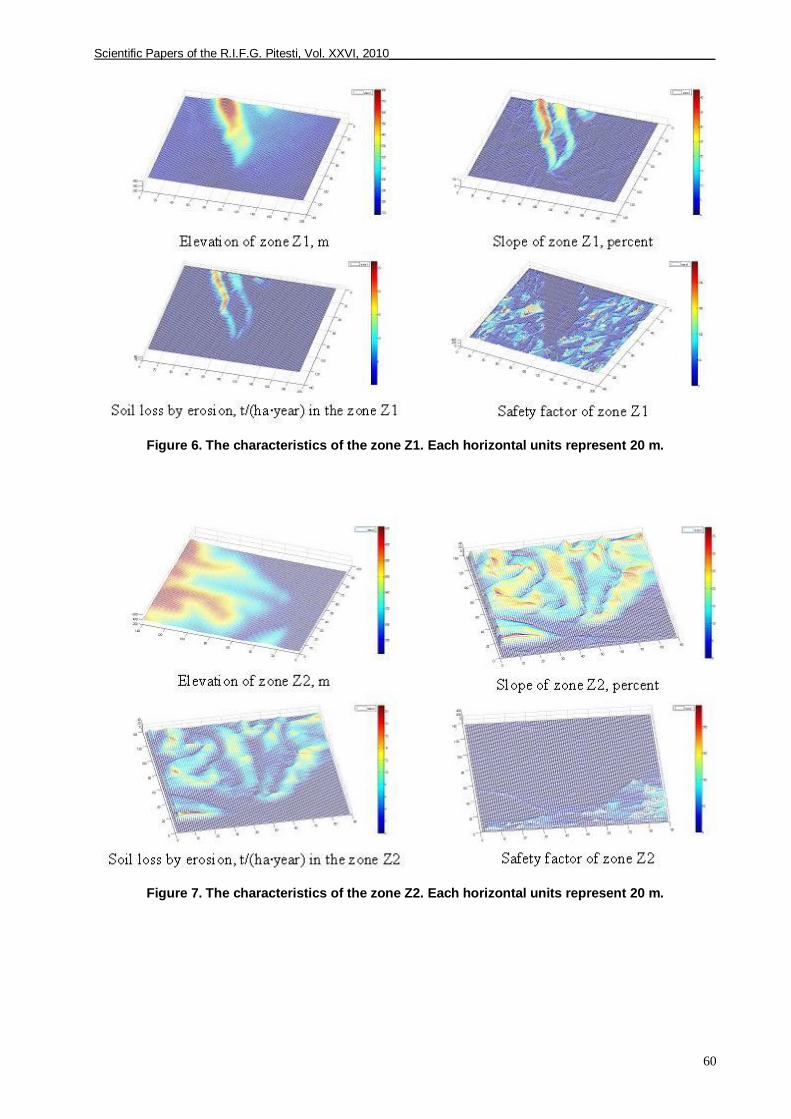
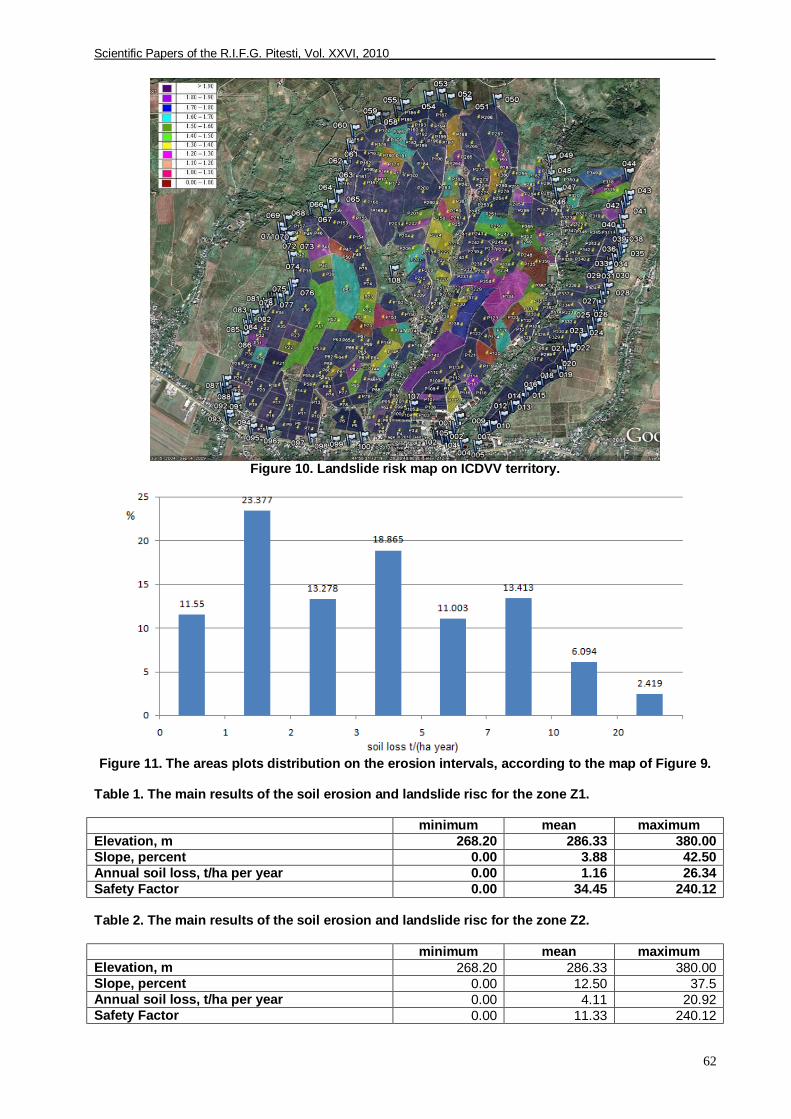
For example, the method was applied to two areas prone to erosion or / and landslides near the village Mărăcineni. The first area, which will mark the Z1, includes massive soil on which it stands the Central Research Institute fruit. Images of the front of the hill that stands Research Institute for Fruit Growing are given in Figure 1. An aerial image of Z1 zone is given in Figure 2, were extracted from GIS archive free Google Earth program. A second area examined, which is denoted Z2, is located near the city of Pitesti and Research Institute for Fruit Growing. Photos of the area Z2 appear in Figure 3. Z2 zone air picture obtained from the archive free Google Earth program is given in Figure 4. Identifiers points of the two areas were marked using a GPS device. They marked four points in each area. List items and their geographical coordinates appear in the list below. In Figure 5 is given the map provided by GPS, the Z1 and Z2 zones marks appear and their locations in relation to Pitesti city and highway Bucharest - Pitesti. The geographical coordinates of the marked places are the next: 001 05-AUG-10 11:33:47 N44 53.820 E24 51.776 295 m Zone Z1 002 05-AUG-10 11:35:58 N44 53.793 E24 51.785 294 m Zone Z1 003 05-AUG-10 11:37:45 N44 53.780 E24 51.704 294 m Zone Z1 004 05-AUG-10 11:42:22 N44 53.740 E24 51.634 301 m Zone Z1 005 05-AUG-10 12:38:31 N44 52.793 E24 54.604 331 m Zone Z2 006 05-AUG-10 12:38:46 N44 52.793 E24 54.609 331 m Zone Z2 007 05-AUG-10 12:38:53 N44 52.792 E24 54.614 330 m Zone Z2 008 05-AUG-10 12:45:57 N44 52.803 E24 54.547 331 m Zone Z2 The main results for the zone Z1, are given in the table 1. 84.56% of the mesh cells (and therefore of land area, because the cells have equal area), rain erosion losses below 1 t / ha annually. Only 7.34% of the area has lost ground over 5 tonnes per hectare per year. This value is low compared with that proceed, for example, Motoc and Trasculescu, 1959. Zone Z1 is included in the rectangular area 3780 x 2480 m (189 x 124 divisions every 20 meters). 4.37% of the area shows the stability factors lower than 1.2, 3.08% of the surface safety factor has values lower than 1.00 and 93.64 over 1.5. The main results for the zone Z2, are given in the table 2. Only 29.26% of the mesh cells (and hence the land surface, because the cells have equal area), have rain erosion losses below 1 t / ha annually. 6.53% of the loss is less than 5 t / ha annually (allowable amount after Motoc and Trasculescu, 1959). Zone Z2 is included in the rectangular area 2780 x 1800 m (139 x 90 divisions every 20 meters). 36.45% of the area has lost ground over 5 tonnes per hectare per year. 2.22% of the area shows the stability factors lower than 1.2, 1.8% of the surface safety factor has values lower than 1.00 and 95.55 over 1.5. ICDVV Calugareasca Valley vineyard area, as described on prognosis (free version) showed a loss of soil through erosion surface with values between 0.219 and 28.517 t / ha per year. Mean predicted soil loss by erosion is 4.047 t / ha per year. Weighted average reported by the total surface area plots, is the 4.55 t / ha per year. Mean values are negligible compared with the permissible limits given in Motoc and Trasculescu, 1959. Percentage weighted with the cell area distribution of erosion in the reference intervals of erosion, appears in Figure 11. Note that only 34.927% of the area mapped on the risk of erosion, has values between 0 and 2 t / ha annually, 67.07% of surface erosion within the class between 0 and 5 t / ha per year and 78.073% of the surface recorded values of soil loss under 7 tons per hectare annually. 4. Conclusions
The results show that soil erosion losses are negligible in the both areas of Maracineni, except for small areas of tension, visible on the maps of Figures 6 and 7. Also, areas with a high risk area for landslides are negligible compared with the total area of the zone considered. These areas are less visible, but noticeable in the maps of Figures 6 and 7. The same applies for zone ICDVV Valea Calugareasca. The results in this area are in agreement with experimental data obtained for ICDVV territory, see Herea et. Al., 2008.
These results are confirmed also by European soil erosion map, given by JRC, 2008. Regarding landslides, sources of verification are few and vague. The map made available by
ESPON, 2008, said, in vague terms, that risk would be higher than those determined in our analysis, over large areas. Accuracy erosion risk and / or landslides can be increased either by increasing the resolution or image area of interest by detailing and recalculation. It also would increase the accuracy of results through map spatial distribution of factors involved in calculating risk of the two phenomena.
The results allow us to support a service that determines the risk of erosion and landslides in Romania. A perspective of the service is monitored by examining aerial images territory from time to time.
Scientific Papers of the R.I.F.G. Pitesti, Vol. XXVI, 2010_________________________________________________
57
This can create a dynamic picture of the evolution of the two phenomena, even when they are slow. It thus provides accurate results that are possible in space and time intervention to prevent disaster. 5. References
1. European Spatial Planning Observation Network (ESPON), Jan 2005, http://www.preventionweb.net/english/professional/maps/v.php?id=3829 .
2. Herea V., Cardei P., Raluca Sfiru, Experimental determination of the soil erosion measures, Bulletin of University of agricultural sciences and veterinary medicine Cluj-Napoca, 2008, Volume 65 (2), p. 88-93.
3. INMA Bucharest, Prognosis and remediation methodology of the rain erosion and landslides – MPREPAT, Bucharest, September, 15, 2010.
4. JRC, European Comission, Land Management & Natural Hazards Unit, http://eusoils.jrc.ec.europa.eu/ESDB_Archive/pesera/pesera_data.html .
5. Manandhar Suman, Shallow soil slope instability analyses at horticultural farm, Daman, Central Nepal, Bulletin of the Department of Geology, Tribhuvan University, Kathmandu, Nepal, Vol. 10, 2007, pp. 72.
6. Mihai Gh., Ionescu V., Ghid pentru combaterea eroziunii solului, Editura Agro-Silvica Bucuresti, 1968, p. 69.
7. Motoc M., Trasculescu Fl., Eroziunea solului pe terenurile agricole si combaterea ei, Editura Agro-Silvica de Stat, Bucuresti, 1959, p. 81.
8. Pantelidis L., Stability Against Translational Failure of Non-cohesive Embankments Founded on Natural Slopes, IACMAG 2008, p. 4647;
9. Sfiru R., Cârdei P., Muraru V., Herea V., Methods and techniques of drawing up risk maps for surface rain erosion phenomenon, INMATEH - Agricultural Engineering vol 31, 2/2010, pp 32 -39.
10. Wischmeier, W. H., Smith, D.D., Predicting rainfall erosion losses. A guide to conservation planning, Agriculture Handbook No. 537, USDA-SEA, US. Govt. Printing Office, Washington, DC. 58 pp, 1978. Tables and figures
Figure 1. Photos of the front of the massive building stands on the Research Institute for Fruit Growing.
Scientific Papers of the R.I.F.G. Pitesti, Vol. XXVI, 2010_________________________________________________
58
Figure 2. Z1 picture air zone obtained using Google Earth free archive.
Figure 3. Photos of the Z2 area that belonged to fruit Research Institute for Fruit Growing, currently being restored.
Scientific Papers of the R.I.F.G. Pitesti, Vol. XXVI, 2010_________________________________________________
59
Figure 4. Aerial image area Z2 from archive free Google Earth program.
Figure 5. GPS map a large area which includes areas Z1 and Z2 and the city of Pitesti.
Scientific Papers of the R.I.F.G. Pitesti, Vol. XXVI, 2010_________________________________________________
60
Figure 6. The characteristics of the zone Z1. Each horizontal units represent 20 m.
Figure 7. The characteristics of the zone Z2. Each horizontal units represent 20 m.
Scientific Papers of the R.I.F.G. Pitesti, Vol. XXVI, 2010_________________________________________________
61
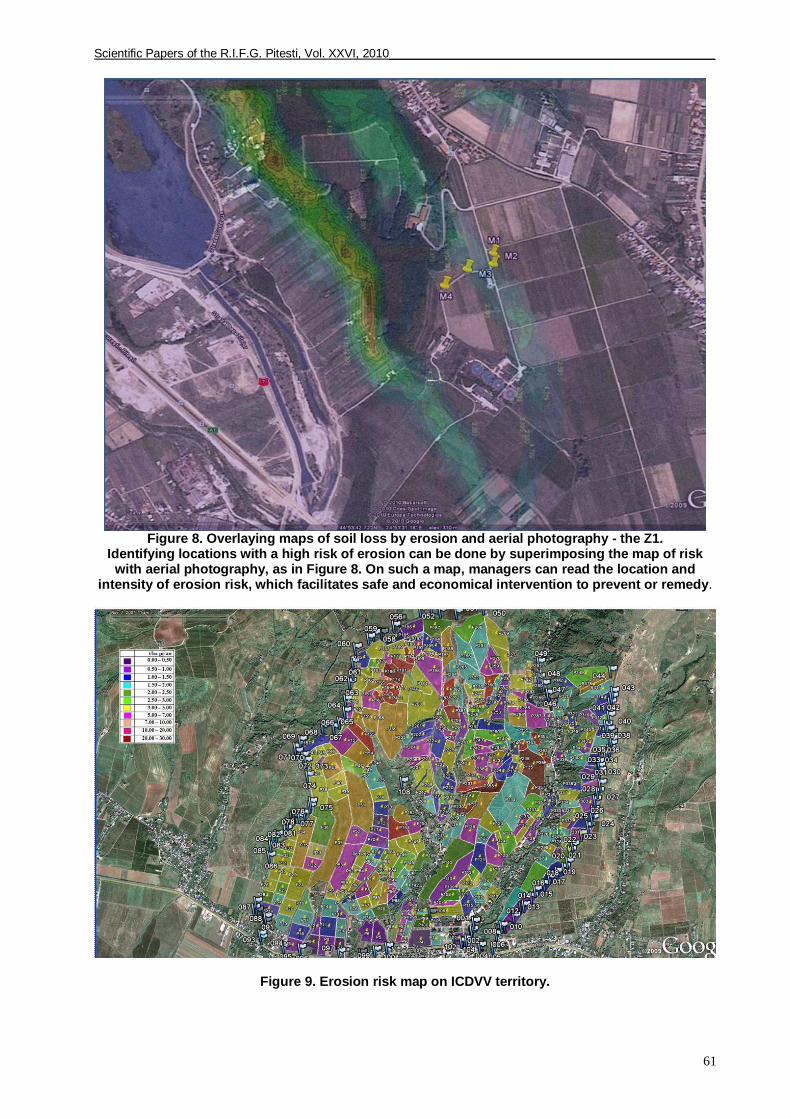
Figure 8. Overlaying maps of soil loss by erosion and aerial photography - the Z1.
Identifying locations with a high risk of erosion can be done by superimposing the map of risk with aerial photography, as in Figure 8. On such a map, managers can read the location and
intensity of erosion risk, which facilitates safe and economical intervention to prevent or remedy.
Figure 9. Erosion risk map on ICDVV territory.
Scientific Papers of the R.I.F.G. Pitesti, Vol. XXVI, 2010_________________________________________________
62
Figure 10. Landslide risk map on ICDVV territory.
Figure 11. The areas plots distribution on the erosion intervals, according to the map of Figure 9.
Table 1. The main results of the soil erosion and landslide risc for the zone Z1. minimum mean maximum Elevation, m 268.20 286.33 380.00 Slope, percent 0.00 3.88 42.50 Annual soil loss, t/ha per year 0.00 1.16 26.34 Safety Factor 0.00 34.45 240.12 Table 2. The main results of the soil erosion and landslide risc for the zone Z2. minimum mean maximum Elevation, m 268.20 286.33 380.00 Slope, percent 0.00 12.50 37.5 Annual soil loss, t/ha per year 0.00 4.11 20.92 Safety Factor 0.00 11.33 240.12