Embed Size (px)
Citation preview

II
(NASA-CR-1201 6 7 ) A SATURN LAUNCHED X-RA-2ASIFONONy EXPERIMENT VOLUnE 2: S-15074-21428Final Prcqram Report (SCI Electronics,Inc.) 92 p BC $7.75 CSCL 03A nclas
CSCL 03AG3/30 16479
A SATURN LAUNCHED
SOFT X-RAY ASTRONOMY EXPERIMENT
FINAL PROGRAM REPORT
VOLUME II
S-150
SUBMITTED IN ACCORDANCE WITH
SUBCONTRACT NO. 1
UNDER PR'IME NASA CONTRACT NAS 8-21015,
UNIVERSITY OF WISCONSIN
OR IGINAL
-4
SCI SYSTEMS, INC.HUNTSVILLE DIVISION
* I.
https://ntrs.nasa.gov/search.jsp?R=19740013315 2020-04-23T16:51:07+00:00Z
A SATURN LAUNCHED
SOFT X-RAY ASTRONOMY EXPERIMENT
FINAL PROGRAM REPORT
VOLUME II
S-150
SUBMITTED IN ACCORDANCE WITH
SUBCONTRACT NO. 1
UNDER PRIME NASA CONTRACT NAS 8-21015
UNIVERSITY OF WISCONSIN
ORIGINAL
PREPARED BY
SCI SYSTEMS, INC.
8620 SOUTH MEMORIAL PARKWAY
HUNTSVILLE, ALABAMA

FORWARD
The final program report for the Saturn Launched X-Ray Astronomy
Experiment is comprised of two (2) volumes. The first volume describes
the original X-Ray Experiment, designated S-027, with a sensitivity range
from 2 Kev to 10 Kev. The second volume describes the soft X-Ray
Version, designated S-150, with a sensitivity range from 200 ev to 10 Kev.

PHASE TWO
FINAL REPORT
FOR
S-150
X-RAY ASTRONOMY
ORIGINAL
APPROVALS
G. Frohwein, Project Engineer DateSpecial Projects Section
T, 2_ 173T. H. Freisen, Manager Date
Special Projects Section

TABLE OF CONTENTS
1.0 SUMMARY
2.0 INTRODUC TION
3.0 EXPERIMENT DISCUSSION
3. 1 SIGNAL DETECTION SYSTEM
3.2 DIGITAL DATA PROCESSING
3.3 VETO SYSTEM
3.4 STAR SENSORS
3. 5 CALIBRATION MECHANISM
3. 6 GAS SYSTEM
4.0 SUBSYSTEM DESCRIPTION
4. 1 BUFFER AMPLIFIERS
4.2 FIVE LEVEL DISCRIMINATORS
4.3 HIGH VOLTAGE POWER SUPPLIES
4.4 HIGH VOLTAGE CONTROL CIRCUIT
4.5 VETO DELAY CIRCUIT
4. 6 THRESHOLD DESCRIMINATORS
4.7 ANALOG SIGNAL CONDITIONER
4.8 STAR SENSOR AMPLIFIERS
4. 9 LOW VOLTAGE POWER SUPPLY
4. 10 DIGITAL DATA PROCESSOR
7/
5.0 ENVIRONMENTAL TEST
6.0 GROUND SUPPORT EQUIPMENT
6. 1 ANALOG PROCESSING AND DISPLAY UNIT
6. 2 DIGITAL PROCESSING AND DISPLAY UNIT
7.0 CONCLUSION
iii
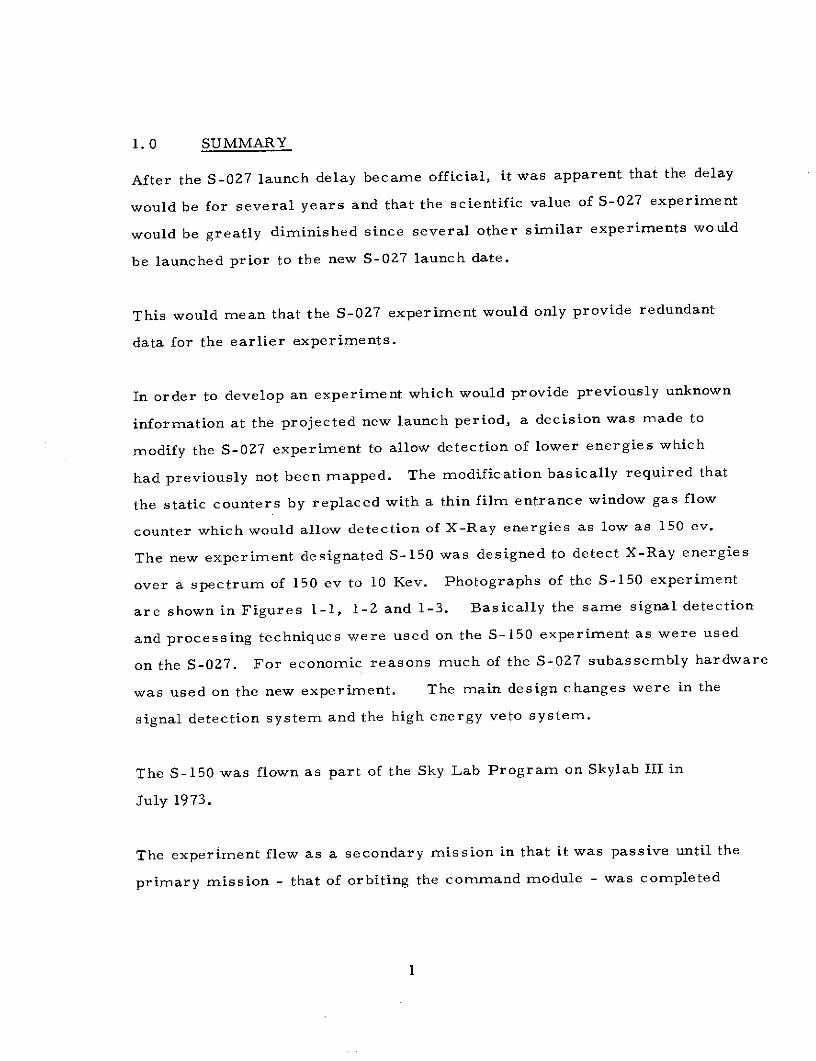
1.0 SUMMARY
After the S-027 launch delay became official, it was apparent that the delay
would be for several years and that the scientific value of S-027 experiment
would be greatly diminished since several other similar experiments would
be launched prior to the new S-027 launch date.
This would mean that the S-027 experiment would only provide redundant
data for the earlier experiments.
In order to develop an experiment which would provide previously unknown
information at the projected new launch period, a decision was made to
modify the S-027 experiment to allow detection of lower energies which
had previously not been mapped. The modification basically required that
the static counters by replaced with a thin film entrance window gas flow
counter which would allow detection of X-Ray energies as low as 150 ev.
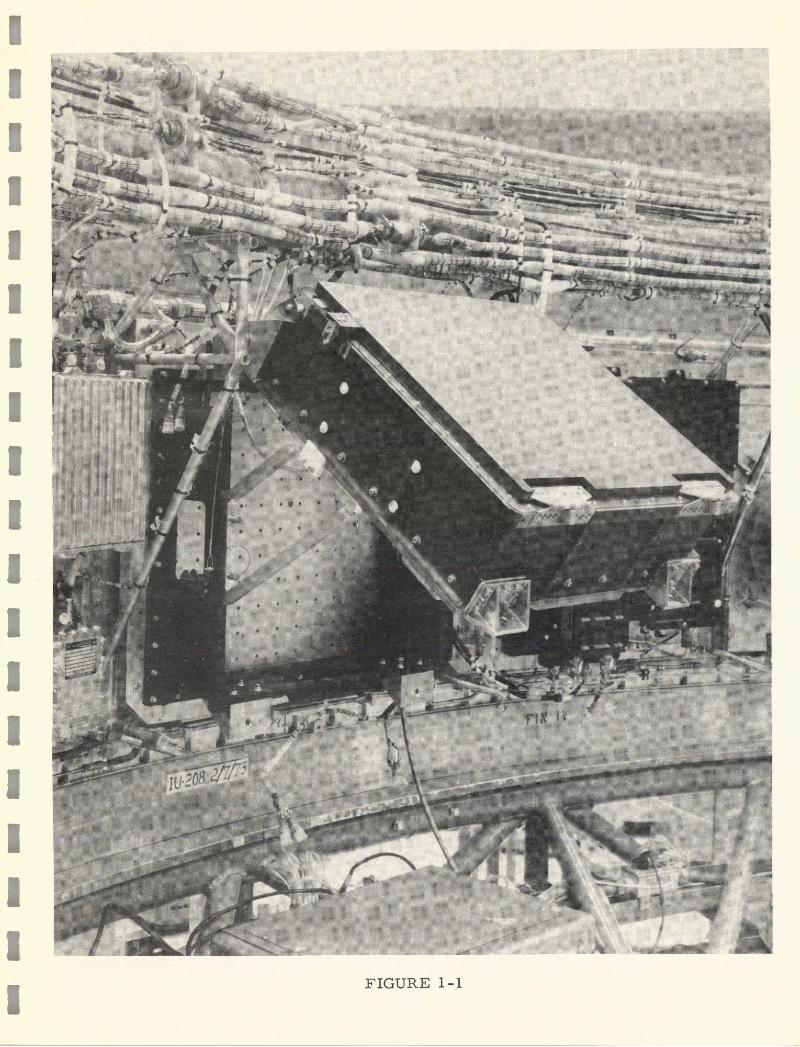
The new experiment designated S-150 was designed to detect X-Ray energies
over a spectrum of 150 ev to 10 Kev. Photographs of the S-150 experiment
are shown in Figures 1-1, 1-2 and 1-3. Basically the same signal detection
and processing techniques were used on the S-150 experiment as were used
on the S-027. For economic reasons much of the S-027 subassembly hardware
was used on the new experiment. The main design changes were in the
signal detection system and the high energy veto system.
The S-150 was flown as part of the Sky Lab Program on Skylab III in
July 1973.
The experiment flew as a secondary mission in that it was passive until the
primary mission - that of orbiting the command module - was completed
1

and the CSM was separated from the I. U. After CSM separation, the
experiment was actuated and provided useful data for at least the first
orbit when a leak developed in the thin window and pressure was reduced
beyond operational level.
2
I
!4
IU
FIGUREI -

I
P4
m JU
-
--....
U
A
U, J
i"-: 1A
V
, I tl
V'M
$0
L- ..

Mtn,
ItUR 1--3' 6
I AIWOW
I
44
4of-
FIGURE 1-3

2.0 INTRODUCTION
The S-150 experiment was based on the design of the S-027 experiment
which was designed to detect X-rays in the 2 Kev to 12 Kev energy range.
The S-150 experiment was designed to detect X-rays in the range of 150 ev
to 10 Kev.
The experiment mated to the Saturn Launch Vehicle Instrument Unit and
operated with the I. U. through the Auxiliary Storage and Playback System
(ASAP).
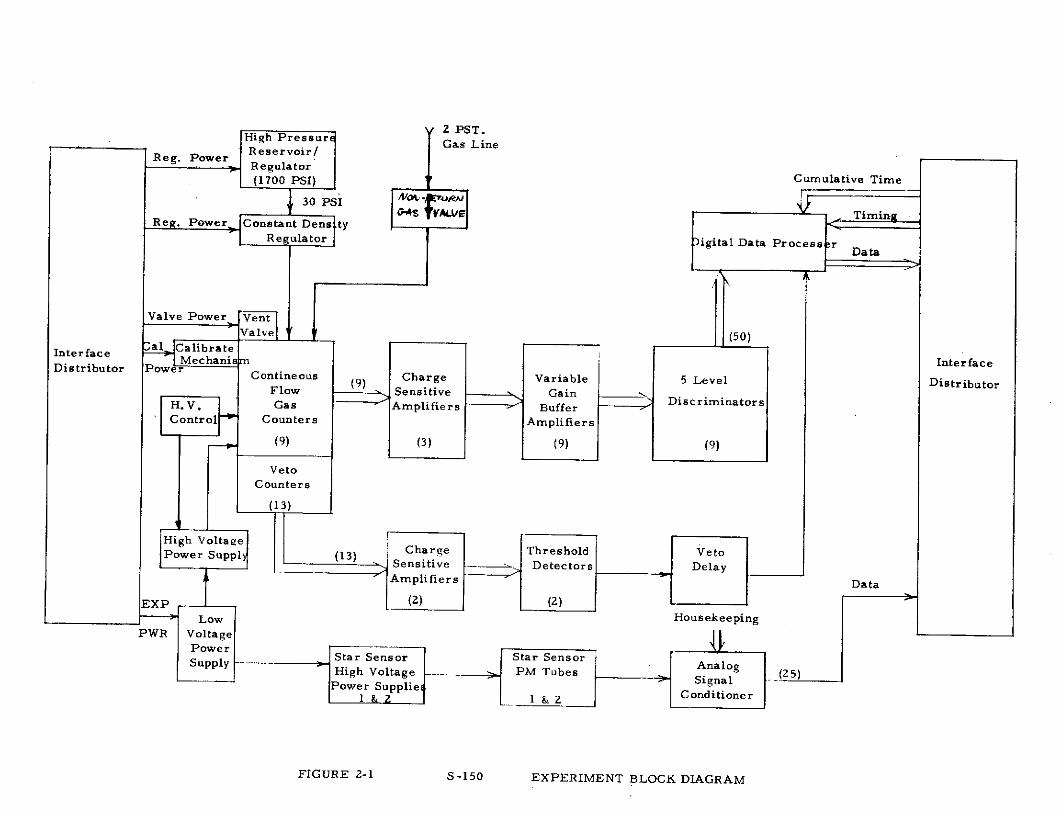
A block diagram of the experiment is shown in Figure 2-1. The experiment
consists of a continuous flow gas counter assembly which includes the viewing
counters and 13 veto counters, change amplifiers, high voltage supply and
constant density gas regulator.
The viewing window associated with the counter assembly is made of ultra
thin "Kimfoil" in order to allow passage of the low level X-rays. The
"Kimfoil" window is characteristically leaky and necessitates the use of a
constant density gas system to replace lost gas. The outputs of the charge
amplifiers contained in the counter assembly are connected to variable gain
buffer amplifiers which have outputs to five level discriminators. The
discriminators analyze the pulse height of the received pulses, and present
the quantized data to the digital data processor which conditions the data
for acceptance by the I.U.
The Counter Acsembly also contains counters which inhibit counts caused
by cosmic rays. These veto counters are connected to charge amplifiers
which have outputs connected to threshold discriminators. The outputs of
the threshold discriminators are ORed together and provide an inhibit within
3

the data processor to corresponding pulses presented via the viewing counters.
The data processor also provides count information concerning the number
of veto pulses received.
The S-150 experiment requires a gas supply for the counters. The gas is
stored at a reservoir pressure of 1700 psig. The pressure is reduced thru
a differential regulator to 30 psia, for interface with the constant density
regulator contained in the counter assembly. Initial commands to control
the gas originate in the IU and are applied to the experiment thru the Inter-
face distributor contained in the experiment package. During the experiment
phase of flight the gas is controlled by the constant density regulator.
A calibrate mechanism is included to expose the counter to a known radio-
active source for a short time at set intervals. The command to calibrate
is received from the IU thru the experiment Interface Distributor.
The experiment develops the required internal voltages thru a low voltage
power supply which operates from the vehicle +28 V power bus.
The experiment contains an Analog Signal Conditioner which has the
capability of conditioning twenty-five analog housekeeping measurements
for presentation to the IU interface.
Two star sensor assemblies are contained in te experiment to provide
location and orientation information in addition to that provided by the IU.
The star sensors allows the X-ray sources being monitored to be located
in space more accurately than could be done by relying on the IU location
information alone. The assemblies each consist of a lens, a field defining
slit, and a photomultiplier tube, a high voltage power supply, an electrometer,
a buffer amplifier, and a high intensity light protection circuit. The two
4
tubes project a field defining slit 0. 1 x 100 arranged to cross each other
at 240 and each making an angle to the line of motion scribed by the sensor
normal of 67. 50. The counter assembly high voltage is controlled by a
circuit which monitors the counter gas pressure. The circuit disables the
high voltage supply at all times the gas pressure is below a pre-determined
level. A detailed description of each subsystem operation is provided in
section 3 of this report.
Each subassembly is described in section and interrelated to the overall
system.
Section 5 describes the environmental qualification test and test results and
section 6 discusses the Ground Support Equipment used for checkout of the
experiment.
5
Reg. Power R e s e r v o r
Regulator(1700 PSI) Cumulative Time
S30 PSI W"S IYALE1 r Timing
Reg. Power, Constant Dens tyRegulator i )igital Data Process r Data
Valve Power 'Vent1
Valvel I (50)ZaeCalibrate
faeae[Mechanism Interface
Contineous (9) Charge Variable 5 Level DistributorFlow Sensitive Gain
H.V. Gas ------- Amplifiers Buffer DiscriminatorControlA Counters Amplifiers
(9) (3) (9) (9)
VetoCounters
(13)
Power Suppl (13) Charge Threshold VetoPower SupplSensitive Detectors Delay
11 2CnAmplifiers 'ie Data
EXP 1 (2) (2)Low Housekeeping
PWR Vo l t a g e
PowerSpply Star Sensor Star SensorSupply High Voltage PM Tubes Analog (25)
Power Supplie,I & 2 1 & 2 Conditioner
FIGURE 2-1 S-150 EXPERIMENT BLOCK DIAGRAM
3.0 EXPERIMENT DISCUSSION
3. 1 COUNTER ASSEMBLY SIGNAL DETECTION SYSTEM
The primary purpose of the S-150 experiment was to detect low energy
X-rays. Due to the low penetration ability of the low energy X-rays a
redesign of the signal detection system from that used on the S-027 was
necessary. An ultra thin window material (Kimfoil) was used to allow
penetration by the low energies. The thin window material is characteristically
leaky and requires a gas flow system to replenish the escaping counter gas.
The Counter Assembly was developed by the University of Wisconsin and
utilized a state of the art constant density gas regulation system which
compared the counter cavity gas density to a standard reference volume
of known density. The Counter Assembly consisted of nine active counter
channels and 13 veto channels. Each channel was isolated from the adjacent
channels by electro statically charged partition wiring. The channels were
functionally grouped together for processing in that each of the three groups
counters, three 900 counters, three -450 counters and three +450 counters -
shared a common charge amplifier.
The complete Counter Assembly consisted of the mechanical collimators, the
gas filled sensor cavity with anode detection wires, the primary charge
amplifiers, the high voltage supply and the gas regulation system.
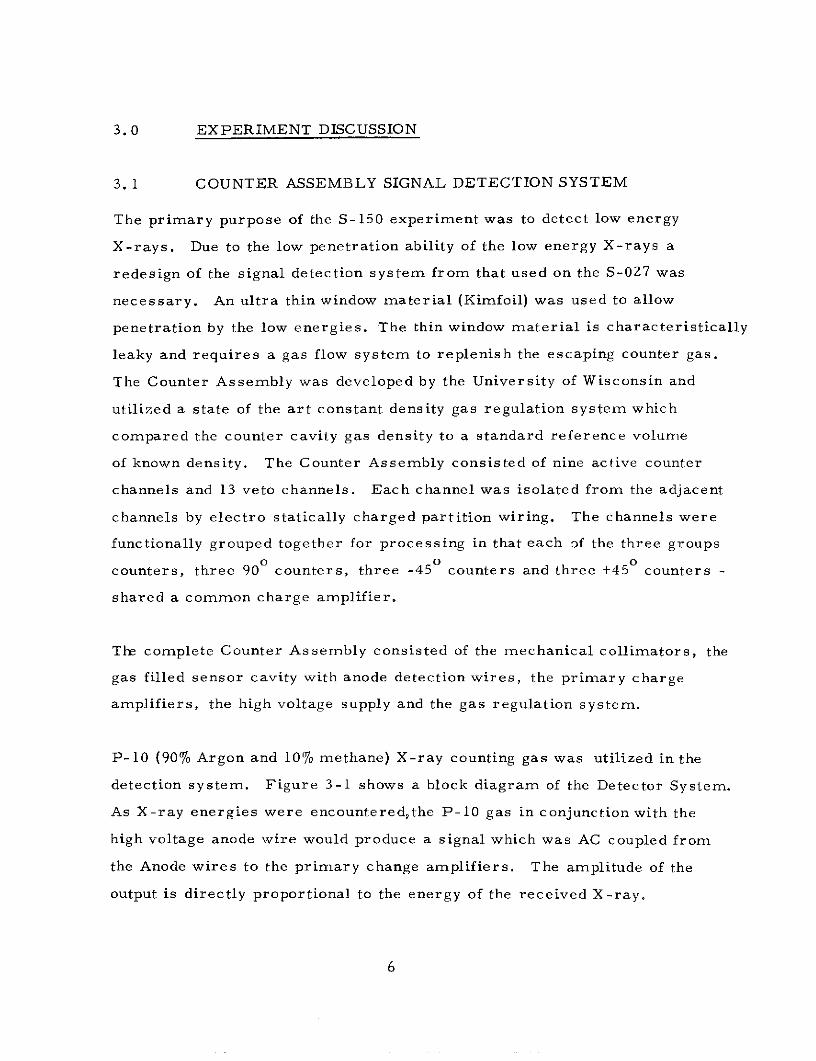
P-10 (90% Argon and 10% methane) X-ray counting gas was utilized in the
detection system. Figure 3-1 shows a block diagram of the Detector System.
As X-ray energies were encountered,the P-10 gas in conjunction with the
high voltage anode wire would produce a signal which was AC coupled from
the Anode wires to the primary change amplifiers. The amplitude of the
output is directly proportional to the energy of the received X-ray.
6

Charge Buffer Five Level Data Group
Proportional Counters Amplifiers Amplifiers Discriminator 5 Words EachI (adj. gain)
NO. 1
Low Energy
NO. 2
2 Medium EnergyGroup A
NO. 3
High EnergyGroup A
NO. 4
Low Energy
- Group B
NO. 5
Medium EnergyGroup B
NO. 6
High Energy
Group B
NO. 7
Growu Ecry
Group C
NO. 8
High Energy
Group C
HIGH VOLTAGE
POWER SUPPLY
DETECTOR SYSTEMS
FIGURE 3-1

The primary change amplifiers were connected to Buffer amplifiers. Both
the primary charge amplifiers and Buffer amplifiers had adjustable gain so
that the overall system gas could be accurately set to provide the proper
pulse heights to the 5 level descriminators for analysis into pulse height
range.
3.2 DIGITAL DATA PROCESSING
The digital data processing is accomplished in the Digital Data Processor.
The processing is done in 12 groups. The first 10 groups are used to
tabulate X-ray counts the remaining two groups provide such data as Veto
counts, discrete bit words. Timing data, sync code and information about
odd angle events occurring prior to Veto.
Each group consists of five 10 bit words. The first nine groups tabulate
the data from the nine proportional counters. The tenth group tabulates
events occurring in group 4, at a delayed time which effectively provides
fifty new bits of information, but also provides a backup check of the data
in group 4. Words 1 and 2 of group 11 form a 19 Bit Veto pulse counter
which counts the number of X-rays of greater energy level than those to be
analyzed by the sensor.
Words 3 and 4 of group 11 are divided into 5 separate words of 4 bits each.
Words one and two of this group are used to detect Horizontal Cosmic rays.
Word 3 is used to detect long horizontal rays. Word 4 detects Vertical
Cosmic rays. Word 5 tabulates the number of X-ray events greater than
15 Kev in data group 6 prior to Veto.
Word 5 of data group 11 consists of 10 discrete bit words which are used
for diagnosis. Information concerning Cal. Rod Status, solenoid status
7

monitor and electrical regulator operation is contained in these bits. Data
group 12 word 1 and 2 contain cumulative time data and word 3, 4, and 5
contain sync code information.
3.3 VETO SYSTEM
The veto system for the S-150 is considerably less complex than for the
S-027. As shown in Figure 3.3-1, thirteen veto counters are arranged
around and under the Nine Active Counters. The 13 veto counters were
ORed to a change amplifier set to produce a veto signal to the threshold
discriminator as energies sufficient to penetrate the counters were
encountered. In addition, to the veto counters other veto pulses were
obtained from the low gain Buffer Amplifier Channels thru a resistive
divider to allow for vetoing energies at a set level greater than 10 Kev.
The setup provided 5 separate veto inputs signals to the threshold discriminator.
The adjustable levels on the threshold discriminator were set to produce a
single discriminator output pulse if any of the input levels were high enough
to require vetoing. The output of the threshold discriminator is connected
to a veto delay circuit which delays the veto pulse to the data processor
so that the veto or inhibit to the processor will coincide with the actual data to
be vetoed at the data processor.
3.4 STAR SENSOR SYSTEM
The same star sensor system is used on both the S-027 and S-150 experiment.
Each assembly consists of a lens, a field defining slit, and photomultiplier
tube, a high voltage power supply, an electrometer, a buffer amplifier and
a high intensity light protection circuit. The two tubes project a field
defining slit 0. 10 x 100 arranged to cross each other at 240 and each making
an angle to the line of motion scribed by the sensor normal of 67. 50. A
8

Veto Charge I f .r Threshold .-eto DataCounters Amplifiers A.r pliifirs Discriminators Delay Processor
IIPrima ry ICounters - -
7
11
_ _
13
BLOCK DIAGRAM
VETO CIRCUITRY
Figure 3.3-1

IIIIIIIIIIUI
;iFi
II
FIU
E
.-

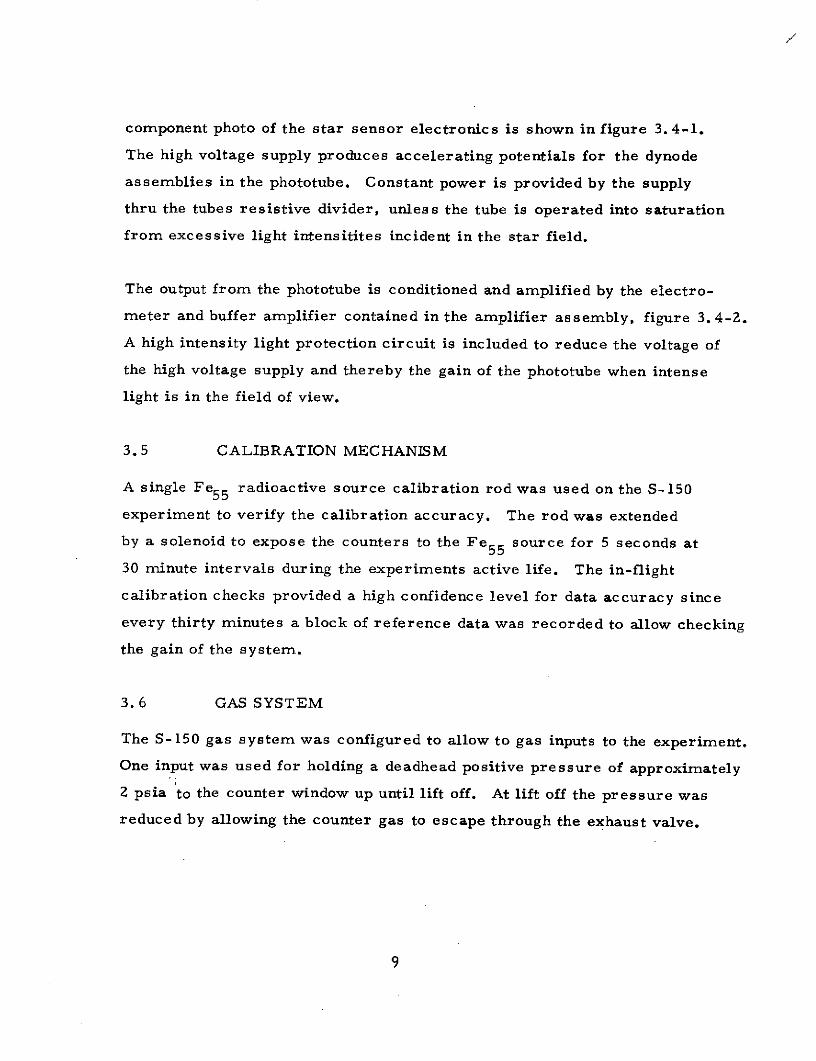
component photo of the star sensor electronics is shown in figure 3.4-1.
The high voltage supply produces accelerating potentials for the dynode
assemblies in the phototube. Constant power is provided by the supply
thru the tubes resistive divider, unless the tube is operated into saturation
from excessive light intensitites incident in the star field.
The output from the phototube is conditioned and amplified by the electro-
meter and buffer amplifier contained in the amplifier assembly, figure 3.4-2.
A high intensity light protection circuit is included to reduce the voltage of
the high voltage supply and thereby the gain of the phototube when intense
light is in the field of view.
3.5 CALIBRATION MECHANISM
A single Fe55 radioactive source calibration rod was used on the S-150
experiment to verify the calibration accuracy. The rod was extended
by a solenoid to expose the counters to the Fe55 source for 5 seconds at
30 minute intervals during the experiments active life. The in-flight
calibration checks provided a high confidence level for data accuracy since
every thirty minutes a block of reference data was recorded to allow checking
the gain of the system.
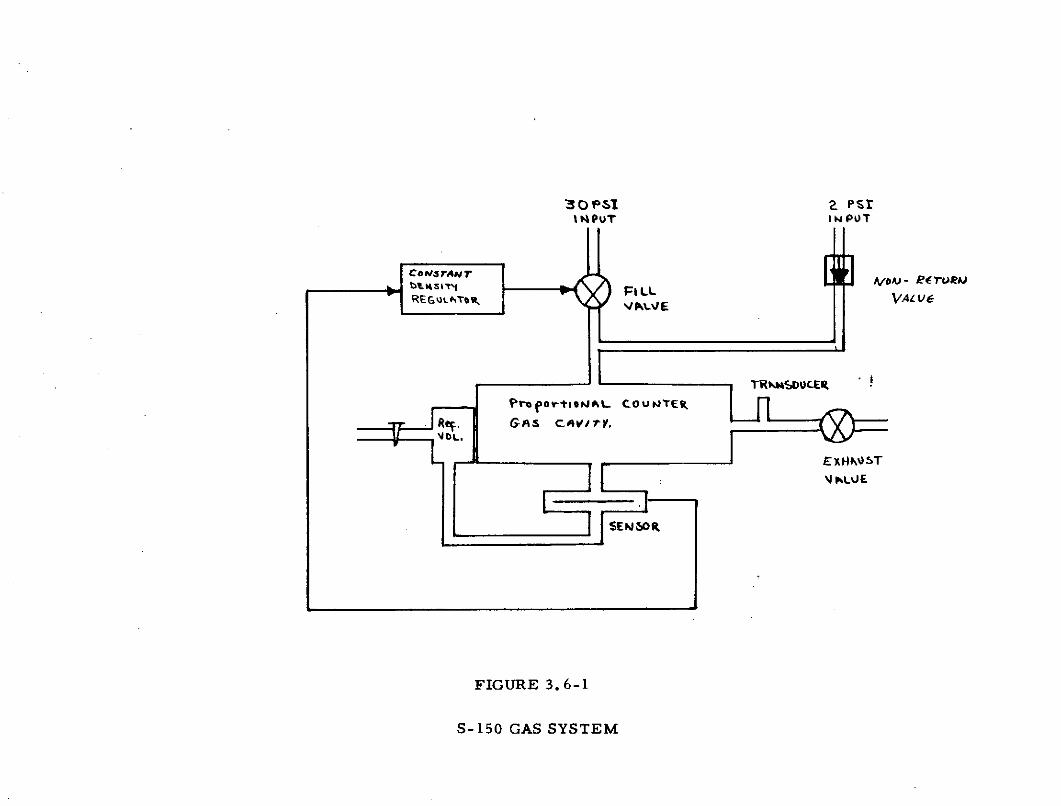
3.6 GAS SYSTEM
The S-150 gas system was configured to allow to gas inputs to the experiment.
One input was used for holding a deadhead positive pressure of approximately
2 psia to the counter window up until lift off. At lift off the pressure was
reduced by allowing the counter gas to escape through the exhaust valve.
9

After orbit was achieved the experiment gas supply was energized and the
constant density gas system filled the counter and provided a constant gas
supply to the counter assembly.
The constant density regulator electronics,which effectively is a gas density
comparator,was used to compare the counter gas density with a reference
volume of know density and then providing an appropriate command to
equalize the cavity density to that of the reference. The repetitive rate
of the regulation system after the initial filling of the gas cavity was a
function of the gask leak rate. The sensor assembly regulator system was
capable of supplying a constant density gas supply to the counter even if a
large gas escape rate such as would result from the exhaust vent valve
hanging in an open position or a large puncture in the thin Kemfil window.
A block diagram of the S-150 gas system is shown in Figure 3. 6-1.
10
30OP&1 2 PSII PuT INPUT
/Os- F LLF~oLr VALV6V AJPL E
TR JSDUCEl
rovorti*NAL C-0ou TEV
. GAs cA vI/tY.
FIGURE 3.6-1
S-150 GAS SYSTEM

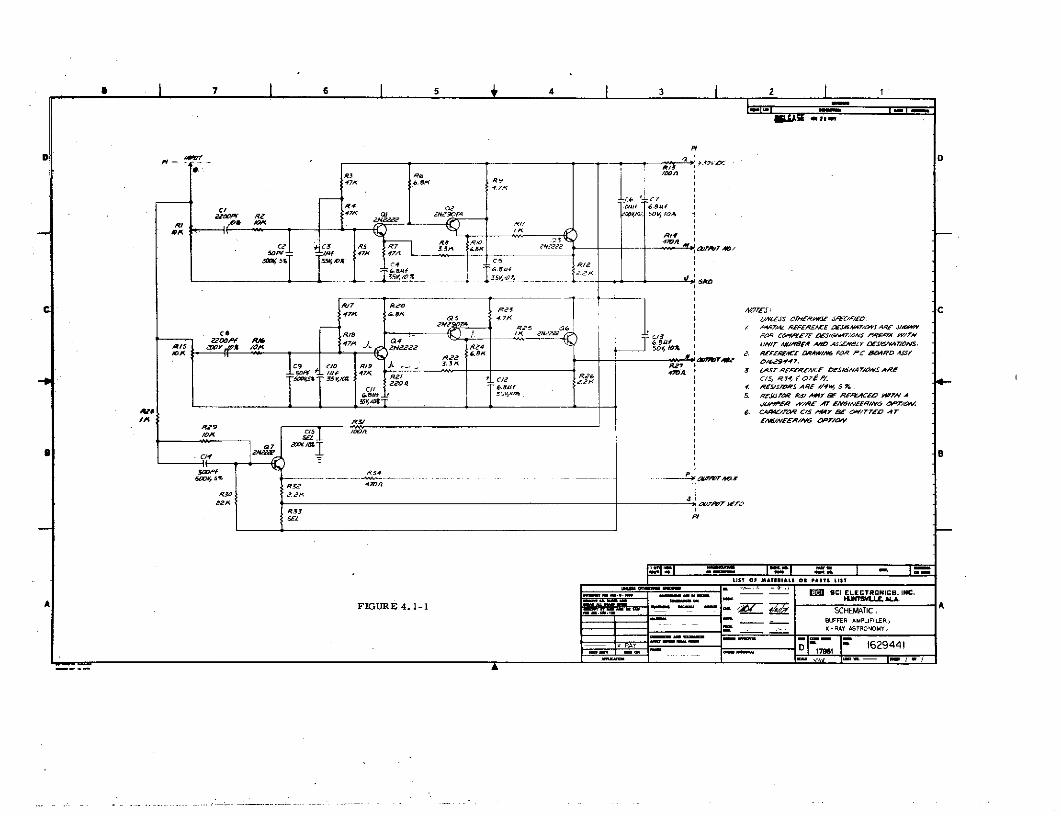
4. 1 BUFFER AMPLIFIERS
A schematic of the S-150 Buffer Amplifier is shown in figure 4. 1-1.
There are three separate amplifiers on each Buffer Amplifier Assembly.
Two of the amplifiers have adjustable gains and the third is a voltage
follower with a resistive divider which provides an attenuated output
corresponding to large pulses,to produce veto pulses to the threshold
discriminators.
The output from the primary charge amplifier is connected commonly to
each of the three amplifiers contained on each buffer amplifier board.
The gain is adjusted in the buffers as required to provide the proper
pulse height for the 5 level trigger points.
11
IR3
471( aj 2Ne9OA l.,I' 50V to^
At R11
35V AV __ 35,&
c JR17 Re'o 1d I12s 47X T I uA'rSs 0cHeRA95 SrEA,M:
47Pl R iNIT AbtIW A,10 AS:,tF&g Y DEAS-bA 7/9A<S.
AOA .a PR/T/eFACE D.AI FOR PC BtB4RD ASSX
I/b 11. 47/b47/ 3. ZASrRPFFFPFVCF AS6NA71DAWS ARE
33cIA S CIS7W ARE, 114w 72 ps.
& oa_ L / f I sI S P L 5 7 f q R RAA Y l . -kA C Z 0 b hi'Y A ' .4ZzI R .w~ 4 r~q AT dF/V6A'f 6 0-7/22014
MeUS1q7
6.A4crRc5/q e6lroA

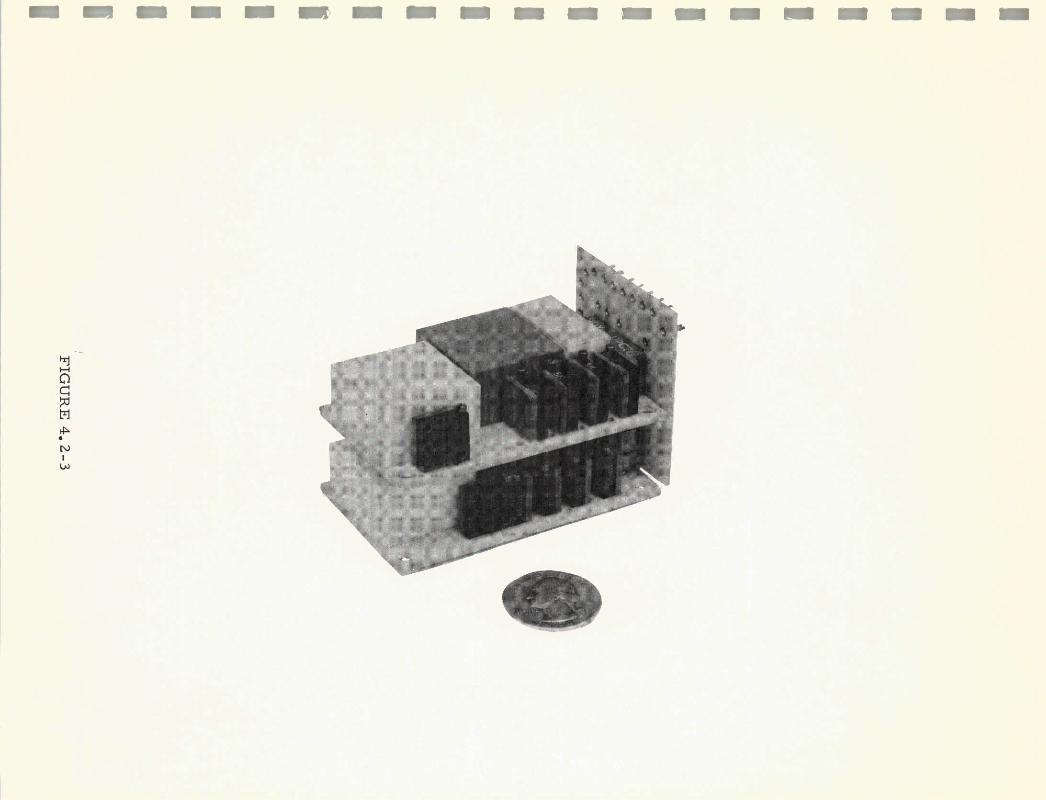
4.2 FIVE LEVEL DISCRIMINATOR
The same Five Level Discriminators are used in both the S-150 and S-027
experiments. A block diagram of the Five Level Discriminator is shown
in figure 4.2-1 and a schematic is shown in figure 4.2-2.
The input is obtained from the signal amplifier output. When an input is
received, the signal triggers a one shot circuit which enables the analyzer
and provides blanking for the duration of the one-shot pulse.
The circuit is designed so that an output is obtained from only the highest
level that the input pulse is capable of triggering. Each level of the five
level is adjustable over a selected range and each level is interconnected
to inhibit the outputfranthe lower levels. The fifth level is open-ended in
that all pulses above that threshold level appear at the output.
A photograph of the Five Level Discriminators in their stacked configuration
is shown in figure 4. 2-3.
12

+12V +1ZV
BB/S
Level Adjustable
Detector Reference
-12V
+12V
Level Adjustable
Detector Reference
-12V
:::B/S B
/ut Level AdjustableDetector Reference
-12v 3 Outpu
+12V Inhibit Gate
S*B/Sd Level Adjustable A When B=0
Detector Reference Output = When
-12V 0
Detector Reference
FIVE LEVEL PULSE
HEIGHT ANALYZER;X-RAY ASTRONOMY
B/S = Bistable Vibrator EXPERIMENT
O/S = Monostable Vibrator

I INOTES:
1. 0 ALISS OTa4I3d IPECIWD:
ALL 2TORaS AR l . .
SiGwATOI PIFi WiT UNIT w. AND ASSMAILy
I I jC
- -- -. . - -. - - -o-
AAWT MRTi I A
c2 I 2r
- DI SCRIMINATOR, I,FIGURE 4. 2-2 - - -- -A A....ow.o. I 162o9019
-----.-- 0 LD 0
a,6W. A. .
A;l ns4. Al l~ z~o 1 -0
SMAJ &ST.-I

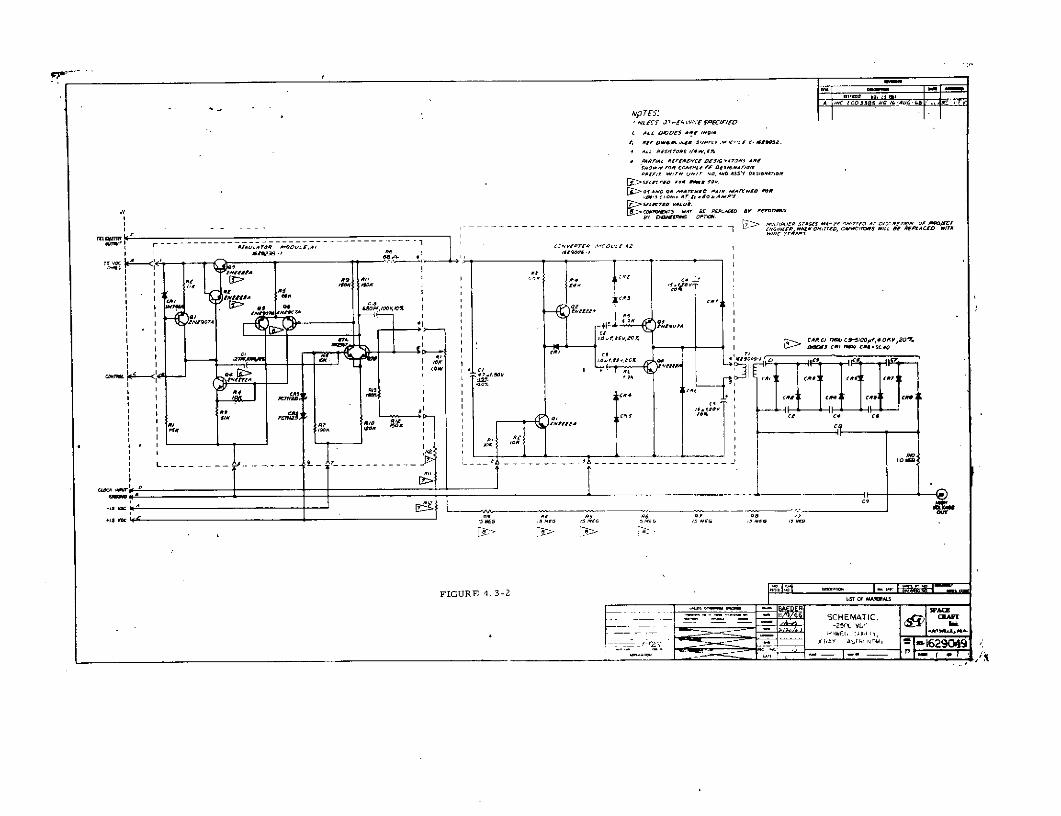
4.3 HIGH VOLTAGE POWER SUPPLIES
The same high voltage supplies are used in both the S-150 and S-027 experiments.
A package outline is shown in figure 4.3-1. Each supply operates from an
unregulated input which is regulated by a series transistor internal to the
high voltage supply. The regulated output is stepped up in the converter
module by a 1:25 ratio. The final output is obtained from a voltage multiplier
circuit. The output is sampled and compared to a reference voltage in a
comparison amplifier which controls the series element.
The basic circuit is common to all the high voltage supplies. A schematic
of the -2500 vdc supply is shown in Figure 4. 3-2. The number of voltage
multiplier stages and the polarity of the diodes in the multiplier are changed
to produce the required output voltage.
13

'U 0 0M
O
00
to
~1
-(O
fJM
T
I
aU
h cvn
I A IINC IC0335 5,lG, Au 4 9.NP TES:
'NL Ef J t VV SPE~f~ C/F/D4 All ODCS ARC -0-
t. tEDwrdL CE 5,,rv if': £- Sf32.* ALL */ffo*f /.y,f,.
A AtrAL *EXA*IACE 055dM V4T3R1 ARCGROW, £OA o nflit O A/A lDes AN
-Fi wT VNI r . 4 AS Y 00sa10Ci90
- -f. rAGES Pf -- Ar - f 01 4WJ.00 x A. tOO4O Pi. AAATTCO Omf
-,tfrR ro* &-I, C . I.6Ev tB. AUt.C& A~P
JZz.C6EOEwTS MAC BE REA. BY FEOIlI, COUWlhl OPTSI.. L ,>NIItttuE OrGAMA &, NrCO~ AT VICNCONx Ml OMCT
- - - - - ------ ----- -------- NO ,eA-
- -T
c:MV/R
mycarr
MLY- - - - - - - - -------- wUIuI srACI.; IX Ips.UJ'II
LT~Pi3s-) If" ISO"
*, .A a I-C
1? s 6 SNAOI10 I0.£o 6204 9E ~MOp, 6~Oi.vvSy DO c-C -, a, 0*-40 .
(R. r .c
0.w .2 -I - (4 5
Ar c*7
C14 ca c. c CA
rC,
L I- - --- -_ - - - - - - - -
ca
-* SCHEMATIC, CFIGUR 4.3-2 - -SIL A y N0.
. .1 ;- A A
XPAY Al0rl ml~vl 1.162904
4.4 HIGH VOLTAGE CONTROL CIRCUIT
A schematic of the High Voltage Control Circuit is shown in Figure 4.4-1.
The high voltage control circuit is used to disable the high voltage when the
counter pressure is below a preset level. The pressure threshold level
is adjustable over a wide range. The circuit is basically a comparator
and gate. A reference voltage is set corresponding to the desired operating
pressure. When the input voltage corresponding to the operating pressure
reaches the set level the comparator switches, enabling the gate to pass the
clock signal to the high voltage supply.
At any time the pressure falls below the set level the high voltage is turned
off by removal of the clock. The circuit operates automatically with counter
pressure.
14

8I7 I6 5 4 3 2RELEASE AI
D D
ZK I /'/JA1//4/ A'IffAXArE,.W!,NT/oA/J 91,r U/OjWNFOP C3JmPL EF (IM 5/e WAfw5 PREFIXY Wvl UNIT
tVUMBF emN AkPqB I OF/CIq/O
C O%3I t ~ 5K 2OK A CT~~2 :AST REFIRENCE DCSI6NAT/OIV8AER4,CZ CR2 AZ. EI2 cc~ 135 4H7 KLCM LYo P
-Z
C .IINPUT PROM
PAMC4 p
tIZ+V M4i--T
E7 .A Hd 4 CUF
D
A FI U E4 4 1HNSIHAA
'-IEATC
61, VO0G .,NkLLKA
A~ FIGUR 4.4-1
167 5
4.5 VETO DELAY CIRCUIT
A schematic of the Veto Delay Circuit is shown in Figure 4. 5-1. The
veto delay circuit is used to produce a pulse to inhibit the data processor
at a time coinciding with the arrival of real data which is of greater energy
than that to be analyzed by the experiment and which is to be inhibited at
the data processor. The circuit consists of two paralleled monostable
multi-vibrators anded together to form a Veto Delay Pulse capable of
inhibiting the count of cosmic rays from the data in the energy range of
interest.
The input to the circuit is obtained from the veto threshold discriminator.
15

4 3 2 1
TO P/AlN f ,/ RI L It ;4 ,
4.7 K,D 14W, 5% .'i N 5
CCl t-o pf, C4
200V, 0/ 7 I3 F
4.7 . K I E 1500p. 2 8CRI 1/4W R3 1/4W 2004v. i4 D5% 10 2---Or 222 A NOTES:
cw A 9z 4,12 A/P/ lopEO -- 6 10 UNLESS OTHERWISE SPECIFIED:
6 200V 10% I .9 F
I O22 6 1. PARTIAL REFERENCE DESIGNATIONS IRE SHOWN.S7 FOR COMPLETE DESIGNATIONS PREFIX WITH UNIT
3 5 I NUMBER AND ASSEMBLY DESIGNATIONS.
20 K . 2. REFERENCE DRAWING FOR P.C. BOARD ASS'Y 1629453
TC-/Nl/ RD 3. LAST REFERENCEDESIGNATION5 ARE 43,C4,R9,Q2
4. FOR P.C. BOARD CIRCUIT INTERCONNECTSEE INTERCONNECTION LIST 1629445.
5. EACH LOGIC SYMBOL REPRESENTS A CIRCUITFUNCTION WITHIN EACH INTEGRATED CIRCUIT.
H 7
I ,
-V - --- FIGURE 4.5-1
.V. CoV'-1o0 C//ZCL/;-- O 1 sI
" I I omr I "o I '==o I "_ I__LIT OF MATERIALS OR PARTS LIST
L A2- ULSmml Plurm SCI a s as ELECTRONICS. INC.
marvr en 5-1tL' , . LElr CIRCUIT
. .. a 17981 i62944IAM I m ON I n. I78

4.6 THRESHOLD DISCRIMINATOR
The same Threshold Discriminator is used on both the S-150 and S-027
experiments. Figure 4. 6-1 is a photograph of theThreshold Discriminator
Assembly. A schematic of the Threshold Discriminator is shown in figure
4. 6-2. There are six identical circuit modules on the board which are
ORed ;:ogether to produce a single output signal. The assembly will accept
six separate inputs and produce an output pulse with an input signal on one
or more of the inputs. Each of the modules has an adjustable threshold
level over a selected range. Each module consists of an adjustable
comparator with two one-shot modules connected in series to produce a
blanking pulse.
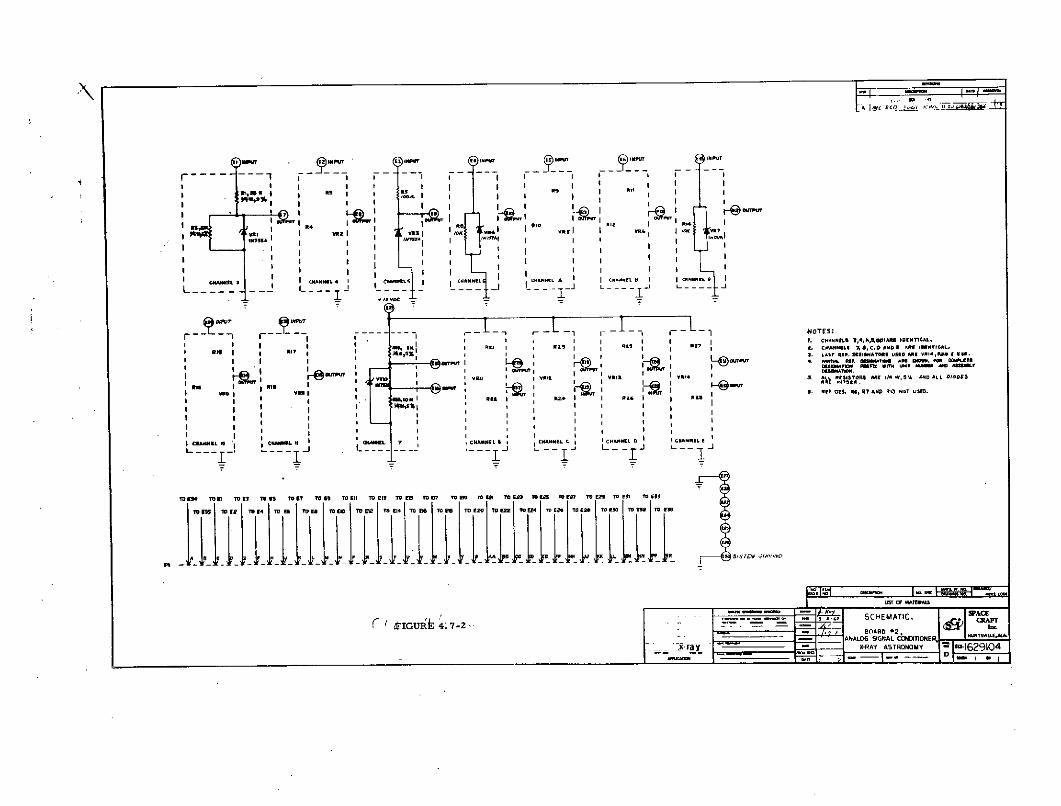
4.7 ANALOG SIGNAL CONDITIONER
The same Analog Signal Conditioner is used for both the S-150 and S-027
experiments. The analog signal conditioner consists of two printed circuit
boards and has twenty five channel capability for conditioning data for
acceptance by the analyzers. In addition to the twenty five active channels,
there are five supplemental channels provided to monitor temperatures
in certain portions of the experiment by the Ground Support Equipment
during experiment checkout.
Each channel is conditioned to produce an output from zero to five volts
d. c. with a source impedance of 10, 000 ohms maximum. Schematics of
the analog boards are shown in figure 4.7-1 and 4.7-2.
16


A, Aa A 5s.,
All
n 1 1 1 1II n I r~
rs o pe S ,50 oSCRUVA to r, oes, o,. rpns£noas .,,, now~ e
770"
-AP1.4, mS ir . 5
A or*s a,;
. ATIAL REntMKKE ~&fArO0 AM9 SHOWM- R TOAIE OESa flO POEfl 1111 IT,-WMR T-D ASSEIWU OESIONTI
LIST OF WMAESPACE
FIGURE 4.6-2 -er. SCHEMATIC, ; A
--xr . --- __ 0- -8 I

, - -- 1 1
2 15 r2 7 1 120 00 D.r 102 -D 1
f :42. 9101
-i - ---- --.-- -- se rea AR-- ', 7*21120LL oorS A41E 75 .24
T4r oo5& -4r !
uo v r OU TP P
I II I 1,2 | CM ZI
I1L I a var vA II "I,. .,
E6 E9
ST 1 TUpCL , ?A STM Tuat 2 1mP, P.C.r2 up. MusING rt ou22N 1 rMP.
vc A' r c sro , M O I I V. R 5 I I .V2 Iti M5U 50 Pu
ELf NNANC LNE NELCAN
, , _ , _ . 29ouU I r...R. I .....
'0 I- T U I
I -T 1 T
TO I I E , i II £ 22 TO. T17 C"(e T 25040
34 is :T '1 ' 05 -_
ILI 2- y . . -" I_ I 2... ..4'1'I...:2"
FIU224 7- .... .- , I" -- -- ... .I IT 0A
IGURE 4.A7-12
-- r-r Iu -
SI I I I I
, I s I I I I , I I
I I Ill II
I "' I " I I ,.-I I I I I I.II
I I I I I I
cIn6LS In 4 Ca NAHEES I ANE c*ANNIL A I CEANNL 6 I I aEmNLJ L... - - - -. j
- -- - - -- NOTES:
I| ni i I I I I I. cANNa un 8 , o s I N c.I I.AII I ll II E7 If ¢ NrF$ SC o a ge 8, IC.* nDL
userI I l s r6 R1[F DE. 1 RG, 17 AND t I* NOT USED,
I ,sN E I I I
,, L
I 1 1.i E1 1
i I I
cm a'ILc assist I c.men 7- cN. is L m AEL H I c :-1Nn t. I 7*Han4n * -
'----I .. ... I "J - ' ... _" -I - L _ _ J ,-- J
IGUR_' ~-- '::'' "~U , r 1- -1
-.- ray --- X-RAY ASTRONOMY I=1629104
_.. _ _ _____ o -- l D"eg
4.8 STAR SENSOR AMPLIFIERS
A photograph of the star sensor assembly is shown in figure 4. 8-1 and a
schematic is shown in figure 4. 8-2.
The assembly consists of an Electrometer module and a Buffer Amplifier
module.
The Electrometer Module will effectively measure a current as low as
5 x 10- 1 2 amps producing an output of 5 millivolts. The electrometer
achieves good stability by the use of differential field-effect devices and
exhibits a high input impedance to prevent loading of the photomultiplier
tubes.
A high intensity light protection circuit is included in the electrometer and
utilizes the property that the voltage output of the electrometer is propor-
tional to the current from the tube.
To prevent solar electric damage to the tube, prevent tube saturation and
limit the tube's recovery time from high light levels, the tube's output is-8
held to a constant current of 10-8 amps. The equivalent electrometer output
(about 6 volts) is returned through a linear amplifier to a control line in the
voltage regulation section of the H. V. power supply. When tube current
through reduction of the tube's current gain by decreasing the high voltage
into the tube.
The Buffer Amplifier module is directly coupled to the electrometer output
and has a switchable gain which provides a x 10 gain for low level signals
and a x 1 gain for higher levels which effectively extends the dynamic range
about three orders of magnitude.
17

IaIIUIIIIIII
FIG
UR
E
4. 8-1
3

JIn
::m A9 I
NY Af I t
a"v 41 12 ?Im aawnf I MSIM M 5
I n/ "W * I8a<m
low 20 IE . DL af r iu
D_ 82 VOIOTM .07' I M
>i7.JVOC AND t17.8 VOC.
soeSlb n WAAS O4M-AC VLVE £MOW0
I a
lox A SWLGOV
LM -n
FIGURE 4.8-2 Tgt__h

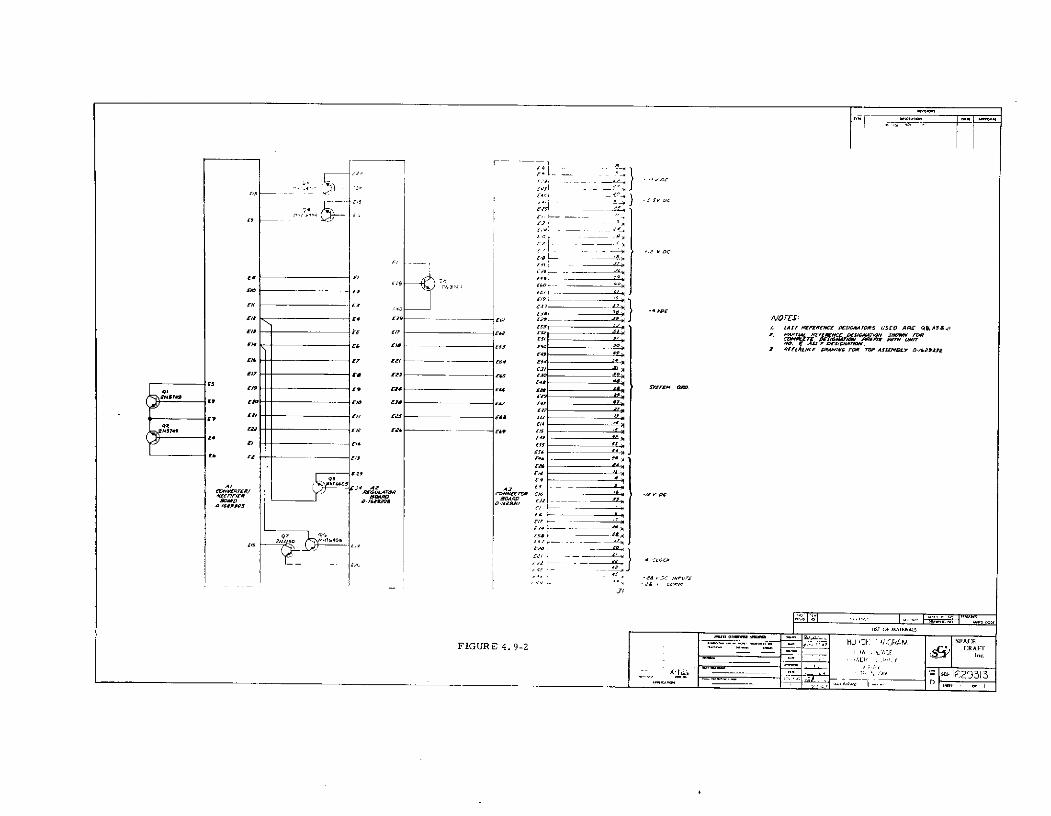
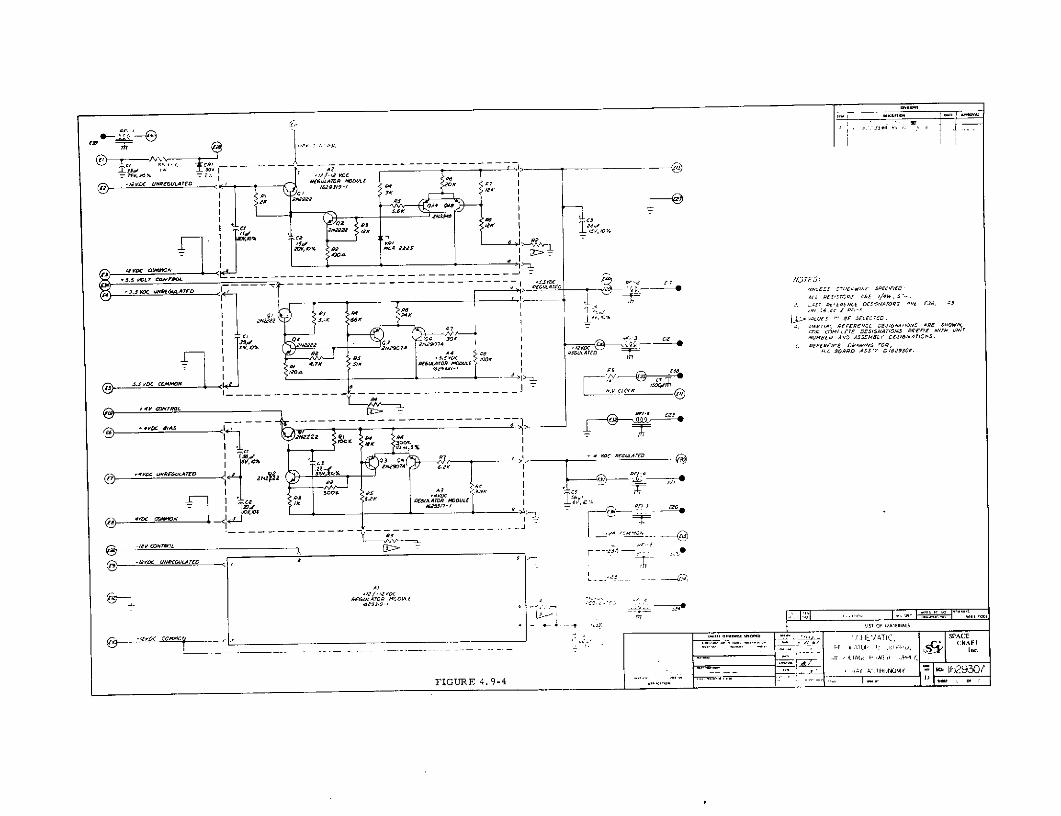
4.0 LOW VOLTAGE POWER SUPPLY
All voltages required in the S-150 experiment are developed in the Low
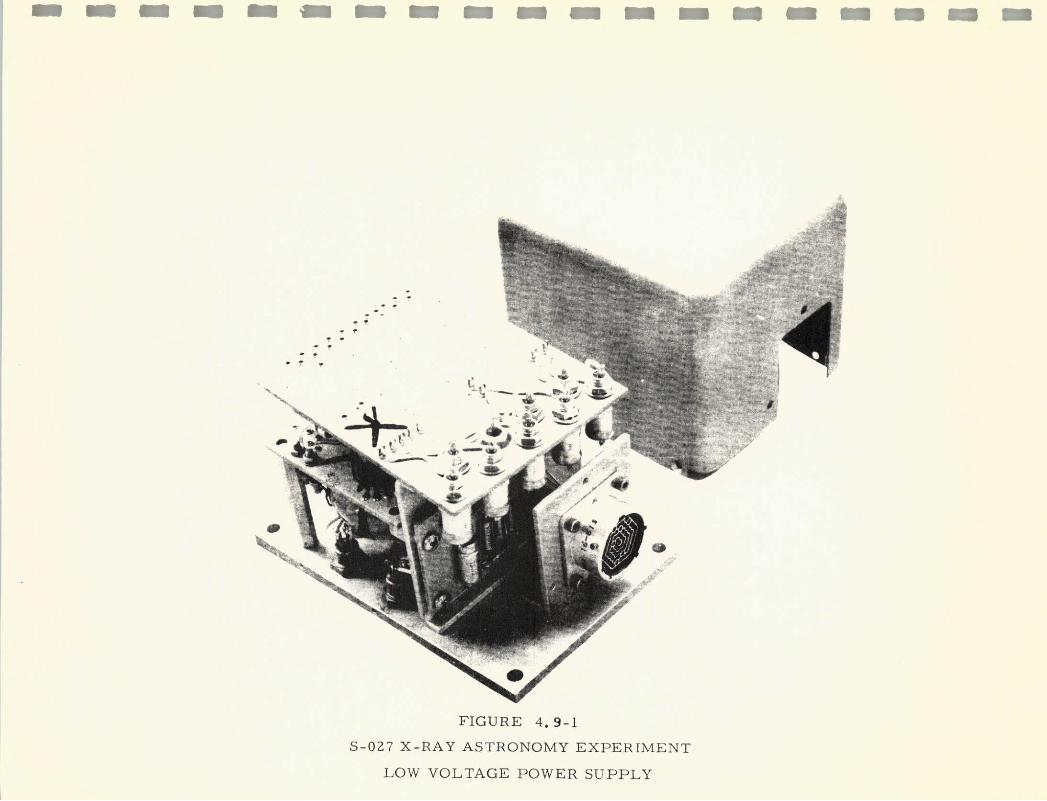
Voltage Power Supply from the spacecraft +28 volt bus. A photograph,
block diagram, and schematics of the suapply are shown in figures 4.9-1.
thru 4. 9-5. The supply provides experiment power isolated from the +28
volt system by chopping and transformer coupling the primary voltage.
The transformer has multiple secondary windings which are regulated and
filtered to provide the final output to the experiment. In addition to pro-
viding the experiment voltages the 12 Vdc, +35 Vdc, +4 Vdc and +5. 5 Vdc
the supply generates a 5 kHz, p-p square-wave clock for the high voltage
power supplies.
18
- -, - -CA
Ap
FIGURE 4.9-1
S-027 X-RAY ASTRONOMY EXPERIMENT
LOW VOLTAGE POWER SUPPLY
... .. . .. . . ...
I -WRM 920 0-09,~ ~ mm -9-ff 2
rM el, El 540)
Ell ra rz3 - f" 9
=52 ci'E3 9 cm E4 r-S- l474d0
-& . 1 3 ~A O E
rig o a A lST 4-01NC( C(5004T0S 590 ARE 9,44V4
E9£ ell~jo la' ~ sCS -4 40- 1,nr,44
3 4(1C 0509CTO 0 44f8Y Sln544 ~ ________10 4
(29 - 94 F5Al eC A ,t
if, o~ 194
94 (4 4-
FI UR 4.o 9- / I m
9#
SPACE
24315 495495 93 -

So --V
I ALL
-1 WI1 A -RV4ASR"- Is, -e '' '' DA OT2?1 1 ~ nI AWVVMas . OP li~l$.*'AW S
AMdl CO a .oea
MPM -'%5I I"'"""""" wrA "CAV YMfV
To safo5 ~ C.I- w.~ Cj'E, 4
FIUR 4.9R-325
WV.A4
V; 5A3 iiL~
-n ii -,kN)Y 9 0
_- - - --------- - -- - - -- - -
-2 2 a 11 _ U
I_ fULLMTED - .(5 . -.I& *1629J59 '- 0-
R, , , 7_ .'. e A' s
ETGURE 4.9-4 r ,o .... , ...
-4.TS .Sz
I
.
E,-
COC
---------------- - -- -0 o5E r -E-- -- -
-1223 AT c _A r.- '' AT C uS Ad
IA_ A IA(A 0 Wf H .r' 1,Rz A < 1 TC ATTRCEO ID 4.9-4 .C '1 2- 3 I
- - - - - - - - - - - - - - - - - -- - .. v c c- -- --- --
- -l-- ---

£ -- - - - - -''-, KS. I ,, r
rorr
-e
to 7.
* S-'- * r
L=5 r , reei
-O 2 H IC
- : -- "5 -*
-" 507. O87 o)
II
CaO II or*
_ 2CCP4'A rmx Eor~~r~s yr
SC tr -
- *.:~z:. - ~~CEMTI sr%
FIGURE 4.9-5 ' CI - St Drl-L5 *T1WF ,F-I
- ~ ~ ~ ~ ~ XNI -- W -tU -D- FIt I JSS o-l29- p~ ____ YII -~ l *.KOLN--'
4. 10 DIGITAL DATA PROCESSOR
The S-150 uses the same data processor as the S-027 experiment. The
digital data processor utilizes high density integrated circuit, welded
module packaging concepts. A photograph of the processor is shown in
figure 4. 10-1 and a block diagram is shown in figure 4. 10-2. The majority
of the system is involved with the primary detector's level discriminators.
Capabilities exist to accept 50 lines of pulse data into the unit providing 10
bit accumulation (1023 counts) for each input. Sequencing of data outputs
is derived from timing inputs from the IU. Twelve separate data sequence
enables five accumulators of 10 bits each to the output circuitry. The 1 pps
timing signal from the IU synchronizes the system by ordering the proper
sequence of data groups. At the leading edge of the 12 pps pulse, the data
accumulators to be interrogated are inhibited from further counting, and
their outputs are presented to the digital data interface. The outputs remain
available for sampling by the IU for a period of 700 microseconds at the end
of which time the accumulators are reset and the input inhibit is lifted. At
the next 12 pps pulse the second group of accumulators are connected to the
output.
19

-WA W- - - - -A -1
40
FIGURE 4. 10. 1DIG1 FAL DATA PPR OCi :50
S-1 AY ASTRONO'v

- --2--- I I
D D
/,QUNCA1L4
I/JTTRS
COX/1T/M.
C C
FIGURE 4.10-2
T OCUUL 7 7UO ARY
POI AMS 41 /,S I74 ." OUT
CUM & 4"VE F ,AA U (/ - E UAS D- SO A-,WAL& &7 ,4C0,'
FIGURE 4. 10-2
-TEM OTY NOI MCLATUE COQ! PIgA ai . M A t
I LIST OF MATERIALS OR PARTS LISTUNLESS OTEWiSE SPECIFIED oil.
OsmOs oNs. IN IN.IS Spce Craft Inc.TOLERANCES ON b w. LA
FiACTl ON DECIMAL$ ANGLES_". B:ZLOC( DIAGRAM,.
A FAmATsfA APPo. 1GITAL DATA RCE S0R A
no,. So27X R-Y ASTzONOMY Eq,ING.
DIMINSLONS AND TOLi IANCES DESIG APPROVAL S I CODD DNT IWG
4 0*. NO.
NEXT ASS'Y u SID ON OT /E4 APPROVAL 178APPLICATION SCALIE INIT WT. L T O'
SC1 FORMI NO. 10-041 NOV. 1966*A

5.0 ENVIRONMENTAL TEST
The S-150 Qualification Unit was subjected to environmental tests per
SCI-1629-005 Qualification Test Plan.
In addition to test performed on the completed experiment, each subassembly
was subjected to appropriate environmental tests and qualified prior to
installation in the experiment.
TEST SEQUENCE AND QUALIFICATION SCHEDULE
The environmental tests were performed in the following order:
(1) Electromagnetic compatability
(2) Accoustic noise
(3) Acceleration
(4) Thermal vacuum with a storage window
(5) Vibration
(5. 1) Sine each axis
(5. 2) Random each axis
(6) Thermal vacuum (flight window)
(7) Pyrotechnic shock
The vibration, thermal vacuum and pyrotechnic shock tests with a flight
window (tests 5, 6 and 7) were performed with minimum time delay between
tests to more realistically subject the thin film window to launch conditions
and at the same time minimize the possibility of window degradation from
non-launch environmental conditions.
20

pj,.- X-Ray PAGE 1 F I
FUNCTIONAL MASTER PLAN ,__"st:,_ 11 -3-7
TITLE S-150 Qualification Schedule -E-SED --
CUSTOMER University of Wisconsin PREAREDG, Frohwein
CONTR ANR _PPRO, EDG. FrohweinCONTR NR L
L 1972 SCHEDULE IN WE KS 1 72 KS END ON 3UN - 8 WKS PROVIDED 1972
TASKS/ MILESTONES _9__ -eN: I Deg __o . . Dec,
2__R.F.I. Testing (SCI) -3 I rR.F. I. Te A-4hermal Vacuum (Wyle) - .
s Acoustic Test (Wyle) - _ _
6, __c-~. _- 4-------- )
8' Acceleration (Wyle) . 1 - i -- - -- -. - - - - - -
9---.--- - '---f! -- Ci-- l- . --l Vibration Test (Wyle) - 1
I . _ -- -. . ..
12 Bracket Qual & Rework o -,--.ermal y-A , !'- --..-
4c ,---i --- - .
1 h V ibration (SW) (SCI) -- .
i .S Viration (FW) (SC I) -- _ . . ._ __ i ....- __..... .... -
25 2ghWd
S--
19. 20
21 - -- -.-- - - -
. . ... ..p y.. . ...ec....c S C , 23i
23 i 24 . , ... .
26 i ...- - . .. ..
-i-- _.30
-SW - Storage Window ...
:'FW - Flight Window

ENVIRONMENTAL TEST AND PERFORMANCE SUMMARY
Environmental testing was started 20 October 1971 with RFI testing. In
broadband radiated the S-150 sensor unit was out of specification from
.15 MHz to 1. 5 MHz, an expected condition that almost exactly duplicates
the old S-027 RFI data.
Thermal Vacuum was started at Wyle Labs on 27 October 1971. Problems
were encountered of storage window leakage. This test was terminated
for investigation of window problems.
Testing was begun on 9 November 1971 for Acoustic noise and was successful.
Acceleration testing was begun on 15 November 1971 and was successful.
Vibration at Wyle Labs was commenced on 29 November 1971 and successful
in both radial and longitudinal. The lateral axis was terminated because of
an uncontrolled "G" buildup. Investigation was started on why this buildup
was occurring.
The second Thermal Vacuum test was started on 16 August 1972 at the SCI
test facility and was completed successfully using a new storage window
support mask on 25 August 1972.
The second Vibration test was started at the SCI test facility on 25 August 1972
using the storage window. The gas system reference tube was broken
and the exhaust valve was locked open after the full duration test sequence
was complete. These items were returned to the customer for repair and
analysis.
21
The third vibration test was started on 10/23/72 using the flight window.
A wire was found loose to the calibrate solenoid, the exhaust valve was
stuck open but later operated okay (contamination was the probable cause),
and the absolute pressure transducer turned into a differential type by
losing its reference vacuum. The open wire was repaired and the trans-
ducer was sent to the manufacturer for evaluation. The third Thermal
Vacuum test was started on 11/7/72 using the same flight window used in
the Vibration testing. The electrical portion of the T. V. test was not
performed as the T. V. test intent was to qualify the flight window equivalent
for flight. Some increased window leakage was noticed but within the
limits imposed for successful experiment operation.
Pyrotechnic Shock was performed on 11/8/72 and was successful.
22

REPORT NO. 4184-1
CERTIFICATION TEST REPORT WYLE JOB NO. 42184
WVLE LABORATORIES HUNTSVILLE FACLTY PAGE NO. 2R(UO Goe,rnors D ve West. Huntsi3e. Alabotm 35100
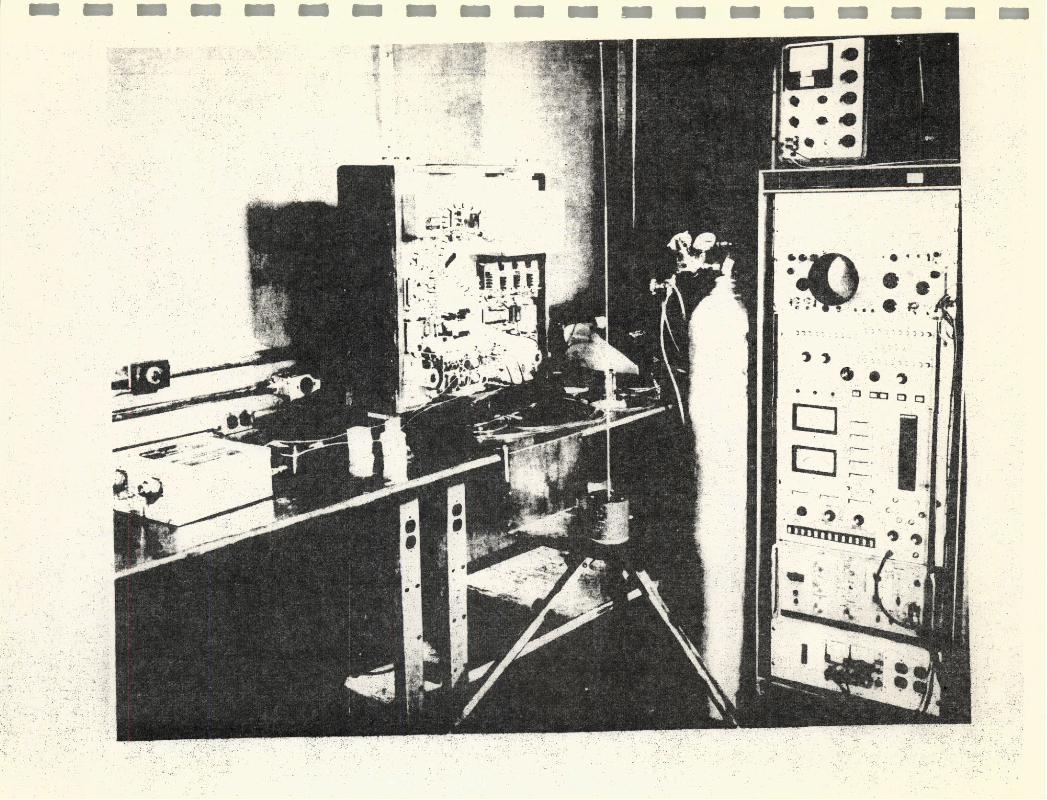
R. PROCEDURES AND RESULTS
Thermal Vacuum Test
The S-150 X-Ray Experiment was installed in a thermal vacuum chamber as
shown in Photograph 1, and the Vacuum Test, as specified in SCI Work State-
ment, Paragraph 4. 0, was commenced.
During the performance of the Thermal Vacuum Test, the SCI Representative
indicated that components of the S-150 X-Ray Experiment had failed to function
properly. These malfunctions occurred in one of the solenoid relays and a
membrane seal. Because of the malfunctions, the SCI Representative stoppedthe test and rescheduled it at a later date. However, other conditions experienced
during the Vibration Test led to the elimination of the thermal vacuum require-ment (reference Wyle Notice of Deviation 42184-1).
Acoustic Test
The S-150 X-Ray Experiment was placed in the reverberant chamber of the 1500
cubic foot acoustic facility and was subjected to a low level test spectrum of
146.5 dB for a period of 2 minutes and a high level test spectrum of 153. 5 dBfor a period of 1 minute. Acoustic spectrums used for the above tests were
adjusted prior to placing the specimen in the test area. The calibration spectrumswere approved by DCAS QAS and the SCI Representative and are included onPages 5 and 6 of this report. Detail test data are included on Pages 22 and 23.
Photograph 2 presents the Acoustic Test setup.
At the conclusion of the Acoustic Test, the test specimen was visually inspected.No damage was noted as a result of the test.
Acceleration Test
The S-150 X-Ray Experiment was attached to the arm of a rotary centrifuge andwas subjected to 10 g acceleration in both directions of the three orthogonal axes.Test duration for each test was 3 minutes. Detail test data sheets are presentedon Pages 24 and 25, and Photograph 3 presents a typical test setup on the centri-fuge.
There was no damage noted to the specimen at the conclusion of the AccelerationTe st.

RADIO FREQUENCY INTERFERENCE
TEST REPORT
ON
X-RAY ASTRONOMY EXPERIMENT
PREPARED BY
GAREY K. BARRELL
RFI ENGINEER
SCI SYSTEMS, INC.

TEST RESULTS
CONDUCTED INTERFERENCE
Broadband
Broadband conducted interference on the input power lines of the test item
was found to be marginal in compliance with the allowable limits of
MIL-I-6181D at .850, 1.0, and 3.5 mHz.
Narrowband
No narrowband signals were detected during this test program.
Data Sheets and Graphs
The data obtained during conducted interference tests is tabulated on Data
Sheets 1 and 2. This data is presented graphically in Figure 3.
RADIATED INTERFERENCE
Broadband
Broadband radiated interference emanating from the test item was found
to exceed the allowable limits of the specification by as much as 13 db at
. 150 and .450 mHz.
Narrowband
No narrowband signals were detected during this test program.
23
Data Sheets and Graphs
The data obtained during the radiated interference tests is tabulated on
Data Sheet 3. This data is presented graphically in Figure 4.
SUSCEPTIBILITY
Conducted Radio Frequency
RF conducted susceptibility characterisitcs of the test item were found to be
within the allowable limits of MIL-I-6181D. No indication of malfunction or
degradation of performance in excess of system specification was detected.
Conducted Audio Frequency
Audio conducted susceptibility characteristics of the test item were found
to be within the allowable limits of MIL-I-6181D. No indication of malfunction
or degradation of performance in excess of system specification was detected.
Radiated Radio Frequency
Radiated radio frequency characteristics of the test item were found to
be within the allowable limits of MIL-I-6181D. No indication of malfunction
or degradation of performance in excess of System Specification was
detected.
The undersigned certifies that the test information contained in this report
is the result of complete and carefully conducted tests and is to the best
of his knowledge true and correct in all respects.
24
oa am ,
S..... ..
tocl cxEp~ l 0r-~
Ai i 7 4o -.o a g
C Q • • f. ' ,d o /" -l* 'a
,. .-r .J , .
II ,.
-' )OIl, '

• .
.
I
?": ;
.D
.
I-
IjI:I:
I, ~:.:
::_i
I+ V
r
I.... .'
I;U
If-c:
I
IY
I

ACCELERATION
The S-150 Sensor was given a pre-acceleration checkout in accordance
with the Qualification test plan and Procedure. The sensor was subjected
to the Acceleration specification 50M71810, para. 5. 2. 5 in an unpowered
condition and pressurized as specified in Section 3.0 of ATP-005. The
test was run at Wyle Labs on their acceleration arm or rotary centrifuge
and was subjected to 10g acceleration in both directions of the orthogonal
axes for three minutes each. Test data is included in this section, with
a photograph of the test and specimen setup also in this section. Subse-
quent to the test, the QTP functional in section 2. 0 of the test plan -005
was again given and verified by QC that no electrical nor mechanical
deterioration including gas leakage thru the thin window. (Reference
Section 8. 1. 6).
25

CI"
I T
~
\
z
m~
-s
'pb~
~
~~
0/j
32p~ )(12
P~i~itjl;0Z
I
~ R
-~
a~~SB~
k p
~rs?-1R;;~~
H
,L
-.
--
--"

ACOUSTIC NOISE
The S-150 Sensor was given a preacoustic checkout in accordance with
the Qualification Test Plan and Procedure 1629-005 and 1629-QTP-001
Respectively. The sensor was subjected to the Acoustic test of 50M71810
paragraph 5. 2.4 in an unpowered condition and pressurized as specified
in section 4.0 of QTP -005. The test was run at Wyle Labs in their acoustic
lab and was subjected to a low level test spectrum of 146. 5 db for a period
of two minutes. In addition, a high level test specturn of 153. 5 db was
run for a period of one minute. All adjustments for acoustical tracking to
the specification errors was done prior to the sensor exposure. Reference
the actual recorded data runs in this section, with a photograph of the
specimen setup.
Subsequent to the test the QTP test was again run no deterioration was noted
either electrically or gas leakage (Reference Section 8. 1. 5).
26

REPORT NO 4 284- I
I'A(d N(
W ,
I
IC T
I,
IE
I -
I
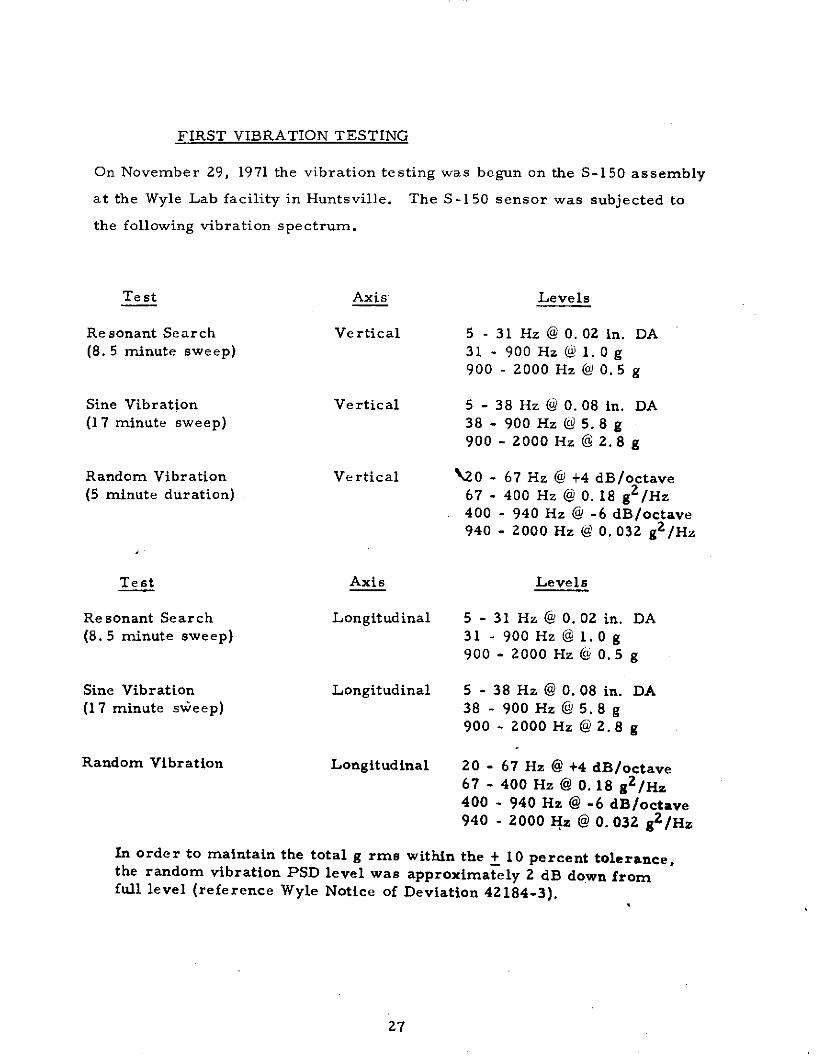
FIRST VIBRATION TESTING
On November 29, 1971 the vibration testing was begun on the S-150 assembly
at the Wyle Lab facility in Huntsville. The S-150 sensor was subjected to
the following vibration spectrum.
Te st Axis Levels
Resonant Search Vertical 5 - 31 Hz @ 0. 02 in. DA(8.5 minute sweep) 31 - 900 Hz @ 1. 0 g
900 - 2000 Hz @ 0. 5 g
Sine Vibration Vertical 5 - 38 Hz @ 0. 08 in. DA(17 minute sweep) 38 - 900 Hz @ 5.8 g
900 - 2000 Hz @ 2. 8 g
Random Vibration Vertical \20 - 67 Hz @ +4 dB/octave(5 minute duration) 67 - 400 Hz @ 0. 18 g 2 /Hz
400 - 940 Hz @ -6 dB/octave940 - 2000 Hz @ 0. 032 g 2 /Hz
Test Axis Levels
Resonant Search Longitudinal 5 - 31 Hz @ 0. 02 in. DA(8.5 minute sweep) 31 - 900 Hz @ 1. 0 g
900 - 2000 Hz @ 0. 5 g
Sine Vibration Longitudinal 5 - 38 Hz @ 0. 08 in. DA(17 minute sweep) 38 - 900 Hz @ 5.8 g
900 - 2000 Hz @ 2.8 g
Random Vibration Longitudinal 20 - 67 Hz @ +4 dB/octave67 - 400 Hz @ 0. 18 gZ2 /Hz400 - 940 Hz @ -6 dB/octave940 - 2000 Hz @ 0. 032 g2 /Hz
In order to maintain the total g rms within the + 10 percent tolerance,the random vibration PSD level was approximately 2 dB down fromfull level (reference Wyle Notice of Deviation 42184-3).
27

Te st Axis Levels
Resonant Search Lateral 5 - 31 Hz @ 0. 02 in. DA
(8.5 minute sweep) 31 - 900 Hz @ 1. 0 g900 - 2000 Hz @ 0. 5 g
Sine Vibration Lateral 5 - 38 Hz @ 0. 08 in. DA
(2. 2 minute sweep) 38 - 67 Hz @ 5. 8 g
The sine vibration was stopped at 67 Hz due to extreme resonance
experienced on test specimen (reference Wyle Notice of Deviation42184-4).
The high resonance experienced across the hinge between the deployment
bracket and the sensor was investigated and ultimately confirmed during
the MSFC deployment bracket qualification testing. (Reference NASA
Letter S&E-ASTN-ADV (72-49) and letter to Mr. Steve Rose from Dr. Alan
Bunner dated January 26, 1972, subject, "Minutes from MSFC Meeting
Concerning S-150 Testing".
: These documents are included in the Deviations and Waviers Section 10. 0
Standard QTP tests were given before and after the vibration runs. The
data sheets for these tests are shown in Section 8. 1. 7.
28
RE1PORI NO. 42184-1
CERTIFICATION TEST REPORT WYrL JOB NO. 42184
(:USTOMER
WYLE LABORATORIES t , . No. _73109
(ONTRACT NAS8-Z1015
MIAN'I'ACT IR1 R SCI
SCI Electronics, Inc. Electronics, Inc.P. O. Box 4208 29Huntsville, Alabama
L IJ )ATI March 21, 1972
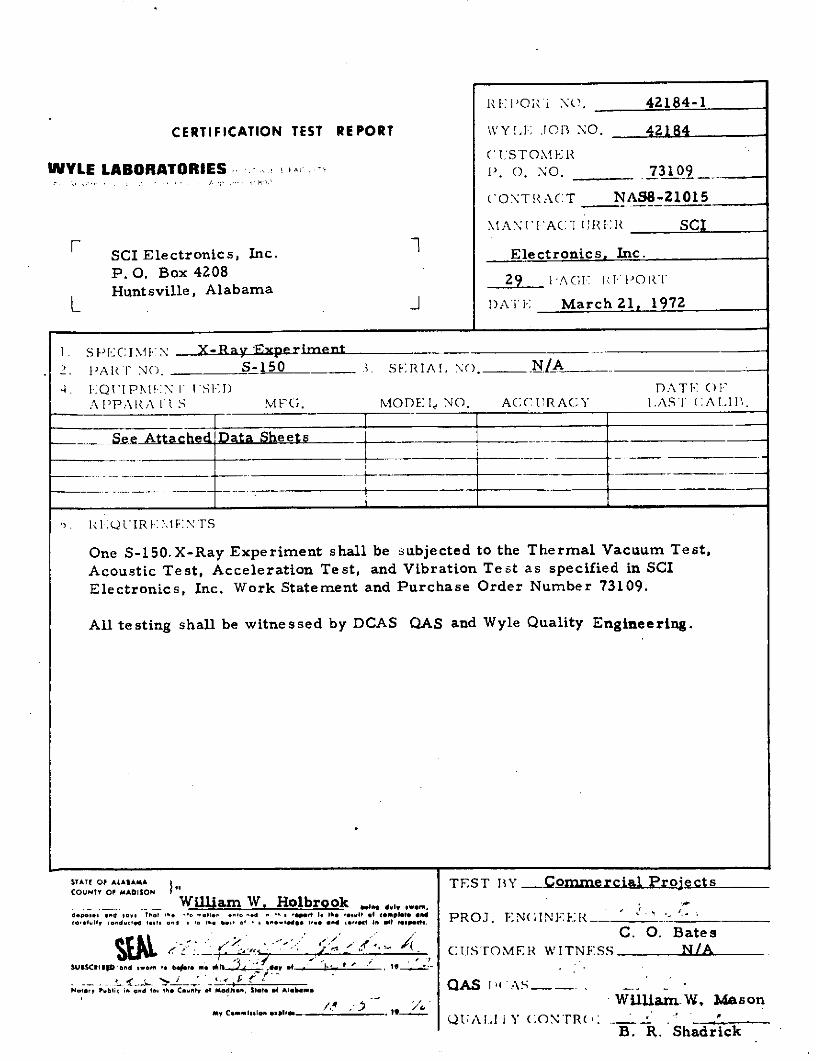
I. StPI:CIM':N X-Ray Experiment
2. I'ARIF NO. S-150 3. SERIAL NO. _/A4. I.QUT'IPNh.N I' SI:I) DAT: (IOF
AFPA\ IAA S MF G. MODE: I NO. ACCURACY LAST C(ALm.
-See AttachdlData Sheets
V. RlQ.UIR1'X: : ENTS
One S-150.X-Ray Experiment shall be subjected to the Thermal Vacuum Test,Acoustic Test, Acceleration Test, and Vibration Test as specified in SCIElectronics, Inc. Work Statement and Purchase Order Number 73109.
All testing shall be witnessed by DCAS QAS and Wyle Quality Engineering.
STATE OF ALASAMA ),. TEST BY Commercial ProiectsCOUNTY Of MADISON
William W. Holbrook .., , .-deo .oe d . . . e . O d Il* e is the eI. , e o tomploo 6 PR OJ E NC IN E R€orefully conduct d fI0$ on a to t1, e be Nol t ledeO tr. In erroct In II e .M81*, 6
C. O. Bates.: CUSOMEI WITNESS N/A
SUSSCRISD oand isorn to bJore e -it . doy , ' 9 " . 1
-_ . ..-, _.. " _.L _ _ ," -"Notery Public in and #*A the County of Modhn, Stt of Al.abama ! - -
.WlliarmW, MasonMy Commision /4o ' " .""QUALI i Y (:ONTR(".
B. R. Shadrick

Page No. 21
NOTICE OF DEVIATION moNo NO __4 8a4-4Po No. 7.3M9. __
DATE 11-30-71
WVLE ,LA ORATORIES T ,I;, IIV. I , ,N trti IS'I Ll E AC, iY Page 1 of 1
TO: SCI
ATTN: Mr. Jim Cobb
PART NAME X-Ray Experiment
PART NO. S-150 SERIAl No. N/A
TEST Vibration
SPECIFICATION SCI Work Statement PARAGRAPH NO 1. O
NOTIFICATION MADE TO: Mr. D. Norris
DATE 11-30-71 r. Witness viA N/A
SPECIFICATION REQUIREMENTS:
The X-Ray Experiment shall be subjected to a resonant search in the lateralaxis in order to determinemrnajor resonances on the Experiment and its mountingbracket. Test levels shall be as follows:
5 - 38 Hz @ 0. 02 in. DA38 - 900 Hz @ 1.0 g peak900 - 2000 Hz @ 0. 5 g peak
DESCRIPTION OF DEVIATION:
The resonant search in the lateral-axis was stopped at the direction of the SCIRepresentative due to a severe resonant condition at 67 Hz.
The accelerometer control points were changed and the resonant search asspecified was performed in the lateral axis. However, due to the number ofresonances noted and the amplitude of the resonances, the lateral axis vibrationat this point was terminated by the SCI Representative.
Specimen returned to SCI and at the direction of SCI, no
SPECIMEN DISPOSITION future tests were performed.
COMMENTS - RECOMMENDATIONS:
DISTRIBUTION:Original: DepartmentS)Cope.,: Cutom.e TEST WITNESS rest ENGINEERI Copy: Quollty Control1 Copy: Field Eng iLneewe -'( (I Copy: Project Ofice REPRESENTING BRANCH HEAI Copy: Contrcts

REPORT NO. 42184-1
3 PAG[ NO I 5
I
Ij
I,
PI TOGRAP 4
rLONGITUDINAL AXIS Sf' TUP

CC
.- 0r

I
REPORT NO. 42184-1
PAGE n O. i7
I
IIe
In PIOTOGRAPH 6
VIBRATION TEST SETUP

VIBRATION#2 Date: August 25, 1972
The vibration test was performed per paragraph 5.0 of the Acceptance
Test Plan 1629-005 Revision B using a storage window.
The sensor successfully completed both sine and random vibration in the
longitudinal and lateral axis and sine vibration in the radial axis. During
the random vibration in the radial axis two failures occurred in the counter
assembly. The exhaust valve was locked in the open state and the gas
system was non operational (See FR #006 Section 9. 0). Analysis revealed
that a copper tube from the gas reference volume to the gas electronic
box had broken. These items were returned to the University of Wisconsin
for repair. Manufacturer analysis of the exhaust valve was to show that
wrong parts were installed in the valve. The copper tube was replaced with
a stainless steel equivalent. Standart QTP tests were given before and
after the vibration sequence. No electrical nor mechanical deterioration,
other than noted above, was observed. Reference Section 8. 1.9, 8. 1. 10,
8. 1. 11, and 8. 1. 12.
29

VIBRATION #3 DATE: October 23, 1972
The vibration test was performed per paragraph 5.0 of the Acceptance
Test Plan 1629-005 Revision B, using a flight window. The sensor
successfully completed both sine and random in all axis.
At the completion of the test sequence a wire to the calibrate solenoid had
become loose and was easily repaired, the exhaust valve was temporarily
stuck in the open position and was fixed by flushing clean gas thru it so
a small foreign comtaminate was probably the cause of the valve sticking.
The absolute pressure transducer was acting as a differential transducer
because of loss of its vacuum reference. The pressure transducer, a
C.F.E. item, was removed and sent directly to the manufacturer for repair
and analysis. The Standard QTP tests were given before and after the
vibration sequence. No electrical nor mechanical deterioration, except
as noted above, was observed. Reference Section 8. 1. 13.
30
THERMAL VACUUM - FIRST ATTEMPT ON OCTOBER 27. 1971
Thermal Vacuum Requirements presented major difficulties in keeping a thin
(flight) window intact when first attempted at Wyle labs in Huntsville.
Several attempts were made to pump down and were terminated when the
thin window ruptured. Attempts at further pumping were discontinued for
a study of the window problem. By later direction, reference, "Minutes
from MSFC Meeting Concerning S-150 Testing" direction was given to do
two types of Thermal Vacuum testing. First a test with storage window
so that the target attitude may be maintained and all electronics properly
tested and second, a test with a flight window qualifying little more than
the flight window itself. The standard QTP test was given the sensor
before testing was begun and is included in Section 8. 1.4.
31

REPORT NO _ -1.
ACA NO 12
SPHOTOGRAPH 1
THERMAL VACUUM SETUP

-Ijufl. N-. -zd" U-
Page No. 18wVYLt Jos NO 42184
NOTICE OF DEVIATION NOD NO 42184-1PO No 73109D*AT 11-4-7!
WVLE LADONATONRES . . Page 1 of 1
TO: SCI
ATTN. Mr. Jim Cobb
PART NAME X-Ray Experiment
PART No S-150 sFIAL NO _ N/A
TEST Thermal Vacuum
SPECIrICATION SCI Work Statement PA AGRAPH NO 4. O0
NOTIFICATION MADE TO: Mr. D. Norris
DATE 11 -4-71 ,, Witness VIA N/A
SPECIFICATION REQUIREMENTS:
The S-150 X-Ray Experiment shall be subjected to the Thermal Vacuum Test
in accordance with SCI Work Statement, Paragraph 4. 0.
DESCRIPTION OF DEVIATION:
During the performance of the Thermal Vacuum Test, the SCI Representative
indicated that components of the S-150 X-Ray Experiment had failed to function
properly. These malfunctions occurred in one of the solenoid relays and a
membrane seal. Because of the malfunctions, the SCI Representative stopped
the test and rescheduled it at a later date. However, other conditions experienced
during the Vibration Test led to the elimination of the thermal vacuum require -ment.
SPECIMEN DISPOSITION Test sequence continued with acoustic testing ____
COMMENTS - RECOMMENDATIONS
DISTRIIITION:Original: Department
( ) oopies: Ctu er TEST WITNESS ItsIT NGINFRe J 'I Copy Ouality Control1 Copy Field Engineering / y1 Copy Proet Office IPtRSENIING __ANC(H FAI
I Copy: Contr cts
THERMAL VACUUM Date: August 16, 1972
The storage window type of thermal vacuum test was accomplished at the
SCI Systems Test Facility. The entire test was run in accordance with
paragraph 5.0 of the Qualification Test Plan -005 and also to Section #10
of the Qualification Test Procedure -001. The sensor was mounted on a
cold plate within the chamber and the Pre T.V. test sequence done as
specified in Paragraph 10. 1 of QTP -001. After stabilization at 325, 000
feet operational electrical data was taken and all systems were nominal.
The chamber temperature was then reduced to -30 0 C, (-0, +5 0 C). Analog
data was taken during the two hour stabilization period and an ATP test
was given at the end of two hour s. A single reading was high by 50 my
and was written up. Later analysis of the measurement showed this
condition to be a normal one and the measurement tolerances were opened
up to cover this drift at low temperature.
Reference Failure Report #004 in Section 9. 0. The chamber temperature
was raised to 45 0 C (+0, -50C) analog data was taken for each 30 minutes.
After two hours of stabilization the analog monitors indicated an increased
gas leakage thru the storage window. The sensor power was briefly
interrupted in order to allow the chamber pressure to return from k 510-4
microns to , 2 x 10⁻⁴ mm at which time the sensor was again powered and
the chamber pressure again rose to near 150 microns. At this unrealistically
low vacuum and with the increased window leakage the test was terminated.
See Failure Report -005 in Section 9.0.
Mr. S. Rose COR MSFC has agreed that the basic objectives of the test
were accomplished, that is, no carona discharge, arcing, and proper
electrical operation in vacuum conditions and thus the last ATP of this
test was waivered. The Standard QTP test was given before and after
32

the test sequence and no evidence of mechanical or electrical deterioration
could be noted. Reference Section 8. 1. 8.
33

MANUFACTURER MODEL NO. DESCRIPTION
Vacuum Industries, Inc. 6300/4800 High Vacuum Chamber48 in. dia. x 54 in. Temperature: -1000 to 250oF
(Shroud) -320oF ultimate with LN 2
Pressure: ambient to 1 x 10⁻⁵
Torr (1 x 10⁻⁷ Torr ultimate)
THERMAL VACUUM TEST FACILITY M183
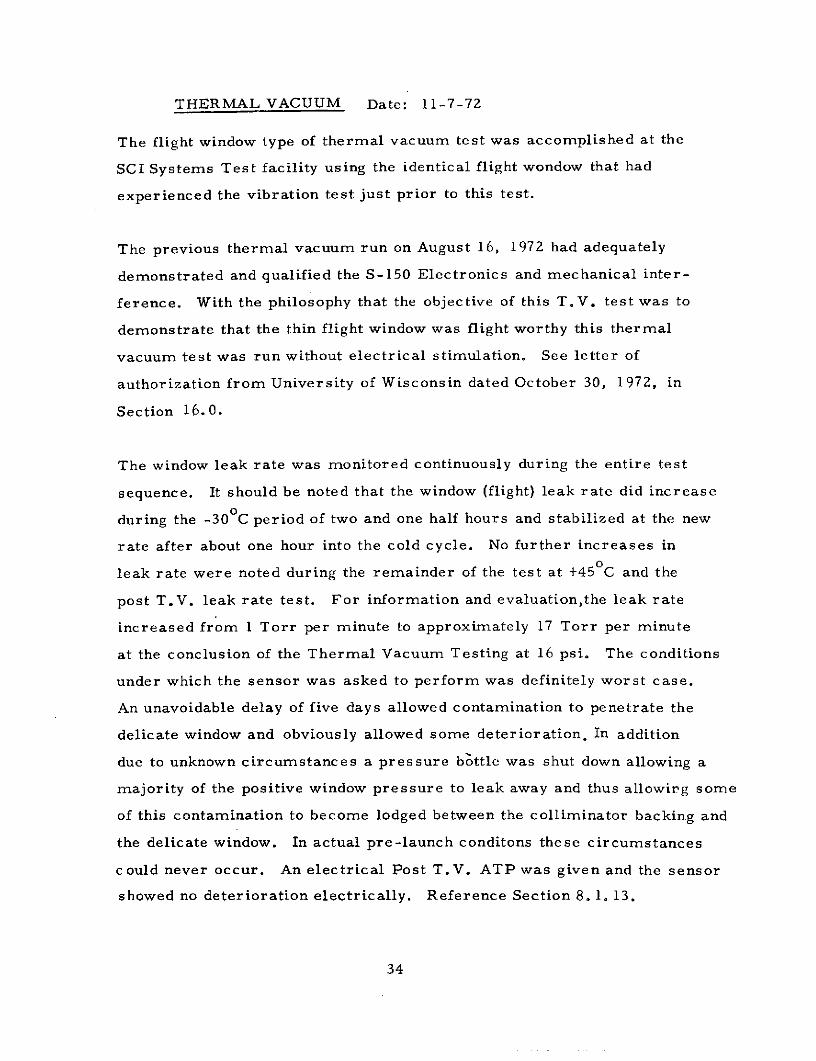
THERMAL VACUUM Date: 11-7-72
The flight window type of thermal vacuum test was accomplished at the
SCI Systems Test facility using the identical flight wondow that had
experienced the vibration test just prior to this test.
The previous thermal vacuum run on August 16, 1972 had adequately
demonstrated and qualified the S-150 Electronics and mechanical inter-
ference. With the philosophy that the objective of this T.V. test was to
demonstrate that the thin flight window was flight worthy this thermal
vacuum test was run without electrical stimulation. See letter of
authorization from University of Wisconsin dated October 30, 1972, in
Section 16.0.
The window leak rate was monitored continuously during the entire test
sequence. It should be noted that the window (flight) leak rate did increase
during the -30 C period of two and one half hours and stabilized at the new
rate after about one hour into the cold cycle. No further increases in
leak rate were noted during the remainder of the test at +450C and the
post T.V. leak rate test. For information and evaluation,the leak rate
increased from 1 Torr per minute to approximately 17 Torr per minute
at the conclusion of the Thermal Vacuum Testing at 16 psi. The conditions
under which the sensor was asked to perform was definitely worst case.
An unavoidable delay of five days allowed contamination to penetrate the
delicate window and obviously allowed some deterioration. In addition
due to unknown circumstances a pressure bottle was shut down allowing a
majority of the positive window pressure to leak away and thus allowirg some
of this contamination to become lodged between the colliminator backing and
the delicate window. In actual pre-launch conditons these circumstances
could never occur. An electrical Post T.V. ATP was given and the sensor
showed no deterioration electrically. Reference Section 8. 1. 13.
34

PYROTECHNIC SHOCK
Immediately after Thermal Vacuum post ATP check the live squibs were
placed within the actuators and fired from two 12V car batteries in series.
Inspection immediately after the firing determined that all ordinance had
fired and all bolts had separated. A post ATP was given and no change in the
condition of the sensor unit could be noted, either electrically or mechanically.
Reference data sheets Section 8. 1. 14.
35
IOU
4t
lob
cccccccccccccccccccc
ccccc
CCCCCCCCCCCC
0 000 0
OFW. WM

gli
t
IAI
_ ,
.,
I

6.0 GROUND SUPPORT EQUIPMENT
The S-027 Ground Support Equipment was modified and used for the S-150
experiment. The mod ification included adding additional command capability
for the gas exhaust value, and re-naming some channels/functions.
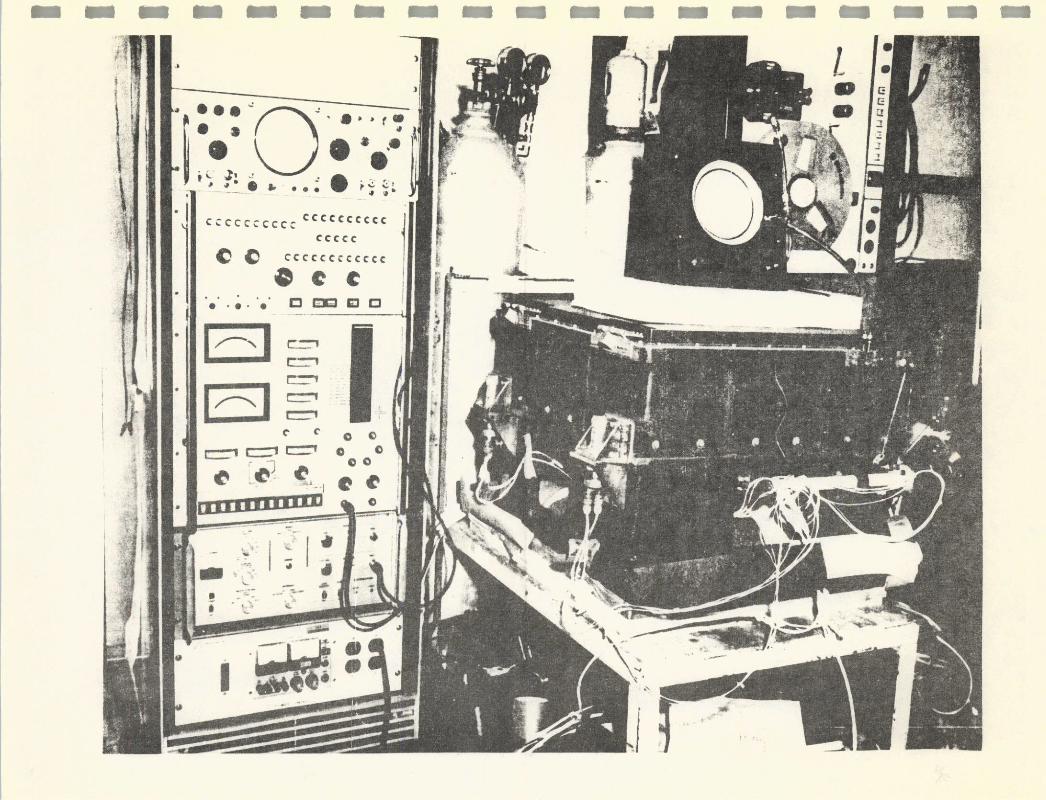
A photograph of one set of the modified GSE is shown in Figure 6. 0-1.
Each of the two identical consoles contains an oscilloscope, a 128 channel
analyzer, an analog processing and display unit, a digital processing and
display unit and a system power supply. In addition to the equipment
contained in the console, the Ground Support Equipment includes a Strip
Chart Recorder, a Pulse Generator and a Line Printer. The digital and
analog processing units interface with the experiment and are the heart
of the Ground Support Equipment. These units will be discussed further
in the following sections.

I
GROUND SUPPORT EQUIPMENT, 4120
X-RAY ASTRONOMY EXPERIMENT
6. 1 ANALOG PROCESSING AND DISPLAY UNIT
The analog processing unit provides displays for the twenty-five analog
data channels in the form of meter readouts and GO/NO-GO indicator
lights. Each channel is also routed to a patchboard to allow recordt4g
the data on external recorders. The five supplemental analog measurements
which are not active channels in the experiment, but are included to provide
additional measurement capability to the Ground Support Equipment, are
also displayed on the analog panel.
6.2 DIGITAL PROCESSING AND DISPLAY UNIT
The digital unit provides information to the experiment Digital Data Processor
which is normally provided by the launch vehicle instrument unit such as
timing and synchronization pulses. The digital outputs from the experiment
are analyzed and displayed by lights on the Digital Front Panel.
Selector switches are included to allow selection and display of any of the
twelve data groups and any of the five ten bit words contained in each data
group.
In addition to the digital data display, commands to apply experiment
power, open or close the exhaust valve and calibrate the experiment
originate in the unit and are activated by lighted pushbutton switches.
37

7.0 CONCLUSION
The S-150 experiment was integrated to Vehicle #207 with few problems,
and was flown at 7:08 EDT on 28th July 1973. The sensor provided normal
engineering data and apparently good x-ray data for approximately the first
two hours. The sensor was then inadvertently maneuvered so that it scanned
into the sun for a period of about 17 minutes. About 5 minutes into that sun
time the kimfoil window leak rate increased to the point where the electronic
regulator was cycling very rapidly. This caused the 30 psi supply line
pressure to drop and not be able to provide the necessary gas flow. Thus,
the sensor pressure began to drop and the counter H. V. supply was auto-
matically turned off ending the useful life-time of the experiement.
The technical operation of the S-150 experiment, both pre-flight and flight,
was nominal and x-ray data was observed during various periods of the
active experiment life-time.
38