Embed Size (px)
Citation preview

CENTRAL FLORIDA ASSESSMENT COLLABORATIVE
Individual Test Item Specifications
Liberal Arts Mathematics 2
2014

2
Table of Contents
I. Guide to the Individual Benchmark Specifications......................................................................4
Benchmark Classification System...............................................................................................4
Definitions of Benchmark Specifications...................................................................................6
II. Individual Benchmark Specifications for Liberal Arts Mathematics 2......................................7
MAFS.912.A-APR.2.3................................................................................................................7
MAFS.912.A-APR.3.4................................................................................................................9
MAFS.912.A-APR.4.6..............................................................................................................11
MAFS.912.A-REI.3.7...............................................................................................................13
MAFS.912.A-SSE.2.3...............................................................................................................14
MAFS.912.F-IF.3.7...................................................................................................................16
MAFS.912.F-IF.3.8...................................................................................................................18
MAFS.912.F-IF.3.9...................................................................................................................20
MAFS.912.F-LE.1.2.................................................................................................................22
MAFS.912.F-LE.1.3.................................................................................................................24
MAFS.912.F-LE.1.4.................................................................................................................26
MAFS.912.F-LE.2.5.................................................................................................................28
MAFS.912.S-CP.1.4.................................................................................................................30
MAFS.912.S-IC.1.1..................................................................................................................32
MAFS.912.S-IC.2.4..................................................................................................................34
MAFS.912.S-IC.2.5..................................................................................................................35
MAFS.912.G-GPE.1.1..............................................................................................................37
MAFS.912.G-GPE.1.2..............................................................................................................39
2

3
MAFS.912.G-GPE.2.4..............................................................................................................41
MAFS.912.G-GPE.2.5..............................................................................................................43
MAFS.912.N-CN.1.1................................................................................................................45
MAFS.912.N-CN.3.7................................................................................................................47
3

4
I. Guide to the Individual Benchmark Specifications
Content specific guidelines are given in the Individual Benchmark Specifications for each course. The Specifications contains specific information about the alignment of items with the Florida Standards. It identifies the manner in which each benchmark is assessed, provides content limits and stimulus attributes for each benchmark, and gives specific information about content, item types, and response attributes.
4

5
Definitions of Benchmark Specifications
The Individual Benchmark Specifications provides standard-specific guidance for assessment item development for CFAC item banks. For each benchmark assessed, the following information is provided:
Reporting Category
is a grouping of related benchmarks that can be used to summarize and report achievement.
Standard refers to the standard statement presented in the Florida Standards.
Benchmark refers to the benchmark statement presented in the standard statement in the Florida Standards. In some cases, two or more related benchmarks are grouped together because the assessment of one benchmark addresses another benchmark. Such groupings are indicated in the Also Assesses statement.
Item Types are used to assess the benchmark or group of benchmarks.
Cognitive Complexity Level
classifies the type and level of thinking and reasoning required of a student for achievement of the benchmark.
Benchmark Clarifications
explain how achievement of the benchmark will be demonstrated by students. In other words, the clarification statements explain what the student will do when responding to questions.
Content Limits define the range of content knowledge and that should be assessed in the items for the benchmark.
Stimulus Attributes
define the types of stimulus materials that should be used in the items, including the appropriate use of graphic materials and item context or content.
Response Attributes
define the characteristics of the answers that a student must choose or provide.
Sample Items are provided for each type of question assessed. The correct answer is provided for each sample item.
5

6
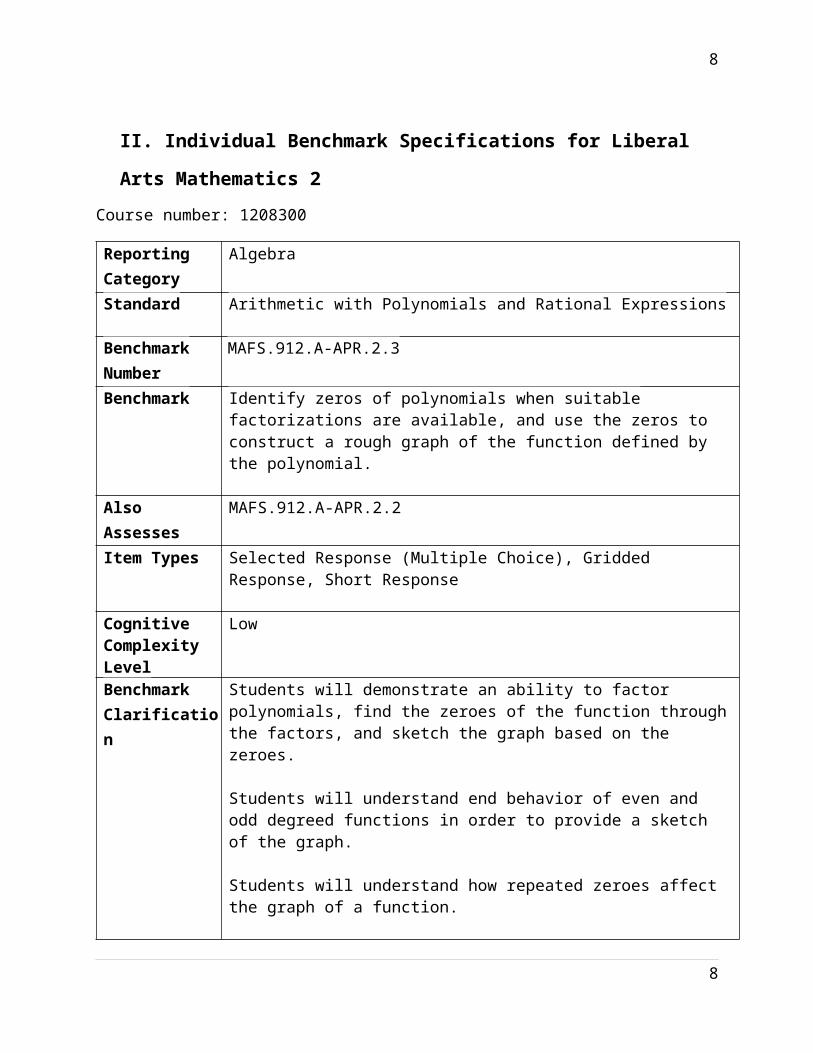
II. Individual Benchmark Specifications for Liberal Arts Mathematics 2Course number: 1208300
Reporting Category
Algebra
Standard Arithmetic with Polynomials and Rational Expressions
Benchmark Number
MAFS.912.A-APR.2.3
Benchmark Identify zeros of polynomials when suitable factorizations are available, and use the zeros to construct a rough graph of the function defined by the polynomial.
Also Assesses MAFS.912.A-APR.2.2
Item Types Selected Response (Multiple Choice), Gridded Response, Short Response
Cognitive Complexity Level
Low
Benchmark Clarification
Students will demonstrate an ability to factor polynomials, find the zeroes of the function through the factors, and sketch the graph based on the zeroes.
Students will understand end behavior of even and odd degreed functions in order to provide a sketch of the graph.
Students will understand how repeated zeroes affect the graph of a function.
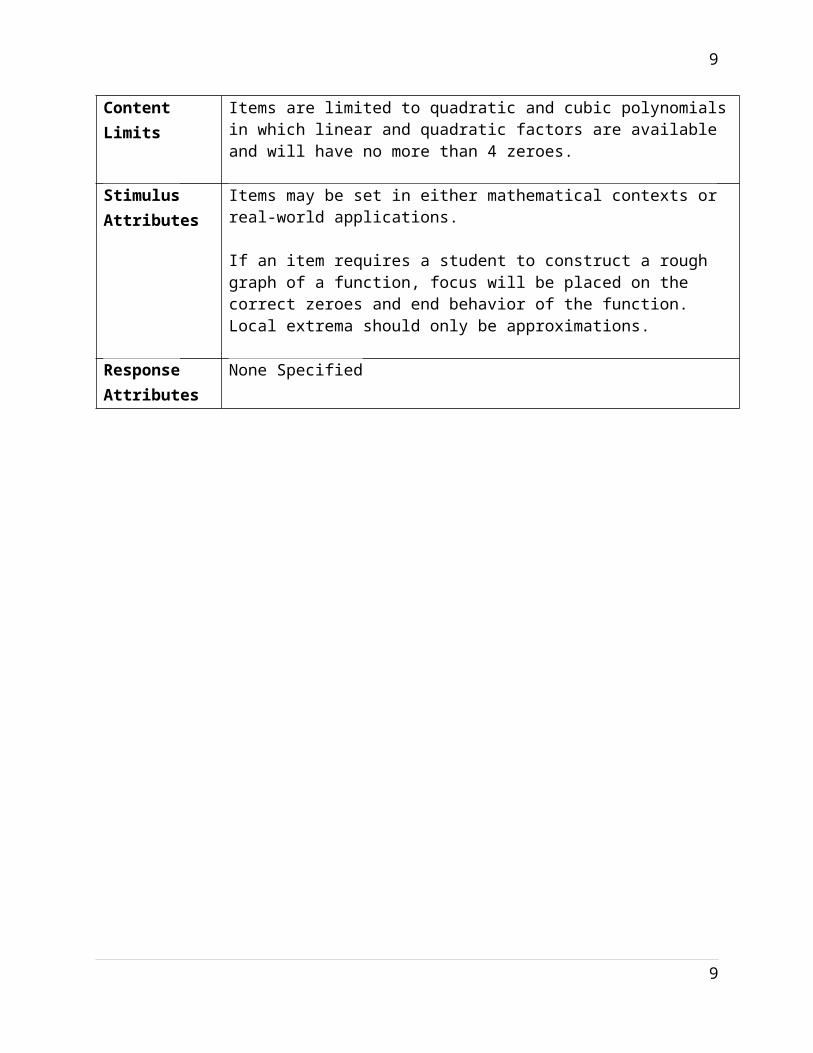
Content Limits Items are limited to quadratic and cubic polynomials in which linear and quadratic factors are available and will have no more than 4 zeroes.
Stimulus Attributes
Items may be set in either mathematical contexts or real-world applications.
If an item requires a student to construct a rough graph of a function, focus will be placed on the correct zeroes and end behavior of the function. Local extrema should only be approximations.
Response Attributes
None Specified
6

7
Sample Items 1. Which of the following cubic functions could generate the graph below with zeros at (3, 0) and (-3, 0)?
A. f (x)=(x2−9)(x−3)B. f (x)=(x2−9)(x+3)C. f (x)=(x2−3)(x+3)D. f (x)=(x2−3)(x−9)
Correct Answer: A
7
Description: The graph at left shows a cubic function with a zero at (-3,0) and a repeated zero at (3,0).
8
Reporting Category
Algebra
Standard Arithmetic with Polynomials and Rational Expressions
Benchmark Number
MAFS.912.A-APR.3.4
Benchmark Prove polynomial identities and use them to describe numerical relationships. For example, the polynomial identity (x2+ y ²) ²=(x ² – y ²) ²+(2 xy ) ² can be used to generate Pythagorean Triples.
Also Assesses N/A
Item Types Selected Response (Multiple Choice ), Gridded Response
Cognitive Complexity Level
Low
Benchmark Clarification
Students will apply common identities for sum, difference, and multiplication of polynomials.
Content Limits Items will be limited to quadratic, cubic, and quartic polynomials.
Stimulus Attributes
Items may be set in either mathematical contexts or real-world applications.
Response Attributes
None specified
8
9
Sample Items 1. Which polynomial identity is demonstrated below?
(x2−2 x−8)2
¿(x2)2+(−2 x)2+(−8)2+2( x2 ∙−2 x)+2(x2∙−8)+2(2 x ∙−8)¿ x4−4 x3−12 x2+32 x−64
A. cube of a binomialB. cube of a trinomialC. square of a binomialD. square of a trinomial
Correct Answer: D
2. Which of the following is the equivalent of ( x−3 )2?
A. x2+6 x+9B. x2+6 x+6C. x2−6 x+9D. x2−6 x+6
Correct Answer: C
9

10
Reporting Category
Algebra
Standard Arithmetic with Polynomials and Rational Expressions
Benchmark Number
MAFS.912.A-APR.4.6
BenchmarkRewrite simple rational expressions in different forms; write
a(x )b(x ) in the form
q (x)+ r (x)b(x )
, where a (x), b (x), q (x), and r (x ) are polynomials with the degree of
r (x ) less than the degree of b (x), using inspection, long division, or, for the more complicated examples, a computer algebra system.
Also Assesses N/A
Item Types Selected Response (Multiple Choice)
Cognitive Complexity Level
Moderate
Benchmark Clarification
Students will apply various theorems to find complex zeros of polynomial functions.
Students will divide polynomials and relate the result to the remainder and factor theorem.
Student will utilize the Fundamental Theorem of Algebra to determine the number of zeros and find the rational zeros of a polynomial using Descartes’ Rule of Signs.
Content Limits Polynomials must be factorable using factoring, graphing, synthetic division (with both a zero remainder and # value remainders), grouping, or finding the greatest common factor.
Stimulus Attributes
Items may be set in either mathematical contexts or real-world applications.
Response Attributes
Selected Response answers and distractors may have complex factors for the polynomial.
Selected Response answers and distractors may have number value remainders for synthetic division.
10

11
Sample Items 1. Which of the following represents the simplification of the following expression?
(9 x2−41 x−6 ) ÷ ( x−4 )
A. 9 x−5 with a remainder of –26B. 9 x−41 with a remainder of 4C. 9 x−5 with a remainder of –14D. 9 x+5 with a remainder of 14
Correct Answer: A
2. What are the roots of the following polynomial equation?
f ( x )=x3−2x2+10 x+136
A. −3 ± 5i, −4B. 3 ±5 i, −4C. −3 ± i, 4D. 3 ±i, 4
Correct Answer: B
11

12
Reporting Category
Algebra
Standard Reasoning with Equations & Inequalities
Benchmark Number
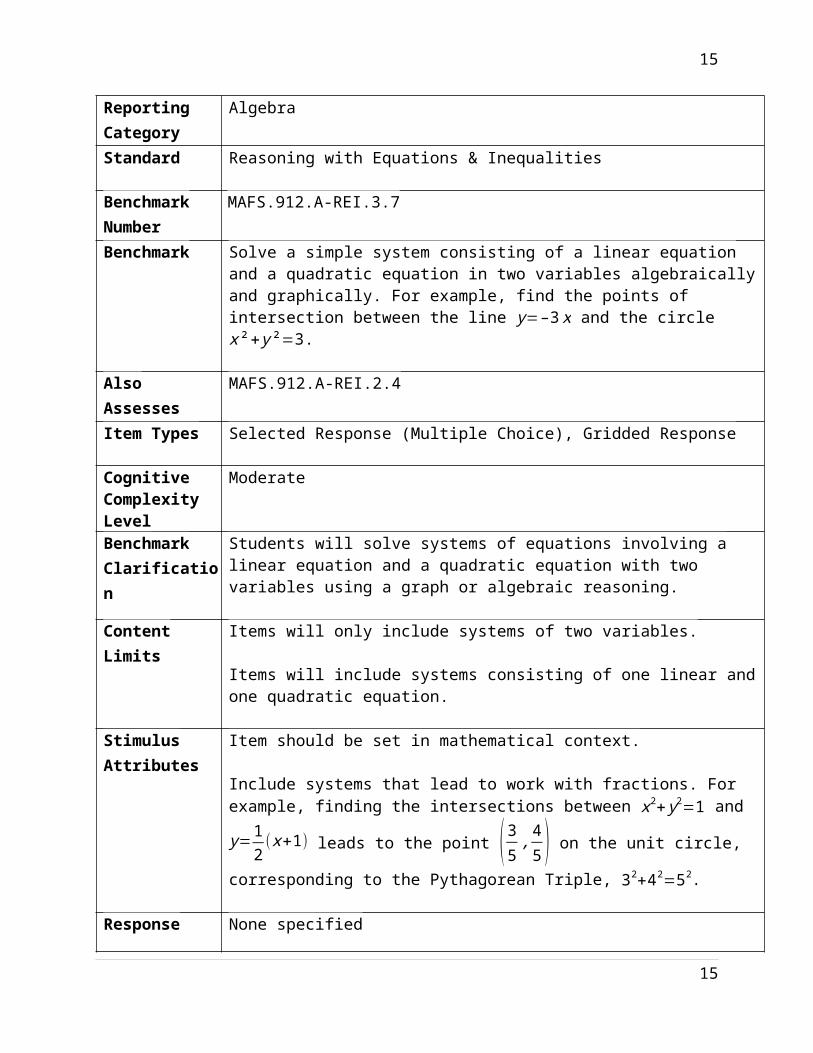
MAFS.912.A-REI.3.7
Benchmark Solve a simple system consisting of a linear equation and a quadratic equation in two variables algebraically and graphically. For example, find the points of intersection between the line y=– 3 x and the circle x ²+ y ²=3.
Also Assesses MAFS.912.A-REI.2.4
Item Types Selected Response (Multiple Choice), Gridded Response
Cognitive Complexity Level
Moderate
Benchmark Clarification
Students will solve systems of equations involving a linear equation and a quadratic equation with two variables using a graph or algebraic reasoning.
Content Limits Items will only include systems of two variables.
Items will include systems consisting of one linear and one quadratic equation.
Stimulus Attributes
Item should be set in mathematical context.
Include systems that lead to work with fractions. For example, finding the
intersections between x2+ y2=1 and y=12(x+1) leads to the point ( 3
5, 45 ) on the
unit circle, corresponding to the Pythagorean Triple, 32+42=52.
Response Attributes
None specified
Sample Items 1. The following system has two solutions.
{ y=3 x+22 x2− y=0
What is the y-coordinate of the solution found in the first quadrant?
Correct Answer: 8
12

13
Reporting Category
Algebra
Standard Seeing Structure in Expressions
Benchmark Number
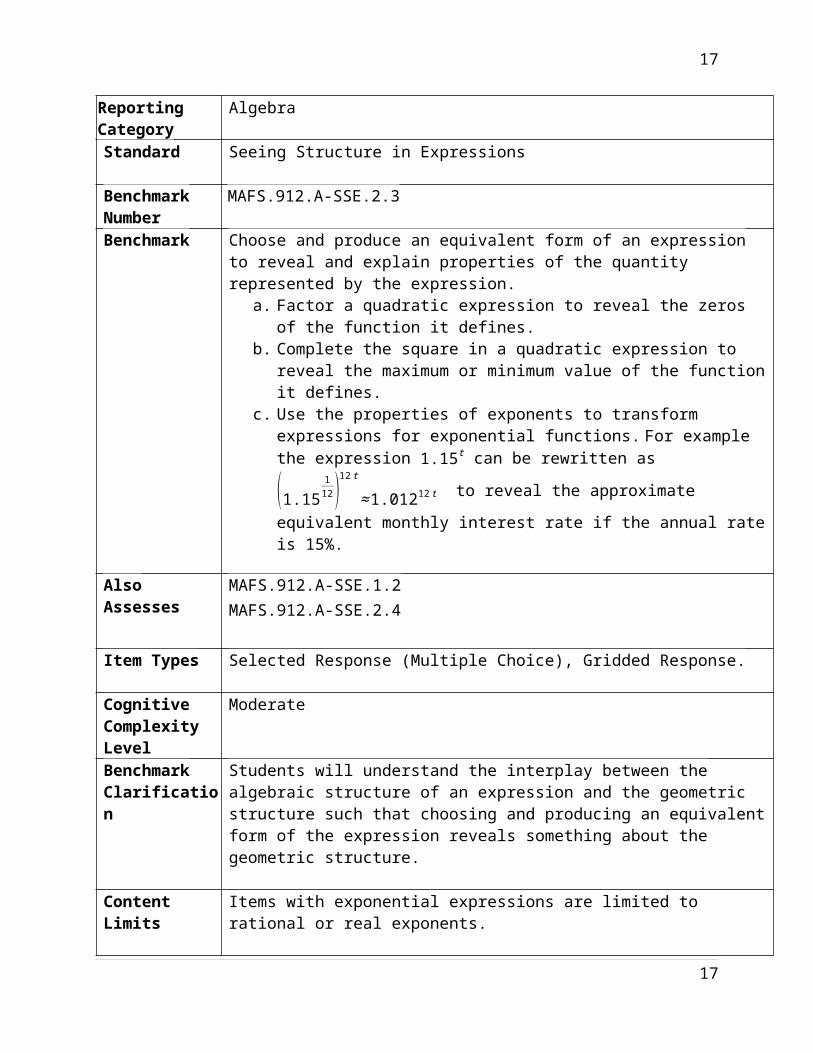
MAFS.912.A-SSE.2.3
Benchmark Choose and produce an equivalent form of an expression to reveal and explain properties of the quantity represented by the expression.
a. Factor a quadratic expression to reveal the zeros of the function it defines.b. Complete the square in a quadratic expression to reveal the maximum or
minimum value of the function it defines.c. Use the properties of exponents to transform expressions for exponential
functions. For example the expression 1.15t can be rewritten as
(1.15112 )12 t
≈ 1.01212t to reveal the approximate equivalent monthly interest
rate if the annual rate is 15%.
Also Assesses MAFS.912.A-SSE.1.2 MAFS.912.A-SSE.2.4
Item Types Selected Response (Multiple Choice), Gridded Response.
Cognitive Complexity Level
Moderate
Benchmark Clarification
Students will understand the interplay between the algebraic structure of an expression and the geometric structure such that choosing and producing an equivalent form of the expression reveals something about the geometric structure.
Content Limits Items with exponential expressions are limited to rational or real exponents.
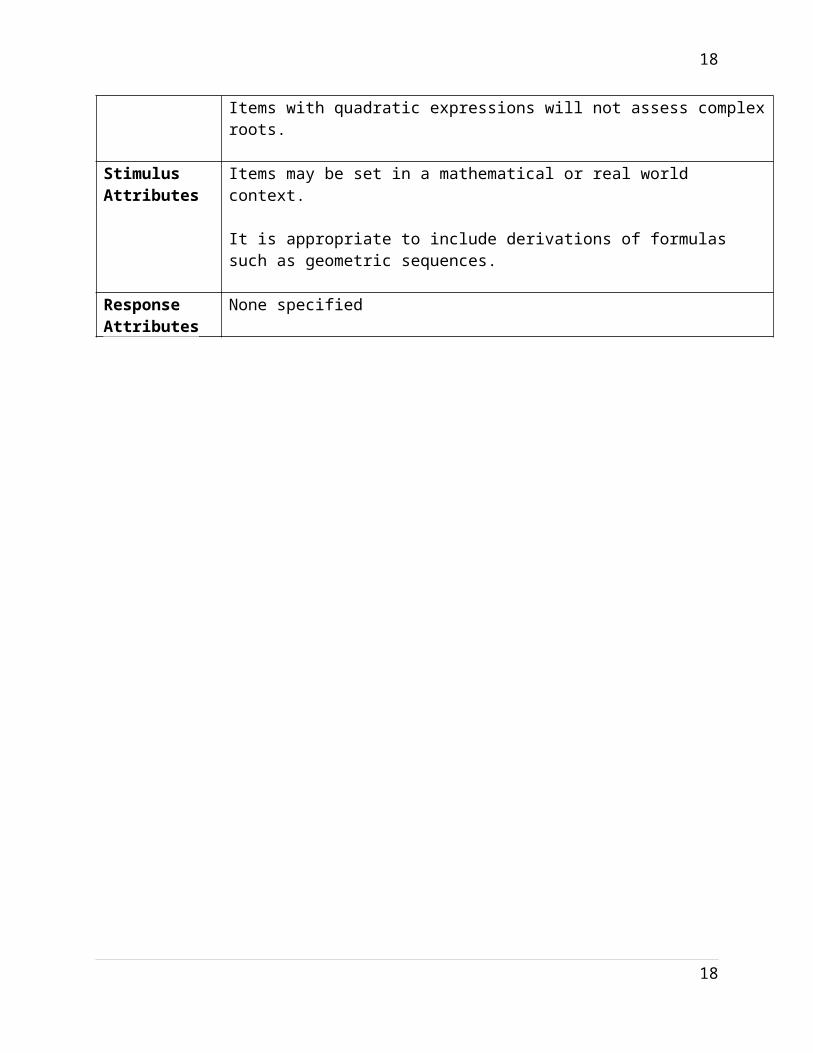
Items with quadratic expressions will not assess complex roots.
Stimulus Attributes
Items may be set in a mathematical or real world context.
It is appropriate to include derivations of formulas such as geometric sequences.
Response Attributes
None specified
13

14
Sample Items 1. Jackson throws a ball straight up in the air from an initial height of 6 feet at an initial rate of 18 feet/second. Using the quadratic function, f (t )=−16 t2+v0t +h0, where t represents the time in seconds after the ball is released, v0 represents the initial velocity at t=0, and h0 represents the initial height at t=0, how many seconds will the ball stay in the air? (round to three decimal places)
Correct Answer: 1.394
2. Consider the quadratic equation: y=x2+6 x+1. Which of the following correctly shows the equivalent vertex form and identifies the correct vertex?
A. y= (x+3 )2+1 ; (3,1 )B. y= (x+3 )2+1 ; (−3,1 )C. y= (x+3 )2−8 ; (3 ,−8 )D. y= (x+3 )2−8 ; (−3 ,−8 )
Correct Answer: D
14
15
Reporting Category
Functions
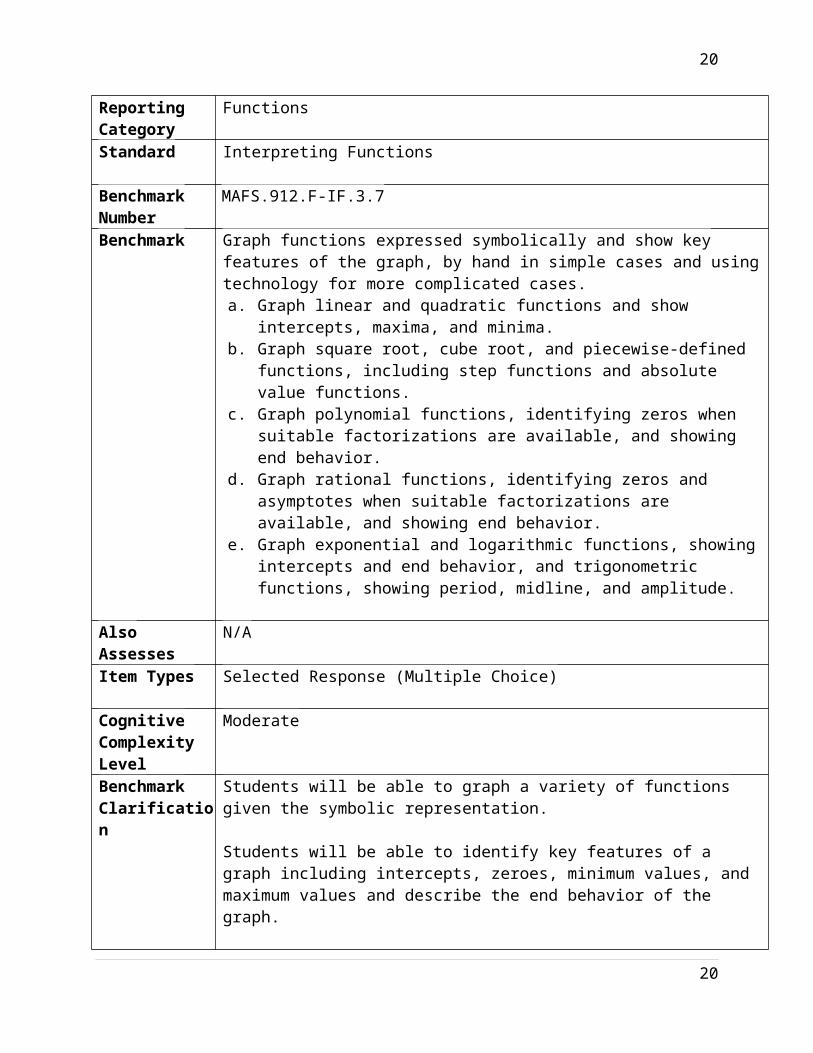
Standard Interpreting Functions
Benchmark Number
MAFS.912.F-IF.3.7
Benchmark Graph functions expressed symbolically and show key features of the graph, by hand in simple cases and using technology for more complicated cases.a. Graph linear and quadratic functions and show intercepts, maxima, and
minima.b. Graph square root, cube root, and piecewise-defined functions, including step
functions and absolute value functions.c. Graph polynomial functions, identifying zeros when suitable factorizations are
available, and showing end behavior.d. Graph rational functions, identifying zeros and asymptotes when suitable
factorizations are available, and showing end behavior.e. Graph exponential and logarithmic functions, showing intercepts and end
behavior, and trigonometric functions, showing period, midline, and amplitude.
Also Assesses N/A
Item Types Selected Response (Multiple Choice)
Cognitive Complexity Level
Moderate
Benchmark Clarification
Students will be able to graph a variety of functions given the symbolic representation.
Students will be able to identify key features of a graph including intercepts, zeroes, minimum values, and maximum values and describe the end behavior of the graph.
Content Limits Functions will be limited to linear, quadratic, square root, piecewise, absolute value, polynomial, rational, and exponential functions.
Stimulus Attributes
Item should be set in mathematical context.
Response Attributes
None Specified
15

16
Sample Items 1. Which of the following functions is represented by this graph?
A. f (x)= 2x−3
+4
B. f (x)= 3x+2
−4
C. f (x)= 2x+3
+4
D. f (x)= 3x−4
+2
Correct Answer: C
16
Description: The graph at left shows a rational function with a vertical asymptote at x=−3 and a horizontal asymptote at y=4.
17
Reporting Category
Functions
Standard Interpreting Functions
Benchmark Number
MAFS.912.F-IF.3.8
Benchmark Write a function defined by an expression in different but equivalent forms to reveal and explain different properties of the function.
a. Use the process of factoring and completing the square in a quadratic function to show zeros, extreme values, and symmetry of the graph, and interpret these in terms of a context.
b. Use the properties of exponents to interpret expressions for exponential functions. For example, identify percent rate of change in functions such as y= (1.02 )t , y= (0.97 )t, y= (1.01 )12 t, y= (1.2 )
t10 , and classify them as
representing exponential growth or decay.
Also Assesses N/A
Item Types Selected Response (Multiple Choice)
Cognitive Complexity Level
Moderate
Benchmark Clarification
Students will use the process of factoring and completing the square in a quadratic function to show zeros, extreme values, and symmetry of the graph, and interpret these in terms of a context.
Students will use the properties of exponents to interpret expressions for exponential functions.
Content Limits Tasks may involve quadratic functions and exponential functions.
The quadratic functions must be solvable using factoring or completing the square.
Stimulus Attributes
Items may be set in either mathematical contexts or real-world applications.
Response Attributes
May include a graph, features of a graph, or an equation.
17
18
Sample Items 1. Colton is trying to figure out how to maximize his profits from the cupcake stand he recently opened. The formula he has calculated is p=−750(c−2.5)2+400, where p is his profit and cis the price he charges for each cupcake. How much should he charge to maximize profits?
A. $1.25B. $2.00C. $2.50D. $4.00
Correct Answer: C
2. The benefits of writing quadratic functions in vertex form are to easily identify the vertex of the parabola as well as determine which direction the parabola opens. Convert this quadratic function from standard form to vertex form: y=x2−8 x+12
A. y= (x−4 )2−4B. y= (x−8 )2−12C. y= (x−12 )2+8D. y= (x+4 )2−8
Correct Answer: A
18
19
Reporting Category
Functions
Standard Interpreting Functions
Benchmark Number
MAFS.912.F-IF.3.9
Benchmark Compare properties of two functions each represented in a different way (algebraically, graphically, numerically in tables, or by verbal descriptions). For example, given a graph of one quadratic function and an algebraic expression for another, say which has the larger maximum.
Also Assesses N/A
Item Types Selected Response (Multiple Choice), Gridded Response
Cognitive Complexity Level
Moderate
Benchmark Clarification
Students will compare key aspects of two functions that are each represented in a different manner. Properties of functions may include but are not limited to: rate of change, continuity, minimums, maximum, inverses, domain, or range.
Content Limits Functions will be limited to linear, quadratic, square root, piecewise, absolute value, polynomial, rational, and exponential functions.
Functions will be explicitly given in either algebraic, numeric, or graphical form.
Stimulus Attributes
Item should be set in mathematical context.
Items should include at least two of the following: graph, table, verbal description, or equation.
Response Attributes
None Specified
19
20
Sample Items 1. The graph of f (x) is shown below.
The function of g(x ) is given below:g ( x )=−x2+3 x+1
Which function has the higher maximum?
A. f (x)B. g(x )C. They have the same maximum.D. There is not enough information.
Correct Answer: B
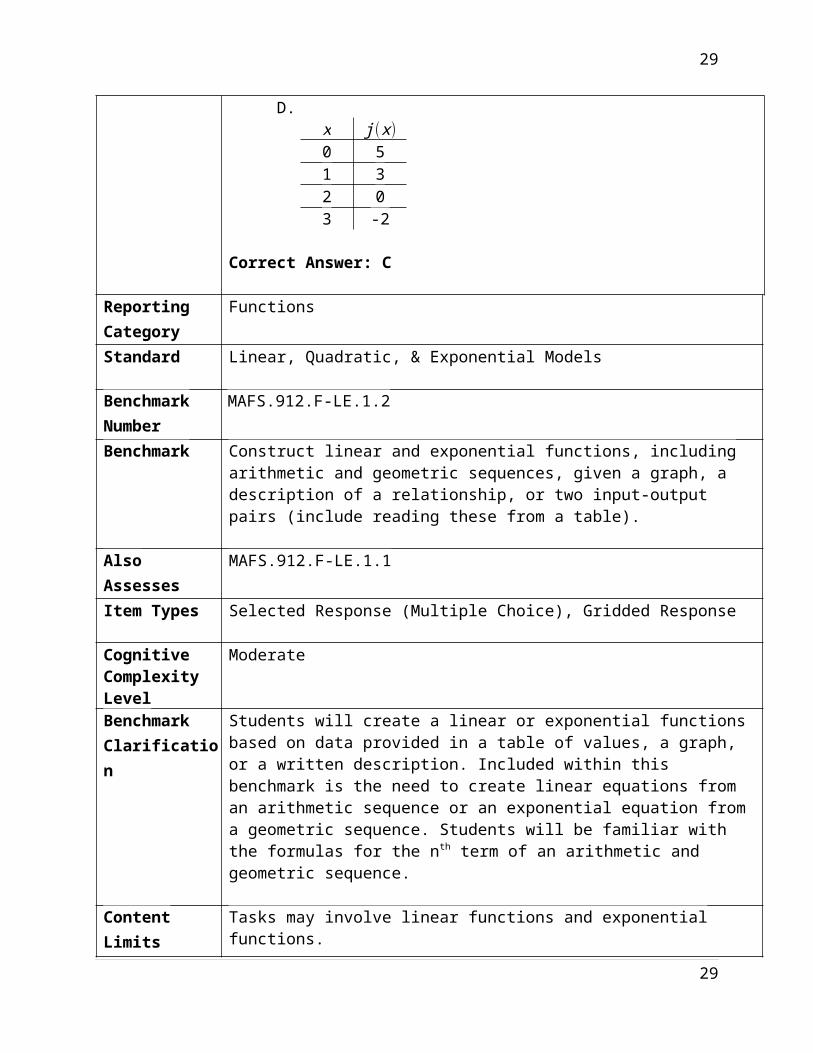
2. Identify which of the following functions is not continuous at x=2.
A. f ( x )=x2−4B. The linear function g(x ) with a slope of 2 and a y-intercept of 2.C. The function h ( x ) graphed below:
D.x j(x )0 51 32 03 -2
Correct Answer: C
20
Description: A parabola graphed on a Cartesian Coordinate plane that opens down. The graph has a maximum at (2.5, 2.25) and intercepts the x axis at x=1 and
x=4.
Description: A rational function with a vertical asymptote at x=2.

21
Reporting Category
Functions
Standard Linear, Quadratic, & Exponential Models
Benchmark Number
MAFS.912.F-LE.1.2
Benchmark Construct linear and exponential functions, including arithmetic and geometric sequences, given a graph, a description of a relationship, or two input-output pairs (include reading these from a table).
Also Assesses MAFS.912.F-LE.1.1
Item Types Selected Response (Multiple Choice), Gridded Response
Cognitive Complexity Level
Moderate
Benchmark Clarification
Students will create a linear or exponential functions based on data provided in a table of values, a graph, or a written description. Included within this benchmark is the need to create linear equations from an arithmetic sequence or an exponential equation from a geometric sequence. Students will be familiar with the formulas for the nth term of an arithmetic and geometric sequence.
Content Limits Tasks may involve linear functions and exponential functions.
Multi-step equations should be included.
A scientific calculator with the number e function is required.
Stimulus Attributes
Item should be set in mathematical or real world context.
Tables and graphs may be included.
If using the nth term formula for an arithmetic or geometric sequence, the formulas will be provided.
Items may ask students to find a specific term in an arithmetic or geometric sequence using the linear or exponential equation.
Response Attributes
Tables and graphs should be included.
21

22
Sample Items 1. Consider the following sequence of numbers:
3 7 11 15…
Which of the following equations best models this sequence where x represents the term number and y represents the value of the term?
A. y=3 ∙4x−1
B. y=4 ∙ 3x−1
C. y=4 ( x−1 )+3
D. y=3 ( x−1 )+4
Correct Answer: C
22

23
Reporting Category
Functions
Standard Linear, Quadratic, & Exponential Models
Benchmark Number
MAFS.912.F-LE.1.3
Benchmark Observe using graphs and tables that a quantity increasing exponentially eventually exceeds a quantity increasing linearly, quadratically, or (more generally) as a polynomial function.
Also Assesses MAFS.912.F-LE.1.1
Item Types Selected Response (Multiple Choice), Gridded Response
Cognitive Complexity Level
Moderate
Benchmark Clarification
Students will interpret growth rates of any polynomial function (especially linear and quadratic), as compared to exponential functions.
Content Limits Linear, quadratic and other polynomial functions will be compared to exponential functions.
Stimulus Attributes
Items may be set in either real-world or mathematical context.
Graphics may be used, as appropriate.
Response Attributes
None Specified
23

24
Sample Items 1. What will be the difference in dollars at the end of the investment between $1000 at 5% interest compounded continuously for 5 years and $1000 at 5% simple interest for 5 years? The formula for simple interest is I=Prt where I is the amount of interest, P is the initial amount, r is the annual interest rate, and t is the number of years. The formula for continuously compounded interest is A=P ert whereA is the total amount including interest, P is the initial amount, r is the annual interest rate, and t is the number of years.
Correct Answer: $34.03
2. Consider the two functions below within the domain of x>0
f ( x )=99 ∙ (3 ) x+10 and g ( x )=10 x3+99
Which function will eventually stay greater for any increasingly larger x value?
A. g(x ) because f (x) increases too slow in the beginningB. g(x ) because for any x-value, g(x ) will be largerC. f (x) because for any x-value, f (x) will be largerD. f (x) because f (x) will eventually increase at a greater rate as x
gets larger
Correct Answer: D
24

25
Reporting Category
Functions
Standard Linear, Quadratic, & Exponential Models
Benchmark Number
MAFS.912.F-LE.1.4
Benchmark For exponential models, express as a logarithm the solution to abct=d where a, c, and d are numbers and the base b is 2, 10, or e; evaluate the logarithm using technology.
Also Assesses N/A
Item Types Selected Response (Multiple Choice)
Cognitive Complexity Level
Moderate
Benchmark Clarification
Students will use technology and the rules of logarithms to solve and evaluate equations with variable exponents.
Content Limits Tasks may involve linear functions, quadratic functions, and exponential functions.
A scientific calculator with the number e function is required.
Stimulus Attributes
Items should be set in mathematical or real world contexts.
Response Attributes
Monetary amounts should be rounded to the hundredths place and utilize appropriate symbols.
25

26
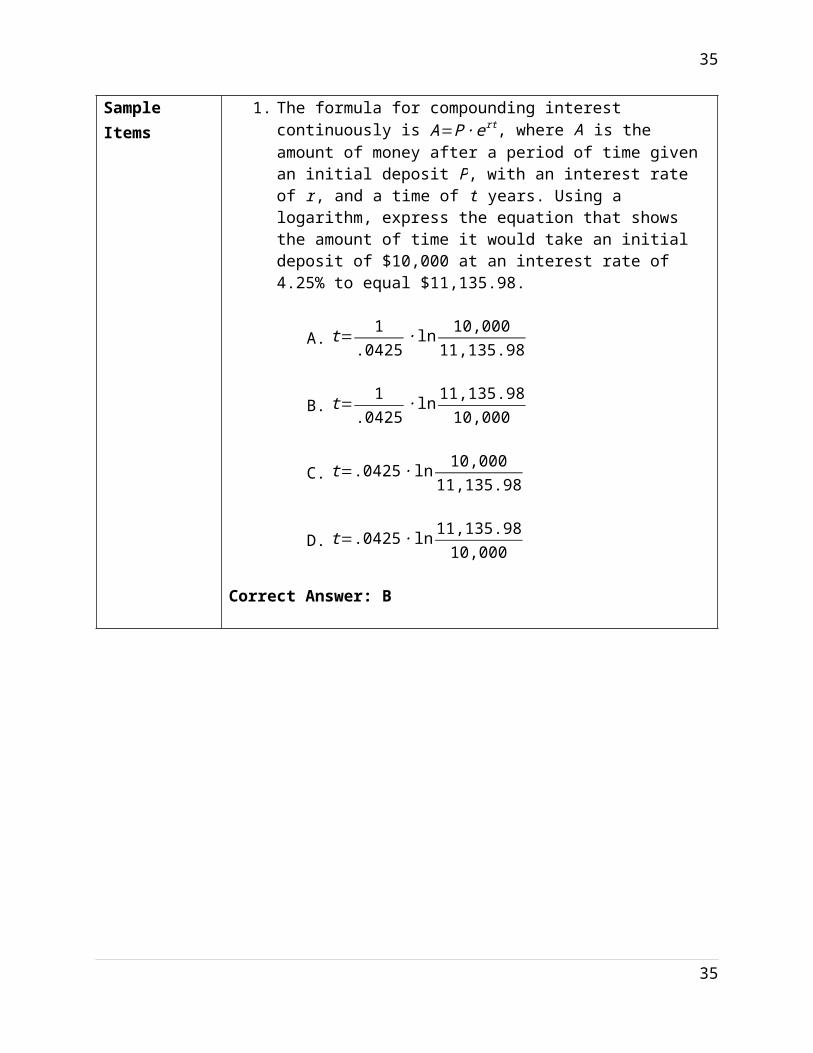
Sample Items 1. The formula for compounding interest continuously is A=P∙ ert, where A is the amount of money after a period of time given an initial deposit P, with an interest rate of r, and a time of t years. Using a logarithm, express the equation that shows the amount of time it would take an initial deposit of $10,000 at an interest rate of 4.25% to equal $11,135.98.
A. t= 1.0425
∙ ln 10,00011,135.98
B. t= 1.0425
∙ ln 11,135.9810,000
C. t=.0425 ∙ ln 10,00011,135.98
D. t=.0425 ∙ ln 11,135.9810,000
Correct Answer: B
26

27
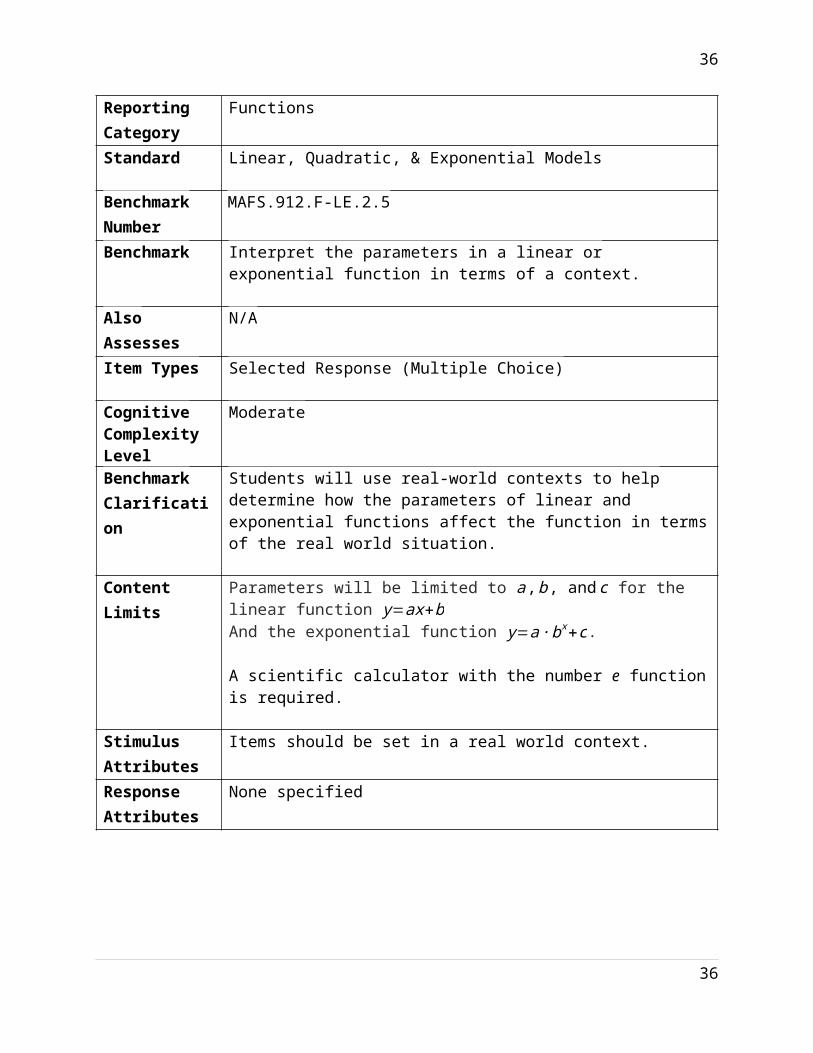
Reporting Category
Functions
Standard Linear, Quadratic, & Exponential Models
Benchmark Number
MAFS.912.F-LE.2.5
Benchmark Interpret the parameters in a linear or exponential function in terms of a context.
Also Assesses N/A
Item Types Selected Response (Multiple Choice)
Cognitive Complexity Level
Moderate
Benchmark Clarification
Students will use real-world contexts to help determine how the parameters of linear and exponential functions affect the function in terms of the real world situation.
Content Limits Parameters will be limited to a , b , and c for the linear function y=ax+b And the exponential function y=a ∙bx+c.
A scientific calculator with the number e function is required.
Stimulus Attributes
Items should be set in a real world context.
Response Attributes
None specified
27

28
Sample Items 1. A cell phone company offers a monthly cellular plan for high school students that includes 100 minutes of calling and unlimited texting for a flat fee of $40 plus $5 per gigabyte of data. Which of the following functions best represents this plan where C (d ) is the monthly cost per d gigabytes of data?
A. y=5+40 dB. y=40+5 dC. y=100+5dD. y=100+40 d
Correct Answer: B
2. A researcher studying the growth rates of bacteria has modelled two different populations, P1 and P2 over t days with the following equations:
P1=100 ∙ e.25 t
P2=100 ∙ e.50 t
Which of the following must be true?
A. P2 will have twice as much bacteria as P1 at any time t .B. P2 will grow twice as fast as P1 at any time t .C. P1 will have twice as much bacteria as P2 at any time t .D. P1 will grow twice as fast as P2 at any time t .
Correct Answer: B
28
29
Reporting Category
Statistics and Probability
Standard Conditional Probability & the Rules of Probability
Benchmark Number
MAFS.912.S-CP.1.4
Benchmark Construct and interpret two-way frequency tables of data when two categories are associated with each object being classified. Use the two-way table as a sample space to decide if events are independent and to approximate conditional probabilities. For example, collect data from a random sample of students in your school on their favorite subject among math, science, and English. Estimate the probability that a randomly selected student from your school will favor science given that the student is in tenth grade. Do the same for other subjects and compare the results.
Also Assesses MAFS.912.S-CP.1.5
Item Types Selected Response (Multiple Choice), Gridded Response, Short Answer
Cognitive Complexity Level
Moderate
Benchmark Clarification
Students will be able to convert data between the following presentations: a two-way frequency table, a tree diagram, a table of values, or a written description. Using these presentations, students will be able to test for independence as well as find conditional probabilities.
Students may be asked to justify two events are mathematically independent using any of the following: P ( A ) ∙ P (B )=P ( A ∩B ), P ( A )=P(B∨A ), or P (B )=P( A∨B).
Content Limits Items may be set in a real world or mathematical context, although preference should be placed on a real world context.
Stimulus Attributes
Items will present data in two of the following forms: verbal description, tables, lists, or tree diagrams.
Response Attributes
Responses may be in decimal or reduced fraction form.
29

30
Sample Items 1. 100 students were recently surveyed to determine favorite music types for an upcoming dance. Of the 55 boys surveyed, 25 boys preferred pop and 16 boys preferred country. For the girls, 18 preferred country and 8 preferred rap. Complete the following frequency table and determine the probability a student chosen at random would like rap music given that the student is a boy.
Pop Country Rap TotalGirl 18 8Boy 25 16 55Total 34 100
P (Rap|Boy )=¿¿
Correct Answer: Pop Country Rap Total
Girl (19) 18 8 (45)Boy 25 16 (14) 55Total (44) 34 (22) 100
P (Rap|Boy )= 711
≈ .636
Rubric:2 points: Student correctly fills out table and finds correct probability.1 point: Student correctly fills out table or finds correct probability.0 Points: Student does not correctly fill out table nor finds correct probability.
2. Researchers have long been interested in the relationship between cigarette smoking and lung cancer. The following table shows various probabilities of an adult male randomly selected from a population.
Event Probabilitysmokes and gets cancer 0.08smokes and does not get cancer 0.17does not smoke and gets cancer 0.04does not smoke and does not get cancer 0.71
If the probability that a randomly selected male is a smoker is 0.25, what is the probability that the individual gets cancer, given that he is a smoker?
Correct Answer : 0.08/0.25 = 0.32
30

31
Reporting Category
Probability and Statistics
Standard Making Inferences & Justifying Conclusions
Benchmark Number
MAFS.912.S-IC.1.1
Benchmark Understand statistics as a process for making inferences about population parameters based on a random sample from that population.
Also Assesses MAFS.912.S-IC.1.2
Item Types Selected Response (Multiple Choice), Short Answer
Cognitive Complexity Level
Low
Benchmark Clarification
Students will have a conceptual understanding of the purpose of statistics in describing larger populations based on an analysis of a smaller random sample taken from that population. Included within this conceptual understanding is a comparison of theoretical and empirical results, various sampling methods, and the ability to design and execute a simulation of random sampling and data generating.
Content Limits None Specified
Stimulus Attributes
Items must be set in a real world context.
Sampling methods can include random, purposeful, convenience, stratified, and snowball among others.
Response Attributes
None Specified
31

32
Sample Items 1. A school is running a contest amongst the grade levels to determine which grade can complete the most community service hours in a two-week period. The school administration decides to sample students to determine the most popular reward to give the winning grade level. Which of the following describes the best method for finding a random sample?
A. Administrators survey twenty students driving out of the student parking lot after school.
B. Administrators survey twenty students showing up for the 9th grade Open House.
C. Administrators survey twenty students entering the cafeteria during lunch.
D. Administrators survey twenty students at a National Honor Society meeting.
Correct Answer: C
32

33
Reporting Category
Probability and Statistics
Standard Making Inferences & Justifying Conclusions
Benchmark Number
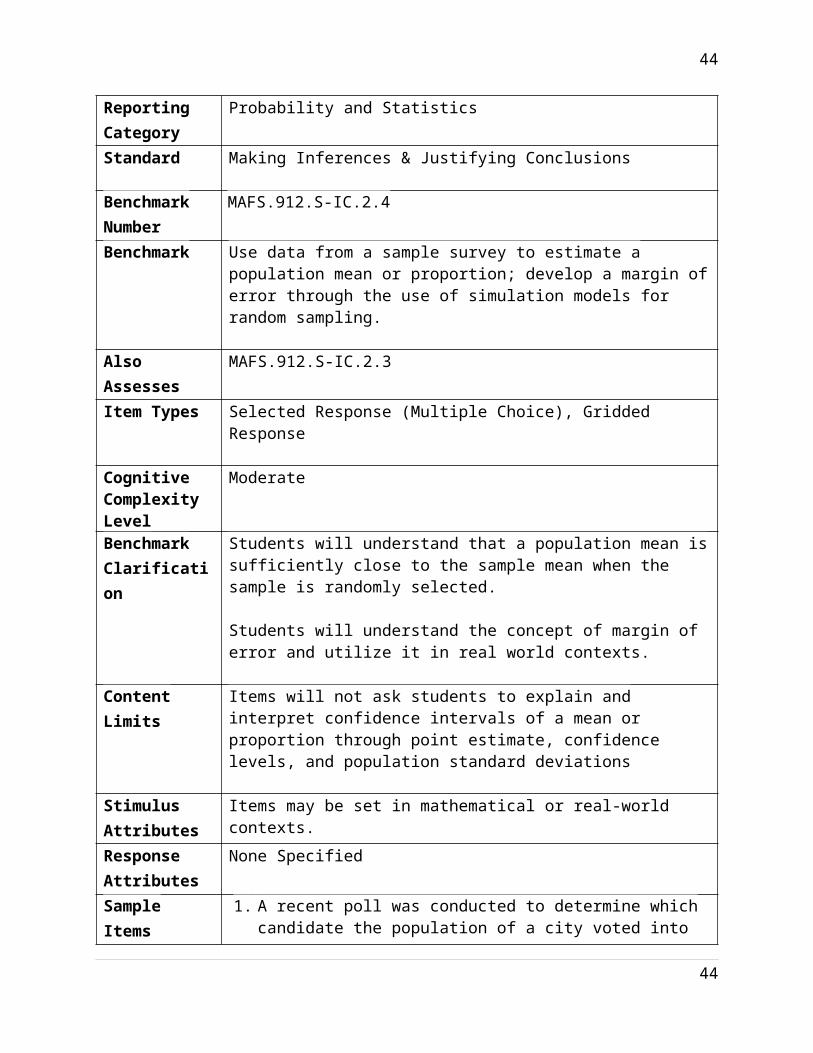
MAFS.912.S-IC.2.4
Benchmark Use data from a sample survey to estimate a population mean or proportion; develop a margin of error through the use of simulation models for random sampling.
Also Assesses MAFS.912.S-IC.2.3
Item Types Selected Response (Multiple Choice), Gridded Response
Cognitive Complexity Level
Moderate
Benchmark Clarification
Students will understand that a population mean is sufficiently close to the sample mean when the sample is randomly selected.
Students will understand the concept of margin of error and utilize it in real world contexts.
Content Limits Items will not ask students to explain and interpret confidence intervals of a mean or proportion through point estimate, confidence levels, and population standard deviations
Stimulus Attributes
Items may be set in mathematical or real-world contexts.
Response Attributes
None Specified
Sample Items 1. A recent poll was conducted to determine which candidate the population of a city voted into office. A random survey of appropriate size was conducted of eligible voters and 48% supported candidate A and 44% supported candidate B with a margin of error of ± 4%. Which of the following is an accurate conclusion based on the information provided?
A. The majority of voters supported candidate AB. The majority of voters supported candidate BC. Neither candidate A nor candidate B will win the electionD. This poll cannot determine who will win the election
Correct Answer: D
33

34
Body of Knowledge
Statistics and Probability
Standard Making Inferences & Justifying Conclusions
Benchmark Number
MAFS.912.S-IC.2.5
Benchmark Use data from a randomized experiment to compare two treatments; use simulations to decide if differences between parameters are significant.
Also assesses MAFS.912.S-IC.2.6
Item Types Selected Response (Multiple Choice), Gridded Response
Cognitive Complexity Level
Moderate
Benchmark Clarification
Students will compare results of two simulations to determine whether the two sets of data are significantly different. Students may graph results or determine measures of center or dispersion to compare the two treatments.
Content Limits If sets of data are provided, no more than 12 data points per treatment will be used.
Stimulus Attribute
Data from two treatments may be presented in a table of values, a graph, an algebraic equation, or described using the parameters of the data sets.
Response Attributes
Responses may be in the form of descriptors, graphs, or numeric answers.
34
35
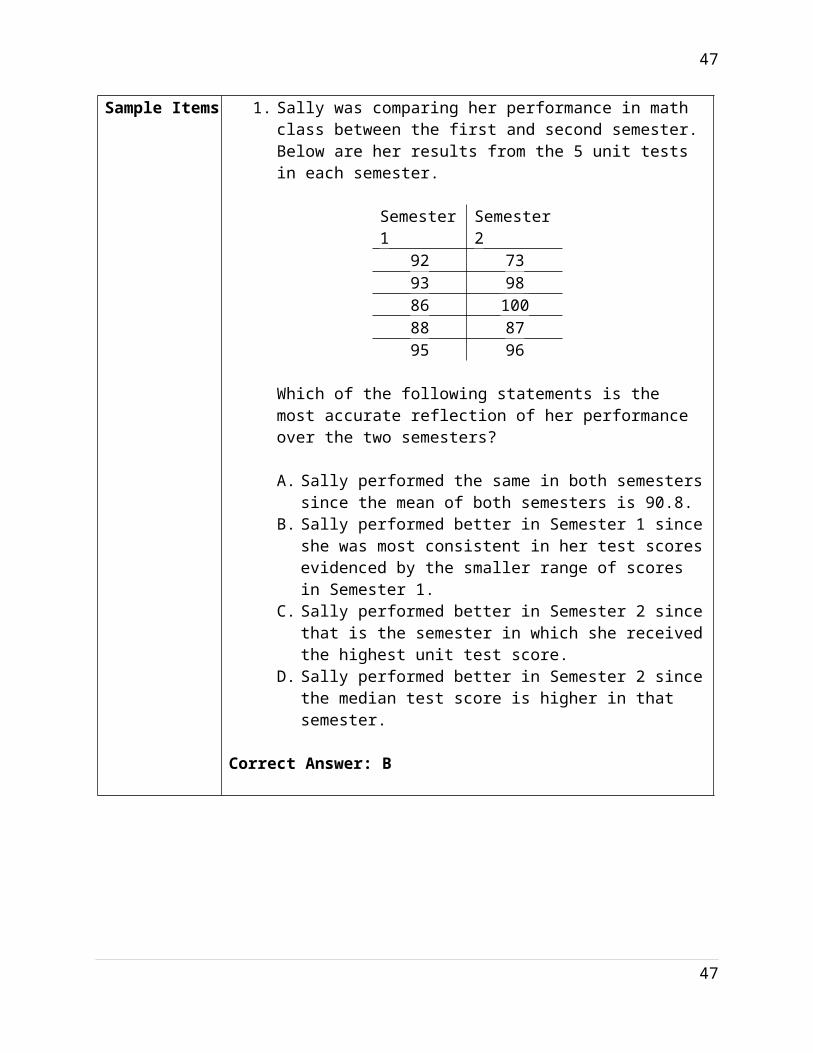
Sample Items 1. Sally was comparing her performance in math class between the first and second semester. Below are her results from the 5 unit tests in each semester.
Semester 1 Semester 292 7393 9886 10088 8795 96
Which of the following statements is the most accurate reflection of her performance over the two semesters?
A. Sally performed the same in both semesters since the mean of both semesters is 90.8.
B. Sally performed better in Semester 1 since she was most consistent in her test scores evidenced by the smaller range of scores in Semester 1.
C. Sally performed better in Semester 2 since that is the semester in which she received the highest unit test score.
D. Sally performed better in Semester 2 since the median test score is higher in that semester.
Correct Answer: B
35
36
Reporting Category
Geometry
Standard Expressing Geometric Properties with Equations
Benchmark Number
MAFS.912.G-GPE.1.1
Benchmark Derive the equation of a circle of given center and radius using the Pythagorean Theorem; complete the square to find the center and radius of a circle given by an equation.
Also Assesses N/A
Item Types Selected Response (Multiple Choice)
Cognitive Complexity Level
Moderate
Benchmark Clarification
Students will understand the relationship between the Pythagorean Theorem and the distance formula and how they both relate to the equation of a circle.
Students will be able to find the center and radius of a circle from an equation given in standard form.
Students will be able to complete the square for an equation given in the form A x2+By2+Cx+Dy+E=0 where A and B are not equal to 0 to find the center and radius of the circle.
Content Limits Equations must have the ability to complete the square when finding the center and radius.
Stimulus Attributes
Items may be set in real world or mathematical context.
Equations for circles do not necessarily have to be given in standard form.
Response Attributes
None Specified
36

37
Sample Items 1. What is the center and radius of the circle given by the equation:
( x−2 )2+( y−1 )2=4
A. Center: (−2 ,−1 ) Radius: 4B. Center: (−2 ,−1 ) Radius: 2C. Center: (2 , 1 ) Radius: 4D. Center: (2 , 1 ) Radius: 2
Correct Answer: D
2. What is the y-coordinate for the center of the circle given by the equation:
x2+ y2−2x+6 y+1=0
Correct Answer: −3
37

38
ReportingCategory
Geometry
Standard Expressing Geometric Properties with Equations
Benchmark Number
MAFS.912.G-GPE.1.2
Benchmark Derive the equation of a parabola given a focus and directrix.
Also Assesses N/A
Item Types Selected Response (Multiple Choice), Gridded Response, Short Answer
Cognitive Complexity Level
Moderate
Benchmark Clarification
Students will be able to find the equation of a parabola given the vertex, focus and/or directrix as well as the vertex, focus, and/or directrix given the equation of a parabola.
Students will be able to complete the square for an equation given in the form A x2+By2+Cx+Dy+E=0 where A or B is equal to 0 to find the vertex, focus, and directrix of the parabola.
Content Limits The rotation of axis for conic sections, degenerate conic sections, and eccentricity for conic sections will not be assessed.
Stimulus Attributes
Items may be set in real world or mathematical context.
Parabolas may open upward, downward, to the left, or to the right.
Equations for parabolas do not necessarily have to be given in standard form.
Response Attributes
None Specified
38

39
Sample Items 1. Which of the following correctly displays the focus and directrix of the parabola with the following graph and equation?
¿
A. Focus: (2 ,−1) and directrix: y=3 B. Focus: (2 ,3) and directrix: y=−1C. Focus: (−3.−2) and directrix: x=−1D. Focus: (3 ,−2) and directrix: x=1
Correct Answer: B
2. Which of the following is the equation for the parabola that has a vertex at (2 ,−1 ) and a focus at (2 , 3 )?
A. ( x−2 )2=16 ( y+1 )B. ( x+2 )2=16 ( y−1 )C. ( x−2 )2=4 ( y+1 )D. ( x+2 )2=4 ( y−1 )
Correct Answer: A
39
Description: parabola graphed with vertex at (2,1) opening up.

40
Reporting Category
Geometry
Standard Expressing Geometric Properties with Equations
Benchmark Number
MAFS.912.G-GPE.2.4
Benchmark Use coordinates to prove simple geometric theorems algebraically. For example, prove or disprove that a figure defined by four given points in the coordinate plane is a rectangle; prove or disprove that the point (1 ,√3) lies on the circle centered at the origin and containing the point (0 ,2).
Also Assesses N/A
Item Types Selected Response (Multiple Choice), Gridded Response
Cognitive Complexity Level
Moderate
Benchmark Clarification
Students will use coordinates in conjunction with the slope formula, midpoint formula, distance formula, equations of lines and other figures to prove geometric theorems or to determine properties of figures on the coordinate plane.
Content Limits Items that require knowledge of geometric theorems or properties of figures outside of the content of the course will have that knowledge or property specified in the item stem.
Items will limit repetitive calculations to no more than four of same type. For example, items may not require students to do more than 4 distance formula calculations.
Stimulus Attributes
Items may be set in either real-world or mathematical contexts.
Graphics should be used in the majority of items as appropriate.
Response Attributes
None Specified
Sample Items 1. Three students are playing a game and their starting positions are shown on the coordinate plane below.
40

41
A fourth student is joining the game and will be starting in position K. If K lies in the first quadrant, what y-coordinate would make HIJK a parallelogram?
Correct Answer: 2
41
Description: Three points drawn on a coordinate plane. H at (3, -3); I at (1, -1); and J at (1, 4).

42
Reporting Category
Geometry
Standard Expressing Geometric Properties with Equations
Benchmark Number
MAFS.912.G-GPE.2.5
Benchmark Prove the slope criteria for parallel and perpendicular lines and use them to solve geometric problems (e.g., find the equation of a line parallel or perpendicular to a given line that passes through a given point).
Also Assesses N/A
Item Types Selected Response (Multiple Choice), Gridded Response
Cognitive Complexity Level
Moderate
Benchmark Clarification
Students will use the properties of slope with parallel (same slope) and perpendicular (product of perpendicular slopes is equal to -1) to solve various geometric problems. Students may use slopes in conjunction with midpoint or distance formulas to aid in solving problems.
Content Limits Items that require knowledge of geometric theorems or properties of figures outside of the content of the course will have that knowledge or property specified in the item stem.
Items will limit repetitive calculations to no more than four of same type. For example, items may not require students to do more than 4 distance formula calculations.
Stimulus Attributes
Items may be set in either real-world or mathematical contexts.
Graphics should be used in the majority of items as appropriate.
Response Attributes
Linear equations may be written in slope intercept form or point slope form.
42

43
Sample Item 1. Which of the following is the equation of a line that passes through (4 ,−6)and is perpendicular to the line that goes through the points (−4 , 5) and (5 , 1)?
A. f (x)=−49
x+ 139
B. f ( x )=−94
x+ 139
C. f ( x )= 94
x+15
D. f ( x )= 94
x−15
Correct Answer: D
43
44
Reporting Category
Number & Quantity
Standard The Complex Number System
Benchmark Number
MAFS.912.N-CN.1.1
Benchmark Know there is a complex number isuch thati ²=– 1, and every complex number has the form a+bi witha and b real.
Also Assesses MAFS.912.N-CN.1.2
Item Types Selected Response (Multiple Choice)
Cognitive Complexity Level
Low
Benchmark Clarification
Students will use the equation i2=−1 and the commutative, associative, and distributive properties to add, subtract, and multiply complex numbers.
Content Limits None specified
Stimulus Attributes
Items should be set in a mathematical context.
Response Attributes
None specified
44

45
Sample Items 1. What is the product of the following complex conjugates?
(5+3 i )(5−3 i)
A. 34B. 16C. 25D. 9
Correct Answer: A
2. Which of the following is equivalent to i201?
A. 1B. -1C. iD. – i
Correct Answer: C
45

46
Reporting Category
Number & Quantity:
Standard The Complex Number System
Benchmark Number
MAFS.912.N-CN.3.7
Benchmark Solve quadratic equations with real coefficients that have complex solutions.
Also Assesses N/A
Item Types Selected Response (Multiple Choice)
Cognitive Complexity Level
Low
Benchmark Clarification
Students will solve quadratic equations that have complex solutions and express the answers as complex numbers.
Content Limits None specified
Stimulus Attributes
Items should be set in mathematical contexts.
The quadratic formula may be provided.
Equations may be given in any form and not necessarily set equal to zero.
Response Attributes
Responses may include one or both solutions.
Responses will be given in a+bi form.
46
47
Sample Items 1. What is the solution to the quadratic equation written below? State your response in terms of complex numbers.
x2−6 x+10=0
A. 3 ± 2iB. 3 ±iC. −3 ± 2iD. −3 ± i
Correct Answer: B
2. Find the complex solutions for the equation below:
2 x2=x+6
A. 14
± √474
i
B. 12
± √472
i
C. 14
± √514
i
D. 12
± √512
i
Correct Answer: A
47
![cfacteam.weebly.comTranslate this pagecfacteam.weebly.com/.../0/26807326/psychology_1_revised.docx2014-11-24 · PK ! ; \» [Content_Types].xml ¢ (](https://img.pdfslide.us/doc/110x75/5be3ab8b09d3f26f228b90ea/-this-page-pk-contenttypesxml-.jpg)