Embed Size (px)
Citation preview
AD- I06 119 ARMY ARMAMENT RESEARCH AND DEVELOPMENT COMMAND AMn-ETC F/6 19/1DEMONSTRATION OF A TECHNIS4JE POR THE MEASURMENT OF SURACE PRE--Tc AOl
'0 APR 0 W P DANCO
UNCLASSIFIED ARRL-R-03017 SOIlE-AC-E3 4SS O
MIIIN,*,II, IN,,,IIIIIIIII

ID
LEVEL 7'MEMORANDUM REPORT ARBRL-MR-03017
DEMONSTRATION OF A TECHNIQUE FOR THE
0 MEASUREMENT OF SURFACE PRESSURES ON
__ SPINNING WIND TUNNEL MODELS VIATELEMETRY
William P. D'Amico, Jr.
April 1980
I US ARMY ARMAMENT RESEARCH AND DEVELOPMENT COMMAND
BALLISTIC RESEARCH LABORATORY
DISTRIBUTION STATEM±
JUN20 1980
D
, 1.28062 O4

I I
DesToy this eport when it is no longer needed.Do not return it to the originator.
Secondary distribution of this report by originatingor sponsoring activity is prohibited.
Additional copies of this report may be obtainedfrom the Defense Technical Information Center, CameronStation, Alexandria, Virginia 22314.
The findings in this report are not to be construed asan official Department of the Army position, umlessso designated by other authorized docummnts.
The met UJ tadu e no ammfdovu'.w.' mae ie this. report,' ee WO aeeiutu oirnwki re of MW amismuv'at prodz, t.
-7-
... -•I
l I I

ULPARTMENT OF: THE ARMYU 5 AHM, AftMAMLNI RES, ARCH AND L-VELUPMLNT COMMANOS , L '"L' 'L A LAh(.)HA I HY
-AL Ut kN PRO 'N(. (,NUUND MARYLAND d1005
!JRL)AI:-TSB 18 June 1980
SLIBJLCT: Change of Itistribution Stateient
r
CommainderDefense Technical Info CenterAT'N : DIJC-DDACameron StationAlexandria, VA 22314
A review of the reports listed below has been completed and it has beendetermined that the distribution limitation can be removed and theStatement "A" be applied:
REPORT TITLE DATE AD NO
Memorandum Report The Development Of An Jan 79 B040233LARBRL-MR-02896 Interior Ballistic Model
For Automated ContinuousPropellant ProductionControl.
Memorandum Report Tests Of An Aft-Ejection Mar 80 B047352LARBRL-MR-02999 Gun-Probe System At
Tonopah Test Range. Nevada.
Memorandum Report Demonstration Of A Tech- Apr 80ARBRL-MR-03017 nique For The Measurement
Of Surface Pressures OnSpinning Wind TunnelModels Via Telemetry.
FOR THE COMMANDER:
Technical Support Division

UNCLASSIFIEDSECOITY CLASSIFICATION OF THIS PAGE (When Deta Entered)
REPORT DOCUMENTATION PAGE a-Ae& BEFORE COMPLETING FORM1. REPORT NUMBER 2. GOVT ACCESSION NO 3. RECIPIENT'S CATALOG NUMBERMEMORANDUM REPORT ARBRL-MR-03017 -- - '
4. TITLE (end Subtitle) 5. TYPE OF REPORT & PERIOD COVERED
DEMONSTRATION OF A TECHNIQUE FOR THE MEASUREMENT FnalOF SURFACE PRESSURES ON SPINNING WIND TUNNEL 6. PERFORMING ORG. REPORT NUMBERMODELS VIA TELEMETRY
7. AUTHOR(.) S. CONTRACT OR GRANT NUMBER(s)
William P. D'Amico, Jr.
9. PERFORMING ORGANIZATION NAME AND ADDRESS 10. PROGRAM ELEMENT. PROJECT. TASKUS Army Ballistic Research Laboratory AREA & WORK UNIT NUMBERS
ATTN: DRDAR-BLLAberdeen Proving Ground, MD 21005 RDT&E No. 1L162618AH80
I. CONTROLLING OFFICE NAME AND ADDRESS 12. REPORT DATE
US Army Armament Research & Development Command April 1980US Army Ballistic Research Laboratory "1. NUMBEROF PAGESATTN: DRDAR-BL 331N G N- A DR AO f It d ewtf from Controlling Office) IS. SECURITY CLASS. (of thl report)
IS. DECL ASSIFI CATION/ DOWNGRADINGSCHEDULE
IS. DISTRIBUTION STATEMENT of thi. R.lnSCEU
DISTRIBUTION STATEMENT A 1Approved for public release;
Distribution Unlimritd' I
I?7. c, r oag, l mwiera In DllOci 20, It different from Repot)
IS. SUPPLEMENTARY NOTES
1S. KEY WORDS (Continue on revere tdeIit neceaery aid identlf by block ntmber)
Telemetry TransducersMagnusPressure DistributionWind Tunnel
20. ABSTRACT (EW~ft d m virimefN numeW oi IMtI~ by block mmiibee)
The measurement of surface pressures on rotating bodies such as wind tunnelmodels or spin-stabilized projectiles is possible through the use of a telemetrlink. Via telemetry, the rotating and/or translating frame can be coupled tothe laboratory or stationary frame, but great care must be exercised toproperly account for differences in phase within the various data channels. Anovel and unique pressure measurement was accomplished by Mark for a spinningwind tunnel model, but the circumferential pressure distributions contained ananomalous phase error. This error has been identified and corrected. A phase
AI 19 UNCLASSIFIED
, ' '7 SECIUltY CLAIFICATtOR OF THIS PAGE (lbne Deto Enered)

IINCLASSTFIEDSECURITY CLASSIFICATION OF THIS PAGE(IfWha D00 JBtee,
20. delay was produced by a low pass filter used in the discrimination of the
output of the telemetry receiver. Since the receiver output had been
recorded in an analog form, some of the original data were re-reduced with
corrections for a constant phase delay. With the phase anomaly
explained, the original technique of Mark presents a very attractive scheme
for the acquisition of surface pressure data from spinning models.
Aaao .sinlfori TIS GaA&
DDC TABainmounced
Justificati -
tstrlbuti c n-
Aallaabil.tY Codes
Avail and/orart. special
UNCLASSIFIEDSECURITY CLASSIFICATION C F THIS PAOE(lmts Doea Enteroe)
.. .. - .. ./" p, - .. .
TABLE OF CONTENTS
Page
LIST OF FIGURES ........ .................... . . 5
I. INTRODUCTION ........... ...................... 7
II. REVIEW OF THE ORIGINAL EXPERIMENT BY MARK .... ........ 7
III. RE-REDUCTION OF DATA ......... ............ ..... 8
A. Determination of Magnitude and Phase ... ....... 8
B. Zero Degrees Angle of Attack ... ........... ... 11
C. 10.62 Degrees Angle of Attack ... ........... ... 11
D. 4.2 Degrees Angle of Attack at Mach 2.0and 3.5 . ....... ..................... ... 11
IV. DISCUSSION ......... ....................... ... 12
V. CONCLUSIONS ......... ....................... ... 13
REFERENCES ........... ....................... 15
DISTRIBUTION LIST ....... .................... ... 31
2.3

|B NOT 12sojDi
LIST OF FIGURES
Figure Page
1 Cutaway schematic of Magnus Telemetry model(Reference 1) ....... .................... ... 16
2 Block Diagram of Transducer/Amplifier/TelemetrySystem (Reference 1) ...... ................. ... 17
3 Combined pressure and subcarrier OscillatorCalibration ....... .................... .. 18
4 Surface Pressure Distribution on Tangent-Ogive-Cylinder Model with Spin (Reference 1) .......... ... 19
5 Graphical Display of Peak Pressure Shift inRotating Wind Tunnel Model (Reference 1) ....... ...... 20
6 Imaginary part of the Transfer Function for aDiscriminator with a I kHz low pass filter ......... 21
7 Typical raw pressure and spin voltages from thedigital oscilloscope ..... ................ ... 22
8 Location of coil and magnet with respect to theport to the 70 kHz pressure transducer in thewind tunnel reference system ...... ............ 23
9 Raw voltages for pressure and spin at zero angleof attack and 17595 RPM .... .............. . 24
10 Raw voltages for pressure and spin at zero angleof attack for 7159 RPM .... ............... ... 25
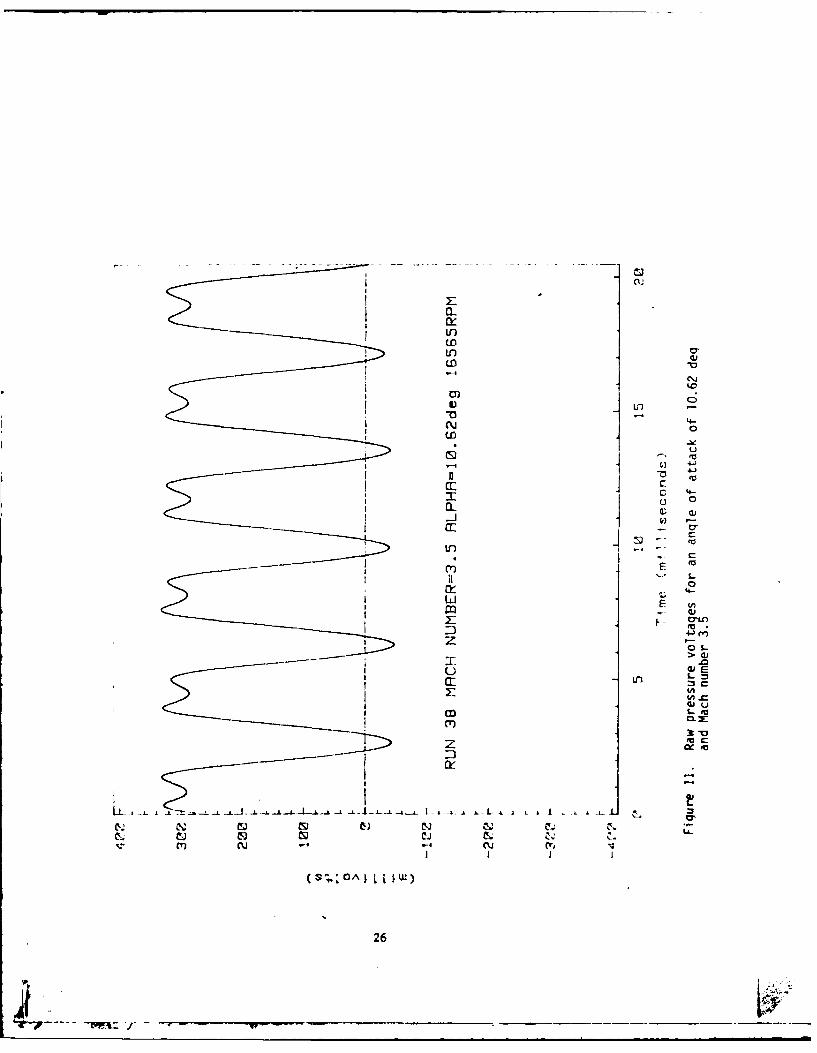
11 Raw pressure voltages for an angle of attack of10.62 deg and Mach number 3.5 ... ............ ... 26
12 Superimposed pressure distributions for angleof attack of 10.62 deg, Mach number 3.5, andspins of 16,565 RPM, 11,342 RPM and 7,585 RPM . . . . 27
13 Raw pressure voltages for angle of attack of4.2 deg, Mach number 2.0, and nominal spinof 15,428 RPM ....... .................... ... 28
14 Pressure distribution for angle of attack of4.2 deg, Mach number 3.5, and 13,544 RPM ....... . 29
15 Pressure distribution for angle of attack of4.2 deg, Mach number 3.5, and 19,693 RPM ....... . 30
'l5e!' "--- ~ w - - - - -- ~ _ _ _

I. INTRODUCTION
The measurement of surface pressures on rotating bodies such aswind tunnel models or spin-stabilized projectiles can be accomplishedthrough the use of a telemetry link. Mark utilized miniature pressuretransducers and a telemetry link to measure surface pressures on aspinning, wind tunnel model. 1 The data gathered by this techniquewere contaminated by an error in phase, thus damaging the credibility ofthe data and the experimental method. The phase error was producedby a low pass filter used in the discrimination of the output from thetelemetry receiver. Some of the original data have been re-reducedwith appropriate phase corrections, and they are in general agreementwith accepted physical principles. This report serves to explain andremove the original phase error and to comment on the feasibilityand potential of the measurement technique.
II. REVIEW OF THE ORIGINAL EXPERIMENT BY MARK
A brief review of the experiment by Mark considers the model,circuitry, run conditions, and data.1 The model was a 5.715 cmdiameter, 7.1 caliber tangent-ogive-cylinder with a 3 caliber nose, asshown in Figure 1. Two pressure transducers located on the spin axisof the model were ported to the exterior of the model. The portswere 1800 apart and located 3.14 calibers from the nose. The modelwas spun up to 333 Hz (20,000 RPM), the air was shut off, and the modelwas allowed to slowly spin down. Good data were obtained at Mach numbersof 2.0, 2.5, and 3.5 at angles of attack of 0.0, 4.20, 8.48, and10.62 deg. A block diagram of the transducers, amplifiers, and thetelemetry link are shown in Figure 2. The output of one transducerwas amplified and fed directly to a 70 kHz subcarrier. The output ofthe second transducer was amplified and differentially combined withthe first transducer to produce a pressure difference. Only data fromthe 70 kHz subcarrier were re-reduced. A combined pressure andsubcarrier oscillator calibration is given in Figure 3. Thiscalibration was done prior to final assembly and potting. The finalcalibration for the model could not be found or reconstructed, anddifferences in pressure amplitude between the data of Reference 1and data presented in this report will exist. Such differences arebothersome, but are not considered to be significant in light of thephase errors that have been uncovered and explained. A typical plotof the original data from Reference 1 is shown in Figure 4. The angle
1. A. Mark, "Pressure Measurements on a Spinning Wind Tunnel Modelby Means of Telemetry," U.S. Army Ballistic Research LaboratoryMemorandum Report No. 2750, May 1977. AD A040909.
7
r Aw

determines the orientation of the port leading to the 70 kHz pressuretransducer. In the reference system of the wind tunnel, a phase angle,¢, locates the roll angle of the model. 0=0 is vertically down.The model was set at an angle of attack, a, vertically upwards.Physical principles dictate that the maximum pressure should be on thewindward side of the model at 0=0. The data show that the maximumpressure occurs at =0 only when the spin approaches zero. A phaseshift was computed from the difference between the angle at whichmaximum measured pressure occurs and 0=0. This phase shift is shown inFigure 5 (from Reference 1) and indicates that the shift increaseslinearly with spin.
I1. RE-REDUCTION OF DATA
A. Determination of Magnitude and Phase
The accuracy of calibration of a pressure measurement systemutilizing a telemetry link can be significantly improved by thedetermination of the transfer function of the complete measurementsystem. A separate calibration must be performed to determine thegage factor of the pressure transducer. The transfer function is acomplex quantity and therefore has two components. The real partgives the relative magnitude between the output and input signals,while the imaginary part gives the phase delay of the output withrespect to the input signal. This method of calibration is far superiorwith respect to that shown in Figure 3. Transfer function measurementsshould be repeated and logged for future reference and will allowsmall variations in the system calibration to be monitored routinely,thereby providing greater measurement accuracy. Also, themeasurement of gain and phase delay are accomplished simultaneously.Since the measurement of phase is central to the data that will bediscussed, a short review is provided for the case of a low-passfilter commonly used in the discrimination of an FM/FM telemetrysignal. The time delay produced by these filters is important sinceit has a direct bearing on the dynamic accuracy of the system. Itwould be desirable to have a constant delay. Under such circumstances,all frequencies would be delayed by the same time constant and nodistortion of the signal would occur. This ideal case cannot beachieved in general, but it can be approximated. 2 Fo example,suppose a network has a transfer function H(S) = Ae , where T and Aare constants. If the excitation and the response to the network areE(t) and R(t) with Laplace transforms E(S) and R(S),
2. Richard C. Vorce, "FiZter Characteristics," E TelemetryApplication Note, Sarasota, Florida.
8

then, E(S) ) H(S) - R(S).
In the frequency domain the transfer function becomes
H(jw) = Ae- jWT
where the magnitude and phase are M(w) = A and 6(w) = -t. For thismodel the phase is linear with frequency, and the response of sucha network is
R(S) = AE(S)e - s
The inverse transform is
R(t) = AE(t - -r)v(t - <),
where p(t - T) is a delta function, This response shows there is atime delay of T. To identify that time delay, we find
t de(w)tD = T = d-
D d
Hence, the derivative of the phase of the transfer function with respectto frequency yields the time delay for a linear delay system.
In practice, one finds that phase delays are large but linearin frequency for w less than 1 kHz and small but nonlinear for (0much larger. The frequency range of interest for the pressure data isDC to 333 Hz. A low pass data filter would typically be set at threeor four times the highest frequency present within the data, or forthe experiments of interest at approximately I kHz. The phase delayproduced by the telemetry system, the receiver, and the tape recordershould be small since these systems employ wide band filters.* In anattempt to correct the data, it was assumed that the major portionof the time shift of Figure 5 was produced by discrimination and lowpass filtering of the pressure data. This can be easily reproduced.A white noise source was fed to a 70 kHz signal which was thendiscriminated at several settings for the low pass filter within thediscriminator. The output of the discriminator was fed to a spectrumanalyzer that is capable of resolving the phase and magnitude of thetransfer function of the network. Filter settings of 10.5, 1, and0.7 kHz resulted in phase delays of 67.7 Vs, 0.496 ms, and 0.75 ms.Figure 6 shows the phase of the transfer function for a 1 kHz settingon the discriminator. This tine delay at 20,000 RPM produces a phaseshift of approximately 60 deg. The phase angle in Mark's data for thisspeed (Figure 5) is approximately 75 deg.
* It is no' possible at this time to reconstruct the time delay due to
these networks, and the measurements of phase are still in error bythis omission.
9

In an attempt to determine possible phase errors in the measurementsystem, Mark also performed a test with the wind tunnel/telemetry modelin a vacuum chamber. The chamber was fitted with a tube which wasdirectly fed onto the surface of the spinning model at the locationof the pressure transducer tap. Hence, a data record showing the timebetween successive pulses from the pressure transducer and the coulused for the measurement of spin could be combined with the instantaneousspin to check for a phase shift. Original data measurements usingthis technique showed no clear evidence of a phase shift. However,the data were re-reduced, and the new reduction indicated a phase shiftthat correlates well with the phase shift measurement due to the lowpass filter.
The pressure data presented within this report was digitized bya Nicolet Explorer Digital Oscilloscope Series 2090. The data werethen transferred to a Hewlett-Packard 9845 Computer for conversion toengineering units and final plotting. A typical digital trace of thepressure and spin data channels versus time is shown in Figure 7.Channel A provides the pressure data, while Channel B gives the timingmarks from a coil and magnet. The inverse of the time between thepulses on Channel B provides the spin rate of the model. The pressuresignals are inverted by the onboard electronics, i.e., a minimumvoltage corresponds to a maximum pressure and locates c=O approximately.The actual location of 4=O is accomplished in the following manner.Figure 8 shows a section of the wind tunnel model with the locationsof the magnet, coil, and the pressure port for the 70 kHz pressuretransducer. A spin pulse is produced at this orientation since themagnet and coil are aligned. The port for the 70 kHz transducerwill then be located at =220 deg, but the pressure data are delayeddue to the low pass filter within the discriminator. This delay is0.496 ms, which for the data within Figure 7 (the spin is 12,195 RPM)translates into an angle of 36.3 deg. Hence, the phase of thepressure signal is actually 183.7 deg at the time a spin pulse isgenerated. This is consistent with the data in Figure 7 since the spinpulses and maximum pressure voltages (minimum pressure due to inversionby the electronics) occur at the same time.
During the re-reduction of the data, the center frequency ofthe discriminator was off-set so as to center the time-varying portionof the pressure signal within the appropriate voltage scale of thedigitizing oscilloscope. This technique allows for greater resolution.The DC off-set was measured, translated into pressure with the calibrationdata of Figure 3, and recombined with the time-varying portion of thesignal after digitization.
10
zI

B. Zero Degrees Angle of Attack
Data were reduced at zero angle of attack to determine thesensitivity of the transducers and the port networks to spin. ThreeMach numbers were considered: 3.5, 2.5, and 2.0. No dependence on spinwas observed for any of the data runs. The raw voltages for Mach 3.5are shown in Figures 9 and 10 for spins of 17,595 and 7,159 RPM,respectively. For zero angle of attack, the pressure distributionaround the model should be independent of spin, and the data showvariations of ±S my, or approximately 275 Pa or 0.04 psia.
C. 10.62 Degrees Angle of Attack at Mach 3.5
Data were reduced for several spin rates. Shown in Figure 11 arethe pressure voltages for a spin of 16,565 RPM. The data are smoothand periodic, and the flow is apparently steady. Figure 12 providesa superposition of pressure data at three spin rates. The trace for16,595 RPM indicates the maximum pressure to be at p=l5 deg. Thisapparent phase shift may be due to unrecoverable phase delay in theamplifier/telemetry/tape recorder system. The asymmetry in the pressuredistribution on the leeward side of the model (4=180 deg) is producedby spin.
D. 4.2 Degrees Angle of Attack at Mach 2.0 and 3.5
All of the data at an angle of attack of 4.2 deg were dramaticallydifferent from either the 8.48 or 10.62 deg data. The pressuredistributions were unsteady for all Mach numbers and all spin rates.It is highly probable that a model vibration was present. It isunlikely that the electronics were faulty since the tests wereperformed by fixing a Mach number and varying the angle of attackfrom zero to 10.62 deg. In all cases, only the data at 4.2 deg wereunsteady. Traces of the raw pressure-related voltages are shown inFigure 13 for Mach 2. The pressure distribution on the leeward sideof the model was unsteady, and the maximum pressure on the windwardside of the model also varied in amplitude. Figure 14 shows thepressure distribution for Mach 3.5 at 13,544 RPM. The discontinuityin the data at 4=180 deg is produced by the unsteady behavior previouslydiscussed. If the pressure distribution were periodic, no discontinuityshould exist. Figure 15 shows two successive cycles of pressuresuperposed and indicates the magnitude of the unsteady part of thepressure. It is clear that both the leeward and the windward sides ofthe model are affected. The influence of spin on the shape of thepressure distribution is obscured by the unsteady nature of the data.
11

IV. DISCUSSION
The use of telemetry links for the measurement of physical phen-omena on board free-flight projectiles is well known. Temperatureand pressure histories have been measured in the interior of chemicalpayloads.3,4 Surface pressure measurements have been made on gun-launched cones by Mark. 5 Also, recent measurements of inertial wavepressures in a rotating cylinder were accomplished by Whiting.
6
Surface pressure measurements on wind tunnel models have been made byMiller. 7
Although modern computational techniques have made many advances,there are situations where pressure measurements would be ofgreat value. For example, flows with complex viscous interactions atlarge angles of attack cannot be computed. Also, some geometric shapesare not tractable to computational schemes. This often occurs when smallsurface irregularities or protuberances are present.
The accurate measurement of surface pressures on rotating bodiesis difficult, since high resolution is required. For example,
3. W.H. Clay, W.P. D 'Amico, A. Mark, and W.H. Mermagen, "Measurementsof Payload Temperature On-Board the XM687 155= Binary Projectile,"Ballistic Research Laboratories Memorandum Report No. 2508,July 1975. AD B007023L.
4. W.P. D'Amico, W. H. Clay, A. Mark, and W. H. Mermagen, "In-FlightPayload Temperature Measurements for the XM736 Binary Projectile,"U.S. Army Ballistic Research Laboratories Memorandum Report No.2560, November 1975. AD B008702L.
5. A. Mark, "Free-Flight Base Pressure Measurements on 80 Cones,"U.S. Army Ballistic Research Laboratories Technical ReportARBRL-TR-02179, July 1979. AD A075365.
6. R.D. Whiting, "An Experimental Study of Forced Asymmetric Oscilla-tions in a Rotating Liquid-Filled Cylinder," U.S. Army BallisticResearch Laboratories Report in publication.
7. Miles C. Miller, "A Magnetic-Fluid Seal for Measurement of Aero-dynamic Surface Pressures," Chemical Systems Laboratory TechnicalReport ARCSL-TR-77018, April 1977. AD B034-708.
12
pressure differences that produce Magnus effects are often as small as70 Pa (0.01 psi). It seems straightforward to simply locate pressuretransducers directly on the surface of a spinning model. However,one must then account for the effects of centrifugal force on thecalibration of the transducer. The transducers used by Mark and Whitingwere semiconductor, integrated sensors mounted on a diaphragm. Theacceleration sensitivity of these units is typically 0.0005% FS/g*perpendicular to the diaphragm and 0.0001% GS/g parallel to the diaphragm.For the wind tunnel model used by Mark (5.715 cm in diameter with amaximum spin of 20,000 RPM), the calibration would have been off-setby 6% of full scale if the transducers had been located on the side wallof the model. Mark chose to locate the transducers on the centerline,i.e., the spin axis of the model, and to use ports. Questions offrequency response and phase delay of the ports must be answered, andthese questions may be more difficult to resolve than those of thecentrifugal effects. Centrifugal effects produced by spin and angularmotions could be simulated by a coning motion device. The calibrationof the transducer could then be corrected for these accelerations.Overpressures are also of great concern, especially in gun-launchedexperiments. The transducers used by Mark5 and those used by Whiting6
were built with a metal stop behind the diaphragm and provide a maximumover-pressure ratio of 40. Experience with these transducers has shownthe sensitivity to be almost infinite. The resolution of the transducersseems to be limited only by the calibration accuracy. Calibrationdata are very linear when the transducer output is as small as 0.2%of full scale (10 my). To further assess the factors of resolution,accuracy, and linearity, calibrations should be attempted at much moresensitive levels. If these calibrations are successful, the resolutionin pressure may be well below 70 Pa (0.01 psi). In circumstances wherehigh resolution is required, other factors must be re-examined.For example, the output of these transducers is proportional to theexcitation voltage. Therefore, the stability of the excitation voltagemust be high and should be monitored continuously. Also, the resolutionand accuracy of an FM/FM telemetry system i limited by the discriminationprocedure. Typically, the resolution of a discriminator is 0.1% of fullscale. This level (approximately 0.2% FS for the transducers used byMark) severely limits the extension of the measurement technique tolower pressures. In these instances a pulse code modulation (a digitalencoding) telemetry system may be required. Miniature PCM devicesare commercially available and should be evaluated.
V. CONCLUSIONS
A technique for the measurement of surface pressures via telemetryon spinning wind tunnel models or spin-stabilized projectiles has beendemonstrated. An initial attempt was successful in measuring surfacepressures on a wind tunnel model, but an error in phase was produced
' ull scaZe per g, where g is the acceteration due to gravity.
13
_ _ __
•i / -r-

by discrimination and filtering of the output of the telemetred data.The error was identified and corrected. The resolution and qualityof the data for these tests were very good. Pressures as small as70 Pa (0.01 psi) could easily be resolved.
14
-- 7 . . " W, i- / - _____.. .. . ....._

REFERENCES
1. A. Mark, "Pressure Measurements on a Spinning Wind Tunnel Modelby P'-ans of Telemetry," U.S. Army Ballistic Research LaboratoryMemorandum Report No. 2750, May 1977. AD A040909.
2. R.G. Vorce, "Filter Characteristics," EMR Telemetry ApplicationNote, Sarasota, Florida.
3. W.H. Clay, W.P. D'Amico, A. Mark, and W. H. Mermagen, "Measurementsof Payload Temperature On-Board the XM687 155mm Binary Projectile,"Ballistic Research Laboratories Memorandum Report No. 2508,July 1975. AD B007023L.
4. W.P. D'Amico, W.H. Clay, A. Mark, and W.H. Mermagen, "In-FlightPayload Temperature Measurements for the XM736 Binary Projectile,"Ballistic Research Laboratories Memorandum Report No. 2560,November 197'. AD B008702L.
5. A. Mark, "Free-Flight Base Pressure Measurements on 80 Cones,"Ballistic Research Laboratories Technical Report ARBRL-TR-02179,July 1979. AD A075365.
6. R.D. Whiting, "An Experimental Study of Forced AsymmetricOscillations in a Rotating Liquid-Filled Cylinder," BallisticResearch Laboratories report in publication.
7. Miles C. Miller, "A Magnetic-Fluid Seal for Measurement ofAerodynamic Surface Pressures," Chemical Systems LaboratoryTechnical Report ARCSL-TR-77018, April 1977. AD B034-708.
is

zwJ
z
I'-4
lks w
C-GJ
w 0
z_ I-
Cii z
w 0
cc-<ZU
0 070
L.
rnLz
16

0l I
4)
CU
4 4-0.0
L
0 )o CU)
0 04
U
xU
17U

1.4- P/PmaxUL14 9 3 V (vots) +~ 7.144
Pm 3.447 x 10³ Pa (5 psla)
1.2P/p fa 1, L436 volt, 80.089 kI Hz
1.0-
0.8
0.6-N.
0.4-
0.2-PpnmaO, 4.784 volt,65.866 k~z
0~
VOLTAGE (vlt)
Figure 3. Combined pressure and subcarrier Oscillator Calibration.
18

:C~ co
cu -0-0I''A
L)
*5 4 0
CLC
low N19

0 UO)
U U -
C2 W
U
63~ E
0~ 0
20

-vI ..-,,=-
L0
TN
E
O U
1, L n x, C=- -
L& ,-i W , ' TI- LO.- - -.I-' -
m M
4-
N UfN f
Li. [ i:T 5
ILI a)
uuJ=
'4- U0
SI 0
2-*.j tu
,.~
21
All . . . ' - " ,. .. "-

CS1ILDA) Hi 13NNUH0
-T-
U,.m0
-4 t4r3
-czU
zo
4-0)
0E >
cr6)
Cz 4)
L)L
1
(81~A~j~iW U t3NNWHZO
22

x 1806
PRESSURE PORT
-9 a -P70
MAGNET AND oCOIL ALGNED
Figure 8. Location of coil and magnet with respect to the portto the 70 kHz pressure transducer in the wind tunnelreference system.
23
Lii

(S~.OA) 13NNH
cu c CD
'4-0
I-I
4.J
Ln 0ID
m0
7:j -01
LflZ a C E S.
Z L a , LA CC
0)OC r~ ~~ Z .t 7
n,~~ 0.
>~
cutn.Ln to
(~L~iLW~U '13NRk2HD)
24
C1LdOA) 6 13NNUHD
cu m w mm MU '1 I
4-)fu
'4-0
a:.
WU
0
a:3LL.
co w t -.w D C
I~~. OAII F- 4NU:
a2S
CL
0n
04)U) 4-)
.) 4-
Li
'4-
zOLS->0
X.0
L:LL~l 3 &
&~.
NIt cr cuCk
S- G I
26

00
O)) -.
-o ) tocxmD m- 4-
CL CD 0'
Cr m
o z CDU V.1-4 IfCY)U Cr c
La a. C
L O
M~ -0.04--
-W L-tnz
x I If
E ~JLiLi
:3C') £ L
Lii 0.-
V: c C% " w w L V- "-c
cu cucu c cz : _: : ":m O
.ANo -d
27D

-j4 m
-o 1 4-
.-4 000ICC
4-)a: to 4-
C C
aC
280
a: -- 0
>C
---------
ON__ _ II-
28

cn
a_ ~
LI-a-. 1 4-
-
LJ4-,
:3 N 4-zZ 'a
Lr.-.-u4.(
X: LJ 0
:3 x W. - C-
Co *,- If)
cnu
LillW
U7 w
JN~d/d
29-

CYo
EC"
C"
to0,
u wz
U)
0) L
Cu~
C.. CT) CY) 0~a: Lo, .6V, -- Iu
: 11 2nCL Ix W
IL a:(0 N
N a: cU') 0 IC CY
U.) C cr. , - C-o Ur 4 CYN
M: a:
Li '-4
2: CUI --
z % C%
Al/
300

DISTRIBUTION LIST
No. of No. ofCopies Organization Copies Organization
2 Commander 1 CommanderDefense Technical Info Center US Army Aviation ResearchATTN: DDC-DDA & Development CommandCameron Station ATTN: DRSAV-EAlexandria, VA 22314 P.O. Box 209
St. Louis, MO 61366CommanderUS Army Materiel Development 1 Director& Readiness Command US Army Air Mobility Research
ATTN: DRCDMD-ST & Development Laboratory5001 Eisenhower Avenue Ames Research CenterAlexandria, VA 22333 Moffett Field, CA 94035
4 Commander 1 CommanderUS Army Armament Research US Army Communications Research& Development Command & Development Command
ATTN: DRDAR-TSS (2 cys) ATTN: DRDCO-PPA-SADRDAR-LC, Dr. Frasier Fort Monmouth, NJ 07703DRDAR-LCA-F, A. Loeb
Dover, NJ 07801 1 CommanderUS Army Electronics Research
3 Commander & Development CommandUS Army Armament Research Technical Support Activity& Development Command ATTN: DELSD-L
ATTN: DRDAR-LCA-F, Fort Monmouth, NJ 07703Mr. S. WassermanMr. D. Mertz 1 CommanderMr. E. Falkowski US Army Harry Diamond Laboratories
Dover, NJ 07801 ATTN: DRXDO-TI2800 Powder Mill Road
Commander Adelphi, MD 20783US Army Armament Materiel
Readiness Command 4 CommanderATTN: DRSAR-LEP-L, Tech Lib US Army Missile CommandRock Island, IL 61299 ATTN: DRDMI-R
DRDMI-YDLDirector DRDMI-TD, Mr.R. BechtUS Army ARRADCOM Mr. R. DeepBenet Weapsns Laboratory Redstone Arsenal, AL 35809ATTN: DRDAR-LCB-TLWatervliet, NY 12189 1 Commander
US Army Mobility Equipment Rsch& Development Command
ATTN: DRDME-WCFort Belvoir, VA 22060
31
"'M R -',r • •

DISTRIBUTION LIST
No. of No. ofCopies Organization Copies Organization
Commander 2 CommanderUS Army Natick Research David W. Taylor Naval Ship
& Development Command Research & Development CenterATTN: DRXRE, Dr.D. Sieling ATTN: Dr. S.de los SantosNatick, MA 01762 Mr. Stanley Gottlieb
Bethesda, MD 20084CommanderUS Army Tank Automotive Rsch 1 Commander& Development Command Naval Surface Weapons Center
ATTN: DRDTA-UL ATTN: Dr. T. Clare, Code DK20Warren, MI 48090 Dahlgren, VA 22448
Commander 2 CommanderUS Army Jefferson Proving Ground Naval Surface Weapons CenterATN: STEJP-TD-D ATTN: Code 312, Mr.S. HastingsMadison, IN 47250 Mr.F. Regan
Silver Spring, MD 209103 Project Manager
Cannon Artillery Weapons Sys 1 CommanderATTN: DRCPM-CAWS Naval Weapons CenterUS Army Armament Research China Lake, CA 93555& Development Command
Dover, NJ 07801 1 AFATL (DLDL)Eglin AFB, FL 32542
CommanderUS Army Research Office 1 Sandia LaboratoriesP.O. Box 12211 ATTN: Div No. 9322Research Triangle Park Mr. W. CurryNC 27709 P.O. Box 5800
Albuquerque, NM 87115DirectorUS Army TRADOC Systems 1 Calspan CorporationAnalysis Activity ATTN: Mr.J. Andes, Head
ATTN: ATAA-SL, Tech Lib Transonic Tunnel DeptWhite Sands Missile Range P.O. Box 235NM 88002 Buffalo, NY 14221
3 Commander 1 Honeywell, Inc.Naval Air Systems Command ATTN: Mr. George StilleyATTN: AIR-604 600 Second Street, N.Washington, DC 20360 Hopkins, Minnesota 55343
32

DISTRIBUTION LIST
No. of No. ofCopies Organization Copies Organi:ation
Director 1 Texas AM UniversityJet Propulsion Laboratory College of EngineeringATTN: Mr. B. Dayian ATTN: Dr. Robert H. Page4800 Oak Grove Drive Dean of EngineeringPasadena, CA 91103 College Station, TX 77843
2 Massachusetts Institute of 1 University of VirginiaTechnology Department of Aerospace
ATTN: Prof. E. Covert Engineering & Engineering PhysicsProf. C. Haldeman ATTN: Prof. I. Jacobson
77 Massachusetts Avenue Charlottesville, VA 22904Cambridge, MA 02139
Aberdeen Proving GroundMIT/Lincoln LaboratoriesATTN: Dr. Milan Vlajinac Dir, USAMSAA
Mail Stop D-382 ATTN: DRXSY-DP.O. Box 73 DRXSY-MP, H. CohenLexington, MA 02173 Cdr, USATECOM
ATTN: DRSTE-TO-FDir, Wpns Sys Concepts Team
ATTN: DRDAR-ACWBldg E3516, EA
33
LI |mh
USER EVALUATION OF REPORT
Please take a few minutes to answer the questions below; tear outthis sheet and return it to Director, US Army Ballistic ResearchLaboratory, ARRADCOM, ATTN: DRDAR-TSB, Aberdeen Proving Ground,Maryland 2100S. Your comments will provide us with information
for improving future reports.
1. BRL Report Number_
2. Does this report satisfy a need? (Comment on purpose, relatedproject, or other area of interest for which report will be used.)
3. How, specifically, is the report being used? (Informationsource, design data or procedure, management procedure, source ofideas, etc.)
4. Has the information in this report led to any quantitativesavings as far as man-hours/contract dollars saved, operating costsavoided, efficiencies achieved, etc.? If so, please elaborate.
S. General Comments (Indicate what you think should be changed tomake this report and future reports of this type more responsiveto your needs, more usable, improve readability, etc.)
6. If you would like to be contacted by the personnel who preparedthis report to raise specific questions or discuss the topic,please fill in the following information.
Aame:
Telephone Number:
Organization Address:
--Wp

DI
i m mp