Embed Size (px)
Citation preview
ii
ALMOST CERTAIN LOSS:
THE PSYCHOLOGY OF PYRAMID SCHEMES
A thesis
submitted in fulfilment
of
Doctor of Philosophy
at the
University of Canterbury
by
Alexander I. Mackenzie
University of Canterbury
2005

iii
ACKNOWLEDGEMENTS
I would like to thank and acknowledge the contributions of my supervisor, Professor
Simon Kemp to this thesis. I am extremely grateful for his expertise, education and
encouragement I have received while conducting this research. Without his support and
keen-intellect it would have been more difficult to complete my thesis.
I would also like to express my sincere thanks to my friends and family. Most especially
my mother, father and grandparents for their support and encouragement. I am also
extremely grateful to Dr Lynden Miles, who has been to me, and so many other students,
a source of information and support in the psychology department.
Thanks also to ‘past academics’ and selected staff and friends who have supported me. In
particular I would like to thank Jim Pollard, Bruce Jamieson, Tara Barrett, Nathan Bright,
Dr Darryl Forsyth, John Barton and Robyn Daly. It has been a pleasure to know these
people. A special thanks to Aaron Jarden, I hope to eventually get the reference you
promised.
Finally, thank you to the participants, perhaps the most important aspect of any research.
iv
TABLE OF CONTENTS
ACKNOWLEDGEMENTS................................................................................................ ii
TABLE OF CONTENTS................................................................................................... iv
LIST OF TABLES............................................................................................................ vii
LIST OF FIGURES ......................................................................................................... viii
ABSTRACT....................................................................................................................... ix
CHAPTER 1 ....................................................................................................................... 1
An Introduction to Understanding Pyramid Schemes .................................................... 1 Pyramid schemes .................................................................................................... 2 Deception ................................................................................................................ 6
Gender differences ............................................................................................ 12 Economics......................................................................................................... 14 Closeness and Deception .................................................................................. 16
CHAPTER 2 ..................................................................................................................... 19
An Introduction to Understanding the Importance of Risk .......................................... 19 Decisions in behavioural economics..................................................................... 20 Risk and sensation seeking ................................................................................... 25 Variables influencing risk..................................................................................... 28
Age.................................................................................................................... 29 Gender............................................................................................................... 29 Gender and Economic Risk .............................................................................. 30
Savings.................................................................................................................. 30 Stock market investments ..................................................................................... 31 White male effect.................................................................................................. 32 Explaining gender differences .............................................................................. 33
Evolution........................................................................................................... 33 Sociological....................................................................................................... 34
CHAPTER 3 ..................................................................................................................... 36
Sunk Costs and Intelligence.......................................................................................... 36 Sunk costs ............................................................................................................. 36 Intelligence............................................................................................................ 38 Summary of Predictions........................................................................................ 40
CHAPTER 4 ..................................................................................................................... 42
Study 1: Using People’s Perceptions of Investment Options as Explanations of Their Investing Behaviours. ................................................................................................... 42
Introduction............................................................................................................... 42 Method ...................................................................................................................... 43
Participants............................................................................................................ 43

v
Procedure .............................................................................................................. 43 Consent ............................................................................................................. 44 Piloting.............................................................................................................. 51
Results....................................................................................................................... 51 Descriptive statistics ............................................................................................. 51 Attitudes towards investment options................................................................... 53
Further Analysis................................................................................................ 58 Bank .................................................................................................................. 60 Pyramid scheme ................................................................................................ 61 Stock market ..................................................................................................... 62 Income analysis................................................................................................. 64
Summary............................................................................................................... 70 Study 2 .......................................................................................................................... 71
Method ...................................................................................................................... 71 Materials ............................................................................................................... 71 Procedure .............................................................................................................. 71
Results....................................................................................................................... 72 General descriptive statistics ................................................................................ 72 Summary............................................................................................................... 74
CHAPTER 5 ..................................................................................................................... 75
Study 3: Exploring Behaviours and Types of Decisions People Make When Involved in Pyramid Schemes...................................................................................................... 75
Introduction............................................................................................................... 75 Method ...................................................................................................................... 77
Participants............................................................................................................ 77 Materials ............................................................................................................... 78
Word stimuli generation ................................................................................... 78 Rating scales ..................................................................................................... 78 Ranking task...................................................................................................... 79 Software ............................................................................................................ 80
Procedure .............................................................................................................. 81 Task one, diadic target choice........................................................................... 81
Results....................................................................................................................... 85 Manipulation check............................................................................................... 85 Main results........................................................................................................... 86
Summary ........................................................................................................... 87 Study 4 .......................................................................................................................... 88
Method ...................................................................................................................... 88 Participants............................................................................................................ 88 Materials ............................................................................................................... 89 Procedure .............................................................................................................. 89
Results....................................................................................................................... 90 Summary ........................................................................................................... 92
CHAPTER 6 ..................................................................................................................... 93
Studies 5 & 6: Identifying Relationships between People’s Risk Seeking Behaviour, Numerical Ability and Investment Decisions. .............................................................. 93
Introduction............................................................................................................... 93

vi
Method ...................................................................................................................... 94 Participants............................................................................................................ 94 Materials ............................................................................................................... 94
Australian Council for Educational Research (ACER) BQ Test Overview ..... 95 Zuckerman’s SSS-V Test Overview................................................................. 95
Procedure .............................................................................................................. 95 Results....................................................................................................................... 96
General descriptive statistics ................................................................................ 96 Testing for main effects .................................................................................... 97
Main results........................................................................................................... 98 Additional Analysis ............................................................................................ 104 Summary............................................................................................................. 104
Study 6 ........................................................................................................................ 105 Method .................................................................................................................... 106
Participants.......................................................................................................... 106 Materials & procedure ........................................................................................ 106
Results..................................................................................................................... 106 General descriptive statistics .............................................................................. 106
Summary ......................................................................................................... 108 CHAPTER 7 ................................................................................................................... 109
Discussion................................................................................................................... 109 Investment in pyramid and other schemes and the perception of risk................ 109 Deception and recruiting others.......................................................................... 115 Individual differences in propensity to invest in pyramid schemes.................... 120 Limitations of the Research and Possibilities for Future Research .................... 123
REFERENCES ............................................................................................................... 125
Appendix A: Zuckerman’s Sensation Seeking Scale Version five (SSS-V) .................. 141

vii
LIST OF TABLES
Table 1: Different dollar amounts of money allocated to investment options.................. 53
Table 2: Intercorrelations Between Ratings of Each Investment Option ......................... 55
Table 3: Average item ratings and Cronbach Alpha for each option. .............................. 59
Table 4: Average ratings of the bank between types of investors .................................... 61
Table 5: Average ratings of the pyramid scheme between types of investors.................. 62
Table 6: Average ratings of the stock market between types of investors........................ 63
Table 7: Average ratings of the safe between types of investors...................................... 64
Table 8: Summary of Regression Analysis for Variables Predicting Investor Confidence
in Investing Money ........................................................................................................... 68
Table: 9:Average closeness ratings for each of the 17 target investors............................ 85
Table 10: Average ratings for each of the 17 targets in each experimental condition...... 92
Table 11: Females’ sensation seeking scores and how much money was allocated. ....... 99
Table 12: Males’ sensation seeking scores and how much money was allocated. ......... 100
Table 13: Correlation between pooled (over male & female) sensation seeking scores and
how much money was allocated to the investment options............................................ 101
Table 14: Average sensation seeking for type of investor.............................................. 102
Table 15: Summary of simple r-correlations for numerical reasoning predicting amounts
of money invested in options. ......................................................................................... 103
Table 16: Summary of simple linear regression for grade point averages and bursary
scores predicting amounts of money invested in options. .............................................. 104
Table 17: Summary of simple linear regression for general intelligence predicting
amounts of money invested in options............................................................................ 108

viii
LIST OF FIGURES
Figure 1: Questions and scales used in Experiment 1....................................................... 48
Figure 2: Average ratings for each investment option as ................................................. 59
Figure 3: Willingness to invest different amounts of income in different investment
options............................................................................................................................... 65
Figure 4. Confidence in investing money in different options. ........................................ 67
Figure 5: Average confidence in investing in the ............................................................. 68
Figure 6: Average confidence in investing in the pyramid scheme.................................. 69
Figure 7: Average confidence in investing in the stock market........................................ 69
Figure 8: Average confidence in investing in the safe...................................................... 70
Figure 9: The explanation measure................................................................................... 79
Figure 10: The ranking measure. ...................................................................................... 80
ix
ABSTRACT
This thesis investigates investing in pyramid schemes. Study 1 explored the relationships
between people’s perceptions of investment options and their investment decisions.
These options included a bank, a pyramid scheme, stock market and a safe. In this study,
participants imagined they could invest money in any of the options and rated their
perceptions of each option on various scales. When investing money, participants
invested larger amounts in the options that they rated more positively. Compared to other
investors, pyramid investors had higher positive correlations between their ratings of the
pyramid scheme and how much money they invested. In Study 2 participants indicated
how much money they would invest in each option and how risky they perceived the
investment. As the perceived risk of an investment option increased, people invested less
money. However, participants did not identify the pyramid scheme as the most risky
option and rated it as being no more or less risky than the stock market. In both Studies 1
and 2 about half of the participants were willing to invest in the pyramid scheme. In
Studies 3 and 4, participants imagined they had invested money in a pyramid scheme and
were recruiting new target investors. Two experimental conditions were devised. In the
first condition, participants were not informed of the potential for monetary loss, whereas
in the second condition, monetary loss was made explicit. Potential target investors
varied in the closeness of their rated relationship to the participant. When in the early
non-loss condition, participants selected targets that were close to themselves, but in the
loss condition they favoured targets that were less close. Furthermore, when in the non-
loss condition, participants persuaded those targets they were closer to invest, whereas in
the loss condition they persuaded them not to invest. Studies 5 and 6 found that there was
no difference in sensation seeking propensities or intellect between pyramid scheme

x
investors and non-investors. One clear finding for the research is that many people did
not select the pyramid scheme as the poor investment that it is, a result which indicates its
present illegal status is justified.

1
CHAPTER 1
An Introduction to Understanding Pyramid Schemes
These unhappy times call for the building of plans… that build from the bottom
up and not from the top down, that put their faith once more in the forgotten man
at the bottom of the economic pyramid (Franklin D Roosevelt, 1932).
The research in this thesis has been conducted from within the theoretical framework of
economic psychology. Because this approach has never, to my knowledge, been applied
to the study of investing in pyramid schemes, the current thesis focuses on relating
economic psychology to pyramid schemes. First a brief outline of what is currently
known about pyramid schemes is presented. Given the absence of published research on
pyramid schemes, most of this first section will be descriptive. Second, the topic of
deception will be introduced because of its importance in defining pyramid schemes.
In Chapter 2 a brief overview of the study of risk will be presented as this concept is of
general importance in understanding investments of any kind. Subsequently, an outline of
the most favoured method of measuring risk will be presented as a justification of my
choice of assessment tool. Consideration will be given to the suitability of a measure of
risk for predicting and explaining why people invest in pyramid schemes. Sensation
seeking, age and gender will all be addressed. Brief evolutionary and sociological
explanations for gender differences in attitudes towards risk are presented. A particular
focus of this chapter will be on how risks impact on economic decision making, as this
provides a basis for exploring investing in pyramid schemes.

2
Chapter 3 will conclude the introductory chapters by presenting brief discussions of sunk
cost and intelligence. These two constructs are also considered to offer potential
explanations of why people invest money in pyramid schemes and how they behave once
they have invested. Because several predictions and hypotheses will be advanced in the
introductory chapters, these are cumulated and presented at the end of Chapter 3.
Pyramid schemes
Pyramid schemes are so named because of the hierarchical structure that is formed by
their investors or recruits. These schemes will typically begin with initiators recruiting a
number of investors who are then expected to recruit the same number of new recruits to
receive their expected monetary returns. Each subsequent level of new investors make
payments to those above them and likewise receives payment from those below, thus
producing a scheme that essentially redistributes money. The continuation of this
investment pattern is the means by which the scheme acquires its revenue and is a
distinguishing characteristic of pyramid schemes (Blaylock, 1998; Commerce
Commission, 1997, 1999). Consequently, for this investment design to work, the number
of new recruits at each level of the pyramid must increase by an exponential factor, which
is determined by how many new recruits each investor is required to enlist.
For example, if each person must recruit five others, then at level one there would be one,
level two there is five, level three there is 25, level four there is 125, level five there is
625 etc.
Pyramid schemes differ from multi level marketing (MLM) in that MLM involves
commercially viable products (e.g. jewellery, clothing, health products), which have real

3
income earning potential through repeat sales to clients (Commerce Commission, 1999).
A widely cited example of such MLM is Amway, which Schwartz (1999) considers
unethical because of its pyramid type structure, but due to its reliance on viable goods is
still a legal enterprise in New Zealand (Commerce Commission, 1997). However,
pyramid schemes are similar to Ponzi schemes, which are another type of investment
scam, because they both promise large returns on investments that are unachievable
because they are solely derived from new investor funds (Blaylock, 1998; Entombed
Albania's Pyramids, 1997). Fundamentally, the key difference between pyramid schemes
and Ponzi schemes is in the destination of new investors’ money. Investors in a Ponzi
scheme typically send their money to either a central investment house, or a person which
is supposed to send the promised returns back to investors. However, new pyramid
investors give their money directly to the people above them (Blaylock, 1998). However,
due to Ponzi schemes reliance upon a continuous supply of investor’s funds to meet the
promised returns to earlier investors, these two schemes are very similar and the terms
are often used interchangeably (Goldstein, 1997). Hence, as these two definitions are
essentially based on the same concepts, the current thesis will include the term Ponzi
within the parameters of pyramid schemes.
The obvious incentive for investors recruiting new investors into pyramid schemes is the
expected monetary gain as they progress up the levels of the pyramid and the number of
new investors below them increases. However, like the parable of doubling a grain of rice
on the consecutive squares of a chessboard, which by the last square exceeds the number
of grains of sand on a beach, the pyramid scheme soon runs out of new investors due to
the world’s limited human population (Teeter, 1999). Consequently, in pyramid schemes
the majority of investors occupy the lower levels of the pyramid and receive no monetary

4
return on their investments, while only a minority can occupy the higher levels and
receive exponentially greater financial returns for a limited period.
The fact that most recruits are not told that they are destined to lose their money in these
schemes is the reason why pyramid schemes are illegal. The recruiting of people into
investment schemes is legal, and so is the giving of money to other people, but it is the
deception of the investors about their expected financial returns that determines the
illegality of pyramid schemes (Caroll, 1998; Commerce Commission, 1997).
Fundamentally, deception exists because new investors are typically recruited on the
promise that they will receive progressively larger financial returns on their investments.
However, as already noted, the ability to fulfil this promise is logically flawed because of
the finite human population.
The pyramid scheme that ran in Albania during 1995-1997 is a notable example of a
pyramid scheme in which people invested and consequently suffered a financial loss. In
this instance the scheme quickly spread through Albania and engulfed most of the
populace. The debt incurred by Albanian citizens was estimated at one billion dollars,
which if the Albanian government had reimburse would have produced bankruptcy
(Entombed Albania's Pyramids, 1997). Investors in this scheme were promised returns of
50% per month on their investments and people were motivated to sell assets in order to
invest cash for the expected monetary returns. For a short period of time the returns were
achieved and a few people did well, but, as with all pyramid schemes, the supply of new
investors ran out and consequently further payments were dishonoured, thus leaving
investors in financial ruin. Hence, people can experience severe economic hardship

5
because of the attraction and adherence to the directives of pyramid schemes. These
experiences, of course, are another reason why the schemes are worthy of investigation.
Although not as large in terms of monetary loss, pyramid schemes are still run in New
Zealand and result in considerable amounts of money being lost by investors nationally.
The Ministry of Consumer Affairs estimates the financial loss to be over ten million New
Zealand dollars per annum (Commerce Commission, 1997) and, like the Commerce
Commission, produces pamphlets that warn and educate people about the hazards of
these schemes. For example, the Commerce Commission (1997) stated the following:
Suppose a scheme requires you to recruit ten people who each recruit 10
people etc. By the sixth level, 1 million people will have to join the
scheme to keep it going. The next step requires 10 million people. People
joining a well established scheme will have difficulty finding enough
recruits to recover their investment. (p. 5).
Similarly the ministry has a website and links (www.consumeraffairs.govt.nz) partly
devoted to pyramid schemes, which attempt to stop investors being drawn into such
investment schemes by supplying information about how to identify them. However,
psychological research into investing in pyramid schemes, to the best of my knowledge,
has not yet been undertaken.
The nature of every pyramid scheme is such that the individual investor plays a key part
in fulfilling the scheme’s promises. Unlike investing in banks or stock markets, investors
in pyramid schemes need to recruit other people to ensure they make money on their
original investments. Hence when a person joins a pyramid scheme, it is their ability to
6
get new investors that determines their success at making money. If they are able to
attract new investors then they might be one of the very few who make a profit. More
likely, however, as pyramid schemes grow, most people who have invested money will
find it extremely difficult to find new investors and will lose their initial investment.
Given these facts, the question arises as to why people are still drawn into such schemes
and why they continue to occur in almost all countries and walks of life. In fact, although
pyramid schemes are illegal in most countries, their appeal is still strong. It is an
interesting question as to whether people’s behaviours change when the difficulties are
realised. Once people realise they are likely to lose their money, will they be more likely
to deceive potential new investors to help ensure they invest?
Deception
The semantics surrounding deliberately misleading people includes such phrases as white
lies, bluffs, and fibs, but essentially all equate to deception (Hyman, 1989). The definition
of deception encompasses all the previous terms, but here it is confined to the parameters
of deliberate economic behaviour. Cheating and dislike of it display themselves cross
culturally. People perceive it to be a socially unacceptable behaviour and react adversely
to known cheaters (Sigmund, 1993). Consequently, a cheater must assess the possible
gains and risks associated with cheating before engaging in deceptive behaviour
(Sigmund, 1993; Wokutch & Carson, 1999). As such, the outcomes associated with
cheating influence both an individual’s choice to engage in deceptive behaviour and the
reactions of others if this behaviour is discovered (Hyman, 1989; Ridley, 1997).
Arguably, either deliberate or unintentional deception is required for the successful
recruitment of investors to pyramid schemes. The studies that follow focus mostly on
deliberate deception because it is more easily measurable.
7
Reaction to, or interpretation of the seriousness of, deceptive behaviours often results
from the perceived relationships between agents and targets. The theory of the scope of
justice and numerous decision making models (Jones, 1991; Singer & Singer, 1997)
demonstrate that the degree to which a person interprets a behaviour to be serious, or
unethical, has a positive relationship with the perceived closeness of the agent to the
target. The intensity of a person’s reaction to deception is mediated by the relationship
between the agent and the target (Brockner, 1990; Opotow, 1990; Ridley, 1997; Singer &
Singer, 1997), which influences the agent’s decisions about who to mislead. People who
are closer and are deceived react more severely. This closely relates to the principle of
evolutionary psychology that asserts people are more likely to act altruistically to people
who are members of their kin group and are themselves more likely to reciprocate
(Ridley, 1997; Sigmund, 1993). Therefore determining how these relationship factors
affect people’s economic behaviours is a worthwhile area to research, especially in
respect to deception-based pyramid schemes.
Deception carries with it a negative connotation. We do not admire deceivers. How often
have you heard someone being praised for their ability to deceive another? It also seems
reasonable to assert that such a compliment would be rare and difficult for the recipient to
graciously accept. However it is not uncommon for people claim that “lies keep
friendships together”; or that “no one wants to know the truth all the time”. Perhaps this
argument is sometimes valid. However, such a claim is dependent on how the agent
(person deceiving), or target (person being deceived) are affected by deception, which
could result in negative, positive or neutral outcomes. I accept that in certain
8
circumstances an act of deception could be perceived as something positive. For example,
consider the following scenario:
Jason receives a gift of money from Alison, who is very special to him.
Unfortunately, the amount is much less than he expected, but Jason still thanks
Alison and states that it is very much appreciated.
In this brief example, deception has occurred because Jason deceived Alison about his
true feelings. But it is possible to see this act positively rather than negatively because
Alison’s feelings could have been hurt by the truth. Of course, such value judgements
depend on a person’s ethical perspective and the seriousness of the consequences
resulting from acts of deception, which can range from miniscule to extremely large.
However, it is possible to see that a person may hold the view that deception can at times
be a beneficial action and not always something to be condemned (Gralton & Sandford,
2002). However, once pyramid investors have realised it is nearly impossible for the
scheme to guarantee money, it is difficult for them to justify recruiting new investors and
few would find such behaviour admirable.
The consequences of actions can determine their perceived seriousness. For instance
harm caused to 10 people, when compared to harm caused to one person is typically
judged to be more serious because of the larger number of people affected (Pojman,
1989). Likewise, losing one dollar is less serious than losing $10,000. In a similar way
that the judged seriousness of outcomes increases with the size of a loss or harm,
beneficial outcomes produce favourable assessments. And when people are asked to
determine the seriousness of acts of deception their judgements are found to depend on
the consequences caused by the deception (DePaulo & Kashy, 1998).
9
Furthermore, when people consider holding others responsible for acts of deception, they
take into consideration the agent’s intent and knowledge of the consequences (DePaulo &
Rosenthal, 1979). For example, a person who knowingly deceives others to invest their
life savings in a fraudulent company is judged more harshly than someone who
ignorantly advises someone to invest. Such distinctions about level of social
undesirability are reflected in the law and are used to determine fraud.
Backbier (1997) used a scenario based study to demonstrate that people have malleable
attitudes towards the acceptability of lying or misleading others. The manipulated
variables in this study were the reason for the lies, if the situation was important or
unimportant, and the closeness between the agent and target. The data showed that
deception became more tolerable when the importance of situations increased and the
deception was in the interests of those being deceived. Conversely when deception was in
the interests of the agent, deception became less acceptable. In this particular study the
participants were all female, but other research (Gordon & Miller, 2000) has shown
males to respond in the same way.
A number of studies have considered the different settings where deception occurs
(DePaulo, 1992). The broad range of studies into deception has, for example, included
investigations into individual criminals trying to avoid prosecution in legal cases (Miller
& Stiff, 1992), prime ministers and politicians trying to avoid answering questions that
may show up their mistaken actions (Ekman & O'Sullivan, 1991), and deception at home
and work (Ekman & O'Sullivan, 1991). For a review see DePaulo (1988). Deception is
also widely used in the design of social psychology experiments. In this context, it is
10
often necessary for participants to be deceived about the true purpose of an experiment to
ensure unbiased results (Brehm, Kassin, & Fein, 2005).
Langenderfer and Shimp (2001) used psychological principles to explain vulnerability to
deceptive selected schemes or scams. However, in their paper, pyramid schemes were not
substantively featured. Instead, their paper focused on the vulnerability of older people to
telemarketing scams. It relied heavily on survey information from the American
Association of Retired People, an organisation that argues for retired people’s rights.
Langenderfer and Shimp proposed an untested model to explain people’s involvement in
scams. The model was based on visceral factors, which were defined as drive states and
proposed to effect how motivated someone might be to attend to scam cues
(Langenderfer & Shimp, 2001).
Given the widespread occurrence of deception, one should not be surprised that a large
number of psychological studies have explored it. Often such studies have required
participants to engage in deceptive behaviours and have measured the accuracy of people
in detecting instances of deception (DePaulo et al., 2003). Typically in this research an
agent makes a false statement and a target or observer who is isolated from the agent,
assesses the veracity of the statement. To increase generalisabiltiy, some experimental
designs have allowed for interactions between agents and targets. These interactions are
intended to better reflect how people interact with each other in real world settings
(Feldman, 1992; Stiff & Miller, 1986).
Research into deception has revealed interesting and at times disturbing facts about the
ability of people to detect when others are being deceptive. DePaulo, Charlton, Cooper,
11
Lindsay and Muhlenbruck (1997) performed a meta analysis of studies of the accuracy of
the judiciary in detecting deception and how confident they were in their judgements.
Although no statistically significant relationship was found between the judges’ accuracy
in detecting deception and confidence in their judgements, a significant positive
relationship was found between confidence and perceptions of truthfulness. Thus it
appears that the judiciary were confident in their ability to detect deception; but this
belief was not borne out by the data. The general population are also very poor at
detecting deception. Ekman and O’Sullivan (1991) found that 15% of ordinary people
(students) were very poor at detecting deception (levels below chance) and 59% were
close to or at chance. The remaining 26% had higher accuracy than had previously been
reported.
However there are instances where people have performed at levels above chance in
detecting deception. For example, DePaulo and Rosenthal (1979) performed an
experiment in which the stimuli consisted of filmed people giving testimony about other
people. This testimony presented agents’ feelings about other target people under
discussion, which at its simplest was categorised as either being true or false testimony.
Participants were required to state the veracity of the testimony and to identify how the
agents felt towards the targets. DePaulo and Rosenthal found that participants were able
to detect deception at levels above chance, although this was a very small effect (d-prime
= 1.64). However, when asked to identify the agents’ real feelings they performed at non-
significant levels. Rather than discovering that people are experts in detecting instances
of deception, research has revealed that as a rule, most people can only correctly detect
deception at levels close to or less than chance.
12
Although people are not very accurate at detecting deception, the skill can be improved
with training. Porter, Woodworth and Birt (2000) conducted an experiment which
measured the effectiveness of parole officers in detecting misleading and deceptive
statements made by inmates seeking parole. Disturbingly, the data showed that before
training, the officers’ baseline performance at detecting deception averaged at 40.40%
accuracy, which was significantly less than chance. Porter et al. (2000) suggested that this
finding was due to the parole officers using and relying on inaccurate cues of when
deception had occurred. These beliefs included those that deceptive prisoners smiled less,
gestured less and gave shorter answers when interviewed. However, while accurate
deception detection was difficult, and prisoners with more at stake were more
manipulative, the researchers also demonstrated that deception detection was a skill that
could be improved by training and feedback. If parole officers were instructed on the
empirically based differences of verbal and non-verbal behaviour between deceivers and
non-deceivers and were made aware of the myths about liars, then the errors in accurately
detecting deception could be reduced (Porter et al., 2000). At the end of the study parole
officers were performing at 76.6% accuracy. Thus research into deception can assist in
helping people make more accurate decisions.
Gender differences
Gender differences in detecting deception have been studied. Research in this area has
frequently tried to identify if men and women differ in the behaviours they display when
being deceptive, and what they observe and use in deciding if someone else is being
deceptive (Burgoon, Buller, Grandpre, & Kalbfleisch, 1998). However, inconsistent
findings have been reported. Bente, Donaghy, Suwelack (1998) and Burgoon et al.
(1998) show that, in some instances, men have been found to detect deceptive displays at

13
higher incidences than women; and, when being deceptive, men tend to engage in more
bodily movements than women. Conversely, in other instances Burgoon et al. (1998)
reported it has been women that have displayed the greatest number of behavioural cues
and detected more instances of deception. After Burgoon et al. (1998) reviewed the
relevant literature and research articles, they came to the conclusion that men and women
were at the same level in encoding and decoding deception; which is normally less than
chance (Ekman & O'Sullivan, 1991). It was argued that given the similarity of human
history, the recognized advantages of deception have resulted in the genders being equal
in their ability to detect it.
Tyler and Feldman (2004) studied 208 university students and found gender differences
in the frequency and nature of deception. Participants communicated with partners of the
same or opposite gender in two experimental conditions (ten minutes in each).
Participants were told that the purpose of the study was to test how people communicate
with strangers. In one condition they were told they would not interact with the partners
again, in the other they were told they would interact on three more occasions. When they
were led to believe they would meet their partners again, females lied more than males.
Females averaged 2.65 lies per 10 minute conversation, which was significantly greater
than males at 1.71 per 10 minute conversation. This difference between males and
females was explained as females were more concerned with pleasant interactions and
used deceptive behaviour to endear themselves to the recipient.
The likelihood of finding a gender difference is difficult to predict because of
contradictory research findings. However, despite Burgoon’s et al. (1998) summary,
given that some previous research has found gender differences (Tyler & Feldman,

14
2004), it would seem negligent not to test for them when studying investing in pyramid
schemes.
Economics
Wokutch (1999) suggests that business people accept deception as part of most economic
transactions and it is often justified by those engaged in it. Wokutch argued that this
tolerance results from its common place in economic transactions. This common
occurrence of deception in business or finance is thought to result from the advantages it
produces (Lewicki, 1993; Lewicki & Litterer, 1985; O'Connor & Carnevale, 1997).
These benefits can result in monetary rewards for the deceiver (O'Connor & Carnevale,
1997). Of course, the risk of being caught out as a deceiver is also likely to result in
monetary loss, because future investors or traders will shun someone who is deceptive,
because they fear losses themselves.
Suggesting that deception in economic transactions is an accepted practice runs counter
to the intolerance that wider societies hold towards deception (Callahan, 1988). In fact,
Culliford (2002) argued that lying and deception in business or economic transactions, as
in any other circumstance, is risky and simply unacceptable. Furthermore, just because
something is frequently practiced, this does not make it acceptable (Callahan, 1988;
Culliford, 2002). However, whichever moral perspective is taken on the actual behaviour,
there is general agreement that deception is often but not always a part of financial and
business transactions.

15
Tax evasion, defined here as the deliberate withholding of income taxes, is another form
of economic deception (Elffers, 1996; Cowell, 1992). This type of deception is faced by
nearly all governments and significantly reduces the government’s ability to fund its
services (Hasseldine, 1990). Understanding how to reduce tax evasion is therefore an
important social issue (Cowell, 1992). Consequently this type of deception has received
much attention and studies have focused on “attitudinal explanation of tax evasion, on
measurement and on experimental issues” (Elffers, 1996, pp. 289-290). Although the
associated improvements in tax compliance have been difficult to ascertain,
understanding the underlying constructs of tax evasion and advertising the costs and
benefits of tax to society are still important in curtailing this form of deception (Elffers,
1996; Hasseldine, 1990).
There seems to be an almost unlimited number of situations where deception may occur.
Probably no one could have escaped being deceived in their lifetime (Fiedler & Walka,
1993; Turner, Edgley, & Olmstead, 1975). Trying to identify behaviours as useful
indicators of deception is a vexed area of study where agreement is still difficult
(Horvath, Jayne, & Buckley, 1994), and even though people are faced with decisions
about the truthfulness of others every day, they still are not very good at detecting it
(DePaulo, Kashy, Kirkendol, Wyer, & Epstein, 1996). Although there are abundant
studies into detection of deception, Steinel (2004) stated few have addressed the
conditions “that foster or inhibit people’s tendency to be truthful and accurate or
dishonest and inaccurate”. (p. 419).
Given the widespread nature of deception, especially in financial transactions, it is
warranted that it be considered when exploring pyramid schemes. Part of the current
16
thesis extends this line of research by measuring deception in people asked to imagine
they have invested in a pyramid scheme. Two experimental conditions are developed to
reflect the nature of pyramid schemes. In each condition, participants imagine they have
invested money in the pyramid scheme and are looking for new investors to make money.
The difference between these two conditions is that, in the second, participants will be
made aware of their potential financial loss and difficulty in recruiting new investors to
receive any monetary returns. How does this difference affect whether people will try to
deceive others?
Closeness and Deception
People behave differently towards others depending on how close they are to them. One
way to avoid the pitfall of assuming certain types of relationships are necessarily close is
to simply ask people to give a subjective rating of how close someone else is to them
(DePaulo & Kashy, 1998). DePaulo and Kashy (1998) performed two diary studies
exploring the incidences and respective effects of lies that agents told targets, while
controlling for closeness between agents and targets, which was measured on a 15-point
scale. DePaulo and Kashy found that targets that are less close are told the greatest
number of lies and agents report they are less uncomfortable when telling them.
Moreover, the lies that were told to closer targets were more altruistic than those lies told
to strangers. For example, an agent told a friend, “…she was nice looking even though
she wasn’t”. To make her feel good”; whereas, a stranger was told, “that if she likes the
jeans that way, they aren’t too tight”, because the agent wanted to sell the jeans. (p. 68).
Over the course of five experiments Tice, Butler and Stillwell (1995) also found that
interactions between people (agents & targets) varied as to whether the target was a
17
friend or stranger to the agent. Results from this study showed that when given the
opportunity to present oneself in either a modest or self enhancing manner to friends, or
strangers, agents were more modest with friends. It is argued that people tell fewer lies to
those people closest to them because the familiarity means they are better at determining
each other’s veracity. Other studies show that people you are closer to are perceived as
being more trustworthy (Siegrist, Cvetkovich, & Roth, 2000); and are offered more
financial assistance (Kirchler, 2001; Zhang, 2001).
Evolutionary principles of relatedness offer an explanation as to the importance of
closeness in making economic decisions. Central in this explanation is Hamilton's
inclusive fitness theory which states that natural selection favours characteristics that
result in a person's genes being passed on. Note that this means that the survival of the
organism itself is not the first consideration (Hamilton, 1972). Hence, when someone
needs assistance, people have a tendency to assist relatives, which ultimately increases
the chances of their own gene survival (Hamilton, 1972). Support has been found for
Hamilton’s theory in explaining why people make certain financial decisions. For
example, Smith, Kish and Crawford (1987) performed a study exploring 1000 wills to
determine if estates are left in accordance with evolutionary principles. These results
support the evolutionary theory showing that benefactors favour close relatives over
distant relatives and those relatives of higher reproductive value. Kemp and Hunt (2001)
found similar results when they analysed 248 wills in Christchurch, New Zealand.
Overwhelmingly, bequests of money and possessions were restricted to family members.
Relatives of equal status (e.g. siblings) were also found to be equally favoured in what
they received from the deceased. It appears that, when making economic decisions,
genetic links are often considered more important than other non-genetic social
18
relationships, thus supporting Hamilton’s theory of inclusive fitness (Coleman &
Ganong, 1998; Judge & Hrdy, 1992).
Webster (2003) also showed that relatedness affects how people allocate money to
recipient targets. In this study, participants/agents were required to allocate fictional
lottery winnings to recipient targets as they saw fit. Depending on the amounts of lottery
winnings participants were assigned ($10,000, $100, 000 or $1m), each participant was
assigned to one of three possible groups. Targets were defined in terms of being blood
relatives to agents; and the variable of cohabitation time spent together factored for. As
predicted, the results show that targets who have greater relatedness receive greater
economic benefits. The findings further show that if people have less resources (lesser
amounts of lottery winnings), then more conservative evolutionary investment strategies
are adopted that favour closer blood relatives.
When one deceives people who are close, it clearly goes against the openness and
trustworthiness which people consider as important factors in close relationships
(DePaulo & Kashy, 1998; Granhag & Stroemwall, 2000; Parks & Floyd, 1996). Also,
when making economic decisions, closeness is an important factor in that one favours
those people who are considered closest. I researched the two constructs of deception and
closeness by studying them together. As DePaulo (1998) suggest, closeness of targets is
ascertained by asking participants to give subjective ratings. I explored whether closeness
plays a part in possible deceptive behaviours when investing in pyramid schemes. The
questions to be addressed are: Will people select target investors for pyramid schemes
depending on how close they are rated and will deceptive behaviours vary accordingly?
19
CHAPTER 2
An Introduction to Understanding the Importance of Risk
Over the last 25 to 30 years, risk taking has been extensively researched. The nature of
risk and how it is perceived makes it a central component in how people make decisions
and it affects the courses of action they choose (Slovic, 1987). Of course, before
exploring the concept of risk taking in any great depth, it is important to attempt to define
it, although the numerous meanings that are associated with the concept of risk (Larkin &
Pines, 2003; Slovic, 1987) make the task of definition somewhat difficult.
Yates (1992) stated that there were three essential and interactive elements involved
when people decided to take risks. These were identified as the existence of potential
losses, the significance of these losses and the uncertainty of the losses occurring. It is
how these elements interact and is perceived that determines risk and whether a person is
likely to engage in risk taking. Sitkin and Pablo (1992) also reduced the necessary
elements for risk taking down to three. They suggested that people make riskier decisions
when “(a) their expected outcomes are more uncertain, (b) decision goals are more
difficult to achieve, or (c) the potential outcome set includes some extreme
consequences.” (p. 11). Hence the defining attributes of risk taking involve the
likelihoods and outcomes of positive and adverse events (MacCrimmon, Wehrung, &
Stanbury, 1986).
The extent to which people perceive something as risky is an important consideration
when making decisions. In essence, decisions to take certain courses of action are largely
dependent on how risky something is considered (Slovic, 1987). In instances where

20
different perceptions of risk exist between individuals or groups, differences in opinion
about what actions should be taken is likely (Slovic, 2000). These perceptions, when
deciding on whether to engage in risky behaviours, are often the determining factors on
what decisions are made (Finucane, Slovic, Mertz, Flynn, & Satterfield, 2000; Flynn,
Slovic, & Mertz, 1994; Slovic, 1987).
Decisions in behavioural economics
My goal is to extend the research in economic decision making by determining if there
are relationships between sensation seeking and peoples’ decisions to invest money in
pyramid schemes. As with any type of risk, a degree of uncertainty of the probable
outcomes is necessary before risk exists at all (McInish & Srivastava, 1984). If people
invest money that eventuates in economic gains or losses, financial risk taking occurs
(Tversky & Fox, 1995). These potentials, especially for losses, are a reality of all pyramid
schemes. Some people may perceive a particular financial risk as highly risky, whereas
other people may perceive there is little associated risk. I will test if people with a
propensity to engage in risky pursuits are more likely to invest in pyramid schemes.
Predicting peoples’ decisions to engage in risk seeking behaviours is not an exact science
(Grable, Lytton, & O'Neill, 2004). Several decision theory models have been proposed to
explain and predict people’s decisions to engage in risky behaviours. Some focus on
rationality, where is assumed decisions are made independent of framing and are based
on basic principles of optimal choice. Normative models are similar to decision theory
models in economics and finance (Von Neumann & Morgenstern, 1944). Within
normative models it is assumed that people are risk averse in that they would choose a
sure option over a gamble of an equal expected value (Ingersoll, 1987). For example
21
when given a choice between a sure option and a lottery of an equal expected value, they
prefer the former. Such risk averse choices, according to Zaleskiewicz (2001) are
“assumed to be rooted in the curvature of the utility function, which is concave for
gains.” (p. 106). Overall, however, people’s actual investment decisions frequently differ
from what might be expected from rational decision makers (Kahneman & Tversky,
1979; Zaleskiewicz, 2001).
Economic models presume that risk aversion is a common human disposition (Warneryd,
1996), and that any differences in attitude towards risk can be predicted by the curvature
of the utility function (Zaleskiewicz, 2001). However, people do not necessarily follow
the rational economic theory of decision making, thus suggesting that other variables play
important parts in determining willingness to take risks. People’s decisions to invest are
often found to be frame dependent (Ingersoll, 1987; Kahneman & Tversky, 1988);
(Kahneman & Tversky, 1988) sensitive to heuristic driven biases (Tversky & Kahneman,
1981); situation dependant (Zaleskiewicz, 2001); and differ with different affective states
(Au, Chan, Wang, & Vertinsky, 2003). Hence when explaining and predicting people’s
decisions to take risks, the principles of utility theory are often inadequate.
When tested, the principle of invariance is perhaps the greatest challenge to rational
choice models. Invariance states that “different representations of the same choice
problem should yield the same preference. That is, the preference between options should
be independent of their description.” (Hagarth & Reder, 1987, p. 69). However this
principle is frequently violated. A common means of demonstrating this violation is to
construct scenarios that differ in their descriptions of choices while keeping the outcomes
constant. These scenarios are presented to participants and the proportions of people
22
choosing each scenario recorded. Usually the differences between descriptions are
framed in terms of gains (positive outcomes), whereas the other is framed in terms of
losses (negative outcomes). An example of how a study might demonstrate this effect
follows. In this example participants indicate their preferred decision.
Example:
Decision (i) Choose between:
A. a sure gain of $250
B. 25% chance to gain $1000 and 75% chance to gain nothing
Decision (ii) Choose between:
C. a sure loss of $750
D. 75% chance to lose $1000 and 25% chance to lose nothing
(Hagarth & Reder, 1987, pp 70-71)
When scenarios are framed like those in this example, greater proportions of people opt
for the sure gain, thus being risk averse. However most do not opt for the sure loss, thus
being risk seeking, Unless the probabilities of winning or losing are small, a greater
proportion of people are risk averse when choices involve gains and risk seeking when
they involve losses (Hagarth & Reder, 1987; Ingersoll, 1987; Kahneman & Tversky,
1979, 1988; Zaleskiewicz, 2001). People perceive equal size gains and losses differently.
Given that decisions to take risks often deviate from what might be expected from
rational interpretations of value and utility, alternative models are required (Warneryd,
1996). The prospect theory (Kahneman & Tversky, 1979; Tversky & Kahneman, 1992) is
23
one of “the most generic and well known” of these theories (Earl & Kemp, 1999, p. 398).
It attempts to model how people actually behave when faced with risky decisions rather
than what they should do if they followed a rational decision model. A feature of the
model is that people have different attitudes towards different types of risk: “risk aversion
for gains and risk seeking for losses of high probability; risk seeking for gains and risk
aversion for losses of low probabilities” (Tversky & Kahneman, 1992, p. 1). Put simply
this theory takes into account the subjective nature of how people make decisions.
Fundamentally the prospect theory focuses on gains and losses from decisions where loss
aversion is a prevailing concept. Important in understanding this theory is how people
perceive monetary outcomes. "An individual views monetary consequences in terms of
changes from a reference level, which is usually the individual's status quo”, and these
vary according to how a problem is framed (Hastie & Dawes, 2001, p.294). Risk aversion
is defined as a “preference for a sure outcome over a prospect with an equal or greater
expected value... Risk seeking is exhibited if a prospect is preferred to a sure outcome
with equal or greater expected value" (Tversky & Fox, 1995, p. 269). This theory states
that a loss is perceived as being greater than a gain of an equivalent value (Earl & Kemp,
1999; MacFadyen & MacFadyen, 1986). Thus the negative feelings from losing $100 are
greater than the positive feelings of gaining $100. As Earl and Kemp (1999) distinctly
wrote, “money lost carries the greatest weight.” (p. 250). People are therefore risk averse
when prospects are perceived as gains; risk seeking when prospects are perceived as
losses. They also overestimate the likelihood that small probabilities will occur and
underestimate moderate and high probabilities (Antonides, Raaij, & Maital, 1997;
Kahneman & Tversky, 1988). For example, people will accept very small probabilities to
win large amounts of money from lotteries and these probabilities are often more

24
attractive than greater probabilities of winning smaller amounts of money (MacFadyen &
MacFadyen, 1986).
Similarly, people place different subjective values on income from different sources
and have different attitudes towards paying the respective income taxes (Smith &
Kinsley, 1987). People are less willing to pay taxes on the income that they have
earned from entrepreneurial activity, which required extra effort, than on income
that was derived from other sources (Earl & Kemp, 1999). However, Ellfers (1996)
suggested that applying the principles of the prospect theory to paying taxes would
reduce tax evasion. Ellfers argued that if slightly “deliberately too high advance
levies (wage tax, provisional tax assessment)” were imposed on each payer, he or
she would find themselves “on the verge of gain” (p. 292). Hence this gain-outcome
would increase the likelihood that people would choose a risk free strategy to obtain
the refund. Therefore taxes would be calculated more accurately and the incidences
of tax evasion reduced.
Framing options in terms of gains or losses affects how much risk people are willing to
take. When framed in terms of gain they are likely to choose to avoid risks whereas a loss
frame would more likely result in risk taking (Nelson, Oxley, & Clawson, 1997;
Roszkowski & Snelbecker, 1990). These differences in how losses and gains are
perceived must be considered when constructing a study’s investment decisions. Given
the same objective alternatives within investment options, simply altering the description
of uncertain situations can affect people investment decisions (MacFadyen &
MacFadyen, 1986). Such effects will be controlled for in my studies.

25
Risk and sensation seeking
It is common practice to measure a person’s desire for sensation seeking as an indicator
of their individual propensity to take risks (Hammelstein, 2004; Zuckerman, 1994).
Initially, Zuckerman (1979) defined sensation seeking as a "trait defined by the need for
varied, novel and complex sensations and experiences and the willingness to take
physical and social risks for the sake of such experience.” (p. 10). Since this definition
was originally produced, Zuckerman and Kuhlman (2000) have omitted the term ‘need’
and sensation seeking has now been redefined as "seeking of varied, novel, complex and
intense sensations and experiences and the willingness to take physical, social, legal and
financial risks for the sake of such experience." (p. 1000). Zuckerman and Kuhlman
(2000) proposed this alteration because they believed that need implied compulsion.
Unfortunately, as Hammelstein (2004) suggests, removing need from the concept of
sensation seeking restricts the ease of its understanding.
Inherent in Zuckerman’s (1979; 1994) conceptualisations of sensation seeking is the
willingness of a person to take risks. These risks can be either physical or psychological.
A very frequently used tool to measure sensation seeking is Zuckerman’s Sensation
Seeking Scale Version five (SSS-V), which is the fifth modified version of the original
scale constructed in 1979 (Zuckerman, 1994). This scale is a survey instrument that
contains 40 items that aim to measure differences between individuals in their
preferences for finding novel and stimulating pursuits, attitudes, and values. The SSS-V
has four subscales (10 items in each), that aim to measure the different components of
sensation seeking. The Disinhibition (DIS) factor measures nonconformity with standards
of acceptable social behaviour (e.g. drinking, gambling, & gender). Disihibition in
accepting risky financial decisions has been linked to feelings of self efficacy (Slanger &
26
Rudestam, 1997) and investment decisions (Hunter & Kemp, 2004). A high score on this
factor may mean a person gambles in excess of acceptable social norms. An item
pertaining to this factor is, “I like to have new and exciting experiences even if they are a
little unconventional or illegal” (Zuckerman, 1994, p. 32). The Boredom Susceptibility
(BS) factor measures aversion to routine in one's life and intolerance of boring people. A
question addressing this factor has the participant choose between “The worst social sin
is to be a bore” and “the worst social sin is to be rude”. (p 32). The Thrill and Adventure
Seeking (TAS) factor measures preference for the thrills inherent in risky activities (e.g.
car racing, sky diving). Because they address rarely engaged in activities, most of these
questions are expressed as intention, for example “I sometimes like to do things that are a
little frightening”. (p. 31). Finally, the Experience Seeking (ES) factor addresses the
preference for mentally arousing activities and a nonconforming lifestyle. For example,
“I enjoy the company of real swingers”. (p. 390). Summing scores on these subscales
produces overall sensation seeking scores which because of the level of correlation
among them indicates the presence of a domain general, risk seeking personality type.
People with higher sensation seeking scores on Zuckerman’s SSS-V are more likely to
seek riskier pursuits than low sensation seekers (Zuckerman & Kuhlman, 2000). Some
examples of how the SSS-V has been utilised and significantly correlated with risky
behaviours include gambling (Chiu, 1997; Eckel & Grossman, 2002; Hammelstein,
2004), sports (Franques et al., 2003), drug and alcohol use (Franques et al., 2003;
Lejoyeux, Feuché, Loi, Solomon, & Adès, 1998; Satinder & Black, 1984), general
behaviour (Gonzalez et al., 2005), vocational choices (Roberti, 2004), fashion
innovations (Stanforth, 1995), financial transactions (Wong & Carducci, 1991) and
investment in e-commerce firms (Hunter & Kemp, 2004).
27
Although it has been widely used, Zuckerman’s SSS-V is not without its critics. The
main criticism has been that it contains questions that are too specific (e.g. I often like to
get high, drinking alcohol or smoking marijuana). Arnett (1994) suggested that the
scale’s questions have been too similar to certain studied constructs, hence more likely
producing significant correlations between the construct and measure. For example, the
outcome of the scale having specific questions addressing drug use behaviours and
administering these items to drug users is that it is more likely that users will be labelled
sensation seekers. This increased chance may inflate the apparent validity of
Zuckerman’s sensation seeking scales (Arnett, 1994; Roth, 2003).
Arnett (1994) developed an alternative tool to Zuckerman’s SS scale in the form of the
Arnett Inventory of Sensation Seeking (AISS). The AISS is like Zuckerman’s scale in
that it was constructed to measure sensation seeking. However, one difference between
the two scales appears in how the researchers conceptualised sensation seeking. Arnett
(1994) conceptualised sensation seeking as "the need for novelty and intensity of
stimulation.” (p 290). Hence Arnett intended the AISS to tap into the broader underlying
need that might make up sensation seeking and placed greater emphasis on intensity of
stimulation; whereas Zuckerman, as we have seen, now distances his measure from
acknowledging sensation seeking as a need. Another difference between the two
measures is that their questions are constructed differently. Zuckerman SSS-V scale
includes items that explicitly ask respondents to choose between concrete behaviours,
whereas the AISS favours descriptions of more general behaviours (“If it were possible to
visit another planet or the moon for free, I would be the first to join up”). Items are rated
on four point scales (A,B,C or D) from “describes me very well” (A) to “does not
28
describe me at all (D)”. (p 296). Arnett (1994) thought that concrete behaviours were
better conceptualised as being contained within the broader and less specific sensory
quality of need for sensation.
While such alternatives to Zuckerman SSS-V exist, Zuckerman is perhaps the best
recognised researcher into sensation seeking, and his scale the most widely used in
psychological research. The measure he developed, which has undergone a series of
refinements over five versions, has been used to measure sensation seeking propensities
in people and to predict whether they are likely to engage in risk seeking behaviours.
Thus I chose to use this instrument to test for the presence of a domain general, risk
seeking personality type and to determine if it correlates with investing in risky pyramid
schemes.
Variables influencing risk
It may seem obvious to the reader that people will vary in their willingness to engage in
risky behaviours. And, in fact, the general risk propensity of people to engage in risky
behaviours ranges from risk seeking to risk avoidance (Harrå, 2000; MacCrimmon et al.,
1986; Stone, Yates, & Caruthers, 2002; Zeelenberg, Beattie, van der Plight, & de Vries,
1996). When exploring risk taking, a complicating factor to be aware of is that a single
person may express high risk behaviours in some situations but in other situations express
low risk behaviours (Grable et al., 2004). A person who is willing to parachute jump
would not necessarily be willing to gamble at a casino. As Slovic (1987) suggests, this
variance makes it difficult to reliably predict an investor’s behaviour from their
involvement in other risky behaviours. However Zuckerman’s SSS-V subscales include
specific targeted behaviours that have been linked to investment decisions (Hunter &
29
Kemp, 2004; Zuckerman, 1994). Therefore, to be thorough it seemed appropriate for me
to include tests for correlations between subscale scores and investing in pyramid
schemes.
Age As age increases, risk seeking typically declines (Butkovic & Bratko, 2003; Otani,
Leonard, Ashford, Bushroe, & al., 1992; Slovic, 2000). After administering Zuckerman’s
SSS-V to a sample of Australians, Ball Farnill and Wangeman (1984) analysed the
resulting data to determine if differences in people’s total sensation seeking scores bore
significant relationships with their age and gender. As in previous research (Ball et al.,
1984; Zuckerman & Neeb, 1980) males on average expressed greater propensities for
sensation seeking than females. However it was also found that sensation seeking
declined as age increased; which is a commonly found main effect when these variables
are studied together.
Gender
Amongst researchers, there is a general consensus that, when making decisions to engage
in risky behaviours, differences exist between men and women (Eckel & Grossman,
2002; Larkin & Pines, 2003; Zaleskiewicz, 2001). Males are typically more willing to
engage in risky behaviours than females and concurrently perceive these risks as less
serious. Examples of studies that have shown this gender difference include those into
alcohol and drug use (Spigner, Hawkins, & Loren, 1993); environmental hazards (Flynn
et al., 1994), and violence (Wilson & Daly, 1993).

30
Gender and Economic Risk
Zaleskiewicz (1999, cited in Zaleskiewicz, 2001) found that men and women also differ
in making economic decisions. The financial options in this study included “gambling,
horse races, investing in the stock market and one’s own education” (Zaleskiewicz, 2001,
p. 106). People’s propensities for risk as measured by Zuckerman’s SSS-V were also
found to be influenced by their sensation seeking motives. Importantly this study
revealed men were more likely to choose to invest in riskier options than were women.
Other studies in economic decision making have shown that men have more favourable
perceptions of risks associated with gambling (Johnson & Powell, 1994; Levin, Snyder,
& Chapman, 1988), more frequently engage in gambling (Wolfgang, 1988), have riskier
asset portfolios (Olsen & Cox, 2001), and in general are more willing to take financial
risks (Barsky, Juster, Kimball, & Shapiro, 1997; Powell & Ansic, 1997). Given these
numerous findings that point to the significance of gender, it seems logical to test for
possible differences between men and women in deciding to invest in pyramid schemes.
Savings
People often save money in banks so that they have a buffer against unexpected
economic expenditures (Dahlbäck, 1991). However as Dahlbäck (1991) also
demonstrated, when studying peoples’ savings behaviours, it is important to consider
their aversion to taking risks. Data from this study showed that the amount of risk people
are willing to take affects their saving choices. Propensity to take risks produced
significant negative correlations with money invested in banks. It seems that when saving
money in bank accounts, people choose this saving option because it is perceived as a
low risk type of investment. However, risk taking was not found to relate to the amount
31
of readily available money for unexpected expenses; and had little associated variance
with amounts of total net capital.
Stock market investments
Conversely, people’s propensities to engage in risky behaviour correlates with investing
in the stock market. McInish and Srivastava (1984) demonstrated that the nature of
investment portfolios differed according to how risky people perceived stock options
were, and this perception was more important as a predictor than other demographic
variables (e.g. gender, age, income & education). Risk in this study was measured by the
beta obtained from regressing stock expectations against specific stock performance. As
the perceived risk of investing in stock increased, people’s attraction to investing in them
decreased. Hunter and Kemp (2004) found the same relationship when they researched
the relationship between people’s risk taking propensities and investment decisions in e-
commerce shares. Wood and Zaichkowsky (2004) further showed that, as a group, risk
intolerant traders purchase different varieties of stock and these stocks are primarily those
they considered to be less risky.
Whereas Dahlbäck (1991) correlated propensities for risk with saving money and Wood
and Zaichkowsky (2004) with stock market investments, my intention was to broaden
this area of research by including the option of investing in a pyramid scheme. By
simultaneously presenting a number of investment options, I hoped that the variety would
present a more realistic platter of choices to the investor, than by simply focusing on one.
My intention here was to determine if perceptions of risk and risk propensity were
correlated with investing in pyramid schemes and to compare this with other investment
choices.
32
White male effect
Although a gender difference exists between men and women’s’ attitudes towards risk,
this difference is itself variable (Johnson, 2002). For instance, Flynn et al. (1994) showed
that, when perceptions of potential environmental health risk were surveyed, gender
differences were more marked in white populations than non-white. These results
revealed that the greatest amount of perceived risk was reported by white women,
followed by non-whites and lastly by white men. There was no significant difference
between males as a group and non-white females; however, white males did report the
least amount of perceived risk of any group; a finding commonly referred to as the 'white
male' effect (Palmer, 2003). Flynn et al. (1994) proposed that when predicting men and
women’s’ perceptions of potential risks, additional sociodemographic factors to gender
differences should also be considered, especially status, power & alienation.
The white male effect appears to be a reasonable robust finding. Knight and Warland
(2004) tested for significant differences amongst three different populations in their
levels of concern they had for the effects of environmental poisons, and fat in foods. The
three different American populations that were tested were African American, white
Americans and women. Once again, support was found for the white male effect. The
results showed that white males were the least concerned, followed by blacks and then
women. However, criticism has been laid against using the term “white male effect”
because it is too specific and inaccurately describes what is actually a general
phenomenon. In fact, the “white male” effect is also found across different populations
(Johnson, 2002; Palmer, 2003), and is not restricted to the low risk perceptions of health

33
(e.g. Eckel, 2002) or environmental hazards (Flynn et al., 1994; Knight & Warland,
2004). When (Palmer, 2003) surveyed the perceived risks of technological hazards, the
results from this study showed the same effect in Taiwanese males. Hence the term
“white male” does not adequately encompass the true nature of this effect and as Palmer
(2003) suggested should be renamed.
Explaining gender differences
Evolution
Larkin and Pines (2003) outline how evolutionary principles explain why men and
women differ in how they perceive risky behaviours, their attitudes toward risk and
whether they are likely to engage in it. The basic premise of evolutional theory is that
successful gene replication hinges on people adopting adaptive behaviours that will
benefit their reproductive success. Hence it is argued that behavioural differences
between men and women have resulted from the different returns they have faced from
alternative investment strategies and their subsequent reproductive success. It is this
relationship, over the course of human and perhaps all animal history, that is responsible
for many of the observed differences between the genders.
For females, successful gene replication (parenting) depends on adopting a low risk long-
term gain approach, as measured by offspring survival. Because offspring survival is
more dependent on the survival of the mother, avoiding personal risks is a better strategy
for females to adopt. According to the evolutionary argument, it is this basic relationship
between mother and offspring that has resulted in women being less likely to engage in
risky behaviours. Conversely, because males have less parental investment in offspring, it
34
is better for them (in terms of gene replication) to reproduce as many times as possible
with the most desirable female partners. Although males’ reproductive status/desirability
increases with their amount of resources, the catch is that they are in competition for
resources with other males. Therefore successfully acquiring resources often depends on
engaging in risky behaviours to gain advantages over competitors. The outcome of these
benefits, as proposed by this theory, is that men are more willing to take risks.
As Larkin and Pines (2003) point out, before wholeheartedly accepting a biological
explanation for the differences in risk taking between men and women, certain criteria
must first be met. A significant problem with biological explanations of these gender
differences is that the effect seems to vary with other variables which are independent of
gender. If indeed men and women’s attitudes towards risk are determined by biological
mechanisms, patterns of risk taking should be similar across different cultures and
socioeconomic groups. However as Finucane (2000) and Flynn (1994) suggested, gender
is not always the best determinant of how risky people will perceive behaviours. Across
cultures, other variables are often more effective at predicting peoples’ perceptions of
risk. Examples of these variables include a person’s income and education, if the risky
situation is private or public (Larkin & Pines, 2003), and the control they have over the
possible outcomes (Eckel & Grossman, 2002; Krimsky & Golding, 1992).
Sociological
From a sociological perspective, differences in risk seeking behaviours between men and
women are due to inequalities in their decision making power and control (Gustafson,
1998; Larkin & Pines, 2003). How risky something is perceived reduces in accordance to
one’s increased control of the outcome of the event (Larkin & Pines, 2003). Compared to
35
men, women have historically had less power and autonomous decision making (Larkin
& Pines, 2003); hence from a sociological perspective “women may have internalized
some of the consequences of powerlessness, perceived risks in others' negative
evaluations of their behaviour, and sought protection through gendered behaviour
consistent with stereotypes.” (Larkin & Pines, 2003, p. 206). It is these restrictions that
have resulted in women adopting the expected behaviour of risk aversion as a means of
protecting themselves from negative outcomes (Gustafson, 1998; Larkin & Pines, 2003).
In terms of investing, men and women may have different societal expectations and
pressures of what are acceptable behaviours. If men are expected to be better at handling
risky options than women, then it is possible that investment options presented to women
and the advice they receive may differ and be a significant factor in explaining the
different gender choices (Larkin & Pines, 2003). Hence this bias in what is presented to
women and men may unfairly enhance stereotypical expectations of men and women. At
the simplest level, men and women may differ in their attitudes towards risk and may also
have different societal expectations of what is acceptable behaviour.

36
CHAPTER 3
Sunk Costs and Intelligence
Sunk costs
The ‘sunk cost effect’ is a term used to describe another behaviour that demonstrates how
people deviate from making rational decisions (Karlsson, Gärling, & Bonini, 2005). The
sunk cost effect, which falls within the construct of escalation of commitment (see Earl &
Kemp, 1999), is “the tendency to continue to invest money, time or effort following
unsuccessful investments” (Karlsson, Ásgeir, Grankvist, & Gärling, 2002, p. 309). This
effort may continue even when subsequent investments can not be recovered and
therefore it is a maladaptive economic behaviour. Instead, a rational decision maker
would choose the paths they expect to produce the best future returns, rather than
continuing with current investments because of previous investment decisions (Arkes &
Ayton, 1999; Arkes & Blumer, 1985).
Clearly prior investments should not affect current investment decisions. Instead the
changes in how well investments are meeting expected returns should be paramount in
determining continued investment (Arkes & Ayton, 1999). However, numerous
researchers (e.g. Arkes & Blumer, 1985; Garland, 1990; Karlsson et al., 2002; Staw &
Ross, 1989) have shown that prior investments are significant factors in determining
future courses of action. For example, Arkes (1985) studied the effect of sunk costs on
people’s decisions to attend theatre performances. Depending on the price people paid for
season theatre tickets ($8, $13 or $15), which was randomly determined, participants
were categorised into one of three groups. Over the following six month period, theatre
attendance was recorded for all groups. The results showed that the group which had paid

37
fifteen dollars attended the greatest number of shows. This result indicated that patrons
who had sunk the largest sums of money in the season tickets ($15) were more motivated
to use them (Arkes & Blumer, 1985). Therefore, because the only difference amongst the
groups was in the ticket prices, the sunk cost effect was clearly demonstrated.
Simonson and Staw (1992) conducted a study that identified procedures that could be
taken to avoid escalation of commitment. Participants were presented with a fictitious
company that had introduced two new brands of beer to the market. Participants had to
make funding decisions as to which brand should receive extra funding. Amounts of
money invested (sunk costs) and returns on investment were varied. Simonson and Staw
(1992) discovered escalation of commitment could be significantly reduced “by setting
minimum targets for performance and having decision makers compare their performance
with these target levels.” (p 424). Hence while continued investment in projects after
substantial losses is irrational (Ross & Staw, 1993), it is not unavoidable.
The sunk cost effect is explained by the prospect theory and how people perceive gains
and losses. According to this theory, a loss will have greater weight than the same sized
gains (see Chapter 2). Hence, withdrawing from an investment option may mean
perceiving the investment as a loss, which is undesirable for the investor. An alternative
interpretation would be to perceive the loss as an expense towards achieving the end goal
(Brockner, 1992; Garland, Sandefur, & Rogers, 1990; Karlsson et al., 2005); thus making
the loss palatable to the investor and encouraging additional investment. It is this
perception of loss that is suggested to be at the root of the sunk cost effect.
38
Karlsson (2005) summarises criticisms of the research into sunk costs and how these may
limit its real world applicability. Karlsson acknowledges that it is difficult to argue that
the sunk cost effect is irrational without explicitly stating “estimates of future or expected
returns.” (p. 67). Researchers claim (Heath, 1995; Parks & Conlon, 1990; Tan & Yates,
1995) that such explicit statements have more ecological validity and may in fact de-
escalate commitment. However, Karlsson has countered these assertions by
demonstrating that continued commitment occurs even when outcomes are transparent.
These effects were evident when alternative options offered the same outcomes, but did
reduce as the outcomes offered by other options increased.
It seems impossible to ignore sunk costs when investigating investing in pyramid
schemes. Once a person has made the initial investment in a pyramid scheme the sunk
cost effect predicts that they will continue with the scheme even in the face of adversity. I
also suggest that people will try to recruit investors even when past efforts of this kind
have proven to be fruitless. I test this prediction in Studies 3 and 4 below by allowing
participants the choice of doing: nothing to encourage new investors, actively
encouraging other people to invest; or actively discouraging new investors. Additionally,
to further test if the sunk cost effect is apparent when outcomes are transparent,
participants will be explicitly told about the outcomes from investing in a pyramid
scheme.
Intelligence
Intelligence has been conceptualised as being made up of a number of skills. Weschler
conceptualised intelligence as “the aggregate or global capacity of the individual to act
purposefully, to think rationally, and to deal effectively with this environment” (Weschler
39
1958, cited in Sternberg, Grigorenko, & Bundy, 2001, p399). Traditional intelligence
tests, for example, the Weschler Adult Intelligence Scale (WAIS) and the Stanford Binet,
like many other tests, focus on scoring performance on cognitive tasks in a timed
conditions (Kline, 1993). Academic success, job performance (Cascio, 1991), and feeling
of overall well being (Sternberg et al., 2001), all positively correlate with intelligence
scores.
Intelligence tests can report intelligence as a single unitary capacity, most commonly
Spearman’s g, or as a construct including relatively distinct domains. For example,
Gardner (1983) lists separate but interrelated types of intelligence in the domains of
language, music, logic, spatial, bodily-kinaesthetic, and interpersonal. Most intelligence
tests measure both a general factor (g) and separate but correlated group factors
(Sternberg, 2000; Sternberg et al., 2001). General factor g is perhaps the most widely
used factor to represent intelligence (Sternberg et al., 2001). Although intelligence is a
widely researched construct, a literature search revealed little about how it relates to
investment, thus it was included when I conducted my research (Study 6).
40
Summary of Predictions
Throughout the introduction several predictions have been made as to what was
researched and tested as part of this thesis. To assist the reader, some of these predictions
are listed below.
Hypothesis 1. Significant positive relationships would exist between the amounts of
money allocated to investment options and people’s perceptions of them.
Hypothesis 2. Significant differences would exist between people’s perceptions of the
investment options and whether or not they invested in the pyramid scheme.
Hypothesis 3. Significant differences would exist between the amounts allocated to the
investment options and whether or not they invested in the pyramid scheme.
Hypothesis 4. People will be less confident in investing larger amounts of money.
Hypothesis 5. A significant difference would exist between the amount of money men and
women allocated to the investment options.
Hypothesis 6. Perceived risk will be significant in predicting how people allocated money
to investment options.
Hypothesis 7. Depending on the likelihood of financial loss, people in an existing
pyramid scheme, will differ in who they choose to be pyramid scheme investors.
Hypothesis 8. Propensity for sensation seeking will relate to investment choices.
41
Hypothesis 9. A significantly greater proportion of men than women would invest money
in riskier investment options.
Hypothesis 10. Pyramid scheme investors will have a higher propensity for sensation
seeking than will non-pyramid investors.
Hypothesis 11. Intelligence will be negatively related to the amount of money allocated to
a pyramid scheme.

42
CHAPTER 4
Study 1: Using People’s Perceptions of Investment Options as Explanations of Their Investing Behaviours.
Introduction
The first study aimed to determine the relationships between people’s perceptions of
different investment options and their investment decisions. The investment options
included descriptions of three legitimate options (bank, stock market, & safe) and a
pyramid scheme, which would be illegal in most western countries (Commerce
Commission, 1997; 1999). Given previous research (see Kahneman & Tversky, 1988) it
seemed likely that people’s investment choices would vary with their perceptions of the
options. The current experiment is the first I know of to include pyramid schemes in a
range of investment choices.
Broadly, I explored three groups of variables within this study: Those associated with
what the investment options offered; the money allocated by participants to hypothetical
investments (allocation task); and responses to questionnaire items.
In the allocation task, participants were instructed to imagine themselves in each of four
scenarios that outlined a different investment opportunity and to allocate money as they
saw fit. These scenarios were constructed to reflect characteristics of investment
opportunities offered by pyramid schemes as well as legitimate investment schemes. To
remain manageable, the manipulated variables within each option (the bank, pyramid
scheme, stock market & safe) were restricted to monetary returns within time periods,
and how each option generated its revenue. The questionnaire contained scales that
43
measured the person’s perceptions of each option and how much money they would
allocate to it.
Method Participants
Participants were 40 male (M age = 22.43, SD = 8.54) and 52 female (M age = 21.70, SD =
6.17) students from the University of Canterbury, New Zealand who volunteered for a
study entitled “Exploring the psychology of people’s economic behaviour within the
context of different investment options”. Once recruited and as an expression of gratitude
for their participation, they were each offered one dollar instant scratch-and-win lottery
tickets that presented chances to win up to $10, 000.
Procedure
Experimental sessions were run at convenient times for each participant. All sessions
were run in the same laboratory with a maximum of 4 participants run at any one time.
Each person was greeted and then seated in individual cubicles, which ensured they could
complete the experiment in privacy; not see other participants’ responses; and not be
distracted by other participants or the experimenter.

44
Consent
A standardised information sheet detailing the study and explaining the participants’
rights was presented to each participant. This clearly expressed that participation was
anonymous, strictly voluntary and could be withdrawn at any time. Furthermore, it was
clearly communicated that to ensure anonymity participants would not be identified with
their data.
After being seated, participants were asked to read the instructions and begin the
experiment. The first step consisted of an allocation task among the four investment
options. The scenarios were written to ensure the wording was as balanced as possible.
Care was taken to ensure that the different options varied only in terms of financial
returns on offer and the associated steps required to receive them. This consistency was
considered important to avoid unwanted framing effects that could have biased peoples
responses (see Chapter 2). Description 1 represented the option of investing in a bank,
Description 2 represented the pyramid scheme, Description 3 the stock market and
Description 4 the option of placing money in a safe. Randomised orderings of the
investment options were used to control for order effects. The allocation task began with
brief instructions and descriptions of the options as follows:
This study is interested in how people invest money. To help us explore this
behaviour, we would like you to complete a number of simple tasks. Your first
task is to read the following descriptions of different investment options.

45
Description 1
You can invest your money in a bank that offers a 2% per annum return upon
your money at the end of a 30-day period. For you to receive financial returns
from this option, you have to leave your money in the bank and not ‘touch’ it for
this agreed amount of time. In order for this option to deliver your financial
returns, it will lend your money to people at a higher rate (8%) and give part of
the profit to you. The bank will keep the other part of the profit as a payment for
its investment services.
Description 2
You can invest your money in a proposal that offers to keep doubling your money
in short terms of time. For you to receive the financial returns from this option,
you have to get other people to invest in this option. The greater the number and
the quicker you get people to invest, the less time it takes to double your money.
As more and more people invest, the number of times you might double your
money increases and potentially you could receive extremely large amounts of
money. This option relies on the revenue of new investors to generate its funds.
Description 3
You can invest your money with a stockbroker who offers a 4% per annum return
upon your money at the end of a 30-day period. For you to receive financial
returns from this option, you allow the stockbroker to invest your money in the
stock market. In order to receive financial returns, the stockbroker invests in the
stocks he or she expects to increase in value. The stockbroker will keep the other
part of any profit, as payment for his or her investment services.
Description 4
You can place your money in a safe where you live.

46
After they had read these four options, participants were instructed:
Now imagine you have $1000 that you can invest in any of the above investment
descriptions/options. Simply allocate as much of the $1000 as you want to any
number of the options. The amount of money and which option(s) you choose to
invest in are entirely up to you, but the total must equal $1000.
Once you have decided on the amount of money you wish to allocate, write this
amount in dollars on the line next to the chosen description(s). If you make a
mistake, simply cross it out and write in the new amount.
*Remember that you have a total of $1000 to allocate to any number of the
descriptions. Once you have finished this task, please proceed to the questionnaire
on the following page. If you have any questions please ask the experimenter.
After the allocation task was completed, participants completed the questionnaire. The
questionnaire began:
Simply read the following descriptions/options and answer the questions by
indicating the number that best reflects your opinion. There are no right or wrong
answers; we are only interested in what you think. If you have any questions,
please ask the experimenter.

47
Subsequently the participants had to make judgments indicating how they perceived each
of the four investment options from the preceding allocation task. The four options were
each presented again, followed each time by their batch of questions. Exact questions and
scales that followed each option are presented as Figure 1. Participants were asked to rate
the options in terms of: How likely they would receive the financial returns on offer
(Q.1), how willing they would be to invest in it (Q. 2 & Q.4), how confident they would
be to recommend it someone else (Q. 3), how confident they would be to invest different
amounts of money (Q. 5) and, in terms of delivering returns, how deceptive or truthful
they considered the option was (Q. 6). Questions 1, 2, 3, 4, & 6 were rated on 1-7
anchored Likert scales that measured the degree each construct was considered to be
present. For example, how likely they would receive the financial returns on offer was
measured on scales ranging from extremely unlikely (1) to extremely likely (7) with a mid
point of 50/50; willingness to invest was measured on scales ranging from extremely
unwilling (1) to extremely willing (7) with a mid-point unsure. Question 4 differed from
Question 2 in that it measured how willing participants were to invest different amounts
of income over time periods: income for a day, a week and a year. Question 5 required
participants to indicate on a scale ranging from extremely unconfident (1) to extremely
confident (100), how confident they would be to invest different amounts of money. The
dollar amounts to be rated were $1, $10, $50, $100, $500, $1,000, $5,000, $10,000,
$50,000, $100,000, $500,000 and $1,000,000. Once all tasks were completed,
participants were again thanked, debriefed and paid for their participation. Participants
were also invited to take part in later studies.

48
Figure 1: Questions and scales used in Experiment 1.
1. How likely do you think it is that you would receive the financial returns this option
offers?
1 2 3 4 5 6 7
extremely unlikely very unlikely 50/50 very likely extremely likely
2. How willing would you be to invest in this option?
1 2 3 4 5 6 7
extremely unwilling very unwilling unsure very willing extremely willing
3. How confident would you be in recommending this option to someone else?
1 2 3 4 5 6 7
extremely
unconfident very unconfident unsure very confident
extremely
confident

49
4. How willing would you be to invest the following general amounts of money in this
option?
Your income for a day
1 2 3 4 5 6 7
extremely
unwilling very unwilling unsure very willing
extremely
willing
Your income for a week
1 2 3 4 5 6 7
extremely
unwilling very unwilling unsure very willing
extremely
willing
Your income for a year
1 2 3 4 5 6 7
extremely
unwilling very unwilling unsure very willing
extremely
willing

50
5. How confident would you be in investing the following amounts of money into this
option? In the grey cells next to each dollar amount, write a number from 1-100,
which best reflects how confident you feel about investing. Remember that for each
dollar amount you can use any number from 1-100.
1 50 100
extremely
unconfident
extremely
confident
$1:00 $10:00 $50:00
$100:00 $500:00 $1,000:00
$5,000:00 $10,000:00 $50,000:00
$100,000:00 $500,000:00 $1,000,000:00
6. In terms of delivering its financial returns, how deceptive/truthful do you think the
description of this option was?
1 2 3 4 5 6 7
extremely
deceptive very deceptive unsure very truthful
extremely
truthful
51
Piloting
Two PhD students from the University of Canterbury read relevant material (Blaylock,
1998; Commerce Commission, 1997, 1999; Entombed Albania's Pyramids, 1997) and
came to an agreement on the fundamental aspects of pyramid schemes and how to word
the description of the scenarios above. To assure face validity, scenarios were presented
to 10 participants in a pilot study and they were asked to comment on ease of
comprehension and understanding of what was required of participants. Appropriate
corrections were made.
Results
Descriptive statistics
Descriptive statistics were calculated on the amounts of money participants invested in
the options (the bank, pyramid scheme, stock market & safe) from the $1000 they were
assigned. Ranging from greatest to least, the mean dollar amounts of money allocated to
the options were the bank (M = 444.02, SD = 306.78), the stock market (M = 250.54, SD
= 235.98), the pyramid scheme (M = 165.21, SD = 242.78) and the safe (M = 140.23, SD
= 202.22). When a repeated measures ANOVA was performed on these amounts of
money, a significant difference was evident, F(3, 273) = 20.96, p < .001. Post hoc testing
using Tukey’s Honestly Significant Difference Test revealed that the mean amount of
money invested in the bank (M = 444.02, SD = 306.78) was significantly greater than all
other options. The only other significant difference was that more money was allocated to
stock market (M = 250.54, SD = 235.98) than the safe (M = 140.23, SD = 202.23).
Of the 92 participants (investors) who completed the investment task and questionnaire,
43 (46.73%) of them were Pyramid Investors, whereas 49 (53.26%) were Non Pyramid
52
Investors (NPI). The Pyramid Investors allocated at least some money to the pyramid
scheme; the Non- Pyramid Investors allocated no money to the pyramid scheme.
Seventeen participants invested no money in the bank (18.48%), 26 (28.26%) invested no
money in the stock market and 45 (48.91%) invested nothing in the safe. A total of six
people invested all their $1,000 in the bank, two chose the pyramid scheme, two invested
all in the stock market and one put it all in the safe.
In order to reveal if Pyramid Investors and Non-Pyramid Investors differed in the
amounts of money they allocated to the other three options (the bank, stock market &
safe), a repeated measures analysis of variance was conducted. When a 2 (pyramid
investor vs. non-pyramid investors) X 3 (investment options) ANOVA with repeated
measures on the last factor was performed, the interaction effect was statistically
significant, F(2, 180) = 6.10, p < .01. As reported in Table 1, and supported by Tukey
post-hoc testing, non-pyramid investors allocated significantly more money to the bank
(M NPI = 575.51, SD = 310.26) than did pyramid investors (M PI = 294.17, SD = 225.25).
However, there were no significant differences between Pyramid Investors and Non-
Pyramid Investors in how much money they allocated to the stock market or safe. In
terms of within-group differences, the only significant difference was for the non-
pyramid investors in that they allocated significantly more money to the bank (M NPI =
575.51, SD = 310.26) than the stock market (M NPI = 285.71, SD = 280.07) and the safe
(M NPI = 138.76, SD = 235.90).
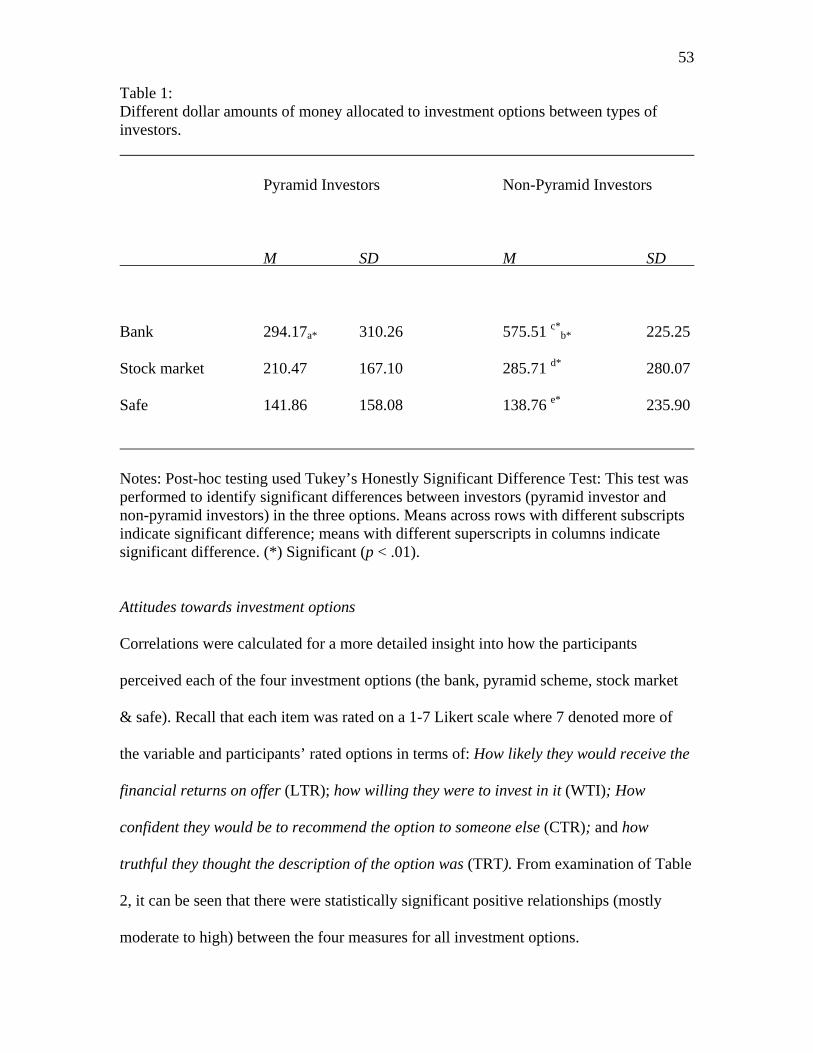
53
Table 1: Different dollar amounts of money allocated to investment options between types of investors.
Pyramid Investors Non-Pyramid Investors
M SD M SD
Bank 294.17a* 310.26 575.51 c*b* 225.25
Stock market 210.47 167.10 285.71 d* 280.07
Safe 141.86 158.08 138.76 e* 235.90
Notes: Post-hoc testing used Tukey’s Honestly Significant Difference Test: This test was performed to identify significant differences between investors (pyramid investor and non-pyramid investors) in the three options. Means across rows with different subscripts indicate significant difference; means with different superscripts in columns indicate significant difference. (*) Significant (p < .01).
Attitudes towards investment options
Correlations were calculated for a more detailed insight into how the participants
perceived each of the four investment options (the bank, pyramid scheme, stock market
& safe). Recall that each item was rated on a 1-7 Likert scale where 7 denoted more of
the variable and participants’ rated options in terms of: How likely they would receive the
financial returns on offer (LTR); how willing they were to invest in it (WTI); How
confident they would be to recommend the option to someone else (CTR); and how
truthful they thought the description of the option was (TRT). From examination of Table
2, it can be seen that there were statistically significant positive relationships (mostly
moderate to high) between the four measures for all investment options.

54
Table 2 also presents the relationships between the participants’ ratings of the four
investment options (the bank, pyramid scheme, stock market & safe). Statistically
significant positive relationships were seen between how likely they would receive (LTR)
the financial returns on offer from the bank with the stock market (r = .32, p < .001) and
the safe (r = .21, p < .05); how confident they would be to recommend (CTR) the bank
and stock market to someone else (r = .21, p < .05); and how truthful they thought the
description (TRT) of the bank and stock market were (r = .32, p < .001). Of the
remaining associations of the stock market and safe, only one negative correlation was
seen-between how willing they were to invest in the stock market and the safe (r = -.22, p
< .05). Negative relationships were seen in how willing they were to invest in the bank
and how confident they would be to recommend (CTR) the pyramid scheme to someone
else (r = -.25, p < .01); and how truthful they thought the description of the bank was
with how likely they would receive the financial returns on offer from the pyramid
scheme (r = -.22, p < .05). Overall, it seems that the bank and stock market were
perceived as rather similar, but the pyramid scheme was different to these and the safe
different again.
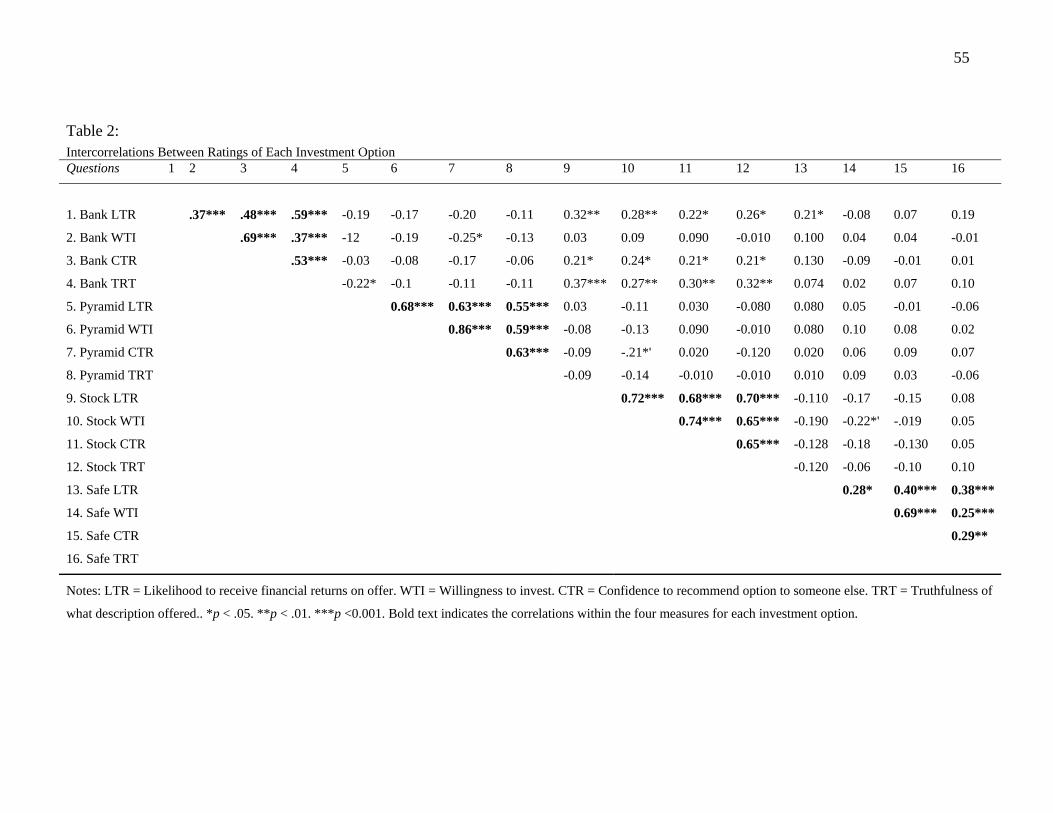
55
Table 2: Intercorrelations Between Ratings of Each Investment Option Questions 1 2 3 4 5 6 7 8 9 10 11 12 13 14 15 16
1. Bank LTR .37*** .48*** .59*** -0.19 -0.17 -0.20 -0.11 0.32** 0.28** 0.22* 0.26* 0.21* -0.08 0.07 0.19
2. Bank WTI .69*** .37*** -12 -0.19 -0.25* -0.13 0.03 0.09 0.090 -0.010 0.100 0.04 0.04 -0.01
3. Bank CTR .53*** -0.03 -0.08 -0.17 -0.06 0.21* 0.24* 0.21* 0.21* 0.130 -0.09 -0.01 0.01
4. Bank TRT -0.22* -0.1 -0.11 -0.11 0.37*** 0.27** 0.30** 0.32** 0.074 0.02 0.07 0.10
5. Pyramid LTR 0.68*** 0.63*** 0.55*** 0.03 -0.11 0.030 -0.080 0.080 0.05 -0.01 -0.06
6. Pyramid WTI 0.86*** 0.59*** -0.08 -0.13 0.090 -0.010 0.080 0.10 0.08 0.02
7. Pyramid CTR 0.63*** -0.09 -.21*' 0.020 -0.120 0.020 0.06 0.09 0.07
8. Pyramid TRT -0.09 -0.14 -0.010 -0.010 0.010 0.09 0.03 -0.06
9. Stock LTR 0.72*** 0.68*** 0.70*** -0.110 -0.17 -0.15 0.08
10. Stock WTI 0.74*** 0.65*** -0.190 -0.22*' -.019 0.05
11. Stock CTR 0.65*** -0.128 -0.18 -0.130 0.05
12. Stock TRT -0.120 -0.06 -0.10 0.10
13. Safe LTR 0.28* 0.40*** 0.38***
14. Safe WTI 0.69*** 0.25***
15. Safe CTR 0.29**
16. Safe TRT
Notes: LTR = Likelihood to receive financial returns on offer. WTI = Willingness to invest. CTR = Confidence to recommend option to someone else. TRT = Truthfulness of
what description offered.. *p < .05. **p < .01. ***p <0.001. Bold text indicates the correlations within the four measures for each investment option.
56
Hypothesis 1 predicted that significant positive relationships would exist between
the amounts of money allocated to investment options and people’s perceptions of
them. A correlation matrix was calculated to show the relationship between the
dollar amounts of money participants allocated to each of the options and how they
rated each in terms of: How likely they would receive the financial returns on offer;
how willing they were to invest in it; how confident they would be to recommend
the option to someone else; and how truthful they thought the description of the
option was in what it offered. There were several significant positive relationships
between the amounts of money participants invested in the bank and how it was
perceived. Statistical significance was reached with how willing they were to invest
in it (r = .55, p < .001); how confident they would be to recommend the option to
someone else (r = .29, p <.005) and how truthful they thought the description of the
option was (r = .21, p < .05). There was no significant relationship between the
amount of money invested in the bank and how likely they would receive the
financial returns on offer (r = .18).
There were several significant positive correlations between the amounts of money
participants invested in the pyramid scheme and how they perceived it. Statistical
significance was reached with how likely they would receive the financial returns
on offer (r = .51, p < .001); how willing they were to invest in it (r = .71, p < .001);
how confident they would be to recommend the option to someone else (r = .72, p <
.001) and how truthful they thought the description of the option was (r = .60, p <
.001).

57
Also, there were several significant positive correlations between the amounts of
money participants invested in the stock market and how it was perceived.
Statistical significance was reached with how likely they would receive the
financial returns on offer (r = .42, p < .001); how willing they were to invest in it (r
= .54, p < .001); how confident they would be to recommend the option to someone
else (r = .45, p < .001) and how truthful they thought the description of the option
was (r = .41, p < .001).
Finally, there was one significant positive correlation between the amounts of
money participants invested in the safe and how it was perceived. Statistical
significance was reached with how willing they were to invest in it (r = .37. p <
001). How likely they would receive the financial returns on offer (r = .12); how
confident they would be to recommend the option to someone else (r = .20) and
how truthful they thought the description of the option was (r = .11) did not reach
statistical significance.
An interesting finding to note concerns the size of the correlations associated with
the pyramid scheme. Consistently large positive correlations existed between the
amount of money invested in it and favorable perceptions. On the other hand, the
significant positive findings for the bank, stock market and safe were moderately
correlated, except for the large positive relationship between willingness to invest
and how much money was allocated to the bank. On the surface, investing in
pyramid schemes can be distinguished by larger correlations between perceptions
and the amounts of money invested.
58
Further Analysis
The ratings on the four measures (LTR, WTI, CTR, TRT) correlated with each
other (see Table 2). Means, standard deviations and Cronbach Alphas were
calculated for the items in each scenario. Table 3 shows items were sufficiently
similar to allow for further analysis (Aron & Aron, 1994). When a 2 (gender) X 4
(options) X 4 (ratings) ANOVA with repeated measure on the last two factors was
performed, the effect of participant sex was non-significant, F(1, 90) = 1.46, ns.
However the interaction effect between options and ratings was statistically
significant F(9, 810) = 14.21, p < 0.01. The main effect of the options was also
statistically significant, F(3, 270) = 36.94, p < 0.01. Post hoc analysis (Tukey
Honestly Significance Test) indicated that the participants’ combined average
ratings of the pyramid scheme (M = 2.89, SD = 1.56) were significantly lower than
those of the bank (M = 4.71, SD 1.34), the stock market (M = 4.25, SD = 1.17) and
the safe (M = 4.25, SD = 1.35). As presented in Figure 2, the average ratings of the
pyramid scheme were lower than those ratings of the remaining three investment
options (the bank, stock market & safe) and indicating it was a generally less
desirable investment option.
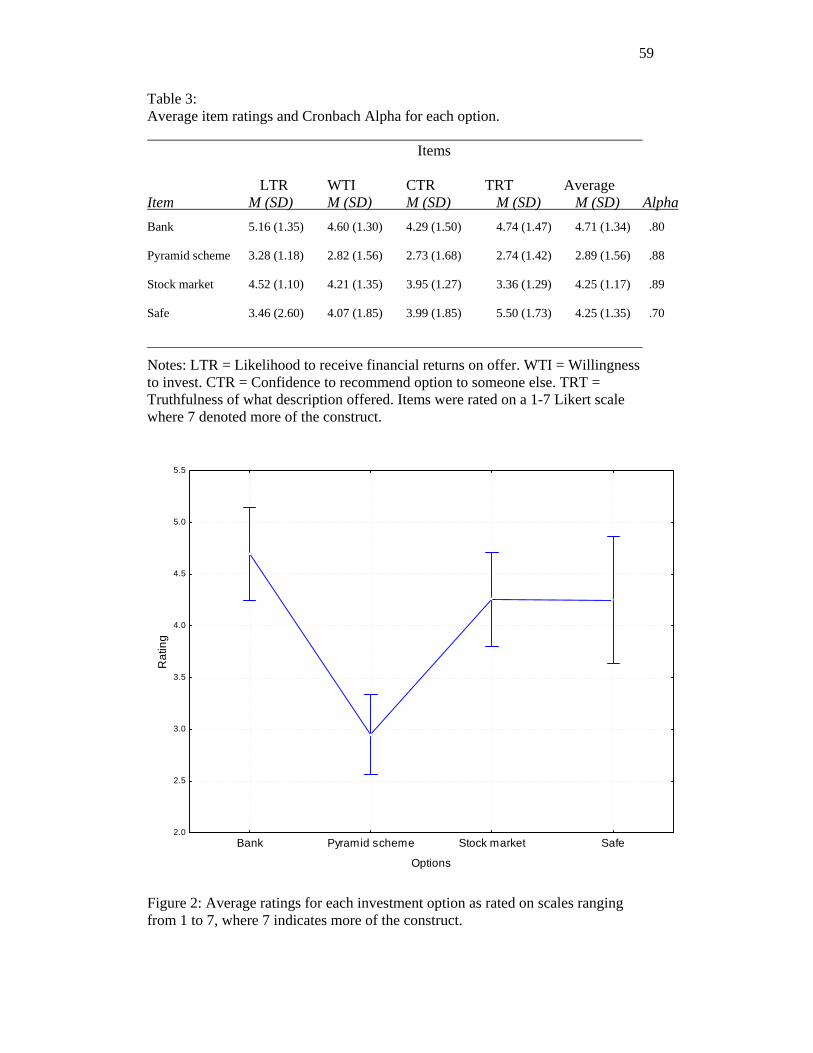
59
Table 3: Average item ratings and Cronbach Alpha for each option. Items
LTR WTI CTR TRT Average Item M (SD) M (SD) M (SD) M (SD) M (SD) Alpha Bank 5.16 (1.35) 4.60 (1.30) 4.29 (1.50) 4.74 (1.47) 4.71 (1.34) .80
Pyramid scheme 3.28 (1.18) 2.82 (1.56) 2.73 (1.68) 2.74 (1.42) 2.89 (1.56) .88
Stock market 4.52 (1.10) 4.21 (1.35) 3.95 (1.27) 3.36 (1.29) 4.25 (1.17) .89
Safe 3.46 (2.60) 4.07 (1.85) 3.99 (1.85) 5.50 (1.73) 4.25 (1.35) .70
Notes: LTR = Likelihood to receive financial returns on offer. WTI = Willingness to invest. CTR = Confidence to recommend option to someone else. TRT = Truthfulness of what description offered. Items were rated on a 1-7 Likert scale where 7 denoted more of the construct.
Bank Pyramid scheme Stock market Safe
Options
2.0
2.5
3.0
3.5
4.0
4.5
5.0
5.5
Rat
ing
Figure 2: Average ratings for each investment option as rated on scales ranging from 1 to 7, where 7 indicates more of the construct.

60
Given that a main effect existed between how pyramid investors and non-pyramid
investors allocated money to the bank, stock market and safe it was considered
appropriate to explore if they differed in their ratings of the four measures (LTR,
WTI, CTR, TRT). A series of 2 (pyramid investor vs. non-pyramid investors) X 4
(ratings) ANOVAs with repeated measures on the last factor was performed for each
option.
Bank
When the bank was analysed no statistically significant interaction effect was
evident, F(3, 270) = 0.35, ns. However a main effect of investor type was
statistically significant F(1, 90) = 4.38, p < .05. Tukey post-hoc testing revealed that
non-pyramid investors perceived the bank as a more favorable investment option
(M NPI = 4.93, SD = 1.16) than did the pyramid investors (M PI = 4.45, SD = 1.17).
The individual means and standard deviations for how pyramid investors and non-
pyramid investors rated the bank (see Table 4) on all four items were not
significantly different to each other.

61
Table 4: Average ratings of the bank between types of investors Pyramid Investor Non-Pyramid Investor
Question M SD M SD
1. LTR 4.95 1.52 5.34 1.14
2. WTI 4.30 1.24 4.95 1.27
3. CTR 4.06 1.45 4.48 1.45
6. TRT 4.51 1.59 4.94 1.34
Notes: LTR = Likelihood to receive financial returns on offer; WTI = Willingness to invest; CTR = Confidence to recommend option to someone else; TRD = Truthfulness of what description offered. Items were rated on a 1-7 Likert scale where 7 denoted more of the construct.
Pyramid scheme
When a 2 (pyramid investors vs. non-pyramid investors) X 4 (ratings) repeated
measures ANOVA was calculated for the pyramid scheme, the interaction effect was
statically significant, F(3, 270) = 8.73, p < .001. The main effect of investor type
was statistically significant. Pyramid investors perceived the pyramid scheme (M PI
= 3.80 SD = 1.35) as a more favorable investment option than did the non-pyramid
investors (M NPI = 2.08 SD = 0.94), F(1, 90) = 78.26, p < .001. Post hoc analysis
(Tukey Honestly Significance Test) indicated that pyramid investors’ mean ratings
of the pyramid scheme (see Table 5) were significantly more positive than the non-
pyramid investors ratings for: How likely they would receive the financial returns
on offer (M PI = 3.88, SD = 1.00; M NPI = 2.76, SD = 1.07); how willing they were to
invest in it (M PI = 3.95, SD = 1.43; M NPI = 1.82, SD = 0.81); how confident they
would be to recommend the option to someone else (M PI = 3.88, SD = 1.60; M NPI =
1.71, SD = 0.96); and how truthful they thought the description of the option was
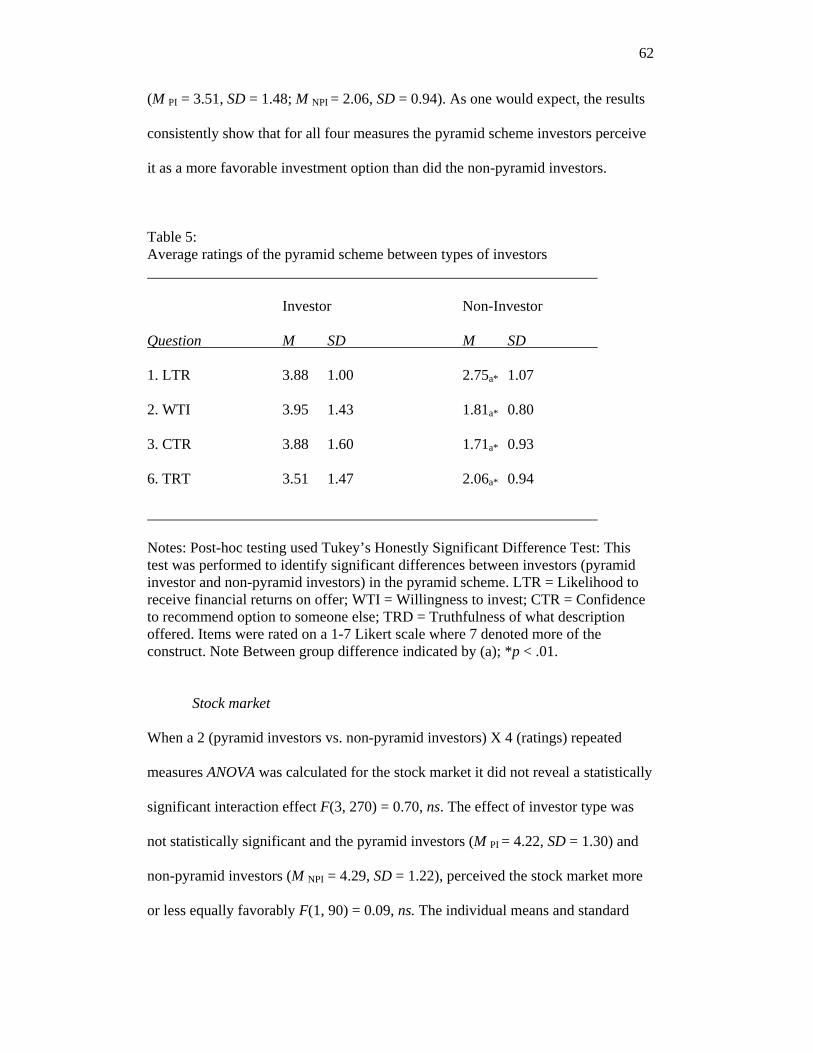
62
(M PI = 3.51, SD = 1.48; M NPI = 2.06, SD = 0.94). As one would expect, the results
consistently show that for all four measures the pyramid scheme investors perceive
it as a more favorable investment option than did the non-pyramid investors.
Table 5: Average ratings of the pyramid scheme between types of investors
Investor Non-Investor
Question M SD M SD
1. LTR 3.88 1.00 2.75a* 1.07
2. WTI 3.95 1.43 1.81a* 0.80
3. CTR 3.88 1.60 1.71a* 0.93
6. TRT 3.51 1.47 2.06a* 0.94
Notes: Post-hoc testing used Tukey’s Honestly Significant Difference Test: This test was performed to identify significant differences between investors (pyramid investor and non-pyramid investors) in the pyramid scheme. LTR = Likelihood to receive financial returns on offer; WTI = Willingness to invest; CTR = Confidence to recommend option to someone else; TRD = Truthfulness of what description offered. Items were rated on a 1-7 Likert scale where 7 denoted more of the construct. Note Between group difference indicated by (a); *p < .01.
Stock market
When a 2 (pyramid investors vs. non-pyramid investors) X 4 (ratings) repeated
measures ANOVA was calculated for the stock market it did not reveal a statistically
significant interaction effect F(3, 270) = 0.70, ns. The effect of investor type was
not statistically significant and the pyramid investors (M PI = 4.22, SD = 1.30) and
non-pyramid investors (M NPI = 4.29, SD = 1.22), perceived the stock market more
or less equally favorably F(1, 90) = 0.09, ns. The individual means and standard
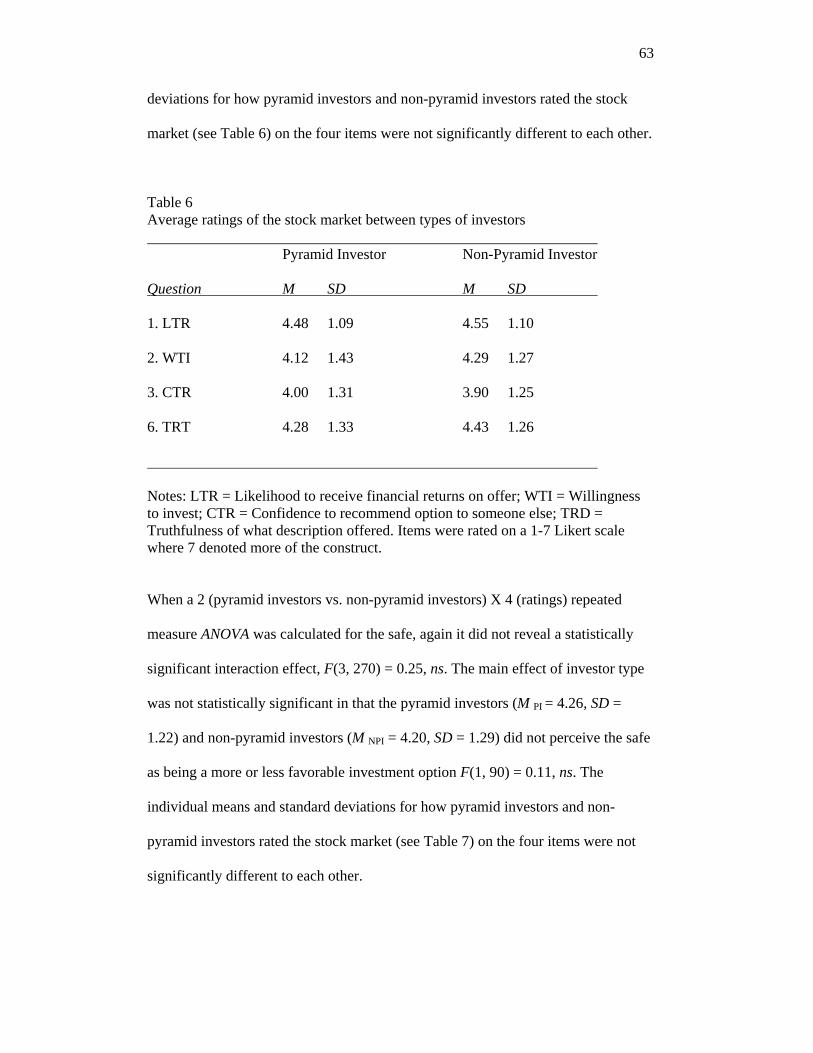
63
deviations for how pyramid investors and non-pyramid investors rated the stock
market (see Table 6) on the four items were not significantly different to each other.
Table 6 Average ratings of the stock market between types of investors Pyramid Investor Non-Pyramid Investor
Question M SD M SD
1. LTR 4.48 1.09 4.55 1.10
2. WTI 4.12 1.43 4.29 1.27
3. CTR 4.00 1.31 3.90 1.25
6. TRT 4.28 1.33 4.43 1.26
Notes: LTR = Likelihood to receive financial returns on offer; WTI = Willingness to invest; CTR = Confidence to recommend option to someone else; TRD = Truthfulness of what description offered. Items were rated on a 1-7 Likert scale where 7 denoted more of the construct.
When a 2 (pyramid investors vs. non-pyramid investors) X 4 (ratings) repeated
measure ANOVA was calculated for the safe, again it did not reveal a statistically
significant interaction effect, F(3, 270) = 0.25, ns. The main effect of investor type
was not statistically significant in that the pyramid investors (M PI = 4.26, SD =
1.22) and non-pyramid investors (M NPI = 4.20, SD = 1.29) did not perceive the safe
as being a more or less favorable investment option F(1, 90) = 0.11, ns. The
individual means and standard deviations for how pyramid investors and non-
pyramid investors rated the stock market (see Table 7) on the four items were not
significantly different to each other.

64
Table 7 Average ratings of the safe between types of investors Pyramid Investor Non-Pyramid Investor
Question M SD M SD
1. LTR 4.45 1.10 4.48 1.09
2. WTI 4.28 1.27 4.11 1.43
3. CTR 3.89 1.25 4.00 1.31
6. TRT 4.43 1.26 4.28 1.33
Notes: LTR = Likelihood to receive financial returns on offer; WTI = Willingness to invest; CTR = Confidence to recommend option to someone else; TRD = Truthfulness of what description offered. Items were rated on a 1-7 Likert scale where 7 denoted more of the construct.
Income analysis
The willingness of people to invest different amounts of income (a day’s, week’s &
year’s) into the bank, pyramid scheme, stock market and safe was explored by way
of a 3 (income) X 4 (options) repeated measures ANOVA. A statistically significant
interaction effect was present, F(6, 546) = 3.64, p < .01. When tested, a main effect
for options was statistically significant F(3, 273) = 22.49, p < .001. The effect of
income periods was also statistically significant F(2, 180) = 24.02, p < .001. Post
hoc analysis (Tukey Honestly test) revealed that the participants willingness to
invest income in the pyramid scheme (M = 2.99, SD = 1.80) was significantly less
than that for the bank (M = 4.22, SD = 1.60), the stock market (M = 4.17, SD =1.52)
and the safe (M = 4.61, SD = 1.91). As depicted in Figure 3, participants were less
willing to invest income into the pyramid scheme than any of the other three
investment options.
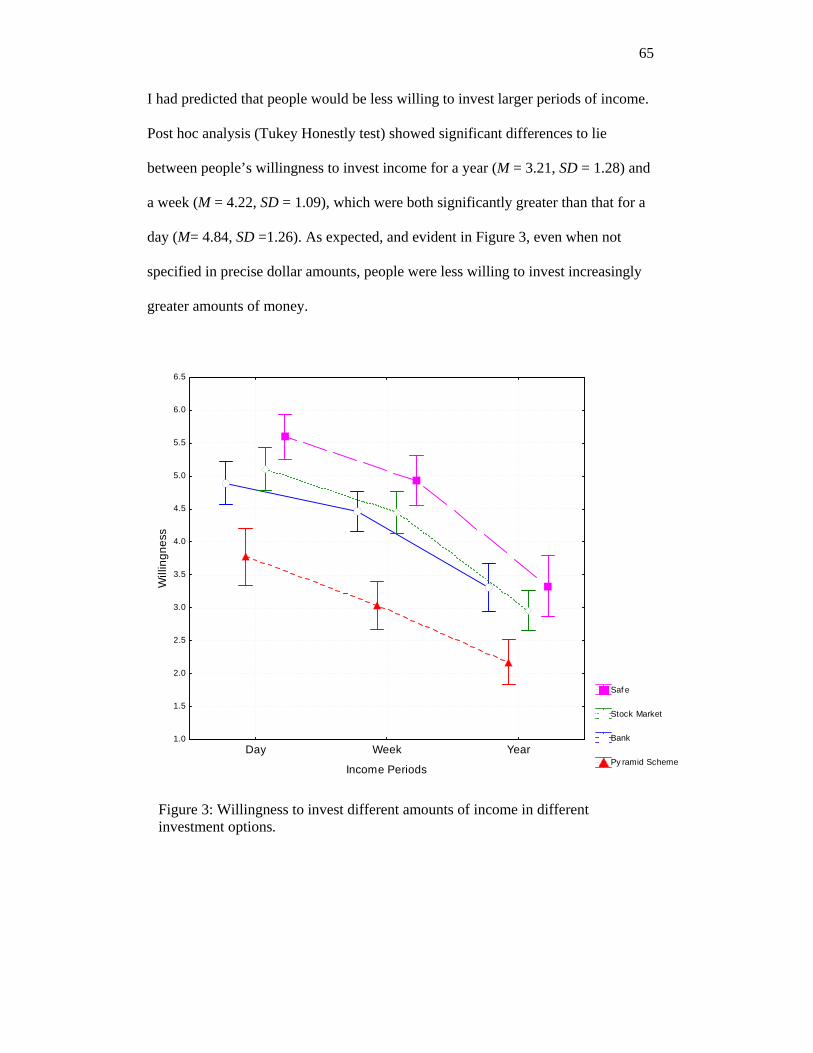
65
I had predicted that people would be less willing to invest larger periods of income.
Post hoc analysis (Tukey Honestly test) showed significant differences to lie
between people’s willingness to invest income for a year (M = 3.21, SD = 1.28) and
a week (M = 4.22, SD = 1.09), which were both significantly greater than that for a
day (M= 4.84, SD =1.26). As expected, and evident in Figure 3, even when not
specified in precise dollar amounts, people were less willing to invest increasingly
greater amounts of money.
Saf e
Stock Market
Bank
Py ramid SchemeDay Week Year
Income Periods
1.0
1.5
2.0
2.5
3.0
3.5
4.0
4.5
5.0
5.5
6.0
6.5
Will
ingn
ess
Figure 3: Willingness to invest different amounts of income in different investment options.
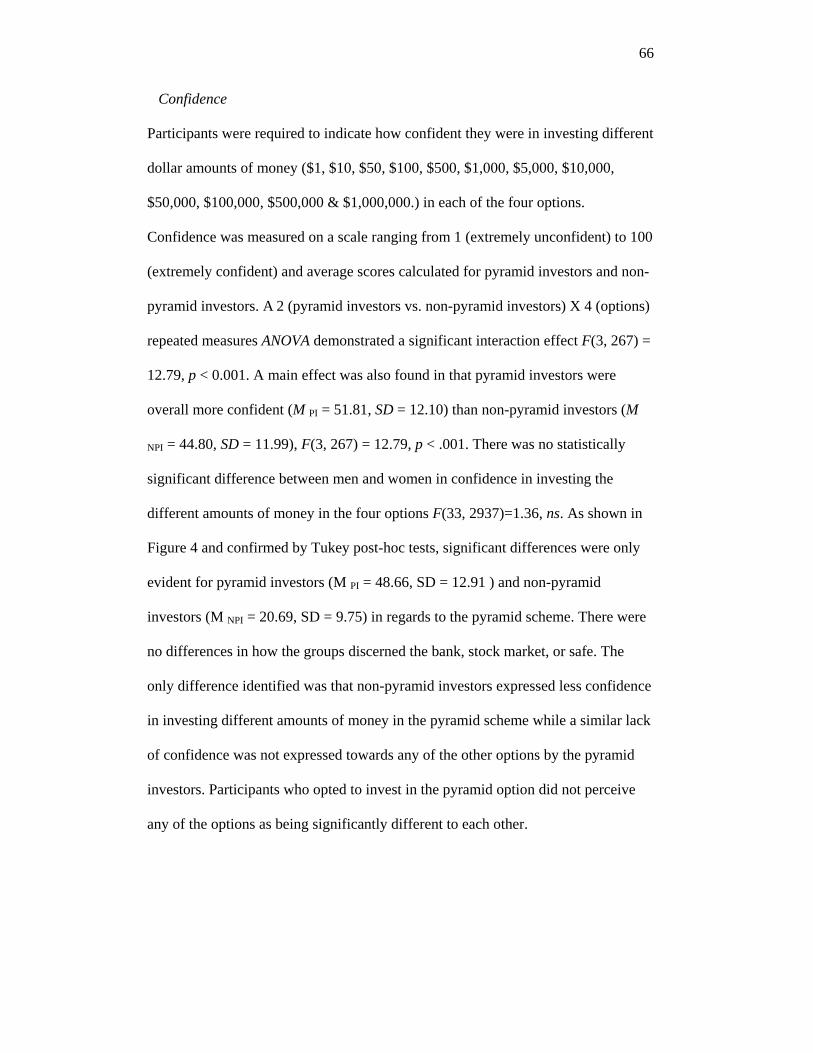
66
Confidence
Participants were required to indicate how confident they were in investing different
dollar amounts of money ($1, $10, $50, $100, $500, $1,000, $5,000, $10,000,
$50,000, $100,000, $500,000 & $1,000,000.) in each of the four options.
Confidence was measured on a scale ranging from 1 (extremely unconfident) to 100
(extremely confident) and average scores calculated for pyramid investors and non-
pyramid investors. A 2 (pyramid investors vs. non-pyramid investors) X 4 (options)
repeated measures ANOVA demonstrated a significant interaction effect F(3, 267) =
12.79, p < 0.001. A main effect was also found in that pyramid investors were
overall more confident (M PI = 51.81, SD = 12.10) than non-pyramid investors (M
NPI = 44.80, SD = 11.99), F(3, 267) = 12.79, p < .001. There was no statistically
significant difference between men and women in confidence in investing the
different amounts of money in the four options F(33, 2937)=1.36, ns. As shown in
Figure 4 and confirmed by Tukey post-hoc tests, significant differences were only
evident for pyramid investors (M PI = 48.66, SD = 12.91 ) and non-pyramid
investors (M NPI = 20.69, SD = 9.75) in regards to the pyramid scheme. There were
no differences in how the groups discerned the bank, stock market, or safe. The
only difference identified was that non-pyramid investors expressed less confidence
in investing different amounts of money in the pyramid scheme while a similar lack
of confidence was not expressed towards any of the other options by the pyramid
investors. Participants who opted to invest in the pyramid option did not perceive
any of the options as being significantly different to each other.
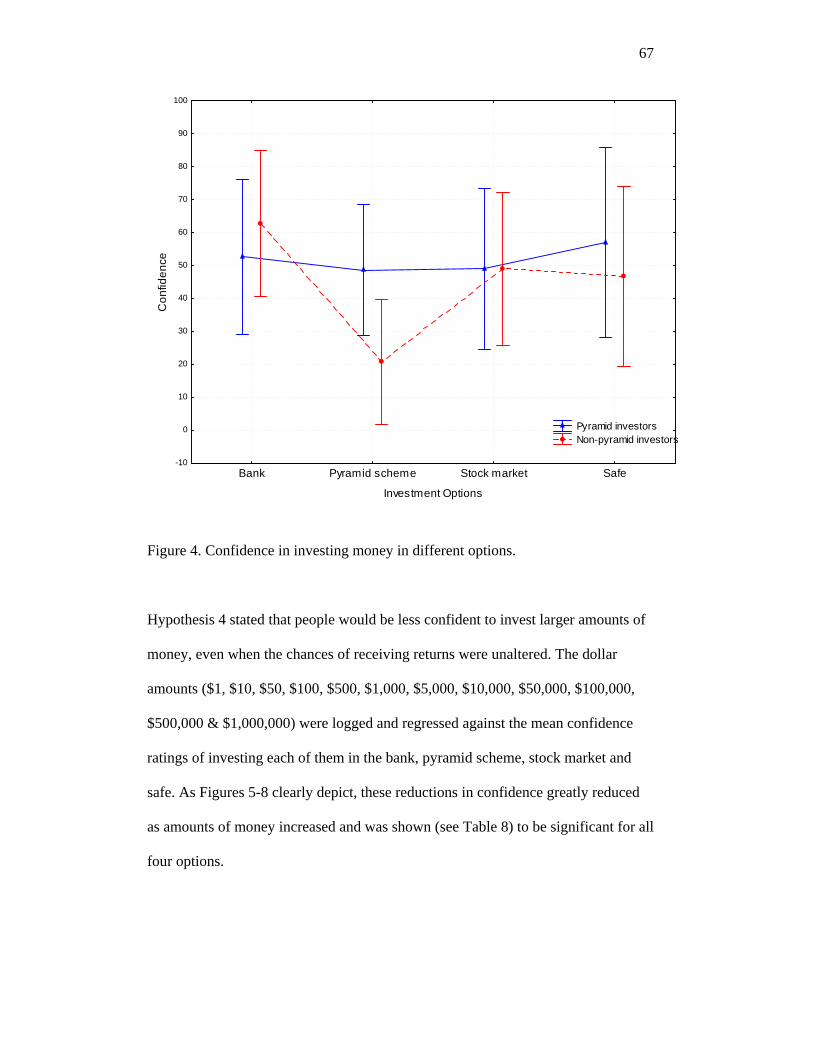
67
Bank Pyramid scheme Stock market Safe
Investment Options
-10
0
10
20
30
40
50
60
70
80
90
100
Con
fiden
ce
Pyramid investors Non-pyramid investors
Figure 4. Confidence in investing money in different options.
Hypothesis 4 stated that people would be less confident to invest larger amounts of
money, even when the chances of receiving returns were unaltered. The dollar
amounts ($1, $10, $50, $100, $500, $1,000, $5,000, $10,000, $50,000, $100,000,
$500,000 & $1,000,000) were logged and regressed against the mean confidence
ratings of investing each of them in the bank, pyramid scheme, stock market and
safe. As Figures 5-8 clearly depict, these reductions in confidence greatly reduced
as amounts of money increased and was shown (see Table 8) to be significant for all
four options.

68
Table 8 Summary of Regression Analysis for Variables Predicting Investor Confidence in Investing Money Option B SE B R2 B t
Bank -0.13 . 001 .96 -.98 -16.84***
Pyramid scheme -.07 .001 .96 -.96 -11.24***
Stock market -.01 .001 .97 -.97 -14.23***
Safe .08 .001 .94 -.97 -13.59***
Note: *** p < .001.
0 $1 $10 $100 $1,000 $10,000 $100,000 $1,000,000 730
40
50
60
70
80
90
100
Con
fiden
ce
non-pyramid investor pyramid investor
Figure 5: Average confidence in investing in the bank as a function of logarithmically scaled amounts of money to invest for pyramid and non-pyramid investors separately. Best fitting regression lines are shown.
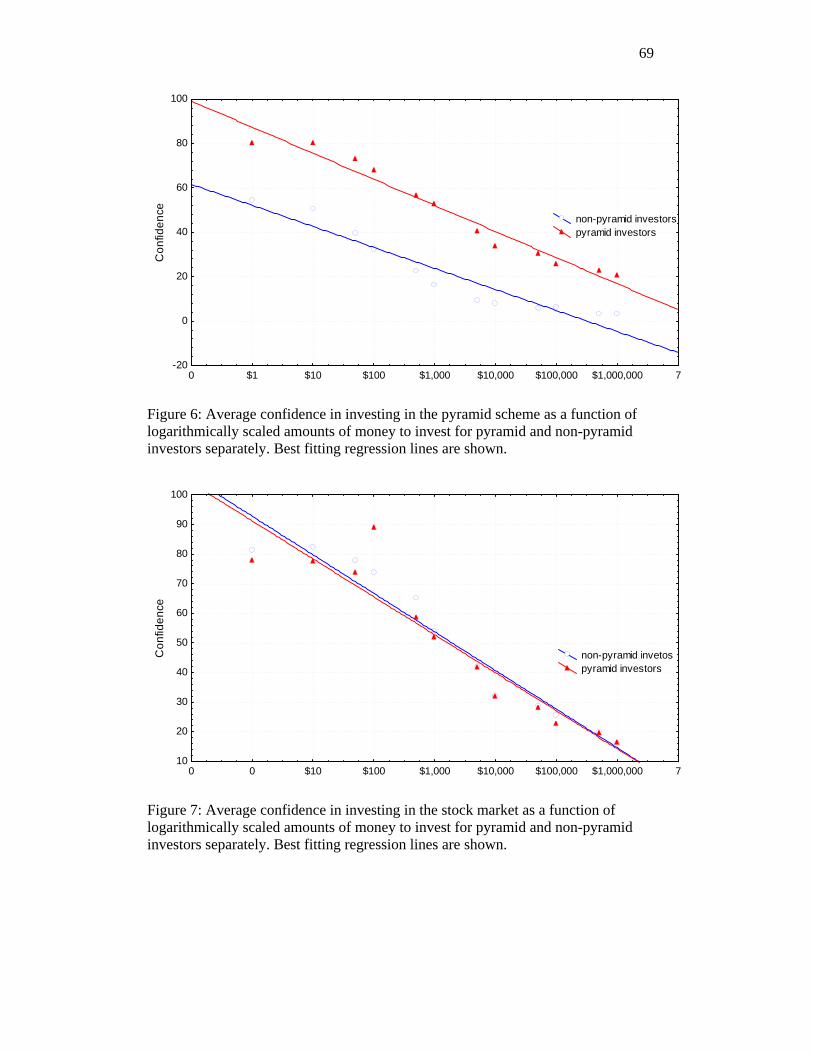
69
0 $1 $10 $100 $1,000 $10,000 $100,000 $1,000,000 7-20
0
20
40
60
80
100
Con
fiden
ce
non-pyramid investors pyramid investors
Figure 6: Average confidence in investing in the pyramid scheme as a function of logarithmically scaled amounts of money to invest for pyramid and non-pyramid investors separately. Best fitting regression lines are shown.
0 0 $10 $100 $1,000 $10,000 $100,000 $1,000,000 710
20
30
40
50
60
70
80
90
100
Con
fiden
ce
non-pyramid invetos pyramid investors
Figure 7: Average confidence in investing in the stock market as a function of logarithmically scaled amounts of money to invest for pyramid and non-pyramid investors separately. Best fitting regression lines are shown.

70
0 $1 $10 $100 $1,000 $10,000 $100,000 $1,000,000 70
10
20
30
40
50
60
70
80
90
100
Con
fiden
ce
non-pyramid investors pyramid investors
Figure 8: Average confidence in investing in the safe as a function of logarithmically scaled amounts of money to invest for pyramid and non-pyramid investors separately. Best fitting regression lines are shown.
Summary
Almost half of all the participants, who were all university students, were willing
invest money into the pyramid scheme. Between pyramid scheme and non-pyramid
scheme investors there were no differences in the amount of money they invested in
the stock market or safe. People’s perceptions generally correlated with their
investment choices. Generally people rated the pyramid scheme less highly. People
who invested in pyramid schemes were more confident when investing money in it
and, there were large correlations between positive perceptions of the scheme and
the amount of money invested in it. People were less confident and willing to invest
larger sums of money.

71
Study 2
An additional study seemed appropriate to explore the relationship between risk and
investment decisions. The previous Study 1 showed that significant positive
relationships exist between a person’s attitudes towards an investment option with
how much money they would invest in it. Study 2 was undertaken to determine if
people’s risk assessment of the potential investment options was also related to how
they chose to allocate money to them.
Method
Twenty males and 46 female students from the University of Canterbury were
recruited and paid five dollars to participate in the study.
Materials
The allocation task was similar to that used in Study 1. Participants imagined
themselves in each of four scenarios (bank, pyramid scheme, stock market & bank)
and allocated money as they saw fit. In addition subjects rated each investment in
terms of how risky they were perceived to be. Risk was assessed by way of a 10
point Likert scale that ranged from 1 (not at all risky) to 10 (extremely risky) with a
mid point of 50/50. Participants were asked to “Please rate each option in terms of:
How risky you consider it is to invest money in it”.
Procedure
The same experimental room was used as in Study 1 and once seated subjects
completed the money allocation tasks and rated each in terms of how risky the
72
option was considered. Stimuli orderings were randomised; payment and
expressions of gratitude were similar to those in Study 1.
Results
General descriptive statistics
Descriptive statistics were calculated for the amounts of money invested in each
option (the bank, pyramid scheme, stock market & safe). Ranging from greatest to
least, the mean amounts of money allocated to the options were the bank (M =
462.88, SD = 281.66), the stock market (M = 265.15, SD = 228.87), the pyramid
scheme (M = 171.97, SD = 281.65) and the safe (M = 77.25, SD = 145.23). When a
repeated measures ANOVA was performed on these amounts of money, a
statistically significant difference was evident, F(3, 195) = 26.22, p < .001. Post hoc
analysis (Tukey Honestly Significant Difference Test) revealed that the mean dollar
amount of money invested in the bank (M = 435.34, SD = 301.02) was significantly
greater than that invested in the pyramid scheme (M = 171.97, SD = 281.65), the
stock market (M = 265.15, SD = 228.87), or the safe (M = 77.25, SD = 145.23). The
only other significant effect was that more money was allocated to stock market (M
= 265.15, SD = 228.87) than the safe (M = 77.25, SD = 145.23). The pattern of
results was thus the same as that in Study 1.
Simple descriptive statistics revealed that of the 66 participants (investors), 34
(51.51%) of them chose to be pyramid investors (PI), while 32 (48.49%) to be non-
pyramid investors (NPI) and allocated no money at all to the pyramid scheme. In
regards to investing all the $1000 into only one option, three allocated it to the
73
bank, two to the pyramid scheme, one to the stock market; no one chose to leave it
all in the safe.
A repeated measures ANOVA was performed to test the perceived riskiness of the
bank, pyramid scheme, stock market and safe. Participants ratings on ten point
Likert scales were analysed for each option and were found to vary significantly,
F(3, 192) = 114.56, p < 0.001. No gender differences were found between how
males (M = 4.80, SD = 1.90) and females (M = 4.77, SD = 1.95), rated the overall
risk of investing in the options, F(1,63) = 0.01, ns. Post hoc analysis (Tukey
Honestly Significant Difference Test) revealed that the perceived risk associated
with investing in the bank (M = 2.69, SD = 1.88) and the safe (M = 2.35, SD = 1.84)
were significantly lower than that for the pyramid scheme (M = 7.20, SD = 2.99)
and the stock market (M = 6.87, SD = 1.81).
When correlation matrices were calculated between perceived risk and the amounts
of money invested in each option, significant relationships were seen. Significant
negative relationships existed between the amount of money participants allocated
and how much risk was associated with investing in the bank (r = -.25, p < .05), the
pyramid scheme (r = -.36, p < .01) and the stock market (r = -.34, p < .01). Results
also suggested that the people who considered the pyramid scheme to be riskier
were more likely to invest in the stock market (r = .49, p < .001), whereas those
who considered the bank as riskier opted for the safe (r = .38, .01). Clearly when
people invested money in the options the associated risk of the respective option
was a significant consideration. The greater the perceived risk associated with
investing in these options the less money was allocated to them.

74
Summary
Study 2 demonstrated people’s perceptions of the riskiness of investment options
correlated with the amount of money they invested, as had been predicted
(Hypothesis 6). Other results virtually replicated those found in Study 1. For
example, there was almost a 50/50 split between who invested in the pyramid
scheme and who did not invest in the pyramid scheme.
75
CHAPTER 5
Study 3: Exploring Behaviours and Types of Decisions People Make When Involved in Pyramid Schemes.
Introduction
Study 1 revealed links between peoples’ perceptions of investment options and how
they allocated money to them. In brief, the amount of money invested in the
pyramid scheme received consistently large positive correlations with optimistic
perceptions of it in terms of: their likelihood to receive funds, their willingness to
invest in it, their confidence in recommending it to someone else, and the perceived
level of truthfulness in its description of what the returns would be. The amount of
money invested in the legitimate investment options (the bank, stock market & safe)
moderately correlated with perceptions of them. One high correlation existed
between the amount invested in the bank and willingness to invest in it.
The present study extended the investigation into pyramid schemes by analyzing
how people might behave when they have already become involved in pyramid
schemes. Participants (agents) were placed in the role of investors looking for new
people (targets) to invest in the schemes. The study consisted of three parts: a diadic
word choice experiment; assigning explanations to targets that could affect
investment decisions; and rating and ranking how close they perceived targets to be
to themselves.
Pyramid schemes are based on impossible promises, and when this is realized by
agents, the recruitment of others must be based on deceit (see Chapter 1). I
attempted to construct an experimental task that would investigate this behaviour.

76
Participants read short scenarios and completed a series of tasks. The manipulated
variables included: the relationship between targets and participants, and the
participants’ and targets’ expected chances of receiving investment returns from the
pyramid schemes. Measures included how closely participants rated and ranked
targets, and types of explanations assigned to targets. Targets were presented to
participants within a framework of their relationship with the participant and ranged
from being not at all close to extremely close. This subjective rating allowed for
more accurate measurements of the closeness of the targets than the experimenter
could have managed (DePaulo & Kashy, 1998). Subjective rating was used because
objective relationships of the same degree may actually be more or less close. For
example, one man may be very close to his sister, while another man only has a
distant relationship with his sister. Agents were able to give targets explanations
that varied in their likelihood of influencing them to become pyramid investors.
Eventual financial returns for targets and agents were limited to the parameters of
pyramid schemes, which most frequently result in financial loss (Commerce
Commission, 1997).
The published statistics describing people affected by pyramid schemes show their
relationship with the target investors to fall within three main categories: family
members, friends and work colleagues (Commerce Commission, 1997). These
associations contrast with the typical professional relationships maintained between
legitimate investment houses, and stock markets and their investors (although there
are a number of family firms).
77
As mentioned above, the principle of altruistic behaviour towards others shows that
people are more likely to act altruistically to the people most closely related to
them, or to whom they generally feel close to (Ridley, 1996; Sigmund, 1993).
However, the generalisability of this principle to people involved in pyramid
schemes and their subsequent behavior is unknown. As people involved in these
schemes are typically friends, family members or work colleagues (Commerce
Commission, 1997), basic principles of evolutionary psychology were expected to
be predictive of the participant’s economic behaviour. More precisely, it was
expected that, in the short term, when the perceived chance of receiving financial
returns is greater, people would be more likely to approach those close to them and
deceive them less. As the chance of financial loss increases, the incidence of
deception would increase and targets that were considered closer would be
approached less often than more distant ones.
Method
Participants
Participants were 22 male (M age = 20, SD = 1.36) and 22 female (Mage = 24, SD =
8.39) students from the University of Canterbury, New Zealand who volunteered
for a study entitled “Exploring peoples investment decisions and behaviours within
a framework of psychology”. Participants were recruited by advertisement that
asked for people willing to take part in an experiment exploring people’s
investment choices and behaviours. They were informed that they would be given
five dollar vouchers for participation and that the experiment would take
approximately forty minutes to complete.

78
Materials
Word stimuli generation
Words used to represent target investors were generated by 10 male & 10 female
introductory psychology students from the University of Canterbury, New Zealand.
They were asked to write down as many individual words as they could that
represented people they considered ranged from not at all close to extremely close
to themselves. The example of “mother” was given as a possible word that denoted
someone who could be considered very or extremely close. The experimenter
accepted words (target people) for which there was agreement as to closeness from
eighty five percent of the students. At the end of the session a list of seventeen
target words was formed that represented people who ranged in terms of closeness.
Ranging from most to least close, the words were mother, father, brother, sister,
aunt, uncle, cousin, friend, man, woman, student, enemy, stranger, nurse, builder,
butcher and chemist.
Rating scales
Rating scales allowed participants (agents) to give target investors different possible
explanations that would influence the target’s investment behaviour (see Figure 9).
The explanation scales were anchored analog vertical lines that were one hundred
millimeters in length. These were printed on sheets of A4 paper with the target
identified in the upper left corner. The mid point of the scales had a neutral/no
effect area while the anchors at the ends were worded: “An explanation that would
almost certainly result in investing” and “An explanation that would almost
certainly result in not investing”. Thus participants did not actually have to generate
or choose a persuasive explanation but only the strength and direction of it.
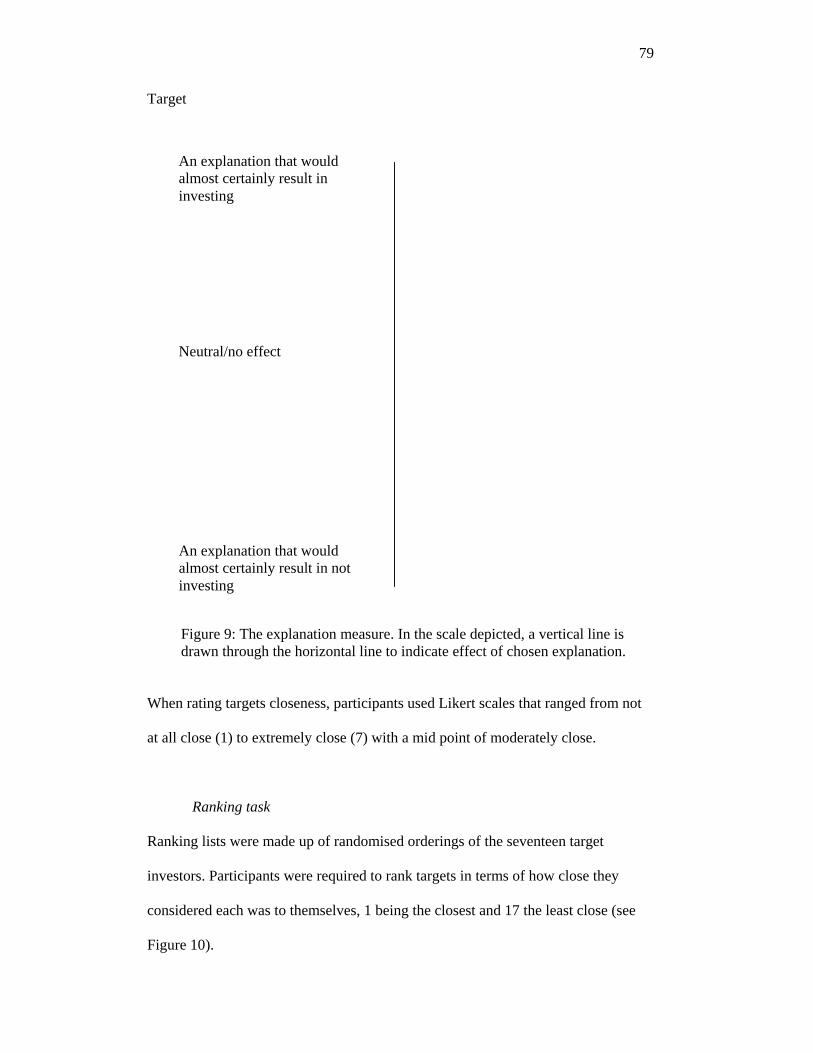
79
Target
Figure 9: The explanation measure. In the scale depicted, a vertical line is drawn through the horizontal line to indicate effect of chosen explanation.
When rating targets closeness, participants used Likert scales that ranged from not
at all close (1) to extremely close (7) with a mid point of moderately close.
Ranking task
Ranking lists were made up of randomised orderings of the seventeen target
investors. Participants were required to rank targets in terms of how close they
considered each was to themselves, 1 being the closest and 17 the least close (see
Figure 10).
An explanation that would almost certainly result in investing
Neutral/no effect
An explanation that would almost certainly result in not investing

80
Simply rank the following people in terms of how close each is to you.
1 being the closest, 2 the next closest and so on until you get to 17, which
would be the least close. Simply write the number that reflects your
ranking in the cell next to the name. If you make a mistake or change
your mind, cross it out and write the correct number beside the
mistake. Please ask the experimenter if you have any questions. Please
begin.
student brother man nurse builder chemist butcher woman enemy uncle stranger aunt friend father mother sister cousin
Figure 10: The ranking measure.
Software
Superlab software (Hisham & Sugar, 2001) was used to run the experiment vi a 14
inch monitor connected to a COMPAQ PC. Full details of Superlab can be accessed
via www.cedrus.com.
81
Procedure
Experimental sessions were blocked into forty minute intervals; and to minimize
any disturbance all the subjects to be tested in a session were present before the
experiment commenced. Sessions were run in the same lab as in Study 1, with a
maximum of four participants run at any one time. Each person was greeted and
seated in a cubicle, which ensured they could complete the experiment in privacy
and without being distracted by other participants or the experimenter. Once seated,
the participants were told that there were three main tasks to complete and to follow
the instructions on the computer screen.
Task one, diadic target choice
The target choice experiment required participants to choose between stimuli
displays of two possible target investors. The stimuli were made up of all possible
paired combinations of the target investors and selection was made by participants
pressing one of two keys on a keyboard. Presentations of the pairs were balanced
and displays randomised in all experimental conditions to counter order effects.
Word pairs were horizontally positioned and centered when displayed on the
computer screens. Participants were exposed to two experimental conditions:
Condition 1 outlined what pyramid schemes offer in terms of high financial gain,
whereas Condition 2 reflected how unlikely it was to achieve what was on offer. To
reflect the most common experience of pyramid investors, Condition 1 always
preceded Condition 2. Participants began the experiment by reading a description of
experimental Condition 1 and following the instructions on the computer screen
which read:

82
Imagine you have invested a $1,000 in a proposal that offers to keep
doubling your money in short terms of time. For you to receive these
financial returns, you have to get other people to invest $1000. The greater
the number and the quicker you get people to invest, the less time it takes to
double your money. As more and more people invest, the number of times
you double your money increases and potentially you and the new investors
could earn extremely large amounts of money. This option relies on the
revenue of new investors to generate its funds.
Your task is to choose between one of two people to be a new investor. In
other words, who would you like to tell about the above investment proposal
and want to become a new investor. A simple example may help explain
what you are to do.
Two words will be presented on the screen, e.g.:
baker mechanic
If you were to choose baker, press the left white dot on the key board; if you
choose mechanic, press the right dot. It is that simple, there are no right or
wrong answers, we are only interested in your choices. Work as fast and
accurately as you can. Please ask the experimenter if you have any
questions. Press any key to begin (e.g. the letter B).”
The second stage of the experiment began with participants being presented with
the following screen of information:

83
Now imagine you are still looking for investors to get your $1000 back or
make a profit. You now realise that each person who invests also has to get
other new investors to get their money back or make a profit, but the
chances of them ever doing this is extremely unlikely or near impossible.
Your task is to once again choose between one of two people to know about
the investment proposal and want to become a new investor. Work as
accurately and as quickly as you can.
Press any key to begin (e.g. the letter B).
Again all the pairs were balanced and presented randomly. Once these two decision
tasks were completed participants were instructed on the computer screen to
proceed to the analog rating task. Participants were presented with the following
instructions:
Now imagine you can give the people explanations about the previous
proposal. When approaching the people, you can tell them different types of
explanations that will influence their likelihood of investing. In fact,
depending on what you tell a person, their possibility of investing can range
from almost certainly will result in investing to almost certainly will result
in not investing; with a mid point that will have no effect.
84
Imagine it has been some time and you are still looking for investors to get
your $1000 back, or make a profit. You realise that each person who invests
also has to get other new investors to get their money back or make a profit,
but the chances of them ever doing this is extremely unlikely or near
impossible.
On the following pages, draw a line through the vertical scale to indicate
what type of explanation you would give each person.
Subjects were then presented with the seventeen randomly ordered explanation
scales (one for each target person) that they could use to affect the target investors
likelihood to invest in the pyramid scheme. When they had completed the task, the
participants moved on to the final parts of this experiment that required them to rate
and rank the targets in terms of how close they felt each target was to themselves.
When rating targets closeness, Likert scales were used that ranged from not at all
close (1) to extremely close (10) with a mid point of moderately close. Agents also
ranked targets from 1, the most close, to 17, the least close to themselves. Again the
order of these stimuli were randomised and once completed, participants were
thanked, debriefed and paid for taking part in the experiment. The total time to
complete the experiment did not exceed 40 minutes.
85
Results
Manipulation check
The experimenter rankings for the 17 targets were compared with the ranked ratings
from participants (see Table 9) using Kendall’s Tau correlation This revealed a
significant correlation between the two measures (T = .64, p < .01), which indicated
that the participants perceived the closeness of targets in the predicted direction
(Aron & Aron, 1994).
Table: 9 Average closeness ratings for each of the 17 target investors as rated on scales that ranged from 1 (not at all close) to 7 (extremely close). Targets are presented in descending order of closeness to participants.
Target Mean SD mother 6.31 1.16
father 5.89 1.23
friend 5.89 1.17
sister 5.64 1.51
brother 5.36 1.79
aunt 4.60 1.05
uncle 4.31 0.97
cousin 4.11 1.13
student 3.76 1.19
builder 3.07 1.16
nurse 3.04 1.17
woman 3.02 1.34
man 2.47 1.25
chemist 2.24 1.07
butcher 1.71 1.06
stranger 1.56 0.87
enemy 1.53 1.29
86
Main results
Simple statistics for the two experimental conditions were calculated to describe the
participants’ choices of investors from the possible 17 targets. Condition 1 (no
monetary loss) placed participants in the position of having invested $1,000 into a
pyramid scheme that offered high financial returns for investors (agents & targets).
Condition 2 (monetary loss) presented the participants with the near impossible but
realistic experiences investors (agents & targets) have of not achieving any financial
returns and losing their money. Targets were rated on scales from 1-7 of how close
they were to each target (greater numbers indicated more closeness), and ranked
from 1-17 in descending order of closeness to themselves.
Hypothesis 7 had predicted that a significant difference would exist between the
targets chosen in the two experimental conditions. When participants were engaged
in a pyramid scheme and informed about the certain monetary loss for them and
new investors (Condition 2), they would choose targets less close to themselves
than those targets chosen in Condition 1 (no loss). When the closeness ratings of the
targets who were chosen in each experimental condition were compared the
difference was statistically significant, t(43) = 5.42, p < 0.001. The targets who
were chosen as pyramid investors in the monetary loss Condition 2 (M = 3.48, SD =
0.85) were rated by agents as being significantly less close to themselves than those
chosen in the no monetary loss Condition 1 (M = 4.22, SD = 0.85). As the almost
certain financial loss from investing in a pyramid scheme became apparent,
participants selected targets who were less close.
87
Relationships between the participants’ choice of targets in the second loss
condition and how closely they ranked the targets were explored. Rank order
correlations were calculated between the explanations given to the selected targets
and how closely they were ranked. The prediction had been made that participants’
explanations would vary with how close targets were ranked to themselves. The
closer a target was ranked the less likely the explanation was expected to result in
investing in the loss condition. Analysis in the form of Spearman rank order
correlation was performed on participants’ ranked orders of the 17 target investors
with the explanations each was given. When the correlations were calculated it
revealed that as explanations not to invest became stronger these were significantly
related to how close the participants ranked the targets (rs = -.87, p < 0.01). This
very high correlation showed that when having to make a choice of who to persuade
in a situation that offered almost certain monetary loss, people who were ranked as
being less close to the agent were chosen.
Summary
Several statistically significant correlations have emerged from the data. When
placed in the position of having invested money into a pyramid scheme, people’s
choice of who they selected to become a pyramid investor changed with the
likelihood of them losing money from their investment. People selected the targets
who they considered were close to themselves when there was no monetary loss
associated with the pyramid scheme. Conversely, when it was made clear that
monetary loss was almost certain for all pyramid investors, participants selected
targets that were less close to themselves. As the conditions associated with
88
pyramid schemes changed so did the reported economic behaviours of the
participants.
Study 4
A limitation of Study 3 concerns the time of presentation of the explanation task.
Here it was given after completion of the diatic word task exercise. Participants
select the types of explanations they could assign targets only in experimental
Condition 2 (monetary loss). A more effective and perhaps simpler experimental
design would have had the explanation task presented after each experimental
condition, thus making it easier to measure differences in explanations given in the
loss condition (Condition 1) versus non-loss condition (Condition 2). In Study 4,
participants also selected explanations given to the targets in Condition 1 (no
monetary loss). The question to be addressed here was: Would the explanations
given to targets in the Condition 1 (no loss) be significantly different to those
explanations given in Condition 2 (loss)? Hence, the current study was performed to
extend and enhance the findings of Study 3.
Method
Participants
Participants were ten male and 15 female students from the University of
Canterbury who were each paid five dollars to complete a study entitled “Exploring
people’s investment decisions and behaviours within a framework of psychology”.

89
Materials
Materials were the investment tasks, rating and explanation scales outlined in the
previous Study 3.
Procedure
The procedure was adapted from Study 3 in that participants did not perform the
diadic word task and ranking exercise. However the participants, as in the previous
study completed the same rating and explanation tasks with the latter done after
each experimental condition. The 1-10 rating scales measured how close agents
perceived a target to be to them and the explanation scales (ranging from –ve 100 to
+ve 100) could be used to affect the target investors’ likelihood to invest in the
pyramid scheme. Subjects were first required to complete the explanation task,
which required them to assign an explanation to each and every target in Condition
1, and then in Condition 2. When they had completed the explanation task
participants moved on to the final parts of this experiment that required them to rate
the targets in terms of how close they felt each target was to themselves. Again the
order of the target stimuli was randomized. Once they had completed the
experiment, participants were thanked, debriefed and paid for taking part in the
experiment. The total time to complete the experiment did not exceed 25 minutes.
90
Results
The types of explanations that people assigned to targets in experimental Condition
1 and 2 were compared. Condition 1 had participants (agents) in the early stages of
a pyramid scheme where no monetary loss was stated, whereas Condition 2 made
clear the almost certain loss of money invested in a pyramid scheme. When rated on
a scale from -ve 100 to +ve 100, where higher scores indicated more likelihood of
investing, the mean explanation rating given to the targets in Condition 1 was
greater than that for Condition 2. Average ratings were calculated for each of the 17
targets in each experimental condition (see Table 10). A dependant measures t-test
was performed and showed that explanations given in Condition 1 (M no loss = 29.35,
SD = 34.59), were significantly more likely to cause targets to invest in the pyramid
scheme than those given to investors in Condition 2 (M loss = -10.67, SD = 43.56),
t(25) = 3.34, p < .01; as in Study 3.
As in Study 3, participants (agents) in Study 4 rated target investors on scales from
1-7 where 7 indicated greater closeness to themselves. Ratings of how close they
considered target pyramid investors to be to and the explanations they gave them,
were expected to be correlated to each other. The prediction was made that when
participants were in Condition 1 (no loss), they would give explanations that would
more likely result in investing to targets who were close to them; whereas in
Condition 2 (loss) the targets who were considered close would receive
explanations that would more likely result in not investing. Pearson’s correlations
were calculated between how close each target was rated with the explanations they
received. When calculated for Condition 1, the large positive relationship between

91
how close targets were and the respective explanations was statistically significant,
(r =.87, p < .001). The large negative relationship between the variables in
Condition 2 was also statistically significant (r = -.92, p < .001). When no monetary
loss was stated participants offered explanations that would more likely result in
investing to the target investors they rated as being close to themselves. However,
when a monetary loss became evident they offered explanations that would more
likely not result in investing. People’s choices of explanations given to target
pyramid investors varied both with how close they were to the respondent and
whether or not a monetary loss was anticipated.
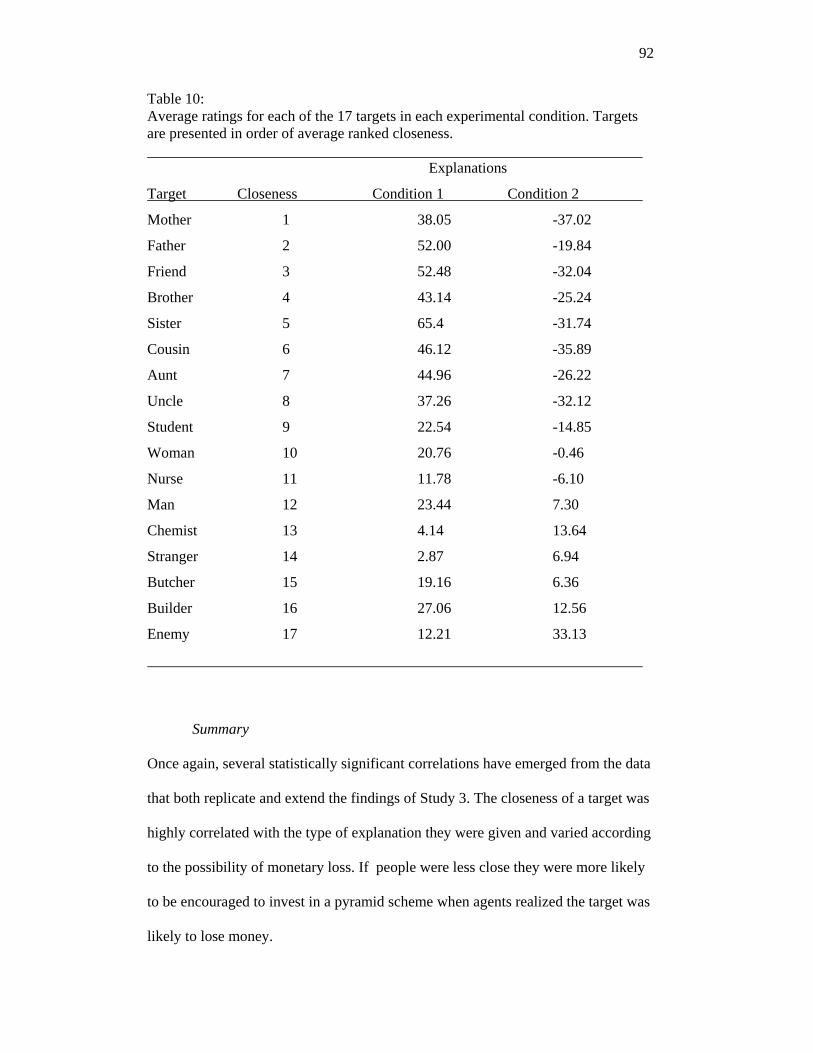
92
Table 10: Average ratings for each of the 17 targets in each experimental condition. Targets are presented in order of average ranked closeness.
Explanations
Target Closeness Condition 1 Condition 2
Mother 1 38.05 -37.02
Father 2 52.00 -19.84
Friend 3 52.48 -32.04
Brother 4 43.14 -25.24
Sister 5 65.4 -31.74
Cousin 6 46.12 -35.89
Aunt 7 44.96 -26.22
Uncle 8 37.26 -32.12
Student 9 22.54 -14.85
Woman 10 20.76 -0.46
Nurse 11 11.78 -6.10
Man 12 23.44 7.30
Chemist 13 4.14 13.64
Stranger 14 2.87 6.94
Butcher 15 19.16 6.36
Builder 16 27.06 12.56
Enemy 17 12.21 33.13
Summary
Once again, several statistically significant correlations have emerged from the data
that both replicate and extend the findings of Study 3. The closeness of a target was
highly correlated with the type of explanation they were given and varied according
to the possibility of monetary loss. If people were less close they were more likely
to be encouraged to invest in a pyramid scheme when agents realized the target was
likely to lose money.

93
CHAPTER 6
Studies 5 & 6: Identifying Relationships between People’s Risk Seeking Behaviour, Numerical Ability and Investment Decisions.
Introduction
Studies 1 and 2 showed that nearly half of all the student participants were prepared
to invest money in the pyramid. What individual differences exist between these
people that predict who will or will not become a pyramid scheme investor? Given
previous research has shown intelligence to predict a person’s behaviour (Cascio,
1991) and a person’s risk propensity can predict investment their decisions (Hunter
& Kemp, 2004) these constructs were the focus of Studies 5 and 6..
It was thought important to determine if an individual’s propensity to engage in risk
seeking activities and reasoning ability would relate to how much money they
allocated to different investment options. Sensation seeking scores, as measured by
Zuckerman’s Sensation Seeking Scale V (SSS-V), were used to ascertain
individuals’ propensities for risk; the Australian Council for Educational Research
BQ (ACER BQ) was used to measure individual numerical reasoning ability
because it has been shown to be a valid tool (ACER, 1982). As intelligence has
never been tested as a possible factor in pyramid scheme investment, it will be
included here.
It is almost impossible to address investment decisions in the broader discipline of
economic psychology without mentioning or encountering the concept of risk. As
94
reviewed earlier, economic psychology is replete with studies on investors’
investment decisions and their relationships to risk (see Chapter 2). Similarly,
psychology has a fundamental interest in the measurement of people’s attitudes and
abilities to be used to predict and explain future behaviours (Gray, 2002).It was
considered likely that sensation seekers would be identified as having a greater
attraction to different investment options than people less willing to engage in
sensation-seeking behaviours.
Method
Participants
Students from the University of Canterbury took part in a study entitled “Exploring
factors that contribute to investing money”. Twenty-nine males and 29 females
were recruited by advertisement; two males and six females were participants from
Study 1 who had expressed an interest in follow-up experiments. Participants were
informed the experiment would take approximately 40-45 minutes and they would
each be given a five dollar gift voucher as payment and a token of appreciation.
Materials
The Australian Council for Educational Research (ACER) BQ numerical test was
administered. Items included in this paper and pencil test included number
sequences, arithmetic reasoning and number matrices. Investment and allocation
tasks from Study 1 and Zuckerman’s online Sensation Seeking Scale Form IV
(SSS-V) (see Appendix A) were also used. Participants were informed that the

95
questionnaire was designed to explore people’s tendency towards varied, novel and
intense sensations. Pencils were supplied.
Australian Council for Educational Research (ACER) BQ Test Overview
The ACER BQ consists of twenty nine items which have a twenty minute time limit
to complete. Used in conjunction with ACER BL (verbal reasoning), the tests can
be used as a measure of the general ability factor (g). Kudar-Richardson reliability
has been reported as .89 for a sample of Australian tertiary students (ACER, 1982).
Zuckerman’s SSS-V Test Overview
Zuckerman’s online Sensation Seeking Scale Form V (SSS-V) is made up of forty
forced choice items related to thrill and adventure seeking (SS 1), experience
seeking (SS 2), disinhibition (SS 3) and boredom susceptibility (SS 4). An overall
sensations seeking score (SS-total) was obtained by the addition of the 4 subscales.
High sensation seeking scores have been found to correlate with engaging in risky
behaviours (see Chapter 2).
Procedure
Subjects were seated in cubicles where they had access to Zuckerman’s online
sensation seeking scale, the ACER BQ numerical reasoning test and investment and
allocation tasks. First the investment and allocation tasks were completed. The
allocation task was the same as that used in Studies 1 and 2, where participants
were asked to imagine themselves as having the opportunity to invest in each of
four scenarios (bank, pyramid scheme, stock market & bank) and allocating
proportions of one thousand dollars as they saw fit. The order of administration of
96
the two psychological tests was counter balanced. The ACER BQ numerical
reasoning tests began with 10-minute practice exercises to familiarise participants
with what was required of them. Once completed, and after any inquires were
answered, the twenty nine item test began. Exact instructions and scoring
procedures were read and followed as outlined in the test manual (ACER, 1982)
Zuckerman’s sensation seeking scale was administered via an online link.
Participants read instructions on how to proceed and a brief history of the test. The
forty forced-choice questions took no longer than ten minutes to complete.
Participants were assured confidentiality and informed they could withdraw from
the experiment at any time. Participants’ grade point averages (GPA) for university
exams and bursary marks (if applicable) were also collected as measures of
intellectual performance that could be analysed in respect to investment decisions.
Finally, participants were given feedback on their scores, thanked and paid for their
cooperation.
Results
General descriptive statistics
Descriptive statistics were calculated for the amounts of money allocated to each of
the four options (the bank, pyramid scheme, stock market & safe). Ranging from
greatest to least, the mean dollar amounts of money allocated to the options were
the bank (M = 435.34, SD = 301.02), the stock market (M = 332.76, SD = 259.48),
the pyramid scheme (M = 123.28, SD = 165.23) and the safe (M = 110.35, SD =
137.89). When a repeated measures ANOVA was performed on these amounts of
money, a significant difference was evident, F(3, 171) = 21.80, p < .001. Post hoc
analysis (Tukey Honestly Significant Difference Test) revealed that the mean dollar
97
amount of money invested in the bank (M = 435.34, SD = 301.02) was significantly
greater than the pyramid scheme (M = 123.28, SD = 165.23) and the safe (M =
110.35, SD = 137.89). The only other significant differences were that more money
was allocated to stock market (M = 332.76, SD = 259.48), than the pyramid scheme
(M = 123.28, SD = 165.23) and the safe (M = 110.35, SD = 137.89).
Simple descriptive statistics revealed that, of the 58 participants (investors), 30
(51.71%) of them chose to be pyramid investors while 28 (48.29%) were non-
pyramid investors who allocated no money at all to the pyramid scheme. Of those
who invested the whole $1000 in only one option, three participants allocated it all
to the bank, two to the stock market; no one chose the pyramid scheme or the safe.
These results were comparable to those obtained from Studies 1 and 2.
Testing for main effects
Given the possible presence of main effects for gender (Eckel & Grossman, 2002;
Larkin & Pines, 2003; Zaleskiewicz, 2001), these were first tested for to determine
the appropriate analyses for the current study. When comparing numerical
reasoning ability, males (M males = 13.38, SD = 4.71) were not significantly different
to females (M females = 11.48, SD = 3.86), t(56) = 1.68, ns. When exploring the four
subscales of Zuckerman’s Sensation Seeking Scale V (thrill & adventure seeking;
experience seeking; disinhibition; and boredom susceptibility), a 2 (gender) X 4
(subscales) ANOVA with repeated measures on the last factor revealed that males
reported higher propensities for sensation seeking (M males = 5.65, SD = 0.23) than
females (M females = 4.55, SD = 0.23), F(1, 56) = 9.36, p < .01. When analysed
further, independent measures t-tests revealed significant differences in that males
98
had higher scores than females for: thrill and adventure seeking (M males = 7.38, SD
= 1.59; M females = 5.86, SD = 1.57) ), t (56) = 3.20, p < .01; and disinhibition (M
males = 6.03, SD = 1.82; M females = 4.62, SD = 2.21 ), t (56) = 2.65, p < .01. When the
four subscales were combined, the mean total sensation seeking score (SS-total) for
males (M males = 22.62, SD = 5.10) was significantly greater than that for females (M
females = 18.207, SD = 4.58), t (56) = 3.09, p < .01.
Main results
Hypothesis 8 proposed that the participants’ propensity to engage in sensation
seeking activities would significantly relate to how they invested money. Given that
the male participants had reported a greater propensity for sensation seeking than
females, separate data analyse were conducted for each gender. Individual
correlation matrices were calculated for participants’ scores on Zuckerman’s SSS-V
(4 subsets & 1 total score) with the amounts of money invested in each option (the
bank, pyramid scheme, stock market & safe). When first looking at the results for
women (see Table 11), a number of significant relationships were found. Higher
propensities for thrill and adventure were seen to negatively relate to the amount of
money invested in the bank (r females= -.43, p < .05), but positively to the amount
invested in the stock market (r females = .61, p < .001). The females’ total sensation
seeking scores showed a similar relationship in that higher sensation seekers
allocated less money to the bank (r females = -.45, p < .05) and more money to the
stock market (r females = .49, p < .01). There were no statistically significant
correlations for the pyramid scheme or safe allocations.
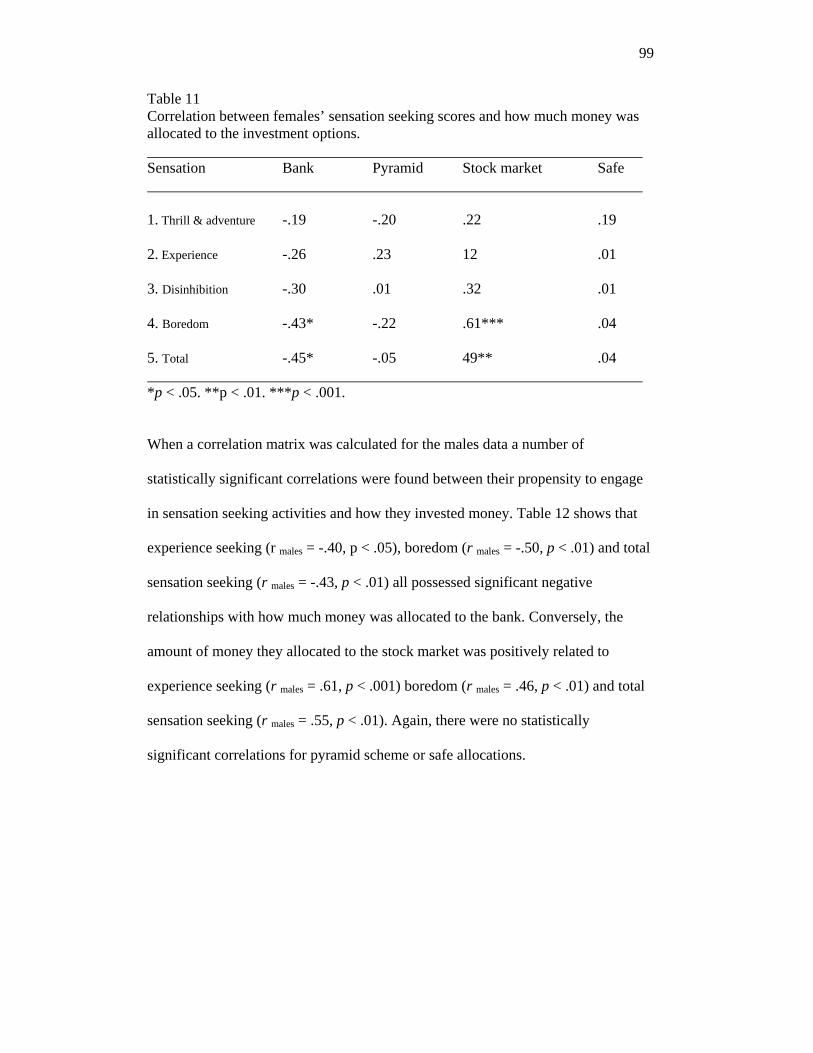
99
Table 11 Correlation between females’ sensation seeking scores and how much money was allocated to the investment options. Sensation Bank Pyramid Stock market Safe 1. Thrill & adventure -.19 -.20 .22 .19 2. Experience -.26 .23 12 .01 3. Disinhibition -.30 .01 .32 .01 4. Boredom -.43* -.22 .61*** .04 5. Total -.45* -.05 49** .04 *p < .05. **p < .01. ***p < .001.
When a correlation matrix was calculated for the males data a number of
statistically significant correlations were found between their propensity to engage
in sensation seeking activities and how they invested money. Table 12 shows that
experience seeking (r males = -.40, p < .05), boredom (r males = -.50, p < .01) and total
sensation seeking (r males = -.43, p < .01) all possessed significant negative
relationships with how much money was allocated to the bank. Conversely, the
amount of money they allocated to the stock market was positively related to
experience seeking (r males = .61, p < .001) boredom (r males = .46, p < .01) and total
sensation seeking (r males = .55, p < .01). Again, there were no statistically
significant correlations for pyramid scheme or safe allocations.
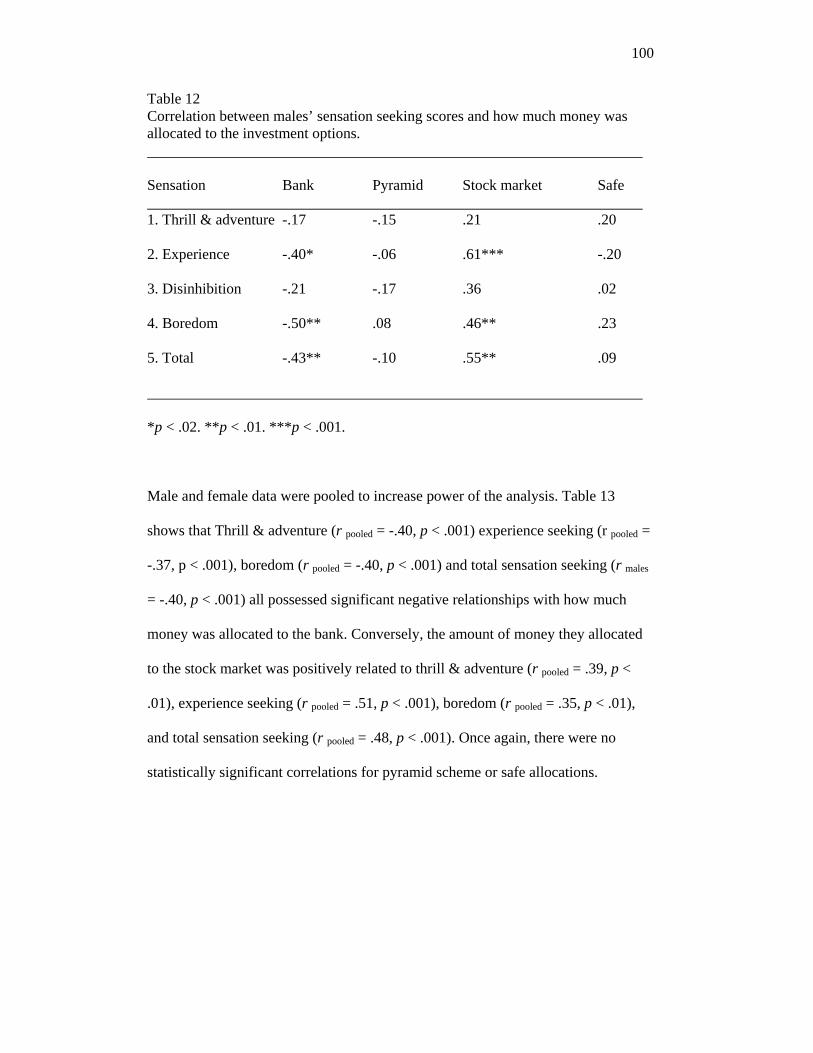
100
Table 12 Correlation between males’ sensation seeking scores and how much money was allocated to the investment options.
Sensation Bank Pyramid Stock market Safe 1. Thrill & adventure -.17 -.15 .21 .20
2. Experience -.40* -.06 .61*** -.20
3. Disinhibition -.21 -.17 .36 .02
4. Boredom -.50** .08 .46** .23
5. Total -.43** -.10 .55** .09
*p < .02. **p < .01. ***p < .001.
Male and female data were pooled to increase power of the analysis. Table 13
shows that Thrill & adventure (r pooled = -.40, p < .001) experience seeking (r pooled =
-.37, p < .001), boredom (r pooled = -.40, p < .001) and total sensation seeking (r males
= -.40, p < .001) all possessed significant negative relationships with how much
money was allocated to the bank. Conversely, the amount of money they allocated
to the stock market was positively related to thrill & adventure (r pooled = .39, p <
.01), experience seeking (r pooled = .51, p < .001), boredom (r pooled = .35, p < .01),
and total sensation seeking (r pooled = .48, p < .001). Once again, there were no
statistically significant correlations for pyramid scheme or safe allocations.
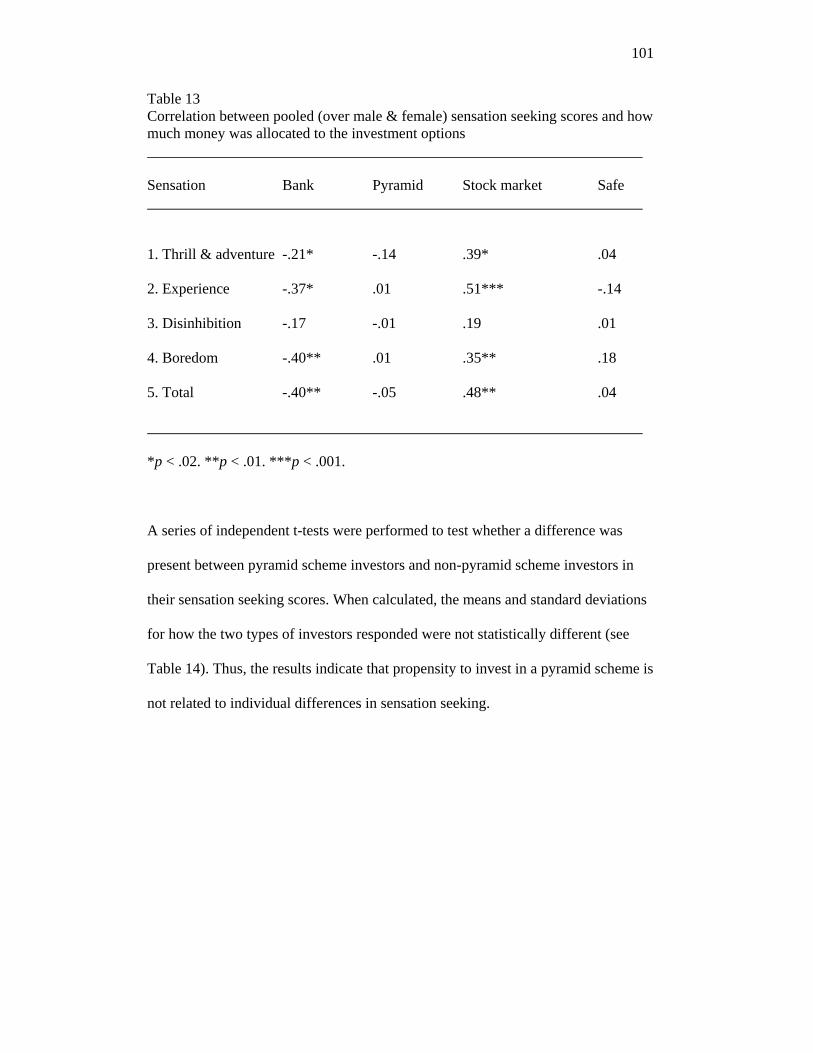
101
Table 13 Correlation between pooled (over male & female) sensation seeking scores and how much money was allocated to the investment options
Sensation Bank Pyramid Stock market Safe
1. Thrill & adventure -.21* -.14 .39* .04
2. Experience -.37* .01 .51*** -.14
3. Disinhibition -.17 -.01 .19 .01
4. Boredom -.40** .01 .35** .18
5. Total -.40** -.05 .48** .04
*p < .02. **p < .01. ***p < .001.
A series of independent t-tests were performed to test whether a difference was
present between pyramid scheme investors and non-pyramid scheme investors in
their sensation seeking scores. When calculated, the means and standard deviations
for how the two types of investors responded were not statistically different (see
Table 14). Thus, the results indicate that propensity to invest in a pyramid scheme is
not related to individual differences in sensation seeking.

102
Table 14 Average sensation seeking for type of investor Pyramid investor Non-pyramid investor Mean SD Mean SD t 1. Thrill & adventure 6.48 1.89 6.78 2.02 -0.57
2. Experience 5.90 1.40 5.78 1.63 0.31
3. Disinhibition 5.35 2.13 5.30 2.16 0.10
4. Boredom 3.06 1.82 2.66 1.59 0.89
5. Total 20.81 5.29 20.52 5.17 0.21
Hypothesis 11 stated that numerical reasoning would be a significant predictor of
people’s investment. When faced with the decision to invest money, it was
predicted that a significant relationship would exist between people’s numerical
reasoning ability and how much money they invested in each of the options. As can
be seen in Table 15, simple regression analyses showed that numerical reasoning
significantly predicted how much money participants invested in the bank (r = .43,
p < .001), the stock market (r = -.27, p < .05) and the safe (r = -.38, p < .001). It
appears people who had higher numerical reasoning abilities invested greater
amounts of money in the bank while lower numerical reasoning ability resulted in
investing in the stock market and safe, which lent support for the hypothesis.
Numerical reasoning did not significantly predict how much money was allocated
to the pyramid scheme.
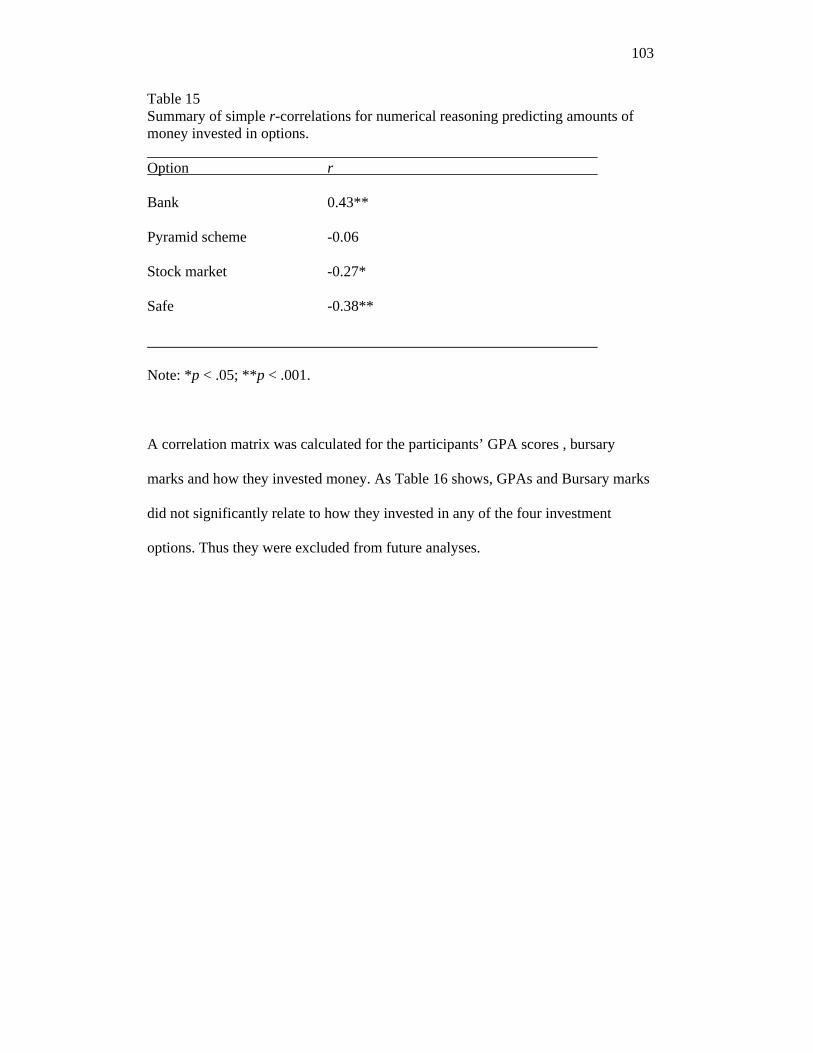
103
Table 15 Summary of simple r-correlations for numerical reasoning predicting amounts of money invested in options. Option r
Bank 0.43**
Pyramid scheme -0.06
Stock market -0.27*
Safe -0.38**
Note: *p < .05; **p < .001.
A correlation matrix was calculated for the participants’ GPA scores , bursary
marks and how they invested money. As Table 16 shows, GPAs and Bursary marks
did not significantly relate to how they invested in any of the four investment
options. Thus they were excluded from future analyses.

104
Table 16 Summary of simple linear regression for grade point averages and bursary scores predicting amounts of money invested in options.
Measure
Options GPA r Bursary r
Bank .15 .13
Pyramid Scheme -.13 -.09
Stock Market -.06 .07
Safe .01 -.17
Additional Analysis
Additional analysis by way of an independent measures t-test was performed to
compare the numerical reasoning ability of those participants who invested in the
pyramid scheme and those who did not invest. When tested, the numerical
reasoning ability of pyramid investors (M = 11.90, SD = 4.77) and non-pyramid
investors (M = 13.03, SD = 4.00) was not statistically different t(56) = .98, ns.
When compared to appropriate norms, students scores were within accepted levels.
Summary
Support was evident for the prediction that numerical reasoning ability, and
sensation seeking would predict how people would invest money into the bank,
stock market and safe. However, no significant relationship was seen between
investing money in the pyramid scheme and the propensity for sensation seeking.
Rather than predicting who would invest in a pyramid scheme, this was the only
105
option that did not correlate with numerical reasoning, although sensation seeking
did predict investment in the bank and stock market.
Similarly there was no relationship between pyramid scheme investment and
numerical reasoning or academic performance, although numerical reasoning ability
did predict investment in the other 3 options.
Study 6
Study 5 showed that investment in three of the options (bank, stock market & safe)
related to the individual’s numerical reasoning ability. In Study 6, the possible
influence of general intelligence on the different investment decisions was
investigated. Although numerical reasoning contributes to the wider construct of
general intelligence (Sternberg, 2000), it was possible that general intelligence
would also correlate with peoples investment decisions. In particular one might
anticipate that higher general intelligence might serve to protect one from the allure
of a pyramid scheme.
Raven, Court, and Raven (1988) developed the Raven’s Progressive Matrices to
differentiate between people according to a person’s level of intellect. The test can
be used to assess intellectual efficiency and indicate general intelligence (Sternberg,
2000). The test requires testees to find a missing element from a three by three
group of figures. These figures vary according to logical patterns and it is the task
of the testee to work out the pattern in order to find the missing element (Raven et
106
al., 1988; Sternberg, 2000). Raven’s Progressive Matrices are considered to be an
important and effective measure of intelligence (Sternberg, 2000).
Method
Participants
Thirty-seven males and 52 female Stage One psychology students were recruited
from the University of Canterbury to complete the study and each paid five dollars
for their participation.
Materials & procedure
Participants completed the investment tasks (as in Studies 1, 2 & 5) and then
completed the Raven’s Advanced Progressive Matrices (Sets I & II) that tests
Spearman’s g. The test proper contained 36 items, and 40 minutes were allowed for
participants to complete it. Precise instructions were followed as outlined in the test
manual (Raven, Court, Raven, 1988).
Results
General descriptive statistics
Descriptive statistics were calculated for the amounts of money invested in each
option (the bank, pyramid scheme, stock market & safe). Ranging from greatest to
least, the mean amounts of money allocated to the options were the bank (M =
471.35, SD = 277.25), the stock market (M = 262.92 SD = 237.74), the pyramid
scheme (M = 156.74, SD = 266.03) and the safe (M = 85.39, SD = 156.66). When a
repeated measures ANOVA was performed on these amounts of money, a significant
107
difference was evident, F(3, 264) = 37.77, p < 0.001. Post hoc analysis (Tukey
Honestly Significance Test) revealed that the mean amount of money invested in the
bank (M = 471.35, SD = 277.25) and the stock market (M = 262.92 SD = 237.74)
were significantly different to each other as well as to the amounts invested in the
pyramid scheme (M = 156.74, SD = 266.03) and safe (M = 85.39, SD = 156.66).
Simple descriptive statistics revealed that, of the 89 participants (investors), 41
(46.06%) them chose to be pyramid investors and 48 (53.94%) chose not to be
pyramid investors who allocated no money at all to the pyramid scheme. In regards
to investing all the $1000 in only one option, no one chose the safe, five participants
chose the bank, two the pyramid scheme and one the stock market.
An independent t-test was performed to test if there was a significant difference
between males and females in how they answered the Progressive Matrices. No
statistically significant difference was evident between the number of items that
were correctly answered by males (M = 26.38, SD = 4.55) and females (M = 25.46,
SD = 5.59), t(87) = -0.82, ns. Table 5 shows that when correlations were calculated
between the participants’ scores on the Raven’s Advanced Progressive Matrices and
the amounts of money they allocated to the different options no significant
relationships were evident. The absence of significance demonstrated that general
intelligence was not able to predict how people invest money, as was the case with
numerical reasoning ability (see Study 5).
I also examined the possibility of a difference in scores between pyramid investors
and non-pyramid investors. When tested by way of an independent t-test the mean

108
number of correctly answered items by pyramid investors (M = 25.44, SD = 6.30)
and non-pyramid investors (M = 26.32, SD = 3.42) was not statistically different,
t(87) = 0.80, ns.
Table 17 Summary of simple linear regression for general intelligence predicting amounts of money invested in options.
Variable r
Bank .11
Pyramid .12 .
Stock market .06 .
Safe .04
Summary
General intelligence did not relate to how people invested money. The general
intelligence of pyramid scheme investors was no different to other investors. The
absence of significance in the current study adds weight to the findings of Study 5
that showed that neither academic performance nor numerical reasoning
corresponded with how people allocated money to a pyramid scheme.
109
CHAPTER 7
Discussion
The concluding chapter will begin by summarising why this thesis was undertaken.
The six studies which were conducted as part of this thesis will be outlined and
findings that describe pyramid scheme investment covered. The first two studies
were intended to identify and measure pyramid scheme investors’ attitudes and
perceptions of a range of investments, including pyramid schemes. The next two
studies focused on the hypothetical behaviour of people after they had invested
money in a pyramid scheme and become a member of it. These two studies
successfully isolated the effects of target closeness and deception in predicting how
people might go about choosing others to invest in pyramid schemes. The effect of
target closeness (the personal closeness between the respondent and another
possible investor) was found to be very highly correlated with target choice. The
final two studies tested for these individual differences between pyramid scheme
investors and other investors in measures of intelligence and desire for sensation
seeking. Interestingly, pyramid scheme investment was not predicted by either
intelligence or sensation seeking, whereas the other investment choices were.
Investment in pyramid and other schemes and the perception of risk
The primary goal of the research conducted for this dissertation was to investigate
investment in pyramid schemes. Published statistics had previously shown that
pyramid schemes constituted a significant financial loss for New Zealand’s national
economy, as well as for that of several other countries. However, before I undertook
this thesis, no previously published psychological study seems to have been devoted

110
to investigating this form of investment behaviour. This absence determined the
nature of Study 1. Also, Study 1 was an important preliminary step to the success of
subsequent studies because it showed that many people, at least in a laboratory
setting, would be willing to invest in a pyramid scheme.
To better reflect a variety of investment options that someone in the real world
might have, it was considered important that in Studies 1, 2 and 5 participants be
given several investment possibilities that they could invest in. Hence participants
had a choice of investing in a bank, pyramid scheme, stock market and safe. Also,
as a large body of research has shown that framing scenarios in terms of gains or
losses affects people’s decisions (Ingersoll, 1987; Kahneman & Tversky, 1988;
Tversky & Kahneman, 1981), care was taken to eliminate framing effects in these
studies. Therefore, when scenarios were used in Studies 1, 2 and 5, they only
described how funds were generated, the time taken to generate them and the
returns offered on investments. Labels were avoided.
In Study 1, ninety-two participants were given a hypothetical allocation task where
they could invest in a bank, pyramid scheme, stock market and safe. Once this task
was completed, attitudes and perceptions towards their investment choices were
measured to find whether they varied with the hypothetical amounts of money
invested in each option. The attitudes and perceptions that were measured were the
perceived likelihood they would receive the financial returns on offer, willingness
to invest in the option, confidence in recommending the investment option to
someone else, confidence in investing different amounts of income in the option (a
day, week or year’s), and how deceptive or truthful they considered the option’s

111
claims of what the actual return would be. Confidence in investing was further
tested by measuring how confident participants were to invest different dollar
amounts of money ($1, $10, $50, $100, $500, $1,000, $5,000, $10,000, $50,000,
$100,000, $500,000 & $1,000,000).
Interestingly, Study 1 established these ratings to be more highly correlated with the
amount of money invested in the pyramid scheme than was the case for any of the
other investors. The more money people chose to invest in the pyramid scheme the
higher they perceived the likelihood they would receive the financial returns on
offer, the higher their willingness to invest in the option, the higher their confidence
in recommending the investment option to someone else and the more truthful they
thought the description of the description of the option was. Thus pyramid scheme
investors had more positive attitudes towards their investments than the other
investors. This possibly explains the longevity of such schemes. It is tentatively
suggested that these stronger relationships between attitudes and amount of money
invested are important in understanding why people are drawn into the scam.
Additional relationships were found between willingness to invest in the pyramid
scheme and perceptions of the other investment options. People who reported they
were willing to make bank investments had less confidence in recommending the
pyramid scheme to others as an investment option; those people who believed the
description of what the bank offered were less likely to expect the pyramid scheme
would meet its returns; people who perceived the bank as a favorable option rated
the description of the pyramid scheme as a less desirable option. The pyramid
scheme was similar to the stock market in the amounts of money invested and
112
investors did not differ in their attitudes towards the pyramid scheme and the stock
market.
The decision on how to invest one’s money is largely restricted to legal enterprises.
These can include banks, stock markets and the like. Other legal enterprises one can
opt for include lottery tickets and other forms of gambling. Occasionally, the
chance of investing in a seemingly legal and profitable money making scheme may
arise, and this scheme later turns out to be illegal. An enduring example of such an
illegal scheme scam is the pyramid scheme which attracts seemingly ordinary
people into almost certain financial loss.
Study 1 showed about half of the sample would invest in a pyramid scheme. Unlike
the non-pyramid scheme investors, pyramid scheme investors showed no
differentiation between it and the other options in overall confidence in investing
money. Non-pyramid scheme investors, however, identified the pyramid scheme as
somehow different and expressed less confidence in investing in it. In comparison,
pyramid scheme investors were about equally confident in all four investment
options. However, like the other investors the confidence of pyramid scheme
investors decreased as the amounts of money available for investment increased.
The relationship between these two variables was very strong. Increasing the
potential sums of money did not alter the likelihood of receiving returns so in a
purely rational model confidence should not have varied. For example, the returns
from investing $1000 dollars are no more or less likely than those from investing
$10, 000. Such changes in perception are challenging to economic models and
reaffirm that subjectivity is often a feature of people’s investment decisions

113
(Ingersoll, 1987; Zaleskiewicz, 2001). Perhaps this decline in confidence relates to
people’s loss aversion as explained by the prospect theory (Kahneman & Tversky,
1979). People are more averse to loss, be it real or imagined, and an aversion to
increased loss might have reduced their confidence.
One line of research into economic behaviour that has implications for pyramid
schemes is that into risk. As previously discussed in Chapter 2, there has been a
great deal of research concerning the importance of risk as a central component in
whether people choose one course of action or another. For the purposes of this
dissertation, research in risk was broadly divided into risk associated with economic
activities and risk associated with non-economic activities. Investment of money in
a pyramid scheme clearly belongs to the former category. Decisions to invest
money frequently depend on how risky the different investment options are
perceived (Finucane et al., 2000; Flynn et al., 1994; Slovic, 1987). Risky decisions
are made when the decision maker accepts a high probability that negative
outcomes are likely and still continues in his or her chosen course of action
(MacCrimmon et al., 1986; Sitkin & Pablo, 1992; Yates, 1992). Study 2 was
intended as a measure of how perceived risk is related to the amount of money
people might invest in a pyramid scheme.
Building on Study 1, Study 2 extended our understanding of the characteristics that
relate to investment in pyramid schemes. In Study 2, the money invested in a
pyramid scheme, or in a bank, stock market or safe, reduced when the perceptions
of the associated risk increased. Study 2 also revealed that participants perceived
the pyramid scheme to be significantly more risky to invest in than the bank or the

114
safe. Investment in the pyramid scheme was, however, perceived to be no more or
less risky than the stock market. Considering the differences in how money is
generated between the stock market and pyramid scheme, this similarity is
surprising, if not disturbing.
To some degree or another, economic risk is present for all investment options
(Tversky & Fox, 1995). The results of Study 2 demonstrated risk aversion was
clearly associated with how much money was invested in the pyramid scheme (or
indeed any other investment). Such an aversion is a fundamental characteristic of
economic models devised to explain peoples investment behaviors (Warneryd,
1996). However, as research in prospect theory has demonstrated (Kahneman &
Tversky, 1979; Tversky & Kahneman, 1992), economic models are unable to
explain how people make seemingly irrational decisions. The key new finding from
Study 2 is that people were not able to correctly identify the pyramid scheme as the
most risky option. Clearly, if they could, this knowledge would protect them from
investing in the scam. The data gathered in Study 2 suggests people were capable of
making rational decisions not to invest money in risky options, but were poor at
accurately assessing economic risk.
Even though pyramid schemes are all based on an impossible tenet, there seems to
be an underlying attraction to pyramid schemes for people. This tenet is that each
investor earns money by having additional investors give them money. The result of
such a system is that an exponential growth in the numbers of investors for an
infinite period of time is necessary for this scheme to meet all its financial promises.
It is therefore illogical to think a pyramid scheme can be a viable investment

115
structure, and thus the risk for an individual of investing in a pyramid scheme is
very high. One might expect a sample of tertiary students to be able to determine
the illogical nature of the pyramid scheme. Indeed, some might argue they should
have been better at this assessment because of their advanced education. However,
the student participants generally did not perceive the scheme to be different to the
stock market, even though the latter is not based on an impossible tenet and offers
real actual returns on investments with less associated risk (Earl & Kemp, 1999).
Deception and recruiting others
Deception occurs in a wide variety of situations and there has been a considerable
amount of research devoted to understanding it (DePaulo & Rosenthal, 1979;
Ekman & O'Sullivan, 1991; Fiedler & Walka, 1993; Kalbfleisch, 1994; Turner et
al., 1975; Vrij, 2000). Deception goes against generally accepted social norms of
behaviour (Sigmund, 1993). Also, it is possibly more prevalent in economic
transactions because of the anticipation of the monetary gains it might produce
(Lewicki, 1993; Lewicki & Litterer, 1985; O'Connor & Carnevale, 1997). What is
unarguable is that deception is a central and defining characteristic of pyramid
schemes (Caroll, 1998; Commerce Commission, 1997). However, as previously
stated by Steinel & De Dreu, (2004), few studies have addressed the conditions
“that foster or inhibit people’s tendency to be truthful and accurate or dishonest and
inaccurate”. (p. 419 ). Study 3 and Study 4 were designed to meet this challenge for
the special case of pyramid schemes. The results of these studies revealed that
people change their deceptive behaviour depending on the economic conditions in
the pyramid scheme. This section will endeavor to explain why people invest in a
pyramid scheme and how they behave after they have invested in it.

116
Theories that explain people’s deceptive behaviour share a common feature. This is
that people vary in the degree of deception they engage in, according to the
closeness of the recipient target. Hence, the acceptability of deception is a malleable
construct (Backbier et al., 1997), which depends on the relationship between agent
and target. Deception is perceived as less acceptable when perpetrated against those
people closer to oneself. It is more acceptable to deceive a complete stranger in
financial matters than your mother. Reasons for this variation include the increased
chance someone close to you may be able to detect your deception, not wanting to
cause negative outcomes for the people who you are closer to, and fear of being the
recipient of undesirable paybacks. These principles are encompassed by
evolutionary theory and explain how participants behaved in Studies 3 and 4. The
relevant principle is altruism. At its simplest, this principle states that people act
altruistically to those they are closer to and are themselves more likely to
reciprocate at some later time (Ridley, 1997; Sigmund, 1993). Often this
relationship effect is expressed in the answers to the question “if you were in a life
boat and only could save one person from your brother, father or cousin, who would
it be?” This theory correctly predicted how people behaved when in Studies 3 and 4
they imagined they had invested in a pyramid scheme.
In Studies 3 and 4 participants were given the option, for each target, to choose
whether to persuade them to invest in the scheme, to persuade them not to invest, or
to do nothing at all. The kind of explanation that participants gave each target
investor was the measure and was also presumed to determine the target’s
investment decision. This measure therefore revealed how investors behaved when
they were involved in a pyramid scheme. Condition 1 in both Studies 3 and 4

117
offered possible good fortune from investing in a pyramid scheme. In this condition
it was not explicitly stated that financial loss was likely. The principles of
evolutionary psychology predicted that people would more likely share the good
fortune of Condition 1 with those closest to themselves. In this initial stage, there is
no need to deceive targeted investors because participants were not intentionally
misinforming them about the pyramid scheme. It could even be argued that sharing
the possibility of good fortune with those closest to you is admirable. However,
sharing such good fortune with those not considered close must be weighed up
against the financial benefits you would receive (money from their investment). It
seems that people were less willing to benefit those targets less close to themselves,
even if it resulted in their own economic benefit. The initial stage of a pyramid
scheme thus seems to place those closest to the investor at the greatest risk of
recruitment.
However, in Condition 2 of Studies 3 and 4, participants were presented with a
different economic environment. In Condition 2 the potential for financial loss was
explicit. Participants were informed they were having difficulty in recruiting new
investors and that these investors would find it almost impossible to recruit other
investors. Again, participants could decide on what explanation to give targeted
investors. They could also persuade targets not to invest and risk losing their
investment, to persuade others to invest and make money for themselves, or do
nothing at all that would affect the target investor’s behavior. The results revealed
that people were both willing and able to alter their deceptive behaviour towards
targets depending on the pyramid scheme conditions. When Condition 2 clearly
stated that target investors had little chance of receiving money, participants were

118
more inclined to offer explanations that would result in investing to the people they
were less close to.
Across most cultures, cheating is disliked and largely considered an unfavourable
behaviour (Sigmund, 1993). The degree to which this form of deception is
considered serious varies with several factors. As shown above, people judge the
act of cheating others out of their money as worse if the intent to cheat is present
(DePaulo & Kashy, 1998; DePaulo & Rosenthal, 1979), if people cheat others who
are close to themselves (DePaulo & Kashy, 1998) and if the cheating is done for
one’s own benefit (Backbier et al., 1997). In Condition 2 (loss) of Studies 3 & 4,
people were more willing to accept a possible financial loss than cheat someone
close to themselves. However, even though cheating for one’s own benefit is
undesirable, it did not, in the loss condition, prevent participants cheating those who
were presumably less close to themselves. In this instance, the financial benefits
from cheating were more important than how such cheating might be judged by
others or oneself.
Because approximately half the subjects invested in the pyramid scheme, it seems
that they were ineffective in identifying the erroneous nature of pyramid schemes.
This proportion is initially surprising, but might have been predicted from previous
research. In fact, when determining the veracity of others, most people perform
below or close to levels of chance (DePaulo & Rosenthal, 1979). Studies 1 and 2
thus extended the research into deception detection by testing people’s abilities to
determine the veracity of written descriptions of investment options. Non-pyramid
investors, but not pyramid scheme investors, were able to identify the pyramid

119
scheme as being more deceptive in its claims of potential financial returns. Given
previous research (Porter et al., 2000) has shown that training may improve one’s
ability to detect deception, training people in identifying pyramid schemes might
reduce the chances of them becoming investors.
Prospect theory and the sunk cost effect help explain why people continue to be
members of a pyramid scheme even when it is clear they are likely to lose their
money. Central to these theories is that people perceive loss as greater than they
would a gain of equal size (Arkes & Blumer, 1985; Earl & Kemp, 1999; Garland,
1990; Karlsson et al., 2002; MacFadyen & MacFadyen, 1986; Staw & Ross, 1989;
Tversky & Kahneman, 1992). According to economic models, such distinctions
would not be made by a rational interpretation of value and utility (Arkes & Ayton,
1999; Warneryd, 1996). It is argued that the sunk cost effect, as explained by the
prospect theory, contributes to our understanding of the behaviour of people in
Studies 3 and 4. After participants had invested in the pyramid scheme, Condition 2
presented them with the possibility of losing their investment. Withdrawing from
the pyramid scheme would mean a halt on recruiting new investors and accepting
their investment as a loss. However, the sunk cost effect predicts that investors
would make a continued effort to recover their losses (Arkes & Blumer, 1985;
Garland, 1990; Karlsson et al., 2002; Staw & Ross, 1989). This prediction was
heavily supported as the participants in both Study 3 and 4 chose to continue
recruiting new investors. It is entirely possible that the loss was perceived as an
expense towards achieving the end goal (Brockner, 1992; Garland et al., 1990;
Karlsson et al., 2005); thus making continued recruitment more acceptable. Thus

120
the sunk cost effect contributes to our understanding of peoples’ continued
involvement in pyramid schemes after they have experienced monetary loss.
Individual differences in propensity to invest in pyramid schemes
The remaining Studies, 5 and 6, explored individual differences between pyramid
scheme investors and non-pyramid scheme investors. Intelligence and sensation
seeking were measured and explored as predictors of investment. The earlier studies
provided much of the impetus for these investigations. In Study 1, 49.73% of
participants (n = 92) invested in the pyramid scheme, in Study 2 (n = 44) it was
51.51%. The proportions were similar in the later studies: Study 5 (n = 58) 51.71%,
and finally in Study 6 (n = 89) 46.06%. Nearly half of all the participants were
prepared to invest money in a pyramid scheme. This was a surprisingly large
proportion. One might expect that, given the sample was taken from a tertiary
institution, where reasonable intelligence is assumed, intelligence might have
somehow enabled the respondents to determine the flawed nature of the pyramid
scheme. However, the actual findings were that a significant proportion of these
educated tertiary students considered the investment option viable enough to invest
money in it.
When general intelligence and numerical reasoning ability were measured they
were not correlated to pyramid scheme investment. This lack of effect of
intelligence in deciding to invest in a pyramid scheme is worthy of note. One might
expect that intelligence would relate to making rational decisions. In fact rational
thought is an important component of how Weschler defined intelligence: “the
aggregate or global capacity of the individual to act purposefully, to think
121
rationally, and to deal effectively with this environment.” (Weschler 1958, cited in
Sternberg et al., 2001, p. 399). General intelligence tests, like numerical reasoning
tests, typically have a component or sub-test that comprises items that draw on
people’s numerical reasoning ability (Sternberg et al., 2001). These items frequently
require the participant to calculate patterns in a series of numbers and mathematical
problems. Higher scores on these tasks contribute to higher intelligence scores.
Those people who are more proficient at these tasks are presumed to have the
capacity for more rational thought. Given this, it seems clear that intellect has little
to do with the decision to invest in a pyramid scheme.
Before writing this thesis there had been few published studies into intelligence as a
predictor of investment choices and none for pyramid scheme investment. Scores
on numerical reasoning ability were found to correlate with amounts of money
invested in the bank, the stock market and safe, however it did not relate to pyramid
schemes in any identifiable way. This shows that some other factor besides
intelligence is preventing nearly half of the participants from investing in the
pyramid scheme. However intelligence does help people chooses the bank over the
stock market or safe. This finding is important for two reasons. First as a
methodological check, it shows that the studies were powerful enough to pick up
moderately sized interesting effects. Second it shows that some of the expected
relationships with intelligence do emerge.
People’s propensity for sensation seeking was expected to predict how much or
whether they would invest in pyramid schemes. This propensity is typically gauged
by measuring a person’s desire for sensation seeking (Hammelstein, 2004;

122
Zuckerman, 1994). The measure used, Zuckerman’s SSS-V, has been shown to be
accurate at measuring sensation seeking and therefore had the potential to isolate
any risk seeking propensity that could characterise pyramid scheme investors.
Zuckerman’s SSS-V measure was made up of four subscales (Thrill and Adventure
Seeking, Experience Seeking, Disinhibition, & Boredom Susceptibility), that, when
summed, produced a score that reflected a general risk seeking propensity
(Zuckerman, 1994). Higher scores on the Disinhibition subscale have been linked to
greater propensities to gamble. Furthermore, Hunter and Kemp (2004) found that
this sub-scale as well as those for Experience Seeking and Boredom Susceptibility
correlated with people’s decisions to invest in a risky type of share (dotcoms).
Also, given Study 2 had found that the pyramid scheme and stock market were
considered similarly risky, and the bank and safe less risky again, there was a
reasonable expectation that a propensity for risk seeking would predict pyramid
scheme investment. Oddly, investment in the pyramid scheme was the only
investment option that a propensity for sensation seeking did not predict. Thus
people do not invest in pyramid schemes because they desire risk or sensation
seeking. Pyramid schemes are therefore appealing to people who range from risk
seekers to risk avoiders.
Other studies (Olsen & Cox, 2001 Barsky, Juster, Kimball, & Shapiro, 1997;
Powell & Ansic, 1997) have reported differences between men and women’s
investment decisions. However, in Studies 1-6, no significant gender differences
existed between the amounts of money invested in the pyramid scheme, in their
recruiting behaviour or in how the pyramid scheme was perceived. Given this
123
absence of gender differences, pyramid schemes are no more or less an attractive
investment option to men and women. In fact the two genders were equally
vulnerable to the call of the pyramid scheme. As Flyn (1994) stated, it appears that
gender alone is insufficient in explaining people’s investment decisions.
Thus a propensity to invest in a pyramid scheme is not predicted very well by
people’s intelligence, gender, numerical reasoning ability or tendency to seek
sensation. There is, in fact, something rather odd about it that calls for future
research. In the meantime, however, the apparent vulnerability of some or many to
the appeal of such schemes indicates it is probably worthwhile for society to keep
them illegal.
Limitations of the Research and Possibilities for Future Research
The obvious limitation to the thesis was that an actual pyramid scheme was not
instigated. Arguably it could have been run under laboratory conditions and would
have added to the ecological validity of the research conducted as part of this thesis.
However, while this idea was considered, it was quickly rejected on legal and
ethical restrictions. Performing such a study would have challenged the laws in
New Zealand where pyramid selling schemes are prohibited under the Fair Trading
Act. The law recognises the vulnerability of people to pyramid schemes - amply
demonstrated in the proceeding studies and makes it a criminal offence to run one.
An ethical dilemma would also have arisen if a pyramid scheme had been run.
Deliberately misleading people to invest money for the good of research would be
difficult to justify to oneself and to the board of ethics at the University of
Canterbury.

124
In looking at directions for future research a number of possibilities arise. The most
obvious would be to identify pyramid scheme investors and then at a later time find
if they were any more or less likely to invest in another after having already
experienced a pyramid scheme. Also, developing a computer simulation of a
pyramid scheme may enable this type of scheme to be further explored. The added
benefit of such a method is that people’s investment behaviours could be more
easily tracked over a longer periods of time and outside the confines of a laboratory
setting using the internet. For instance, having such a mobile system would enable
other populations to be tested for their vulnerability to pyramid schemes.
Before beginning the research reported here, I carried out a search of the literature
to determine whether any studies existed on pyramid schemes. No such
psychological studies were found and it has, therefore, been interesting to examine
this previously unexplained type of economic behaviour. The present work
contributed our understanding of what type of individuals and conditions give rise
to pyramid scheme investment. This line of research is of particular importance for
many reasons. Arguably the most important are that pyramid schemes cause
financial loss for most of its investors and there is no sign of their appeal abating.
At present, there is no foolproof way to tell whether a person will invest in a
pyramid scheme, or not. Instead we must rely on the legal system to protect people
from pyramid schemes and penalise those people who run them.
125
REFERENCES
ACER. (1982). ACER Advanced tests AL- BQ and BL-BQ. Victoria: The
Australian Council for Educational Research.
Antonides, G., Raaij, W. F. v., & Maital, S. (1997). Advances in economic
psychology. Chichester ; New York: John Wiley.
Arkes, H. R., & Ayton, P. (1999). The sunk cost and Concorde effects: Are humans
less rational than lower animals? Psychological Bulletin, 125(5), 591-600.
Arkes, H. R., & Blumer, C. (1985). The psychology of sunk cost. Organizational
Behavior & Human Decision Processes, 35(1), 124-140.
Arnett, J. (1994). Sensation seeking: A new conceptualization and a new scale.
Personality & Individual Differences, 16(2), 289-296.
Aron, A., & Aron, E. (1994). Statistics for psychology. Englewood Cliffs., N.J.:
Prentice Hall.
Au, K., Chan, F., Wang, D., & Vertinsky, I. (2003). Mood in foreign exchange
trading: Cognitive processes and performance. Organizational Behavior &
Human Decision Processes, 91(2), 322-338.
Backbier, E., Hoogstraten, J., & Meerum Terwogt-Kouwenhoven, K. (1997).
Situational determinants of the acceptability of telling lies. Journal of
Applied Social Psychology, 27(12), 1048-1062.
Ball, I. L., Farnill, D., & Wangeman, J. F. (1984). Sex and age differences in
sensation seeking: Some national comparisons. British Journal of
Psychology, 75(2), 257-265.
Barsky, R. B., Juster, T., Kimball, M. S., & Shapiro, M. D. (1997). Preference
parameters and behavioral heterogeneity: an experimental approach in the

126
health and retirement study. Quarterly Journal of Economics, 112(2), 537-
580.
Bente, G., Donaghy, W. C., & Suwelack, D. (1998). Sex differences in body
movement and visual attention: An integrated analysis of movement and
gaze in mixed-sex dyads. Journal of Nonverbal Behavior, 22(1), 31-58.
Blaylock, B. T. (1998). Pyramid Schemes, Ponzi Schemes, and Related Frauds.
Retrieved from the World Wide Web on 16/04/99.
http://www.impulse.net/~thebob/pyramid.html.
Brehm, S. S., Kassin, S., & Fein, S. (2005). Social Psychology (6 ed.). Boston:
Houghton Miffin.
Brockner, J. (1990). Scope of justice in the workplace: How survivors react to co-
worker layoffs. Journal of Social Issues, 46(1), 95-106.
Brockner, J. (1992). The escalation of commitment to a failing course of action:
Toward theoretical progress. Academy of Management Review, 17(1), 39-
61.
Burgoon, J. K., Buller, D. B., Grandpre, J. R., & Kalbfleisch, P. (1998). Sex
differences in presenting and detecting deceptive messages. In. Mahwah,
NJ, US: Lawrence Erlbaum Associates, Publishers.
Butkovic, A., & Bratko, D. (2003). Generation and sex differences in sensation
seeking: Results of the family study. Perceptual & Motor Skills, 97(3, Pt 1),
965-970.
Callahan, J. C. (1988). Ethical issues in professional life. New York: Oxford
University Press.
Caroll, R. T. (1998). Becoming a Critical Thinker. Retrieved from the World Wide
Web on 21/04/99. http://dcn.davis.ca.us/~btcarrol/skeptic/pyramid.html.
127
Cascio, W. F. (1991). Applied psychology in personnel management (4th . ed.).
Englewood Cliffs., N.J.: Prentice Hall.
Chiu, J.-W. (1997). Predictors of gambling behavior among college students.
Unpublished Dissertation Abstracts International Section A: Humanities &
Social Sciences. Vol 58(3-A), Sep 1997, pp. 0750 Social Sciences.
Coleman, M., & Ganong, L. H. (1998). Attitudes toward inheritance following
divorce and remarriage. Journal of Family & Economic Issues, 19(4), 289-
314.
Commerce Commission, N. Z. (1997). Pyramid Selling. Fair Trading Act.
Wellington: Commerce Commission.
Commerce Commission, N. Z. (1999). Pyramid Schemes. Retrieved from the World
Wide Web.www.consumer-minisry.govt.nz.
Cowell, F. A. Tax evasion and inequity. (1992) Journal of Economic Psychology.
Special Issue: Economic psychological perspectives on taxation, 4, 521-543.
Culliford, L. (2002). "Can deception be therapeutic?": Comment. Psychiatric
Bulletin, 26(7), 276.
Dahlbäck, O. (1991). Saving and risk taking. Journal of Economic Psychology,
12(3), 479-500.
DePaulo, B. M. (1992). Nonverbal behavior and self-presentation. Psychological
Bulletin, 111(2), 203-243.
DePaulo, B. M., Charlton, K., Cooper, H., Lindsay, J. J., & Muhlenbruck, L.
(1997). The accuracy-confidence correlation in the detection of deception.
Personality & Social Psychology Review, 1(4), 346-357.
DePaulo, B. M., & Kashy, D. A. (1998). Everyday lies in close and casual
relationships. Journal of Personality & Social Psychology, 74(1), 63-79.

128
DePaulo, B. M., Kashy, D. A., Kirkendol, S. E., Wyer, M. M., & Epstein, J. A.
(1996). Lying in everyday life. Journal of Personality & Social Psychology,
70(5), 979-995.
DePaulo, B. M., Lindsay, J. J., Malone, B. E., Muhlenbruck, L., Charlton, K., &
Cooper, H. (2003). Cues to deception. Psychological Bulletin, 129(1), 74-
118.
DePaulo, B. M., & Rosenthal, R. (1979). Telling lies. Journal of Personality and
Social Psychology, 37(10), 1713-1722.
DePaulo, P. J. (1988). Research on deception in marketing communications: Its
relevance to the study of nonverbal behavior. Journal of Nonverbal
Behavior. Special Deception, 12(4, Pt 2), 253-273.
Earl, P. E., & Kemp, S. (1999). The Elgar companion to consumer research and
economic psychology. Northampton, Mass.: Edward Elgar Pub.
Eckel, C. C., & Grossman, P. J. (2002). Sex differences and statistical stereotyping
in attitudes toward financial risk. Evolution & Human Behavior, 23(4), 281-
295.
Ekman, P., & O'Sullivan, M. (1991). Who can catch a liar? American Psychologist,
46(9), 913-920.
Elffers, H. H., D. J. (1997). Influencing the prospects of tax evasion. Journal of
Economic Psychology(18), 289-304.
Entombed Albania's Pyramids. (1997). Entombed in Albania's Pyramids. The
Economist, 342(8001), 49.
Feldman, R. S. (Ed.). (1992). Applications of Nonverbal Behavioural Theories and
Research. Hillsdale, NJ.: Lawrence Erlbaum Associates.
129
Fiedler, K., & Walka, I. (1993). Training lie detectors to use nonverbal cues instead
of global heuristics. Human Communication Research, 20(2), 199-223.
Finucane, M. L., Slovic, P., Mertz, C. K., Flynn, J., & Satterfield, T. A. (2000).
Gender, race, and perceived risk: The 'white male' effect. Health, Risk &
Society, 2(2), 159-172.
Flynn, J., Slovic, P., & Mertz, C. K. (1994). Gender, race, and perception of
environmental health risks. Risk Analysis, 14(6), 1101-1108.
Franques, P., Auriacombe, M., Piquemal, E., Verger, M., Brisseau-Gimenez, S.,
Grabot, D., et al. (2003). Sensation seeking as a common factor in opioid
dependent subjects and high risk sport practicing subjects. A cross sectional
study. Drug & Alcohol Dependence, 69(2), 121-126.
Gardner, H. (1983). Frames of mind : the theory of multiple intelligences. New
York: Basic Books.
Garland, H. (1990). Throwing good money after bad: The effect of sunk costs on
the decision to esculate commitment to an ongoing project. Journal of
Applied Psychology, 75(6), 728-731.
Garland, H., Sandefur, C. A., & Rogers, A. C. (1990). De-escalation of commitment
in oil exploration: When sunk costs and negative feedback coincide. Journal
of Applied Psychology, 75(6), 721-727.
Goldstein, M. A. (1997). Privatization Success and Failure: Finance Theory and
Regulation in the Transitional Economies of Albania and the Czech
Republic. Managerial and Decision Economics, 18(7/8), 529-544.
Gonzalez, R., Vassileva, J., Bechara, A., Grbesic, S., Sworowski, L., Novak, R. M.,
et al. (2005). The influence of executive functions, sensation seeking, and
HIV serostatus on the risky sexual practices of substance-dependent
130
individuals. Journal of the International Neuropsychological Society, 11(2),
121-131.
Gordon, A. K., & Miller, A. G. (2000). Perspective differences in the construal of
lies: Is deception in the eye of the beholder? Personality and Social
Psychology Bulletin, 26(1), 46-55.
Grable, J., Lytton, R., & O'Neill, B. (2004). Projection bias and financial risk
tolerance. Journal of Behavioral Finance, 5(3), 142-147.
Gralton, E., & Sandford, J. J. (2002). Can deception be therapeutic? Psychiatric
Bulletin, 26(3), 114.
Granhag, P. A., & Stroemwall, L. A. (2000). Effects of preconceptions on deception
detection and new answers to why lie-catchers often fail. Psychology, Crime
& Law, 6(3), 197-218.
Gray, P. (2002). Psychology (4th ed.). New York: Worth Publishers.
Gustafson, P. E. (1998). Gender differences in risk perception: Theoretical and
methodological perspectives. Risk Analysis, 18(6), 805-811.
Hagarth, R. M., & Reder, M. W. (Eds.). (1987). Rational Choice: The contrast
Between Economics and Psychology. Chicago: The University of Chicago
Press.
Hamilton, W. D. (1972). Altruism and related phenomena, mainly in social insects.
Annual Review of Ecology and Systematics, 3, 193-232.
Hammelstein, P. (2004). Faites vos jeux! Another look at sensation seeking and
pathological gambling. Personality & Individual Differences, 37(5), 917-
931.
Harrå, N. (2000). Risk evaluation, driving, and adolescents: A typology.
Developmental Review, 20(2), 206-226.
131
Hastie, R., & Dawes, R. M. (2001). Rational Choice in an Uncertain World.
London: Sage Publications.
Hasseldine, D. J., Bebbington, K. J. (1991). Blending economic deterrence and
fiscal psychology models in the design of responses to tax evasion: The
New Zealand experience. Journal of Economic Psychology, 12, 299-324.
Heath, C. (1995). Escalation and de-escalation of commitment in response to sunk
costs: The role of budgeting in mental accounting. Organizational Behavior
& Human Decision Processes, 62(1), 38-54.
Hisham, A., & Sugar, D. (2001). SuperLab Experimental Laboratory Software
User's Guide. www.cedus.com.
Horvath, F., Jayne, B., & Buckley, J. (1994). Differentiation of truthful and
deceptive criminal suspects in behavior analysis interviews. Journal of
Forensic Sciences, 39(3), 793-807.
Hunter, K., & Kemp, S. (2004). The personality of e-commerce investors. Journal
of Economic Psychology, 25(4), 529-537.
Hyman, R. (1989). The psychology of deception. Annual Review of Psychology. Vol
40.
Ingersoll, J. E. (1987). Theory of financial decision making. Totowa, N.J.: Rowman
& Littlefield.
Johnson, B. B. (2002). Gender and Race in Beliefs about Outdoor Air Pollution.
Risk Analysis, 22(4), 725-738.
Johnson, J., & Powell, P. (1994). Decision making, risk and gender: Are managers
different? British Journal of
Management, 5, 123-138.
132
Jones, T. M. (1991). Ethical decision making by individuals in organizations: An
issue-contingent model. Academy of Management Review, 16(2), 366-395.
Judge, D. S., & Hrdy, S. B. (1992). Allocation of accumulated resources among
close kin: Inheritance in Sacramento, California, 1890-1984. Ethology &
Sociobiology, 13(5-6), 495-522.
Kahneman, D., & Tversky, A. (1979). Prospect theory: An analysis of decision
under risk. Econometrica, 47(2), 263-291.
Kahneman, D., & Tversky, A. (1988). Prospect theory: An analysis of decision
under risk. In. New York, NY, US: Cambridge University Press.
Kalbfleisch, P. J. (1994). The language of detecting deceit. USA: Sage Publications.
Karlsson, N., Ásgeir, J., Grankvist, G., & Gärling, T. (2002). Impact of decision
goal on escalation. Acta Psychologica, 111(3), 309-322.
Karlsson, N., Gärling, T., & Bonini, N. (2005). Escalation of Commitment with
Transparent Future Outcomes. Experimental Psychology, 52(1), 67-73.
Kemp, S., & Hunt, F. (2001). Exploring the psychology of inheritances. Zeitschrift
für Sozialpsychologie, 32(3), 171-179.
Kirchler, E. (2001). Conflict and decision making in close relationships : love,
money, and daily routines. Philadelphia, Pa.: Psychology Press.
Kline, P. (1993). The handbook of psychological testing. London ; New York:
Routledge.
Knight, A., & Warland, R. (2004). The relationship between sociodemographics
and concern about food safety issues. Journal of Consumer Affairs, 38(1),
107-120.
Krimsky, S., & Golding, D. (1992). Social theories of risk. Westport, Conn.:
Praeger.

133
Langenderfer, J., & Shimp, T. A. (2001). Consumer vulnerability to scams,
swindles, and fraud: A new theory of visceral influences on persuasion.
Psychology & Marketing, 18(7), 763-783.
Larkin, J. E., & Pines, H. A. (2003). Gender and Risk in Public Performance. Sex
Roles, 49(5-6), 197-210.
Lejoyeux, M., Feuché, N., Loi, S., Solomon, J., & Adès, J. (1998). Impulse-control
disorders in alcoholics are related to sensation seeking and not to
impulsivity. Psychiatry Research, 81(2), 149-155.
Levin, I. P., Snyder, M. A., & Chapman, D. P. (1988). The interaction of
experiential and situational factors and gender in a simulated risky decision-
making task. Journal of Psychology: Interdisciplinary & Applied, 122(2),
173-181.
Lewicki, R. J. (1993). Negotiation : readings, exercises, and cases (2nd . ed.).
Homewood, IL: Irwin.
Lewicki, R. J., & Litterer, J. A. (1985). Negotiation. Homewood, Ill.: R.D. Irwin.
MacCrimmon, K. R., Wehrung, D. A., & Stanbury, W. T. (1986). Taking risks : the
management of uncertainty. London: Collier Macmillan Publishers.
MacFadyen, A. J., & MacFadyen, H. W. (1986). Economic psychology :
intersections in theory and application. Amsterdam ; New York
New York, N.Y., U.S.A.: North-Holland ;
Sole distributors for the U.S.A. and Canada Elsevier Science Pub. Co.
McInish, T. H., & Srivastava, R. K. (1984). The nature of individual investors'
heterogeneous expectations. Journal of Economic Psychology, 5(3), 251-
263.

134
Miller, G. R., & Stiff, J. B. (1992). Applied issues in studying deceptive
communication. In Feldman, Robert Stephen (Ed). (1992). Applications of
nonverbal behavioral theories and research. (pp. 217 237).
Nelson, T. E., Oxley, Z. M., & Clawson, R. A. (1997). Toward a psychology of
framing effects. Political Behavior, 19(3), 221-246.
O'Connor, K. M., & Carnevale, P. J. (1997). A nasty but effective negotiation
strategy: Misrepresentation of a common-value issue. Personality & Social
Psychology Bulletin, 23(5), 504-515.
Olsen, R. A., & Cox, C. M. (2001). The influence of gender on the perception and
response to investment risk: The case of professional investors. Journal of
Psychology & Financial Markets, 2(1), 29-36.
Opotow, S. (1990). Deterring moral exclusion. Journal of Social Issues, 46(1), 173-
182.
Otani, H., Leonard, S. D., Ashford, V. L., Bushroe, M., & al., e. (1992). Age
differences in perception of risk. Perceptual & Motor Skills, 74(2), 587-594.
Palmer, C. G. S. (2003). Risk perception: Another look at the 'white male' effect.
Health, Risk & Society, 5(1), 71-83.
Parks, J. M., & Conlon, E. J. (1990). Justification and the processing of
information. Journal of Applied Social Psychology, 20(9, Pt 2), 703-723.
Parks, M. R., & Floyd, K. (1996). Meanings for closeness and intimacy in
friendship. Journal of Social & Personal Relationships, 13(1), 85-107.
Pojman, L. P. (1989). Ethical theory : classical and contemporary readings.
Belmont, Calif.: Wadsworth Pub. Co.

135
Porter, S., Woodworth, M., & Birt, A. R. (2000). Truth, Lies, and Videotape: An
investigation of the ability of federal parole officers to detect deception. Law
& Human Behavior, 24(6), 643-658.
Powell, M., & Ansic, D. (1997). Gender differences in risk behaviour in financial
decision-making: An experimental analysis. Journal of Economic
Psychology, 18(6), 605-628.
Raven, J. C., Court, J. H., & Raven, J. (1988). Manual for Raven's Progressive
Matrices and Vocabulary Scales. London: H. K. Lewis & Co. Ltd.
Ridley, M. (1997). The origins of virtue : human instincts and the evolution of
cooperation (1st American ed.). New York: Viking.
Roberti, J. W. (2004). A review of behavioral and biological correlates of sensation
seeking. Journal of Research in Personality, 38(3), 256-279.
Roosevelt, F. D. (1932).Radio address.
Ross, J., & Staw, B. M. (1993). Organizational escalation and exit: Lessons from
the Shoreham Nuclear Power Plant. Academy of Management Journal,
36(4), 701-732.
Roszkowski, M. J., & Snelbecker, G. E. (1990). Effects of "framing" on measures
of risk tolerance: Financial planners are not immune. Journal of Behavioral
Economics, 19(3), 237-246.
Roth, M. (2003). Validation of the Arnett Inventory of Sensation Seeking (AISS):
efficiency to predict the willingness towards occupational change, and
affection by social desirability. Personality & Individual Differences, 35(6),
1307-1314.
136
Satinder, K. P., & Black, A. (1984). Cannabis use and sensation-seeking
orientation. Journal of Psychology: Interdisciplinary & Applied, 116(1),
101-105.
Schwartz, S. (1999). Amway: The Untold Story. In Retrieved from the World Wide
Web on 21/04/99. http://www.teleport.com/~schwartz.html.
Siegrist, M., Cvetkovich, G., & Roth, C. (2000). Salient Value Similarity, Social
Trust, and Risk/Benefit Perception. Risk Analysis, 20(3), 353-362.
Sigmund, K. (1993). Games of life : explorations in ecology, evolution, and
behaviour. Oxford [England] ; New York: Oxford University Press.
Simonson, I., & Staw, B. M. (1992). Deescalation strategies: A comparison of
techniques for reducing commitment to losing courses of action. Journal of
Applied Psychology, 77(4), 419-426.
Singer, M. S., & Singer, A. E. (1997). Observer judgements about moral agents'
ethical decisions: The role of scope of justice and moral intensity. Journal of
Business Ethics, 16(5), 437-484.
Sitkin, S. B., & Pablo, A. L. (1992). Reconceptualizing the Determinants of Risk
Behavior. Academy of Management. The Academy of Management Review.,
17(1), 9-38.
Slanger, E., & Rudestam, K. E. (1997). Motivation and disinhibition in high risk
sports: Sensation seeking and self-efficacy. Journal of Research in
Personality, 31(3), 355-374.
Slovic, P. (1987). Perception of risk. Science, 236, 280-285.
Slovic, P. (2000). The perception of risk. London, England: Earthscan Publications
Ltd.
137
Smith, K. W., Kinsey, K. A. (1987). Understanding taxpaying behavior: A conceptual framework with implications for research. Law & amp; Society Review, 21(4), 639-663.
Smith, M. S., Kish, B. J., & Crawford, C. B. (1987). Inheritance of wealth as human
kin investment. Ethology & Sociobiology, 8(3), 171-182.
Spigner, C., Hawkins, W., & Loren, W. (1993). Gender differences in perception of
risk associated with alcohol and drug use among college students. Women &
Health, 20(1), 87-97.
Stanforth, N. (1995). Fashion innovators, sensation seekers, and clothing
individualists. Perceptual & Motor Skills, 81(3, Pt 2), 1203-1210.
Staw, B. M., & Ross, J. (1989). Understanding behavior in escalation situations.
Science, 246(4927), 216-220.
Steinel, W., & De Dreu, C. K. W. (2004). Social Motives and Strategic
Misrepresentation in Social Decision Making. Journal of Personality &
Social Psychology, 86(3), 419-434.
Sternberg, R. J. (2000). Handbook of intelligence. Cambridge ; New York:
Cambridge University Press.
Sternberg, R. J., Grigorenko, E. L., & Bundy, D. A. (2001). The predictive value of
IQ. Merrill-Palmer Quarterly, 47(1), 1-41.
Stiff, J. B., & Miller, G. R. (1986). "Come to think of it . . .": Interrogative probes,
deceptive communication, and deception detection. Human Communication
Research, 12(3), 339-357.
Stone, E. R., Yates, A. J., & Caruthers, A. S. (2002). Risk taking in decision making
for others versus the self. Journal of Applied Social Psychology, 32(9),
1797-1824.

138
Tan, H.-T., & Yates, J. F. (1995). Sunk cost effects: The influences of instruction
and future return estimates. Organizational Behavior & Human Decision
Processes, 63(3), 311-319.
Teeter, R. (1999). What's Wrong With Chain Letter Pyramid Schemes? In Retrieved
from the World Wide Web on 16/04/99.
http://www.wco.com/~rteeter/pyramid.html.
Tice, D. M., Butler, J. L., Muraven, M. B., & Stillwell, A. M. (1995). When
modesty prevails: Differential favorability of self-presentation to friends and
strangers. Journal of Personality & Social Psychology, 69(6), 1120-1138.
Turner, R. E., Edgley, C., & Olmstead, G. (1975). Information control in
conversations: Honesty is not always the best policy. Kansas Journal of
Sociology, 11(1), 69-89.
Tversky, A., & Fox, C. R. (1995). Weighing risk and uncertainty. Psychological
Review, 102(2), 269-283.
Tversky, A., & Kahneman, D. (1981). The framing of decisions and the psychology
of choice. Science, 211(4481), 453-458.
Tversky, A., & Kahneman, D. (1992). Advances in prospect theory: Cumulative
representation of uncertainty. Journal of Risk and Uncertainty, 5, 297-323.
Tyler, J. M., & Feldman, R. S. (2004). Truth, Lies, and Self-Presentation: How
Gender and Anticipated Future Interaction Relate to Deceptive Behavior.
Journal of Applied Social Psychology, 34(12), 2602-2615.
Von Neumann, J., & Morgenstern, O. (1944). Theory of games and economic
behavior. Princeton, NJ, US: Princeton University Press.
Vrij, A. (2000). Detecting lies and deceit : the psychology of lying and the
implications for professional practice. New York: John Wiley.
139
Warneryd, K.-E. (1996). Risk attitudes and risky behavior. Journal of Economic
Psychology, 17(6), 749-770.
Webster, G. D. (2003). Prosocial behavior in families: Moderators of resource
sharing. Journal of Experimental Social Psychology, 39(6), 644-652.
Wilson, M., & Daly, M. (1993). An evolutionary psychological perspective on male
sexual proprietariness and violence against wives. Violence and Victims.
Special Issue: Social and cultural aspects of interpersonal violent
behaviors, 8(3), 271-294.
Wokutch, R. E., & Carson, T. L. (1999). The ethics and profitability of bluffing in
business. In R. J. Lewicki (Ed.), Lewicki, Roy; Saunders, David; Minton,
John. (1999). Negotiation: Readings, exercises, and cases (3rd ed.) (2nd .
ed., pp. 228-233). Boston, MA, US: Irwin/The McGraw-Hill Companies,
Inc.
Wolfgang, A. K. (1988). Gambling as a function of gender and sensation seeking.
Journal of Gambling Behavior, 4(2), 71-77.
Wong, A., & Carducci, B. J. (1991). Sensation seeking and financial risk taking in
everyday money matters. Journal of Business & Psychology, 5(4), 525-530.
Wood, R., & Zaichkowsky, J. L. (2004). Attitudes and trading behavior of stock
market investors: A segmentation approach. Journal of Behavioral Finance,
5(3), 170-179.
Yates, J. F. (1992). Risk-taking behavior. Chichester, West Sussex, England ; New
York: Wiley.
Zaleskiewicz, T. (2001). Beyond risk seeking and risk aversion: Personality and the
dual nature of economic risk taking. European Journal of Personality.
Special Personality and economic behavior, 15(1,SpecIssue), S105-S122.
140
Zeelenberg, M., Beattie, J., van der Plight, J., & de Vries, N. K. (1996).
Consequences of regret aversion: Effects of expected feedback on risky
decision making. Organizational Behavior & Human Decision Processes,
65(2), 148-158.
Zhang, Z.-X. (2001). The effects of frequency of social interaction and relationship
closeness on reward allocation. Journal of Psychology: Interdisciplinary &
Applied, 135(2), 154-164.
Zuckerman, M. (1979). Sensation seeking : beyond the optimal level of arousal.
Hillsdale, N.J.: L. Erlbaum.
Zuckerman, M. (1994). Behavioral expressions and biosocial bases of sensation
seeking. Cambridge ; New York: Cambridge University Press.
Zuckerman, M., & Kuhlman, D. M. (2000). Personality and risk-taking: Common
biosocial factors. Journal of Personality. Special Personality processes and
problem behavior, 68(6), 999-1029.
Zuckerman, M., & Neeb, M. (1980). Demographic influences in sensation seeking
and expression of sensation seeking in religion, smoking and driving habits.
Personality and Individual Differences, 1(3), 197-206.

141
Appendix A: Zuckerman’s Sensation Seeking Scale Version five (SSS-V)
Sensation Seeking For each question, please clearly tick which of the choices most
describes your likes or the way you feel. When it is hard to choose, select the option that describes you best or that you dislike the least. 1. A. I like “wild” uninhibited parties B. I prefer quiet parties with good conversation 2. A. There are some movies I enjoy seeing a second or even third time B. I can’t stand watching a movie that I’ve seen before 3. A. I often wish I could be a mountain climber B. I can’t understand people who risk their necks climbing mountains 4. A. I dislike all body odours B. I like some of the earthy body smells 5. A. I get bored seeing the same old faces B. I like the comfortable familiarity of everyday friends 6. A. I like to explore a strange city or section of town by myself, even if it
means getting lost
B. I prefer a guide when I am in a place I don’t know well 7. A. I dislike people who do or say things just to shock or upset others
B. When you can predict almost everything a person will do and say he or she must be a bore
8. A. I usually don’t enjoy a movie or play where I can predict what will
happen in advance B. I don’t mind watching a movie or play where I can predict what will happen in advance

142
9. A. I have tried cannabis or would like to B. I would never smoke cannabis 10. A. I would not like to try any drug which might produce strange and
dangerous effects on me
B. I would like to try some of the drugs that produce hallucinations 11. A. A sensible person avoids activities that are dangerous B. I sometimes like to do things that are a little frightening 12. A. I dislike “swingers” (people who are uninhibited and free about sex) B. I enjoy the company of real "swingers" 13. A. I find that stimulants make me uncomfortable B. I often like to get high (drinking alcohol or smoking marijuana) 14. A. I like to try new foods that I have never tasted before
B. I order the dishes with which I am familiar so as to avoid disappointment and unpleasantness
15. A. I enjoy looking at home movies, videos or travel slides
B. Looking at someone’s home movies, videos, or travel slides bores me tremendously
16. A. I would like to take up the sport of water skiing B. I would not like to take up water skiing 17. A. I would like to try surfboard riding B. I would not like to try surfboard riding

143
18. A. I would like to take off on a trip with no preplanned or definite routes or timetable
B. When I go on a trip I like to plan my route and timetable fairly carefully 19. A. I prefer the “down to earth” kinds of people as friends
B. I would like to make friends in some of the “far-out” groups like artists or anarchists
20. A. I would not like to learn to fly an airplane B. I would like to learn to fly an airplane 21. A. I prefer the surface of the water to the depths B. I would like to go scuba diving 22. A. I would like to meet some people who are homosexual (men or women) B. I stay away from anyone I suspect of being gay or lesbian 23. A. I would like to try parachute jumping
B. I would never want to try jumping out of a plane, with or without a parachute
24. A. I prefer friends who are excitingly unpredictable B. I prefer friends who are reliable and predictable 25. A. I am not interested in experience for its own sake
B. I like to have new and exciting experiences and sensations even if they are a little frightening, unconventional, or illegal

144
26. A. The essence of good art is in its clarity, symmetry of form, and harmony of colours B. I often find the beauty in the clashing colours and irregular forms of modern paintings
27. A. I enjoy spending time in the familiar surroundings of home B. I get very restless if I have to stay around home for any length of time 28. A. I like to dive off the high board
B. I don’t like the feeling I get standing on the high board (or I don’t go near it at all)
29. A. I like to date people who are physically exciting B. I like to date people who share my values 30. A. Heavy drinking usually ruins a party because some people get loud and
boisterous
B. Keeping the drinks full is the key to a good party 31. A. The worst social sin is to be rude B. The worst social sin is to be a bore 32. A. A person should have considerable sexual experience before marriage
B. It’s better if two married people begin their sexual experience with each other
33. A. Even if I had the money, I would not care to associate with flighty rich
people in the jet set
B. I could conceive of myself seeking pleasures around the world with the jet set

145
34. A. I like people who are sharp and witty even if they do sometimes insult
others
B. I dislike people who have their fun at the expense of hurting the feelings of others
35. A. There is altogether too much portrayal of sex in the movies B. I enjoy watching many of the sexy scenes in movies 36. A. I feel best after taking a couple of drinks B. Something is wrong with people who need alcohol to feel good 37. A. People should dress according to some standard of taste, neatness and style
B. People should dress in individual ways even if the effects are sometimes strange
38. A. Sailing long distances in small sailing crafts is foolhardy B. I would like to sail a long distance in a small but seaworthy sailing craft 39. A. I have no patience with dull or boring people B. I find something interesting in almost every person I talk to 40. A. Skiing down a high mountain slope is a good way to end up on crutches
B. I think I would enjoy the sensations of skiing very fast down a high mountain slope