Embed Size (px)
Citation preview

IHG Green Engage/Solutions
Green Engage/SolutionsIssued on February 1, 2011
Green Engage/SolutionsIssued on February 1, 2011
AcknowledgementsGreen Engage/Solu ons is our comprehensive onlinesustainability system. It tells our hotels what they cando to be a ‘green’ hotel and gives them the means toconserve resources and save money – by measuring,managing and repor ng on their hotel energy, waterand waste consump on, as well as their communityimpacts.
This metric has been reviewed and endorsed,both internally to IHG and by external third partyorganisa ons. Actual IHG hotel data has been used inthe technical analysis which informed items includedin this nal dra , and feedback from ini al users hasbeen incorporated. Many thanks go to those who havecontributed and collaborated in the evolu on of thissystem making it such a success and industry gamechanger.
Ques ons can be directed to the CSR team in Denham,UK.

3 Green Engage/SolutionsIssued on February 1, 2011
Table of Contents
Introduction iProcess iiCredit Category Overview ivImpact Chart Users Guide viEnergy Savings viiNew Hotels Certi ication Levels ixNew Hotels Checklist xiExisting Hotels Certi ication Levels xiiExisting Hotels Checklist xiv
Action Groups 1-72 Operations and Process 1-10 Energy 11-24 Building Envelope 25-30 Mechanical 31-42 Water 43-51 Waste 52-57 Products and Materials 58-65 Site 66-72Glossary 73-78
APPENDIX A: Existing Hotels Energy AnalysisAPPENDIX B: New Hotels Energy AnalysisAPPENDIX C: LEED Documentation

i Green Engage/SolutionsIssued on February 1, 2011
PurposeThe purpose of this guide is to iden fy appropriatesustainable building criteria, technologies andopera onal guidelines for IHG hotels – this is our greenbaseline. This work builds on our measurement e orts(IHG Green Measure) by guiding our e ort to reducewhat we have measured.
Our green base line is made ac onable via theprerequisite ac ons enumerated in this guide.Sustainable design and opera ons provides safer,healthier, more comfortable hotels with reducedenvironmental, cost and societal impacts.
Designing and opera ng a hotel to be sustainabledemonstrates a strong commitment to our guests, theenvironment and the future of the planet.
De inition of SustainabilitySustainability is about planning for the long term. Thismeans balancing environmental, economic, and socialdemands.
Corporate ResponsibilityThis is about how companies respond to thesustainability challenge and how this response impactsthe top and bo om line.
Action Groups (AGS)In order to achieve the sustainability goals for futureresort/ hotels, eight di erent categories of “ac ongroups” have been iden ed.
These categories are:• Site• Water
• Products & Materials• Waste• Building Envelope• Mechanical• Electrical• Opera on & Process
This guideline describes and recommends various designand opera on strategies and technologies for each ofthese categories.
The intent of each Ac on Group is to a empt to complywith one or more of the following:
• Reduce energy consump on• Reduce water consump on• Reduce carbon footprint• Improve guest health and comfort• Reduce opera ng and maintenance costs• Raise guest and sta awareness of sustainabledevelopment
The issue of how best to manage energy costs hasalso been addressed in the development of IHG GreenEngage/Solu ons. These ac ons are covered in theenergy sec on in the appendix of the guide. The guideadjusts the ac ons to di erent clima c regions.
The four climates considered are: Hot-Humid, Arid,Temperate and Cold-Alpine. Each Ac on Group isanalysed for its climate appropriateness and sustainablebuilding performance.
iIntroduction i
TEXT PENDING FROM IHGdemonstrates a strong commitment to our guests, thedemonstrates a strong commitment to our guests, theenvironment and the future of the planet.environment and the future of the planet.
• Reduce carbon footprint• Reduce carbon footprint• Improve guest health and comfort• Improve guest health and comfort• Reduce opera ng and maintenance costs• Reduce opera ng and maintenance costs• Raise guest and sta awareness of sustainable• Raise guest and sta awareness of sustainable

ii Green Engage/SolutionsIssued on February 1, 2011
Process ii
TEXT PENDING FROM IHGTEXT PENDING FROM IHGTEXT PENDING FROM IHGTEXT PENDING FROM IHGTEXT PENDING FROM IHGTEXT PENDING FROM IHGTEXT PENDING FROM IHGTEXT PENDING FROM IHG
iii Green Engage/SolutionsIssued on February 1, 2011
Process iii
TEXT PENDING FROM IHG

iv Green Engage/SolutionsIssued on February 1, 2011
OPERATIONS & PROCESSESHotel and hospitality opera ons can be very resource intensive. The prac ces and systems set in place to improve hotel opera ons andmaintenance are an immediate and public way to exhibit a hotel’s commitment to the environment.
ENERGYE cient electrical systems in a hotel o er many opportuni es to reduce opera ng costs and capture measurable reduc ons to environmentalimpact. Most saving achieved through ligh ng design also improve the enjoyment and comfort of spaces.
BUILDING ENVELOPEThe building envelope is the interface between the indoor and outdoor environments. A properly designed envelope helps to maintain the desiredindoor condi ons and may permit the use of natural ven la on, passive hea ng, and day-ligh ng.
MECHANICALGuest comfort, opera ng costs and many global environmental impacts are all dependant on a hotel’s mechanical systems. Op mum results areachieved when the e cient systems are chosen and designed to work in harmony with the other building systems and components.
WATERResponsibili es and opportuni es exist with all water that passes through a building and site. Economic and Environmental indicators favour thelowest possible man-made changes to the natural hydrological-cycle.
WASTEConstruc on and demoli on ac vi es contribute signi cant volume to land lls and incinerators that could be avoided with proper management.Diver ng this waste can reduce disposal fees and transporta on consequences.
PRODUCTS & MATERIALSMaterials selected for sustainable buildings should have appropriate performance, durability and environmental proper es. Material selec on cana ect issues ranging from our planet’s resources to occupant comfort and health.
SITEA hotel’s loca on a ects commu ng op ons, local ecosystems, building energy e ciency and much more. Proper site selec on should be givenappropriate considera on at the beginning of a project as it will a ect many down-stream decisions.
Credit Category Overview iv
v Green Engage/SolutionsIssued on February 1, 2011
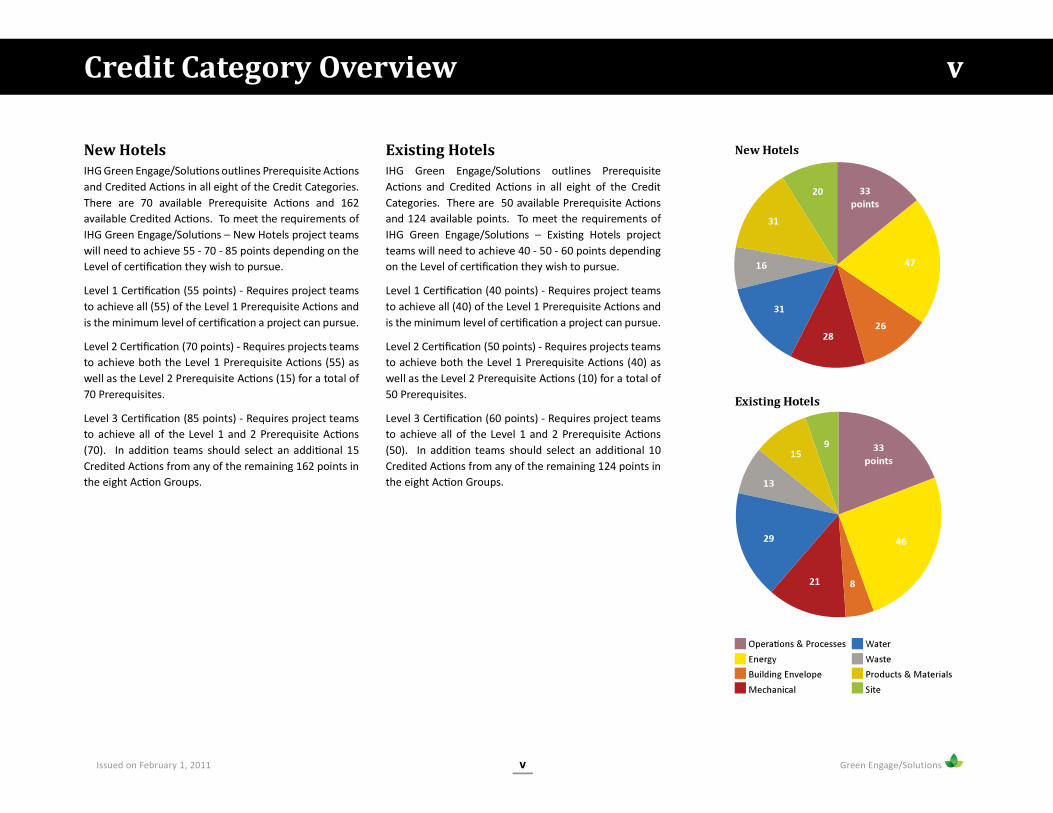
New HotelsIHG Green Engage/Solu ons outlines Prerequisite Ac onsand Credited Ac ons in all eight of the Credit Categories.There are 70 available Prerequisite Ac ons and 162available Credited Ac ons. To meet the requirements ofIHG Green Engage/Solu ons – New Hotels project teamswill need to achieve 55 - 70 - 85 points depending on theLevel of cer ca on they wish to pursue.
Level 1 Cer ca on (55 points) - Requires project teamsto achieve all (55) of the Level 1 Prerequisite Ac ons andis the minimum level of cer ca on a project can pursue.
Level 2 Cer ca on (70 points) - Requires projects teamsto achieve both the Level 1 Prerequisite Ac ons (55) aswell as the Level 2 Prerequisite Ac ons (15) for a total of70 Prerequisites.
Level 3 Cer ca on (85 points) - Requires project teamsto achieve all of the Level 1 and 2 Prerequisite Ac ons(70). In addi on teams should select an addi onal 15Credited Ac ons from any of the remaining 162 points inthe eight Ac on Groups.
Existing HotelsIHG Green Engage/Solu ons outlines PrerequisiteAc ons and Credited Ac ons in all eight of the CreditCategories. There are 50 available Prerequisite Ac onsand 124 available points. To meet the requirements ofIHG Green Engage/Solu ons – Exis ng Hotels projectteams will need to achieve 40 - 50 - 60 points dependingon the Level of cer ca on they wish to pursue.
Level 1 Cer ca on (40 points) - Requires project teamsto achieve all (40) of the Level 1 Prerequisite Ac ons andis the minimum level of cer ca on a project can pursue.
Level 2 Cer ca on (50 points) - Requires projects teamsto achieve both the Level 1 Prerequisite Ac ons (40) aswell as the Level 2 Prerequisite Ac ons (10) for a total of50 Prerequisites.
Level 3 Cer ca on (60 points) - Requires project teamsto achieve all of the Level 1 and 2 Prerequisite Ac ons(50). In addi on teams should select an addi onal 10Credited Ac ons from any of the remaining 124 points inthe eight Ac on Groups.
Credit Category Overview v

vi Green Engage/SolutionsIssued on February 1, 2011
Impact Chart Users Guide
ENERGY Represents the energyconserved and energygenerated by that measure atthe hotel
Li le or no energysavings
Minimal energysavings
Moderate energysavings
Signi cant energysavings
WASTE Represents the amount ofwaste the measure generatesand the reuse or recyclability ofthe measure at the hotel
Li le or no impact onwaste reducing waste
stream
Minimal impact onreducing waste stream
Moderate impact onreducing waste stream
Signi cant impact onreducing waste stream
WATER Represents the water resourceslikely to be a ected (consumed/saved) as a result of themeasure at the hotel
Li le or no potablewater savings
Minimal potablewater savings
Moderate potablewater savings
Signi cant potablewater savings
CARBON Represents the CO2 equivalentemissions associated with eachmeasure directly or indirectlyduring the life me of themeasure at the hotel
Li le or no carbonemissions reduc on
Minimal carbonemissions reduc on
Moderate carbonemissions reduc on
Signi cant carbonemissions reduc on
AFFORDABILITY Represents the capitalinvestment, opera on andmaintenance costs and paybackfor the hotel
High cost; poten allylong payback period
High cost; paybackperiod towards the
end of life me
Low cost; quickpayback
Very low cost; instantpayback
CONSUMER Represents how the measurea ects the health and comfortof the hotel guest/visitor Li le or no e ect for
the hotel guest/visitor
Minimal posi vee ect for the hotel
guest/visitor
Moderate posi vee ect for the hotel
guest/visitor
Signi cant posi vee ect for the hotel
guest/visitor
vi

vii Green Engage/SolutionsIssued on February 1, 2011
Green Engage/Solu ons for New Hotels is intended toshape the design of more sustainable hotels, by lookingat a wide range of issues including water use, wastemanagement, products and materials, guest comfort,and par cularly energy use.
Even though brand standards guide in the developmentof a new hotel, there remain a number of decisionsto be made about the building and the systems to beput inside it - decisions that can signi cantly impactthe energy e ciency of the hotel, impac ng not only rst costs, but also the short and long term opera ng
costs of a property. The appendix of Green Engage/Solu ons has been developed to help hotels weigh thechoices which o en seem confusing or overly technicaland allow development teams to make the right designchoices for their building type and climate.
Obviously a hotel in Siberia has to consider di erentfactors than a hotel in An gua, and to address thisGreen Engage/Solu ons has a set of Energy Chartswhich contain guidelines covering all aspects of hoteldesign, providing a prescrip ve path for achievingenergy savings of up to 25% over typical new hotelenergy use. The predicted savings for each climate zoneare summarised to the right.
The appendix also contains Calcula on Sheets, whichshow in detail the cost and savings of speci c designop ons, such as one type of HVAC system over another,in four di erent climate zones. These sheets, which arebased on the results of extensive “energy modelling”(computer simula on of hotel energy use), are designedto allow those looking for even greater savings to quicklyand easily weigh up which op on makes the most sense.
Hot-Humid Climates
Of the more than 100 Ac on Items outlined in GreenEngage/Solu ons, the biggest energy saving measures inthis climate are improved insula on, a dedicated centraloutside air unit and demand ven la on.
Overall, a hotel in a hot humid climate can performbetween 15% and 25% be er than a modelled baselinehotel.
Arid ClimatesOf the more than 100 Ac on Items outlined in GreenEngage/Solu ons, the biggest energy saving measures inthis climate are improved insula on, a dedicated centraloutside air unit and demand ven la on.
Overall, a hotel in an arid climate can perform between15% and 25% be er than a modelled baseline hotel.
Temperate ClimatesDue to the variability of this climate, there are a widerange of energy saving measures which can signi cantlyreduce energy use, in par cular the use of economisermode and energy recovery.
Overall, a hotel in a temperate climate can performbetween 20% and 25% be er than a modelled baselinehotel.
Cold-Alpine Climates
Of the more than 100 Ac on Items outlined in GreenEngage/Solu ons, the biggest energy saving measures inthis climate are improved glazing, improved insula on,demand ven la on, and economiser mode.
Overall, a hotel in a cold climate can perform between20% and 25% be er than a modelled baseline hotel.
viiNew Hotel Energy Savings

viii Green Engage/SolutionsIssued on February 1, 2011
Making an exis ng hotel more sustainable is obviouslyvery di erent from designing a sustainable hotelfrom scratch. In most cases it isn't sensible to rip outthe windows or completely replace or redesign theair condi oning systems. Instead, you have to makethe most of what is already there. Or in some casesmake improvements to the stu that is about to bereplaced anyway (televisions, refrigerators, etc). GreenEngage/Solu ons for Exis ng Hotels is focused oncombining common sense and best prac ce with fairlyminor improvements that, added together, can have asigni cant impact on how your hotel performs and yourbo om line.
The appendix of Green Engage/Solu ons has beendeveloped to help General Managers and their GreenTeams weigh the choices which o en seem confusingor overly technical and allow them to make the rightchoices for their hotel and climate. To do this, an energyanalysis of exis ng hotels is included, which outlines theimprovement that an “average” IHG hotel can achieveby going through the Green Engage/Solu ons process.
This analysis was done by building an “energy model”(a computer simula on of a typical hotel) and usingactual IHG hotels energy usage data. Calcula on Sheetshave been developed for every Level 1 and Level 2Prerequisite Ac on. This allows hotel managers to lookat the cost and bene t of these ac ons individually, aswell as look at the overall a ect of reaching Level 1 orLevel 2 Cer ca on on. These results are summarised tothe right.
Hot-Humid Climates
Level 1 Cer ca on can reduce energy consump onby 24%. Level 2 Cer ca on can reduce energyconsump on by 25%.
Arid Climates
Level 1 Cer ca on can reduce energy consump onby 22%. Level 2 Cer ca on can reduce energyconsump on by 23%.
Temperate ClimatesLevel 1 Cer ca on can reduce energy consump onby 20%. Level 2 Cer ca on can reduce energyconsump on by 22%.
Cold-Alpine ClimatesLevel 1 Cer ca on can reduce energy consump onby 17%. Level 2 Cer ca on can reduce energyconsump on by 19%.
viiiExisting Hotel Energy Savings

ix Green Engage/SolutionsIssued on February 1, 2011
IHG Green Engage/Solu ons outlines Level 1Prerequisite Ac ons, Level 2 Prerequisite Ac ons andCredited Ac ons in all eight of the Credit Categories.There are 70 available Prerequisite Ac ons and 162available Credited Ac ons. To meet the requirements ofIHG Green Engage/Solu ons – New Hotels project teamswill need to achieve 55 - 70 - 85 points depending on theLevel of cer ca on they wish to pursue.
Level 1 Certi ication - 55 pointsOperations & ProcessesO-01 Ban Smoking on the Property
O-01 Develop Cleaning Policy and Fee for Roomswhere Smoking has Occurred
O-02 Green Sta Orienta on & Educa on
O-02 Develop Sta Ac ve Green Team
O-03 Guest Conserva on Educa on
O-03 Green Holiday Agenda and Guides
O-04 Green Cleaning Materials
O-04 Training for Green Prac ces
O-04 Towel/Sheet Program
O-04 IHG Welcome Mats
O-08 IHG HR Human Rights Training
O-09 Hazardous Material Audit
O-09 Appropriate Segrega on, Storage and Disposalof Hazardous Materials
EnergyE-01 Adopt IHG Energy BMPs Document
E-01 Develop Sequence of Opera ons
E-01 Develop Building Opera ng Plan
E-01 Develop Systems Narra ve
E-01 Preventa ve Maintenance
E-02 Meter Whole Building Energy Use
E-02 Enrol In Green Measure
E-07 Energy E cient Appliances
E-07 Energy E cient Televisions
E-07 Energy E cient Appliances
E-08 Pipe Insula on
E-08 Boiler E ciency
E-09 Zero Use of Incandescent Lamps in GuestRooms
E-09 Zero Use of Incandescent Lamps in Circula onSpaces
E-09 Zero Use of Incandescent Lamps in Back ofHouse Spaces
E-10 Occupancy Sensors in O ces
E-10 Occupancy Sensors in Corridors for Decora veFixtures
E-11 Timing Controls on all Up and Facade Ligh ng
Building EnvelopeB-01 Low-E Glazing
B-02 Meet ASHRAE Recommenda ons for ClimateZone
B-03 Roof System Selec on
B-04 Install Weatherstripping on all Guest RoomWindows
MechanicalM-01 Verify Minimum Outdoor Air Rates
M-03 No Through the Wall Heat Pumps (PTACs)
M-03 No 2-Pipe Fan Coil Units with Electric Heat
M-06 No CFCs in HVAC and Refrigera on Systems
M-07 Airside Economisers on Central AHUs
M-09 100% of Guest Rooms have 4°F DeadbandThermostats
M-11 Variable Frequency Drives
M-11 NEMA Premium E ciency Motors
WaterW-01 Meet WHO Drinking Water Quality Standards
W-02 Enrol In Green Measure
W-02 Meter Whole Building Water Use
W-03 Meet IPC 2006 Maximum Flow Rates
WasteG-01 Enrol In Green Measure
G-02 Adopt IHG Solid Waste Management Policy
G-02 Provide Recycling Storage Area
Products & MaterialsP-01 Adopt IHG Sustainable Purchasing Policy
P-01 Standardised Speci ca on for Green Materials
P-02 Low or No VOC Paint
P-02 Low or No VOC Adhesives
SiteS-01 Erosion & Sedimenta on Control During
Construc on and Landscaping
ixNew Hotels Certi ication Levels

x Green Engage/SolutionsIssued on February 1, 2011
Level 2 Certi ication - 70 pointsThere are an addi onal 15 points required at achieveLevel 2 Cer ca on
Energy
E-03 Meet Minimum Energy PerformanceRequirements
E-04 Commissioning Plan
E-05 Install Central Building Management System(BMS)
E-05 Monitor BMS
E-06 Provide Guest Room Master Switching
E-09 Reduce Ligh ng Power Densi es
Building EnvelopeB-01 Op mised Window to Wall Ra o
B-04 Use of Outdoor Air to Minimise In ltra on
MechanicalM-01 Installa on of Central AHU for Fresh Air
M-08 Ven la on Air Heat Recovery
M-09 100% of Public Areas have 4°F Deadbandthrough BMS
WasteG-01 Conduct a Waste Stream Audit
G-03 Construc on Waste Management Plan
SiteS-01 Adopt IHG Sustainable Building Exterior and
Hardscape Management Plan
S-01 Adopt IHG Sustainable Integrated PestManagement, Erosion Control and LandscapeManagement Plan
Level 3 Certi ication - 85 pointsMeet all of the Prerequisite Ac ons and achieve 15points through self selected Credited Ac ons
xNew Hotels Certi ication Levels

xi Green Engage/SolutionsIssued on February 1, 2011
Opera ons & Processes 33P1 P2 CA Ac on Group Pts
O-01 Smoke-Free Hotel 2
O-02 Sta Training and Awareness 2
O-03 Guest/Public Educa on 3
O-04 Green Housekeeping Productsand Prac ces
6
O-05 Sustainable Event Management 6
O-06 Food and Beverage 5
O-07 Sustainable Terms andCondi ons with Business Partners
3
O-08 Suppor ng Communi es 4
O-09 On-Site Hazard/EnvironmentalImpact Analysis
2
Energy 47P1 P2 CA Ac on Group Pts
E-01 O&M Best ManagementPrac ce (BMPs)
5
E-02 Energy Metering and Sub-Metering
5
E-03 Energy PerformanceBenchmarking
3
E-04 Building Energy SystemCommissioning
4
E-05 Building Management System(BMS)
4
E-06 Guest Room Master Switching 3
E-07 Energy E cient Appliances 3
E-08 Hot Water Contribu on toEnergy Reduc on
4
E-09 Energy E cient Ligh ng 5
E-10 Ligh ng Systems Controls 6
E-11 Reduce Light Pollu on 2
E-12 Low Energy Systems 3
Building Envelope 26P1 P2 CA Ac on Group Pts
B-01 Op mise Dayligh ng Design 7
B-02 Op mise Façade Design 5
B-03 Cool Roo ng Systems 3
B-04 Air In ltra on Reduc onMeasures
6
B-05 Acous c Isola on 5
Mechanical 28P1 P2 CA Ac on Group Pts
M-01 Fresh Air Delivery 5
M-02 Natural Ven la on 1
M-03 Guest Room HVAC EquipmentSelec on
3
M-04 Water Cooled Chiller 1
M-05 Addi onal HVAC Strategies 2
M-06 Refrigerant Management 2
M-07 Economiser Modes 2
M-08 Heat Recovery 2
M-09 4 Degree Deadband 2
M-10 Enhanced HVAC Guest RoomControls & CO2 Monitoring
6
M-11 Motor Energy E ciency 2
Water 31P1 P2 CA Ac on Group Pts
W-01 Drinking Water Quality 5
W-02 Water Metering and Sub-Metering
3
W-03 Water E cient Fixtures 6
W-04 Water E cient Appliances andSystems
5
W-05 Reduce Irriga on Demand 3
W-06 Manage Stormwater 2
W-07 Water Collec on, Treatment &Re-Use System
3
W-08 Ozone Water Treatment/Chemical Reduc on
4
Waste 16P1 P2 CA Ac on Group Pts
G-01 Establish a Waste Benchmark 2
G-02 Manage Ongoing Waste 6
G-03 Reuse and Dona on ofConstruc on and FF&E Materials
4
G-04 Material Supplier PackagingReduc on and Removal Policy
2
G-05 Manage Site and Food Waste 2
Products & Materials 31P1 P2 CA Ac on Group Pts
P-01 Eco-Embedded MaterialsSpeci ca on
3
P-02 Low-Emi ng Finish Materials 6
P-03 Recycled and RecyclableMaterials
5
P-04 Regionally Manufactured/Regionally Sourced Materials
4
P-05 Rapidly Renewable/SustainableHarvested Materials
4
P-06 Design for Material Reduc onand Flexibility of Spaces
4
P-07 Mold/Contaminant ResistantMaterials and Processes
5
Site 20P1 P2 CA Ac on Group Pts
S-01 Environmentally Sensi ve SiteManagement
3
S-02 Des na on Protec on 3
S-03 Building Si ng 2
S-04 Ecology and Landscaping 4
S-05 Reduce Auto Use Impact 4
S-06 Parking 4
xiNew Hotels Scorecard

xii Green Engage/SolutionsIssued on February 1, 2011
IHG Green Engage/Solu ons outlines Level 1Prerequisite Ac ons, Level 2 Prerequisite Ac ons andCredited Ac ons in all eight of the Credit Categories.There are 50 available Prerequisite Ac ons and 124available Credited Ac ons. To meet the requirementsof IHG Green Engage/Solu ons – Exis ng Hotels projectteams will need to achieve 40 - 50 - 60 points dependingon the Level of cer ca on they wish to pursue.
Level 1 Certi ication - 40 pointsOperations & ProcessesO-01 Ban Smoking on the Property
O-01 Develop Cleaning Policy and Fee for Roomswhere Smoking has Occurred
O-02 Green Sta Orienta on & Educa on
O-02 Develop Sta Ac ve Green Team
O-03 Guest Conserva on Educa on
O-03 Green Holiday Agenda and Guides
O-04 Green Cleaning Materials
O-04 Training for Green Prac ces
O-04 Towel/Sheet Program
O-04 IHG Welcome Mats
O-08 IHG HR Human Rights Training
O-09 Hazardous Material Audit
O-09 Appropriate Segrega on, Storage and Disposalof Hazardous Materials
EnergyE-01 Adopt IHG Energy BMPs Document
E-01 Develop Sequence of Opera ons
E-01 Develop Building Opera ng Plan
E-01 Develop Systems Narra ve
E-01 Preventa ve Maintenance
E-02 Meter Whole Building Energy Use
E-02 Par cipate in Green Measure
E-07 Energy E cient Appliances
E-07 Energy E cient Televisions
E-07 Energy E cient Refrigerators
E-09 Zero Use of Incandescent Lamps in GuestRooms
E-09 Zero Use of Incandescent Lamps in Circula onSpaces
E-09 Zero Use of Incandescent Lamps in Back ofHouse Spaces
E-10 Occupancy Sensors in Corridors for Decora veFixtures
Building EnvelopeB-04 Install Weatherstripping on all Guest Room
Windows
MechanicalM-01 Verify Minimum Outdoor Air Rates
M-06 No CFCs in HVAC and Refrigera on Systems
M-09 100% of Guest Rooms have 4°F DeadbandThermostats
WaterW-01 Meet WHO Drinking Water Quality Standards
W-02 Par cipate in Green Measure
W-03 Meet IPC 2006 Maximum Flow Rates
WasteG-01 Par cipate in Green Measure
G-02 Adopt IHG Solid Waste Management Policy
G-02 Provide Recycling Storage Area
Products & MaterialsP-01 Adopt IHG Sustainable Purchasing Policy
P-02 Low or No VOC Paint
P-02 Low or No VOC Adhesives
xiiExisting Hotels Certi ication Levels

xiii Green Engage/SolutionsIssued on February 1, 2011
Level 2 Certi ication - 50 pointsThere are an addi onal 10 points required at achieveLevel 2 Cer ca on
Energy
E-03 Meet Minimum Energy PerformanceRequirements
E-04 Commissioning Plan
E-08 Pipe Insula on
E-10 Occupancy Sensors in O ces
MechanicalM-11 Variable Frequency Drives
M-11 NEMA Premium E ciency Motors
WaterW-02 Meter Whole Building Water Use
WasteG-01 Conduct a Waste Stream Audit
SiteS-01 Adopt IHG Sustainable Building Exterior and
Hardscape Management Plan
S-01 Adopt IHG Sustainable Integrated PestManagement, Erosion Control and LandscapeManagement Plan
Level 3 Certi ication - 60 pointsMeet all of the Prerequisite Ac ons and achieve 10points through self selected Credited Ac ons
xiiiExisting Hotels Certi ication Levels

xiv Green Engage/SolutionsIssued on February 1, 2011
Existing Hotels Scorecard xivOpera ons & Processes 33P1 P2 CA Ac on Group Pts
O-01 Smoke-Free Hotel 2
O-02 Sta Training and Awareness 2
O-03 Guest/Public Educa on 3
O-04 Green Housekeeping Productsand Prac ces
6
O-05 Sustainable Event Management 6
O-06 Food and Beverage 5
O-07 Sustainable Terms andCondi ons with Business Partners
3
O-08 Suppor ng Communi es 4
O-09 On-Site Hazard/EnvironmentalImpact Analysis
2
Energy 46P1 P2 CA Ac on Group Pts
E-01 O&M Best ManagementPrac ce (BMPs)
5
E-02 Energy Metering and Sub-Metering
5
E-03 Energy PerformanceBenchmarking
3
E-04 Building Energy SystemCommissioning
3
E-05 Building Management System(BMS)
4
E-06 Guest Room Master Switching 3
E-07 Energy E cient Appliances 3
E-08 Hot Water Contribu on toEnergy Reduc on
4
E-09 Energy E cient Ligh ng 5
E-10 Ligh ng Systems Controls 6
E-11 Reduce Light Pollu on 2
E-12 Low Energy Systems 3
Building Envelope 8P1 P2 CA Ac on Group Pts
B-01 Op mise Dayligh ng Design 4
B-02 Op mise Façade Design 0
B-03 Cool Roo ng Systems 3
B-04 Air In ltra on Reduc onMeasures
1
B-05 Acous c Isola on 0
Mechanical 21P1 P2 CA Ac on Group Pts
M-01 Fresh Air Delivery 1
M-02 Natural Ven la on 1
M-03 Guest Room HVAC EquipmentSelec on
3
M-04 Water Cooled Chiller 1
M-05 Addi onal HVAC Strategies 2
M-06 Refrigerant Management 2
M-07 Economiser Modes 2
M-08 Heat Recovery 2
M-09 4 Degree Deadband 2
M-10 Enhanced HVAC Guest RoomControls & CO2 Monitoring
3
M-11 Motor Energy E ciency 2
Water 29P1 P2 CA Ac on Group Pts
W-01 Drinking Water Quality 4
W-02 Water Metering and Sub-Metering
3
W-03 Water E cient Fixtures 6
W-04 Water E cient Appliances andSystems
5
W-05 Reduce Irriga on Demand 3
W-06 Manage Stormwater 1
W-07 Water Collec on, Treatment &Re-Use System
3
W-08 Ozone Water Treatment/Chemical Reduc on
4
Waste 13P1 P2 CA Ac on Group Pts
G-01 Establish a Waste Benchmark 2
G-02 Manage Ongoing Waste 6
G-03 Reuse and Dona on ofConstruc on and FF&E Materials
1
G-04 Material Supplier PackagingReduc on and Removal Policy
2
G-05 Manage Site and Food Waste 2
Products & Materials 15P1 P2 CA Ac on Group Pts
P-01 Eco-Embedded MaterialsSpeci ca on
2
P-02 Low-Emi ng Finish Materials 6
P-03 Recycled and RecyclableMaterials
3
P-04 Regionally Manufactured/Regionally Sourced Materials
1
P-05 Rapidly Renewable/SustainableHarvested Materials
2
P-06 Design for Material Reduc onand Flexibility of Spaces
0
P-07 Mold/Contaminant ResistantMaterials and Processes
1
Site 9P1 P2 CA Ac on Group Pts
S-01 Environmentally Sensi ve SiteManagement
2
S-02 Des na on Protec on 1
S-03 Building Si ng 0
S-04 Ecology and Landscaping 2
S-05 Reduce Auto Use Impact 3
S-06 Parking 1

1 Green Engage/SolutionsIssued on February 1, 2011
The success of a sustainable building relies on bothsustainable design and sustainable opera ons. Establishingand maintaining an environment conducive to properopera ons starts with building energy commissioningwhere the intent of the building is documented alongwith design decisions so that opera ng personal canmake decisions consistent with the original system intent.Sustainable opera ons con nues through occupancy bymaintaining green housekeeping, facilita ng recycling,educa ng occupants and verifying and documen ngenergy performance.
Opera onal measures secure the investments madeduring the design phase. They are cri cal to achievingthe payback that drove design decisions. However,opera ons relies on human behaviour, which is typicallyharder to predict and control than mechanical systems.A transparent and sustained management commitmentcan help secure employee commitment towardssustainable opera ons.
O-01 Smoke-Free Hotel
O-02 Staff Training and Awareness
O-03 Guest/Public Education
O-04 Green Housekeeping Products & Practices
O-05 Sustainable Event Management
O-06 Food and Beverage
O-07 Sustainable Terms and Conditions withBusiness Partners
O-08 Supporting Communities
O-09 On-site Hazard/Environmental ImpactAnalysis
O-01 to O-09Operations and Processes Action Groups

2 Green Engage/SolutionsIssued on February 1, 2011
Action Group Impact:Energy
Waste
Water
Carbon
A ordability
Consumer
Minor Major
Considerations:
New HotelsAll new hotels commi ed to gaining Green Engage/Solu ons cer ca on should ban smoking on theproperty. As a disincen ve, the hotel should have apolicy of ning guests who disregard this policy.
Exis ng HotelsHotels which currently have smoking areas should ensuresepara on from non-smoking areas through physicalbarriers and separate HVAC systems. These proper esshould develop a phase-out plan and run an educa onprogram to inform guests of this change of policy.
Advantages:Less odour migra on; Be er indoor air quality.
Disadvantages:Poten al guest dissa sfac on in regions where indoorsmoking is acceptable
Other Relevant Action Groups:O-03
Narrative:
Indoor air quality is crucial in achieving a healthyenvironment. In many municipali es, smoking is notallowed in public places to protect the health of others. Insome areas of the world smoke-free hotels are the norm,whereas in others hotel guest expecta ons dictate thatsmoking rooms are made available. The disadvantage ofallowing guests to smoke is that smoking in hotel roomscreates discomfort for non-smoking guests. Smokingrooms need more fresh air and ven la on than non-smoking rooms, so there is also an increased energy use.
Where banning of smoking is not feasible, all designatedsmoking areas should be separated with walls that goup to structure and doors that close, and independentven la on systems so smoke cannot migrate to non-smoking areas. The HVAC system must provide higherexhaust and outdoor air rates in these rooms to dilutepar culates. Room-type air condi oning units should notbe used in smoking areas as they recycle the room air.
O-01Smoke-Free Hotel
IHG Green Engage/Solutions NH EH
Level 1 Prerequisites
1 Ban Smoking on the Property
1 Develop Cleaning Policy and Fee forRooms where Smoking has Occurred
Total Available Points 2 2
LEED® EQp2
3 Green Engage/SolutionsIssued on February 1, 2011
Action Group Impact:Energy
Waste
Water
Carbon
A ordability
Consumer
Minor Major
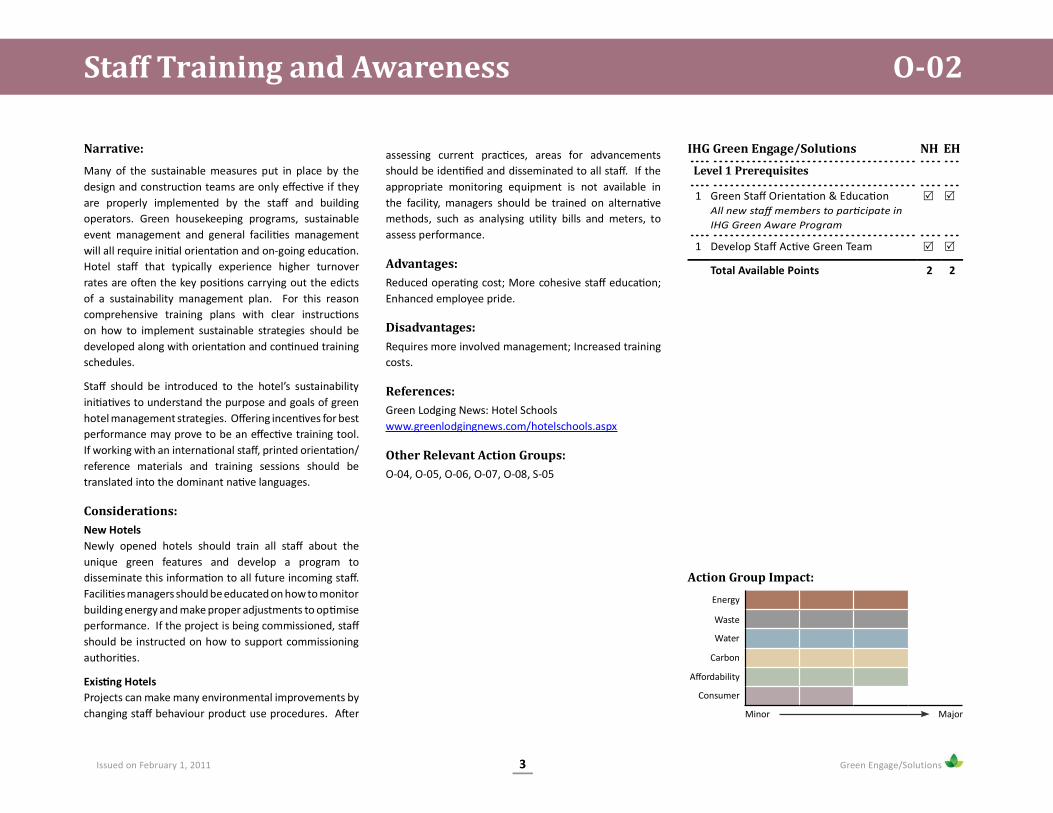
assessing current prac ces, areas for advancementsshould be iden ed and disseminated to all sta . If theappropriate monitoring equipment is not available inthe facility, managers should be trained on alterna vemethods, such as analysing u lity bills and meters, toassess performance.
Advantages:Reduced opera ng cost; More cohesive sta educa on;Enhanced employee pride.
Disadvantages:Requires more involved management; Increased trainingcosts.
References:Green Lodging News: Hotel Schoolswww.greenlodgingnews.com/hotelschools.aspx
Other Relevant Action Groups:O-04, O-05, O-06, O-07, O-08, S-05
Narrative:
Many of the sustainable measures put in place by thedesign and construc on teams are only e ec ve if theyare properly implemented by the sta and buildingoperators. Green housekeeping programs, sustainableevent management and general facili es managementwill all require ini al orienta on and on-going educa on.Hotel sta that typically experience higher turnoverrates are o en the key posi ons carrying out the edictsof a sustainability management plan. For this reasoncomprehensive training plans with clear instruc onson how to implement sustainable strategies should bedeveloped along with orienta on and con nued trainingschedules.
Sta should be introduced to the hotel’s sustainabilityini a ves to understand the purpose and goals of greenhotel management strategies. O ering incen ves for bestperformance may prove to be an e ec ve training tool.If working with an interna onal sta , printed orienta on/reference materials and training sessions should betranslated into the dominant na ve languages.
Considerations:New HotelsNewly opened hotels should train all sta about theunique green features and develop a program todisseminate this informa on to all future incoming sta .Facili es managers should be educated on how to monitorbuilding energy and make proper adjustments to op miseperformance. If the project is being commissioned, stashould be instructed on how to support commissioningauthori es.
Exis ng HotelsProjects can make many environmental improvements bychanging sta behaviour product use procedures. A er
O-02Staff Training and Awareness
IHG Green Engage/Solutions NH EH
Level 1 Prerequisites
1 Green Sta Orienta on & Educa onAll new sta members to par cipate inIHG Green Aware Program
1 Develop Sta Ac ve Green Team
Total Available Points 2 2

4 Green Engage/SolutionsIssued on February 1, 2011
Action Group Impact:Energy
Waste
Water
Carbon
A ordability
Consumer
Minor Major
Guest/Public Education O-03
Considerations:New HotelsNew facili es could enhance guest involvement byproviding real- me metering to monitor energy use,water use and provide feedback from any alterna veenergy or rainwater collec on equipment.
Exis ng HotelsExis ng projects should engage guests by o eringpar cipatory conserva on programs, encouragingsustainable tourism and highligh ng conserva onprac ces that can be con nued at home.
Advantages:Enhances brand image; Posi ve marke ng tool; Reducesenergy cost, Reduces laundering needs.
Disadvantages:
None.
References:Energy,Inc: The Energy Detec vewww.theenergydetec ve.com/about-ted
“Green” Hotels Associa on: Catalogwww.greenhotels.com/catalog/printed.htm
Other Relevant Action Groups:O-01, O-04, O-05, O-08, S-02
Narrative:
Guiding guest behaviour is a crucial element to e ec velyimplemen ng many conserva ons measures. Signage,literature and helpful front of house sta can all calla en on to the green e orts of the facility and encourageguests to par cipate.
Promo ng local sustainable shops, ac vi es andalterna ve means of transport encourages the guests’environmentally conscious choices to permeate into thesurrounding economy.
Providing guests with feedback on their energy andresource usage in a friendly informa ve manner can alsoencourage self-correc ve ac on.
Making guests aware of measures implemented at thehotel will also educate them on conserva on prac cesthey can con nue at home.
IHG Green Engage/Solutions NH EH
Level 1 Prerequisite
1 Guest Conserva on Educa onDevelop a guest educa on program thatincludes signage and literature explaininggreen hotel features and conserva on ps for hotel and home
1 Green Holiday Agenda and GuidesProvide guest with informa on on localgreen o erings and environmentallypreferable ways to reach des na ons
Credited Actions
1 Consumer Behaviour FeedbackProvide meters in rooms and/or energy/water consump on informa on on bills
Total Available Points 3 3
LEED® IOc1.3

5 Green Engage/SolutionsIssued on February 1, 2011
Action Group Impact:Energy
Waste
Water
Carbon
A ordability
Consumer
Minor Major
Narrative:
Some of the tradi onal cleaning products used in hotelscontain ingredients that are toxic or hazardous. Manycontain vola le organic compounds (VOCs) which againcan be toxic and also act as an irritant to sensi ve people.The aim of green cleaning is to reduce the risk of chemicalexposure to janitorial sta along with guests at the hotel.There are a range of levels of green cleaning that could beimplemented by a hotel operator.
Proper sta training and guest awareness are some ofthe most cost e ec ve means or conserving resources.Sta should be encouraged to subs tute reusablesupplies for disposables as much as possible and trainedto understand the towel and sheet program.
Products should be compliant with a standard such asthat contained in the California Code of Regula ons whichsets VOC limits for a range of product groups. Anotherstandard is the Green Seal 37 standard which lists actualproducts from a range of manufacturers.
The Carpet and Rug Ins tute developed a voluntarystandard for tes ng vacuum cleaners to ensure thatthey work e ciency and contain the dust that they areextrac ng from the carpet.
Considerations:New HotelsAll housekeeping sta and procurement agents should betrained to purchase or use green cleaning products.
Exis ng HotelsMost of the green products work as well as conven onalcleaning products but they may need to be useddi erently. A training schedule should be set up for stato ensure they are up to date with the products andmethods being used. This can also improve the health ofcleaning sta as well as reducing worker safety liabilityissues.
Advantages:
Li le or no cost di erence when compared to conven onalcleaning methods; Could poten ally make guests staymore enjoyable due to be er indoor environment; Saferfor both guests and sta .
Disadvantages:Addi onal training may be required for housekeepingsta .
References:IHG Green Cleaning Policy
California Environmental Protec on Agency: AirResources Boardwww.arb.ca.gov/testmeth/cptm/cptm.htm
Green Sealwww.greenseal.org/ ndaproduct/index.cfm
The Carpet and Rug Ins tutewww.carpet-rug.com/commercial-customers/cleaning-and-maintenance/seal-of-approval-products/vacuums.cfm
Other Relevant Action Groups:O-01, O-02, O-09, W-08, S-01
O-04Green Housekeeping Products and Practices
IHG Green Engage/Solutions NH EH
Level 1 Prerequisites
1 Green Cleaning MaterialsUse non-toxic cleaning products
1 Training for Green Prac cesAll housekeeping sta to receive regulartraining on use and handling of greencleaning products
1 Towel/Sheet ProgramImplement towel/sheet laundryconserva on program
1 IHG Welcome MatsProvide IHG brand-speci ed welcomemats on all public entry points. Minimum10 feet in total length
Credited Actions
1 E cient Use of Cleaning MaterialsDevelop program to supply reusablecleaning products and train sta onproper use & minimising waste
1 CRI High E ciency Vacuum Cleaners
Total Available Points 6 6
LEED® EQp3, EQc3.3 & EQc3.5

6 Green Engage/SolutionsIssued on February 1, 2011
IHG Green Engage/Solutions NH EH
Credited Actions
1 Recycling/Compost ProgramPackaging/event materials & literature/food & beverages
1 Reduc on of ConsumablesWashable/reusable catering dish/ atware, table linens, bulk dispensers
1 Local CateringSeek catering ingredients originate within80 kilometres (50 miles) of hotel
1 Environmentally Preferable EventMaterialsRecycled content, non-toxic inks,compostable
1 Avoid Printed MaterialsInstall screens with event schedule/curricula
1 Educa on/Marke ng of Green Op onsDevelop green mee ng packages, educatesta /a endees on using/implemen nggreen programs
Total Available Points 6 6
O-05Sustainable Event Management
Considerations:
New HotelsBuilding management systems should be designed toallow for exibility of uses in spaces. Occupancy sensingcontrols should be incorporated wherever possible.
Exis ng HotelsEvent management sta should incorporate greenmee ng op ons into event packages and researchfacili es capable of accep ng recyclable/compostableevent waste. Sta should be trained on how to executethese opera ons. Green event op ons should be properlymarketed to event clients.
Advantages:
Increases venue visibility and desirability to prospec veevent clients, Could reduce some opera ng costs.
Disadvantages:Green event materials and addi onal catering servicesmay increase costs in some areas.
References:EcoSpeakers.com: Green Event Planning Resourceswww.ecospeakers.com/foreventmgrs/greenevents
Other Relevant Action Groups:
O-02, O-06, G-01, P-01, P-03, P-04
Narrative:
Events are generally huge material and energy consumersand produce large amounts of waste. Increasingly, groupsare favouring venues that o er sustainable managementprac ces for their events and mee ngs. A comprehensivegreen event o ering, at a minimum, includes recyclingprograms to handle packaging, event materials and food& beverage waste. Event managers should also considergreen catering op ons by reducing use of disposablewares, purchasing sustainable food (organic, local, fairtrade) and menu planning to reduce waste. Wheredisposable materials must be used, preference should begiven to those with high recycled content and/or otherenvironmentally preferable characteris cs (non-toxicinks, biodegradable/compostable, made from rapidlyrenewable materials, cer ed sustainably harvested,produced with alterna ve energy).
The exible nature of room popula on and use for eventsrequires dynamic designs and systems in order to avoidexcessively sized spaces and energy consump on. Eventspaces and mee ng rooms should have mo on detectorsand dynamic monitoring to allow for fast adjustments ofenvironmental controls.
Action Group Impact:Energy
Waste
Water
Carbon
A ordability
Consumer
Minor Major

7 Green Engage/SolutionsIssued on February 1, 2011
Action Group Impact:Energy
Waste
Water
Carbon
A ordabilityConsumer
Minor Major
O-06Food and Beverage
IHG Green Engage/Solutions NH EH
Credited Actions
1 Menu Planning to Prevent WasteDevelop & implement a menu planningpolicy
1 Bulk DispensersProvide bulk food, beverage andcondiments dispensers whenever possible
1 Purchase Local, Organic, Fair Trade FoodDevelop sustainable food purchasingpolicy with possible suppliers iden ed
1 Par cipate in Green RestaurantCer ca on Program
1 Food Dona on ProgramDevelop & implement a excess fooddona on plan with possible recipientsiden ed
Total Available Points 5 5
Narrative:
The hospitality industry is a large consumer of food andbeverage products through in-house restaurants, cateringand guest room services. By engaging suppliers throughpurchasing agreements, sustainable food resource chainsare reinforced and stabilised.
Sustainable food and beverage sources include locallyproduced, fairly traded and organic ingredients. Menuplanning reduces excess food waste and re ects theseasonally available ingredients. Materials are conservedby o ering op ons in bulk dispensers rather thanindividual packages. Green restaurant programs validatee orts to use environmentally responsible products.
Educa on of food service sta is crucial to ensuring thatpolicies are understood and properly implemented.
Considerations:New HotelsKitchen equipment should be selected to allow for anyunique storage/staging needs for seasonal food use.Consider including a greenhouse or se ng aside sitearea for gardens to o set catering needs. Considerincorpora ng a compos ng area near the kitchen forlocal distribu on or use on landscaping.
Exis ng HotelsFood service sta should be trained on green restaurantmanagement and food selec on. Exis ng contracts withfood suppliers should be adapted to include organic, localand fair trade products. Local farms should be surveyedto determine if local products can be subs tuted. Fooddona on programs should be set up, where applicable.
Advantages:
Enhances brand image; Posi ve marke ng tool; Providesfresher, healthier food to guests.
Disadvantages:Seasonal food supplies may be limited in some regions;Organic food can be more expensive.
References:Green Restaurant Associa on: Dine Greenwww.dinegreen.com
Slow Foodwww.slowfood.com
FairTrade Cer edTM: TransFair USAwww.transfairusa.org
Other Relevant Action Groups:O-02, G-04, G-05

8 Green Engage/SolutionsIssued on February 1, 2011
Action Group Impact:Energy
Waste
Water
Carbon
A ordability
Consumer
Minor Major
Narrative:
Sustainable business prac ces and corporateresponsibility is shaped by the rela onships formed withsuppliers and partners. Business partners should bechosen based on the degree to which they support thesocial and environmental goals adopted by IHG.
Hotels should look for opportuni es to work closelywith product and service providers to iden fy areas forimprovement. In areas where certain greener technologiesor services are limited, hotels should consider developingagreements that foster improvements to locally availableproducts and businesses. Opportuni es might include:
• Developing educa on and training programs withlocal service contractors – such as landscape or pestmanagement providers
• Networking suppliers with local resources to drivegreen market transforma on in local economies
The measures encouraged include:
• Sourcing products which are responsible in theirmanufacture, use and disposal
• Reviewing all the products and services purchasedand iden fying where more responsible alterna ves areavailable.
• Integrate sustainable criteria into your purchasingpolicy and procedures
• Encourage local businesses to source locally whenpossible•
Considerations:New HotelsInclude sustainable products and prac ces in construc ondocuments or procurement contracts. Contractors and
building material suppliers with the most sustainablebusiness prac ces should be incen vised or favoured.Design and construc on teams should carefully assessa ordable products and services available in the areaand iden fy gaps in availability. Hotels should considercrea ng alliances throughout the IHG brand to furtherleverage in uence.
Exis ng HotelsCurrent and future service and supply contracts should bereviewed and revised for sustainable business prac cesas they are renewed. Purchases for maintenance andrenova ons should be massed to increase producttransforma on poten al
Advantages:Requiring partners to review their prac ces will increasequality checks and accountability; Creates posi vemarket change in some underserved areas; Standardspeci ca ons increase product/service selec ons andreduce cost/need for customisa on.
Disadvantages:Product and service availability may be limited in someareas and may increase lead mes; Increased learningcurve may increase costs; Requires more e ort/inputfrom owners.
References:IHG Procurement Policy
The IHG business code of conduct and suppor ngpolicies on Merlin
Other Relevant Action Groups:O-02, G-04, P-01
O-07Sustainable Terms and Conditions with Business Partners
IHG Green Engage/Solutions NH EH
Credited Actions
1 Sustainable Terms and Condi ons forBusiness PartnersCreate sample language to include incontracts, review contracts & documentsfor opportuni es to include sustainablemeasures
1 Encourage Product Innova onImplement policy of collabora ngwith manufacturers to develop moresustainable product
1 Cost/E ciency Op misa on BundleSustainable product purchases for costand quality control
Total Available Points 3 3
9 Green Engage/SolutionsIssued on February 1, 2011
Action Group Impact:Energy
Waste
Water
Carbon
A ordabilityConsumer
Minor Major
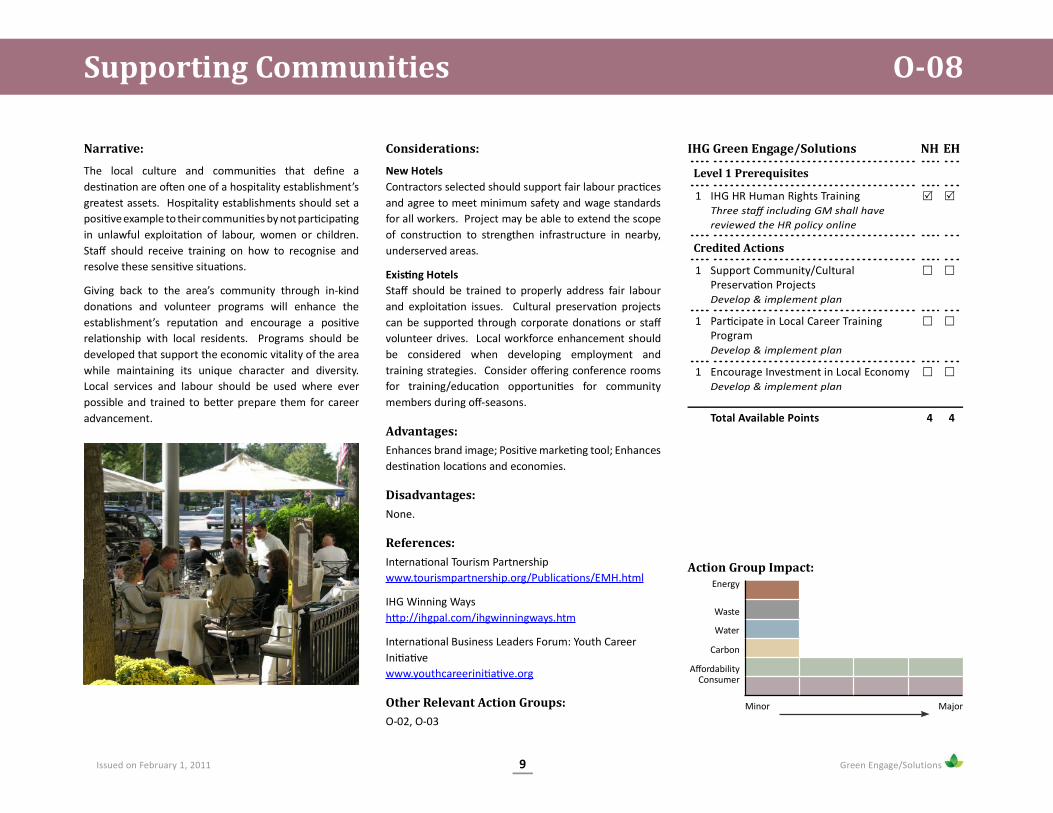
O-08Supporting Communities
IHG Green Engage/Solutions NH EH
Level 1 Prerequisites
1 IHG HR Human Rights TrainingThree sta including GM shall havereviewed the HR policy online
Credited Actions
1 Support Community/CulturalPreserva on ProjectsDevelop & implement plan
1 Par cipate in Local Career TrainingProgramDevelop & implement plan
1 Encourage Investment in Local EconomyDevelop & implement plan
Total Available Points 4 4
Narrative:
The local culture and communi es that de ne ades na on are o en one of a hospitality establishment’sgreatest assets. Hospitality establishments should set aposi ve example to their communi es by not par cipa ngin unlawful exploita on of labour, women or children.Sta should receive training on how to recognise andresolve these sensi ve situa ons.
Giving back to the area’s community through in-kinddona ons and volunteer programs will enhance theestablishment’s reputa on and encourage a posi verela onship with local residents. Programs should bedeveloped that support the economic vitality of the areawhile maintaining its unique character and diversity.Local services and labour should be used where everpossible and trained to be er prepare them for careeradvancement.
Considerations:
New HotelsContractors selected should support fair labour prac cesand agree to meet minimum safety and wage standardsfor all workers. Project may be able to extend the scopeof construc on to strengthen infrastructure in nearby,underserved areas.
Exis ng HotelsSta should be trained to properly address fair labourand exploita on issues. Cultural preserva on projectscan be supported through corporate dona ons or stavolunteer drives. Local workforce enhancement shouldbe considered when developing employment andtraining strategies. Consider o ering conference roomsfor training/educa on opportuni es for communitymembers during o -seasons.
Advantages:Enhances brand image; Posi ve marke ng tool; Enhancesdes na on loca ons and economies.
Disadvantages:None.
References:Interna onal Tourism Partnershipwww.tourismpartnership.org/Publica ons/EMH.html
IHG Winning Waysh p://ihgpal.com/ihgwinningways.htm
Interna onal Business Leaders Forum: Youth CareerIni a vewww.youthcareerini a ve.org
Other Relevant Action Groups:O-02, O-03

10 Green Engage/SolutionsIssued on February 1, 2011
Action Group Impact:Energy
Waste
Water
Carbon
A ordability
Consumer
Minor Major
O-09On-site Hazard/Environmental Impact Analysis
IHG Green Engage/Solutions NH EH
Level 1 Prerequisites
1 Hazardous Material AuditAudit all chemicals used at the hotelfacility and current disposal procedures
1 Appropriate Segrega on, Storage andDisposal of Hazardous MaterialsProvide appropriate and segregatedstorage for hazardous materials, Use ahazardous waste materials contractor todispose of hazardous waste.
Total Available Points 2 2
Narrative:
A hazardous waste audit tracks the amount of hazardouswaste generated, increases the safety of personnel andensures the Hotel’s compliance with environmentalregula ons. A manifest sheet describes the types ofhazardous waste located at the facility.
The hazardous chemicals must be labelled and storedin areas separa ng corrosive, ammable and acidicsubstances. Containers should be properly sealed andprevent of any releases. Material Safety Data Sheets(MSDS) should be available for any hazardous substancelocated in the vicinity of the chemicals. An appropriatecollec on company, hauler and disposal facility mustbe proposed with chain of custody form included. Landdisposal of hazardous chemicals should be prohibited.
Considerations:
New HotelsAny paints, paint thinners, oils, cleaning products(excluding “green” cleaning products, ba eries,pes cides, herbicides, fungicides, uorescent lights, lightballasts and anything else considered hazardous shouldbe considered hazardous waste and properly stored.
Exis ng HotelsAny chemicals stored and/or used should be properlylabelled and documented. See New Hotels.
Advantages:Reduce expenses associated with storage, pickup anddisposal of hazardous waste; Reduce possibility ofaccident.
Disadvantages:Costs of disposing/recycling hazardous waste isexpensive.
References:US EPA: Reducing Risk from Wastewww.epa.gov/epawaste/inforesources/pubs/trifold.pdf
ECHA website - European Chemicals Agencyh p://echa.europa.eu/
Other Relevant Action Groups:O-04, W-08, P-01, P-02

11 Green Engage/SolutionsIssued on February 1, 2011
E-01 O&M Best Management Prac ces (BMPs)
E-02 Energy Metering and Sub-Metering
E-03 Energy Performance Benchmarking
E-04 Building Energy System Commissioning
E-05 Building Management System (BMS)
E-06 Guest Room Master Switching
E-07 Energy E cient Appliances
E-08 Hot Water Contribu on to Energy Reduc on
E-09 Energy E cient Ligh ng
E-10 Ligh ng System Controls
E-11 Reduce Light Pollu on
E-12 Low Energy Systems
Electrical consump on is one of the most costlyaspects of hotel management from both a nancialand environmental standpoint. With careful design,it is possible to minimise this load without diminishingthe well being of guests and sta . This can be achievedthrough the use of:
• E cient ligh ng design
• Energy saving products
• On-site power genera on
• E ec ve energy controls and management
Coordinated electrical design should be pursued forhotels. Use of energy e cient products, ligh ng controlsystems, dayligh ng, and renewable energy can allcontribute. The building should be commissioned andon-site power genera on should be researched to see ifit is applicable to the project. Good electrical and ligh ngprac ces can save money, provide a more comfortableenvironment for guests, and reduce carbon emissions.
Energy E-01 to E-12

12 Green Engage/SolutionsIssued on February 1, 2011
Action Group Impact:Energy
Waste
Water
Carbon
A ordability
Consumer
Minor Major
IHG Green Engage/Solutions NH EH
Level 1 Prerequisites
1 Adopt IHG Energy BMPs Document
1 Develop Sequence of Opera ons
1 Develop Building Opera ng Plan
1 Develop Systems Narra ve
1 Preventa ve MaintenanceComplete and document quarterly QCpreventa ve maintenance inspec on
Total Available Points 5 5
LEED® EAp1
E-01O&M Best Management Practices (BMPs)
Narrative:
The energy e ciency of a building is dependant notonly on the various mechanical and electrical systemsthat are in place, but how these systems are used bythe occupants. Improving building systems opera ons iso en a fast, low-cost way to signi cantly reduce energyconsump on. Development of a sequence of opera onsand building opera ng plan forces hotel operators todescribe and understand how various systems work andinteract. Combined with a preventa ve maintenanceprogram, this ensures than systems are opera ng theway they were designed to and allows poten al problemsand ine ciencies to be iden ed and corrected.
IHG’s Energy Best Management Prac ces (BMPs)Document contains a comprehensive list of strategies forimproving opera onal energy e ciency.
Considerations:
New HotelsA sequence of opera ons and building opera ng planare developed during construc on documenta on, andshould be stored and understood by hotel management.The preventa ve maintenance program should beadopted as soon as the hotel is occupied.
Exis ng HotelsIf the hotel does not have a sequence of opera ons,building opera ng plan, or systems narra ve, these canbe dra ed using the templates below.
Advantages:Poten ally large energy savings for li le capitalinvestment; Improved understanding of the buildingsystems can improve condi ons for workers and guests;Preventa ve maintenance reduces cost and down meassociated with the failure of mechanical and electricalequipment.
Disadvantages:Development of new plans is me intensive and mayrequire training or assistance from an engineer.
References:IHG Energy BMPs Document
Sample Sequence of Opera ons Document
Sample Building Opera ng Plan
Sample Systems Narra ve
Other Relevant Action Groups:E-04

13 Green Engage/SolutionsIssued on February 1, 2011
Action Group Impact:Energy
Waste
WaterCarbon
A ordability
Consumer
Minor Major
Narrative:
Metering equipment and other consump onmeasurement procedures should be used to quan fysystem performance and energy. Hotels shall be requiredto keep accurate documented records and measurementsof all energy consump on.
The metering procedures also enable veri ca on of theperformance of credited ac ons over me to ensuresavings are maintained. Results can be used to tunebuilding systems for improved con nuous performanceand to assist in energy use evalua on for future hotels.Sites can be compared against each other to iden fy thee ec veness of credited ac ons implemented at onehotel versus another.
Sub-metering can be installed for ligh ng, boilers, steam,gas, power, water piping and other u li es.
Considerations:New HotelsThe hotel owner needs to decide what to do with themetering data before installa on. A meter at the sourcelevel (a meter for the en re building from the u lity)should always be installed. Feedback on energy andwater usage should be provided through the Hotel’sGreen Engage program. Meters should be installed for alife me above 20 years.
Exis ng HotelsIn exis ng hotels, iden fying and targe ng areas of highconsump on and greatest poten al for energy savingswill reduce costs of a new metering system. Exis ngmeters shall be regularly checked to ensure calibra onwithin manufacturer’s tolerances and intervals. Thisdata shall be entered into an online monitoring andcalcula on tool via Green Measure which shall produceoutputs that allow the hotel to assess its performanceagainst previous years and compare performance with
other hotels. Hotels shall be required to keep accuratedocumented records and measurements of all energyconsump on for a minimum of ve years for veri ca onof past online entries.
All installed meters must be calibrated to manufacturer’srequirements and be included as part of a documentedequipment maintenance schedule. Other fuelmeasurement procedures such as dips ck measurementfrom fuel oil tanks should have a brief method statementdescribing how values (e.g. volumes) are calculated andthe proposed program of intervals between readings.
Advantages:Long term energy and water savings; Opera ons andmaintenance trouble shoo ng; Iden fy problemsbefore failure and down me; Provides data source fordecision making; Iden fy peak shaving opportuni es;Enables performance contrac ng; Measurement andveri ca on.
Disadvantages:Added capital cost; Time required for record keepingand data entry. Requires advanced training or outsidecontracts for data interpreta on if feeding back to acentral system.
References:Interna onal Performance Measurement & Veri ca onProtocol (IPMVP) Volume III: Concepts and Op ons forDetermining Energy Savings in New Construc on, April,2003
Other Relevant Action Groups:E-03, E-05, W-02, G-01
IHG Green Engage/Solutions NH EH
Level 1 Prerequisites
1 Meter Whole Building Energy UseInstall meters for all energy u li esand ensure all meters are calibrated tomanufacturer’s recommenda ons
1 Enrol In Green MeasureBegin uploading monthly u lity data toGreen Measure and keep documenta onrecords of all fuel bills, measurementcalcula ons and deliveries.
1 Par cipate in Green MeasureUpload a minimum of 12 months ofu lity data to Green Measure and keepdocumenta on records of all fuel bills,measurement calcula ons and deliveries
Credited Actions
1 Provide Sub-Meters for each Zone
1 Provide Sub-Meters on 10% Sample ofIndividual Zones
1 Provide Sub-Meters on 20% Sample ofIndividual Zones
Total Available Points 5 5
LEED® EAp2, EAc1 & EAc3.2
E-02Energy Metering and Sub-Metering

14 Green Engage/SolutionsIssued on February 1, 2011
Narrative:Hotel energy management is about tracking energyperformance and iden fying opportuni es forimprovement. This relates not only to past performancebut also how current performance compares with otherbuildings of a similar type. A concise and standardizedsystem of energy monitoring and performance evalua onis important to allow this to happen.
Many of the systems designed into a project o er asigni cant return on investment; however, this canonly be ensured if the systems are being monitored foracceptable performance. Environmental targets shouldbe clearly detailed in an Environmental ManagementPlan. Correc ve ac ons should be developed for sta tofollow when targets or benchmarks are not met.
Projects should be metered to allow for isola on ofsystem performance. Facili es managers should developmonitoring plans that include performance comparisonsagainst projected savings and/or similar building typedatabases. When goals are not met, measurable shortand long term targets for improvement should beestablished.
There are many areas with environmental standards wellbelow others. If developing projects in one of these areasmanagers should work with IHG and the local communityto improve environmental standards in the local area.
Considerations:New HotelsSet performance benchmarks during design usingexpecta ons from energy models or building databases.This may be done by using energy models to calculatepredicted energy performance and then comparingthis with a baseline building’s energy performance tothe latest version of ASHRAE 90.1 (2007) Appendix Gstandards. The energy improvement of the proposedbuilding against the baseline building can be used tocalculate achievement of minimum performance targets.
Upon comple on and occupancy, monitoring plans andenrolment in the Green Measure online system will helpdetermine if projects are mee ng these goals. Designingbuilding management systems or system sub-meteringwill assist data collec on.
Exis ng HotelsMetered and measured energy consump on data shallbe entered into Green Measure, which benchmarks thisdata against hotels across the IHG por olio and calculateswhether the hotel meets Green Engage/Solu ons’sminimum performance requirements. It also allowsmanagers to track performance against a number ofother parameters including historical trends and energyconsumed per guest night.
Hotels that do not meet the minimum requirements mayconsider implemen ng other Green Engage/Solu onsac on groups to improve performance. These mayinclude capital improvements outlined in the Energy,Building Envelope or Mechanical sec ons, or opera onalimprovements found in the Opera ons & Processessec on.
Advantages:Decreased opera ng costs; Increased performance/longevity of equipment.
Disadvantages:Increased costs of metering equipment.
References:IHG CSR in a boxh p://eetdnews.lbl.gov/nl10/IPMVP.html
Other Relevant Action Groups:E-02
E-03Energy Performance BenchmarkingIHG Green Engage/Solutions NH EH
Level 2 Prerequisite
1 Meet Minimum Energy PerformanceRequirementsMeet minimum requirement as calculatedusing online tool through Green Measureor through energy modelling at designstage.
Credited Actions
1 Collec on and Use of Meter Informa onAgainst Na onal Databases and OtherHotelsResearch relevant databases, comparebuilding performance annually andpresent results to IHG.
1 Exceed Minimum Energy PerformanceRequirementsExceed minimum requirement ascalculated using online tool throughGreen Measure or through energymodelling at design stage for new hotels.
Total Available Points 3 3
LEED® EAp2 & EAc1
Action Group Impact:Energy
Waste
Water
Carbon
A ordability
Consumer
Minor Major

15 Green Engage/SolutionsIssued on February 1, 2011
Action Group Impact:Energy
Waste
Water
Carbon
A ordability
Consumer
Minor Major
IHG Green Engage/Solutions NH EH
Level 2 Prerequisites
1 Commissioning PlanAdopt plan for commissioning, retro-commissioning or recommissioning
Credited Actions1 Conduct Energy Audit
Have a third party conduct an energyaudit of the hotel, including a siteassessment and energy breakdown.
1 Perform CommissioningPerform commissioning of new hotel priorto occupancy, and of exis ng hotel atleast every three years.
1 Start Commissioning in Mid-Design Phase
Total Available Points 4 3
Narrative:
The commissioning process is a series of steps thatoccur during both the design and construc on life of abuilding and even following occupancy. The aim of thisprocess is to ensure rstly that buildings are designedin a way that enables them to be commissionable andmeet the building owner’s requirements for the building.Addi onally, commissioning ensures that a buildingsenergy consuming systems are purchased, installed andare opera ng as the designer intended them to. Thecommissioning process can have a signi cant impact onthe whole life energy of a building. The embodied energyassociated with construc ng a building are small whencompared with the opera onal energy and embodiedenergy required to replace, upgrade and modify interiorsof buildings throughout their life. This is par cularlyrelevant to hotel resorts because they undergo re- tsapproximately every eight years, due to con nued wearon the building interiors.
Implemen ng commissioning steps into the early stagesof a hotel life can iden fy and prevent energy waste overthe remainder of its life.
Considerations:New HotelsConsidera on should be given to the ming ofcommissioning in construc on. Commissioning realisesgreatest savings and catches the most system de ciencieswhen the process is started early. NOTE: The LEED ra ngsystem has speci c requirements for commissioningwhich are me sensi ve star ng in mid design.
Exis ng HotelsRetro-commissioning can provide immense savings forexis ng facili es whether construc on, renova ons orupgrades are scheduled. Once retro-commissioning hasbeen complete, the resul ng documenta on can be usedannually to re-check systems performance and con nuedsavings and e cient opera on.
Advantages:Energy savings or preventa ve energy losses; Reduc onin maintenance or replacement costs; Baselinedocumenta on for building opera on.
Disadvantages:Addi onal cost for third party commissioning agent;Percep on the commissioning is di cult and hard toschedule.
References:Building Commissioning Associa onwww.bcxa.org
ASHRAE Procedures for Commercial Building EnergyAuditswww.ashrae.org
Other Relevant Action Groups:E-01
E-04Building Energy System Commissioning

16 Green Engage/SolutionsIssued on February 1, 2011
Action Group Impact:Energy
Waste
Water
Carbon
A ordability
Consumer
Minor Major
Narrative:
Building Management Systems (BMSs) are commonlyemployed in modern hotels to allow centralizedmonitoring and control of the building’s mechanical andelectrical systems. Sensors and actuators are incorporatedinto the ven la on, ligh ng, power, hea ng, cooling, hotwater, security and re systems and linked to a centralizedcomputer. From there, so ware programs are used tomonitor and control the systems according to the desiredparameters . This Direct Digital Control (DDC) technologyenables building management systems to co-operate onprogrammed schedules and to use weather condi ons topredica vely maintain desired thermal comfort, ligh ng,and services ( re, security, etc) while minimising energyconsump on. DDC can alert sta to faulty equipmentor out-of-tolerance condi ons with the use of systemalarms allowing maintenance work to be carried outbefore any serious guest disrup on or remedial costsoccur. Alterna vely, stand alone controllers have limitedinterconnec vity and control exibility.
Considerations:New HotelsA system can be installed in hotels to recognise whenguests leave their room and save energy during these mes. A central monitoring system can be installed
as stand alone on a room by room basis, but are moree ec ve, par cularly for larger hotels, when theyreport back to a central loca on. This can enable stato monitor the status of rooms including occupancy,energy consump on, maintenance issues (such as faultyequipment), security issues and can be used to generatetrends of room usage sta s cs that can be useful in futureplanning for housekeeping, maintenance and other sta .Automated adjustments could be made for hea ng andcooling when guests check in and out.
Exis ng HotelsWireless BMS systems are available for installa on onselec ve equipment at exis ng facili es. These systemsare expensive to install but exible.
Advantages:Can save a signi cant amount of energy (greater than20%); Allows for trending and long term monitoring ofhotel use which can assist in planning for maintenance,future expansion and reducing costs; Maintains op mumenvironment for guests; Wireless systems can be used in exible conference rooms/exhibi on halls.
Disadvantages:Cost premium depending on the level of sophis ca on;Maintenance sta may be hesitant to adopt system;Mo on sensors may be perceived as invasive by guests.
References:Inncom Interna onalwww.inncom.com
DBS Lodging Technologies, LLC: Entergizewww.entergize.net/index.php
Minxon Hotel Technology Inc.www.minxon.us
LTC Enterprises, LLCwww.lodgingtechnology.com
Other Relevant Action Groups:E-02, E-06, M-10
E-05Building Management System (BMS)
IHG Green Engage/Solutions NH EH
Level 2 Prerequisites1 Install Central Building Management
System (BMS)
1 Monitor BMSProduce quarterly reports to ensure BMSand connected systems are performingcorrectly
Credited Actions1 Install Central Building Management
System (BMS)
1 Monitor BMSProduce quarterly reports to ensure BMSand connected systems are performingcorrectly
1 Connect Primary Meters to BMS
1 Connect Sub-Meters to BMS
Total Available Points 4 4

17 Green Engage/SolutionsIssued on February 1, 2011
Action Group Impact:Energy
Waste
Water
Carbon
A ordabilityConsumer
Minor Major
Narrative:
Popular in Europe and Asia, these systems are nowstar ng to appear in the US market. The systems recognisewhen guests leave their rooms and save energy duringthese mes. The system can detect “Occupied” and“Unoccupied” modes by using either mo on detectors ora key card holder at the door that the guests leave theirkeys in when they are in the room.
The following sequence of opera ons could be applicabledependant on how advanced the installed guest roomcontrol system is.
• Guest removes card and exits room or is no longerdetected by mo on sensor.
• A er a prede ned period (eg 1 minute), room goes into“Unoccupied” mode.
• Electrical outlets power down with the excep on ofone or two designated for charging guest laptops, mobilephones, etc.
• Ligh ng turns o which saves electrical power and alsoreduces unwanted heat in the room.
• Curtains could close to cut out solar gains hea ng upthe room.
• HVAC either turns o or sets back the temperaturecontrol of the room. Outdoor air temperature sensorscan be used to help make this decision.
• Outside air ow to the room and exhaust air ow fromthe bathroom can damper down.
• No ca on of empty room goes back to centralsystem.
• Display outside of door can no fy housekeeping stathat the room is now unoccupied if desired.
• When guest returns, the opposite happens.
These systems can be installed as stand alone on a roomby room basis, but are more e ec ve, par cularly forlarger hotels, when they report back to a central loca on.This can enable sta to monitor the status of roomsincluding occupancy, energy consump on, maintenanceissues (such as faulty equipment), and can be used togenerate trends of room usage sta s cs that can beuseful in future planning for housekeeping, maintenanceand other sta .
Considerations:New HotelsThe e ciency of the system is maximised by linking it toligh ng, electrical, HVAC and metering systems.
Exis ng HotelsAs this links with so many systems, it is most easilyimplemented early in the design phase and may bedi cult to retro t to exis ng hotels.
Advantages:Can save a signi cant amount of energy – some sourcessay this could be in excess of 20%; Allows for trendingand long term monitoring of hotel use which can assist inplanning for maintenance and reducing costs.
Disadvantages:Cost premium – somewhere in the order of $400 perroom depending on the level of sophis ca on; Mo onsensors may be perceived as invasive by guests.
E-06Guest Room Master Switching
IHG Green Engage/Solutions NH EH
Level 2 Prerequisite
1 Provide Guest Room Master SwitchingFor at least 20% of guest rooms
Credited Actions
1 Provide Guest Room Master SwitchingFor at least 20% of guest rooms
1 Connect Guest Room Master Switchingto BMS
1 Trend and Report Informa on fromSystem Monthly
Total Available Points 3 3
References:Inncom Interna onalwww.inncom.com
DBS Lodging Technologieswww.entergize.net/index.php
LTC Enterprises, LLCwww.lodgingtechnology.com
Other Relevant Action Groups:E-05, E-10
18 Green Engage/SolutionsIssued on February 1, 2011
Action Group Impact:Energy
Waste
Water
Carbon
A ordability
Consumer
Minor Major
IHG Green Engage/Solutions NH EH
Level 1 Prerequisites
1 Energy E cient AppliancesAll appliances outside of guest rooms(dishwashers, dryers, etc) shall be EnergyStar, EU Energy Label A, or the equivalentlocal standard, rated
1 Energy E cient TelevisionsAll televisions shall be Energy Star, EUEnergy Label A, or the equivalent localstandard, rated
1 Energy E cient Guest Room RefrigeratorsAll guest room refrigerators shall beEnergy Star, EU Energy Label A, or theequivalent local standard, rated
Total Available Points 3 3
Narrative:
Energy e cient products use less energy and water, savemoney, and help protect the environment. The US EPAcer es energy e cient products with the Energy Starlabel. Products in more than 50 categories are eligible forEnergy Star, the full list is at EPA’s Energy Star website.Other regions use their own standard for energy e cientproducts including Australia and Europe.
Considerations:New Hotels
For the hotel, energy e cient dishwashers, clotheswashers, dryers, ice machines, refrigerators, watercoolers, freezers, ovens, computers, copier/fax machines,vending machines, exit signs, roof products, furnaces,heat pumps, boilers and central air condi oners could beinstalled.
Guest rooms could include energy e cient clock radios,ceiling fans, televisions, DVD players, refrigerators, androom air condi oners.
Exis ng HotelsMany of the exis ng appliances and products throughoutthe hotel could be upgraded to energy e cient appliancesand products.
Advantages:
Reduces energy cost and natural resources; Increasesguest sa sfac on; Can save 5-15% depending on whatappliances are used and the program of the hotel.
Disadvantages:In some markets availability may not be able to meetdemand, this could have schedule impacts.
References:US EPA: Energy Starwww.energystar.gov
US EPA: Energy Star Interna onal Partnerswww.energystar.gov/index.cfm?c=partners.intl_implementa on
Europe's Energy Portal: EU Energy Labelh p://www.energy.eu/focus/energy-label.php
Other Relevant Action Groups:W-04
E-07Energy Ef icient Appliances

19 Green Engage/SolutionsIssued on February 1, 2011
Action Group Impact:Energy
Waste
Water
Carbon
A ordability
Consumer
Minor Major
Narrative:
Pipe insula on reduces heat loss or heat gain in pipes.
Solar thermal captures the suns energy for use in spacehea ng and domes c hot water. Low, medium and hightemperature systems can be selected to meet the end-use requirements. Boilers should operate with electroniccontrol systems monitoring oxygen to minimise excessair. Wherever possible traps shall be purchased withinthe steam-using devices, with all other traps and drip legtraps provided as necessary in the piping design. Watercooling chillers reject heat (compressor heat) through itscooling towers. The heat could be recovered and usedfor domes c hot water, which could poten ally leadto energy savings. Two types of chiller heat recoveryunits are condensers (single and split) and templi ers.A single condenser heat recovery chiller is selectedto operate exi ng contender water at 105°F - 110°F.Split loop units use one loop to reject heat to a coolingtower, while the other loop is used to collect heat for thebuilding. Templi ers can recover low grade heat from thecondenser (centrifugal or reciproca ng compressor) andconvert it to high grade heat (140°F - 160°F).
Considerations:New HotelsUse insula on wrap, breglass insula on strips, orpolyethylene or neoprene foam pipe sleeves aroundpipes. Blowdown heat recovery systems should beconsidered to improve boiler e ciency. Solar collectorsshould be south facing and inclined to the azimuthangle of the site. O en these sigh ng condi ons canbe ful lled in a loca on that is also prominently visible.Heat recovery is recommended for buildings (especiallyhotels) with balanced cooling and heat loads (24 hour hotwater buildings, total installed heat rejec on capacity ofwater-cooled systems exceeds 6 million Btu/h and designservice water hea ng load exceeds 1 million Btu/h).
Exis ng HotelsReplacing or upgrading an exis ng boiler is a cost e ec vemeasure to reducing water hea ng costs. Repairing leaks,installa on of blowdown heat recovery systems andinsula ng the boilers are other e ciency improvementmeasures. Heat recovery units could be retro ed.
Advantages:Pipe insula on signi cantly reduces hea ng and coolingcosts; E cient boiler controls can reduce both energyand water consump on; Solar thermal is an a ordable,e cient renewable technology which requires minimalmaintenance and can replace or reduce the need forboiler or water heaters; Chiller heat recovery saveshea ng energy and can be ed onto exis ng watercooled chiller plants.
Disadvantages:
Solar thermal requires roof area and has a cost premium(incen ves are usually available); Chiller heat recoveryincreases complexity in chiller and increases cost; Whenrecovering heat, the chiller’s performance may decrease.
References:Thermomaxwww.thermomax-group.com
Ronald E. Jarnagin: Heat Recovery From Air Condi oningUnitswww.p2pays.org/ref%5C08/07362.pdf
ASHRAE: Chiller Heat Recovery Guidewww.ashrae.org
Other Relevant Action Groups:M-08, W-04
E-08Hot Water Contribution to Energy Reduction
IHG Green Engage/Solu ons NH EH
Level 1 Prerequisite
1 Pipe Insula onInsulate all hot and chilled water pipes
Level 2 Prerequisite1 Pipe Insula on
Insulate all hot and chilled water pipes
1 Boiler E ciencyInstall an electronic control system
Credited Actions1 Boiler E ciency
Install an electronic control system
1 Solar ThermalA minimum of 20% of hot water demandfrom solar thermal unit
1 Chiller Heat Recovery for Domes c HotWater UseInstall chiller heat recovery units fordomes c water if applicable
Total Available Points 4 4

20 Green Engage/SolutionsIssued on February 1, 2011
Action Group Impact:Energy
Waste
Water
Carbon
A ordability
Consumer
Minor Major
Narrative:
Compact Fluorescent Lights (CFLs) are about 60%more e cient than the standard incandescent bulbsand available in a variety of shapes, sizes, and colourtemperatures to suit di erent applica ons. The overallquality of CFLs has also increased: however, special careshould be taken when selec ng CFLs as the quality andperformance varies. Like linear uorescent, CFLs haveballasts and while they are predominantly non-dimmableballasts, dimmable CFLs are also available. Op mised xture design, u lising a good balance of upligh ng
and downligh ng, is important to eliminate glare andenhance visual acuity.
A smaller version of the compact uorescent, cold cathodeCFLs are becoming more popular for accent ligh ng andelevator ligh ng in many hotels. They do not work wellfor general illumina on, but have very low e cacies andcome in a number of di erent colours.
There are many di erent incen ves for CFLs in newand retro t applica ons and they vary widely by state.Federal incen ves and tax credits are also available. Formore informa on visit: www.dsireusa.org.
LEDs boast e ciencies exceeding those of CFLs, howeverat present are not su ciently a ordable or exible inuse to jus fy general use. However, they are suitable ininstances such as exit ligh ng and reading lamps.
Considerations:New HotelsThe low capital costs and energy savings produced byCFLs jus fy their installa on for all general ligh ng. LEDsshould be considered for exit signs and other specialiseduses. Individual task ligh ng, either CFLs or LEDs, can alsobe used to supplement the ambient ligh ng. Ligh ng
power densi es can be further reduced through e cient xture design and u lisa on of natural ligh ng.
Exis ng HotelsAll incandescent bulbs should be replaced with CFLs.Fixture design should be reevaluated in all refurbishmentsto maximise the overall ligh ng e ciency.
Advantages:Fluorescent lights have longer life than standardincandescent bulbs (approximately 15,000 hours);Available in all sorts of shapes, sizes, colour temperatures,and dimming applica ons; Low capital costs and veryshort payback (typically less than 2 years); Op mised xture design can improve indoor environmental quality.
Disadvantages:Higher costs than standard incandescent and very highcost for dimming applica ons; CFLs contain mercury, ahazardous material.
References:US EPA: Energy Starwww.energystar.gov
The General Electric Companywww.geligh ng.com
The Illumina ng Engineering Societywww.iesna.org
Other Relevant Action Groups:E-10, E-11
E-09Energy Ef icient Lighting
IHG Green Engage/Solutions NH EH
Level 1 Prerequisites
1 Zero Use of Incandescent Lamps in GuestRooms
1 Zero Use of Incandescent Lamps inCircula on Spaces
1 Zero Use of Incandescent Lamps in Backof House Spaces
Level 2 Prerequisite
1 Reduce Ligh ng Power Densi esMaximum 9 W/m2 in Guest Rooms
Credited Actions
1 Reduce Ligh ng Power Densi esMaximum 9 W/m2 in Guest Rooms
1 High Performance Ligh ngUse LED or other high performance light ngs in guest rooms.
Total Available Points 5 5

21 Green Engage/SolutionsIssued on February 1, 2011
Action Group Impact:Energy
Waste
WaterCarbon
A ordabilityConsumer
Minor Major
IHG Green Engage/Solutions NH EH
Level 1 Prerequisites
1 Occupancy Sensors in Corridors forDecora ve FixturesProvide occupancy sensors for ligh ngcontrol in all corridors
1 Occupancy Sensors in O cesProvide occupancy sensors for ligh ngcontrol in all o ces
Level 2 Prerequisite
1 Occupancy Sensors in O cesProvide occupancy sensors for ligh ngcontrol in all o ces
Credited Actions
1 Install Daylight Sensors in all PublicSpaces
1 Connect Daylight Sensors toGuest Room Master SwitchingInclude a daylight override in masterswitching system
1 Allow Daylight Sensors to ControlPerimeter Shades in Public Spaces
1 Occupancy Sensors in Mul -OccupancySpacesProvide occupancy sensors for ligh ngcontrol in all mul - occupancy spaces
Total Available Points 6 6
Narrative:
Hotels typically waste signi cant energy unnecessarilyligh ng areas that either are already receiving adequatenatural daylight or are unoccupied. The installa onof daylight occupancy and sensors and controls caneliminate this wastage and reduce hotel opera ng costs.
Dayligh ng controls should be integrated with a buildingenvelope design that maximises dayligh ng. Thesesystems are used to reduce ar cial ligh ng levels whenadequate dayligh ng is available, through either on-oor dimming control of perimeter lights.
Occupancy sensors can also be used to automa cally shuto ligh ng to unoccupied spaces. These controls arepar cularly e ec ve for hotels, which typically have highspace occupancy diversity as people travel between theirrooms and various ac vi es. Occupancy sensors can beused in conjunc on with manual overrides to provide forhigh occupant control while maintaining a high degree ofenergy e ciency
Considerations:New HotelsThe use of photosensors in perimeter public spaceswill automa cally adjust light levels and reduce energyconsump on, but dimming controls and ballasts aremore expensive and will o en double the cost of theballast compared to a conven onal system. Simple on-o systems typically have a be er rate of return thandimming systems.
Layout and coverage pa ern are cri cal to properoccupancy control system func onality. A combina on ofscheduling devices and occupancy sensors can be usedto e ec vely limit the number of lights on a er regularlyoccupied hours in o ce and mul -occupancy spaces.
Types of occupancy sensors available including infrared,ultra-sonic, radio frequency, and dual technologies.
Exis ng HotelsDaylight controls are best used on the perimeter of ahotel near windows. Both dayligh ng and occupancycontrols may be incorporated into exis ng systems butcan have a higher cost and increase system complexity.
Advantages:Signi cant energy savings by reducing ar cial ligh nglevels, o en with a high return on investment; Moreuniform illumina on level; Reduced cooling load due toar cial light reduc on.
Disadvantages:Require proper placement of sensors and maintenance ofsystems to ensure lights do not switch o when daylightlevels are too low or when a space is occupied.
References:The Illumina ng Engineering Societywww.iesna.org
Lutron Electronics Company, Incwww.lutron.com
Legrand: Wa Stopperwww.wa stopper.com
Other Relevant Action Groups:
E-09, E-11, B-01, M-10
E-10Lighting Systems Controls

22 Green Engage/SolutionsIssued on February 1, 2011
Action Group Impact:Energy
Waste
Water
Carbon
A ordability
Consumer
Minor Major
IHG Green Engage/Solutions NH EH
Level 1 Prerequisite
1 Timing Controls on all Up and FacadeLigh ngShut the up and facade lights o betweenthe hours of 2am and 6am
Credited Actions
1 Timing Controls on all Up and FacadeLigh ngShut the up and facade lights o betweenthe hours of 2am and 6am
1 Install Full Cut-O Luminaires
Total Available Points 2 2
Narrative:
Light pollu on is the result of excessive and ine cientuse of ar cial ligh ng. Forms of pollu on include lighttrespass, over-illumina on, glare, and sky glow. One ofthe main causes of light pollu on is over-illumina on.For this reason, exterior illuminance levels should bedesigned to the IESNA standards. Up to 30-40% ofexterior light might be cast into the night sky or o yoursite boundary.
The selec on of full cut o xtures prevents light beingunnecessarily emi ed above the horizontal plane. Thiselimina on of direct glare will improve site security byimproving visual acuity. In addi on to proper illuminanceligh ng controls should be u lised to ensure interiorligh ng is not on during unoccupied hours, allowing lightfrom windows to trespass beyond the building’s site.
Proper design could allow for the use of lower wa agelamps to produce the desired illumina on level.
Considerations:New HotelsDesign teams should consider the reduc on of thedensity of facade ligh ng, “Up” ligh ng landscaping andexcessive parking ligh ng. A simple strategy is to haveuse low intensity light sources and closer intervals tomost accurately direct the illumina on in the requiredarea. This strategy will both reduce the amount of energyconsumed for unnecessary light and reduce the amountof light trespass on to adjacent proper es
Exis ng HotelsThe removal and reloca on of permanent exteriorluminaires can be costly and should deferred un l acomplete renova on is scheduled. Operators shouldhowever, consider a power density calcula on to iden fy
opportuni es for energy savings and the reduc onof light trespass. For most exis ng hotels, signi cantsavings can be found in relamping xtures from a 400Wto a 250W High Pressure Sodium (PS) or Metal Halide(MH) with a ec ng safety or security.
Advantages:Energy savings from elimina ng wasted light that doesnot serve the useful purpose intended.
Disadvantages:A common misconcep on is that if the light source is notvisible, the area is not bright enough for the intendedtask. Ligh ng design must balance measured results withpercep on.
References:The Illumina ng Engineering Society of North Americawww.iesna.org
Other Relevant Action Groups:E-9, E-10
E-11Reduce Light Pollution

23 Green Engage/SolutionsIssued on February 1, 2011
Narrative:Alterna ve/renewable energy is non-tradi onal fuelsources (tradi onal fuel = coal, oil, etc) that do not useup natural resources. Tradi onal alterna ve fuels for abuilding are wind, solar, biomass and geothermal.
Solar power uses the sun’s direct and di use radia onto ac vely generate electricity by means of photovoltaic(PV) cell. The three main types of PV cells currently inuse are Monocrystalline, (presently most e cient),polycrystalline and thin lm (cheapest but least e cient).PVs have been developed to integrate into buildings(BIPV) and some thin lm PVs are translucent and couldact as windows, while also genera ng energy.
Wind power can be generated using small horizontal orver cal axis wind turbines, which can be integrated intothe hotel structure or located elsewhere on the site.Wind turbines are only feasible on sites with signi cantwind resources, and operate at much lower e ciency inurban se ngs.
A geothermal power system o ers the opportunity touse the Earth’s natural thermal energy, stored in hot ormolten rock several kilometres below the surface, togenerate heat and or electricity.
Cogenera on (cogen) is the simultaneous produc onof heat and power from one fuel source. Electricity isgenerated by an engine spinning a generator. Wasteheat from the engine is captured and used to heat water.Depending on the system u lised, the e ciency ofgenera on may range from 24% to 40%. A er waste heat
is captured, the total e ciency of the process may rangefrom 50% to 70% or greater. The goal of cogenera on isto produce electricity and heat at a lower cost per unitand carbon footprint than can be achieved by purchasingelectricity and natural gas respec vely.
Biomass encompasses an array of fuels including,plant ma er, organic waste and sewage. Unlike manyrenewable energy technologies, biomass energy can bestored and consumed upon demand. Biomass can beconverted to electricity and heat through cogenera on,anaerobic diges on, gasi ca on and pyrolysis.
A ground source heat pump (GSHP) system usesthe earth as a thermal ba ery to heat and/or coolthe building at considerably higher e ciency thanconven onal hea ng and cooling systems. A typicalGSHP consists of a series of buried pipe loops ac ng asa closed loop ground heat exchanger, connected to anumber of reversible heat pumps. When compared to aconven onal water-cooled refrigerant circuit, the groundloop performs the func on of the condenser loop andheat rejec on plant, but rejects heat from the building tothe ground rather than the atmosphere. Such a systemalso works in reverse in winter, taking the place of a boilerto absorb heat from the ground to heat the building.Incen ves for such systems are available in some areas.See: www.geoexchange.org/incen ves/incen ves
A thermal energy storage system is used to reduce abuilding’s peak air condi oning load. Chillers run duringo -peak hours to cool a storage tank of water or ice.During peak hours, part of the cooling demand is metby circula ng uid through the storage tank, reducing
E-12Low Energy Systemsthe electrical demand and required cooling capacity ofthe chiller. This can reduce the strain on the electricalgrid and can produce considerable savings under someelectric pricing structures, such as Time of Use rates.While higher chiller e ciencies can be achieved due tolower outdoor temperatures at night, any savings areusually o set by system ine ciencies especially in icestorage.
Considerations:
New HotelsAlterna ve energy feasibility is dependent on site loca on.For wind, anemometers should be installed at least a yearbefore construc on to test wind resources at the actualsite. Small horizontal axis turbines do not integrate wellwithin urban environments, however there are severaltypes of ver cal axis turbines that have been made andcan be mounted in parking lots, on roofs, or integratedin the façade. Solar is not as loca on dependant butpayback will be be er in areas with high solar radia onvalues. Geothermal power genera on is only appropriateon sites which have high levels of geothermal ac vity.
Cogenera on should be considered where there is asigni cant heat load access to natural gas or biomass.The primary use for cogen heat in a hotel is space hea ngand cooling. Hea ng can be achieved through hot watersystems such as variable air volume with reheat. Coolingcan u lise heat in an absorp on chiller. Viability of cogensystems is highly dependent on primary fuel costs and thecost of electricity from the local u lity grid. The ability touse all recovered heat to displace hea ng energy is alsovery important to the system economics.
GSHPs can be an e cient approach for providing hea ngand cooling for a larger building with a high cost ofelectricity. Considera on should be given to ensurehea ng and cooling demands are equal to within 20%,or the imbalance in heat ow will cause performance todegrade over me.

24 Green Engage/SolutionsIssued on February 1, 2011
Action Group Impact:Energy
Waste
Water
Carbon
A ordability
Consumer
Minor Major
IHG Green Engage/Solutions NH EH
Credited Actions1 On-Site Electricity Genera on
Install a system to generate electricityon-site, including solar, wind, geothermalor cogenera on.
1 BiomassUse biomass as the primary fuel sourcefor an on-site generator.
1 Low Energy TechnologiesInstall a low energy system includingground source heat pumps or thermalstorage.
Total Available Points 3 3
Thermal storage tanks are rela vely inexpensive andcompact. This system is most e ec ve when there is ahigh peak cooling demand and low o -peak demand.This is not a typical hotel pa ern. The savings dependson the electricity pricing structure, but may be as highas 10%.
Exis ng HotelsSolar and wind power can be added to addi onal facili es.A geothermal system is costly and requires altera ons toexis ng electrical and mechanical systems.Cogen is not recommended for exis ng facili es withoutaccess to natural gas or biomass. If the exis ng boilersystems and layout of the hotel permits easy replacementthen cogen might be advantageous and reduce hea ngcosts.
Ground source heat pump systems are costly to install inexis ng hotels as excava on of a signi cant amount ofland is necessary. They may also make exis ng boilersand chillers redundant.
Some chillers can support the addi on of a water-basedthermal energy storage system, though there will beaddi onal space requirements, temperature issues, andworking uid issues.
Advantages:Renewable energy systems are a highly visible signs ofsustainability; Can reduce opera ng costs through energygenera on; May qualify for signi cant incen ves.
Biomass and cogen plants can be shut down duringperiods of low energy demand, producing a a erelectrical demand curve that can bene t u li es and leadto decreased rate structures; Can be used as a primarysource of energy during a power outage.
Ground source heat pumps can deliver good energysavings; Can eliminate the need for cooling towers;Rela vely low maintenance.
Thermal energy storage can lower capital costs due to
smaller sized chiller; Lower energy costs under some ratestructures.
Disadvantages:In most cases renewables do not generate a viablepayback scenario to make them economically feasible.
Biomass and cogen plants create a signi cant amount ofnoise and would require sound a enua on if placed inthe development district; Requires a reliable fuel source.
GSHPs can cost up to $1000 per ton of cooling and do notwork well in climates where the hea ng load does notbalance the cooling load.
Capital cost of thermal energy storage tank may o setany savings.
References:U.S. DOE: Energy E ciency and Renewable Energywww.eere.energy.gov
European Renewable Energy Councilwww.erec.org/facts-and- gures.html
DSIRE: Database of State Incen ves for RenewableEnergy (DSIRE)www.dsireusa.org
Cogenera on Technologieswww.cogenera on.net/terms.htm
Other Relevant Action Groups:None
E-12Low Energy Systems

25 Green Engage/SolutionsIssued on February 1, 2011
The building envelope is used to maintain occupantcomfort and regulate indoor environmental quality. Theenvelope consists of roofs, walls, windows, doors and oors.
In general, the following a ributes should be consideredfor each climate zone:
AridMaterials with high thermal mass are favoured, alongwith external insula on. Concrete, masonry and adobeare all suitable materials. Adequate thermal mass willabsorb solar heat during the day and release the heatat night. Finishes with high re ec vity and wall shadingshould be used to reduce solar gains. Use plants andother devices for external shading.
Hot-HumidMaterials with low thermal mass are favoured. In somecases, masonry is used because of its durability. Highre ec vity materials are suitable. Use plants and otherdevices to shade the building.
TemperateMaterials and construc on vary for speci c climatecondi ons and hea ng/cooling strategy.
Cold-AlpineGenerally, a conven onally heated building should nothave high thermal mass, as this can increase the merequired to meet thermal comfort condi ons. Howeverif solar hea ng will be used, a high thermal mass canbe advantageous. Envelopes with low in ltra on andop mised insula on are very e ec ve for this climate.
B-01 Op mise Dayligh ng Design
B-02 Op mise Façade Design
B-03 Cool Roo ng Systems
B-04 Air In ltra on Reduc on Measures
B-05 Acous c Isola on
Building Envelope Action Groups B-01 to B-05

26 Green Engage/SolutionsIssued on February 1, 2011
Narrative:Windows provide a visual connec on with the outdoors,natural light and solar hea ng. Op mising glazingmaterials and window design can have a signi cantimpact on increasing building energy performance.
Use of low-E coa ngs and double-paned windows canimprove glazing thermal performance. A Low-E coa ngis a metal lm, which reduces the emissivity of glass (orthe “E” in low-E), and thus the amount of heat that is lostor gained (transmission). Windows manufactured withLow-E coa ngs typically cost 10%–15% more than regularwindows, but reduce energy transmission through awindow by 30%–50%.
The size and orienta on of windows must also beconsidered. Typical window to wall ra os range from20% to 50% and should be op mised for loca on.
Shading strategies should be considered in the designprocess. Op mally designed shading will allow sunlightpenetra on during hea ng periods and block it duringcooling periods.
To maximise energy savings, op mised dayligh ng designshould be combined with photo sensors linked to thear cial ligh ng in the building. The generally acceptedgoal for daylight, which is de ned by the BRE and theUSGBC, is to design for 75% of regularly occupied spacesto achieve 25 footcandles (250 lux) of illumina on fromdaylight on the task plane.
Considerations:New HotelsLow-E, double glazed windows may be applied to an en rehotel or to speci c orienta ons. This is most bene cial inextreme climates and in guest rooms with large windows.The shading design will depend on climate, la tude andbuilding layout. Shade plan ng should be considered
Exis ng HotelsReplacement of exis ng windows should be consideredwhen remodelling exis ng hotels 30 years or older.Installa on of shading devices in exis ng hotels is costlyand generally only appropriate in refurbishments. Interiorshading such as curtains can be used in other cases
Advantages:Improved comfort and indoor environmental quality dueto reduced solar heat gain and greater access to naturallight; Reduces hea ng and cooling equipment sizes alongwith running costs.
Disadvantages:Higher cost premium; Reduces useful winter solar heat.Shading may be challenging to incorporate into somearchitectural schemes.
References:AGT: Guide to Glazing, Finish Op ons and Performancewww.agtglazing.com/technical-binder/guide/index.php
Savannah Trims: Shu er Studiowww.shu erstudio.com
Illumina ng Engineering Society of North Americawww.iesna.org
Other Relevant Action Groups:E-10, B-02, M-02
B-01Optimise Daylighting Design
Action Group Impact:Energy
Waste
WaterCarbon
A ordabilityConsumer
Minor Major
IHG Green Engage/Solutions NH EH
Level 1 Prerequisite
1 Low-E GlazingMaximum glazing assembly U-value of0.30
Level 2 Prerequisite
1 Op mised Window to Wall Ra oVision glass not to exceed 40%OR Provide external ver cal shadingthat extends 1.2 metres (4 feet)beyond exterior wall at each oorOR Provide energy model demonstra ngglass performance is equivalent to glazingrequirements outlined in appendix
Credited Actions
1 Low-E GlazingMaximum glazing assembly U-value of0.30
1 High Performance GlazingInstalla on of double glazed argon orkrypton lled units in all guest rooms
1 Sunpath AnalysisAnalysis of hotel to iden fy shadingopportuni es
1 Shading DesignDesign shading for 4 orienta ons basedon analysis results
1 Shade Plan ngsPlan ng as required by analysis
1 Allow for Natural Light in Corridors25 footcandles of natural light in at least75% of corridor spaces
Total Available Points 7 4
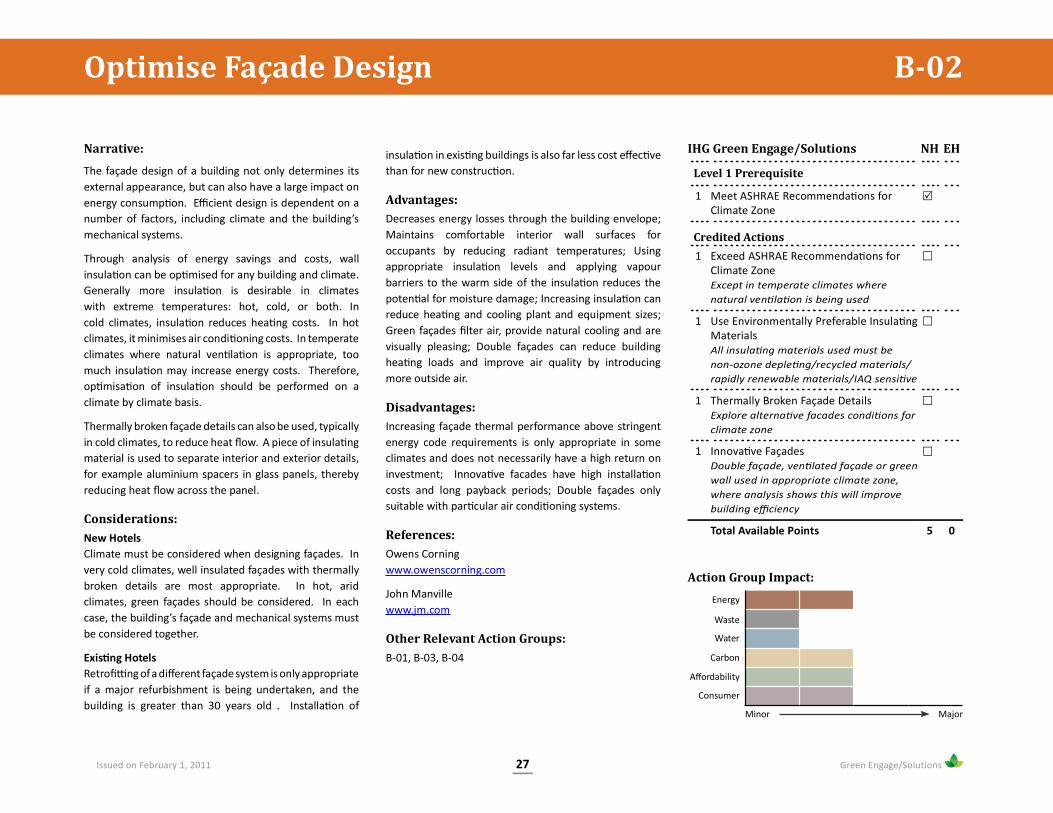
27 Green Engage/SolutionsIssued on February 1, 2011
Narrative:
The façade design of a building not only determines itsexternal appearance, but can also have a large impact onenergy consump on. E cient design is dependent on anumber of factors, including climate and the building’smechanical systems.
Through analysis of energy savings and costs, wallinsula on can be op mised for any building and climate.Generally more insula on is desirable in climateswith extreme temperatures: hot, cold, or both. Incold climates, insula on reduces hea ng costs. In hotclimates, it minimises air condi oning costs. In temperateclimates where natural ven la on is appropriate, toomuch insula on may increase energy costs. Therefore,op misa on of insula on should be performed on aclimate by climate basis.
Thermally broken façade details can also be used, typicallyin cold climates, to reduce heat ow. A piece of insula ngmaterial is used to separate interior and exterior details,for example aluminium spacers in glass panels, therebyreducing heat ow across the panel.
Considerations:New HotelsClimate must be considered when designing façades. Invery cold climates, well insulated façades with thermallybroken details are most appropriate. In hot, aridclimates, green façades should be considered. In eachcase, the building’s façade and mechanical systems mustbe considered together.
Exis ng HotelsRetro ng of a di erent façade system is only appropriateif a major refurbishment is being undertaken, and thebuilding is greater than 30 years old . Installa on of
insula on in exis ng buildings is also far less cost e ec vethan for new construc on.
Advantages:Decreases energy losses through the building envelope;Maintains comfortable interior wall surfaces foroccupants by reducing radiant temperatures; Usingappropriate insula on levels and applying vapourbarriers to the warm side of the insula on reduces thepoten al for moisture damage; Increasing insula on canreduce hea ng and cooling plant and equipment sizes;Green façades lter air, provide natural cooling and arevisually pleasing; Double façades can reduce buildinghea ng loads and improve air quality by introducingmore outside air.
Disadvantages:Increasing façade thermal performance above stringentenergy code requirements is only appropriate in someclimates and does not necessarily have a high return oninvestment; Innova ve facades have high installa oncosts and long payback periods; Double façades onlysuitable with par cular air condi oning systems.
References:Owens Corningwww.owenscorning.com
John Manvillewww.jm.com
Other Relevant Action Groups:B-01, B-03, B-04
B-02Optimise Façade Design
Action Group Impact:Energy
Waste
Water
Carbon
A ordability
Consumer
Minor Major
IHG Green Engage/Solutions NH EH
Level 1 Prerequisite
1 Meet ASHRAE Recommenda ons forClimate Zone
Credited Actions1 Exceed ASHRAE Recommenda ons for
Climate ZoneExcept in temperate climates wherenatural ven la on is being used
1 Use Environmentally Preferable Insula ngMaterialsAll insula ng materials used must benon-ozone deple ng/recycled materials/rapidly renewable materials/IAQ sensi ve
1 Thermally Broken Façade DetailsExplore alterna ve facades condi ons forclimate zone
1 Innova ve FaçadesDouble façade, ven lated façade or greenwall used in appropriate climate zone,where analysis shows this will improvebuilding e ciency
Total Available Points 5 0

28 Green Engage/SolutionsIssued on February 1, 2011
Action Group Impact:Energy
Waste
Water
Carbon
A ordability
Consumer
Minor Major
IHG Green Engage/Solutions NH EH
Level 1 Prerequisite
1 Roof System Selec onAll low-sloped roofs must have an SRI of<78 and steep-sloped roofs an SRI of <29
Credited Actions1 Roof System Selec on
All low-sloped roofs must have an SRI of<78 and steep-sloped roofs an SRI of <29
1 Re ec vity of 65%,Overall roof re ec vity must exceed 65%,with a thermal emi ance of 0.9 or morefor 50% of roof
1 Re ec vity of 87%Overall roof re ec vity must exceed 87%,with a thermal emi ance of 0.9 or morefor 100% of roof
Total Available Points 3 3
Narrative:
The term “heat island” refers to urban air and surfacetemperatures that are higher than nearby rural areas,caused by the high density of dark roofs and paving thatabsorb heat. The elevated temperature associated withheat island e ect leads to increased building coolingloads.
A roof with high solar re ec vity, typically white incolour, is called a cool roof, and can be used to reduceheat island e ect. Re ec ve cool roofs can reduce roofsurface temperatures by up to 100°F. This will in turnlower the cooling energy used by a building. Anotherbene t of the cool roof is that the lower temperaturewill cause less expansion and contrac on of the roofmaterials, extending their useful life.
Considerations:New HotelsHotels located in urban areas are most likely to beimpacted by heat island e ect. Cool roo ng systems mayo er signi cant bene ts in terms of comfort and cost.Packaged roo op air condi oners will operate moree ciently on a cool roof than on a tradi onal roof.
Exis ng HotelsHotels in temperate and hot climates, especially in urbanareas, should consider a cool roof when roof replacementis being done.
Advantages:Reduces roo ng replacement costs due to long lifematerial; Lowers HVAC system energy consump on,thereby saving money; Reduces heat island e ect in ci esand suburbs; Reduces roo ng material sent to land lls;Reduces air pollu on and smog forma on due to reducedroof temperature and heat island e ect.
Disadvantages:35% to 50% of re ectance on a cool roof can be lost if theroof is not kept clean from dirt. Maintenance is neededevery few months to keep at design condi on; Cool roofat the Podium level may re ect an undesirable level oflight up towards the guest rooms.
References:US EPA: Heat Island Reduc on Ini a vewww.epa.gov/hiri
US EPA, US DOE: Energy Starwww.energystar.gov/index.cfm?c=roof_prods.pr_roof_products
Cool Roof Ra ng Councilwww.coolroofs.org
Johns Manvillewww.jm.com
Other Relevant Action Groups:B-02
Cool Roo ing Systems B-03

29 Green Engage/SolutionsIssued on February 1, 2011
Action Group Impact:Energy
Waste
Water
Carbon
A ordability
Consumer
Minor Major
IHG Green Engage/Solutions NH EH
Level 1 Prerequisite
1 Install Weatherstripping on all GuestRoom Windows
Level 2 Prerequisite1 Use of Outdoor Air to Minimise
In ltra on
Credited Actions
1 Install Building Pressurisa on Controls
1 Outdoor Air Filtra onMaintain a minimum MERV 11 ltra onmedia
1 Incorporate Building Pressurisa onControls into BMS
1 Develop Plan for Correc ve Ac on whenSystem Alarms
Total Available Points 6 1
Narrative:
In ltra on of untreated outdoor air to indoor spacesoccurs when a building’s indoor pressure is less than theoutdoor air pressure. This causes outdoor air to “leak” inthe building, via cracks around doors and windows andeven through exterior walls.
This outdoor air has not been condi oned or dehumidi ed,resul ng in uncomfortable temperatures and humiditylevels. If the outdoor air is humid, condensa on canform on cold surfaces. This can cause mildew and otherproblems. Un ltered outdoor air coming can also carrypar culates and dirt.
To minimise in ltra on, the ltered outdoor air broughtinto the building must be supplied to create a posi velypressurised building. This will cause air to push out ofthe building rather than in. Addi onally, the construc onof the building should be weather ght, using well-builtdoors and windows with weather-stripping aroundthem.
For larger resorts with high square footage, buildingpressurisa on controls can be used in conjunc on with abuilding management system. The pressure sensors willreport when pressure has fallen below the acceptablelevels and the BMS relays to the air-handling unit to
supply more condi oned air, thus increasing the pressureand avoiding in ltra on.
Considerations:New HotelsAll new hotels should be built with construc on materialsthat minimise in ltra on and should be posi velypressurised using a mechanical system.
Exis ng HotelsWeather stripping should be installed on exis ng doorsand windows, and all cracks and building envelopefailures should be repaired.
Advantages:Indoor environment is healthier; Energy costs are lowerbecause systems are not loaded by uncondi oned air.
Disadvantages:Building commissioning is required to ensure correctpressurisa on is being achieved.
References:None
Other Relevant Action Groups:E-05, B-02, M-01, M-02, P-07
Air In iltration Reduction Measures B-04

30 Green Engage/SolutionsIssued on February 1, 2011
Action Group Impact:Energy
Waste
Water
Carbon
A ordability
Consumer
Minor Major
IHG Green Engage/Solutions NH EH
Credited Actions
1 Precer ca on of Mechanical Equipmentfor Noise Reduc onMeet Noise Criteria of 35 or be er atmedium speed
1 Isolate Building Air Intakes and Ou akesLocate at least 18 metres (60 feet) fromoperable guest room windows
1 Isolate Kitchen, Dining and Waste AreasLocate at least 36 metres (120 feet) fromguest rooms
1 Use Reverbera on Control in Kitchen,Dining and Waste AreasUse absorp ve materials to achievereverbera on control
1 Room to Room Noise Isola onSTC level of 50 or greater
Total Available Points 5 0
Narrative:
Noise is de ned as being “unwanted sound”. It has theability to disturb sleep and cause stress. In general, noisein buildings comes from 3 sources:
(a) environmental (tra c, adjacent ac vi es, construc onetc)
(b) building opera on (noise from MEP services)
(c) occupa onal (from human ac vity).
The combina on of noise from all of these sources mustbe appropriately mi gated and balanced to achievesuccess in hotel design. This requires an integrateddesign approach.
The criteria and metrics vary between spaces based onfunc on (bedrooms, lounges, o ces, spas etc).
Considerations:New HotelsAppropriate shell and core, wall, oor and facadeacous c performance should be considered. Ven la onapproach should also be considered. Successful acous cdesign is achieved by separate noise producing spaces(mechanical rooms, kitchen, elevators, garbage andlaundry shoots etc) from quiet spaces (bedrooms,lounges etc) horizontally and ver cally.
Exis ng HotelsAcous c issues should be considered during majorrefurbishments or retro ts.
Advantages:Increased privacy and improved acous c comfort levelsfor guests and sta .
Disadvantages:Some noise control approaches require rou nemaintenance; Reloca on of noise producing or quietspaces.
References:The Engineering Toolbox: Room Criterion Curveswww.engineeringtoolbox.com/rc-room-criteria-d_729.html
Acous cs.com: Codes and Tes ngwww.acous cs.com/stc.asp; www.acous cs.com/iic.asp
Reverbera on Timewww.reverbera on me.com
Other Relevant Action Groups:None
Acoustic Isolation B-05

31 Green Engage/SolutionsIssued on February 1, 2011
Mechanical systems present many opportuni es to saveenergy, resources, and money. In addi on, mechanicalsystems can help achieve improved comfort and airquality for guests. The appropriate mechanical systemsand equipment for a project are dependent upon severalfactors including:
• Climate
• Types of rooms and their clientele
• Orienta on of building
• Availability of parts, equipment, and skilled labour
Mechanical systems may be ac ve or passive andappropriate condi ons and improved e ciency canbe achieved through both equipment and controls. Todetermine the correct HVAC systems and accreditedac ons to use for a new hotel, it is recommended thatan energy audit of an exis ng similar hotel in the sameclimate zone be done. This will reveal which strategiescould present the most savings. The accredited ac onsshould not all be done together, in fact, some would becounter-produc ve depending on the climate zone.
M-01 Fresh Air Delivery
M-02 Natural Ven la on
M-03 Guest Room HVAC Equipment Selec on
M-04 Water Cooled Chillers
M-05 Addi onal Cooling Systems
M-06 Refrigerant Management
M-07 Economiser Modes
M-08 Heat Recovery
M-09 4 Degree Deadband
M-10 Enhanced HVAC Guest Room Controls & CO2Monitoring
M-11 Motor Energy E ciency
M-01 to M-11Mechanical Action Groups

32 Green Engage/SolutionsIssued on February 1, 2011
M-01Fresh Air Deliverycoordinated with bathroom exhaust sha s. Control of airdistribu on should be integrated with controls dampers,guest room master switching and CO2 sensors if suchsystems are in place.
All new ven la on systems must be designed and installedto meet ASHRAE Standard 62.1-2007 for minimumoutdoor air rates, and tested to prove compliance.
Exis ng HotelsCentral air distribu on o en requires a new mechanicalchase to be built to each guest room, which is not prac calunless a total architectural and mechanical renova on isbeing done.
Hotels that have been constructed or undergonecommissioning in the last 5 years can use thisdocumenta on to show that outdoor air rates meetASHRAE 62.1-2007. Otherwise, tes ng of the air handlersmust be performed by either the hotel engineer or a thirdparty tes ng and balancing technician.
Hotels that cannot meet ASHRAE 62.1-2007 must showthat at least 10 cfm of outdoor air per person can besupplied under all normal opera ng condi ons.
Advantages:Be er indoor air quality; Improved pressurisa oncontrol; Increased e ciency of condi oning the outdoorair; Demand ven la on reduces energy demand.
Disadvantages:Requires a capital cost for the separate outside air unit;but does present a payback due to reduced in ltra onand reduced outside air ows; Controls system notavailable for all hotels.
References:ASHRAE - www.ashrae.org
Other Relevant Action Groups:M-02, M-03, M-07, M-10
Narrative:Outdoor air in hotel rooms is o en delivered to hotelrooms using through the wall air condi oning units.These units are o en not well-equipped to handle ahigh heat load, some mes resul ng in excess humidity,mould, and poor air quality.
Supplying the outdoor air to hotel rooms througha central system allows for be er control over thetemperature, humidity and amount of outdoor air toeach room, crea ng a more comfortable environment. Acentral unit allows for ease in maintenance and createsfewer disrup ons in guest rooms. It also controls buildingpressurisa on, which can help prevent in ltra on.
If the hotel has a building management system, thendemand ven la on may also be implemented to reduceven la on rates when a room is unoccupied by use of acontrol system and CO2 sensors. This can produce energysavings of approximately 10%.
Displacement ven la on supplies air at low levelsand uses the natural buoyancy of air to raise heat andcontaminants to the exhaust at the top of the room.Supply air can reduce cooling, hea ng and fan energyconsump on by supplying air from an under oor plenumor mechanical chase at low velocity, at a temperaturecloser to the desired room temperature, compared withconven onal overhead systems.
A minimum indoor air quality must be provided for alloccupants - sta and guests. ASHRAE Standard 62.1-2007 mandates the minimum ven la on rates for newhotels. Exis ng hotels must meet these standards orprovide at least 10 cfm per person.
Considerations:New HotelsThe design of new hotels needs to allow for a central airhandling unit and mechanical sha s for the ductworkto supply air to each room. This ductwork can be
All climates, during appropriate seasons
Action Group Impact:Energy
Waste
Water
Carbon
A ordability
Consumer
Minor Major
IHG Green Engage/Solutions NH EH
Level 1 Prerequisite
1 Verify Minimum Outdoor Air RatesComply with ASHRAE Standard 62.1-2007 (New Hotels) or a rate of 10 cfmper person under all normal opera ngcondi ons (Exis ng Hotels)
Level 2 Prerequisite
1 Installa on of Central AHU for Fresh Air
Credited Actions
1 Demand Ven la onInstall in all guest rooms: higherven la on rates during occupancy,minimum rates when unoccupied (perASHRAE 62.1-2007)
1 CO2 SensorsInstall CO2 sensors in all public/mul -occupant spaces
1 Displacement Ven la onUse of displacement ven la on to supplyoutside air to all guest rooms
Total Available Points 5 1
LEED® EQp1

33 Green Engage/SolutionsIssued on February 1, 2011
Action Group Impact:Energy
Waste
Water
Carbon
A ordability
Consumer
Minor Major
IHG Green Engage/Solutions NH EH
Credited Actions
1 Operable Windows in all RoomsWindow opening should be 4% of room oor area - not to exceed 10 cm (4 inch)
opening
Total Available Points 1 1
on climate and the willingness of guests to open thewindows. In common areas such as foyers, careful designis necessary to ensure minimum levels of outside air aredelivered. Natural ven la on should only be used whenit can provide comfortable condi ons. On extreme days,the central ven la on unit should be used instead.
Exis ng HotelsInstalla on of operable windows and A/C lockouts shouldbe considered in rooms where the climate is suitable.Conversion of larger areas such as foyers to naturalven la on/mixed mode opera on can be complex andcostly and would typically only be undertaken as part of aredevelopment/redesign.
Advantages:Maximises ven la on air; No energy use; Guests will feelmore connected with the outdoors.
Disadvantages:Added costs of operable windows and A/C lockoutcontrols.
References:Na onal Ins tute of Building Scienceswww.wbdg.org/resources/naturalven la on.php
NIST: Building and Fire Research Laboratoryh p:// re.nist.gov/bfrlpubs/build01/PDF/b01073.pdf
Other Relevant Action Groups:B-01, B-02, M-01
Narrative:
To save energy, modern air condi oned buildingstypically re-circulate used room air, which can diminishindoor air quality and can a ect occupant comfort andproduc vity. Using natural ven la on in appropriateweather can reduce building energy use and improveoccupant comfort. Typically, natural ven la on can beused to ven late up to around 6 metres (18 feet) depthfrom a window, or a oor plate depth of up to 12 metres(40 feet) for cross ven la on.
In summer months the temperature di erence betweeninside and outside will be small and very li le coolinge ec veness will be available. E orts should therefore bemade to minimise heat gains to the building through:
• Shading, Light shelves / natural dayligh ng• Ar cial ligh ng controls• Increased insula on• High e ciency glazing• Orienta on• Wind inves ga ons
Due to the expecta ons of hotel guests, it will not befeasible to use natural ven la on for the whole year. Inmost climates, the building will have to use conven onalhea ng and cooling systems for peak winter and summerperiods. Natural ven la on may also be unsuitable inareas with year-round extreme temperatures or highhumidity.
Considerations:New HotelsNatural ven la on can be incorporated by includingoperable windows in each guest room with an exteriorwall, in conjunc on with A/C lockouts when windowsare open. The amount of energy saved will depend
M-02Natural VentilationAll climates, during appropriate seasons

34 Green Engage/SolutionsIssued on February 1, 2011
Action Group Impact:Energy
Waste
Water
Carbon
A ordability
Consumer
Minor Major
IHG Green Engage/Solutions NH EH
Level 1 Prerequisites
1 No Through the Wall Heat Pumps (PTACs)
1 No 2-Pipe Fan Coil Units with ElectricHeat
Credited Actions1 No Through the Wall Heat Pumps (PTACs)
1 No 2-Pipe Fan Coil Units with ElectricHeat
1 Water Source Heat Pumps or 4-Pipe FanCoil Units or VAVs in Guest Rooms
Total Available Points 3 3
Narrative:
In hotels, guest rooms are o en served with using throughthe wall heat pump units (PTACs). These are easy to installon a room level because they do not require piping, theydo not require a separate outdoor compressor unit, andthey do not require ductwork. Unfortunately, most unitsdo not provide ght temperature or humidity control, areo en noisy, and are energy ine cient.
Providing guest rooms with be er HVAC units wouldachieve higher guest comfort, ease maintenance, andsave energy. The type of hotel, the climate zone it islocated in, the orienta on of the exterior rooms, and thelayout of the overall building must be considered beforepicking the system that is right for the hotel.
Water source heat pumps are typically 25% more e cientthan PTACs and use a condenser water system. They areeasy to install and inexpensive, but s ll not as e cient asother systems that can be used.
Four-pipe fan coil units provide cooling and hea ngfrom a central plant piped to the guest rooms, whichprovides be er energy e ciency than PTACs and be ertemperature control and lower noise. They o er animprovement in energy e ciency of approximately 15%.
A variable-air-volume (VAV) air-handling system wouldrequire a central air-handling unit that would be ductedto VAV boxes in each room. The VAV boxes would openand close in response to the thermostat in each room.The outdoor air could be supplied either through theVAV system or separately. These are generally the moste cient systems, o ering energy savings of 25-30%. If theVAV system is selected in the cold or temperate climates,use of fan-powered parallel VAV boxes in the room willproduce an addi onal energy savings by reusing roomheat during the winter.
Considerations:
New HotelsNew hotels pose the best opportunity to integratethe best HVAC system for a climate, building type,and building size. VAV units require a ceiling cavity,while heat pumps and usually fan coil units require anarchitectural enclosure. VAV systems require a BMS andrequire commissioning and would only be applicable inlarge scale resorts.
Exis ng HotelsAs HVAC systems are upgraded or replaced, a moree cient system for that climate and hotel type shouldbe used to ensure energy savings and be er roomcondi ons.
Advantages:Guests are more comfortable; Saves building energy costs;New equipment can be ed into building managementsystems.
Disadvantages:Can have higher capital costs due to equipment, controls,sheet metal and piping costs.
References:INNCOM Technologieswww.inncom.com
DBS Lodging Technologieswww.entergize
LTC Enterprise, LLC: Lodging Technologywww.lodgingtechnology.com
Other Relevant Action Groups:E-06, M-01, M-06, M-07, M-08, M-09, M-10
M-03Guest Room HVAC Equipment SelectionAll climates

35 Green Engage/SolutionsIssued on February 1, 2011
Action Group Impact:Energy
Waste
Water
Carbon
A ordabilityConsumer
Minor Major
IHG Green Engage/Solutions NH EH
Credited Actions
1 Water Cooled ChillersInstall water cooled chillers in lieu ofair cooled chillers in hot climates wherewater is abundant
Total Available Points 1 1
Narrative:
In an air condi oning system, supply air removes heatfrom the spaces if the outside air is warmer than therequired supply air temperature. Chilled water oranother medium is used to remove heat from the supplyair. The heat that is captured in the chilled water loop isthen rejected by the chiller either directly to air or to acondenser water system that will reject heat using eithera cooling tower or a dry cooler.
The di erence in e ciency between air cooled and watercooled systems is climate and weather speci c. Theoutdoor dry bulb temperature is the primary factor for aircooled systems and the outdoor wet bulb is the primaryfactor for water cooled systems.
When using a condenser water system, dry coolers areless e cient than cooling towers, so if a chiller is usedit should be air cooled or have a cooling tower. At acertain tonnage of HVAC, it becomes more cost e cientto have a cooling tower and a water cooled chiller thanan air cooled chiller. A rule of thumb is that for coolingloads in excess of 200 tons, a water-cooled system willlikely be the best choice for the life of the system. Thesystem in the modelled hotel had a cooling load of less200 tons, yet using a water cooled chiller s ll yieldedenergy savings of approximately 10% over an air cooledchiller in hot/humid and hot/dry climates. The bene tsin temperate and cold climates were negligible. Beforedeciding to use a water cooled chiller, system tonnageand climate should be considered.
When compared to air cooled systems, purchasing a watercooled system will require a higher capital investment,mainly due to the cooling tower, condenser water pumps,and piping. They will also require addi onal maintenance,including speci c water treatment requirements. Forlarger systems however, these downsides are usuallyo set by the overall energy savings.
Considerations:
New HotelsThis must be considered with regard to a number of othercredits. Water cooled chillers will likely be appropriatefor a large, centralised HVAC system, but are unsuitablefor smaller systems. More detailed analysis is necessarybased on weather and internal load data.
Exis ng HotelsThe di erence in structure between air and water-cooledchillers makes conversion of exis ng systems di cult andcostly, and should only be considered if replacement orextensive repair of an exis ng chiller is necessary.
Advantages:Smaller footprint size; Lower energy costs; Quieter; Be ercapacity control; Ability to use waterside economisers.
Disadvantages:Higher capital investment; Increased water consump on;Without proper maintenance, there can be a risk ofLegionnaire’s disease.
References:Johnson Controls: York Products and Serviceswww.york.com
Trane Chillersh p://www.trane.com/commercial/dna/view.aspx?i=975
United Technologies Company: Carrierwww.carrier.com
Other Relevant Action Groups:M-05, M-06, M-07, M-08, W-04
Water Cooled Chillers M-04Hot climates for smaller buildings, all climates for large resorts

36 Green Engage/SolutionsIssued on February 1, 2011
Action Group Impact:Energy
Waste
Water
Carbon
A ordabilityConsumer
Minor Major
Narrative:
In some climates and hotel sites, innova ve coolingstrategies such as evapora ve or absorp on cooling canbe employed to e ec vely save energy and opera ngcosts over conven onal air condi oning systems. Thesestrategies can be complex and require though ul designconsidering the climate and usage of the building. Todetermine if any non-tradi onal system should beincorporated into a hotel, an energy model should bedone to study the system and realise if both cost andenergy use are reduced.
A direct evapora ve cooling system passes dry outdoorair through pads kept moist through water satura on.Cooling is achieved because heat from the air is used toevaporate the water. This process also results in increasedhumidity. An indirect system passes the supply air througha heat exchanger so that the humidity stays out of the airstream. This can produce total energy savings of 4% in ahot dry climate, and 1-2% in other climates.
The poten al for evapora ve cooling is measured bythe di erence in dry bulb temperature and wet bulbtemperatures. While dry climates have greater poten alfor evapora ve cooling they typically do not haveabundant water resources. Energy saving are achievedbecause minimal mechanical energy is required otherthan the fan energy. The trade o between energysavings and increased water consump on should beconsidered in the context of the local ecology and u lityprices. Moreover, the o site energy savings are limitedbecause of the energy intense processes associated withwater treatment and transporta on.
An absorp on chiller uses a heat source to genera ngcooling. While this process is less e cient than that ofa conven onal vapour-compression chiller, savings cans ll be realised where solar thermal or waste heat isavailable. Where steam is available, a double e ect cyclecan increase the e ciency by 50% over single e ect.
Absorp on chillers do not consume electricity or CFCor HCFC refrigerants, however commonly have lowerreliability than other chillers.
Considerations:New HotelsHotels located in hot dry climates may consider usingevapora ve coolers. Controls should be used so as notto exceed comfortable and safe humidity levels. Anindirect system should be used where humidi ca on isnot desired.
A hotel site that is appropriately situated for solarthermal, or that will generate signi cant waste heat,should consider an indirect red single e ect absorp onchiller to u lise this thermal energy. This is a HVAC goodsystem to use when fuel cells or a CHP plant are in thedesign.
Exis ng HotelsThese systems should only be considered when anextensive refurbishment or replacement of the exis ngcooling plant is necessary.
Advantages:Evapora ve cooling can o er signi cant energy savings;Reduces the size of cooling equipment
Absorp on chillers can reduce electrical usage and wasteheat; Possibility of using renewable sources such as solarthermal or fuel cells to re absorp on chiller; Elimina onof CFC and HCFC refrigerants.
Disadvantages:Evapora ve cooling requires a trade o between waterand energy consump on; Needs maintenance - poten alexposure to Legionnaires’ disease; May make air toohumid, psychometrics should be studied.
Absorp on cooling systems have higher capital cost;Lower reliability.
Additional Cooling Systems M-05
References:Thomas & Be s: Reznor HVAC Solu onswww.rezspec.com
California Energy Commission: Consumer Energy Centrewww.consumerenergycenter.org/home/hea ng_cooling/evapora ve.html
US DOE: Energy E ciency and Renewable Energywww.eere.energy.gov/consumer/your_home/space_hea ng_cooling/index.cfm/mytopic=12360
Other Relevant Action Groups:E-12, M-04, M-06
IHG Green Engage/Solutions NH EH
Credited Actions
1 Evapora ve Cooling SystemInstall evapora ve cooling system in allclimates in where water is abundant
1 Absorp on Cooling SystemInstall absorp on cooling system in hot-humid and temperate climate zones
Total Available Points 2 2

37 Green Engage/SolutionsIssued on February 1, 2011
Action Group Impact:Energy
Waste
Water
Carbon
A ordabilityConsumer
Minor Major
Narrative:
A refrigerant is a uid used in a machine that isdesigned to pump heat from a lower temperature heatsource to a higher temperature heat sink. CFCs, HCFCs,HFCs, ammonia, water, and CO2 are di erent types ofrefrigerants.
CFCs in par cular are known to deplete the ozone layer.As a result, the use of CFCs has been phased out in mostdeveloped countries since the signing of the MontrealProtocol in 1989, while developing countries have un l2010 to eliminate their use. Addi onally, HCFCs causedamage to the ozone layer and are also being phasedout.
The Ozone Deple on Poten al (ODP) measures thee ect of the selected refrigerant on the ozone layer.The Global Warming Poten al (GWP) measures thee ect of the refrigerant on global warming. ODP andGWP calcula ons ensure that the most ‘environmentallyfriendly’ refrigerant is used.
Considerations:New HotelsWhen selec ng refrigerants for HVAC and coolingequipment, the ozone deple on poten al and the globalwarming poten al should be researched and calculated.The life me of the equipment, refrigerant charge,and amount of refrigerant are all values that must beconsidered when selec ng refrigerants.
Exis ng HotelsExis ng hotels that use CFCs and HCFCs in HVAC andcooling equipment should begin a phase-out program andreplace exis ng refrigerants (if possible) or equipment.Since produc on of these refrigerants is or will bediscon nued, the availability will decrease over me.
Advantages:
Li le or zero ozone deple on poten al; Less impact onglobal warming.
Disadvantages:Cooling system or plant replacement is expensive; thisshould only be considered when HVAC systems are beingrefurbished.
References:United Na ons Environment Programme: Scien cAssessment of Ozone Deple onwww.unep.ch/ozone/Assessment_Panels/SAP/Scien c_Assessment_2006/index.shtml
US EPA: Lis ng of Global Warming Poten al for Ozone-Deple ng Substances.www.epa.gov/fedrgstr/EPA-AIR/1995/October/Day-11/pr-1117.html
Other Relevant Action Groups:M-03, M-04, M-05
IHG Green Engage/Solutions NH EH
Level 1 Prerequisite
1 No CFCs in HVAC and Refrigera onSystems
Credited Actions
1 Phase Out or No HCFCs
Total Available Points 2 2
LEED® EAp3
M-06Refrigerant ManagementAll climates

38 Green Engage/SolutionsIssued on February 1, 2011
Action Group Impact:Energy
Waste
Water
Carbon
A ordability
Consumer
Minor Major
IHG Green Engage/Solutions NH EH
Level 1 Prerequisite
1 Airside Economisers on Central AHUsProvide 0-100% airside economiser onall central air handling units, provide theright type of controls per ASHRAE 90.1-2004
Credited Actions
1 Airside Economisers on Central AHUsProvide 0-100% airside economiser onall central air handling units, provide theright type of controls per ASHRAE 90.1-2004
1 Heat Exchanger for Waterside EconomiserProvide heat exchanger for watersideeconomiser for chilled water system
Total Available Points 2 2
Narrative:
When the outdoor air temperature is at or below thesupply air temperature, an airside economiser modeon an air handler achieves free cooling by using moreoutdoor air instead of cooling the return air. This can alsobe done when the outdoor air is greater than the supplyair temperature, but less than the return air temperature.An enthalpy economiser mode has addi onal control tocompare enthalpy rather than temperature to ensurethat outdoor air is only used when the enthalpy is lowerthan the return air enthalpy.
Economiser mode is required by ASHRAE 90.1-2004for systems of certain sizes, dependent on climatezone. Di erent controls for economiser mode are alsorecommended based on climate zone.
While airside economisers are more common and o era large savings, economisers can also be used in watersystems when it is cold outside and cooling is s ll requiredinside. This is typical of interior spaces with high loads,such as conference rooms and mee ng spaces in hotels.The economiser mode consists of running the coolingtower condenser loop through a heat exchanger ratherthan opera ng the chiller.
Considerations:
New HotelsEconomisers should be considered in rela on to on site-speci c factors such as climate, and various other HVAC-related credits. Economiser cycles are most bene cialin areas with cooler or temperate climates, and may notbe appropriate in high humidity regions or in extremeclimates. Though they carry an addi onal capital cost, theenergy savings can produce fairly short payback periods.
Exis ng HotelsRetro ng to exis ng systems may be suitable whereclimate is appropriate and thermal loads are su ciencyhigh. This is not applicable to systems that have room aircondi oners only.
Advantages:Lower energy costs; Improved air quality due to 100%outdoor air.
Disadvantages:Higher capital investment; Unsuitable in smaller HVACsystems or extreme climates.
References:ASHRAEwww.ashrae.org
US EPA: IAQ Building Educa on and Assessment Modelwww.epa.gov/iaq/largebldgs/i-beam/text/energy_e ciency.html
California Public U li es Commissionwww.energydesignresources.com/docs/db-02-economizers.pdf
Other Relevant Action Groups:M-01, M-03, M-08
M-07Economiser ModesUse appropriate economiser for each climate per ASHRAE-90.1-2004
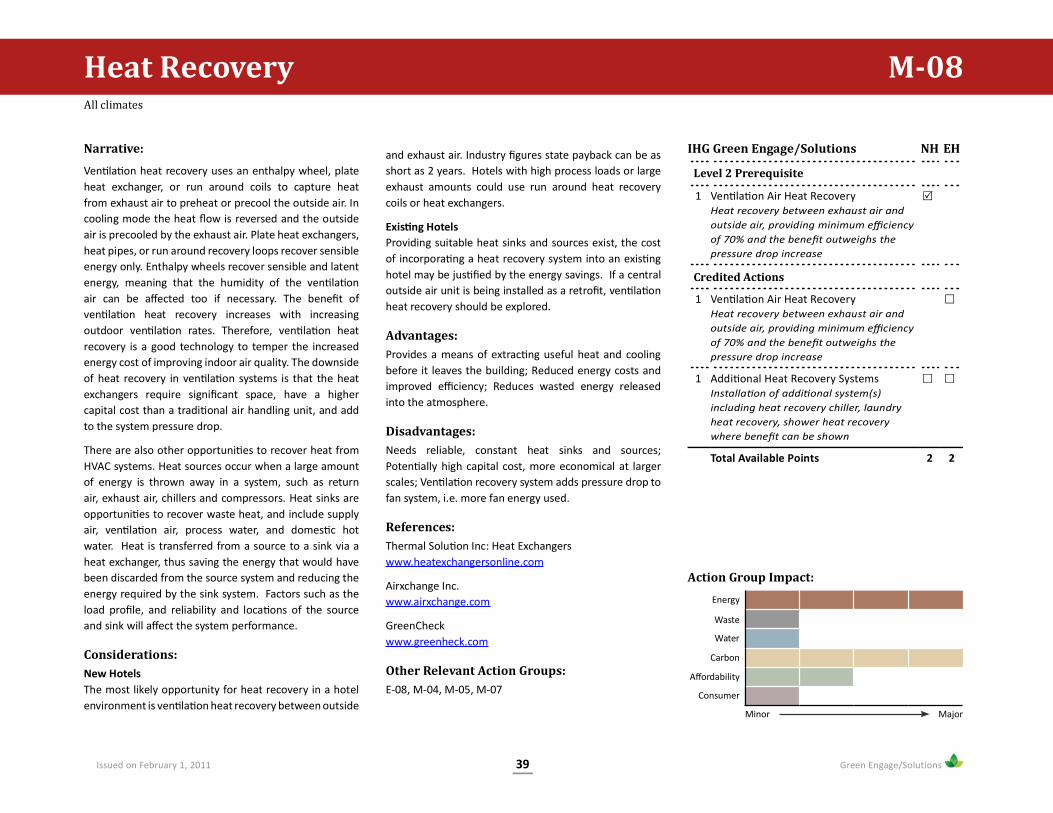
39 Green Engage/SolutionsIssued on February 1, 2011
Action Group Impact:Energy
Waste
Water
Carbon
A ordability
Consumer
Minor Major
IHG Green Engage/Solutions NH EH
Level 2 Prerequisite
1 Ven la on Air Heat RecoveryHeat recovery between exhaust air andoutside air, providing minimum e ciencyof 70% and the bene t outweighs thepressure drop increase
Credited Actions
1 Ven la on Air Heat RecoveryHeat recovery between exhaust air andoutside air, providing minimum e ciencyof 70% and the bene t outweighs thepressure drop increase
1 Addi onal Heat Recovery SystemsInstalla on of addi onal system(s)including heat recovery chiller, laundryheat recovery, shower heat recoverywhere bene t can be shown
Total Available Points 2 2
Narrative:
Ven la on heat recovery uses an enthalpy wheel, plateheat exchanger, or run around coils to capture heatfrom exhaust air to preheat or precool the outside air. Incooling mode the heat ow is reversed and the outsideair is precooled by the exhaust air. Plate heat exchangers,heat pipes, or run around recovery loops recover sensibleenergy only. Enthalpy wheels recover sensible and latentenergy, meaning that the humidity of the ven la onair can be a ected too if necessary. The bene t ofven la on heat recovery increases with increasingoutdoor ven la on rates. Therefore, ven la on heatrecovery is a good technology to temper the increasedenergy cost of improving indoor air quality. The downsideof heat recovery in ven la on systems is that the heatexchangers require signi cant space, have a highercapital cost than a tradi onal air handling unit, and addto the system pressure drop.
There are also other opportuni es to recover heat fromHVAC systems. Heat sources occur when a large amountof energy is thrown away in a system, such as returnair, exhaust air, chillers and compressors. Heat sinks areopportuni es to recover waste heat, and include supplyair, ven la on air, process water, and domes c hotwater. Heat is transferred from a source to a sink via aheat exchanger, thus saving the energy that would havebeen discarded from the source system and reducing theenergy required by the sink system. Factors such as theload pro le, and reliability and loca ons of the sourceand sink will a ect the system performance.
Considerations:New HotelsThe most likely opportunity for heat recovery in a hotelenvironment is ven la on heat recovery between outside
and exhaust air. Industry gures state payback can be asshort as 2 years. Hotels with high process loads or largeexhaust amounts could use run around heat recoverycoils or heat exchangers.
Exis ng HotelsProviding suitable heat sinks and sources exist, the costof incorpora ng a heat recovery system into an exis nghotel may be jus ed by the energy savings. If a centraloutside air unit is being installed as a retro t, ven la onheat recovery should be explored.
Advantages:Provides a means of extrac ng useful heat and coolingbefore it leaves the building; Reduced energy costs andimproved e ciency; Reduces wasted energy releasedinto the atmosphere.
Disadvantages:Needs reliable, constant heat sinks and sources;Poten ally high capital cost, more economical at largerscales; Ven la on recovery system adds pressure drop tofan system, i.e. more fan energy used.
References:Thermal Solu on Inc: Heat Exchangerswww.heatexchangersonline.com
Airxchange Inc.www.airxchange.com
GreenCheckwww.greenheck.com
Other Relevant Action Groups:E-08, M-04, M-05, M-07
M-08Heat RecoveryAll climates

40 Green Engage/SolutionsIssued on February 1, 2011
Action Group Impact:Energy
Waste
Water
Carbon
A ordability
Consumer
Minor Major
IHG Green Engage/Solutions NH EH
Level 1 Prerequisite
1 100% of Guest Rooms have 4°F DeadbandThermostats
Level 2 Prerequisite
1 100% of Public Areas have 4°F Deadbandthrough BMS
Credited Actions
1 100% of Public Areas have 4°F Deadbandthrough BMS
Total Available Points 2 2
Narrative:
Without a di erence, or “deadband”, between cooling andhea ng control setpoints the systems are con nuouslyac vated and cycled frequently. This results in high energyuse and equipment degrada on. Maintaining a 4°F saveson hea ng and cooling energy by reducing chiller, boilerand pumping u lisa on.
A setpoint deadband can be implemented througha deadband thermostat or a more advancedbuilding automa on system. The ASHRAE indoorcomfort temperature range chart, below, indicatesthat there is 5 degree range that is acceptableto 90% of occupants in all outdoor condi ons,and that this range changes with each season.
Considerations:New HotelsA 4 degree deadband should result in decreased energyconsump on without compromising thermal comfort,providing the deadband is selected to fall within theindoor comfort range shown above. This should beconsidered for all HVAC systems, both manually controlledand automated.
Exis ng HotelsRetro ng of exis ng systems is simple, rela velyinexpensive and can lead to signi cant energy savings.This process should be inves gated for all exis ng HVACsystems.
Advantages:Rela vely inexpensive; Can produce signi cant savings inHVAC running and maintenance costs.
Disadvantages:Ini al cost; Possible nega ve e ect on thermal comfort ifdeadband is improperly selected.
References:US EPA: Programmable Thermostatswww.energystar.gov/index.cfm?c=thermostats.pr_thermostats
Other Relevant Action Groups:E-03, E-06, M-10
M-094 Degree DeadbandAll climates, change with season
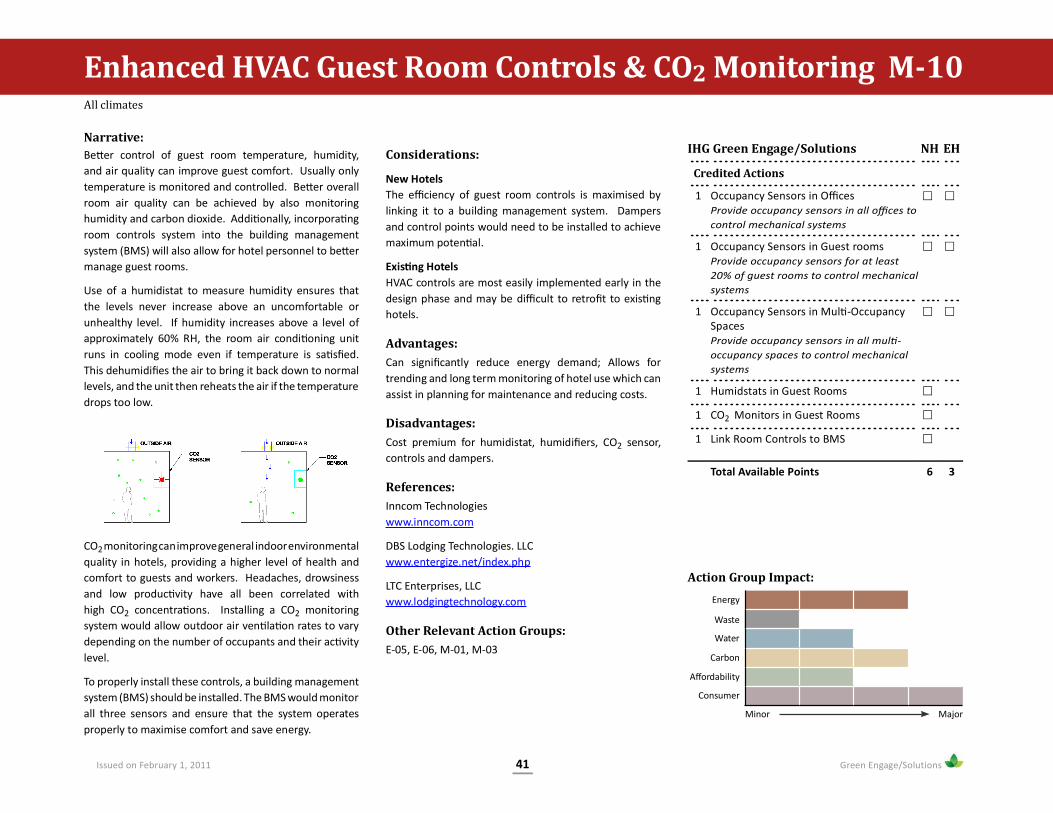
41 Green Engage/SolutionsIssued on February 1, 2011
Action Group Impact:Energy
Waste
Water
Carbon
A ordability
Consumer
Minor Major
IHG Green Engage/Solutions NH EH
Credited Actions
1 Occupancy Sensors in O cesProvide occupancy sensors in all o ces tocontrol mechanical systems
1 Occupancy Sensors in Guest roomsProvide occupancy sensors for at least20% of guest rooms to control mechanicalsystems
1 Occupancy Sensors in Mul -OccupancySpacesProvide occupancy sensors in all mul -occupancy spaces to control mechanicalsystems
1 Humidstats in Guest Rooms
1 CO2 Monitors in Guest Rooms
1 Link Room Controls to BMS
Total Available Points 6 3
Narrative:Be er control of guest room temperature, humidity,and air quality can improve guest comfort. Usually onlytemperature is monitored and controlled. Be er overallroom air quality can be achieved by also monitoringhumidity and carbon dioxide. Addi onally, incorpora ngroom controls system into the building managementsystem (BMS) will also allow for hotel personnel to be ermanage guest rooms.
Use of a humidistat to measure humidity ensures thatthe levels never increase above an uncomfortable orunhealthy level. If humidity increases above a level ofapproximately 60% RH, the room air condi oning unitruns in cooling mode even if temperature is sa s ed.This dehumidi es the air to bring it back down to normallevels, and the unit then reheats the air if the temperaturedrops too low.
CO2 monitoring can improve general indoor environmentalquality in hotels, providing a higher level of health andcomfort to guests and workers. Headaches, drowsinessand low produc vity have all been correlated withhigh CO2 concentra ons. Installing a CO2 monitoringsystem would allow outdoor air ven la on rates to varydepending on the number of occupants and their ac vitylevel.
To properly install these controls, a building managementsystem (BMS) should be installed. The BMS would monitorall three sensors and ensure that the system operatesproperly to maximise comfort and save energy.
Considerations:
New HotelsThe e ciency of guest room controls is maximised bylinking it to a building management system. Dampersand control points would need to be installed to achievemaximum poten al.
Exis ng HotelsHVAC controls are most easily implemented early in thedesign phase and may be di cult to retro t to exis nghotels.
Advantages:Can signi cantly reduce energy demand; Allows fortrending and long term monitoring of hotel use which canassist in planning for maintenance and reducing costs.
Disadvantages:Cost premium for humidistat, humidi ers, CO2 sensor,controls and dampers.
References:Inncom Technologieswww.inncom.com
DBS Lodging Technologies. LLCwww.entergize.net/index.php
LTC Enterprises, LLCwww.lodgingtechnology.com
Other Relevant Action Groups:E-05, E-06, M-01, M-03
M-10Enhanced HVAC Guest Room Controls & CO2 MonitoringAll climates

42 Green Engage/SolutionsIssued on February 1, 2011
Action Group Impact:Energy
Waste
Water
Carbon
A ordability
Consumer
Minor Major
IHG Green Engage/Solutions NH EH
Level 1 Prerequisites
1 Variable Frequency DrivesVFDs on all motors 5 HP and larger
1 NEMA Premium E ciency MotorsUse only NEMA premium e ciencymotors on fans and pumps 1 HP andlarger
Level 2 Prerequisites1 Variable Frequency Drives
VFDs on all motors 5 HP and larger
1 NEMA Premium E ciency MotorsUse only NEMA premium e ciencymotors on all fans and pumps 1 HP andlarger
Total Available Points 2 2
Narrative:
Electric motors are used extensively in buildings and inpar cular in hea ng, ven la on and air condi oningsystems. Motors are used to pump water in hea ng,cooling and domes c water systems and also to run fansin ven la on systems. NEMA set up a premium e ciencymotor program in 2001. This program set standardsfor motors to meet in terms of their construc on withthe inten on to minimise losses and hence increasee ciency. This resulted in motors with e ciencies up to96% (2% to 8% be er than standard motors).
Even small increases in e ciency can result in drama csavings in energy and running cost, par cularly for largerhorsepower motors. For example, an improvement of 5%in the e ciency of a single 20 HP motor, opera ng for8,000 hours per year, will result in saving of $260 in energycosts and 4 metric tons of CO2 emissions per year.
Motor e ciency can be further improved through theuse of variable frequency drives (VFDs), which controlthe speed of a motor by varying the frequency of the ACsupply. VFDs allow the ow rate in systems to decrease atpart load. Since power consump on varies with the cubeof ow rate, signi cant energy savings can be realised.
VFDs can be placed on most HVAC systems, as long asthe systems are designed for variable ow. Since mostsystems rarely operate at full load, energy savings can besigni cant. Fans, pumps, and motors all can be ed witha VFD.
Considerations:New HotelsNEMA Premium motors typically carry an addi onal costpremium of up to 15%. This is considered cost e ec vewhen annual opera on exceeds 2,000 hours, with a
payback period of less than 5 years. Installing VFDs showsa signi cant savings immediately since a large por on ofenergy used in a building is for the HVAC systems.
Exis ng HotelsIt is not cost e ec ve to replace all exis ng standarde ciency motors with Premium motors. However,replacement should be considered where older motorsare running with par cularly low e ciency or when repairor rewinding is necessary. Cost analyses should be doneto determine the feasibility of installing VFDs on exis ngequipment. Also, the systems should be inspected to seeif valves will need to be replaced in order for the VFD tooperate properly.
Advantages:Motors are a low cost item – the energy savings o enjus fy using premium e ciency motors for both new andexis ng installa ons; VFDs improve interface for energytrending and are capable of ramped start up, reducingwear and surge loads.
Disadvantages:10 to 15% addi onal cost premium for NEMA Premiummotors; VFD power system harmonics may causeelectrical distor on and increase controls complexity.
References:NEMAwww.nema.org
US DOE: Energy Tips - Motor Systemswww.eere.energy.gov/industry/bestprac ces/pdfs/whentopurchase_nema_motor_systemts1.pdf
Other Relevant Action Groups:None
Motor Energy Ef iciency M-11All climates

43 Green Engage/SolutionsIssued on February 1, 2011
Although more than 70% of the earth’s surface is coveredin water, less that 1% lls the earth’s rivers and lakesand is available for drinking. Almost 20% of the world’spopula on do not have access to safe drinking water.20% lack adequate sanita on.
Many parts of the world are already experiencingfreshwater stress where the amount withdrawn as apercentage of total water available is shown to be 10%or more. This stress will con nue as popula ons con nueto grow with parts of Asia, the United States and parts ofEurope expected to use between 20 and 40% of the totalwater available to them. It is at this “moderate” stresslevel that scien sts an cipate impacts on local species.
Groundwater currently supplies around one third of theworld’s popula on and is par cularly cri cal in remoteareas. Due to excessive withdrawing of groundwaterresources, and nature being unable to keep up with thedemand, water tables have dropped. This has lead toland subsidence and the intrusion of saltwater into thegroundwater.
Energy associated with the pumping and treatment ofwater is signi cant and, across the world, accounts for
3% of energy consump on. Depending on the region,however, this can be signi cantly more. Water is alreadythe subject of li ga on across the world as environmentalorganisa ons take water distributors to court over thepoten al impact that giving water rights to developmentshas on ecosystems. Many developments have beenhalted based on this. This trend will con nue to grow.
W-01 Drinking Water Quality
W-02 Water Metering and Sub-Metering
W-03 Water E cient Fixtures
W-04 Water E cient Appliances and Systems
W-05 Reduce Irriga on Demand
W-06 Manage Stormwater
W-07 Water Collec on, Treatment & Re-Use System
W-08 Ozone Water Treatment/Chemical Reduc on
W-01 to W-08Water Action Groups

44 Green Engage/SolutionsIssued on February 1, 2011
Action Group Impact:Energy
Waste
Water
Carbon
A ordability
Consumer
Minor Major
IHG Green Engage/Solutions NH EH
Level 1 Prerequisite
1 Meet WHO Drinking Water QualityStandards
Credited Actions
1 Install Water FiltersA ached to all guest room faucets
1 No Bo led WaterPotable water supply should be qualitydrinking water. Do not supply or purchasebo led water
1 Water TreatmentWhere necessary, use either a reverseosmosis unit or chemical so ening/hardening to achieve a water hardness of<120mg/L
1 Trace/Recirculated Dead EndsNo dead ends (dead end length limited toless than pi)
Total Available Points 5 4
Narrative:
A key component of e ec ve water management issu cient potable water supply, distribu on and qualitydrinking water. Water storage is needed for waterconsump on, re and emergency supplies, however, toomuch storage may contribute to water quality issues.Water is usually distributed by a municipal water systembut if no municipal supply is available, water storage iscalculated from maximum possible water demand.
Dead ends in water distribu on system create stagnantwater leading deposi on and contamina on. Elimina ngdead end water mains is best prac ce to ensure a safepotable water supply for a hotel.
Water hardness is caused by the presence of calciumand magnesium ions in natural water due to geologicalforma ons. Hard water could cause build-up in supplysystems damaging pipes and pumps. Water so eningcould be done through reverse osmosis, RO (pressurised ltra on system through a membrane that could treat
water to drinking water quality minus disinfec on), orby adding sodium based zeolites. “So water” is waterde cient in mineral ions like calcium and magnesium.Water could be hardened by adding these minerals tothe water supply.
Water ltra on units could be a ached to hotel guestssinks to enhance taste, remove residual chlorine (if usedfor disinfec on) and reduce the need for bo led water.Guests can consume faucet water, and reduce wasteproduced by consuming bo led water. Bo led watercontains more embodied energy than faucet waterbecause of packaging and transporta on involved.
Considerations:
New HotelsAn assessment of water quality should be carried outprior to construc on. If potable water quality does notmeet WHO standards, a water treatment facility may benecessary. Dead ends for distribu on piping should beavoided.
Exis ng HotelsWater ltra on units can easily be retro t into guestrooms’ faucets. Providing quality drinking water fromfaucets removes the need for bo led water.
Advantages:Safe, reliable drinking water for guests and employees.
Disadvantages:RO is energy intensive; Hardening/so ening requiresoperator or automated machinery.
References:World Health Organiza on: Drinking Water Qualitywww.who.int/water_sanita on_health/dwq/en
American Water Works Associa on: Water Quality &Treatment Handbook
Other Relevant Action Groups:None
Drinking Water Quality W-01

45 Green Engage/SolutionsIssued on February 1, 2011
Action Group Impact:Energy
Waste
Water
Carbon
A ordability
Consumer
Minor Major
Narrative:
Hotel proper es are typically billed on a monthly basis bytheir local water u lity provider. Tracking this informa onthrough Green Measure allows hotel operators to seehow they compare against other hotels in IHG’s por olioand improve their performance over me.
Increasing the level of metering and the rate of monitoringhas a range of bene ts. Sub-meters can be designed orretro ed into water subsystems such as boilers, domes chot water, cooling towers, irriga on, and indoor plumbing xtures and ngs. Depending on the hotel’s building
management system and level of energy metering, thisdata can be used to trend equipment e ciencies, anddetect problems, and determine the e ect of changes inbuilding opera ons.
All meters, whether at a building or subsystem level, shouldbe read on at least a weekly basis, so that any trends orsigni cant varia ons can be quickly no ced. The accuracyof meters of also of great importance, and they should becalibrated and maintained according to manufacturersrecommenda ons. Hotels shall be required to keepaccurate records of all water consump on data.
Sub-metering can be installed for ligh ng, boilers, steam,gas, power, water piping and other u li es.
Considerations:New HotelsThe hotel owner needs to decide what to do with themetering data before installa on. A meter at the sourcelevel (a meter for the en re building from the u lity)should always be installed. New hotels should enrol inGreen Engage and begin uploading water consump ondata once the hotel is occupied. Meters should beinstalled for a life me above 20 years.
Exis ng HotelsIn exis ng hotels, iden fying and targe ng areas of highconsump on and greatest poten al for water savings willreduce costs of a new metering system. Exis ng metersshall be regularly checked to ensure calibra on withinmanufacturer’s tolerances and intervals.
Advantages:Long term water savings; Opera ons and maintenancetrouble shoo ng; Iden fy problems before failure anddown me; Provides data source for decision making;Measurement and veri ca on.
Disadvantages:Added capital cost; Requires advanced training or outsidecontracts for data interpreta on if feeding back to acentral system.
References:US EPA: Universal Water Meteringwww.epa.gov/watersense/docs/app_a508.pdf#Page=2
Other Relevant Action Groups:E-02, G-01
IHG Green Engage/Solutions NH EH
Level 1 Prerequisites
1 Enrol In Green MeasureOnce building is occupied, uploadmonthly water consump on data toGreen Measure and keep thoroughdocumenta on of all water u lity bills.
1 Par cipate in Green MeasureUpload a minimum of 12 months of waterconsump on data to Green Measure andkeep thorough documenta on records ofall water u lity bills.
1 Meter Whole Building Water UseInstall a water meter to track andupload water consump on to GreenMeasure at least weekly. Ensuremeters are calibrated to manufacturer’srecommenda ons.
Level 2 Prerequisite1 Meter Whole Building Water Use
Install a water meter to track andupload water consump on to GreenMeasure at least weekly. Ensuremeters are calibrated to manufacturer’srecommenda ons.
Credited Actions
1 Meter Subsystem Water UseInstall one or more water sub-meters.Report results to Green Measure at leastweekly. Ensure meters are calibrated tomanufacturer’s recommenda ons.
Total Available Points 3 3
LEED® WEc1
W-02Water Metering and Sub-Metering

46 Green Engage/SolutionsIssued on February 1, 2011
Action Group Impact:Energy
Waste
Water
Carbon
A ordability
Consumer
Minor Major
Narrative:
Managing water demand is key to reducing waterconsump on. By designing to improve water e ciencywithin the building, the water budget can be signi cantlyreduced. The building’s largest poten al consumers ofwater are likely to be showers, water closets, faucets andany kitchens within the building. Low ow xtures area huge step in water conserva on e orts. As with everytechnology, the e ciency in which we use water hasincreased since basic plumbing was introduced.
Aerators/ ow control devices restrict ow and createhigher pressure at discharge. Sensor ush xtures assurethe system does not run unless a user is in proximity. Low ow xtures are available for most applica ons including
restroom and food prepara on sinks, steam cookers,pre-rinse spray valves, showerheads, toilets, and laundryequipment. These xtures use on average 85% of ahotel's total potable water use. Low ow xtures couldpoten ally reduce overall use by at least 25%.
Ultra-low ow xtures are yet another way of furtherreducing water consump on, but will likely increaseguest complaints in a resort-type hotel. These xturesmay work well when water availability is low or scarce.Ultra low ow xtures could poten ally reduce potablewater use at a hotel by at least 40%.
Local plumbing codes must be checked to ensure thatlow/no ow xtures are permi ed.
Considerations:New HotelsDual ush xtures, low ow faucets and showerheadscould easily be installed during construc on. Aeratorsand ow control devices can be installed without no cefrom hotel guests due to pressurisa on of the water.
Exis ng HotelsFixtures for faucets and water closets could be replacedto reduce water consump on.
Advantages:
A visible sign to “green” commitment; Reduces waterconsump on and costs associated; Reduces amount ofwater needed to be heated thus less gas consump on.
Disadvantages:Guests may nd objec on to low ow showers watersupply, Higher chance of maintenance issues and guestmoving pertaining to low ow toilets; Filter changes forwaterless urinals (newer technologies do not requirechange out); Water closets, lavatories and showershave the same maintenance requirements as standard xtures; Sensor ba eries need to be replaced (>1,000
hours of use).
References:IHG Hotel Water Calculator
Water E ciency Manualwww.p2pays.org/ref/01/00692.pdf
Interna onal Plumbing Code (IPC), 2006, MaximumFixture Flow Rates:
Fixture Max. Flow Rate Units
Water ClosetsUrinalsShowerheads*Public lavatory faucets**Private lavatory faucets**Public metering lavatory faucetsKitchen and janitor sink faucetsMetering faucets
1.601.002.500.502.200.252.200.25
gpfgpf
gpmgpmgpmgpcgpmgpc
*Measures at 80 psi** Measured at 60 psi
gpf = gallons per ushgpm = gallons mer minutegpc = gallons per cycle
Other Relevant Action Groups:W-07
IHG Green Engage/Solutions NH EH
Level 1 Prerequisite
1 Meet IPC 2006 Maximum Flow RatesAll xtures meet maximum ow rates, oruse the calculator to show the hotel as awhole meets the baseline
Credited Actions
1 Aerators/Low Flow FaucetsRestrict ow on all guest room faucets to1.5 gpm or lower
1 Dual Flush/Low Flush Water ClosetsAverage ush rate of 1.2 gpf for all waterclosets
1 Sensor FlushInstall sensor ushes on all non-guesturinals and water closets
1 Waterless UrinalsUse only waterless urinals in public spacerestrooms
1 Low Flow ShowerheadsMaximum 1.8 gpm for all showerheads
Total Available Points 6 6
LEED® WEp1 & WEc2
W-03Water Ef icient Fixtures

47 Green Engage/SolutionsIssued on February 1, 2011
Action Group Impact:Energy
Waste
Water
Carbon
A ordability
Consumer
Minor Major
IHG Green Engage/Solutions NH EH
Credited Actions
1 Water E cient Laundry Facili esAll washing machines purchased shallachieve a minimum 10% water savingsfrom standard machines
1 Water E cient DishwashersAll dishwashing machines purchased shallachieve a minimum 10% water savingsfrom standard machines
1 Cooling Tower Water ManagementFor hotels that have a cooling tower,achieve a Cycle of Concentra on (COC)of >10
1 Cooling Tower Condensate ReturnUse 40% less water than a baseline case
1 Boiler Condensate ReturnInstall a return valve for condensate onall boilers
Total Available Points 5 5
Narrative:
Dish and clothes washing machines signi cantlycontribute to the amount of water use in a hotel. EnergyStar clothing washing machines can use up to 50%less water than a typical washing machine, as well ascontribute to poten al energy savings. Energy Star dishwashing machines can contribute up to a 25% savingsin water. These two technologies o er signi cant watersavings in hotels.
Cooling tower water consump on can be greatly reducedby minimising blowdown, or water discharged from thesystem. However, le unmonitored, minerals in thewater can damage cooling equipment and increase therisk of Legionnaire’s disease. Conduc vity meters andautoma c controls, combined with a comprehensivemaintenance program, can mi gate against these risksand allow an balance to be reached. Condensate returnwater can be collected from cooling towers and reusedfor a variety of uses.
Boiler systems can be designed to ensure return of steamcondensate to the boiler for reuse. Boiler blowdowncan be limited and should be checked con nuously andadjusted if necessary.
Considerations:New Hotels
The t-out of a new hotel should warrant the inclusionof highly e cient washing machines (dish and clothing).Boiler systems should be designed with return valvesfor condensate. Cooling tower condensate return isrecommended for areas with high humidity and shouldbe inves gated during the design process.
Exis ng HotelsNew e cient dishwashing and clothing washing machinescan be retro ed into exis ng hotels as a replacement forolder, less-e cient machines. Cooling tower conduc vitymeters and controls are easy to retro t and can have avery short payback. Retro ng condensate returnson exis ng cooling towers or boilers carry a signi cantaddi onal cost.
Advantages:Reduc on of demand (and costs) from potable watersupply and wastewater discharge.
Disadvantages:Ini al capital costs of e cient systems may be higherthan tradi onal systems.
References:EnergyStar™www.energystar.gov/index.cfm?fuseac on= nd_a_product
DOE Cooling Tower Managementwww1.eere.energy.gov/femp/program/watere ciency_bmp10.html
Other Relevant Action Groups:E-06, E-08, W-08
W-04Water Ef icient Appliances and Systems
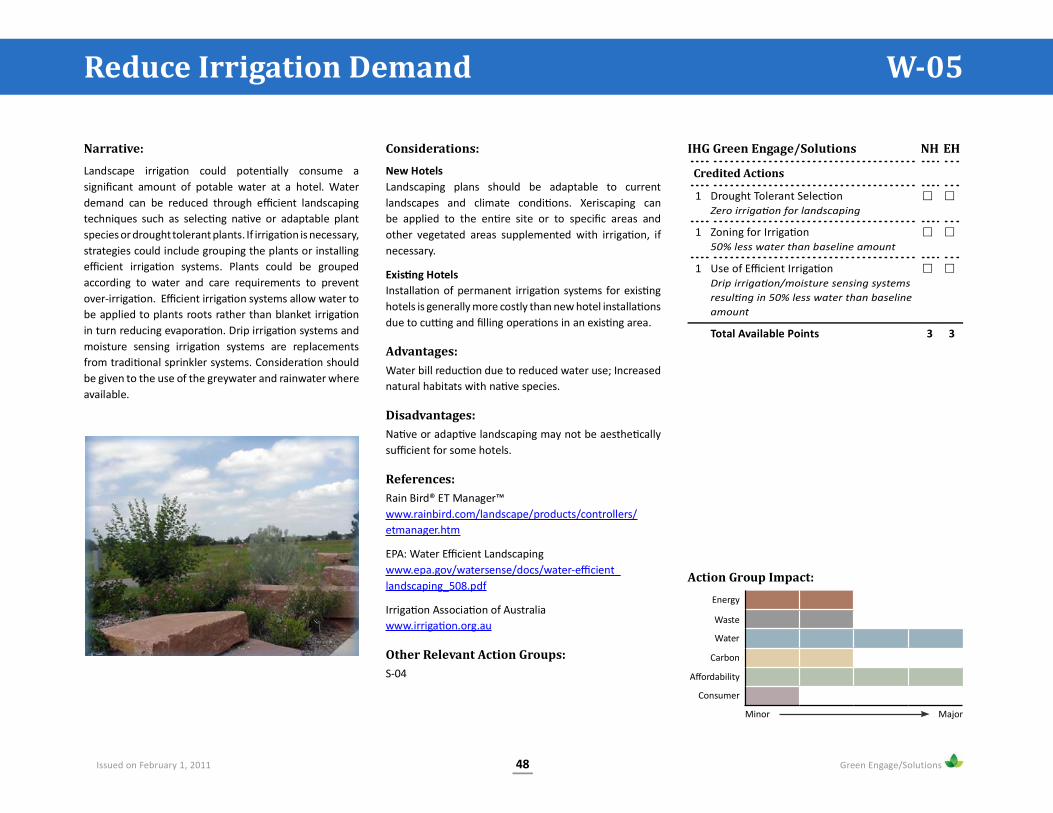
48 Green Engage/SolutionsIssued on February 1, 2011
Action Group Impact:Energy
Waste
Water
Carbon
A ordability
Consumer
Minor Major
IHG Green Engage/Solutions NH EH
Credited Actions
1 Drought Tolerant Selec onZero irriga on for landscaping
1 Zoning for Irriga on50% less water than baseline amount
1 Use of E cient Irriga onDrip irriga on/moisture sensing systemsresul ng in 50% less water than baselineamount
Total Available Points 3 3
Narrative:
Landscape irriga on could poten ally consume asigni cant amount of potable water at a hotel. Waterdemand can be reduced through e cient landscapingtechniques such as selec ng na ve or adaptable plantspecies or drought tolerant plants. If irriga on is necessary,strategies could include grouping the plants or installinge cient irriga on systems. Plants could be groupedaccording to water and care requirements to preventover-irriga on. E cient irriga on systems allow water tobe applied to plants roots rather than blanket irriga onin turn reducing evapora on. Drip irriga on systems andmoisture sensing irriga on systems are replacementsfrom tradi onal sprinkler systems. Considera on shouldbe given to the use of the greywater and rainwater whereavailable.
Considerations:
New HotelsLandscaping plans should be adaptable to currentlandscapes and climate condi ons. Xeriscaping canbe applied to the en re site or to speci c areas andother vegetated areas supplemented with irriga on, ifnecessary.
Exis ng HotelsInstalla on of permanent irriga on systems for exis nghotels is generally more costly than new hotel installa onsdue to cu ng and lling opera ons in an exis ng area.
Advantages:Water bill reduc on due to reduced water use; Increasednatural habitats with na ve species.
Disadvantages:Na ve or adap ve landscaping may not be aesthe callysu cient for some hotels.
References:Rain Bird® ET Manager™www.rainbird.com/landscape/products/controllers/etmanager.htm
EPA: Water E cient Landscapingwww.epa.gov/watersense/docs/water-e cient_landscaping_508.pdf
Irriga on Associa on of Australiawww.irriga on.org.au
Other Relevant Action Groups:S-04
W-05Reduce Irrigation Demand

49 Green Engage/SolutionsIssued on February 1, 2011
Action Group Impact:Energy
Waste
Water
Carbon
A ordability
Consumer
Minor Major
IHG Green Engage/Solutions NH EH
Credited Actions
1 Reduce and Control Stormwater RunoReduce post-construc on stormwater ow and volume from pre-construc on
condi ons
1 Treat StormwaterPrevent the introduc on of pollutantsand nutri ca on of local watershed: 80%Total Suspended Solids (TSS) removal,40% Total Phosphorus (TP) removal
Total Available Points 2 1
Narrative:
A new development drama cally disturbs the naturalhydrology of a site. Impervious surfaces do not allowrainfall to soak into the ground causing increasedstormwater runo , which the exis ng drainage systemmay not be capable of handling. Stormwater leaving thesite can be reduced by storing water on-site, reducing thespeed through structural and biological prac ces
Impervious surfaces accumulate pollutants and duringstorm events, these pollutants will be picked up by thestormwater and washed into the exis ng drainage system.By trea ng stormwater, the quality of water running o -site does not impair the local environment. There aremany methods for improving stormwater quality. Thesemethods may be are regional and adap ve to localclimate condi ons and responsive to site constraints.Some strategies may include bioswales in parking lotsand ltra on devices. In most municipali es stormwaterquality and quan ty control are required and regulated.
Nutri ca on is the increase of nutrients (nitrates andphosphates) to waterbodies, which causes increasedalgae growth at the water surface.
Considerations:New HotelsIn new construc on projects, the landscape design canbe focused to deter stormwater from leaving the site.Construc on of green roofs and rainwater collec on forreuse systems needs to be considered early in the design.Biological systems such as bioswales and constructedwetlands could be installed in conjunc on with structuralsystems.
Exis ng HotelsStormwater ltra on systems can be easily added tostormwater inlets. Rainwater collec on for irriga onpurposes could be constructed with the exis ng drainageon the building. Construc on of permeable pavementsystems could replace asphalt parking lots. Naturalising(crea ng drainage systems used before development) iscostly but will improve exis ng drainage.
Advantages:Reduce wastewater load on local Waste Water Treatmentplant; Reduc on of pollutants to watershed.
Disadvantages:Structural systems such as ltra on systems requiremaintenance.
References:US EPA: Reducing Stormwater Costs through Low ImpactDevelopment (LID) Strategies and Prac ceswww.epa.gov/owow/nps/lid/costs07/documents/reducingstormwatercosts.pdf
Interna onal Erosion Control Associa on (IECA)www.ieca.org
Other Relevant Action Groups:W-07, S-01, S-04, S-06
W-06Manage Stormwater

50 Green Engage/SolutionsIssued on February 1, 2011
Action Group Impact:Energy
Waste
Water
Carbon
A ordability
Consumer
Minor Major
IHG Green Engage/Solutions NH EH
Credited Actions
1 Rainwater Harves ngUse 40% less water than a baseline case
1 Greywater TreatmentUse 50% less water than a baseline case
1 Blackwater TreatmentTreat 100% of blackwater to local ter arystandards
Total Available Points 3 0
Narrative:
Increasing water demands and viable treatmenttechnologies make water recycling an important op on.Rainwater harves ng is a process of intercep ngstormwater runo and collec ng it for future use.Greywater recycling is trea ng water from sinks,baths, showers, washing machines, kitchen sinks anddishwashers for future reuse. Blackwater recycling istrea ng the e uent from water closets, urinals, wastedisposal units, kitchen sinks (without lters), and anyother highly polluted e uent source for future reuse.
With the addi on of ultra low ow xtures, hotelscould reduce potable water demand for bathroom useapproximately 70% by greywater recycling. By using ultralow ow xtures and rainwater harves ng, hotels in hot-humid, temperate, cold and hot dry regions could reducepotable water demand in bathrooms 55%, 50%, 45%,45%, respec vely.
While in some areas there are restric ons on the reuse ofrecovered water/wastewater, in general it can be reusedfor any purpose as long as it is treated to the requiredlevel.
Considerations:New HotelsThe viability of the system depends greatly on thequan ty of source water, treatment costs and availableend uses. Rainwater recycling systems should be usedin areas with average to high rainfall. Local codes mayprevent collec on of rainwater or greywater. Blackwatertreatment can be done with packaged systems suchas membrane bioreactors (MBR) or naturally throughconstructed wetlands or lagoons (odour may be an issuewith these types of systems if not maintained).
Exis ng HotelsRainwater harves ng could be implemented inconjunc on with exis ng rainwater collec oninfrastructure. Room must be available for storage tanksand ltra on systems.
Advantages:Reduc on of demand (and costs) from potable watersupply and wastewater discharge; Marke ng valuefor this rela vely inexpensive technology far exceedsany es mates of nancial savings; All wastewater istreated and recycled onsite reducing site wastewaterinfrastructure.
Disadvantages:Water storage tank loca on and size to be considered inbuilding layout; A separate water supply network needs tobe provided; Filtra on equipment requires maintenance;Increased cost as treatment requirements increase.
References:Metcalf & Eddy: Wastewater Engineering: Treatmentand Reuse
Design Manual: Constructed WetlandsTreatment of Municipal Wastewaterwww.epa.gov/owow/wetlands/pdf/Design_Manual2000.pdf
American Rainwater Catchment Systems Associa onwww.arcsa-usa.org
Other Relevant Action Groups:W-03, W-06
W-07Water Collection, Treatment and Re-Use System

51 Green Engage/SolutionsIssued on February 1, 2011
Action Group Impact:Energy
Waste
Water
Carbon
A ordability
Consumer
Minor Major
IHG Green Engage/Solutions NH EH
Credited Actions
1 Non-Toxic Detergents for LaundryUse only non-toxic detergents for laundry
1 Ozone Treatment for LaundryInstall ozone treatment laundry machines
1 Ozone Treatment of Aqua c Facili esInstall ozone treatment for pools
1 Ozone Treatment for Water FeaturesInstall ozone treatment for water features
Total Available Points 4 4
Narrative:
Tradi onal laundry cleaning methods create high levels ofenergy, chemical waste and water consump on. Chlorineand other chemical based detergents are poten ally toxicto organisms when released to the environment andcould create toxic residuals when stored.
Ozone is a very powerful disinfectant and rapidly oxidisesdissolved impuri es without the produc on of residualsand noxious gases. Ozone allows for shorter wash cyclesresul ng in signi cant energy and water/sewer surchargesavings. Ozone disinfec on is recommended to replacechlorine in pool water and water features/fountains.Ozone disinfec on could be 10-20% water savings and60% - 80% water hea ng savings compared to chlorinedisinfec on.
Considerations:
New HotelsSpace must to be provided for ozone treatment systems.Linking the ozone treatment systems together will savecosts.
Exis ng HotelsRetro ng of exis ng clothing washing machines withozone treatment technology is rela vely simple providingsu cient space exists. Replacement of older machines isalso possible with limited addi onal cost.
Advantages:Energy and water savings; Be er disinfec on (comparedto chlorine systems) and no residuals; Reduced garmentwear-and-tear; Faster washing me for laundry, Nochemical fees and reduced labour.
Disadvantages:High ini al capital cost; Sta educa on; Requires spacefor ozone tank.
References:Ar Clean Ozone Laundry Systemswww.ar clean.com
California Urban Water Conserva on Council: Poten alBest Management Prac ces, On-Premise LaundryFacili esh p://www.cuwcc.org/WorkArea/showcontent.aspx?id=7958
Other Relevant Action Groups:O-04, W-04
W-08Ozone Water Treatment/Chemical Reduction

52 Green Engage/SolutionsIssued on February 1, 2011
G-01 Establish a Waste Benchmark
G-02 Manage Ongoing Waste
G-03 Reuse and Dona on of Construc on and FF&EMaterials
G-04 Material Supplier Packaging Reduc on andRemoval Policy
G-05 Manage Site and Food Waste
Waste disposal creates a myriad of environmentalproblems that may not be reversed for many genera ons.Carbon emissions from transporta on, habitat deple onfor land lls, airborne pollutants from trash incinera on,toxins leaching into water supplies and greenhousegas emissions from decomposi on are some of theenvironmental impacts of waste disposal. With 124million tons of construc on debris buried in land lls everyyear, waste reduc on programs o er many opportuni esfor carbon reduc on and habitat protec on.
Waste reduc on and diversion programs begin atconstruc on and con nue through to opera ons.Comprehensive programs should encompass the supplychain waste reduc on and recycling/reuse programs.Understanding a hotel’s waste stream contribu ons willpresent many opportuni es for reduc ons in land lledtrash as well as disposal fees.
Waste Action Groups G-01 to G-05
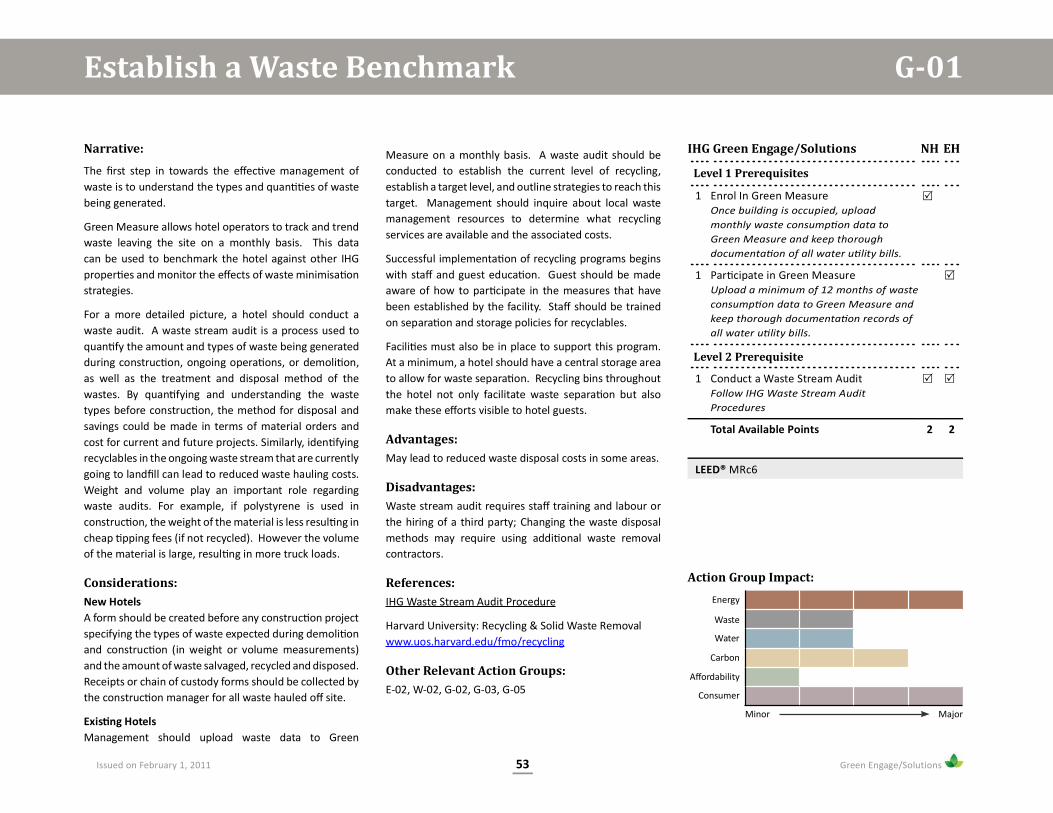
53 Green Engage/SolutionsIssued on February 1, 2011
IHG Green Engage/Solutions NH EH
Level 1 Prerequisites
1 Enrol In Green MeasureOnce building is occupied, uploadmonthly waste consump on data toGreen Measure and keep thoroughdocumenta on of all water u lity bills.
1 Par cipate in Green MeasureUpload a minimum of 12 months of wasteconsump on data to Green Measure andkeep thorough documenta on records ofall water u lity bills.
Level 2 Prerequisite
1 Conduct a Waste Stream AuditFollow IHG Waste Stream AuditProcedures
Total Available Points 2 2
LEED® MRc6
Narrative:
The rst step in towards the e ec ve management ofwaste is to understand the types and quan es of wastebeing generated.
Green Measure allows hotel operators to track and trendwaste leaving the site on a monthly basis. This datacan be used to benchmark the hotel against other IHGproper es and monitor the e ects of waste minimisa onstrategies.
For a more detailed picture, a hotel should conduct awaste audit. A waste stream audit is a process used toquan fy the amount and types of waste being generatedduring construc on, ongoing opera ons, or demoli on,as well as the treatment and disposal method of thewastes. By quan fying and understanding the wastetypes before construc on, the method for disposal andsavings could be made in terms of material orders andcost for current and future projects. Similarly, iden fyingrecyclables in the ongoing waste stream that are currentlygoing to land ll can lead to reduced waste hauling costs.Weight and volume play an important role regardingwaste audits. For example, if polystyrene is used inconstruc on, the weight of the material is less resul ng incheap pping fees (if not recycled). However the volumeof the material is large, resul ng in more truck loads.
Considerations:New HotelsA form should be created before any construc on projectspecifying the types of waste expected during demoli onand construc on (in weight or volume measurements)and the amount of waste salvaged, recycled and disposed.Receipts or chain of custody forms should be collected bythe construc on manager for all waste hauled o site.
Exis ng HotelsManagement should upload waste data to Green
Measure on a monthly basis. A waste audit should beconducted to establish the current level of recycling,establish a target level, and outline strategies to reach thistarget. Management should inquire about local wastemanagement resources to determine what recyclingservices are available and the associated costs.
Successful implementa on of recycling programs beginswith sta and guest educa on. Guest should be madeaware of how to par cipate in the measures that havebeen established by the facility. Sta should be trainedon separa on and storage policies for recyclables.
Facili es must also be in place to support this program.At a minimum, a hotel should have a central storage areato allow for waste separa on. Recycling bins throughoutthe hotel not only facilitate waste separa on but alsomake these e orts visible to hotel guests.
Advantages:May lead to reduced waste disposal costs in some areas.
Disadvantages:Waste stream audit requires sta training and labour orthe hiring of a third party; Changing the waste disposalmethods may require using addi onal waste removalcontractors.
References:IHG Waste Stream Audit Procedure
Harvard University: Recycling & Solid Waste Removalwww.uos.harvard.edu/fmo/recycling
Other Relevant Action Groups:E-02, W-02, G-02, G-03, G-05
G-01Establish a Waste Benchmark
Action Group Impact:Energy
Waste
Water
Carbon
A ordability
Consumer
Minor Major

54 Green Engage/SolutionsIssued on February 1, 2011
Action Group Impact:Energy
Waste
Water
Carbon
A ordability
Consumer
Minor Major
IHG Green Engage/Solutions NH EH
Level 1 Prerequisite
1 Adopt IHG Solid Waste ManagementPolicy
1 Provide Recycling Storage AreaSize area to sort/store paper, metal, glass,plas c & cardboard
Credited Actions
1 Provide Recycling BinsPlace recycling bins in the wastecollec on room in each hotel and allowfor the separa on of paper, plas c, glassand other recyclable materials
1 Recycle General WasteDivert at least 50% of total waste stream.Track and upload diversion rate to GreenMeasure.
1 Recycle Light BulbsRecycle all spent and broken light bulbscontaining mercury in accordance withthe EPA’s Universal Waste Rule
1 Recycle Used Ba eriesProvide a recycling bin in the wastecollec on and recycling room for portabledry-cell ba eries, including rechargeableba eries
Total Available Points 6 6
LEED® MRp2, MRc7, MRc8 & MRc9
Narrative:
Once the types and quan es of waste being generated bya hotel have been established, a Solid Waste Management(SWM) policy should be adopted to ensure that this wasteis being handled properly. A SWM policy should addresshow hotel waste is to be handled, in par cular iden fyingopportuni es for waste reduc on, reuse and recycling.The recycling program should encompass paper, metal,glass, cardboard, plas c, light bulbs and ba eries.Strategies that should be explored include engaging arecycling agency, par cipa ng in company take-backprograms and par cipa ng in dona on programs.
Successful implementa on of recycling programs beginswith sta and guest educa on. Guest should be madeaware of how to par cipate in the measures that havebeen established by the facility. Sta should be trainedon separa on and storage policies for recyclables.
Facili es must also be in place to support this program.At a minimum, a hotel should have a central storage areato allow for waste separa on. Recycling bins throughoutthe hotel not only facilitate waste separa on but alsomake these e orts visible to hotel guests.
Considerations:New HotelsThe collec on and storage strategy for recyclables shouldbe considered for new hotels and used to inform thedesign of waste storage and pick-up areas.
Exis ng HotelsEnsure that exis ng collec on areas are adequately sized,and add or expand if necessary. The waste managementpolicy should be conveyed to sta and guests to ensure it isfollowed. This includes making bins accessible to all hotelsta including front desk sta , as well as housekeeping
and guests. Recycling rates should be tracked anduploaded on a monthly basis to Green Measure.
Advantages:Reduced burden on land ll; Reduced waste hauling costs;Improved visibility of environmental objec ves to hotelguests.
Disadvantages:Poten al addi onal labour costs in separa ng waste.
References:IHG Solid Waste Management Policy
Other Relevant Action Groups:G-01, G-03, G-05, O-06
G-02Manage Ongoing Waste

55 Green Engage/SolutionsIssued on February 1, 2011
IHG Green Engage/Solutions NH EH
Level 2 Prerequisite
1 Construc on Waste Management PlanSubmit a Construc on WasteManagement Plan including weight orvolume of all poten al materials to bedemolished, recycled and disposed
Credited Actions
1 Construc on and Demoli onSalvage, reuse, recycle a minimum 50% ofconstruc on and demoli on debris
1 Deconstruc onDevelop a deconstruc on plan as partof the Construc on Waste ManagementPlan
1 FurnishingsReuse/recycle 10% of furnishings
Total Available Points 4 1
Narrative:
Waste management is comprised of the 3 Rs (reduce,re-use and recycle), with waste reduc on resul ngin the largest economic and environmental bene ts(e.g. reduc on in GHG emissions) followed by re-use,recycling/compos ng, energy recovery and disposal asworst case. Resource and waste management shouldbe considered at each stage of the building from design,through to construc on, opera on, maintenance anddeconstruc on.
Carefully “deconstruc ng” a building instead ofdemolishing will allow be er reuse and recycling ofbuilding materials and equipment.
Considerations:New HotelsAn on-site staging area or the o -site hauler for eachwaste type should be considered prior to projectcommencement. Poten al waste that could be collectedand salvaged on a construc on includes: concrete,ceramics, metals, inert waste, liquids and oils, wood,plasterboard, packaging, plas cs, insula on, furniture. Ifspace permits, Construc on and Demoli on (C&D) wastecan be treated using mobile processing plant.
Exis ng HotelsDeconstruc on of an exis ng hotel and the poten alloca on of building materials and equipment should beplanned early in the design phase.
Advantages:Cost savings through reducing the quan ty of raw materialsthrough re-use and recycling and by reducing waste toland ll; Reducing the space required at proper es forthe storage of recyclables and waste; Improved marketsthrough increasing e ciency of resource use and throughpromo on of industrial symbiosis.
Disadvantages:
In some regional loca ons, coordina on and staging mayrequire addi onal management and scheduling.
References:Ins tute of Civil Engineers: Demoli on Protocolh p://www.ice.org.uk/knowledge/specialist_waste_board.asp
Addis & Schouten: Design for Deconstruc on: C607:Principles of Design to Facilitate Reuse and Recycling
Other Relevant Action Groups:G-01, G-02, G-04, P-06
G-03Reuse and Donation of Construction and FF&E Materials
Action Group Impact:Energy
Waste
Water
Carbon
A ordability
Consumer
Minor Major
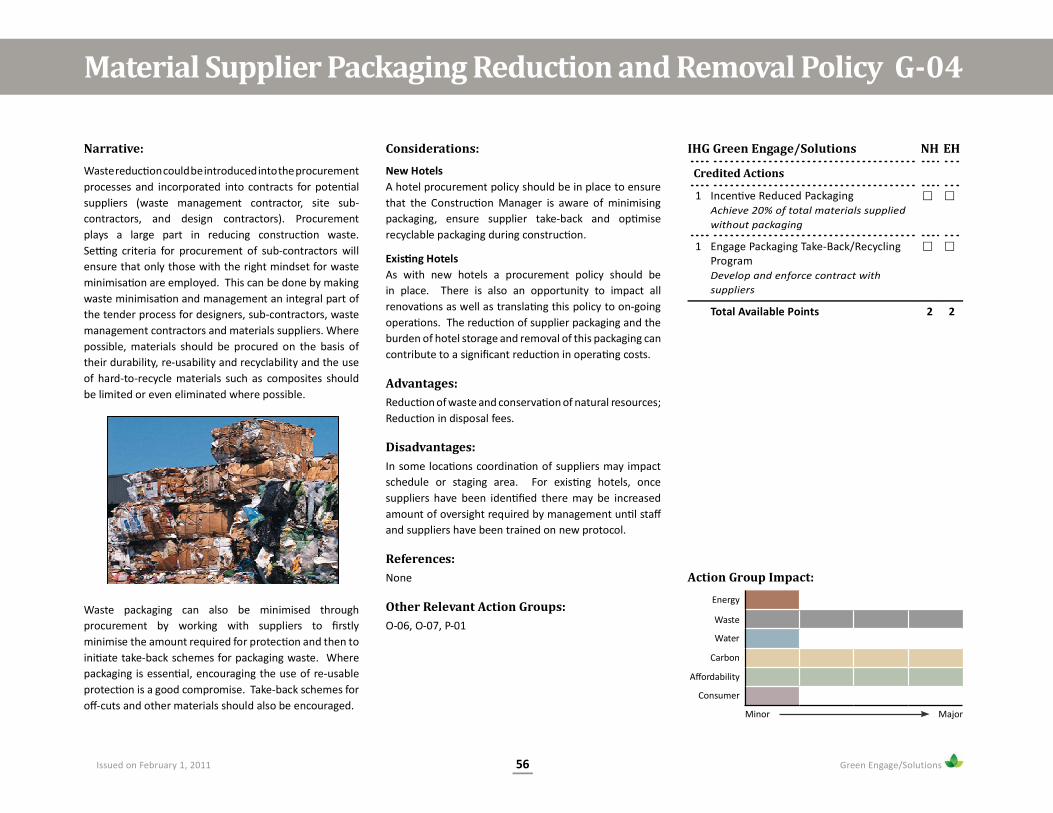
56 Green Engage/SolutionsIssued on February 1, 2011
IHG Green Engage/Solutions NH EH
Credited Actions
1 Incen ve Reduced PackagingAchieve 20% of total materials suppliedwithout packaging
1 Engage Packaging Take-Back/RecyclingProgramDevelop and enforce contract withsuppliers
Total Available Points 2 2
Narrative:
Waste reduc on could be introduced into the procurementprocesses and incorporated into contracts for poten alsuppliers (waste management contractor, site sub-contractors, and design contractors). Procurementplays a large part in reducing construc on waste.Se ng criteria for procurement of sub-contractors willensure that only those with the right mindset for wasteminimisa on are employed. This can be done by makingwaste minimisa on and management an integral part ofthe tender process for designers, sub-contractors, wastemanagement contractors and materials suppliers. Wherepossible, materials should be procured on the basis oftheir durability, re-usability and recyclability and the useof hard-to-recycle materials such as composites shouldbe limited or even eliminated where possible.
Waste packaging can also be minimised throughprocurement by working with suppliers to rstlyminimise the amount required for protec on and then toini ate take-back schemes for packaging waste. Wherepackaging is essen al, encouraging the use of re-usableprotec on is a good compromise. Take-back schemes foro -cuts and other materials should also be encouraged.
Considerations:
New HotelsA hotel procurement policy should be in place to ensurethat the Construc on Manager is aware of minimisingpackaging, ensure supplier take-back and op miserecyclable packaging during construc on.
Exis ng HotelsAs with new hotels a procurement policy should bein place. There is also an opportunity to impact allrenova ons as well as transla ng this policy to on-goingopera ons. The reduc on of supplier packaging and theburden of hotel storage and removal of this packaging cancontribute to a signi cant reduc on in opera ng costs.
Advantages:Reduc on of waste and conserva on of natural resources;Reduc on in disposal fees.
Disadvantages:In some loca ons coordina on of suppliers may impactschedule or staging area. For exis ng hotels, oncesuppliers have been iden ed there may be increasedamount of oversight required by management un l staand suppliers have been trained on new protocol.
References:None
Other Relevant Action Groups:O-06, O-07, P-01
Material Supplier Packaging Reduction and Removal Policy G-04
Action Group Impact:Energy
Waste
Water
Carbon
A ordability
Consumer
Minor Major

57 Green Engage/SolutionsIssued on February 1, 2011
IHG Green Engage/Solutions NH EH
Credited Actions
1 Manage Landscaping WasteDivert 50% of landscape waste throughmulching, compos ng or dona on
1 Manage Food WasteDivert 50% of food scraps throughcompos ng
Total Available Points 2 2
Narrative:
Green space on a hotel site o ers bene ts both to hotelguests and the environment. However, such spaces canalso generate a substan al quan ty of clippings, whichis commonly discarded as trash. Rather than sendingthis waste to a land ll, it can be put to use on site, eitherdirectly for mulching or by rst being composted, thenused as a fer lizer.
Food scraps are also suitable for compos ng, so long asmeat scraps are rst removed. This should be consideredin hotels which have the space on-site for a centralcompos ng facility, and the green space to jus fy such afacility. Compost from food scraps is rich in nutrients andcan also be used as fer lizer on-site or donated for use ino -site areas.
Considerations:
New HotelsHotels with signi cant green space should allocate spacefor a central compos ng facility for site and food scrapwaste. Those with less space should implement a sitemanagement policy in which clippings are used formulching.
Exis ng HotelsThe development of a compos ng facility may be di cultfor exis ng hotels. However the use of clippings formulching is simple to implement and carries no capitalcost.
Advantages:Reduced burden on land ll; Reduced fer lizer costs;Environmentally bene cial to inorganic (synthe c)fer lizers.
Disadvantages:Sta ng requirements to sort waste and manage compost;Odour concerns.
References:IHG Sustainable Integrated Pest Management, ErosionControl and Landscape Management Plan
Other Relevant Action Groups:O-05, O-06, G-01, G-02, S-01
G-05Manage Site and Food Waste
Action Group Impact:Energy
Waste
Water
Carbon
A ordability
Consumer
Minor Major

58 Green Engage/SolutionsIssued on February 1, 2011
These principles should be followed when consideringthe selec on of materials:
• Allow exibility in the design of the project
• Be suitable for any future modi ca ons that maybe necessary in the future - lowering future spacecon gura on change costs for example
• Promote the increased health and welfare of buildingoccupants.
• Improve the produc vity of occupants
• Save energy and embodied energy
• Be durable
• Reduce future maintenance costs for the life cycle offacility
New products are con nuing to enter the marketplace toaddress the items listed above as manufacturers respondto the demands of building owners and consumers.
A number of standards have now been developed formaterials. Some of these are listed below:
CarpetsCarpet and Rug Ins tute Indoor Air Quality Carpet Tes ngProgram | www.carpet-rug.com
PaintsGreen Seal Standard GS-11| www.greenseal.org
Sealants / Caulks / AdhesivesSouth Coast Air Quality Management District (SCAQMD)
Rule #1168 | www.aqmd.gov
Wood ProductsForest Stewardship Council | www.fscus.org
ANSI A208.1 (for par cleboard) | www.web.ansi.org
Recycled ContentInterna onal Standard ISO 14021 1999 - Environmental
Labels and Declara ons | www.iso.org
P-01 Eco-Embedded Materials and Speci ca on
P-02 Low-Emi ng Finish Materials
P-03 Recycled and Recyclable Materials
P-04 Regionally Manufactured and/or RegionallySourced Materials
P-05 Rapidly Renewable/Sustainable HarvestedMaterials
P-06 Design for Material Reduc on and Flexibility ofSpaces
P-07 Mold/Contaminant Resistant Materials andProcess
Product and Materials Action Groups P-01 to P-07

59 Green Engage/SolutionsIssued on February 1, 2011
Action Group Impact:Energy
Waste
Water
Carbon
A ordability
Consumer
Minor Major
P-01Eco-Embedded Materials Speci ication
Narrative:
Speci ca ons ensure a level on consistency throughoutbrands and are a way to determine the quality of aproduct which has been previously reviewed. Embeddingsustainability in to speci ca ons allows hotels a defaultlevel of sustainability which the hotel General Manager orOwner can be con dent will be applied in their property.
The follow criteria is widely used for construc onmaterials, ongoing consumables, and durable goods,in par cular high cost, high impact and high volumematerials such as carpet, paint, oor, wall board, casework, le, insula on, structural members, and windows.These criteria apply to new construc on, renova ons,and ongoing hotel opera ons.
•Local Availability: Locally extracted and manufacturedmaterials should be chosen where possible
•Rapidly renewable content: Materials that have agrowth cycle and can be harvested in less than 10 years,allow products to be manufactured without deple ngresources
•Recycled content: Recycled content materials are madefrom waste material from either a manufacturing processor consumer use
•Low toxicity: Products such as uorescent light bulbsand ba eries contain hazardous materials, howeverthere are products that contain lower levels of thesetoxins or are made to be reusable
•Durability: Materials that last longer with lessmaintenance use less embodied energy over their life
•Speed of assembly: Using materials that can beassembled more quickly can reduce energy requiredduring construc on
Considerations:
New HotelsDevelop speci ca ons that incorporate environmentalstandards. All contractors and subcontractors shouldbe educated on the use and importance of thesespeci ca ons.
Exis ng HotelsStandardised environmental materials speci ca onsshould be developed for ongoing consumables, durablegoods, mercury containing light bulbs, ba eries and to beincluded in all renova on specs.
Advantages:Possible reduced construc on cost; Possible increasedbuilding durability.
Disadvantages:Some products may have limited availability, higher costsand/or longer lead mes in some markets. Allow for theseconsidera ons in budget and construc on schedule.
References:IHG Sustainable Purchasing Policy
IHG Terms and Condi ons
BuildingGreen LLCwww.buildinggreen.com
Na onal Ins tute of Building Science: WBDGwww.wbdg.org/design/greenspec.php
Other Relevant Action Groups:O-07, G-04, P-02, P-03, P-04, P-05
IHG Green Engage/Solutions NH EH
Level 1 Prerequisites
1 Adopt IHG Sustainable Purchasing Policy
1 Standardised Speci ca on for GreenMaterialsDevelop speci ca ons for construc onmaterials using IHG Preferred SupplierList
Credited Actions
1 Standardised Speci ca on Language forProcurement of Regionally Speci c GreenMaterials
Total Available Points 3 2
LEED® MRp1, MRc1 & MRc2.1

60 Green Engage/SolutionsIssued on February 1, 2011
Action Group Impact:Energy
Waste
Water
Carbon
A ordability
Consumer
Minor Major
IHG Green Engage/Solutions NH EH
Level 1 Prerequisites
1 Low or No VOC PaintInterior Latex Flat: 50g/L; Non-Flat:150g/L
1 Low or No VOC AdhesivesMul purpose Construc on Adhesive:70g/L; Wood Floor Adhesive 100g/L;Robber Floor Adhesive 60g/L; CeramicTile Adhesives: 65g/L, Sub oor Adhesives:50g/L; Drywall & Panel Adhesives 50g/L
Credited Actions
1 Low or No VOC Coa ngsFloor Coa ng: 100g/L; Sealers: 250g/L;Stains: 250g/L
1 Low or No VOC Carpet SystemsIndoor Carpet and Carpet Pad: 50g/L;Carpet Fibers should meet CRI label orequivalent
1 Low or No VOC Hard Surface FlooringFloor Coa ng: 100g/L; Varnish: 350g/L;Lacquer: 550g/L
1 Composite Wood & Agri breNo added urea-formaldehyde
Total Available Points 6 6
Narrative:
The quan ty of indoor air contaminants that areodorous, irrita ng and/or harmful have a high impacton the comfort and well-being of hotel guests, sta andinstallers. Materials that have a high impact on indoor airquality are adhesives and sealants, paints and coa ngs,carpet systems and ooring and composite wood &agri bre products.
For reference standards on low vola le-organic-compound (VOC) weights, refer to South Coast Air QualityManagement District Rules, Green Seal Standards andthe Green Label program, among others.
Considerations:New HotelsConsidera on should be made for the inclusion of low-emi ng materials into performance speci ca ons. Thereference web sites outlined on this Ac on Group havespeci c language and performance requirements whichcan be added as relevant on individual projects based onmaterials being used and building type
Exis ng HotelsEmissions diminish and chemicals present in themanufacturing process dry and air out. Therefore,exis ng projects should only pursue these points whenconsidering interior nish/millwork replacement andtouch-ups
Advantages:
Reduced ini al odour, reduc on in ush-out me,reduc on in hazardous materials for storage and control
Disadvantages:Possible longer lead me for availability in certain globalmarkets. Possible addi onal management required forthe review of acceptable tolerances for VOCs or trainingof appropriate “green labelled” products.
References:South Coast Quality Management Districtwww.aqmd.gov
Green Sealwww.greenseal.org
The Carpet and Rug Ins tutewww.carpet-rug.org
US EPA: Health Problems Caused By Vola le OrganicCompoundswww.epa.gov/iaq/pubs/hpguide.html#VOCs
Other Relevant Action Groups:O-09, P-01
P-02Low-Emitting Finish Materials

61 Green Engage/SolutionsIssued on February 1, 2011
Action Group Impact:Energy
Waste
Water
Carbon
A ordability
Consumer
Minor Major
IHG Green Engage/Solutions NH EH
Credited Actions
1 Specify and Install Recycled Materials20% of total base building materials
1 Specify and Install Materials which canbe Recycled at End of Life10% of total base building materials
1 Specify and Install Recycled ContentCarpet Tile in Lieu of Broad Loom60% recycled content carpet le
1 Select Carpet Tile from a Manufacturerwith a Take Back ProgramPar cipate in program when renova ng
1 Specify and Install RecycledContent Furnishings5% of public space furniture
Total Available Points 5 3
Narrative:
Using materials with recycled content reducesenvironmental impacts from extrac on and processingof virgin materials. As a global standard for recycledcontent, ISO 14021 1999- Environmental labels andDeclara ons can be used. Most projects will aim for10-20% of recycled content in materials based on totalmaterial cost in projects.
Recycled content can be both post-consumer such aswaste generated by households as well as pre-consumer,which entails material diverted from waste stream duringthe manufacturing process.
Recycled content can be found in a wide array of nishesand furniture such ceiling les, o ce chairs, and structuralelements such as concrete, engineered wood and steel.
Preference should be given to those products that canbe easily recycled at the end of their use such as steeland aluminium. Many furniture and ooring companiesprovide take-back and recycling programs. Performancespeci ca on language should outline inclusion formaximised recycled content and recyclability wherelocally available and economically feasible. Trackingrecycled content informa on from suppliers should beincorporated into contracts.
Considerations:New HotelsDesign teams should op mise the design to use recycledcontent construc on and nish materials. In most regionswhen incorporated early in design this can be done in acost neutral capacity.
Exis ng HotelsWhen purchasing new furniture and nish materials highrecycled content products should be selected.
Advantages:
Some manufacturers of materials with high recycledcontent have programs to take back the materials, ina renova on this could have a signi cant impact to thereduc on of construc on waste. Addi onally for itemssuch as carpet and ceiling le this may allow for thestorage of less replacement stock.
Many base building materials have a high recycledcontent by the nature of their composi on for examplesteel and glass.
Disadvantages:Product lead mes may need to be adjusted based onavailability in some markets.
References:MBDC: Cradle to Cradlewww.c2ccer ed.com
CalRecycle: Recycled-Content Product Directorywww.ciwmb.ca.gov/rcp
Other Relevant Action Groups:O-05, P-01
P-03Recycled and Recyclable Materials

62 Green Engage/SolutionsIssued on February 1, 2011
Action Group Impact:Energy
Waste
Water
Carbon
A ordability
Consumer
Minor Major
IHG Green Engage/Solutions NH EH
Credited Actions
1 Specify and Install RegionallyManufactured Materials20% of total base building materials
1 Specify and Install RegionallySourced and Manufactured Materials10% of total base building materials
1 Use Local Aggregate for Concrete Mix
1 Use Locally Manufactured Furniture inLobby and/or Lounge
Total Available Points 4 1
Narrative:
Signi cant energy is consumed to transport buildingmaterials from their source to the site. Using regionallyextracted, processed, manufactured and/or recoveredmaterials supports the use of indigenous resourcesand reduces the environmental impact resul ng fromtransporta on. Within the sustainable construc onindustry, regional is commonly de ned as within 800kilometres (500 miles) of the project site. Use of regionallymanufactured materials requires a local site or regionalapproach. Most loca ons should have at minimum localgypsum board manufacturers, steel mills and concreteplants. In addi on, regional materials are o en adaptedto speci c local climate challenges that each project teammay be unaware of.
U lisa on of regional materials is a strategy whichalso provides a good way to demonstrate the project’scommitment to the community and local ar sans.
Considerations:New HotelsProject teams need to work to iden fy and determinelocal availability of materials and their rela onship tobuilding design. Incorpora ng regional materials earlyin design ensures a limited cost risk and may presentopportuni es for savings. It is also best if the designteam iden es the use of regional materials in thegeneral condi ons (division 1) of speci ca ons to clearlycommunicate to the contractor the targets for materialuse.
Exis ng HotelsRegional materials are not exclusively limited toconstruc on materials and general managers shouldreview and consider on-going suppliers and consumablegoods. Addi onally, during renova ons or scheduled
maintenance locally sourced and/or manufacturedproducts should be selected when purchasing/replacingnew furniture and nish materials.
Advantages:In des na on loca ons local or regional materials mayenhance the guest experience as well as showing supportfor the local community and heritage.
In many cases local materials are available on shorterno ce given their short haul me; this makes stagingand scheduling these materials easier for both new andexis ng hotels. A large por on of base building materialssuch as concrete, steel and glass are manufactured locally.Addi onally some recycled alterna ves to Portlandcement enhance concrete strength while reducingembodied energy
Disadvantages:Some markets may have limited op ons dependant onloca on. In these cases product lead mes may need tobe adjusted based on availability.
References:None
Other Relevant Action Groups:O-05, P-01
Regionally Manufactured/Regionally Sourced Materials P-04

63 Green Engage/SolutionsIssued on February 1, 2011
Action Group Impact:Energy
Waste
Water
Carbon
A ordability
Consumer
Minor Major
IHG Green Engage/Solutions NH EH
Credited Actions
1 Specify and Install RapidlyRenewable Materials10% of total nish materials
1 Specify and Install SustainablyHarvested Rapidly Renewable Materials10% of total nish materials
1 Install Linoleum Flooring in Place of VinylTile or Sheet Flooring
1 Install Cork Flooring in Place of HardWood Flooring
Total Available Points 4 2
Narrative:
Most building materials u lise nite raw resourcesor resources with long regenera on cycles. U lisingrapidly renewable materials that have less than tenyear harvest periods diminishes the ecological footprintof a building project. Common examples are bamboo,wool, co on ba insula on, agri bre, linoleum ooring,wheatboard, strawboard and cork. Wheatboard isan excellent replacement for par cle board. Rapidlyrenewable materials o en have a signi cant pricepremium, o en because they serve a niche market.Unfortunately, as demand increases some suppliers areo ering products that are the result of environmentallydetrimental agricultural prac ces—such as clearing oldgrowth forests to grow bamboo. When selec ng rapidlyrenewable products, it is important to choose productsfrom sustainable sources.
Considerations:
New HotelsRapidly renewable nishes, furniture and serviceproducts provide a great opportunity to demonstratethe company’s commitment to sustainability and thuseduca ng the sta and community. However, thedesire for visibility should not result in using renewablematerials even though they have high embodied energydue to distance travelled from their source (e.g. bamboofrom South Asia to United States).
Exis ng HotelsSustainably harvested rapidly renewable materials canbe found in a wide variety of products from fabric totoiletries. Interior renova ons also o er opportuni es toupgrade furniture and nishes to products with rapidlyrenewable content.
Advantages:Rapidly renewable materials are widely iden able assustainable materials and can improve public percep on.
Disadvantages:Lack of product availability or cost increase may limitop ons in some markets; Products that are long distanceimports and/or produced through environmentallydamaging prac ces would send a contradictorymessage.
References:Environ Biocomposites Mfg. LLCwww.environbiocomposites.com
Green Depotwww.greenmakersupply.com/pages/construc on_materials/110.php
Other Relevant Action Groups:P-01
P-05Rapidly Renewable/Sustainable Harvested Materials

64 Green Engage/SolutionsIssued on February 1, 2011
Action Group Impact:Energy
Waste
Water
Carbon
A ordability
Consumer
Minor Major
IHG Green Engage/Solutions NH EH
Credited Actions1 Advanced Framing
Submit design demonstra ng reduc onin framing members and implementa onplan
1 Designing for Standard DimensionsSubmit design demonstra ng standarddimensions
1 Modular/Pre-Fab Construc onSubmit design demonstra ng use ofmodular and/or pre-fab systems inconstruc on
1 Flexibility of SpacesSubmit design and implementa on planfor mul ple uses of space
Total Available Points 4 0
Narrative:
Designing for material reduc on can reduce the wastestream as well as the cost of a project. Using advancedframing prac ces, the overall number of framing membersis reduced and the depth of the members increased. Thistechnique uses less material waste and provides a largerwall cavity for increased insula on. Increased modularityand designing to u lise standard product dimensions willdecrease the amount of construc on waste generatedon-site and simplify construc on. Modular systems,such as structurally insulated panel systems, reduce theneed for on-site construc on decreasing me, costs anderrors.
All of these systems and techniques require increaseda en on to detail in design and planning. Further takingthe me to design in exibility of programs into spaceswill reduce the need for costly and disrup ve addi onsand renova ons in the future.
Considerations:
New HotelsCrea ng a standard design that can be easily adjusted to t the speci c site and climate characteris cs will reduce
the need for me intensive redesigns with each project.
Exis ng HotelsThese strategies do not apply to exis ng projects.
Advantages:Reduced material costs; Reduced construc on wastedisposal costs; Increased energy e ciency; Reduces theneed for future construc on
Disadvantages:Increased design e ort; Lack of exper se and/or materialsin some markets
References:Southface Energy Ins tutewww.southface.org/default-interior/Documents/awf-advanced_frame00-770.pdf
Structural Insulated Panel Associa onwww.sips.org
Other Relevant Action Groups:G-03
P-06Design for Material Reduction and Flexibility of Spaces

65 Green Engage/SolutionsIssued on February 1, 2011
Action Group Impact:Energy
Waste
Water
Carbon
A ordability
Consumer
Minor Major
Narrative:
Mold growth and contaminants in indoor environmentscan cause persistent problems from producing stainingand foul odours to serious respiratory illnesses. Removingand remedia ng contaminants a er it has been no cedcan be a very expensive process.
Mold will grow anywhere that excess moisture is present.The best way to combat mold growth is to controlthe moisture introduced to interior spaces. Duringconstruc on, the staging and storage of absorbentmaterials and air handling equipment is cri cal topreven ng the introduc on of contaminants. Deliveringand storing ducts covered and sealed will prevent dust anddebris from contamina ng the air handling equipment. Ifabsorbent materials do get wet, allowing thorough dryout before installa on will prevent future mold growth.
Proper envelope detailing and installa on will deterrain and humid air in ltra on and allow for full dry outwhen moisture is introduced. Vapour barriers/retardersshould be limited to use in the correct climate zones witha en on paid to how the walls will dry out. Using moldresistant materials will deter mold growth when smallamounts of moisture are present. Bathrooms, kitchensand other humid areas of the building should provide theappropriate automated exhaust op ons.
Considerations:New HotelsDesign teams should consider climate and movement ofmoisture through the envelope when crea ng details andwall construc ons. Construc on teams should create andimplement a Construc on Air Quality Management Plan.
Exis ng HotelsRegular inspec ons for leaks and condensa on buildup should be implemented and problems remediatedimmediately. When renova ng exis ng facili es,consider installing bathroom exhausts that vent to theoutside and replacing interior wall coverings with vapourpermeable nishes that allow walls to dry out.
Advantages:Increased durability of construc on materials; Odourreduc on; Increased guest sa sfac on; Less in ltra onreduces energy consump on
Disadvantages:Requires supervision during construc on; Can requireadded design exper se
References:Sheet Metal and Air Condi oning Contractor's Na onalAssocia onwww.smacna.org
US Environment Protec on Agencywww.epa.gov/iaq/schooldesign/controlling.html
Other Relevant Action Groups:B-04
P-07Mold/Contaminant Resistant Materials and Process
IHG Green Engage/Solutions NH EH
Credited Actions
1 Specify Mold Resistant ProductsSpecify mold resistant products whereappropriate
1 Moisture Resistant Details/DesignSpecify moisture resistant details whereappropriate
1 Spot ExhaustInstall spot exhausts in all bathrooms,kitchens and pool rooms
1 Envelope Dry OutAllow envelope to fully dry out beforeinstalling moisture barriers
1 Construc on Materials Storage/HandlingFollow a Construc on IAQ ManagementPlan
Total Available Points 5 1

66 Green Engage/SolutionsIssued on February 1, 2011
S-01 Environmentally Sensi ve Site Management
S-02 Des na on Protec on
S-03 Building Si ng
S-04 Ecology and Landscaping
S-05 Reduce Auto Use Impact
S-06 Parking
According to the US EPA, developed land use in 2004 wasequal to around 108 million acres. This was an increase of24% over the previous 10 years. This trend is replicatedthroughout much of the world as popula ons grow andmigrate to urban areas of the world.
With this growth, land that could have been put toother uses is lost. These uses could include land forgrowing food, and diversi ed ecosystems. As paved areasgrow, rainwater is no longer a enuated at the point ofcontact with the ground and immediately runs o takingcontaminants and eroding soil. Waterways get polluted.
Developed land tends to consist of a high percentageof hardscape - such as parking areas and building roofs.These are heated by the sun during the day and re-emitthat heat at night which can raise local air temperatures.This can increase air condi oning loads for a building andalso impact insects and other wildlife.
A site should be chosen, designed, and constructed, tominimize the impacts listed above. The social impact ofthe site should also be considered along with the ease ofaccess to those working at the site.
S-01 to S-06Site Action Groups
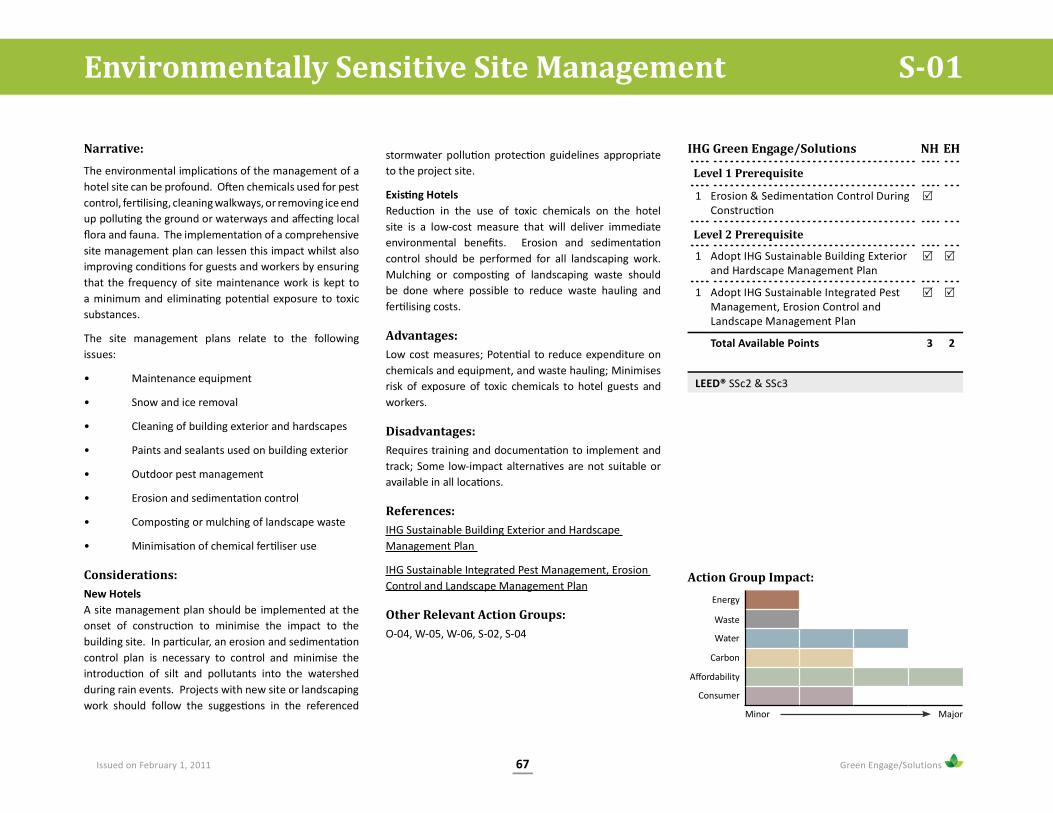
67 Green Engage/SolutionsIssued on February 1, 2011
S-01Environmentally Sensitive Site Management
Narrative:
The environmental implica ons of the management of ahotel site can be profound. O en chemicals used for pestcontrol, fer lising, cleaning walkways, or removing ice endup pollu ng the ground or waterways and a ec ng local ora and fauna. The implementa on of a comprehensive
site management plan can lessen this impact whilst alsoimproving condi ons for guests and workers by ensuringthat the frequency of site maintenance work is kept toa minimum and elimina ng poten al exposure to toxicsubstances.
The site management plans relate to the followingissues:
• Maintenance equipment
• Snow and ice removal
• Cleaning of building exterior and hardscapes
• Paints and sealants used on building exterior
• Outdoor pest management
• Erosion and sedimenta on control
• Compos ng or mulching of landscape waste
• Minimisa on of chemical fer liser use
Considerations:New HotelsA site management plan should be implemented at theonset of construc on to minimise the impact to thebuilding site. In par cular, an erosion and sedimenta oncontrol plan is necessary to control and minimise theintroduc on of silt and pollutants into the watershedduring rain events. Projects with new site or landscapingwork should follow the sugges ons in the referenced
stormwater pollu on protec on guidelines appropriateto the project site.
Exis ng HotelsReduc on in the use of toxic chemicals on the hotelsite is a low-cost measure that will deliver immediateenvironmental bene ts. Erosion and sedimenta oncontrol should be performed for all landscaping work.Mulching or compos ng of landscaping waste shouldbe done where possible to reduce waste hauling andfer lising costs.
Advantages:Low cost measures; Poten al to reduce expenditure onchemicals and equipment, and waste hauling; Minimisesrisk of exposure of toxic chemicals to hotel guests andworkers.
Disadvantages:Requires training and documenta on to implement andtrack; Some low-impact alterna ves are not suitable oravailable in all loca ons.
References:IHG Sustainable Building Exterior and HardscapeManagement Plan
IHG Sustainable Integrated Pest Management, ErosionControl and Landscape Management Plan
Other Relevant Action Groups:O-04, W-05, W-06, S-02, S-04
IHG Green Engage/Solutions NH EH
Level 1 Prerequisite
1 Erosion & Sedimenta on Control DuringConstruc on
Level 2 Prerequisite
1 Adopt IHG Sustainable Building Exteriorand Hardscape Management Plan
1 Adopt IHG Sustainable Integrated PestManagement, Erosion Control andLandscape Management Plan
Total Available Points 3 2
LEED® SSc2 & SSc3
Action Group Impact:Energy
Waste
Water
Carbon
A ordability
Consumer
Minor Major

68 Green Engage/SolutionsIssued on February 1, 2011
IHG Green Engage/Solutions NH EH
Credited Actions
1 Site Selec onAvoid prime parkland, farmland,proximity to wetlands and bodies ofwater, protected species habitat
1 Species & Habitat Protec onProvide wildlife corridors, ecologicalbu ers, restore na ve species
1 Habitat Educa onProvide guided tours, literature andsignage to inform guests of sensi vehabitat to avoid
Total Available Points 3 1
Narrative:
Construc on and tourism can be very disrup ve to localecosystems and endanger the natural resources that makea loca on a desirable des na on. Whenever possible,choosing a building site that has already been disturbedand/or is not home to sensi ve species is the rst step toreducing the nega ve impact of increased human ac vityin an area. Landscape and site planning should protectna ve species with wetland bu ers, wildlife corridors andhabitat restora on. Trained tour guides and other meansof signage and visitor educa on should be employed tolimit damage to protected areas.
Considerations:
New HotelsLanguage explaining proper site prepara on andmaintenance should be included in speci ca ons. Allprojects could prac ce site and species protec onstar ng with a basic ecological audit that will inform sitedesign and use.
S-02Destination Protection
Exis ng HotelsConsidera on should be made for habitat restora onwhen designing new landscape features and guides and/or educa on for guests visi ng ecologically fragile areasshould be provided
Advantages:Reduces invasive species; lowers landscaping maintenancecosts; Creates a stronger sense of place; Preserves thenatural character of the des na on environment.
Disadvantages:Limits buildable site; Construc on erosion controlrequires oversight and maintenance.
References:
US EPA: Na onal Pollutant Discharge Elimina on System,Chapter 3www.epa.gov/npdes/pubs/chap03_conguide.pdf
US EPA: NPDES, Stormwater Pollu on Preven on Guidewww.epa.gov/npdes/pubs/sw_swppp_guide.pdf
Nature Servewww.natureserve.org/
Other Relevant Action Groups:S-01, S-04, S-05 Action Group Impact:
Energy
Waste
Water
Carbon
A ordability
Consumer
Minor Major
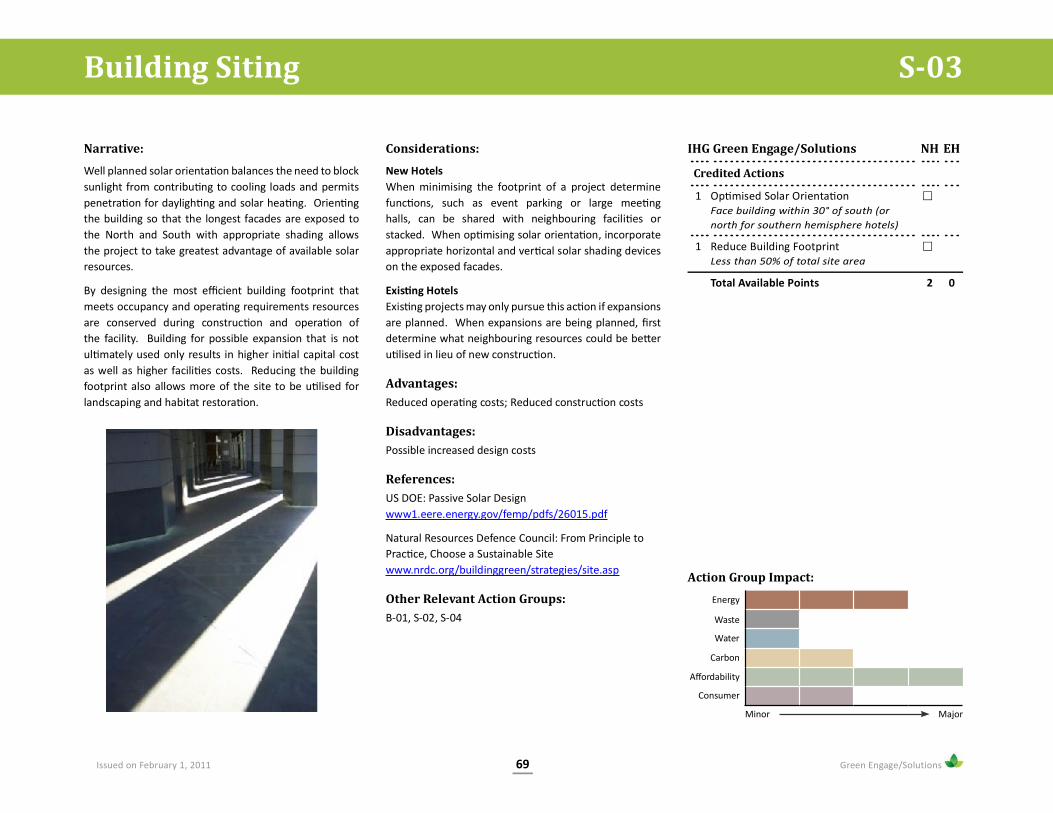
69 Green Engage/SolutionsIssued on February 1, 2011
IHG Green Engage/Solutions NH EH
Credited Actions
1 Op mised Solar Orienta onFace building within 30° of south (ornorth for southern hemisphere hotels)
1 Reduce Building FootprintLess than 50% of total site area
Total Available Points 2 0
Narrative:
Well planned solar orienta on balances the need to blocksunlight from contribu ng to cooling loads and permitspenetra on for dayligh ng and solar hea ng. Orien ngthe building so that the longest facades are exposed tothe North and South with appropriate shading allowsthe project to take greatest advantage of available solarresources.
By designing the most e cient building footprint thatmeets occupancy and opera ng requirements resourcesare conserved during construc on and opera on ofthe facility. Building for possible expansion that is notul mately used only results in higher ini al capital costas well as higher facili es costs. Reducing the buildingfootprint also allows more of the site to be u lised forlandscaping and habitat restora on.
Considerations:
New HotelsWhen minimising the footprint of a project determinefunc ons, such as event parking or large mee nghalls, can be shared with neighbouring facili es orstacked. When op mising solar orienta on, incorporateappropriate horizontal and ver cal solar shading deviceson the exposed facades.
Exis ng HotelsExis ng projects may only pursue this ac on if expansionsare planned. When expansions are being planned, rstdetermine what neighbouring resources could be be eru lised in lieu of new construc on.
Advantages:Reduced opera ng costs; Reduced construc on costs
Disadvantages:Possible increased design costs
References:US DOE: Passive Solar Designwww1.eere.energy.gov/femp/pdfs/26015.pdf
Natural Resources Defence Council: From Principle toPrac ce, Choose a Sustainable Sitewww.nrdc.org/buildinggreen/strategies/site.asp
Other Relevant Action Groups:B-01, S-02, S-04
S-03Building Siting
Action Group Impact:Energy
Waste
Water
Carbon
A ordability
Consumer
Minor Major

70 Green Engage/SolutionsIssued on February 1, 2011
IHG Green Engage/Solutions NH EH
Credited Actions
1 Vegetated Open SpaceA minimum 75% of vegetated open space
1 Na ve/Adap ve SpeciesA minimum 50% of na ve or adap vevegeta on
1 Site Restora onGreen eld sites – limit site disturbancewith a site development plan includingrestora on of any disturbed vegeta on;previously developed – restore 50% of thesite area outside the building footprint
1 Maximise Open SpaceExceed local zoning open spacerequirements by a minimum 25%
Total Available Points 4 2
Narrative:
Plan the building footprint, driveway and parking tomaximise open space and preserve local ecosystems.Green space should serve as a wildlife corridor and maybe used for recrea on or aesthe c gardens. Vegeta oncontributes signi cantly to other measures such asreduced heat island impact and stormwater control.Na ve vegeta on species adapt to the geography,hydrology, and climate of the region, require li le orno irriga on, minimal maintenance and require nofer lisers, pes cides and herbicides. Na ve vegeta onact as local habitats to animal species in the region andcreate biodiversity. Vegetated open space is cri cal tothreatened/endangered species.
If a site will be disturbed during construc on such as llingwetlands, vegeta on removal, soil compac on, then arestora on plan should be developed and the projectmust develop an Erosion and Sedimenta on ControlPlan based on the requirements in the IHG IntegratedPest Management, Erosion Control and LandscapeManagement Plan.. The restora on plan can iden fyareas not to be disturbed, as well as procedures to ensurethat the site is restored. The plan should illustrate the sitebefore construc on and the measures that will be takenduring and a er construc on to restore habitats.
Considerations:New HotelsDisturbance outside the building footprint should beminimised. An ecological disturbance should be mi gatedwith a site restora on plan including developing habitatsfor plant and animal species. Urban environmentsmay u lise plazas, courtyards, or even green roofs.Greenspaces in close proximity to the hotel may havesecure wireless internet access enabling sta to work
remotely. If there is su cient open space, a plant withhigh calori c value could be grown as a biofuel.
Exis ng HotelsInvasive and non-na ve species should be removed fromthe exis ng hotel grounds and replaced with na ve/adap ve species. Landscape maintenance prac cesshould minimize the use of chemicals, reduce theintroduc on of pollutants to stormwater runo andreduce waste.
Advantages:Na ve/adap ve species require li le or no water andless maintenance, open space for guests, visitors andemployees can use for recrea on
Disadvantages:Na ve/adap ve species require a higher capital cost thantradi onal grasses
References:Donald Harker, Landscape Restora on Handbook
Other Relevant Action Groups:W-05, W-06, S-01, S-02, S-03
S-04Ecology and Landscaping
Action Group Impact:Energy
Waste
Water
Carbon
A ordability
Consumer
Minor Major

71 Green Engage/SolutionsIssued on February 1, 2011
IHG Green Engage/Solutions NH EH
Credited Actions
1 Access to Public Transporta onWithin 180 metres (600 feet) distance ofpublic transporta on or hotel providedshu le or other
1 On-Site Alterna ve Transporta onRentalsProvide availability for Bicycles, Segway,Fuel-E cient Vehicles, for a total of 2%guest rooms
1 Employee Bicycling ProgramParking and shelter for bicycles for 10%of total shi sta
1 Shu le/Carpool ServicesCreate or provide a shu le or carpoolprogram for sta
Total Available Points 4 3
Narrative:
The environmental impact of transporta on to and fromthe project can be signi cantly decreased with planningand programs that decrease single occupancy vehicleuse. Guests and employees will bene t from programsthat o er alterna ves to single occupancy vehicles.
Enabling employees and guests to u lise publictransporta on will lead to a reduc on in automobilepollu on, road development and parking requirements.O ering ameni es such as discounted or readily availabletransit cards can increase ridership in areas where masstransit is available. Fuel e cient shu les that serviceairports, train sta ons and mass transit sta ons canbe employed in remote loca ons to discourage singleoccupancy vehicle rental.
Biking instead of driving reduces pollu on, parkingrequirements, and provides a healthy alterna ve totra c. Providing bicycle and fuel-e cient vehicle rentalson-site will allow guest greater exibility while reducingcar usage.
Considerations:New HotelsBefore considering a poten al building or site loca on,the owner should thoroughly inves gate local bus, train,and light rail transporta on op ons. Parking plans shouldincorporate shu le and carpool drop-o areas as well asprovide ample secure bicycle storage for employees andguest rentals.
Exis ng HotelsAll projects can encourage employee use of alterna vetransporta on by giving preferen al parking to fuele cient vehicles and carpools, providing bike storageand showering facili es, par cipa ng in mass transit
discount fare programs and providing easy accessibilityto mass transit.
Guest alterna ve transporta ons programs, with on-siterentals, shu le services, maps and educa on, can beincorporated in part or in full depending on the loca on’sresources.
Advantages:Some countries - such as the UK - have government runtax break schemes available to employers to promote theuse of bicycles, exercise could also reduce health carecosts, Increased appeal and accessibility of the hotel.
Disadvantages:Depending on the local market, land use and value maybe higher near public transporta on, shu le services willincrease costs.
References:Average e ciencies for various transport modes:
Commuter Rail (Diesel): 0.475 l/100km (495 mpg) perpassenger
Bus: (Diesel): 0.653 l/100km (360 mpg) per passenger
Car: 6.53 l/100km (36 mpg) per passenger
American Council for Energy E cient Economy:Transporta on Programwww.aceee.org/transporta on/index.htm
US DOE: Fuel Economywww.fueleconomy.gov
Other Relevant Action Groups:S-02, S-06
S-05Reduce Auto Use Impact
Action Group Impact:Energy
Waste
Water
Carbon
A ordability
Consumer
Minor Major

72 Green Engage/SolutionsIssued on February 1, 2011
IHG Green Engage/Solutions NH EH
Credited Actions
1 Code Minimum/No Addi onal Parking
1 Parking Under ShadeShade 50% of parking areas with > 29 SRImaterials
1 Pervious/Permeable PavingMinimum 50% of surface area
1 Recycled Content PavingMinimum 50% of surface area
Total Available Points 4 1
Narrative:
Large vehicle storage lots cause many other environmentalimpacts beyond simply suppor ng single occupancyvehicle use. Surface car parking lots limit the amount ofsite available for habitat and management of stormwater.These large impervious surfaces cause excessive runowhich causes ooding, erosion and the introduc onof pollutants into waterways. The dark surface of thepavement is also a major contributor to the urban heatisland e ect that changes the microclimate of areas. Heatislands are characterised by a thermal gradient betweendeveloped and undeveloped areas. Heat island impactcan be reduced by shading hardscape and using open gridpaving systems or paving material with a solar re ec veindex (SRI) greater than 29.
These environmental impacts can be reduced byminimising surface parking and selec ng environmentallypreferable materials.
Shading with exis ng trees can be an aesthe callypleasing op on that incurs no cost. Asphalt has a SRI of0 while new white concrete has an SRI of 86. If nancialor local circumstances provide no alterna ve to the useof asphalt, teams should consider the use of recycledasphalt where locally available and feasible. Pavingop ons that allow for increased stormwater in ltra oninclude pervious concrete, open grid pavers, gravel andstructural systems that allow for periodic parking ongrass.
Considerations:New HotelsRequired parking should be minimised through alterna vetransporta on programs, where applicable. Parking areashould be shaded with trees or placed under a structurewith a high albedo roof. Surface parking should providerainwater in ltra on through pervious paving materials.
Materials used to construct new parking should be lightcoloured and/or have high recycled content.
Exis ng HotelsProjects with exis ng parking spaces should not createaddi onal parking. Parking should be shaded with treesand/or resurfaced with a lighter coloured material, suchas white topping.
Advantages:Greater stormwater in ltra on will reduce strain oninfrastructure and need for deten on/reten on areas. Inhot climates providing covered parking areas will increasedriver comfort.
Disadvantages:Underground parking could cost signi cantly morethan surface parking. Pervious pavement materialsand experienced installers may not be available or mayincrease costs.
References:US Environmental Protec on Agency: Heat Island E ectwww.epa.gov/hea sld/resources/pdf/HIRIbrochure.pdf
Na onal Ready Mixed Concrete Associa on: PerviousConcrete Pavementwww.perviouspavement.org
Interlocking Concrete Pavement Ins tutewww.icpi.org/design/?gclid=CInP8K__95MCFQfNIgodAhkGWw
Other Relevant Action Groups:W-06, S-05
S-06Parking
Action Group Impact:Energy
Waste
Water
Carbon
A ordability
Consumer
Minor Major

73 Green Engage/SolutionsIssued on February 1, 2011
A/C Lockout
A switch which automa cally turns a room’s aircondi oning unit o when a window is open.
Absorption CoolingA type of cooling process that uses a heat-ac vatedrefrigera on cycle. This means that the mean energysource for cooling can be a source of heat includingwaste heat, natural gas or biomass.
Agri ibre ProductsComposite panel products derived from recoveredagricultural waste bre. Sources include cereal strawand agricultural prunings, which are mixed with resins toproduce panel products.
Air Cooled ChillerA refrigera on device used for air condi oning thatrejects heat to air.
Air Handling Unit (AHU)A device used to condi on and circulate air as part ofbuilding’s HVAC system. Equipment includes a fan orblower, hea ng and/or cooling coils, controls, air ltersand possibly humidi ers.
AlbedoA measure of a material’s re ec vity, which ranges from0 (dark) to 1 (light).
ASHRAE 90.1-2004US energy standard which provides minimum energy-e ciency requirements for the design and construc onof new buildings and building systems. This code coversbuilding envelope construc on, HVAC, domes c hotwater and electrical systems.
Biofuel
Fuel such as methane produced from treated municipaland industrial waste or renewable biological resourcessuch as biomass.
BiomassPlant ma er such as trees, grasses, agricultural cropsor other biological material. It can provide a renewablesource of electrical power, fuel, or chemical feedstocks.
BioswaleA landscape element designed to channel surface runowater whilst removing silt and pollu on.
BlackwaterWastewater from toilets and kitchen sinks that containsorganic materials.
Blowdown Heat RecoveryBlowdown is the process of limi ng the concentra onof impuri es in steam boiler water through the periodicor con nuous removal of some of the water. A heatrecovery system can be added to recover the thermalenergy in this water that would otherwise be lost.
Building Management System (BMS)A computer-based control system installed in buildingsthat controls and monitors the building’s mechanicaland electrical equipment. Opera on of ven la on,ligh ng, and power systems is controlled based onmeasurements of variables such as space temperatureand humidity. Fire and security systems may also becontrolled.
Building EnvelopeThe exterior por ons of a building through which
Glossary
thermal energy is transferred between the building andits surroundings, including oors, walls, roofs and glazedareas.
Building FootprintThe area on a project site that is used by the buildingstructure. Parking lots, landscapes and other non-building facili es are excluded.
Carbon Dioxide (CO2)A greenhouse gas and indicator of ven la one ec veness inside buildings. CO2 concentra onsgreater than 540 ppm above outdoor CO2 condi onsare generally considered to be an indicator of poorbreathing air quality and inadequate ven la on.
Chloro luorocarbons (CFCs)Chemicals previously used as refrigerants butnow banned due to their damaging e ect on thestratospheric ozone layer. These chemicals are alsopotent greenhouse gases, in the order of 5,000 – 10,000 mes stronger than CO2.
CoGenAlso known as Combined Heat and Power (CHP). Thesimultaneous genera on of both electricity and usefulheat, typically on a building or campus level, through theuse of a heat engine or a power sta on.
CondensateRefers to steam that has been condensed back intowater in a steam hea ng system. This may be returnedto the boiler through condensate return lines.
Constructed WetlandAn engineered system designed to simulate natural

74 Green Engage/SolutionsIssued on February 1, 2011
wetland func ons for water puri ca on. Constructedwetlands are essen ally treatment systems that removecontaminants from wastewater.
Daylight SensorA control which reads light levels in perimeter zones ofbuildings and switches o or dims ar cial ligh ng whenthere is su cient daylight.
DeadbandThe range of values around a setpoint where no ac onoccurs, preven ng a system from constantly ickering onand o .
Direct Digital Control (DDC)A system which uses a computer or microprocessor tomonitor and control variables such as temperature andair ow rates.
Double FaçadeA façade consis ng of a two layers or “skins”, separatedby a ven lated cavity.
Drip IrrigationA high-e ciency irriga on method in which water dripsto the soil from perforated tubes or emi ers.
Ecological BufferA zone or an area that serves not for any anthropogenicuse but as a conserved natural habitat where plants andanimals can thrive.
EconomiserA system designed to improve the HVAC e ciencywhen the outside air is su ciently cool. An airsideeconomiser allows an AHU to draw on outside air rather
than recircula ng air as a means of cooling the indoorspace. A waterside economiser uses water cooled by awet cooling tower to cool buildings without opera ng achiller.
Embodied EnergyThe total amount of energy involved in crea ng aproduct, including resource extrac on, transporta on,manufacturing and fabrica on.
Energy StarAn interna onal standard for energy e cient productsand buildings, run jointly by the U.S. EnvironmentalProtec on Agency and the U.S. Department of Energy.Devices carrying the Energy Star logo, such as computerproducts and peripherals, kitchen appliances, buildingsand other products, save 20%-30% on average in energyconsump on.
ErosionA combina on of processes in which materials of theearth’s surface are loosened, dissolved or worn away,and transported from one place to another by naturalagents.
Evaporative CoolingThe process of cooling air through the simpleevapora on of water.
Fan Coil Unit (FCU)A device used to control the temperature of a space. Itconsists of a hea ng and/or cooling coil and a fan.
FF&E MaterialsFurniture, xtures and equipment.
Glossary
FPP (Fan Powered Parallel)
A type of VAV system which can improve ven la one ciency of VAV systems in hea ng mode. The intakeof air from the AHU is reduced to a minimum and FPPboxes simply recirculate and heat the air within thespace.
Flush-Out TimeThe period during which a building’s air condi oningsystem runs at full capacity at the comple on ofconstruc on but before the building is occupied. This isintended to reduce the level of pollutants and irritants inthe air to acceptable levels.
Footcandle (fc)A measure of light falling on a given surface. Onefootcandle is equal to the quan ty of light falling on aone-square-foot area from a one candela light sourceat a distance of one foot. Footcandles can be measuredboth horizontally and ver cally by a footcandle or “lightmeter.”
FormaldehydeA naturally occurring VOC found in small amounts inanimals and plants, but carcinogenic and an irritantto most people when present in high concentra ons,causing headaches, dizziness, mental impairment, andother symptoms. Urea-formaldehyde is a combina onof urea and formaldehyde that is used in some glues andreadily decomposes at room temperature.
Full Cut Off LuminaireA light source designed to prevent light pollu on byemi ng no light above horizontal, and an intensityof less than 10% in the region of 80°-90° from thedownward ver cal axis.

75 Green Engage/SolutionsIssued on February 1, 2011
F-value
The perimeter heat loss factor for slab-on-grade oors,expressed in Btu/h• •°F.
Geothermal PowerEnergy generated from heat stored in the earth, typicallyusing high temperature water or steam extracted fromdeep below the surface to drive turbines.
Green AwareIHG’s in-house training course, addressingenvironmentally responsible hotel opera on.
Green EngageIHG’s in-house global measurement tool, used to assessand benchmark water, energy and waste performanceof hotels.
Green FaçadeA façade which features vegeta on, typically climbingplants, growing directly on the surface or on speciallydesigned suppor ng structures.
Green ieldUndeveloped land or land that has not been impactedby human ac vity.
Greenhouse Gases (GHG)Those gases, such as water vapour, carbon dioxide, andmethane, that are transparent to solar radia on, butopaque to long wave radia on, and which contribute tothe greenhouse e ect.
GreywaterWastewater generated from domes c purposes such asdish washing, lavatory and bathing.
Ground Source Heat Pump (GSHP)
A type of heat pump that uses the ground, groundwater, or ponds as a heat source and heat sink, ratherthan outside air. Ground or water temperatures aremore constant and are warmer in winter and cooler insummer than air temperatures. Geothermal heat pumpsoperate more e ciently than “conven onal” or “airsource” heat pumps.
Heat Island EffectThe e ect whereby an urban area is signi cantly warmerthan surrounding rural areas, mainly due to solar energyreten on on constructed surfaces. Principal surfacesthat contribute to the heat island e ect include streets,sidewalks, parking lots and buildings.
Heat RecoveryThe process of capturing heat from the exhaust air froma building and transferring it to the supply air enteringthe building to preheat the air and increase overalle ciency.
HumidistatAn automa c control device used to maintain humidityat a xed or adjustable setpoint.
HVAC SystemThe Hea ng, Ven la ng, and Air-Condi oning systemsequipment, distribu on systems, and terminals usedto provide thermal comfort and ven la on for buildinginteriors.
Hydrochloro luorocarbons (HCFCs)Refrigerants used in building equipment that depletethe stratospheric ozone layer, but to a lesser extentthan CFCs. These chemicals are also potent greenhouse
Glossary
gases, in the order of 100 – 2,000 mes stronger thanCO2.
Hydro luorocarbons (HFCs)Refrigerants that do not deplete the stratospheric ozonelayer. However, some HFCs have high global warmingpoten al, in the order of 1,000 – 10,000 mes strongerthan CO2, and thus are not environmentally benign.
Impervious SurfaceA surface which does not allow rainwater to passthrough it, crea ng stormwater runo .
Indoor Air Quality (IAQ)The nature of air that a ects the health and well-beingof building occupants.
Industrial SymbiosisA form of coexistence whereby a number of industriesmake use of each other’s produc on residues or by-products for commercial and environmental reasons.
In iltrationThe uninten onal or accidental introduc on of outsideair into a building, typically through cracks in thebuilding envelope and through use of doors for passage.
Light ShelfAn architectural element which consists of a highlyre ec ve overhang on a window. Light shelves aredesigned to increase dayligh ng by re ec ng light ontothe ceiling and deeper into a space.
Light PollutionCaused by stray light from unshielded light sources andlight re ec ng o surfaces that enters the atmosphere,

76 Green Engage/SolutionsIssued on February 1, 2011
causing an e ect know as “sky glow”. Light pollu oncan substan ally limit visual access to the night sky andadversely a ect nocturnal environments, and needlesslyconsumes energy and natural resources.
Light TrespassObtrusive, unwanted light.
Low-E (Emissivity) CoatingA coa ng applied to the surface of the glazing of awindow to improve thermal performance by increasingits ability to re ect heat.
MERV (Minimum Ef iciency Reporting Value)A measure of the e ciency of an air lter in removingpar cles.
Modular/Pre-Fab ConstructionConstruc on using standard designs that allow somelevel of preassembly before delivery to the site.
Native/Adapted VegetationSpecies that are indigenous to a locality or have adaptedto the local climate and are not invasive. Such plants donot require irriga on or fer lisa on once root systemsare established in the soil.
Natural VentilationThe process of supplying and removing air withoutmechanical assistance in building spaces by usingopenings such as windows and doors, non-poweredven lators, and in ltra on processes.
NEMA (National Electrical ManufacturersAssociation)A US organisa on which provides standards for high
e ciency motors.
Noise Criteria (NC)A standard system established in the US for ra ng indoornoise from air condi oning systems, etc.
Occupancy SensorA device that detects the presence or absence of peoplewithin an area and causes ligh ng, equipment, orappliances to be regulated accordingly.
Packaged Terminal Air Conditioner (PTAC)A self-contained air condi oning and hea ng systemcommonly found in hotels. Typically, PTACs use arefrigerant cycle for cooling, with electric hea ng.
Packaged Terminal Heat Pump (PTHP)A PTAC capable of using the refrigera ng system in areverse cycle or heat pump mode to provide heat.
Pervious/Permeable PavingPaving which allows rainwater to pass through it andseep into the ground, reducing stormwater runo .
Photovoltaic (PV) CellA device which converts light into electricity.
Potable WaterWater that meets drinking water quality standards andis approved for human consump on by the state or localauthori es having jurisdic on.
Prime MoverA device in a building’s HVAC system where electricalenergy is converted to rota ng-sha power, such asboilers, chillers and air handling fans.
Rainwater Harvesting
The collec on and storage of rainwater, which can beused for irriga on or toilet- ushing.
Rapidly Renewable MaterialsAgricultural products, either bre or animal, which take10 years or less to grow/raise and harvest in an ongoingand sustainable fashion.
RecyclingThe collec on, reprocessing, marke ng and use ofmaterials which have been diverted or recovered fromthe solid waste stream.
Re lectivityThe ra o of the light re ected by a material to the lightincident upon it.
RefrigerantThe working uid of refrigera on cycles. Refrigerantsabsorb heat through evapora on from a reservoir at lowtemperatures and reject heat through condensa on athigher temperatures.
Regional MaterialA material which has been extracted/harvested/recovered and manufactured within a speci c distanceof the building site, typically 800 kilometres (500 miles).
Relative Humidity (RH)The ra o of par al density of water vapour in the airto the satura on density of water vapour at the sametemperature.
Return AirAir removed from condi oned spaces that is either
Glossary

77 Green Engage/SolutionsIssued on February 1, 2011
recirculated in the building or exhausted to the outside.
Reverberation ControlThe reduc on of reverbera on, or echoing, as a meansof reducing the spread of sound from one area toanother, typically through the use of porous, sound-absorp ve materials.
Reverse Osmosis (RO)A ltra on process where pressure is used to forcewater through a membrane, leaving behind anyimpuri es.
RS MeansThe leading US supplier of construc on cost informa on.
R-value (Thermal Resistance)The reciprocal of U-value. Units of R are h• 2•°F/Btu.
SedimentationThe addi on of soils to water bodies by natural andhuman-related ac vi es. Sedimenta on decreaseswater quality and accelerates the aging process of lakes,rivers and streams.
Solar Heat Gain Coef icient (SHGC)The ra o of the solar heat gain entering the spacethrough a glazing to the incident solar radia on. Solarheat gain includes directly transmi ed solar heat andabsorbed solar radia on, which is then reradiated,conducted, or convected into the space.
Solar OrientationThe orienta on of a building with respect to the sun,which can have a signi cant e ect on energy e ciency.
Solar Thermal
The technology of extrac ng thermal energy (heat) fromsolar energy. Typical uses include domes c hot waterand pool hea ng.
SRI (Solar Re lectance Index)A measure of a material’s ability to reject solar heat. Astandard black has an SRI of 0 and a standard white 100.
Stormwater RunoffWater volumes that are created during precipita onevents and ow over surfaces into sewer systems orreceiving waters.
Sunpath AnalysisA simula on of the progression of the sun over a year,which is used when designing a building to determineshading e ects and sun penetra on.
Supply AirAir delivered to condi oned spaces for use in ven la ng,hea ng, cooling, humidifying, and dehumidifying thosespaces.
Thermal Broken DetailA façade element featuring a spacer, made of aninsula ng material, which separates indoor and outdoorsurfaces.
Thermal ComfortA condi on of mind experienced by building occupantsexpressing sa sfac on with the thermal environment.
Thermal StorageThe storage of thermal energy during u lity o -peak mes at night, usually in the form of ice or other phase-
Glossary
change materials, which is then used during peakperiods the next day.
Total Phosphorous (TP)Pollutants found in stormwater, consis ng oforganically bound phosphates, poly-phosphates andorthophosphates, the majority of which originates fromfer liser applica on. Chemical precipita on is the typicalremoval mechanism.
Total Suspended Solids (TSS)Par cles which are too small or light to be removedfrom stormwater via gravity se ling. Suspended solidconcentra ons are typically removed via ltra on.
Urea-Formaldehyde(see Formaldehyde)
U-value (Thermal Transmittance)The rate of heat transmission through a material,induced by a temperature di erence between one sideand the other. Units of U are Btu/ h• 2•°F.
Vapour BarrierAn element in a wall, oor or ceiling that does notallow moisture or air to penetrate and is used to xontrolmoisture migra on through building envelopes.
Variable Frequency Drive (VFD)A system for controlling the rota onal speed of a motorby controlling the frequency of the electrical powersupplied to the motor, allowing the speed of the motorto match demand.
Variable Air Volume (VAV)HVAC system capable of varying the rate of heated or

78 Green Engage/SolutionsIssued on February 1, 2011
cooled supply air to a space as demand varies.
VentilationThe process of supplying and removing air to and fromspaces in a building by natural or mechanical means.
Volatile Organic Compounds (VOCs)Organic compounds which vaporise at normal roomtemperatures, and may contribute to poor indoor airquality in buildings.
Waste Stream AuditThe measurement of the quan ty and composi on ofthe waste generated by a facility.
Water Cooled ChillerA refrigera on device that uses cooling towers to rejectheat.
Water HardnessA measure of the level of minerals such as calcium andmagnesium ions in water.
Waterless UrinalA dry plumbing xture that uses advanced hydraulicdesign and a buoyant uid instead of water to maintainsanitary condi ons.
Weather strippingThe use of strips of material for sealing buildingopenings such as doors and windows, to reduce airin ltra on and heat loss.
WHO (World Health Organisation) DrinkingWater Quality StandardsThe interna onal reference point for drinking water
quality regula on and standard se ng.
Wildlife CorridorAn area of habitat connec ng wildlife popula onsseparated by human ac vi es such as roads,development or logging.
XeriscapingLandscaping designed to reduce or eliminate the needfor supplemental irriga on.
Glossary

APPENDICES

APPENDICES
APPENDIX A: ExistingHotels Energy Analysis
Introduction 1How to Use this Appendix 2How to Read the CalculationSheets
3
Energy Model Assumptions 7Global Climate Map 15Climate Data 16
Calculation Sheets 18Overall Summary Page 19Hot-Humid 20Arid 76Temperate 132Cold-Alpine 188
APPENDIX B: NewHotels Energy Analysis
Introduction 1How to Use this Appendix 2How to Read the CalculationSheets
3
Energy Model Assumptions 7Global Climate Map 10Climate Data 11
Energy Charts 13
Calculation Sheets 22Overall Summary Page 23Hot-Humid 24Arid 54Temperate 84Cold-Alpine 118
APPENDIX C: LEEDDocumentation
Introduction 1
APPENDIX A: Existing Hotels Energy Analysis
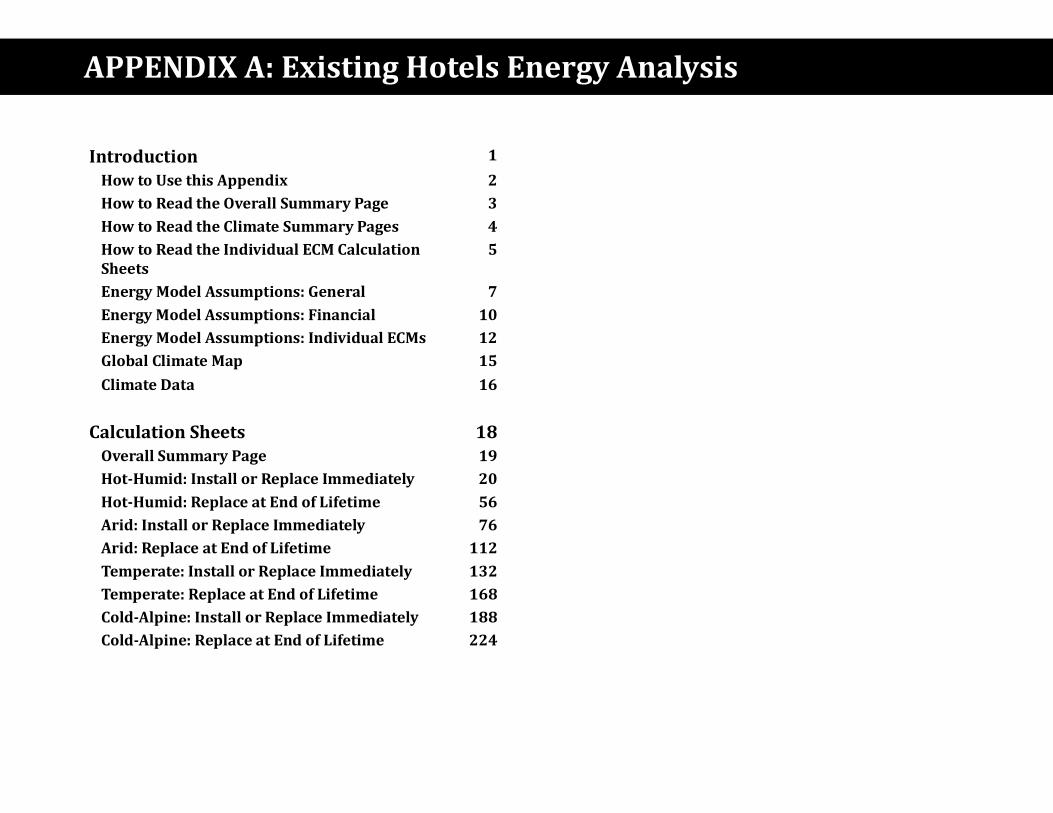
Introduction 1How to Use this Appendix 2How to Read the Overall Summary Page 3How to Read the Climate Summary Pages 4How to Read the Individual ECM CalculationSheets
5
Energy Model Assumptions: General 7Energy Model Assumptions: Financial 10Energy Model Assumptions: Individual ECMs 12Global Climate Map 15Climate Data 16
Calculation Sheets 18Overall Summary Page 19Hot-Humid: Install or Replace Immediately 20Hot-Humid: Replace at End of Lifetime 56Arid: Install or Replace Immediately 76Arid: Replace at End of Lifetime 112Temperate: Install or Replace Immediately 132Temperate: Replace at End of Lifetime 168Cold-Alpine: Install or Replace Immediately 188Cold-Alpine: Replace at End of Lifetime 224
APPENDIX A: Existing Hotels Energy Analysis

Introduction
Issued February 1, 2011 1 Existing Hotels Energy Analysis - Green Engage/Solutions

Green Engage/Solu ons for Exis ng Hotels contains 40 Level1 Prerequisite Ac ons and 10 Level 2 Prerequisite Ac ons (50Prerequisites in total). These ac ons are designed to improvethe sustainable opera ons of a hotel across a wide range ofareas including water use, waste management, products andmaterials, guest comfort, and par cularly energy use.
Of the 50 Level 1 and Level 2 Prerequisites, 15 have a directimpact on energy consump on (11 Level 1 and four Level 2Ac ons). This appendix has been developed to show boththe individual impact these 15 Prerequisites can have onhotel energy use, and to show the overall savings that can beachieved by reaching Level 1 and Level 2 Cer ca on.
To do this, a detailed computer energy model of an 'average'IHG hotel was created, using actual IHG prototype drawings andenergy use data. The e ect of each Prerequisite was calculatedin four climates, represen ng the full range of loca ons of IHGproper es. Then these Prerequisites were combined to showhow a Level 1 Cer ed Hotel and Level 2 Cer ed Hotel wouldperform against a typical hotel that hasn't gone through theGreen Engage/Solu ons program.
These results can all be found in the Calcula on Sheets. Thediagram to the right shows how these sheets t together.Detailed instruc ons on how to read and interpret these sheetsare provided on the following four pages
For informa on on the climate zones, and help determiningwhich climate zone your hotel is located in, refer to the GlobalClimate Map and Climate Data sec ons.
While the results of this energy analysis are applicable to hotelsin a wide variety of loca ons and brands, obviously in the realworld actual results may vary. If you'd like to look in moredetail at how the energy model was created, and determinewhether these assump ons apply to your par cular property,refer to the Energy Modelling Assump ons sec on.
How to Use this Appendix
Issued February 1, 2011 2 Existing Hotels Energy Analysis - Green Engage/Solutions

How to Read the Overall Summary Page
Issued February 1, 2011 3 Existing Hotels Energy Analysis - Green Engage/Solutions

How to Read the Climate Summary Pages
Issued February 1, 2011 4 Existing Hotels Energy Analysis - Green Engage/Solutions
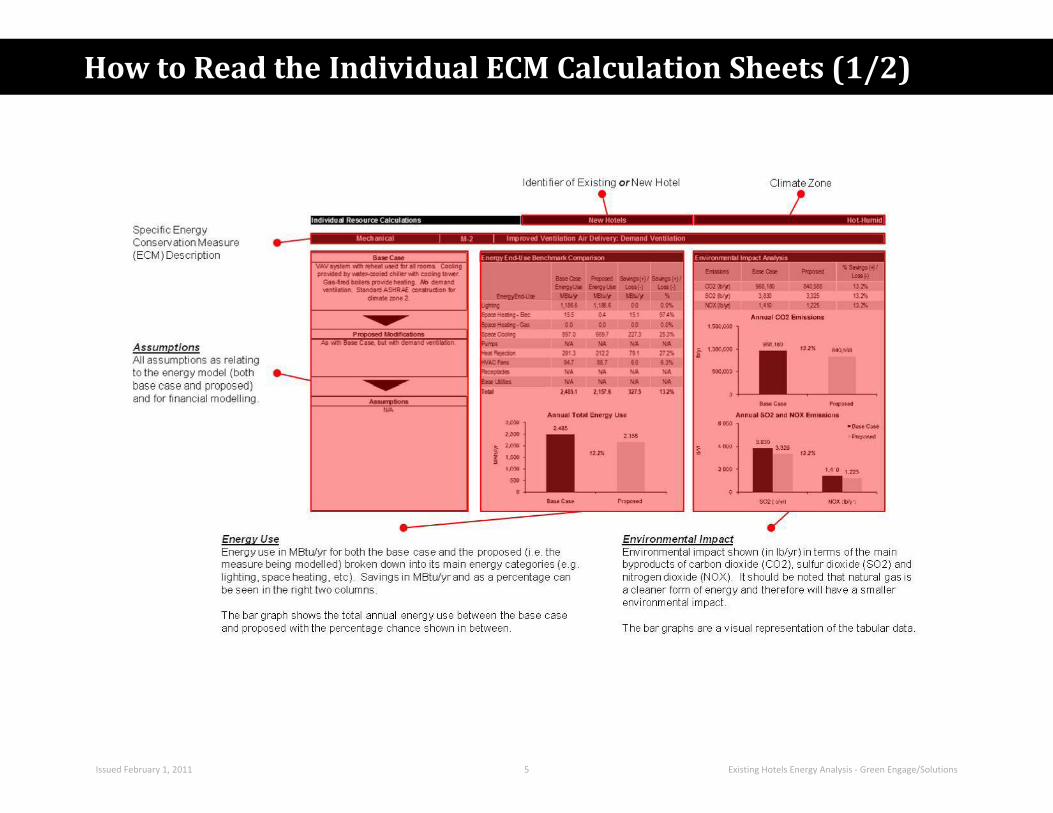
How to Read the Individual ECM Calculation Sheets (1/2)
Issued February 1, 2011 5 Existing Hotels Energy Analysis - Green Engage/Solutions

How to Read the Individual ECM Calculation Sheets (2/2)
Issued February 1, 2011 6 Existing Hotels Energy Analysis - Green Engage/Solutions

Introduction:
A full building energy model was created for this study,using the energy modelling program eQUEST. Thismodel is intended to represent a typical IHG hotel withaverage energy performance.
The model se ngs, including construc on, ligh ng andequipment loads, mechanical systems and e ciencies,are typical of a 10 - 30 year old full service hotel. Toverify the assump ons used, the energy consump onof the model was entered into Energy Star Target Finderto ensure that it aligned very closely with the actualaverage energy consump on of hotels in a number ofdi erent loca ons.
Every “real” IHG hotel will di er to some degree fromthis energy model. Nevertheless, it was created toapproximate as many IHG hotels as closely as possible.
In general, the results are scalable and can be appliedeven to hotels that are very di erent from the model.For example, implemen ng a measure in a hotel thatis twice the size of the model is likely to cost twice asmuch but yield twice the annual energy savings, so theoverall result will be the same.
However, in some obvious cases there will be measuresand results that do not apply to some hotels. Forexample, using energy e cient guest room refrigeratorswould be di cult for a hotel which does not have guestroom refrigerators.
In other cases, hotels which are completely di erentfrom the model can expect results which are also quitedi erent. A resort with acres of landscaped grounds,several swimming pools and a casino is going to seeenergy savings by implemen ng the Green Engage Level1 and Level 2 Prerequisite ac ons, but as a percentageof its total energy consump on these savings will looksmaller than for a limited service hotel.
Energy Model Performance
The energy model was validated by entering thepredicted energy consump on into Energy Star TargetFinder. This US government-backed tool compares thisnumber against a database of energy consump on datafrom a large number of actual hotels, and returns anEnergy Star score, represen ng which percen le themodel falls into. For example, and Energy Star scoreof 70 means that the model is performing be er than70% of hotels. Since the energy model was intended torepresent an average hotel, an Energy Star score of 50was targeted.
The graph below shows the Energy Star scores for themodel in each of the four climate zones. Note thatthe Energy Star score takes into account the e ectclimate has on energy performance, so while the energyconsump on varied greatly from model to model,the Energy Star score did not. In fact, the di erencebetween the energy model and an Energy Star score of50 was no more than 4% in any of the climate zones.
Climates Modelled:
The model was run in four climate zones, covering thefull range of loca ons of IHG’s proper es. The followingweather data was used to simulate these four zones:
• Hot-Humid: West Palm Beach, Florida
• Arid: Phoenix, Arizona
• Temperate: New York, New York
• Cold-Alpine: Fargo, North Dakota
Slight modi ca ons were made to the model to adapt itto each climate zone. For example, extra insula on wasprovided in the cold-alpine zone. Each of these changeshas been noted in the following sec ons.
Building Geometry:The geometry of the model, including alloca on of oorspace and number of guest rooms, was based on IHGHoliday Inn Balanced Full Service Prototype drawings.
The model has the following proper es:
• 150 guest rooms
• Guest room area: 400 sf (37 m²)
Energy Model Assumptions: General (1/3)
Issued February 1, 2011 7 Existing Hotels Energy Analysis - Green Engage/Solutions

Energy Model Assumptions: General (2/3)
• 6 oors
• Total building area: 90,000 sf (8,360 m²)
• Building area per oor: 15,000 sf (1,390 m²)
• Exterior walls have 30% glazing
Building Envelope Construction• Walls: 4 inch heavyweight concrete with 2 inch
polystyrene insula on (R-8)
• Roof: 4 inch heavyweight concrete with 2 inchpolystyrene insula on (R-8). Cold-Alpine modeluses 4 inch polystyrene insula on (R-16).
• Windows: double clear glazing, aluminium frame,operable. Hot-Humid model has bronze ntedglass.
• Shading: Light-coloured fabric drapes. Hot-humidmodel has 2 foot overhangs on all windows.
Occupancy:• Hotel rooms: 2 people per room
• All other spaces: default occupancy densi es used
Lighting Load• All loads are based on ASHRAE 90.1-1999
allowances for each space type. A 50/50 splitof incandescent and uorescent ligh ng wasassumed.
Equipment loads• Hotel rooms: One non-Energy Star 32” LCD TV and
one non-Energy Star 3 cu. . refrigerator per room
• Food prepara on: 2 dishwashers, 4 ovens,2 refrigerators, 2 freezers, 2 icemakers, 4microwaves. All equipment is commercial and non-
Energy Star.
• Laundry: 3 clothes washers, 3 clothes dryers. Allequipment is commercial and non-Energy Star.
• All other spaces: default equipment loads used
Space Allocations:The alloca on of oor space was based on IHG HolidayInn Balanced Full Service Prototype drawings. “HotelRooms” and “Corridors” are allocated to oors 2 – 6,all other spaces are allocated to the rst oor of themodel.
Space Type BuildingArea
Occupancy(sf/person)
Ligh ng(W/sf)
Equipment(W/sf)
HotelRooms 66.6% 200 1.5 0.66
Conven onCentre /Restaurant
3.9% 15 1.6 0.5
Corridors 13.8% 100 0.7 0.1
Mech andElec Rooms 5.6% 333 1.3 1.0
Lobby 5.7% 100 1.8 1.0
Restrooms,Lockers andLaundry
1.7% 100 1.0 3.3
FoodPrepara on 1.1% 200 2.2 150
Fitness 1.6% 50 1.1 2.0
Schedules:Default “high-use hotel” schedules were used foroccupancy, ligh ng and equipment loads in the model.These schedules are shown below:
Occupancy:
Ligh ng:
Equipment:
Issued February 1, 2011 8 Existing Hotels Energy Analysis - Green Engage/Solutions
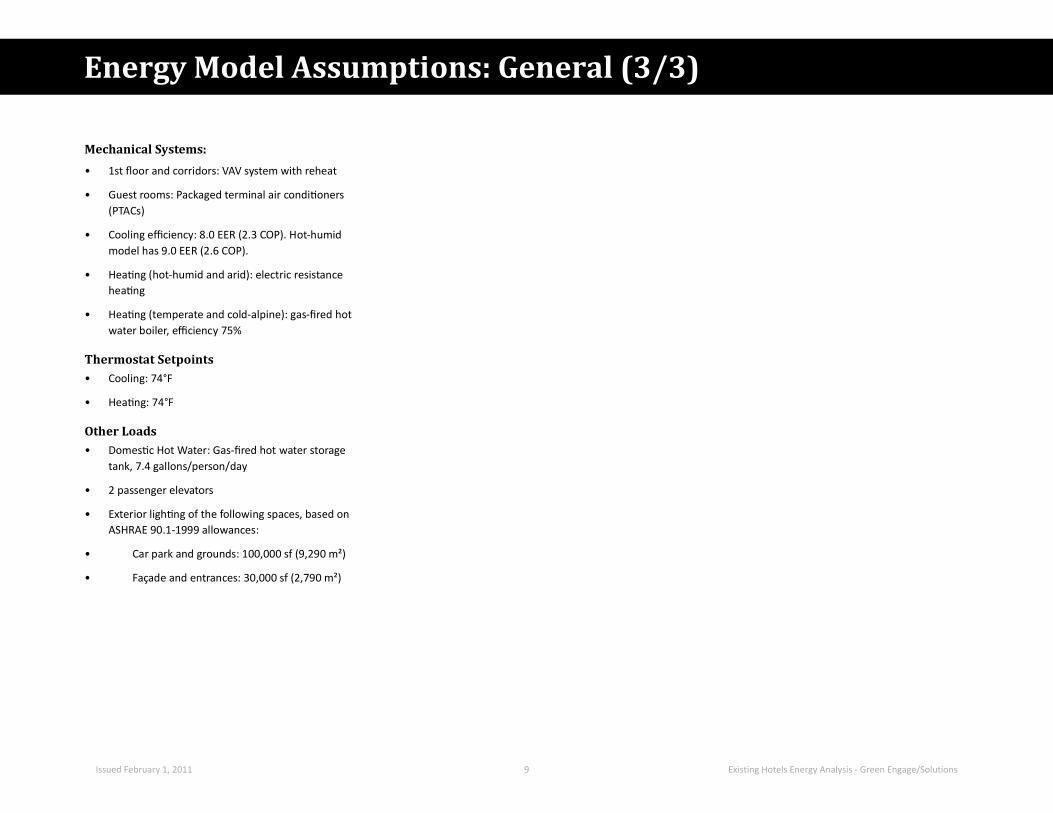
Energy Model Assumptions: General (3/3)
Mechanical Systems:• 1st oor and corridors: VAV system with reheat
• Guest rooms: Packaged terminal air condi oners(PTACs)
• Cooling e ciency: 8.0 EER (2.3 COP). Hot-humidmodel has 9.0 EER (2.6 COP).
• Hea ng (hot-humid and arid): electric resistancehea ng
• Hea ng (temperate and cold-alpine): gas- red hotwater boiler, e ciency 75%
Thermostat Setpoints• Cooling: 74°F
• Hea ng: 74°F
Other Loads• Domes c Hot Water: Gas- red hot water storage
tank, 7.4 gallons/person/day
• 2 passenger elevators
• Exterior ligh ng of the following spaces, based onASHRAE 90.1-1999 allowances:
• Car park and grounds: 100,000 sf (9,290 m²)
• Façade and entrances: 30,000 sf (2,790 m²)
Issued February 1, 2011 9 Existing Hotels Energy Analysis - Green Engage/Solutions

Labour Costs:
All labour costs are sourced from RS Means. They areUS na onal average gures and assume “open” contractprices (as opposed to union rates). The below tableshows the base rate (including fringe bene t), the totaloverhead and pro t percentage increase and the labourrate with overhead and pro t included. The overheadand pro t includes workers’ compensa on insurancespeci c to each trade, an average xed overhead of16.3%, an overhead for each trade and a pro t of 10%.
Trade Base Rate O&P % Rate withO&P
CommonBuildingLabourers
$25.50 68.2% 42.90%
SkilledWorker $32.70 67.7% $54.85
Carpenter $32.40 68.2% $54.50
Electrician $39.20 62.7% $63.80
Plumber $38.50 63.9% $63.10
Capital Costs and Lifetimes:
Capital costs occur in both scenarios of “replace orinstall now” and “replace at end of life me”.
For the rst scenario it should be noted that exis ngproducts to be replaced immediately are assumed tobe, on average, halfway through their life me. Under“straight line” deprecia on principles they are thereforeworth half of their original purchase value.
Install now products incur a full capital cost outlay sincethese products do not already exist within the hotel.
The second scenario of “replace at end of life me” is
obtained from the US Department of Commerce for thecommercial end-use sector.
EnergyType
2010-2015
2015-2020
2020-2025
2025-2030
2030-2035
Electricity -0.9% 0.4% 0.5% 0.8% 1.0%
NaturalGas 2.6% 0.7% 0.7% 1.9% 1.2%
Projected average (nominal) fuel escala on ratesincluding the in a on gure of 2.875% stated earlier.
EnergyType
2010-2015
2015-2020
2020-2025
2025-2030
2030-2035
Electricity 1.9% 3.2% 3.3% 3.6% 3.8%
NaturalGas 5.4% 3.5% 3.5% 4.7% 4.0%
Weighted Average Cost of Capital:
The discount rate applied to determine the net presentvalue (NPV) of each ECM can be di erent for eachproject, each franchise and each region. Each newproject should input their own personalized discountrate.
However, to provide a star ng point and a basis forcomparison across regions, we have determined theweighted average cost of capital (rwacc) for the IHGGroup as a whole. This was calculated using the typical nancial equa ons (r_wacc=r_d×d/v+r_e×e/v and r_
e=r_f+ ×r_m) with the appropriate inputs from a varietyof sources including the IHG Group 2009 Annual Report,the US Department of Treasury, MSN Money, CNN andBloomberg.
• rwacc (nominal): 7.19%
Utilities:
U lity values for electricity and natural gas wereobtained from the US Energy Informa on Administra onfor the baseline 2010 year. These gures are for theCommercial US Average. U lity values for water wereobtained from the Circle of Blue’s Urban Water PricingSurvey for 2010.
• Electricity - US$0.1028/kWh
• Natural Gas – US$9.27/ Mcf (US$0.90/therm)
• Water - US$0.0037/Gal
Emission Factors:Emission factors for electricity depend on the state orcountry electricity mix. However, for comparison acrossclimate zones the average emission for CO2, SO2 andNOX across the US has been used. These gures weresourced from the EPA’s eGRID 2007, the EIA and theEERE.
Energy Type CO2(lb/MWh)
SO2(lb/MWh)
NOX(lb/MWh)
Electricity 1,329.35 5.2589 1.9366
Natural Gas 398.31 0 0.2994
NPV Financial Inputs:
• Base year for analysis: 2010
• Building Analysis/Study Period : 20 years
The in a on rates for the past twenty years wereobtained from the US Bureau of Sta s cs and averagedto provide a historical trend.
• In a on rate: 2.785% (20 year historical average)
Projected average (real) fuel escala on rates were
Energy Model Assumptions: Financial (1/2)
Issued February 1, 2011 10 Existing Hotels Energy Analysis - Green Engage/Solutions
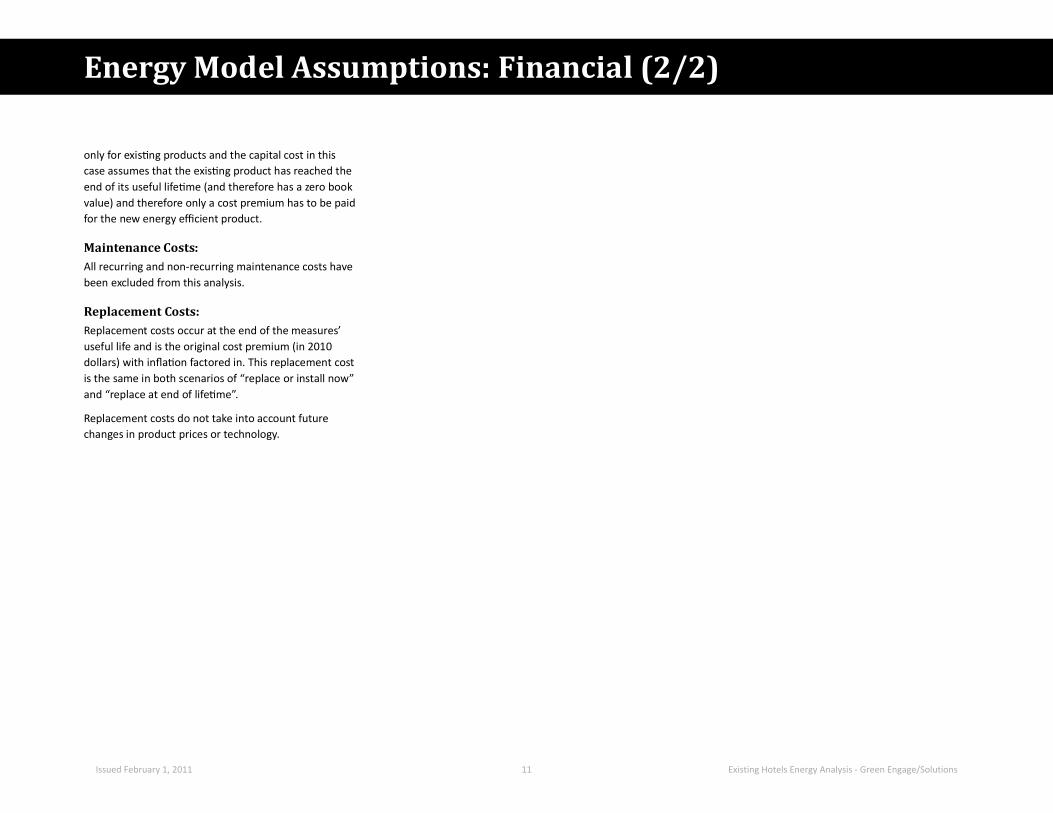
only for exis ng products and the capital cost in thiscase assumes that the exis ng product has reached theend of its useful life me (and therefore has a zero bookvalue) and therefore only a cost premium has to be paidfor the new energy e cient product.
Maintenance Costs:All recurring and non-recurring maintenance costs havebeen excluded from this analysis.
Replacement Costs:Replacement costs occur at the end of the measures’useful life and is the original cost premium (in 2010dollars) with in a on factored in. This replacement costis the same in both scenarios of “replace or install now”and “replace at end of life me”.
Replacement costs do not take into account futurechanges in product prices or technology.
Energy Model Assumptions: Financial (2/2)
Issued February 1, 2011 11 Existing Hotels Energy Analysis - Green Engage/Solutions
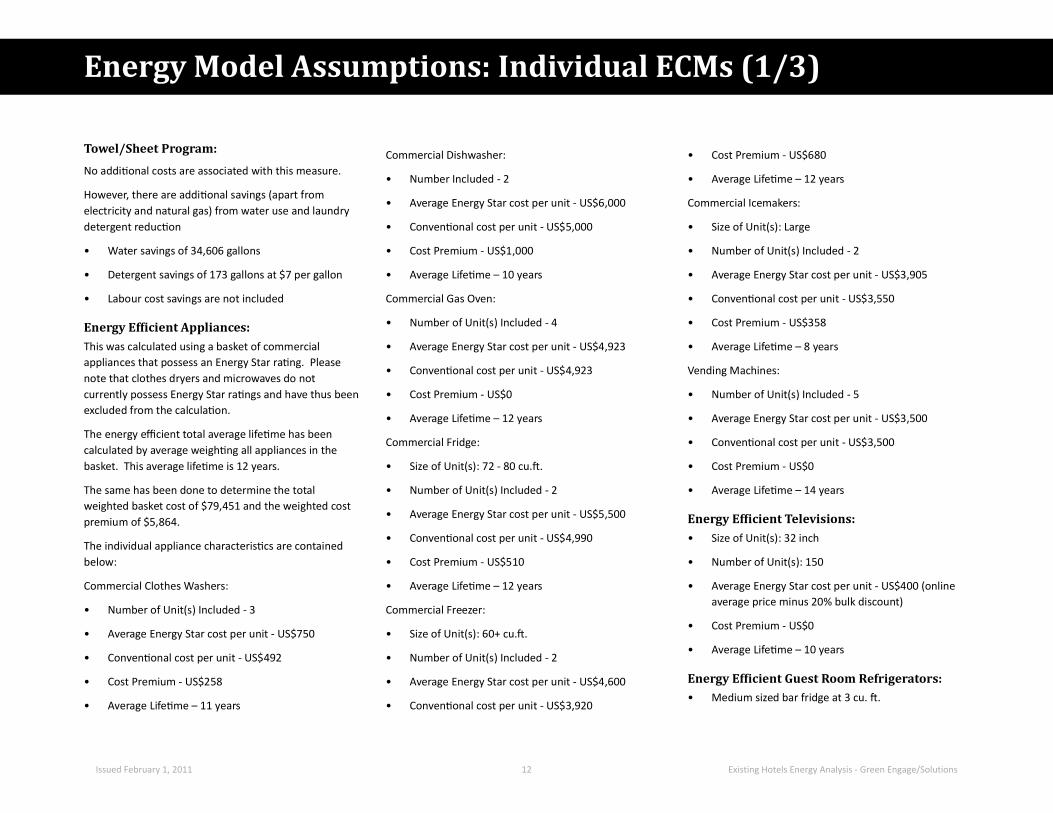
• Cost Premium - US$680
• Average Life me – 12 years
Commercial Icemakers:
• Size of Unit(s): Large
• Number of Unit(s) Included - 2
• Average Energy Star cost per unit - US$3,905
• Conven onal cost per unit - US$3,550
• Cost Premium - US$358
• Average Life me – 8 years
Vending Machines:
• Number of Unit(s) Included - 5
• Average Energy Star cost per unit - US$3,500
• Conven onal cost per unit - US$3,500
• Cost Premium - US$0
• Average Life me – 14 years
Energy Ef icient Televisions:• Size of Unit(s): 32 inch
• Number of Unit(s): 150
• Average Energy Star cost per unit - US$400 (onlineaverage price minus 20% bulk discount)
• Cost Premium - US$0
• Average Life me – 10 years
Energy Ef icient Guest Room Refrigerators:• Medium sized bar fridge at 3 cu. .
Commercial Dishwasher:
• Number Included - 2
• Average Energy Star cost per unit - US$6,000
• Conven onal cost per unit - US$5,000
• Cost Premium - US$1,000
• Average Life me – 10 years
Commercial Gas Oven:
• Number of Unit(s) Included - 4
• Average Energy Star cost per unit - US$4,923
• Conven onal cost per unit - US$4,923
• Cost Premium - US$0
• Average Life me – 12 years
Commercial Fridge:
• Size of Unit(s): 72 - 80 cu. .
• Number of Unit(s) Included - 2
• Average Energy Star cost per unit - US$5,500
• Conven onal cost per unit - US$4,990
• Cost Premium - US$510
• Average Life me – 12 years
Commercial Freezer:
• Size of Unit(s): 60+ cu. .
• Number of Unit(s) Included - 2
• Average Energy Star cost per unit - US$4,600
• Conven onal cost per unit - US$3,920
Towel/Sheet Program:
No addi onal costs are associated with this measure.
However, there are addi onal savings (apart fromelectricity and natural gas) from water use and laundrydetergent reduc on
• Water savings of 34,606 gallons
• Detergent savings of 173 gallons at $7 per gallon
• Labour cost savings are not included
Energy Ef icient Appliances:This was calculated using a basket of commercialappliances that possess an Energy Star ra ng. Pleasenote that clothes dryers and microwaves do notcurrently possess Energy Star ra ngs and have thus beenexcluded from the calcula on.
The energy e cient total average life me has beencalculated by average weigh ng all appliances in thebasket. This average life me is 12 years.
The same has been done to determine the totalweighted basket cost of $79,451 and the weighted costpremium of $5,864.
The individual appliance characteris cs are containedbelow:
Commercial Clothes Washers:
• Number of Unit(s) Included - 3
• Average Energy Star cost per unit - US$750
• Conven onal cost per unit - US$492
• Cost Premium - US$258
• Average Life me – 11 years
Energy Model Assumptions: Individual ECMs (1/3)
Issued February 1, 2011 12 Existing Hotels Energy Analysis - Green Engage/Solutions
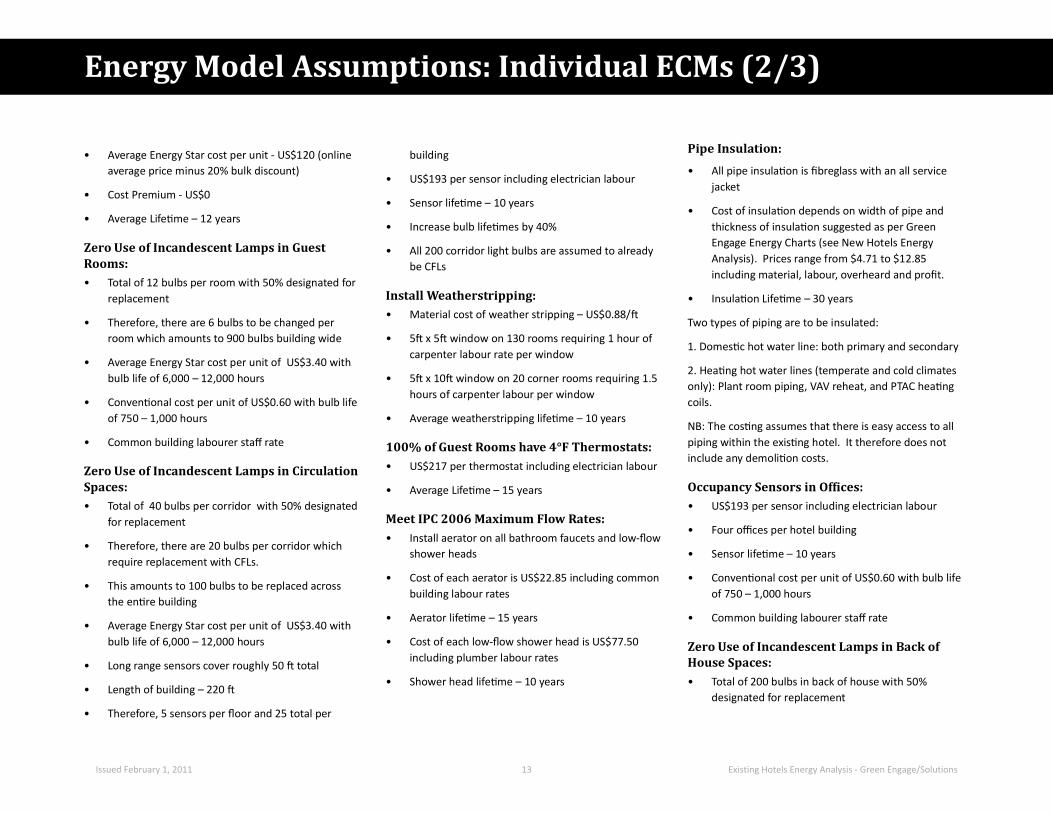
Pipe Insulation:
• All pipe insula on is breglass with an all servicejacket
• Cost of insula on depends on width of pipe andthickness of insula on suggested as per GreenEngage Energy Charts (see New Hotels EnergyAnalysis). Prices range from $4.71 to $12.85including material, labour, overheard and pro t.
• Insula on Life me – 30 years
Two types of piping are to be insulated:
1. Domes c hot water line: both primary and secondary
2. Hea ng hot water lines (temperate and cold climatesonly): Plant room piping, VAV reheat, and PTAC hea ngcoils.
NB: The cos ng assumes that there is easy access to allpiping within the exis ng hotel. It therefore does notinclude any demoli on costs.
Occupancy Sensors in Of ices:• US$193 per sensor including electrician labour
• Four o ces per hotel building
• Sensor life me – 10 years
• Conven onal cost per unit of US$0.60 with bulb lifeof 750 – 1,000 hours
• Common building labourer sta rate
Zero Use of Incandescent Lamps in Back ofHouse Spaces:• Total of 200 bulbs in back of house with 50%
designated for replacement
building
• US$193 per sensor including electrician labour
• Sensor life me – 10 years
• Increase bulb life mes by 40%
• All 200 corridor light bulbs are assumed to alreadybe CFLs
Install Weatherstripping:• Material cost of weather stripping – US$0.88/
• 5 x 5 window on 130 rooms requiring 1 hour ofcarpenter labour rate per window
• 5 x 10 window on 20 corner rooms requiring 1.5hours of carpenter labour per window
• Average weatherstripping life me – 10 years
100% of Guest Rooms have 4°F Thermostats:• US$217 per thermostat including electrician labour
• Average Life me – 15 years
Meet IPC 2006 Maximum Flow Rates:• Install aerator on all bathroom faucets and low- ow
shower heads
• Cost of each aerator is US$22.85 including commonbuilding labour rates
• Aerator life me – 15 years
• Cost of each low- ow shower head is US$77.50including plumber labour rates
• Shower head life me – 10 years
• Average Energy Star cost per unit - US$120 (onlineaverage price minus 20% bulk discount)
• Cost Premium - US$0
• Average Life me – 12 years
Zero Use of Incandescent Lamps in GuestRooms:• Total of 12 bulbs per room with 50% designated for
replacement
• Therefore, there are 6 bulbs to be changed perroom which amounts to 900 bulbs building wide
• Average Energy Star cost per unit of US$3.40 withbulb life of 6,000 – 12,000 hours
• Conven onal cost per unit of US$0.60 with bulb lifeof 750 – 1,000 hours
• Common building labourer sta rate
Zero Use of Incandescent Lamps in CirculationSpaces:• Total of 40 bulbs per corridor with 50% designated
for replacement
• Therefore, there are 20 bulbs per corridor whichrequire replacement with CFLs.
• This amounts to 100 bulbs to be replaced acrossthe en re building
• Average Energy Star cost per unit of US$3.40 withbulb life of 6,000 – 12,000 hours
• Long range sensors cover roughly 50 total
• Length of building – 220
• Therefore, 5 sensors per oor and 25 total per
Energy Model Assumptions: Individual ECMs (2/3)
Issued February 1, 2011 13 Existing Hotels Energy Analysis - Green Engage/Solutions

• Average motor life me – 15 years
In addi on, the two colder climates can also install a1 HP NEMA e ciency motor on the hot water hea ngloop.
• Cost of 1 HP NEMA e ciency motor is $531including electrician installa on rate
• Cost of 1 HP normal motor is $430 includingelectrician installa on rate
• Cost Premium of $101
• Average motor life me – 15 years
NB: demoli on costs are not included
• Therefore, there are 100 bulbs in back of housewhich require replacement with CFLs
• Average Energy Star cost per unit of US$3.40 withbulb life of 6,000 – 12,000 hours
• Conven onal cost per unit of US$0.60 with bulb lifeof 750 – 1,000 hours
• Common building labourer sta rate
Occupancy Sensors in Corridors forDecorative Fixtures:• Increase o ce light bulb life me by 25%
• All 16 o ce light bulbs are assumed to already beCFLs
Variable Frequency Drives:• VFDs only recommended on motors greater than
5HP.
• All four climate zones can install one 15 HP capableVFD for the supply fan motor
• Cost of VFD is $2,868 including electricianinstalla on rate
• VFD life me – 10 years
NEMA Premium Motors:• All four climates can install a 15 HP NEMA e ciency
motor on the supply fan.
• Cost of 15 HP NEMA e ciency motor is $1,482including electrician installa on rate
• Cost of 15 HP normal motor is $1,195 includingelectrician installa on rate
• Cost Premium of $287
Energy Model Assumptions: Individual ECMs (3/3)
Issued February 1, 2011 14 Existing Hotels Energy Analysis - Green Engage/Solutions

Source: Peel et.al. Updated world map of the Koppen-Geiger climate classi ca on, Hydrol. Earth Syst. Sci., 11, 1633–1644, 2007
Global Climate Map
Issued February 1, 2011 15 Existing Hotels Energy Analysis - Green Engage/Solutions

Hot-Humid: West Palm Beach, Florida
Climate Data
Arid: Phoenix, Arizona
Issued February 1, 2011 16 Existing Hotels Energy Analysis - Green Engage/Solutions

Temperate: New York City, New York
Climate Data
Cold-Alpine: Fargo, North Dakota
Issued February 1, 2011 17 Existing Hotels Energy Analysis - Green Engage/Solutions

Calculation Sheets
Issued February 1, 2011 18 Existing Hotels Energy Analysis - Green Engage/Solutions

InstallReplaceReplaceReplaceReplaceReplaceReplaceInstallInstallInstallInstall
InstallInstallInstall
Replace
All Climate Zones Energy Modelling Results Summary Existing Hotels
Energy Efficient Guest Room Refrigerators
Zero Use of Incandescent Lamps in Circulation SpacesZero Use of Incandescent Lamps in Back of House SpacesE-09
Fargo, NDNew York, NY
E-10
Zero Use of Incandescent Lamps in Guest Rooms
Occupancy Sensors in Corridors for Decorative Fixtures
Phoenix, ARWest Palm Beach, FL
E-07E-07
E-09E-09
Energy Efficient TVs
Immediate0.1 yrs0.2 yrs
ImmediateImmediate
M-11
0.3 yrs Immediate
B-04
0.2 yrs
6.2 yrs N/A
W-03
Variable Frequency Drives
9 yrs
2.9 yrs6 yrs
0.3 yrs Immediate
N/A
NEMA Premium Efficiency Motors 2.1 yrs
Meet IPC 2006 Maximum Flow Rates
N/A 1.3 yrs7.1 yrs N/A
Immediate
M-09
N/A 3 yrs
2.6 yrs N/A
N/A1.4 yrs
3.5 yrs N/A
M-11
Use of Building Appropriate Materials100% of Guest Rooms have 4F Deadband Thermostats 3.7 yrs
N/A 1.3 yrs N/A
5.3 yrsN/A
0.3 yrs0.1 yrs
Immediate
Immediate
2.6 yrs
0.2 yrs
3.8 yrs N/A5 yrs
Immediate
N/A
N/A 10 yrs
6 yrs 2.1 yrs
15 yrs5 yrs
3.3 yrs
N/AN/A 2.3 yrs N/A 2.2 yrs
7.1 yrs Never
7.6 yrsImmediate
0.1 yrs
N/A
Immediate0.3 yrs1.3 yrs
N/A
0.3 yrs
ImmediateImmediate ImmediateImmediate
16 yrs5.2 yrs
N/A
Immediate
2.4 yrs
6.9 yrs
6.9 yrs
Immediate20 yrs > 20 yrs
Immediate
10 yrs
Green Engage Level 2 CertificationE-08 Pipe Insulation 10 yrs N/A 10 yrs N/A 8.2 yrs
The table below summarises the financial performance, in terms of simple payback, for the modelled existing hotel in 4 climate zones against various baseline models. Energy savings for a specific building may vary based on that building's parameters and financial results may also vary based on local costs and financing structures.
For details regarding each measure and for additional energy and financial performance metrics (CO2 reduction, IRR, first year yield on marginal cost and NPV) refer to the summary pages and individual calculation pages immediately following this page. For detailed assumptions relating to the energy model, utilities, emission factors, financial inputs, cost of capital, etc refer to the assumptions section of this book.
Relevant Action Group Measure
Install New or Replace
Hot/Humid
ImmediateImmediate
N/A
0.1 yrs
Arid Temperate Cold-Alpine
Install for First Time or Replace Current Item
Now
Replace At End of Current Item's
Lifetime
Install for First Time or Replace Current Item
Now
Replace At End of Current Item's
Lifetime
Install for First Time or Replace Current Item
Now
Replace At End of Current Item's
Lifetime
Install for First Time or Replace Current Item
Now
Replace At End of Current Item's
Lifetime
Green Engage Level 1 CertificationO-04 Towel/Sheet Program Immediate N/A Immediate N/A Immediate N/A Immediate N/AE-07 Energy Efficient Appliances 7.3 yrs 1.1 yrs 7.4 yrs 1.2 yrs 7.7 yrs 1.2 yrs 7.6 yrs 1.2 yrs
N/AE-10 Occupancy Sensors in Offices 19 yrs N/A 20 yrs N/A Never N/A Never N/A
Replace
N/A
N/A
N/A
N/A
Legend (Criteria Based On Simple Payback Only):Very Short or Immediate Payback (0 - 3 years)Intermediate Payback (3 - 7 years)Long or No Payback (>7 years)N/A - Measure to be Installed for First TimeN/A
M 11 6 yrsNEMA Premium Efficiency Motors 2.1 yrs 6 yrs 2.1 yrs 3.3 yrs2.4 yrs6.9 yrs 10 yrs
Install All New Measures Immediately &Replace Existing Measures At End of Lifetime
Green Engage Level 1 Certification Cumulative Savings Scenarios
All Measures Installed or Replaced Immediately 2.7 yrs N/A 2.8 yrs N/A 3.3 yrs N/A 3.2 yrs N/A
1.3 yrs 1.3 yrs 1.5 yrs 1.5 yrs
Green Engage Level 2 Certification Cumulative Savings Scenarios (Includes Green Engage Level 1)
N/A 3.8 yrs N/A
Install All New Measures Immediately &Replace Existing Measures At End of Lifetime
1.6 yrs 1.6 yrs 2.2 yrs 2.2 yrs
All Measures Installed or Replaced Immediately 2.9 yrs N/A 3 yrs N/A 3.8 yrs
Issued February 1, 2011 19 Existing Hotels Energy Analysis - Green Engage/Solutions

Hot-Humid: Install or Replace Immediately
Issued February 1, 2011 20 Existing Hotels Energy Analysis - Green Engage/Solutions

InstallReplaceReplaceReplaceReplaceReplaceReplaceInstallInstallInstallInstall
E-07
E-10
M-09W-03
E-09E-09E-09
B-04
Immediate
Use of Building Appropriate Materials$36,032
0.9% 5.7%
2.6 yrs
9 yrs3.5 yrs
1.4 yrs
29.4% 28.0% $63,575
$19,7740.1%
519.3% $20,193
N/AN/A
74.6%
2.0%
$23,481
Meet IPC 2006 Maximum Flow Rates
Zero Use of Incandescent Lamps in Back of House Spaces
$
2.4%
Energy Efficient Guest Room RefrigeratorsZero Use of Incandescent Lamps in Guest Rooms
Occupancy Sensors in Corridors for Decorative Fixtures 76.5%
100% of Guest Rooms have 4F Deadband Thermostats1.2% 39.5% 37.4% $48,384
0.6% 2.8% 10.2% ($4,165)4.6%
$12,838($7,364)
19.5%0.9%
0.2 yrs 0.8% 523.3%
21.5%
1.7%
Install New or Replace
Hot-HumidExisting HotelsInstall or Replace ImmediatelyThe table below summarises the overall energy and financial performance for the modelled existing hotel in the hot-humid climate zone against the baseline building. Energy savings for a specific building may vary based on that building's parameters and financial results may also vary based on local costs and financing structures. For details regarding each measure refer to the individual calculation pages immediately following this page. For detailed assumptions relating to the energy model, utilities, emission factors, financial inputs, cost of capital, etc refer to the assumptions section of this book.Note: CO2 reduction percentages closely match both source energy reductions and annual energy saving cost reductions. Due to different modelling methodologies existing hotel and new hotel CO2 reduction percentages cannot be compared against each other. The stoplight colour legend contained below refers solely to simple payback periods.
Hot/HumidWest Palm Beach, FL
0.2 yrs 9.9% 705.2% 702.0% $243,3690.1 yrs $51,069
NPV(Over 20 years)Simple Payback
12.5%Energy Efficient Appliances
Zero Use of Incandescent Lamps in Circulation Spaces
Energy Modelling Results Summary
13.4%7.3 yrs
Relevant Action Group Measure
Green Engage Level 1 Certification
5 yrs
IRR
15 yrs
%
3.9%
CO2 Reductions
O-04E-07E-07 Energy Efficient TVs
Towel/Sheet Program
% %
1372.9% 1279.0%
First Year Yield On Marginal Cost
yrs
InstallInstallInstall
Replace
N/A
N/A
Legend (Criteria Based On Simple Payback Only):Very Short or Immediate Payback (0 - 3 years)Intermediate Payback (3 - 7 years)Long or No Payback (>7 years)
M-11 NEMA Premium Efficiency MotorsM-11
E-08
0.1%$7,567
9.4% $4,03719 yrs 0.0%E-10
Variable Frequency Drives 34.8%1.9% 9.1% ($291)
Pipe Insulation
15.9% $72834.6%
Occupancy Sensors in Offices10 yrs 0.7% 10.2%
Green Engage Level 2 Certification
All Measures Installed or Replaced Immediately 2.7 yrs 24.7% 39.0% 35.6% $495,357
16.7%6 yrs0.5%2.9 yrs
Green Engage Level 2 Certification Cumulative Savings Scenarios (Includes Green Engage Level 1)
All Measures Installed or Replaced Immediately 2.9 yrs 25.8% 36.0% 32.7% $502,518
Green Engage Level 1 Certification Cumulative Savings Scenarios
Issued February 1, 2011 21 Existing Hotels Energy Analysis - Green Engage/Solutions

Base Case3 commercial, non-Energy Star washing machines and
dryers, operating for 8 hours per day.
Proposed ModificationsThe energy consumption of washing machines and dryers is reduced by 17%, based on a study by the
American Hotel & Lodging Association.
Space Heating - Gas
374 6
94.21,835.9
HVAC FansHeat Rejection 0.0
2,380.3
93.71,835.9
Base Case Energy Use
Proposed Energy Use
LightingSpace Heating - Elec
0.0%
Environmental Impact Analysis
CO2 (lb/yr) 2,501,896 2,498,588 0.1%SO2 (lb/yr) 8,992 8,981
% Savings (+) / Loss (-)ProposedBase CaseEmissions
0.1%
0.1%NOX (lb/yr)
O-04 Towel/Sheet Program
0.0
Energy End-Use Benchmark Comparison
Energy End-Use
Savings (+) / Loss (-)
Operations
0.0 0.0 0.0 0.0%
MBtu/yr MBtu/yr
Savings (+) / Loss (-)
2,377.6 2.7 0.1%
0.0
PumpsSpace Cooling
374 3 0 3 0 1%
Individual Resource Calculations Install or Replace Immediately Existing Hotels Hot-Humid
-0.4 -0.5%3,483
0.0 0.00.0 0.0
3,479 0.1%%
0.0%MBtu/yr
0.0%
2,501,896 2,498,588
1,500,000
2,000,000
2,500,000
3,000,000
lb/y
r
Annual CO2 Emissions
American Hotel & Lodging Association.
Receptacles - Gas 425.8 421.8
374.6HVAC Fans
Financial Assumptions- No additional costs
- Additional savings (apart from energy) from water and laundry detergent - Water savings of 34,606 gallons - Detergent savings of 173 gallons @ $7 per gallon (This is included under the Replacement Life and Cost Summary as a Savings)- Labour cost savings are not included
Base Utilities - Gas
Receptacles - Elec 1,149.8 1,145.0 4.7 0.4%0.9%
0.1%7,795.0 7,783.7
374.3 0.3 0.1%
0.0 0.0%
0.1%
11.31,534.9 1,534.9
4.0
Total
2,501,896 2,498,588
0
500,000
1,000,000
1,500,000
2,000,000
2,500,000
3,000,000
Base Case Proposed
lb/y
r
Annual CO2 Emissions
8,992
3,483
8,981
3,479
0
2,000
4,000
6,000
8,000
10,000
SO2 (lb/yr) NOX (lb/yr)
g/yr
Annual SO2 and NOX EmissionsBase Case
Proposed
7,795 7,784
01,0002,0003,0004,0005,0006,0007,0008,0009,000
Base Case Proposed
MBt
u/yr
Annual Total Energy Use
Issued February 1, 2011 22 Existing Hotels Energy Analysis - Green Engage/Solutions

Additional Capital CostHVAC Plant First Cost Reductions
Cooling Plant SavingsHeating Plant Savings
Yr.
Financial Table
kWh
$1 879
Capital Costs Savings Summary$393
$451
$36$220
Annual Savings (+) / Loss (-)
Annual Resource Cost Summary
Galstherms
$0.0037
ResourceAnnual Resource Savings
(+) / Loss (-)
N/AN/A
2
$0
Savings (+) / Loss (-)
1
$1,389
$1,315$1,279$1,245
$1,729
$1,638$1,683
$0.9000$0.1028Unit Cost
Operations
Water & sewerNatural gasElectricity
34,60640
2,137
0 $0$0
Cash Flow$0
$393
6 $1 428
$0
First Year Yield On Marginal Cost
IRR
MBhtons $0 $437
$424543
$1,352
Immediate
N/A
N/A$414$403
$1,827$1,776
$128 Simple Payback
O-04 Towel/Sheet Program
Costs (Marginal/Maint/
Replace)
$0
Initial Annual Savings
Initial Marginal Cost
Financial Results Summary
Individual Resource Calculations Install or Replace Immediately Existing Hotels Hot-Humid
Heating Plant SavingsAirside Distribution Savings
Total Additional Capital Cost:
Estimated Useful Life (yrs)Percent replacedReplacement Cost (In 2010 Dollars)
Base YearValuation TypeProject Analysis PeriodInflation RateDiscount Rate for Defined ValuationEnergy Escalation Rate (Nominal)
N/A $0$1,879$451N/A $0
$0
1 Replacement Life and Cost Summary
20191817Defined
20
2010
100%$1,211 $1,731
$1,638 $526
$2,425
$684$661$639
(See Table in Assumptions)
$1,986
11
$2,041 $2,7252.79%
Financial Analysis
$1,684
$1,779$597
$2,647
7.19%
$559
$2,571$2,497
13
$2,098 $708 $2,806
$465 $1,933
$542
876
$479$1,509
109
12
$1,551$510$494
$1,594
$1,468$1,428
1615
$617
14
$1,879
$577 $2,356
$1,932
$1,828
$2,164$2,103$2,045$1,988
$2,226$2,290
NPVcfmMBh $19,774
$0 $5,000
$10,000 $15,000 $20,000 $25,000 $30,000 $35,000 $40,000 $45,000 $50,000
0 5 10 15 20
Net
Cas
h Fl
ow (E
nd o
f Yea
r)
Years
Simple Payback Graph
Issued February 1, 2011 23 Existing Hotels Energy Analysis - Green Engage/Solutions

All appliances replaced with Energy Star rated equivalents. Overall saving of 30% on electricity and
34% on natural gas.
Energy E-07 Energy Efficient Appliances
Energy End-Use Benchmark Comparison Environmental Impact Analysis
Energy End-Use
Base Case Energy Use
Proposed Energy Use
Savings (+) / Loss (-)
Savings (+) / Loss (-)
MBtu/yr MBtu/yr MBtu/yr %
Emissions Base Case Proposed % Savings (+) / Loss (-)
Base CaseThe following commercial, non-Energy Star appliances
located in the food preparation and laundry areas: 3 washing machines, 2 dishwashers, 4 gas ovens, 2
fridges, 2 freezers, 2 icemakers and 5 vending machines
Space Heating - Gas 0.0 0.0
CO2 (lb/yr) 2,501,896 2,442,457 2.4%
3,483 3,409 2.1%Space Heating - Elec 93.7 95.4 -1.7 -1.8%
SO2 (lb/yr) 8,992 8,825 1.9%Lighting 1,835.9 1,835.9 0.0 0.0% NOX (lb/yr)
0.0 0.0%Space Cooling 2,380.3 2,370.6 9.7 0.4%Proposed ModificationsPumps 0.0 0.0 0.0 -16.7%
HVAC Fans 374 6 373 6 1 0 0 3%
2.4%Heat Rejection 0.0 0.0 0.0 0.0%
Individual Resource Calculations Install or Replace Immediately Existing Hotels Hot-Humid
2,501,896 2,442,457
1,500,000
2,000,000
2,500,000
3,000,000
lb/y
r
Annual CO2 Emissions
34% on natural gas.
255.1 3.3%Base Utilities - Gas 1,534.9 1,534.9 0.0 0.0%
HVAC Fans 374.6 373.6 1.0 0.3%Receptacles - Elec 1,149.8 1,050.1 99.7 8.7%Receptacles - Gas 425.8 279.4 146.4 34.4%
- Basket of commercial appliances that have an energy star rating- Total weighted basket cost of US$79,451 and a weighted cost premium of US$5,864- Average lifetime of 12 years- Appliances include 3 washing machines, 2 dishwashers, 4 gas ovens, 2 fridges, 2 freezers, 2 icemakers and 5 vending machines
3.3%
Financial Assumptions Total 7,795.0 7,539.9
2,501,896 2,442,457
0
500,000
1,000,000
1,500,000
2,000,000
2,500,000
3,000,000
Base Case Proposed
lb/y
r
Annual CO2 Emissions
8,992
3,483
8,825
3,409
0
2,000
4,000
6,000
8,000
10,000
SO2 (lb/yr) NOX (lb/yr)
g/yr
Annual SO2 and NOX EmissionsBase Case
Proposed
7,795 7,540
01,0002,0003,0004,0005,0006,0007,0008,0009,000
Base Case Proposed
MBt
u/yr
Annual Total Energy Use
Issued February 1, 2011 24 Existing Hotels Energy Analysis - Green Engage/Solutions

Additional Capital CostHVAC Plant First Cost Reductions
Cooling Plant SavingsHeating Plant Savings
Cash FlowInitial Marginal Cost $42,658
$5,352
Annual Resource Cost Summary Financial Table Financial Results Summary
ResourceAnnual Resource Savings
(+) / Loss (-) Unit CostAnnual Savings (+) /
Loss (-)Yr.
Costs (Marginal/Maint/
Replace)
Savings (+) / Loss (-)
Natural gas 1,464 therms $0.9000 $1,318Electricity 31,857 kWh $0.1028 $3,275 Initial Annual Savings
Water & sewer 164,438 Gals $0.0037 $608 0 ($42,658) $0 ($42,658)1 $0 $5,352 $5,352
Simple Payback 7.3 yrs
4 $0 $5,837 $5,837 First Year Yield On Marginal Cost 12.5%
13.4%IRR3 $0 $5,669 $5,6692 $0 $5,507
N/A MBh $0 6 $0 $6 220 $6 220N/A tons $0 5 $0 $6,025 $6,025
Individual Resource Calculations Install or Replace Immediately Existing Hotels Hot-Humid
($42,658)Capital Costs Savings Summary $5,507
Energy E-07 Energy Efficient Appliances
Heating Plant SavingsAirside Distribution Savings
Total Additional Capital Cost:
Estimated Useful Life (yrs)Percent replacedReplacement Cost Premium (In 2010 Dollars)
Base YearValuation TypeProject Analysis PeriodInflation RateDiscount Rate for Defined ValuationEnergy Escalation Rate (Nominal)
N/A MBh $0 6 $0 $6,220 $6,220 NPV
9 $0 $6,844 $6,844
$6,4228 $0 $6,630 $6,630
$23,4817 $0 $6,422
12 11 $0 $7,303 $7,303Replacement Life and Cost Summary 10 $0 $7,070 $7,070
14 $0 $8,050 $8,050($5,864) 13 $0 $7,793 $7,793
2010 16 $0 $8,678 $8,678Financial Analysis 15 $0 $8,358 $8,358
20 18 $0 $9,355 $9,355Defined 17 $0 $9,010 $9,010
7.19% 20 $0 $10,079 $10,0792.79% 19 $0 $9,714 $9,714
(See Table in Assumptions)
100% 12 ($8,154) $7,544 ($610)
($42,658)N/A cfm $0
($60,000)($40,000)($20,000)
$0 $20,000 $40,000 $60,000 $80,000
$100,000 $120,000
0 5 10 15 20
Net
Cas
h Fl
ow (E
nd o
f Yea
r)
Years
Simple Payback Graph
Issued February 1, 2011 25 Existing Hotels Energy Analysis - Green Engage/Solutions
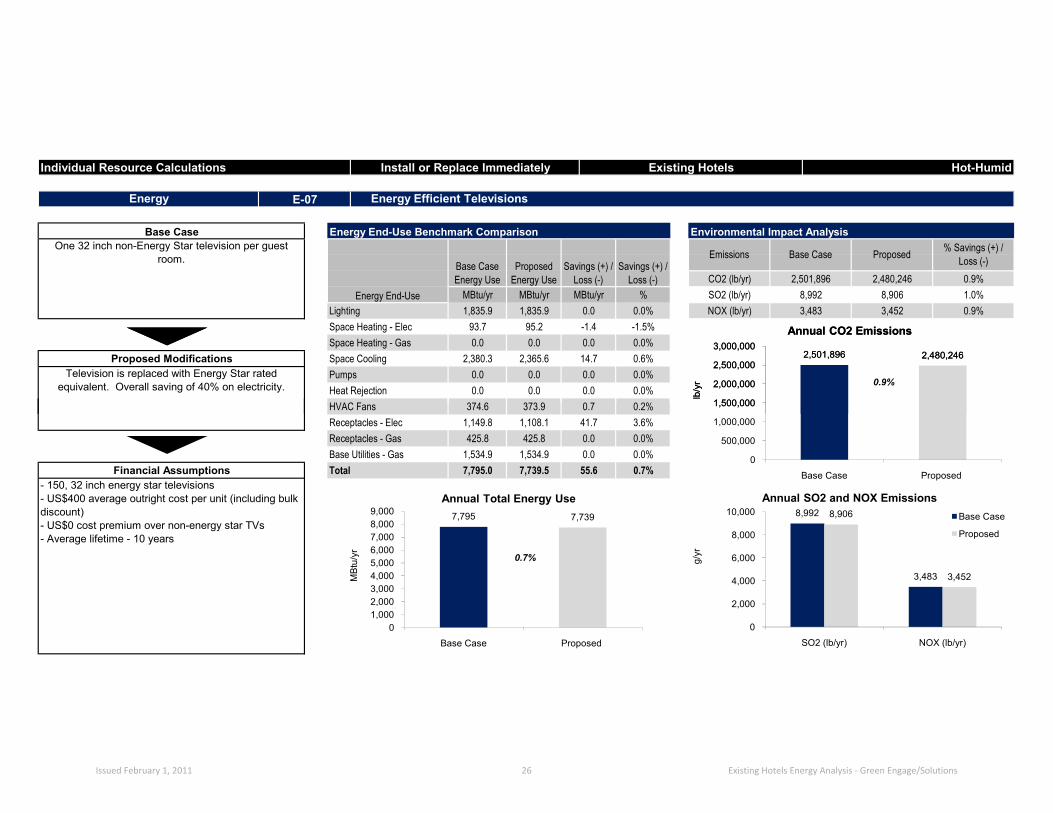
Television is replaced with Energy Star rated equivalent. Overall saving of 40% on electricity.
Energy E-07 Energy Efficient Televisions
Energy End-Use Benchmark Comparison Environmental Impact Analysis
Energy End-Use
Base Case Energy Use
Proposed Energy Use
Savings (+) / Loss (-)
Savings (+) / Loss (-)
MBtu/yr MBtu/yr MBtu/yr %
Emissions Base Case Proposed % Savings (+) / Loss (-)
Base CaseOne 32 inch non-Energy Star television per guest
room.
Space Heating - Gas 0.0 0.0
CO2 (lb/yr) 2,501,896 2,480,246 0.9%
3,483 3,452 0.9%Space Heating - Elec 93.7 95.2 -1.4 -1.5%
SO2 (lb/yr) 8,992 8,906 1.0%Lighting 1,835.9 1,835.9 0.0 0.0% NOX (lb/yr)
0.0 0.0%Space Cooling 2,380.3 2,365.6 14.7 0.6%Proposed ModificationsPumps 0.0 0.0 0.0 0.0%
HVAC Fans 374 6 373 9 0 7 0 2%
0.9%Heat Rejection 0.0 0.0 0.0 0.0%
Individual Resource Calculations Install or Replace Immediately Existing Hotels Hot-Humid
2,501,896 2,480,246
1,500,000
2,000,000
2,500,000
3,000,000
lb/y
r
Annual CO2 Emissions
55.6 0.7%Base Utilities - Gas 1,534.9 1,534.9 0.0 0.0%
HVAC Fans 374.6 373.9 0.7 0.2%Receptacles - Elec 1,149.8 1,108.1 41.7 3.6%Receptacles - Gas 425.8 425.8 0.0 0.0%
- 150, 32 inch energy star televisions- US$400 average outright cost per unit (including bulk discount)- US$0 cost premium over non-energy star TVs- Average lifetime - 10 years
0.7%
Financial Assumptions Total 7,795.0 7,739.5
2,501,896 2,480,246
0
500,000
1,000,000
1,500,000
2,000,000
2,500,000
3,000,000
Base Case Proposed
lb/y
r
Annual CO2 Emissions
8,992
3,483
8,906
3,452
0
2,000
4,000
6,000
8,000
10,000
SO2 (lb/yr) NOX (lb/yr)
g/yr
Annual SO2 and NOX EmissionsBase Case
Proposed
7,795 7,739
01,0002,0003,0004,0005,0006,0007,0008,0009,000
Base Case Proposed
MBt
u/yr
Annual Total Energy Use
Issued February 1, 2011 26 Existing Hotels Energy Analysis - Green Engage/Solutions

Additional Capital CostHVAC Plant First Cost Reductions
Cooling Plant SavingsHeating Plant Savings
Cash FlowInitial Marginal Cost $30,000
$1,706
Annual Resource Cost Summary Financial Table Financial Results Summary
ResourceAnnual Resource Savings
(+) / Loss (-) Unit CostAnnual Savings (+) /
Loss (-)Yr.
Costs (Marginal/Maint/
Replace)
Savings (+) / Loss (-)
Natural gas 0 therms $0.9000 $0Electricity 16,286 kWh $0.1028 $1,674 Initial Annual Savings
Water & sewer 0 Gals $0.0037 $0 0 ($30,000) $0 ($30,000)1 $0 $1,706 $1,706
Simple Payback 15 yrs
4 $0 $1,805 $1,805 First Year Yield On Marginal Cost 5.7%
3.9%IRR3 $0 $1,771 $1,7712 $0 $1,738
N/A MBh $0 6 $0 $1 922 $1 922N/A tons $0 5 $0 $1,863 $1,863
Individual Resource Calculations Install or Replace Immediately Existing Hotels Hot-Humid
($30,000)Capital Costs Savings Summary $1,738
Energy E-07 Energy Efficient Televisions
Heating Plant SavingsAirside Distribution Savings
Total Additional Capital Cost:
Estimated Useful Life (yrs)Percent replacedReplacement Cost Premium (In 2010 Dollars)
Base YearValuation TypeProject Analysis PeriodInflation RateDiscount Rate for Defined ValuationEnergy Escalation Rate (Nominal)
N/A MBh $0 6 $0 $1,922 $1,922 NPV
9 $0 $2,113 $2,113
$1,9848 $0 $2,047 $2,047
-$7,3647 $0 $1,984
10 11 $0 $2,255 $2,255Replacement Life and Cost Summary 10 $0 $2,183 $2,183
14 $0 $2,485 $2,485$0 13 $0 $2,406 $2,406
2010 16 $0 $2,668 $2,668Financial Analysis 15 $0 $2,575 $2,575
20 18 $0 $2,863 $2,863Defined 17 $0 $2,764 $2,764
7.19% 20 $0 $3,079 $3,0792.79% 19 $0 $2,966 $2,966
(See Table in Assumptions)
100% 12 $0 $2,329 $2,329
($30,000)N/A cfm $0
($40,000)
($30,000)
($20,000)
($10,000)
$0
$10,000
$20,000
0 5 10 15 20
Net
Cas
h Fl
ow (E
nd o
f Yea
r)
Years
Simple Payback Graph
Issued February 1, 2011 27 Existing Hotels Energy Analysis - Green Engage/Solutions

Base CaseOne 3 cu. ft. non-Energy Star refrigerator per guest
room.
Proposed ModificationsRefrigerator is replaced with Energy Star rated
equivalent. Overall saving of 24% on electricity.
Energy E-07 Energy Efficient Guest Room Refrigerators
Energy End-Use Benchmark Comparison Environmental Impact Analysis
Energy End-Use
Base Case Energy Use
Proposed Energy Use
Savings (+) / Loss (-)
Savings (+) / Loss (-)
MBtu/yr MBtu/yr MBtu/yr %
Emissions Base Case Proposed % Savings (+) / Loss (-)
Space Heating - Gas 0.0
CO2 (lb/yr) 2,501,896 2,479,605 0.9%
3,483 3,451 0.9%Space Heating - Elec 93.7 95.2 -1.5 -1.6%
SO2 (lb/yr) 8,992 8,904 1.0%Lighting 1,835.9 1,835.9 0.0 0.0% NOX (lb/yr)
0.0 0.0 0.0%Space Cooling 2,380.3 2,365.2 15.1 0.6%
0.0%
374 6 373 9 0 7 0 2%
0.9%Heat Rejection 0.0 0.0 0.0 0.0%Pumps 0.0 0.0 0.0
HVAC Fans
Individual Resource Calculations Install or Replace Immediately Existing Hotels Hot-Humid
2,501,896 2,479,605
1,500,000
2,000,000
2,500,000
3,000,000
lb/y
r
Annual CO2 Emissions
374.6 373.9 0.7 0.2%Receptacles - Elec 1,149.8 1,106.9 42.9 3.7%
Base Utilities - Gas 1,534.9 1,534.9 0.0 0.0%
- Medium sized bar fridge at 3 cu. ft.- Average Energy Star cost per unit - US$120 (online average price minus 20% bulk discount)- Cost Premium - US$0- Average Lifetime – 12 years
0.7%
Receptacles - Gas 425.8 425.8 0.0 0.0%
HVAC Fans
Financial Assumptions Total 7,795.0 7,737.8 57.2 0.7%
2,501,896 2,479,605
0
500,000
1,000,000
1,500,000
2,000,000
2,500,000
3,000,000
Base Case Proposed
lb/y
r
Annual CO2 Emissions
8,992
3,483
8,904
3,451
0
2,000
4,000
6,000
8,000
10,000
SO2 (lb/yr) NOX (lb/yr)
g/yr
Annual SO2 and NOX EmissionsBase Case
Proposed
7,795 7,738
01,0002,0003,0004,0005,0006,0007,0008,0009,000
Base Case Proposed
MBt
u/yr
Annual Total Energy Use
Issued February 1, 2011 28 Existing Hotels Energy Analysis - Green Engage/Solutions

Additional Capital CostHVAC Plant First Cost Reductions
Cooling Plant SavingsHeating Plant Savings
Energy E-07 Energy Efficient Guest Room Refrigerators
Annual Resource Cost Summary Financial Table Financial Results Summary
ResourceAnnual Resource Savings
(+) / Loss (-) Unit CostAnnual Savings (+) /
Loss (-)Yr.
Costs (Marginal/Maint/
Replace)
Savings (+) / Loss (-)
Natural gas 0 therms $0.9000 $0Electricity 16,768 kWh $0.1028 $1,724
Cash FlowInitial Marginal Cost $9,000
$1,757Initial Annual Savings
Water & sewer 0 Gals $0.0037 $0 0 ($9,000) $01 $0 $1,757 $1,757
($9,000) Simple Payback 5 yrs
($9,000) 3 $0 $1,824 $1,824Capital Costs Savings Summary 2 $0 $1,790 $1,790
4 $0 $1,859 $1,859 First Year Yield On Marginal Cost 19.5%
21.5%IRR
N/A tons $0 5 $0 $1,918 $1,918N/A MBh $0 6 $0 $1 979 $1 979
Individual Resource Calculations Install or Replace Immediately Existing Hotels Hot-Humid
Heating Plant SavingsAirside Distribution Savings
Total Additional Capital Cost:
Estimated Useful Life (yrs)Percent replacedReplacement Cost Premium (In 2010 Dollars)
Base YearValuation TypeProject Analysis PeriodInflation RateDiscount Rate for Defined ValuationEnergy Escalation Rate (Nominal)
9 $0
N/A cfm $0 7 $0 $2,043N/A MBh $0 6 $0 $1,979 $1,979
($9,000) 8 $0 $2,108 $2,108
$12,838NPV$2,043
$2,176 $2,176
14 $0 $2,559 $2,55913 $0 $2,477 $2,477
$0 $2,247 $2,247
2010 16 $0 $2,747 $2,747Financial Analysis 15 $0 $2,651 $2,651
20 18 $0 $2,948 $2,948Defined 17 $0 $2,845 $2,845
7.19% 20 $0 $3,170 $3,1702.79% 19 $0 $3,054 $3,054
(See Table in Assumptions)
$0100% 12 $0 $2,398 $2,398
12 11 $0 $2,322 $2,322Replacement Life and Cost Summary 10
($20,000)
($10,000)
$0
$10,000
$20,000
$30,000
$40,000
$50,000
0 5 10 15 20
Net
Cas
h Fl
ow (E
nd o
f Yea
r)
Years
Simple Payback Graph
Issued February 1, 2011 29 Existing Hotels Energy Analysis - Green Engage/Solutions

All 75W incandescent bulbs are replaced with 25W CFLs (6 per room or 900 in total). The guest room
lighting density is reduced to 0.75 W/sf.
Each guest room contains a total of 12 light bulbs. There is a 50/50 split of 75W incandescent bulbs and
25W CFLs, giving a lighting density of 1.5 W/sf. Bulbs operate for 8 hours/day.
Proposed Modifications
Energy E-09 Zero Use of Incandescent Lamps in Guest Rooms
Energy End-Use Benchmark Comparison Environmental Impact Analysis
Energy End-Use
Base Case Energy Use
Proposed Energy Use
Savings (+) / Loss (-)
Savings (+) / Loss (-)
MBtu/yr MBtu/yr MBtu/yr %
Emissions Base Case Proposed % Savings (+) / Loss (-)
Base Case
Space Heating - Gas 0.0
CO2 (lb/yr) 2,501,896 2,253,343 9.9%
3,483 3,121 10.4%Space Heating - Elec 93.7 113.2 -19.5 -20.8%
SO2 (lb/yr) 8,992 8,009 10.9%Lighting 1,835.9 1,355.3 480.6 26.2% NOX (lb/yr)
0.0 0.0 0.0%Space Cooling 2,380.3 2,207.9 172.4 7.2%Pumps 0.0 0.0 0.0 0.0%
HVAC Fans 374 6 370 2 4 4 1 2%
9.9%Heat Rejection 0.0 0.0 0.0 0.0%
Individual Resource Calculations Install or Replace Immediately Existing Hotels Hot-Humid
2,501,8962,253,343
1,500,000
2,000,000
2,500,000
3,000,000
lb/y
r
Annual CO2 Emissions
lighting density is reduced to 0.75 W/sf.
638.0 8.2%Base Utilities - Gas 1,534.9 1,534.9 0.0 0.0%
HVAC Fans 374.6 370.2 4.4 1.2%Receptacles - Elec 1,149.8 1,149.8 0.0 0.0%Receptacles - Gas 425.8 425.8 0.0 0.0%
- Total of 12 bulbs per room with 50% designated for replacement- Average Energy Star cost per unit of US$3.40 with bulb life of 6,000 – 12,000 hours- Conventional cost per unit of US$0.60 with bulb life of 750 – 1,000 hours- Common building laborer staff rate- Replacement cost premium is a savings because light bulbs will last longer for the price paid
8.2%
Financial Assumptions Total 7,795.0 7,157.0
2,501,8962,253,343
0
500,000
1,000,000
1,500,000
2,000,000
2,500,000
3,000,000
Base Case Proposed
lb/y
r
Annual CO2 Emissions
8,992
3,483
8,009
3,121
0
2,000
4,000
6,000
8,000
10,000
SO2 (lb/yr) NOX (lb/yr)
g/yr
Annual SO2 and NOX EmissionsBase Case
Proposed
7,7957,157
01,0002,0003,0004,0005,0006,0007,0008,0009,000
Base Case Proposed
MBt
u/yr
Annual Total Energy Use
Issued February 1, 2011 30 Existing Hotels Energy Analysis - Green Engage/Solutions

Additional Capital CostHVAC Plant First Cost Reductions
Cooling Plant SavingsHeating Plant Savings
Cash FlowInitial Marginal Cost $2,790
$19,586
Annual Resource Cost Summary Financial Table Financial Results Summary
ResourceAnnual Resource Savings
(+) / Loss (-) Unit CostAnnual Savings (+) /
Loss (-)Yr.
Costs (Marginal/Maint/
Replace)
Savings (+) / Loss (-)
Natural gas 0 therms $0.9000 $0Electricity 186,973 kWh $0.1028 $19,221 Initial Annual Savings
Water & sewer 0 Gals $0.0037 $0 0 ($2,790) $0 ($2,790)1 $0 $19,586 $19,586
Simple Payback 0.2 yrs
4 $0 $20,724 $20,724 First Year Yield On Marginal Cost 702.0%
705.2%IRR3 $2,709 $20,337 $23,0462 $0 $19,958
N/A MBh $0 6 $2 941 $22 071 $25 013N/A tons $0 5 $0 $21,387 $21,387
Individual Resource Calculations Install or Replace Immediately Existing Hotels Hot-Humid
($2,790)Capital Costs Savings Summary $19,958
Energy E-09 Zero Use of Incandescent Lamps in Guest Rooms
Heating Plant SavingsAirside Distribution Savings
Total Additional Capital Cost:
Estimated Useful Life (yrs)Percent replacedReplacement Cost Premium (In 2010 Dollars)
Base YearValuation TypeProject Analysis PeriodInflation RateDiscount Rate for Defined ValuationEnergy Escalation Rate (Nominal)
N/A MBh $0 6 $2,941 $22,071 $25,013 NPV
9 $3,194 $24,259 $27,453
$22,7788 $0 $23,506 $23,506
$243,3697 $0 $22,778
3 11 $0 $25,886 $25,886Replacement Life and Cost Summary 10 $0 $25,059 $25,059
14 $0 $28,534 $28,534$2,494 13 $0 $27,623 $27,623
2010 16 $0 $30,626 $30,626Financial Analysis 15 $3,766 $29,562 $33,328
20 18 $4,090 $32,871 $36,960Defined 17 $0 $31,728 $31,728
7.19% 20 $0 $35,348 $35,3482.79% 19 $0 $34,054 $34,054
(See Table in Assumptions)
100% 12 $3,468 $26,740 $30,209
($2,790)N/A cfm $0
($100,000)
$0
$100,000
$200,000
$300,000
$400,000
$500,000
$600,000
0 5 10 15 20Net
Cas
h Fl
ow (E
nd o
f Yea
r)
Years
Simple Payback Graph
Issued February 1, 2011 31 Existing Hotels Energy Analysis - Green Engage/Solutions

All 75W incandescent bulbs are replaced with 25W CFLs (20 per floor or 100 in total). The guest room
lighting density is reduced to 0.35 W/sf.
Corridors contain 40 light bulbs per floor. There is a 50/50 split of 75W incandescent bulbs and 25W CFLs, giving a lighting density of 0.7 W/sf. Bulbs operate for
24 hours/day.
Proposed Modifications
Energy E-09 Zero Use of Incandescent Lamps in Circulation Spaces
Energy End-Use Benchmark Comparison Environmental Impact Analysis
Energy End-Use
Base Case Energy Use
Proposed Energy Use
Savings (+) / Loss (-)
Savings (+) / Loss (-)
MBtu/yr MBtu/yr MBtu/yr %
Emissions Base Case Proposed % Savings (+) / Loss (-)
Base Case
Space Heating - Gas 0.0
CO2 (lb/yr) 2,501,896 2,451,580 2.0%
3,483 3,410 2.1%Space Heating - Elec 93.7 157.0 -63.3 -67.5%
SO2 (lb/yr) 8,992 8,793 2.2%Lighting 1,835.9 1,678.9 157.0 8.6% NOX (lb/yr)
0.0 0.0 0.0%Space Cooling 2,380.3 2,349.3 31.0 1.3%Pumps 0.0 0.0 0.0 -16.7%
HVAC Fans 374 6 370 2 4 4 1 2%
2.0%Heat Rejection 0.0 0.0 0.0 0.0%
Individual Resource Calculations Install or Replace Immediately Existing Hotels Hot-Humid
2,501,896 2,451,580
1,500,000
2,000,000
2,500,000
3,000,000
lb/y
r
Annual CO2 Emissions
lighting density is reduced to 0.35 W/sf.
129.1 1.7%Base Utilities - Gas 1,534.9 1,534.9 0.0 0.0%
HVAC Fans 374.6 370.2 4.4 1.2%Receptacles - Elec 1,149.8 1,149.8 0.0 0.0%Receptacles - Gas 425.8 425.8 0.0 0.0%
- Total of 40 bulbs per corridor with 50% designated for replacement- This amounts to 100 bulbs to be replaced across the entire building- Average Energy Star cost per unit of US$3.40 with bulb life of 6,000 – 12,000 hours- Conventional cost per unit of US$0.60 with bulb life of 750 – 1,000 hours- Common building laborer staff rate- Replacement cost premium is a savings because light bulbs will last longer for the price paid
1.7%
Financial Assumptions Total 7,795.0 7,665.9
2,501,896 2,451,580
0
500,000
1,000,000
1,500,000
2,000,000
2,500,000
3,000,000
Base Case Proposed
lb/y
r
Annual CO2 Emissions
8,992
3,483
8,793
3,410
0
2,000
4,000
6,000
8,000
10,000
SO2 (lb/yr) NOX (lb/yr)
g/yr
Annual SO2 and NOX EmissionsBase Case
Proposed
7,795 7,666
01,0002,0003,0004,0005,0006,0007,0008,0009,000
Base Case Proposed
MBt
u/yr
Annual Total Energy Use
Issued February 1, 2011 32 Existing Hotels Energy Analysis - Green Engage/Solutions

Additional Capital CostHVAC Plant First Cost Reductions
Cooling Plant SavingsHeating Plant Savings
Cash FlowInitial Marginal Cost $310
$3,965
Annual Resource Cost Summary Financial Table Financial Results Summary
ResourceAnnual Resource Savings
(+) / Loss (-) Unit CostAnnual Savings (+) /
Loss (-)Yr.
Costs (Marginal/Maint/
Replace)
Savings (+) / Loss (-)
Natural gas 0 therms $0.9000 $0Electricity 37,850 kWh $0.1028 $3,891 Initial Annual Savings
Water & sewer 0 Gals $0.0037 $0 0 ($310) $0 ($310)1 $285 $3,965 $4,250
Simple Payback 0.1 yrs
4 $309 $4,195 $4,505 First Year Yield On Marginal Cost 1279.0%
1372.9%IRR3 $301 $4,117 $4,4182 $293 $4,040
N/A MBh $0 6 $327 $4 468 $4 795N/A tons $0 5 $318 $4,329 $4,647
Individual Resource Calculations Install or Replace Immediately Existing Hotels Hot-Humid
($310)Capital Costs Savings Summary $4,333
Energy E-09 Zero Use of Incandescent Lamps in Circulation Spaces
Heating Plant SavingsAirside Distribution Savings
Total Additional Capital Cost:
Estimated Useful Life (yrs)Percent replacedReplacement Cost Premium (In 2010 Dollars)
Base YearValuation TypeProject Analysis PeriodInflation RateDiscount Rate for Defined ValuationEnergy Escalation Rate (Nominal)
N/A MBh $0 6 $327 $4,468 $4,795 NPV
9 $355 $4,911 $5,266
$4,9478 $345 $4,759 $5,104
$51,0697 $336 $4,611
1 11 $375 $5,240 $5,615Replacement Life and Cost Summary 10 $365 $5,073 $5,438
14 $407 $5,776 $6,183$277 13 $396 $5,592 $5,988
2010 16 $430 $6,200 $6,630Financial Analysis 15 $418 $5,984 $6,403
20 18 $454 $6,654 $7,109Defined 17 $442 $6,423 $6,865
7.19% 20 $480 $7,156 $7,6362.79% 19 $467 $6,894 $7,361
(See Table in Assumptions)
100% 12 $385 $5,413 $5,799
($310)N/A cfm $0
($20,000)
$0
$20,000
$40,000
$60,000
$80,000
$100,000
$120,000
0 5 10 15 20Net
Cas
h Fl
ow (E
nd o
f Yea
r)
Years
Simple Payback Graph
Issued February 1, 2011 33 Existing Hotels Energy Analysis - Green Engage/Solutions

Base Case
All 75W incandescent bulbs are replaced with 25W CFLs (100 in total). The average lighting density is
reduced to 0.7 W/sf.
Offices, food preparation, lockers, laundry, mechanical and electrical spaces contain a total of 200 light bulbs. There is a 50/50 split of 75W incandescent bulbs and 25W CFLs, giving an average lighting density of 1.4 W/sf. Bulbs operate for 8
hours/day.
Proposed Modifications
Energy E-09 Zero Use of Incandescent Lamps in Back of House
Energy End-Use Benchmark Comparison Environmental Impact Analysis
Energy End-Use
Base Case Energy Use
Proposed Energy Use
Savings (+) / Loss (-)
Savings (+) / Loss (-)
MBtu/yr MBtu/yr MBtu/yr %
Emissions Base Case Proposed % Savings (+) / Loss (-)
Space Heating - Gas 0.0
CO2 (lb/yr) 2,501,896 2,481,468 0.8%
3,483 3,454 0.9%Space Heating - Elec 93.7 96.7 -3.0 -3.2%
SO2 (lb/yr) 8,992 8,911 0.9%Lighting 1,835.9 1,799.0 36.9 2.0% NOX (lb/yr)
0.0 0.0 0.0%Space Cooling 2,380.3 2,363.6 16.7 0.7%Pumps 0.0 0.0 0.0 -16.7%
HVAC Fans 374 6 372 8 1 8 0 5%
0.8%Heat Rejection 0.0 0.0 0.0 0.0%
Individual Resource Calculations Install or Replace Immediately Existing Hotels Hot-Humid
2,501,896 2,481,468
1,500,000
2,000,000
2,500,000
3,000,000
lb/y
r
Annual CO2 Emissions
reduced to 0.7 W/sf.
52.4 0.7%Base Utilities - Gas 1,534.9 1,534.9 0.0 0.0%
HVAC Fans 374.6 372.8 1.8 0.5%Receptacles - Elec 1,149.8 1,149.8 0.0 0.0%Receptacles - Gas 425.8 425.8 0.0 0.0%
- Total of 200 bulbs in back of house with 50% designated for replacement- Average Energy Star cost per unit of US$3.40 with bulb life of 6,000 – 12,000 hours- Conventional cost per unit of US$0.60 with bulb life of 750 – 1,000 hours- Common building laborer staff rate- Replacement cost premium is a savings because light bulbs will last longer for the price paid
0.7%
Financial Assumptions Total 7,795.0 7,742.6
2,501,896 2,481,468
0
500,000
1,000,000
1,500,000
2,000,000
2,500,000
3,000,000
Base Case Proposed
lb/y
r
Annual CO2 Emissions
8,992
3,483
8,911
3,454
0
2,000
4,000
6,000
8,000
10,000
SO2 (lb/yr) NOX (lb/yr)
g/yr
Annual SO2 and NOX EmissionsBase Case
Proposed
7,795 7,743
01,0002,0003,0004,0005,0006,0007,0008,0009,000
Base Case Proposed
MBt
u/yr
Annual Total Energy Use
Issued February 1, 2011 34 Existing Hotels Energy Analysis - Green Engage/Solutions

Additional Capital CostHVAC Plant First Cost Reductions
Cooling Plant SavingsHeating Plant Savings
Cash FlowInitial Marginal Cost $310
$1,610
Annual Resource Cost Summary Financial Table Financial Results Summary
ResourceAnnual Resource Savings
(+) / Loss (-) Unit CostAnnual Savings (+) /
Loss (-)Yr.
Costs (Marginal/Maint/
Replace)
Savings (+) / Loss (-)
Natural gas 0 therms $0.9000 $0Electricity 15,367 kWh $0.1028 $1,580 Initial Annual Savings
Water & sewer 0 Gals $0.0037 $0 0 ($310) $0 ($310)1 $0 $1,610 $1,610
Simple Payback 0.2 yrs
4 $0 $1,703 $1,703 First Year Yield On Marginal Cost 519.3%
523.3%IRR3 $301 $1,671 $1,9722 $0 $1,640
N/A MBh $0 6 $327 $1 814 $2 141N/A tons $0 5 $0 $1,758 $1,758
Individual Resource Calculations Install or Replace Immediately Existing Hotels Hot-Humid
($310)Capital Costs Savings Summary $1,640
Energy E-09 Zero Use of Incandescent Lamps in Back of House
Heating Plant SavingsAirside Distribution Savings
Total Additional Capital Cost:
Estimated Useful Life (yrs)Percent replacedReplacement Cost Premium (In 2010 Dollars)
Base YearValuation TypeProject Analysis PeriodInflation RateDiscount Rate for Defined ValuationEnergy Escalation Rate (Nominal)
N/A MBh $0 6 $327 $1,814 $2,141 NPV
9 $355 $1,994 $2,349
$1,8728 $0 $1,932 $1,932
$20,1937 $0 $1,872
3 11 $0 $2,128 $2,128Replacement Life and Cost Summary 10 $0 $2,060 $2,060
14 $0 $2,345 $2,345$277 13 $0 $2,270 $2,270
2010 16 $0 $2,517 $2,517Financial Analysis 15 $418 $2,430 $2,848
20 18 $454 $2,702 $3,156Defined 17 $0 $2,608 $2,608
7.19% 20 $0 $2,905 $2,9052.79% 19 $0 $2,799 $2,799
(See Table in Assumptions)
100% 12 $385 $2,198 $2,583
($310)N/A cfm $0
($5,000)$0
$5,000 $10,000 $15,000 $20,000 $25,000 $30,000 $35,000 $40,000 $45,000 $50,000
0 5 10 15 20Net
Cas
h Fl
ow (E
nd o
f Yea
r)
Years
Simple Payback Graph
Issued February 1, 2011 35 Existing Hotels Energy Analysis - Green Engage/Solutions
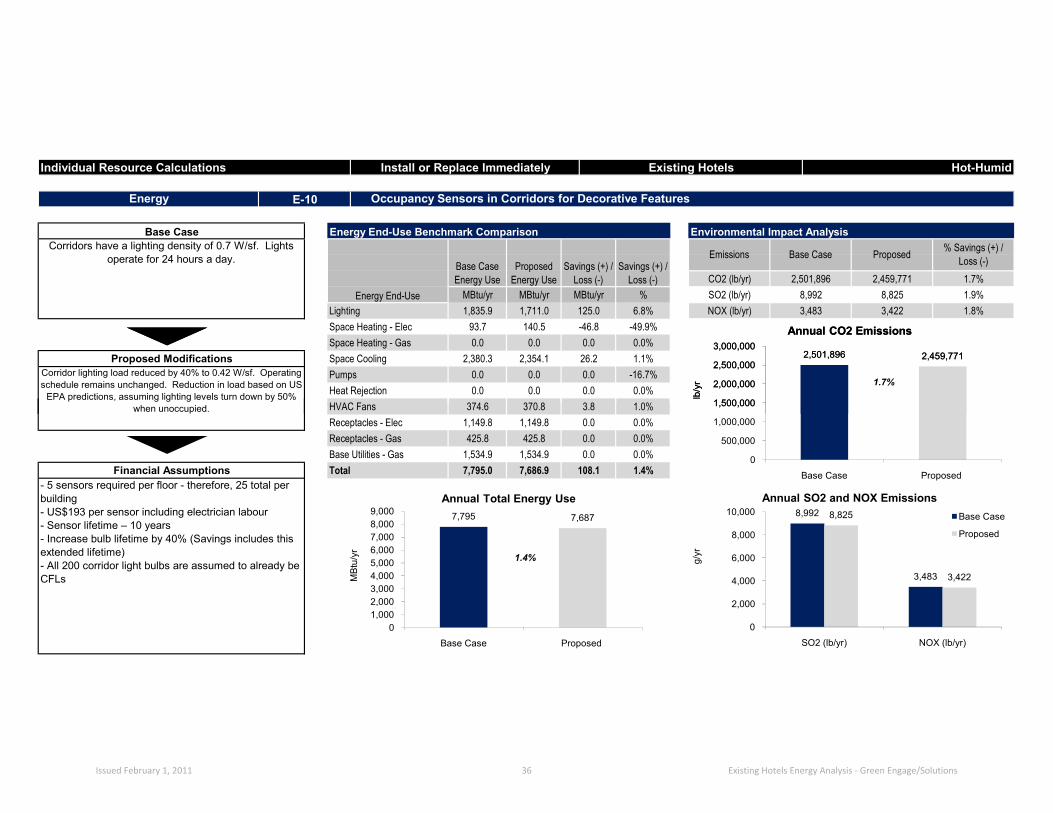
Base CaseCorridors have a lighting density of 0.7 W/sf. Lights
operate for 24 hours a day.
Proposed ModificationsCorridor lighting load reduced by 40% to 0.42 W/sf. Operating schedule remains unchanged. Reduction in load based on US
EPA predictions, assuming lighting levels turn down by 50% h i d
Energy E-10 Occupancy Sensors in Corridors for Decorative Features
Energy End-Use Benchmark Comparison Environmental Impact Analysis
Energy End-Use
Base Case Energy Use
Proposed Energy Use
Savings (+) / Loss (-)
Savings (+) / Loss (-)
MBtu/yr MBtu/yr MBtu/yr %
Emissions Base Case Proposed % Savings (+) / Loss (-)
Space Heating - Gas 0.0
CO2 (lb/yr) 2,501,896 2,459,771 1.7%
3,483 3,422 1.8%Space Heating - Elec 93.7 140.5 -46.8 -49.9%
SO2 (lb/yr) 8,992 8,825 1.9%Lighting 1,835.9 1,711.0 125.0 6.8% NOX (lb/yr)
0.0 0.0 0.0%Space Cooling 2,380.3 2,354.1 26.2 1.1%
-16.7%
374 6 370 8 3 8 1 0%
1.7%Heat Rejection 0.0 0.0 0.0 0.0%Pumps 0.0 0.0 0.0
HVAC Fans
Individual Resource Calculations Install or Replace Immediately Existing Hotels Hot-Humid
2,501,896 2,459,771
1,500,000
2,000,000
2,500,000
3,000,000
lb/y
r
Annual CO2 Emissions
when unoccupied. 374.6 370.8 3.8 1.0%Receptacles - Elec 1,149.8 1,149.8 0.0 0.0%
Base Utilities - Gas 1,534.9 1,534.9 0.0 0.0%
- 5 sensors required per floor - therefore, 25 total per building- US$193 per sensor including electrician labour- Sensor lifetime – 10 years- Increase bulb lifetime by 40% (Savings includes this extended lifetime)- All 200 corridor light bulbs are assumed to already be CFLs
1.4%
Receptacles - Gas 425.8 425.8 0.0 0.0%
HVAC Fans
Financial Assumptions Total 7,795.0 7,686.9 108.1 1.4%
2,501,896 2,459,771
0
500,000
1,000,000
1,500,000
2,000,000
2,500,000
3,000,000
Base Case Proposed
lb/y
r
Annual CO2 Emissions
8,992
3,483
8,825
3,422
0
2,000
4,000
6,000
8,000
10,000
SO2 (lb/yr) NOX (lb/yr)
g/yr
Annual SO2 and NOX EmissionsBase Case
Proposed
7,795 7,687
01,0002,0003,0004,0005,0006,0007,0008,0009,000
Base Case Proposed
MBt
u/yr
Annual Total Energy Use
Issued February 1, 2011 36 Existing Hotels Energy Analysis - Green Engage/Solutions

Additional Capital CostHVAC Plant First Cost Reductions
Cooling Plant SavingsHeating Plant Savings
Energy E-10 Occupancy Sensors in Corridors for Decorative Features
Annual Resource Cost Summary Financial Table Financial Results Summary
ResourceAnnual Resource Savings
(+) / Loss (-) Unit CostAnnual Savings (+) /
Loss (-)Yr.
Costs (Marginal/Maint/
Replace)
Savings (+) / Loss (-)
Natural gas 0 therms $0.9000 $0Electricity 31,688 kWh $0.1028 $3,258
Cash FlowInitial Marginal Cost $4,825
$3,599Initial Annual Savings
($4,825) Simple PaybackWater & sewer 0 Gals $0.0037 $0 0 ($4,825) $0
($4,825) 3 $0 $3,742 $3,742Capital Costs Savings Summary 2 $0 $3,670 $3,670
1 $0 $3,599 $3,5991.4 yrs
4 $0 $3,816 $3,816 First Year Yield On Marginal Cost 74.6%
76.5%IRR
N/A tons $0 5 $0 $3,937 $3,937N/A MBh $0 6 $0 $4 061 $4 061
Individual Resource Calculations Install or Replace Immediately Existing Hotels Hot-Humid
Heating Plant SavingsAirside Distribution Savings
Total Additional Capital Cost:
Estimated Useful Life (yrs)Percent replacedReplacement Cost Premium (In 2010 Dollars)
Base YearValuation TypeProject Analysis PeriodInflation RateDiscount Rate for Defined ValuationEnergy Escalation Rate (Nominal)
9 $0
N/A cfm $0 7 $0 $4,190N/A MBh $0 6 $0 $4,061 $4,061
($4,825) 8 $0 $4,323 $4,323
$36,032NPV$4,190
$4,460 $4,460
14 $0 $5,236 $5,23613 $0 $5,070 $5,070
($6,350) $4,605 ($1,745)
2010 16 $0 $5,613 $5,613Financial Analysis 15 $0 $5,421 $5,421
20 18 $0 $6,017 $6,017Defined 17 $0 $5,811 $5,811
7.19% 20 $0 $6,462 $6,4622.79% 19 $0 $6,230 $6,230
(See Table in Assumptions)
($4,825)100% 12 $0 $4,910 $4,910
10 11 $0 $4,755 $4,755Replacement Life and Cost Summary 10
($10,000)$0
$10,000 $20,000 $30,000 $40,000 $50,000 $60,000 $70,000 $80,000 $90,000
0 5 10 15 20Net
Cas
h Fl
ow (E
nd o
f Yea
r)
Years
Simple Payback Graph
Issued February 1, 2011 37 Existing Hotels Energy Analysis - Green Engage/Solutions

Infiltration is reduced by a third, to 0.2 air changes per hour, in all perimeter spaces.
Proposed Modifications
Infiltration of 0.3 air changes per hour in all perimeter spaces.
Building Materials B-04 Weather Stripping
Energy End-Use Benchmark Comparison Environmental Impact Analysis
Energy End-Use
Base Case Energy Use
Proposed Energy Use
Savings (+) / Loss (-)
Savings (+) / Loss (-)
MBtu/yr MBtu/yr MBtu/yr %
Emissions Base Case Proposed % Savings (+) / Loss (-)
Base Case
Space Heating - Gas 0.0
CO2 (lb/yr) 2,501,896 2,487,023 0.6%
3,483 3,462 0.6%Space Heating - Elec 93.7 86.9 6.8 7.3%
SO2 (lb/yr) 8,992 8,933 0.7%Lighting 1,835.9 1,835.9 0.0 0.0% NOX (lb/yr)
0.0 0.0 0.0%Space Cooling 2,380.3 2,350.9 29.4 1.2%
0.0%
374 6 372 7 1 9 0 5%
0.6%Heat Rejection 0.0 0.0 0.0 0.0%Pumps 0.0 0.0 0.0
HVAC Fans
Individual Resource Calculations Install or Replace Immediately Existing Hotels Hot-Humid
2,501,896 2,487,023
1,500,000
2,000,000
2,500,000
3,000,000
lb/y
r
Annual CO2 Emissions
374.6 372.7 1.9 0.5%Receptacles - Elec 1,149.8 1,149.8 0.0 0.0%
Base Utilities - Gas 1,534.9 1,534.8 0.1 0.0%
- Material cost of weather stripping – US$0.88/ft- 5ft x 5ft window on 130 rooms requiring 1 hour of carpenter labor rate per window- 5ft x 10ft window on 20 corner rooms requiring 1.5 hour of carpenter labor per window- Average weatherstripping lifetime – 10 years 0.5%
Receptacles - Gas 425.8 425.8 0.0 0.0%
HVAC Fans
Financial Assumptions Total 7,795.0 7,756.8 38.2 0.5%
2,501,896 2,487,023
0
500,000
1,000,000
1,500,000
2,000,000
2,500,000
3,000,000
Base Case Proposed
lb/y
r
Annual CO2 Emissions
8,992
3,483
8,933
3,462
0
2,000
4,000
6,000
8,000
10,000
SO2 (lb/yr) NOX (lb/yr)
g/yr
Annual SO2 and NOX EmissionsBase Case
Proposed
7,795 7,757
01,0002,0003,0004,0005,0006,0007,0008,0009,000
Base Case Proposed
MBt
u/yr
Annual Total Energy Use
Issued February 1, 2011 38 Existing Hotels Energy Analysis - Green Engage/Solutions

Additional Capital CostHVAC Plant First Cost Reductions
Cooling Plant SavingsHeating Plant Savings
Building Materials B-04 Weather Stripping
Annual Resource Cost Summary Financial Table Financial Results Summary
ResourceAnnual Resource Savings
(+) / Loss (-) Unit CostAnnual Savings (+) /
Loss (-)Yr.
Costs (Marginal/Maint/
Replace)
Savings (+) / Loss (-) Cash Flow
Initial Marginal Cost $11,540
$1,172Natural gas 1 therms $0.9000 $1Electricity 11,179 kWh $0.1028 $1,149 Initial Annual Savings
Water & sewer 0 Gals $0.0037 $0 0 ($11,540) $0 ($11,540)1 $0 $1,172 $1,172
Simple Payback 9 yrs
($11,540) 3 $0 $1,217 $1,217Capital Costs Savings Summary 2 $0 $1,194 $1,194
4 $0 $1,240 $1,240 First Year Yield On Marginal Cost 10.2%
2.8%IRR
MBh $0 6 $0 $1 321
Individual Resource Calculations Install or Replace Immediately Existing Hotels Hot-Humid
N/A tons $0 5 $0 $1,280 $1,280N/A $1 321Heating Plant Savings
Airside Distribution SavingsTotal Additional Capital Cost:
Estimated Useful Life (yrs)Percent replacedReplacement Cost Premium (In 2010 Dollars)
Base YearValuation TypeProject Analysis PeriodInflation RateDiscount Rate for Defined ValuationEnergy Escalation Rate (Nominal)
cfm $0 7 $0 $1,363MBh $0 6 $0 $1,321 NPV
($11,540) 8 $0 $1,407 $1,407
-$4,165$1,363
10 11 $0 $1,549 $1,549Replacement Life and Cost Summary 10 ($15,188) $1,500 ($13,688)
14 $0 $1,708 $1,708($11,540) 13 $0 $1,653 $1,653
2010 16 $0 $1,833 $1,833Financial Analysis 15 $0 $1,769 $1,769
20 18 $0 $1,967 $1,967Defined 17 $0 $1,899 $1,899
7.19% 20 $0 $2,115 $2,1152.79% 19 $0 $2,038 $2,038
(See Table in Assumptions)
100% 12 $0 $1,600 $1,600
9 $0 $1,452 $1,452
N/AN/A $1,321
($16,000)($14,000)($12,000)($10,000)($8,000)($6,000)($4,000)($2,000)
$0 $2,000 $4,000 $6,000
0 5 10 15 20
Net
Cas
h Fl
ow (E
nd o
f Yea
r)
Years
Simple Payback Graph
Issued February 1, 2011 39 Existing Hotels Energy Analysis - Green Engage/Solutions

Mechanical M-09 100% of Guest Rooms have 4F Deadband Thermostats
Energy End-Use Benchmark Comparison Environmental Impact Analysis
Energy End-Use
Base Case Energy Use
Proposed Energy Use
Savings (+) / Loss (-)
Savings (+) / Loss (-)
MBtu/yr MBtu/yr MBtu/yr %
Emissions Base Case Proposed % Savings (+) / Loss (-)
Base CaseGuest room thermostat setpoints of 74°F (cooling) and
74°F (heating).
CO2 (lb/yr) 2,501,896 2,386,302 4.6%
3,483 3,315 4.8%Space Heating - Elec 93.7 40.8 52.9 56.5%
SO2 (lb/yr) 8,992 8,535 5.1%Lighting 1,835.9 1,835.9 0.0 0.0% NOX (lb/yr)
Space Heating - Gas 0.0 0.0 0.0 0.0%Space Cooling 2,380.3 2,127.2 253.1 10.6%Proposed ModificationsPumps 0.0 0.0 0.0 -16.7%
HVAC Fans 374 6 384 1 9 5 2 5%
Guest room thermostat setpoints of 76°F (cooling) and 72°F (heating). 4.6%
Heat Rejection 0.0 0.0 0.0 0.0%
Individual Resource Calculations Install or Replace Immediately Existing Hotels Hot-Humid
2,501,896 2,386,302
1,500,000
2,000,000
2,500,000
3,000,000
lb/y
r
Annual CO2 Emissions
297.0 3.8%Base Utilities - Gas 1,534.9 1,534.5 0.4 0.0%
HVAC Fans 374.6 384.1 -9.5 -2.5%Receptacles - Elec 1,149.8 1,149.8 0.0 0.0%Receptacles - Gas 425.8 425.8 0.0 0.0%
- US$217 per sensor including electrician labour- Average Lifetime – 15 years
3.8%
Financial Assumptions Total 7,795.0 7,498.0
2,501,896 2,386,302
0
500,000
1,000,000
1,500,000
2,000,000
2,500,000
3,000,000
Base Case Proposed
lb/y
r
Annual CO2 Emissions
8,992
3,483
8,535
3,315
0
2,000
4,000
6,000
8,000
10,000
SO2 (lb/yr) NOX (lb/yr)
g/yr
Annual SO2 and NOX EmissionsBase Case
Proposed
7,795 7,498
01,0002,0003,0004,0005,0006,0007,0008,0009,000
Base Case Proposed
MBt
u/yr
Annual Total Energy Use
Issued February 1, 2011 40 Existing Hotels Energy Analysis - Green Engage/Solutions

Additional Capital CostHVAC Plant First Cost Reductions
Cooling Plant SavingsHeating Plant Savings
Cash FlowInitial Marginal Cost $32,550
$9,109
Annual Resource Cost Summary Financial Table Financial Results Summary
ResourceAnnual Resource Savings
(+) / Loss (-) Unit CostAnnual Savings (+) /
Loss (-)Yr.
Costs (Marginal/Maint/
Replace)
Savings (+) / Loss (-)
Natural gas 4 therms $0.9000 $4Electricity 86,920 kWh $0.1028 $8,935 Initial Annual Savings
Water & sewer 0 Gals $0.0037 $0 0 ($32,550) $0 ($32,550)1 $0 $9,109 $9,109
Simple Payback 3.5 yrs
4 $0 $9,639 $9,639 First Year Yield On Marginal Cost 28.0%
29.4%IRR3 $0 $9,459 $9,4592 $0 $9,282
N/A MBh $0 6 $0 $10 265 $10 265N/A tons $0 5 $0 $9,947 $9,947
Individual Resource Calculations Install or Replace Immediately Existing Hotels Hot-Humid
($32,550)Capital Costs Savings Summary $9,282
Mechanical M-09 100% of Guest Rooms have 4F Deadband Thermostats
Heating Plant SavingsAirside Distribution Savings
Total Additional Capital Cost:
Estimated Useful Life (yrs)Percent replacedReplacement Cost Premium (In 2010 Dollars)
Base YearValuation TypeProject Analysis PeriodInflation RateDiscount Rate for Defined ValuationEnergy Escalation Rate (Nominal)
N/A MBh $0 6 $0 $10,265 $10,265 NPV
9 $0 $11,283 $11,283
$10,5948 $0 $10,933 $10,933
$63,5757 $0 $10,594
15 11 $0 $12,040 $12,040Replacement Life and Cost Summary 10 $0 $11,655 $11,655
14 $0 $13,271 $13,271($32,550) 13 $0 $12,847 $12,847
2010 16 $0 $14,244 $14,244Financial Analysis 15 ($49,147) $13,749 ($35,398)
20 18 $0 $15,288 $15,288Defined 17 $0 $14,757 $14,757
7.19% 20 $0 $16,441 $16,4412.79% 19 $0 $15,839 $15,839
(See Table in Assumptions)
100% 12 $0 $12,437 $12,437
($32,550)N/A cfm $0
($50,000)
$0
$50,000
$100,000
$150,000
$200,000
0 5 10 15 20
Net
Cas
h Fl
ow (E
nd o
f Yea
r)
Years
Simple Payback Graph
Issued February 1, 2011 41 Existing Hotels Energy Analysis - Green Engage/Solutions

Base CaseDomestic hot water load of 7.40 gallons/person/day.
Load calculated by assuming water fixtures exceeding IPC rates by 20%, and default usage by hotel guests.
Water W-03 Meet IPC 2006 Maximum Flow Rates
Energy End-Use Benchmark Comparison Environmental Impact Analysis
Energy End-Use
Base Case Energy Use
Proposed Energy Use
Savings (+) / Loss (-)
Savings (+) / Loss (-)
MBtu/yr MBtu/yr MBtu/yr %
Emissions Base Case Proposed % Savings (+) / Loss (-)
CO2 (lb/yr) 2,501,896 2,471,872 1.2%
3,483 3,461 0.6%Space Heating - Elec 93.7 93.7 0.0 0.0%
SO2 (lb/yr) 8,992 8,992 0.0%Lighting 1,835.9 1,835.9 0.0 0.0% NOX (lb/yr)
Space Heating - Gas 0.0 0.0 0.0 0.0%Space Cooling 2,380.3 2,380.3 0.0 0.0%Proposed ModificationsPumps 0.0 0.0 0.0 0.0%
HVAC Fans 374 6 374 6 0 0 0 0%
Water fixtures meet IPC rates, reducing the domestic hot water load reduced to 6.16 gallons/person/day. 1.2%
Heat Rejection 0.0 0.0 0.0 0.0%
Individual Resource Calculations Install or Replace Immediately Existing Hotels Hot-Humid
2,501,896 2,471,872
1,500,000
2,000,000
2,500,000
3,000,000
lb/y
r
Annual CO2 Emissions
257.2 3.3%Base Utilities - Gas 1,534.9 1,277.7 257.2 16.8%
HVAC Fans 374.6 374.6 0.0 0.0%Receptacles - Elec 1,149.8 1,149.8 0.0 0.0%Receptacles - Gas 425.8 425.8 0.0 0.0%
- Install aerator on all bathroom faucets and low-flow shower heads
- Cost of each aerator is US$22.85 including common building labour rates- Aerator lifetime – 15 years
- Cost of each low-flow shower head is US$77.50 including plumber labour rates- Shower head lifetime – 10 years
3.3%
Financial Assumptions Total 7,795.0 7,537.8
2,501,896 2,471,872
0
500,000
1,000,000
1,500,000
2,000,000
2,500,000
3,000,000
Base Case Proposed
lb/y
r
Annual CO2 Emissions
8,992
3,483
8,992
3,461
0
2,000
4,000
6,000
8,000
10,000
SO2 (lb/yr) NOX (lb/yr)
g/yr
Annual SO2 and NOX EmissionsBase Case
Proposed
7,795 7,538
01,0002,0003,0004,0005,0006,0007,0008,0009,000
Base Case Proposed
MBt
u/yr
Annual Total Energy Use
Issued February 1, 2011 42 Existing Hotels Energy Analysis - Green Engage/Solutions

Additional Capital CostHVAC Plant First Cost Reductions
Cooling Plant SavingsHeating Plant Savings
Cash FlowInitial Marginal Cost $15,053
$5,631
Annual Resource Cost Summary Financial Table Financial Results Summary
ResourceAnnual Resource Savings
(+) / Loss (-) Unit CostAnnual Savings (+) /
Loss (-)Yr.
Costs (Marginal/Maint/
Replace)
Savings (+) / Loss (-)
Natural gas 2,573 therms $0.9000 $2,315Electricity 0 kWh $0.1028 $0 Initial Annual Savings
Water & sewer 838,836 Gals $0.0037 $3,104 0 ($15,053) $0 ($15,053)1 $0 $5,631 $5,631
Simple Payback 2.6 yrs
4 $0 $6,322 $6,322 First Year Yield On Marginal Cost 37.4%
39.5%IRR3 $0 $6,081 $6,0812 $0 $5,851
N/A MBh $0 6 $0 $6 721 $6 721N/A tons $0 5 $0 $6,518 $6,518
Individual Resource Calculations Install or Replace Immediately Existing Hotels Hot-Humid
($15,053)Capital Costs Savings Summary $5,851
Water W-03 Meet IPC 2006 Maximum Flow Rates
Heating Plant SavingsAirside Distribution Savings
Total Additional Capital Cost:
Estimated Useful Life (yrs)Percent replacedReplacement Cost Premium (In 2010 Dollars)
Base YearValuation TypeProject Analysis PeriodInflation RateDiscount Rate for Defined ValuationEnergy Escalation Rate (Nominal)
100%15
($11,625)100%
10
N/A MBh $0 6 $0 $6,721 $6,721 NPV
9 $0 $7,368 $7,368
$6,9308 $0 $7,146 $7,146
$48,3847 $0 $6,930
11 $0 $7,834 $7,834Replacement Life and Cost Summary 10 ($15,300) $7,598 ($7,702)
14 $0 $8,590 $8,59013 $0 $8,330 $8,330
2010 16 $0 $9,235 $9,235Financial Analysis 15 ($5,175) $8,907 $3,731
20 18 $0 $9,933 $9,933Defined 17 $0 $9,577 $9,577
7.19% 20 $0 $10,651 $10,6512.79% 19 $0 $10,302 $10,302
(See Table in Assumptions)
12 $0 $8,078 $8,078($3,428)
($15,053)N/A cfm $0
($40,000)($20,000)
$0 $20,000 $40,000 $60,000 $80,000
$100,000 $120,000 $140,000
0 5 10 15 20
Net
Cas
h Fl
ow (E
nd o
f Yea
r)
Years
Simple Payback Graph
Issued February 1, 2011 43 Existing Hotels Energy Analysis - Green Engage/Solutions
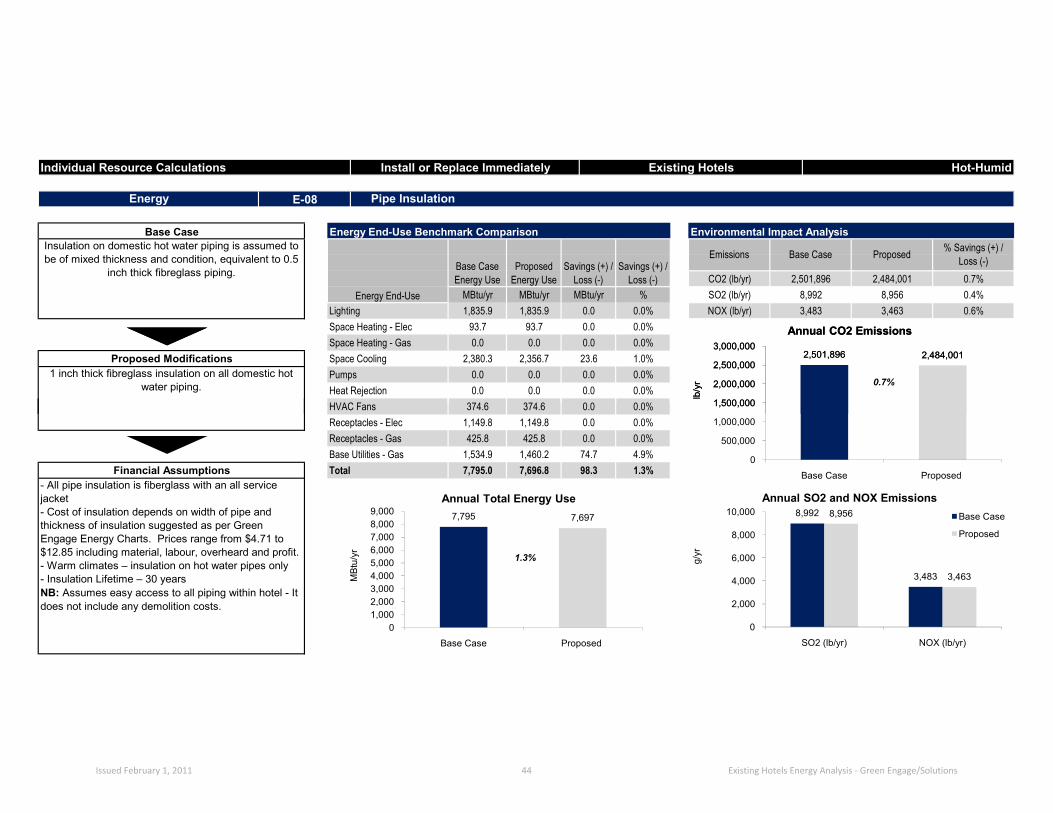
Energy E-08 Pipe Insulation
Energy End-Use Benchmark Comparison Environmental Impact Analysis
Energy End-Use
Base Case Energy Use
Proposed Energy Use
Savings (+) / Loss (-)
Savings (+) / Loss (-)
MBtu/yr MBtu/yr MBtu/yr %
Emissions Base Case Proposed % Savings (+) / Loss (-)
Base CaseInsulation on domestic hot water piping is assumed to be of mixed thickness and condition, equivalent to 0.5
inch thick fibreglass piping. CO2 (lb/yr) 2,501,896 2,484,001 0.7%
3,483 3,463 0.6%Space Heating - Elec 93.7 93.7 0.0 0.0%
SO2 (lb/yr) 8,992 8,956 0.4%Lighting 1,835.9 1,835.9 0.0 0.0% NOX (lb/yr)
Space Heating - Gas 0.0 0.0 0.0 0.0%Space Cooling 2,380.3 2,356.7 23.6 1.0%Proposed ModificationsPumps 0.0 0.0 0.0 0.0%
HVAC Fans 374 6 374 6 0 0 0 0%
1 inch thick fibreglass insulation on all domestic hot water piping. 0.7%
Heat Rejection 0.0 0.0 0.0 0.0%
Individual Resource Calculations Install or Replace Immediately Existing Hotels Hot-Humid
2,501,896 2,484,001
1,500,000
2,000,000
2,500,000
3,000,000
lb/y
r
Annual CO2 Emissions
98.3 1.3%Base Utilities - Gas 1,534.9 1,460.2 74.7 4.9%
HVAC Fans 374.6 374.6 0.0 0.0%Receptacles - Elec 1,149.8 1,149.8 0.0 0.0%Receptacles - Gas 425.8 425.8 0.0 0.0%
- All pipe insulation is fiberglass with an all service jacket- Cost of insulation depends on width of pipe and thickness of insulation suggested as per Green Engage Energy Charts. Prices range from $4.71 to $12.85 including material, labour, overheard and profit.- Warm climates – insulation on hot water pipes only- Insulation Lifetime – 30 yearsNB: Assumes easy access to all piping within hotel - It does not include any demolition costs.
1.3%
Financial Assumptions Total 7,795.0 7,696.8
2,501,896 2,484,001
0
500,000
1,000,000
1,500,000
2,000,000
2,500,000
3,000,000
Base Case Proposed
lb/y
r
Annual CO2 Emissions
8,992
3,483
8,956
3,463
0
2,000
4,000
6,000
8,000
10,000
SO2 (lb/yr) NOX (lb/yr)
g/yr
Annual SO2 and NOX EmissionsBase Case
Proposed
7,795 7,697
01,0002,0003,0004,0005,0006,0007,0008,0009,000
Base Case Proposed
MBt
u/yr
Annual Total Energy Use
Issued February 1, 2011 44 Existing Hotels Energy Analysis - Green Engage/Solutions

Additional Capital CostHVAC Plant First Cost Reductions
Cooling Plant SavingsHeating Plant Savings
Cash FlowInitial Marginal Cost $15,279
$1,432
Annual Resource Cost Summary Financial Table Financial Results Summary
ResourceAnnual Resource Savings
(+) / Loss (-) Unit CostAnnual Savings (+) /
Loss (-)Yr.
Costs (Marginal/Maint/
Replace)
Savings (+) / Loss (-)
Natural gas 747 therms $0.9000 $672Electricity 6,902 kWh $0.1028 $710 Initial Annual Savings
Water & sewer 0 Gals $0.0037 $0 0 ($15,279) $0 ($15,279)1 $0 $1,432 $1,432
Simple Payback 10 yrs
4 $0 $1,595 $1,595 First Year Yield On Marginal Cost 9.4%
10.2%IRR3 $0 $1,538 $1,5382 $0 $1,484
N/A MBh $0 6 $0 $1 704 $1 704N/A tons $0 5 $0 $1,648 $1,648
Individual Resource Calculations Install or Replace Immediately Existing Hotels Hot-Humid
($15,279)Capital Costs Savings Summary $1,484
Energy E-08 Pipe Insulation
Heating Plant SavingsAirside Distribution Savings
Total Additional Capital Cost:
Estimated Useful Life (yrs)Percent replacedReplacement Cost Premium (In 2010 Dollars)
Base YearValuation TypeProject Analysis PeriodInflation RateDiscount Rate for Defined ValuationEnergy Escalation Rate (Nominal)
N/A MBh $0 6 $0 $1,704 $1,704 NPV
9 $0 $1,881 $1,881
$1,7618 $0 $1,820 $1,820
$4,0377 $0 $1,761
30 11 $0 $2,011 $2,011Replacement Life and Cost Summary 10 $0 $1,945 $1,945
14 $0 $2,224 $2,224($15,279) 13 $0 $2,151 $2,151
2010 16 $0 $2,414 $2,414Financial Analysis 15 $0 $2,317 $2,317
20 18 $0 $2,620 $2,620Defined 17 $0 $2,515 $2,515
7.19% 20 $0 $2,837 $2,8372.79% 19 $0 $2,730 $2,730
(See Table in Assumptions)
100% 12 $0 $2,080 $2,080
($15,279)N/A cfm $0
($20,000)($15,000)($10,000)($5,000)
$0 $5,000
$10,000 $15,000 $20,000 $25,000 $30,000
0 5 10 15 20
Net
Cas
h Fl
ow (E
nd o
f Yea
r)
Years
Simple Payback Graph
Issued February 1, 2011 45 Existing Hotels Energy Analysis - Green Engage/Solutions

Corridor lighting load is reduced by 25% to 1.35 W/sf. The operating schedule remains unchanged. The reduction in load
is based on US EPA predictions, assuming the lighting turns ff h i d
Proposed Modifications
Base Case
Energy E-10 Occupancy Sensors in Offices
Energy End-Use Benchmark Comparison Environmental Impact Analysis
Energy End-Use
Base Case Energy Use
Proposed Energy Use
Savings (+) / Loss (-)
Savings (+) / Loss (-)
MBtu/yr MBtu/yr MBtu/yr %
Emissions Base Case Proposed % Savings (+) / Loss (-)
Offices have a lighting density of 1.8 W/sf. Lights operate for 8 hours a day.
Space Heating - Gas 0.0
CO2 (lb/yr) 2,501,896 2,501,001 0.0%
3,483 3,482 0.0%Space Heating - Elec 93.7 93.8 -0.1 -0.1%
SO2 (lb/yr) 8,992 8,989 0.0%Lighting 1,835.9 1,834.3 1.6 0.1% NOX (lb/yr)
0.0 0.0 0.0%Space Cooling 2,380.3 2,379.6 0.7 0.0%
0.0%
374 6 374 5 0 1 0 0%
0.0%Heat Rejection 0.0 0.0 0.0 0.0%Pumps 0.0 0.0 0.0
HVAC Fans
Individual Resource Calculations Install or Replace Immediately Existing Hotels Hot-Humid
2,501,896 2,501,001
1,500,000
2,000,000
2,500,000
3,000,000
lb/y
r
Annual CO2 Emissions
off when unoccupied. 374.6 374.5 0.1 0.0%Receptacles - Elec 1,149.8 1,149.8 0.0 0.0%
Base Utilities - Gas 1,534.9 1,534.9 0.0 0.0%
- US$193 per sensor including electrician labour- Four offices per hotel building - Sensor lifetime – 10 years- Increase office bulb lifetime by 25%- Increase office light bulb lifetime by 25%- All 16 office light bulbs are assumed to already be CFLs
0.0%
Receptacles - Gas 425.8 425.8 0.0 0.0%
HVAC Fans
Financial Assumptions Total 7,795.0 7,792.7 2.3 0.0%
2,501,896 2,501,001
0
500,000
1,000,000
1,500,000
2,000,000
2,500,000
3,000,000
Base Case Proposed
lb/y
r
Annual CO2 Emissions
8,992
3,483
8,989
3,482
0
2,000
4,000
6,000
8,000
10,000
SO2 (lb/yr) NOX (lb/yr)
g/yr
Annual SO2 and NOX EmissionsBase Case
Proposed
7,795 7,793
01,0002,0003,0004,0005,0006,0007,0008,0009,000
Base Case Proposed
MBt
u/yr
Annual Total Energy Use
Issued February 1, 2011 46 Existing Hotels Energy Analysis - Green Engage/Solutions

Additional Capital CostHVAC Plant First Cost Reductions
Cooling Plant SavingsHeating Plant Savings
Yr.Costs
(Marginal/Maint/Replace)
Savings (+) / Loss (-)
Energy E-10 Occupancy Sensors in Offices
Cash FlowInitial Marginal Cost $772
$70Natural gas 0 therms $0.9000 $0Electricity 673 kWh $0.1028 $69 Initial Annual Savings
Water & sewer 0 Gals $0.0037 $0 0 ($772) $0 ($772)1 $0 $70 $70
Simple Payback 19 yrs
4 $0 $75 $75 First Year Yield On Marginal Cost 9.1%
1.9%IRR3 $0 $88 $882 $0 $72
N/A MBh $0 6 $0 $95 $95N/A tons $0 5 $0 $77 $77
Individual Resource Calculations Install or Replace Immediately Existing Hotels Hot-Humid
($772)Capital Costs Savings Summary $72
Annual Resource Cost Summary Financial Table Financial Results Summary
ResourceAnnual Resource Savings
(+) / Loss (-) Unit CostAnnual Savings (+) /
Loss (-)
Heating Plant SavingsAirside Distribution Savings
Total Additional Capital Cost:
Estimated Useful Life (yrs)Percent replacedReplacement Cost Premium (In 2010 Dollars)
Base YearValuation TypeProject Analysis PeriodInflation RateDiscount Rate for Defined ValuationEnergy Escalation Rate (Nominal)
N/A MBh $0 6 $0 $95 $95 NPV
9 $0 $105 $105
$828 $0 $85 $85
-$2917 $0 $82
10 11 $0 $93 $93Replacement Life and Cost Summary 10 ($1,016) $90 ($926)
14 $0 $103 $103($772) 13 $0 $99 $99
2010 16 $0 $110 $110Financial Analysis 15 $0 $127 $127
20 18 $0 $141 $141Defined 17 $0 $114 $114
7.19% 20 $0 $127 $1272.79% 19 $0 $123 $123
(See Table in Assumptions)
100% 12 $0 $115 $115
($772)N/A cfm $0
($1,200)($1,000)
($800)($600)($400)($200)
$0 $200 $400
0 5 10 15 20
Net
Cas
h Fl
ow (E
nd o
f Yea
r)
Years
Simple Payback Graph
Issued February 1, 2011 47 Existing Hotels Energy Analysis - Green Engage/Solutions

One VFD (15 HP capacity) installed on VAV supply fan motor.
Constant speed, standard efficiency motor on supply fan for VAV system serving the first floor and corridor
spaces (15 HP capacity).
Proposed Modifications
Base Case
Mechanical M-11 Variable Frequency Drives
Energy End-Use Benchmark Comparison Environmental Impact Analysis
Energy End-Use
Base Case Energy Use
Proposed Energy Use
Savings (+) / Loss (-)
Savings (+) / Loss (-)
MBtu/yr MBtu/yr MBtu/yr %
Emissions Base Case Proposed % Savings (+) / Loss (-)
Space Heating - Gas 0.0
CO2 (lb/yr) 2,501,896 2,489,298 0.5%
3,483 3,465 0.5%Space Heating - Elec 93.7 95.0 -1.3 -1.4%
SO2 (lb/yr) 8,992 8,942 0.6%Lighting 1,835.9 1,835.9 0.0 0.0% NOX (lb/yr)
0.0 0.0 0.0%Space Cooling 2,380.3 2,369.7 10.6 0.4%
0.0%
374 6 351 6 23 0 6 1%
0.5%Heat Rejection 0.0 0.0 0.0 0.0%Pumps 0.0 0.0 0.0
HVAC Fans
Individual Resource Calculations Install or Replace Immediately Existing Hotels Hot-Humid
2,501,896 2,489,298
1,500,000
2,000,000
2,500,000
3,000,000
lb/y
r
Annual CO2 Emissions
374.6 351.6 23.0 6.1%Receptacles - Elec 1,149.8 1,149.8 0.0 0.0%
Base Utilities - Gas 1,534.9 1,534.9 0.0 0.0%
VFDs only recommended on motors greater than 5HP.
- All four climate zones can install one 15 HP capable VFD for the supply fan motor- Cost of VFD is $3,275 including electrician installation rate- VFD lifetime – 10 years
0.4%
Receptacles - Gas 425.8 425.8 0.0 0.0%
HVAC Fans
Financial Assumptions Total 7,795.0 7,762.7 32.3 0.4%
2,501,896 2,489,298
0
500,000
1,000,000
1,500,000
2,000,000
2,500,000
3,000,000
Base Case Proposed
lb/y
r
Annual CO2 Emissions
8,992
3,483
8,942
3,465
0
2,000
4,000
6,000
8,000
10,000
SO2 (lb/yr) NOX (lb/yr)
g/yr
Annual SO2 and NOX EmissionsBase Case
Proposed
7,795 7,763
01,0002,0003,0004,0005,0006,0007,0008,0009,000
Base Case Proposed
MBt
u/yr
Annual Total Energy Use
Issued February 1, 2011 48 Existing Hotels Energy Analysis - Green Engage/Solutions

Additional Capital CostHVAC Plant First Cost Reductions
Cooling Plant SavingsHeating Plant Savings
Mechanical M-11 Variable Frequency Drives
Annual Resource Cost Summary Financial Table Financial Results Summary
ResourceAnnual Resource Savings
(+) / Loss (-) Unit CostAnnual Savings (+) /
Loss (-)Yr.
Costs (Marginal/Maint/
Replace)
Savings (+) / Loss (-)
Natural gas 0 therms $0.9000 $0Electricity 9,477 kWh $0.1028 $974
Cash FlowInitial Marginal Cost $2,868
$993Initial Annual Savings
Water & sewer 0 Gals $0.0037 $0 0 ($2,868) $01 $0 $993 $993
($2,868) Simple Payback 2.9 yrs
($2,868) 3 $0 $1,031 $1,031Capital Costs Savings Summary 2 $0 $1,012 $1,012
4 $0 $1,050 $1,050 First Year Yield On Marginal Cost 34.6%
34.8%IRR
N/A tons $0 5 $0 $1,084 $1,084N/A MBh $0 6 $0 $1 119 $1 119
Individual Resource Calculations Install or Replace Immediately Existing Hotels Hot-Humid
Heating Plant SavingsAirside Distribution Savings
Total Additional Capital Cost:
Estimated Useful Life (yrs)Percent replacedReplacement Cost Premium (In 2010 Dollars)
Base YearValuation TypeProject Analysis PeriodInflation RateDiscount Rate for Defined ValuationEnergy Escalation Rate (Nominal)
9 $0
N/A cfm $0 7 $0 $1,155N/A MBh $0 6 $0 $1,119 $1,119
($2,868) 8 $0 $1,191 $1,191
$7,567NPV$1,155
$1,230 $1,230
14 $0 $1,446 $1,44613 $0 $1,400 $1,400
($3,775) $1,270 ($2,504)
2010 16 $0 $1,552 $1,552Financial Analysis 15 $0 $1,498 $1,498
20 18 $0 $1,666 $1,666Defined 17 $0 $1,608 $1,608
7.19% 20 $0 $1,792 $1,7922.79% 19 $0 $1,726 $1,726
(See Table in Assumptions)
($2,868)100% 12 $0 $1,355 $1,355
10 11 $0 $1,312 $1,312Replacement Life and Cost Summary 10
($5,000)
$0
$5,000
$10,000
$15,000
$20,000
$25,000
0 5 10 15 20
Net
Cas
h Fl
ow (E
nd o
f Yea
r)
Years
Simple Payback Graph
Issued February 1, 2011 49 Existing Hotels Energy Analysis - Green Engage/Solutions

VAV supply fan motor replaced with NEMA premium efficiency motor (15 HP capacity).
Constant speed, standard efficiency motor on supply fan for VAV system serving the first floor and corridor
spaces (15 HP capacity).
Proposed Modifications
Base Case
Mechanical M-11 NEMA Premium Efficiency Motors
Energy End-Use Benchmark Comparison Environmental Impact Analysis
Energy End-Use
Base Case Energy Use
Proposed Energy Use
Savings (+) / Loss (-)
Savings (+) / Loss (-)
MBtu/yr MBtu/yr MBtu/yr %
Emissions Base Case Proposed % Savings (+) / Loss (-)
Space Heating - Gas 0.0
CO2 (lb/yr) 2,501,896 2,500,116 0.1%
3,483 3,481 0.1%Space Heating - Elec 93.7 93.8 -0.1 -0.1%
SO2 (lb/yr) 8,992 8,985 0.1%Lighting 1,835.9 1,835.9 0.0 0.0% NOX (lb/yr)
0.0 0.0 0.0%Space Cooling 2,380.3 2,378.7 1.6 0.1%
0.0%
374 6 371 5 3 1 0 8%
0.1%Heat Rejection 0.0 0.0 0.0 0.0%Pumps 0.0 0.0 0.0
HVAC Fans
Individual Resource Calculations Install or Replace Immediately Existing Hotels Hot-Humid
2,501,896 2,500,116
1,500,000
2,000,000
2,500,000
3,000,000
lb/y
r
Annual CO2 Emissions
374.6 371.5 3.1 0.8%Receptacles - Elec 1,149.8 1,149.8 0.0 0.0%
Base Utilities - Gas 1,534.9 1,534.9 0.0 0.0%
NB: demolition costs are not includedAll four climates can install a 15 HP NEMA efficiency motor on the supply fan. - 15 HP NEMA efficiency motor is $1,482- 15 HP normal motor is $1,195- Cost Premium of $287 0.1%
Receptacles - Gas 425.8 425.8 0.0 0.0%
HVAC Fans
Financial Assumptions Total 7,795.0 7,790.5 4.6 0.1%
2,501,896 2,500,116
0
500,000
1,000,000
1,500,000
2,000,000
2,500,000
3,000,000
Base Case Proposed
lb/y
r
Annual CO2 Emissions
8,992
3,483
8,985
3,481
0
2,000
4,000
6,000
8,000
10,000
SO2 (lb/yr) NOX (lb/yr)
g/yr
Annual SO2 and NOX EmissionsBase Case
Proposed
7,795 7,790
01,0002,0003,0004,0005,0006,0007,0008,0009,000
Base Case Proposed
MBt
u/yr
Annual Total Energy Use
Issued February 1, 2011 50 Existing Hotels Energy Analysis - Green Engage/Solutions

Additional Capital CostHVAC Plant First Cost Reductions
Cooling Plant SavingsHeating Plant Savings
Mechanical M-11 NEMA Premium Efficiency Motors
Annual Resource Cost Summary Financial Table Financial Results Summary
ResourceAnnual Resource Savings
(+) / Loss (-) Unit CostAnnual Savings (+) /
Loss (-)Yr.
Costs (Marginal/Maint/
Replace)
Savings (+) / Loss (-)
Natural gas 0 therms $0.9000 $0Electricity 1,339 kWh $0.1028 $138
Cash FlowInitial Marginal Cost $885
$140Initial Annual Savings
Water & sewer 0 Gals $0.0037 $0 0 ($885) $01 $0 $140 $140
($885) Simple Payback 6 yrs
($885) 3 $0 $146 $146Capital Costs Savings Summary 2 $0 $143 $143
4 $0 $148 $148 First Year Yield On Marginal Cost 15.9%
16.7%IRR
N/A tons $0 5 $0 $153 $153N/A MBh $0 6 $0 $158 $158
Individual Resource Calculations Install or Replace Immediately Existing Hotels Hot-Humid
Heating Plant SavingsAirside Distribution Savings
Total Additional Capital Cost:
Estimated Useful Life (yrs)Percent replacedReplacement Cost Premium (In 2010 Dollars)
Base YearValuation TypeProject Analysis PeriodInflation RateDiscount Rate for Defined ValuationEnergy Escalation Rate (Nominal)
9 $0
N/A cfm $0 7 $0 $163N/A MBh $0 6 $0 $158 $158
($885) 8 $0 $168 $168
$728NPV$163
$174 $174
14 $0 $204 $20413 $0 $198 $198
$0 $179 $179
2010 16 $0 $219 $219Financial Analysis 15 ($433) $212 ($222)
20 18 $0 $235 $235Defined 17 $0 $227 $227
7.19% 20 $0 $253 $2532.79% 19 $0 $244 $244
(See Table in Assumptions)
($287)100% 12 $0 $192 $192
15 11 $0 $185 $185Replacement Life and Cost Summary 10
($1,500)($1,000)
($500)$0
$500 $1,000 $1,500 $2,000 $2,500 $3,000
0 5 10 15 20
Net
Cas
h Fl
ow (E
nd o
f Yea
r)
Years
Simple Payback Graph
Issued February 1, 2011 51 Existing Hotels Energy Analysis - Green Engage/Solutions

Individual Resource Calculations Install or Replace Immediately Existing Hotels Hot-Humid
Cumulative Scenario Green Engage Lvl 1: All Measures Installed or Replaced Now
Base Case Energy End-Use Benchmark Comparison Environmental Impact AnalysisAs detailed in individual measures
Energy End-Use
Base Case Energy Use
Proposed Energy Use
Savings (+) / Loss (-)
Savings (+) / Loss (-)
MBtu/yr MBtu/yr MBtu/yr %
Emissions Base Case Proposed % Savings (+) / Loss (-)
CO2 (lb/yr) 2,501,896 1,884,383 24.7%
3,483 2,617 24.9%Space Heating - Elec 93.7 126.4 -32.7 -34.9%
SO2 (lb/yr) 8,992 6,737 25.1%Lighting 1,835.9 1,098.9 737.1 40.1% NOX (lb/yr)
Space Heating - Gas 0.0 0.0 0.0 0.0%Proposed Modifications Space Cooling 2,380.3 1,809.6 570.7 24.0%
As detailed in individual measures Pumps 0.0 0.0 0.0 -16.7%
HVAC Fans 374 6 373 8 0 8 0 2%
24.7%Heat Rejection 0.0 0.0 0.0 0.0%
2,501,896
1,884,383
1,500,000
2,000,000
2,500,000
3,000,000
lb/y
r
Annual CO2 Emissions
HVAC Fans 374.6 373.8 0.8 0.2%Receptacles - Elec 1,149.8 962.3 187.5 16.3%Receptacles - Gas 425.8 277.1 148.7 34.9%Base Utilities - Gas 1,534.9 1,277.5 257.4 16.8%
All financial assumptions remain the same as in each individual measure.
24.0%
Financial Assumptions Total 7,795.0 5,925.6 1,869.4 24.0%
2,501,896
1,884,383
0
500,000
1,000,000
1,500,000
2,000,000
2,500,000
3,000,000
Base Case Proposed
lb/y
r
Annual CO2 Emissions
8,992
3,483
6,737
2,617
0
2,000
4,000
6,000
8,000
10,000
SO2 (lb/yr) NOX (lb/yr)
g/yr
Annual SO2 and NOX EmissionsBase Case
Proposed
7,795
5,926
01,0002,0003,0004,0005,0006,0007,0008,0009,000
Base Case Proposed
MBt
u/yr
Annual Total Energy Use
Issued February 1, 2011 52 Existing Hotels Energy Analysis - Green Engage/Solutions

Additional Capital CostHVAC Plant First Cost Reductions
Cooling Plant SavingsHeating Plant Savings
Individual Resource Calculations Install or Replace Immediately Existing Hotels Hot-Humid
Cumulative Scenario Green Engage Lvl 1: All Measures Installed or Replaced Now
Annual Resource Cost Summary Financial Table Financial Results Summary
ResourceAnnual Resource Savings
(+) / Loss (-) Unit CostAnnual Savings (+) /
Loss (-)Yr.
Costs (Marginal/Maint/
Replace)Electricity 428,862 kWh $0.1028 $44,087Savings (+) /
Loss (-) Cash FlowInitial Marginal Cost $149,066
Water & sewer 1,037,880 Gals $0.0037 $3,840 0Natural gas 4,062 therms $0.9000 $3,656
Initial Annual Savings $53,005
($149,066) $0 ($149,066) Simple Payback 2.7 yrs
Capital Costs Savings Summary 2 $1,572 $54,184 $55,756 IRR 39.0%($149,066) 3 $4,325 $55,409 $59,733
1 $1,245 $53,005 $54,249
N/A tons $0 5 $1,389 $58,443 $59,8324 $1,661 $56,636 $58,297 First Year Yield On Marginal Cost 35.6%
N/A MBh $0 6 $5 023 $60 323 $65 346Heating Plant SavingsAirside Distribution Savings
Total Additional Capital Cost:
Estimated Useful Life (yrs)Percent replacedReplacement Cost (In 2010 Dollars)
Base YearValuation TypeProject Analysis PeriodInflation RateDiscount Rate for Defined ValuationEnergy Escalation Rate (Nominal)
N/A cfm $0 7 $1,468N/A MBh $0 6 $5,023 $60,323 $65,346
$62,232 $63,699($149,066) 8 $1,854 $64,217 $66,071
NPV $495,357
9 $5,099 $66,284 $71,383
N/A 11 $1,638 $70,679 $72,317Replacement Life and Cost Summary 10 ($34,880) $68,437 $33,557
N/A 13 $1,731 $75,385 $77,116N/A 12 ($2,231) $73,013 $70,782
14 $2,186 $77,855 $80,041
2010 16 $2,310 $83,606 $85,915Financial Analysis 15 ($48,309) $80,699 $32,390
20 18 $6,984 $89,808 $96,792Defined 17 $1,932 $86,640 $88,572
7.19% 20 $2,578 $96,529 $99,1072.79% 19 $2,041 $93,047 $95,088
(See Table in Assumptions)
($400,000)($200,000)
$0 $200,000 $400,000 $600,000 $800,000
$1,000,000 $1,200,000 $1,400,000
0 5 10 15 20
Net
Cas
h Fl
ow (E
nd o
f Yea
r)
Years
Simple Payback Graph
Issued February 1, 2011 53 Existing Hotels Energy Analysis - Green Engage/Solutions

Base Case Energy End-Use Benchmark Comparison Environmental Impact AnalysisAs detailed in individual measures
Energy End-Use
Base Case Energy Use
Proposed Energy Use
Savings (+) / Loss (-)
Savings (+) / Loss (-)
MBtu/yr MBtu/yr MBtu/yr %
Emissions Base Case Proposed % Savings (+) / Loss (-)
CO2 (lb/yr) 2,501,896 1,856,030 25.8%
3,483 2,581 25.9%Space Heating - Elec 93.7 128.3 -34.6 -36.9%
SO2 (lb/yr) 8,992 6,652 26.0%Lighting 1,835.9 1,097.3 738.7 40.2% NOX (lb/yr)
Space Heating - Gas 0.0 0.0 0.0 0.0%Proposed Modifications Space Cooling 2,380.3 1,779.6 600.7 25.2%
As detailed in individual measures Pumps 0.0 0.0 0.0 -16.7%
HVAC Fans 374 6 348 7 25 9 6 9%
25.8%Heat Rejection 0.0 0.0 0.0 0.0%
Cumulative Scenario Green Engage Lvl 2: All Measures Installed or Replaced Now
Hot-HumidIndividual Resource Calculations Install or Replace Immediately Existing Hotels
2,501,896
1,856,030
1,500,000
2,000,000
2,500,000
3,000,000
lb/y
r
Annual CO2 Emissions
HVAC Fans 374.6 348.7 25.9 6.9%Receptacles - Elec 1,149.8 962.3 187.5 16.3%Receptacles - Gas 425.8 277.1 148.7 34.9%Base Utilities - Gas 1,534.9 1,217.4 317.5 20.7%
All financial assumptions remain the same as in each individual measure.
25.5%
Financial Assumptions Total 7,795.0 5,810.7 1,984.3 25.5%
2,501,896
1,856,030
0
500,000
1,000,000
1,500,000
2,000,000
2,500,000
3,000,000
Base Case Proposed
lb/y
r
Annual CO2 Emissions
8,992
3,483
6,652
2,581
0
2,000
4,000
6,000
8,000
10,000
SO2 (lb/yr) NOX (lb/yr)
g/yr
Annual SO2 and NOX EmissionsBase Case
Proposed
7,795
5,811
01,0002,0003,0004,0005,0006,0007,0008,0009,000
Base Case Proposed
MBt
u/yr
Annual Total Energy Use
Issued February 1, 2011 54 Existing Hotels Energy Analysis - Green Engage/Solutions

Additional Capital CostHVAC Plant First Cost Reductions
Cooling Plant SavingsHeating Plant Savings
Annual Resource Cost Summary Financial Table Financial Results Summary
ResourceAnnual Resource Savings
(+) / Loss (-) Unit CostAnnual Savings (+) /
Loss (-)Yr.
Costs (Marginal/Maint/
Replace)
Savings (+) / Loss (-)
Natural gas 4,663 therms $0.9000 $4,197Electricity 444,913 kWh $0.1028 $45,737
Cash FlowInitial Marginal Cost $168,869
$55,256Initial Annual Savings
($168,869) Simple Payback 2.9 yrsWater & sewer 1,037,880 Gals $0.0037 $3,840 0 ($168,869) $0
($168,869) 3 $4,325 $57,788 $62,113Capital Costs Savings Summary 2 $1,572 $56,498 $58,071
1 $1,245 $55,256 $56,501
4 $1,661 $59,083 $60,744 First Year Yield On Marginal Cost 32.7%
36.0%IRR
MBh $0 6 $5 023 $62 934
Cumulative Scenario Green Engage Lvl 2: All Measures Installed or Replaced Now
Individual Resource Calculations Install or Replace Immediately Existing Hotels Hot-Humid
N/A tons $0 5 $1,389 $60,970 $62,359N/A $67 956Heating Plant Savings
Airside Distribution SavingsTotal Additional Capital Cost:
Estimated Useful Life (yrs)Percent replacedReplacement Cost (In 2010 Dollars)
Base YearValuation TypeProject Analysis PeriodInflation RateDiscount Rate for Defined ValuationEnergy Escalation Rate (Nominal)
cfm $0 7 $1,468 $64,927MBh $0 6 $5,023 $62,934
($168,869) 8 $1,854 $67,002 $68,855
$502,518NPV$66,395
N/A 11 $1,638 $73,750 $75,389Replacement Life and Cost Summary 10 ($39,670) $71,409 $31,739
14 $2,186 $81,246 $83,432N/A 13 $1,731 $78,667 $80,397
2010 16 $2,310 $87,267 $89,577Financial Analysis 15 ($48,742) $84,223 $35,480
20 18 $6,984 $93,762 $100,746Defined 17 $1,932 $90,445 $92,377
7.19% 20 $2,578 $100,796 $103,3742.79% 19 $2,041 $97,156 $99,197
(See Table in Assumptions)
N/A 12 ($2,231) $76,188 $73,957
9 $5,099 $69,160 $74,259
N/AN/A $67,956
($400,000)($200,000)
$0 $200,000 $400,000 $600,000 $800,000
$1,000,000 $1,200,000 $1,400,000
0 5 10 15 20
Net
Cas
h Fl
ow (E
nd o
f Yea
r)
Years
Simple Payback Graph
Issued February 1, 2011 55 Existing Hotels Energy Analysis - Green Engage/Solutions

Hot-Humid: Replace at End of Lifetime
Issued February 1, 2011 56 Existing Hotels Energy Analysis - Green Engage/Solutions

InstallReplaceReplaceReplaceReplaceReplaceReplaceInstallInstallInstallInstall
Energy Modelling Results Summary Replace at End of Lifetime Existing Hotels Hot-Humid
0.9%Immediate
O-04
Use of Building Appropriate Materials
$20,624
The table below summarises the overall energy and financial performance for the modelled existing hotel in the hot-humid climate zone against the baseline building. Energy savings for a specific building may vary based on that building's parameters and financial results may also vary based on local costs and financing structures. For details regarding each measure refer to the individual calculation pages immediately following this page. For detailed assumptions relating to the energy model, utilities, emission factors, financial inputs, cost of capital, etc refer to the assumptions section of this book.Note: CO2 reduction percentages closely match both source energy reductions and annual energy saving cost reductions. Due to different modelling methodologies existing hotel and new hotel CO2 reduction percentages cannot be compared against each other. The stoplight colour legend contained below refers solely to simple payback periods.
NPV(Over 20 Years)Simple Payback IRR
% $
Energy Efficient TVs
Towel/Sheet ProgramEnergy Efficient Appliances
Zero Use of Incandescent Lamps in Guest Rooms
Install New or Replace
N/A
2.4%1.1 yrs
Relevant Action Group Measure
E-07E-07
N/A
Hot/HumidWest Palm Beach, FL
%
CO2 Reductions First Year Yield On Marginal Cost
%yrs
Green Engage Level 1 Certification
Occupancy Sensors in Corridors for Decorative FixturesE-10
100% of Guest Rooms have 4F Deadband Thermostats
E-09
N/A94.2%
E-07
E-09
Energy Efficient Guest Room Refrigerators
Zero Use of Incandescent Lamps in Back of House SpacesZero Use of Incandescent Lamps in Circulation Spaces
9.9% N/A
E-09
Meet IPC 2006 Maximum Flow Rates
B-04M-09W-03
N/A N/AN/A
N/A
$21,2340.9%
Immediate
N/A
2.0%0.8%
$57,807
N/A
Immediate $51,617
N/A$248,298
$20,740
Immediate
Immediate N/A91.3%
InstallInstallInstall
Replace
N/A
N/A
Legend (Criteria Based On Simple Payback Only):Very Short or Immediate Payback (0 - 3 years)Intermediate Payback (3 - 7 years)Long or No Payback (>7 years)
Variable Frequency DrivesM-11M-11 NEMA Premium Efficiency Motors
Install All New Measures Immediately &Replace Existing Measures At End of Lifetime
Green Engage Level 2 Certification Cumulative Savings Scenarios (Includes Green Engage Level 1)
$572,120Install All New Measures Immediately &Replace Existing Measures At End of Lifetime 1.3 yrs 24.7% 84.4% 79.4%
$1,28551.0%2.1 yrs 0.1% 48.9%
E-08 Pipe InsulationN/AE-10 Occupancy Sensors in Offices
Green Engage Level 2 Certification
1.6 yrs 25.8% 68.7% 64.3% $579,838
Green Engage Level 1 Certification Cumulative Savings Scenarios
Issued February 1, 2011 57 Existing Hotels Energy Analysis - Green Engage/Solutions
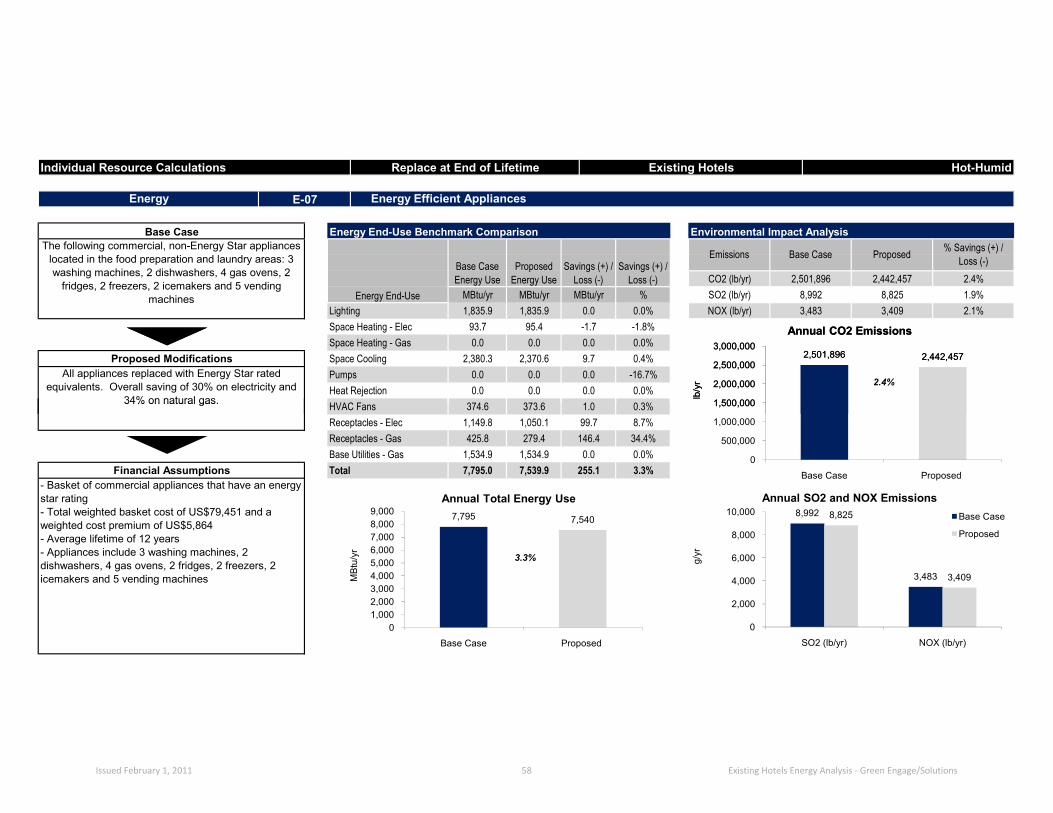
2.4%Heat Rejection 0.0 0.0 0.0 0.0%Pumps 0.0 0.0 0.0
Proposed Modifications-16.7%
HVAC Fans 374 6 373 6 1 0 0 3%
All appliances replaced with Energy Star rated equivalents. Overall saving of 30% on electricity and
34% on natural gas.
Space Heating - Gas 0.0 0.0 0.0 0.0%Space Cooling 2,380.3 2,370.6 9.7 0.4%
CO2 (lb/yr) 2,501,896 2,442,457 2.4%
3,483 3,409 2.1%Space Heating - Elec 93.7 95.4 -1.7 -1.8%
SO2 (lb/yr) 8,992 8,825 1.9%Lighting 1,835.9 1,835.9 0.0 0.0% NOX (lb/yr)
Energy End-Use
The following commercial, non-Energy Star appliances located in the food preparation and laundry areas: 3 washing machines, 2 dishwashers, 4 gas ovens, 2
fridges, 2 freezers, 2 icemakers and 5 vending machines
Emissions Base Case Proposed
Individual Resource Calculations Replace at End of Lifetime Existing Hotels
Energy E-07 Energy Efficient Appliances
Energy End-Use Benchmark Comparison Environmental Impact Analysis
Hot-Humid
Base Case% Savings (+) /
Loss (-)Base Case Energy Use
Proposed Energy Use
Savings (+) / Loss (-)
Savings (+) / Loss (-)
MBtu/yr MBtu/yr MBtu/yr %
2,501,896 2,442,457
1,500,000
2,000,000
2,500,000
3,000,000
lb/y
r
Annual CO2 Emissions
Financial Assumptions Total 7,795.0 7,539.9 255.1 3.3%Base Utilities - Gas 1,534.9 1,534.9 0.0 0.0%
- Basket of commercial appliances that have an energy star rating- Total weighted basket cost of US$79,451 and a weighted cost premium of US$5,864- Average lifetime of 12 years- Appliances include 3 washing machines, 2 dishwashers, 4 gas ovens, 2 fridges, 2 freezers, 2 icemakers and 5 vending machines
3.3%
Receptacles - Gas 425.8 279.4 146.4 34.4%
HVAC Fans 374.6 373.6 1.0 0.3%Receptacles - Elec 1,149.8 1,050.1 99.7 8.7%
34% on natural gas.
2,501,896 2,442,457
0
500,000
1,000,000
1,500,000
2,000,000
2,500,000
3,000,000
Base Case Proposed
lb/y
r
Annual CO2 Emissions
8,992
3,483
8,825
3,409
0
2,000
4,000
6,000
8,000
10,000
SO2 (lb/yr) NOX (lb/yr)
g/yr
Annual SO2 and NOX EmissionsBase Case
Proposed
7,795 7,540
01,0002,0003,0004,0005,0006,0007,0008,0009,000
Base Case Proposed
MBt
u/yr
Annual Total Energy Use
Issued February 1, 2011 58 Existing Hotels Energy Analysis - Green Engage/Solutions

Additional Capital CostHVAC Plant First Cost Reductions
Cooling Plant SavingsHeating Plant Savings N/A MBh $0 6 $0 $6 220 $6 220
N/A tons $0 5 $0 $6,025 $6,0254 $0 $5,837 $5,837 First Year Yield On Marginal Cost 91.3%
94.2%IRR($5,864) 3 $0 $5,669 $5,669
Capital Costs Savings Summary 2 $0 $5,507 $5,507
Water & sewer 164,438 Gals $0.0037 $608 0 ($5,864) $0 ($5,864)1 $0 $5,352 $5,352
Simple Payback 1.1 yrs
Natural gas 1,464 therms $0.9000 $1,318Electricity 31,857 kWh $0.1028 $3,275 Initial Annual Savings
Cash FlowInitial Marginal Cost $5,864
$5,352
Annual Resource Cost Summary Financial Table Financial Results Summary
ResourceAnnual Resource Savings
(+) / Loss (-) Unit CostAnnual Savings (+) /
Loss (-)Yr.
Costs (Marginal/Maint/
Replace)
Savings (+) / Loss (-)
Energy E-07 Energy Efficient Appliances
Individual Resource Calculations Replace at End of Lifetime Existing Hotels Hot-Humid
Heating Plant SavingsAirside Distribution Savings
Total Additional Capital Cost:
Estimated Useful Life (yrs)Percent replacedReplacement Cost Premium (In 2010 Dollars)
Base YearValuation TypeProject Analysis PeriodInflation RateDiscount Rate for Defined ValuationEnergy Escalation Rate (Nominal) (See Table in Assumptions)
100% 12 ($8,154) $7,544 ($610)
7.19% 20 $0 $10,079 $10,0792.79% 19 $0 $9,714 $9,714
20 18 $0 $9,355 $9,355Defined 17 $0 $9,010 $9,010
2010 16 $0 $8,678 $8,678Financial Analysis 15 $0 $8,358 $8,358
14 $0 $8,050 $8,050($5,864) 13 $0 $7,793 $7,793
12 11 $0 $7,303 $7,303Replacement Life and Cost Summary 10 $0 $7,070 $7,070
9 $0 $6,844 $6,844
$6,422($5,864) 8 $0 $6,630 $6,630
$57,807N/A cfm $0 7 $0 $6,422N/A MBh $0 6 $0 $6,220 $6,220 NPV
($20,000)$0
$20,000 $40,000 $60,000 $80,000
$100,000 $120,000 $140,000 $160,000
0 5 10 15 20Net
Cas
h Fl
ow (E
nd o
f Yea
r)
Years
Simple Payback Graph
Issued February 1, 2011 59 Existing Hotels Energy Analysis - Green Engage/Solutions

0.9%Heat Rejection 0.0 0.0 0.0 0.0%Pumps 0.0 0.0 0.0
Proposed Modifications0.0%
HVAC Fans 374 6 373 9 0 7 0 2%
Television is replaced with Energy Star rated equivalent. Overall saving of 40% on electricity.
Space Heating - Gas 0.0 0.0 0.0 0.0%Space Cooling 2,380.3 2,365.6 14.7 0.6%
CO2 (lb/yr) 2,501,896 2,480,246 0.9%
3,483 3,452 0.9%Space Heating - Elec 93.7 95.2 -1.4 -1.5%
SO2 (lb/yr) 8,992 8,906 1.0%Lighting 1,835.9 1,835.9 0.0 0.0% NOX (lb/yr)
Energy End-Use
One 32 inch non-Energy Star television per guest room. Emissions Base Case Proposed
Individual Resource Calculations Replace at End of Lifetime Existing Hotels
Energy E-07 Energy Efficient Televisions
Energy End-Use Benchmark Comparison Environmental Impact Analysis
Hot-Humid
Base Case% Savings (+) /
Loss (-)Base Case Energy Use
Proposed Energy Use
Savings (+) / Loss (-)
Savings (+) / Loss (-)
MBtu/yr MBtu/yr MBtu/yr %
2,501,896 2,480,246
1,500,000
2,000,000
2,500,000
3,000,000
lb/y
r
Annual CO2 Emissions
Financial Assumptions Total 7,795.0 7,739.5 55.6 0.7%Base Utilities - Gas 1,534.9 1,534.9 0.0 0.0%
- 150, 32 inch energy star televisions- US$400 average outright cost per unit (including bulk discount)- US$0 cost premium over non-energy star TVs- Average lifetime - 10 years
0.7%
Receptacles - Gas 425.8 425.8 0.0 0.0%
HVAC Fans 374.6 373.9 0.7 0.2%Receptacles - Elec 1,149.8 1,108.1 41.7 3.6%
2,501,896 2,480,246
0
500,000
1,000,000
1,500,000
2,000,000
2,500,000
3,000,000
Base Case Proposed
lb/y
r
Annual CO2 Emissions
8,992
3,483
8,906
3,452
0
2,000
4,000
6,000
8,000
10,000
SO2 (lb/yr) NOX (lb/yr)
g/yr
Annual SO2 and NOX EmissionsBase Case
Proposed
7,795 7,739
01,0002,0003,0004,0005,0006,0007,0008,0009,000
Base Case Proposed
MBt
u/yr
Annual Total Energy Use
Issued February 1, 2011 60 Existing Hotels Energy Analysis - Green Engage/Solutions

Additional Capital CostHVAC Plant First Cost Reductions
Cooling Plant SavingsHeating Plant Savings N/A MBh $0 6 $0 $1 922 $1 922
N/A tons $0 5 $0 $1,863 $1,8634 $0 $1,805 $1,805 First Year Yield On Marginal Cost N/A
N/AIRR$0 3 $0 $1,771 $1,771
Capital Costs Savings Summary 2 $0 $1,738 $1,738
Water & sewer 0 Gals $0.0037 $0 0 $0 $0 $01 $0 $1,706 $1,706
Simple Payback Immediate
Natural gas 0 therms $0.9000 $0Electricity 16,286 kWh $0.1028 $1,674 Initial Annual Savings
Cash FlowInitial Marginal Cost $0
$1,706
Annual Resource Cost Summary Financial Table Financial Results Summary
ResourceAnnual Resource Savings
(+) / Loss (-) Unit CostAnnual Savings (+) /
Loss (-)Yr.
Costs (Marginal/Maint/
Replace)
Savings (+) / Loss (-)
Energy E-07 Energy Efficient Televisions
Individual Resource Calculations Replace at End of Lifetime Existing Hotels Hot-Humid
Heating Plant SavingsAirside Distribution Savings
Total Additional Capital Cost:
Estimated Useful Life (yrs)Percent replacedReplacement Cost Premium (In 2010 Dollars)
Base YearValuation TypeProject Analysis PeriodInflation RateDiscount Rate for Defined ValuationEnergy Escalation Rate (Nominal) (See Table in Assumptions)
100% 12 $0 $2,329 $2,329
7.19% 20 $0 $3,079 $3,0792.79% 19 $0 $2,966 $2,966
20 18 $0 $2,863 $2,863Defined 17 $0 $2,764 $2,764
2010 16 $0 $2,668 $2,668Financial Analysis 15 $0 $2,575 $2,575
14 $0 $2,485 $2,485$0 13 $0 $2,406 $2,406
10 11 $0 $2,255 $2,255Replacement Life and Cost Summary 10 $0 $2,183 $2,183
9 $0 $2,113 $2,113
$1,984$0 8 $0 $2,047 $2,047
$20,624N/A cfm $0 7 $0 $1,984N/A MBh $0 6 $0 $1,922 $1,922 NPV
$0 $5,000
$10,000 $15,000 $20,000 $25,000 $30,000 $35,000 $40,000 $45,000 $50,000
0 5 10 15 20
Net
Cas
h Fl
ow (E
nd o
f Yea
r)
Years
Simple Payback Graph
Issued February 1, 2011 61 Existing Hotels Energy Analysis - Green Engage/Solutions

0.9%Heat Rejection 0.0 0.0 0.0 0.0%Pumps 0.0 0.0 0.0
Proposed Modifications0.0%
HVAC Fans 374 6 373 9 0 7 0 2%
Refrigerator is replaced with Energy Star rated equivalent. Overall saving of 24% on electricity.
Space Heating - Gas 0.0 0.0 0.0 0.0%Space Cooling 2,380.3 2,365.2 15.1 0.6%
CO2 (lb/yr) 2,501,896 2,479,605 0.9%
3,483 3,451 0.9%Space Heating - Elec 93.7 95.2 -1.5 -1.6%
SO2 (lb/yr) 8,992 8,904 1.0%Lighting 1,835.9 1,835.9 0.0 0.0% NOX (lb/yr)
Energy End-Use
One 3 cu. ft. non-Energy Star refrigerator per guest room. Emissions Base Case Proposed
Individual Resource Calculations Replace at End of Lifetime Existing Hotels
Energy E-07 Energy Efficient Guest Room Refrigerators
Energy End-Use Benchmark Comparison Environmental Impact Analysis
Hot-Humid
Base Case% Savings (+) /
Loss (-)Base Case Energy Use
Proposed Energy Use
Savings (+) / Loss (-)
Savings (+) / Loss (-)
MBtu/yr MBtu/yr MBtu/yr %
2,501,896 2,479,605
1,500,000
2,000,000
2,500,000
3,000,000
lb/y
r
Annual CO2 Emissions
Financial Assumptions Total 7,795.0 7,737.8 57.2 0.7%Base Utilities - Gas 1,534.9 1,534.9 0.0 0.0%
- Medium sized bar fridge at 3 cu. ft.- Average Energy Star cost per unit - US$120 (online average price minus 20% bulk discount)- Cost Premium - US$0- Average Lifetime – 12 years
0.7%
Receptacles - Gas 425.8 425.8 0.0 0.0%
HVAC Fans 374.6 373.9 0.7 0.2%Receptacles - Elec 1,149.8 1,106.9 42.9 3.7%
2,501,896 2,479,605
0
500,000
1,000,000
1,500,000
2,000,000
2,500,000
3,000,000
Base Case Proposed
lb/y
r
Annual CO2 Emissions
8,992
3,483
8,904
3,451
0
2,000
4,000
6,000
8,000
10,000
SO2 (lb/yr) NOX (lb/yr)
g/yr
Annual SO2 and NOX EmissionsBase Case
Proposed
7,795 7,738
01,0002,0003,0004,0005,0006,0007,0008,0009,000
Base Case Proposed
MBt
u/yr
Annual Total Energy Use
Issued February 1, 2011 62 Existing Hotels Energy Analysis - Green Engage/Solutions

Additional Capital CostHVAC Plant First Cost Reductions
Cooling Plant SavingsHeating Plant Savings
N/A tons $0 5 $0 $1,918 $1,918N/A MBh $0 6 $0 $1 979 $1 979
4 $0 $1,859 $1,859 First Year Yield On Marginal Cost N/A
N/AIRR$0 3 $0 $1,824 $1,824
Capital Costs Savings Summary 2 $0 $1,790 $1,7901 $0 $1,757 $1,757
$0 Simple Payback ImmediateWater & sewer 0 Gals $0.0037 $0 0 $0 $0
Cash FlowInitial Marginal Cost $0
$1,757Initial Annual Savings
Annual Resource Cost Summary Financial Table Financial Results Summary
ResourceAnnual Resource Savings
(+) / Loss (-) Unit CostAnnual Savings (+) /
Loss (-)Yr.
Costs (Marginal/Maint/
Replace)
Savings (+) / Loss (-)
Natural gas 0 therms $0.9000 $0Electricity 16,768 kWh $0.1028 $1,724
Energy E-07 Energy Efficient Guest Room Refrigerators
Individual Resource Calculations Replace at End of Lifetime Existing Hotels Hot-Humid
Heating Plant SavingsAirside Distribution Savings
Total Additional Capital Cost:
Estimated Useful Life (yrs)Percent replacedReplacement Cost Premium (In 2010 Dollars)
Base YearValuation TypeProject Analysis PeriodInflation RateDiscount Rate for Defined ValuationEnergy Escalation Rate (Nominal) (See Table in Assumptions)
7.19% 20 $0 $3,170 $3,1702.79% 19 $0 $3,054 $3,054
20 18 $0 $2,948 $2,948Defined 17 $0 $2,845 $2,845
2010 16 $0 $2,747 $2,747Financial Analysis 15 $0 $2,651 $2,651
14 $0 $2,559 $2,559$0 13 $0 $2,477 $2,477
$2,39812 11 $0 $2,322 $2,322
Replacement Life and Cost Summary 10 $0 $2,247 $2,247
100% 12 $0 $2,398
9 $0 $2,176 $2,176$0 8 $0 $2,108 $2,108
$21,234N/A cfm $0 7 $0 $2,043N/A MBh $0 6 $0 $1,979 $1,979 NPV
$2,043
$0 $5,000
$10,000 $15,000 $20,000 $25,000 $30,000 $35,000 $40,000 $45,000 $50,000
0 5 10 15 20
Net
Cas
h Fl
ow (E
nd o
f Yea
r)
Years
Simple Payback Graph
Issued February 1, 2011 63 Existing Hotels Energy Analysis - Green Engage/Solutions

9.9%Heat Rejection 0.0 0.0 0.0 0.0%Pumps 0.0 0.0 0.0 0.0%
HVAC Fans 374 6 370 2 4 4 1 2%
Space Heating - Gas 0.0 0.0 0.0 0.0%Space Cooling 2,380.3 2,207.9 172.4 7.2%
Space Heating - Elec 93.7 113.2 -19.5 -20.8%
SO2 (lb/yr) 8,992 8,009 10.9%Lighting 1,835.9 1,355.3 480.6 26.2% NOX (lb/yr)
Proposed % Savings (+) / Loss (-)
CO2 (lb/yr) 2,501,896 2,253,343 9.9%
3,483 3,121 10.4%
Base Case
All 75W incandescent bulbs are replaced with 25W CFLs (6 per room or 900 in total). The guest room
lighting density is reduced to 0.75 W/sf.
Each guest room contains a total of 12 light bulbs. There is a 50/50 split of 75W incandescent bulbs and
25W CFLs, giving a lighting density of 1.5 W/sf. Bulbs operate for 8 hours/day.
Proposed Modifications
Individual Resource Calculations Replace at End of Lifetime Existing Hotels
Energy E-09 Zero Use of Incandescent Lamps in Guest Rooms
Energy End-Use Benchmark Comparison Environmental Impact Analysis
Hot-Humid
Energy End-Use
Base Case Energy Use
Proposed Energy Use
Savings (+) / Loss (-)
Savings (+) / Loss (-)
MBtu/yr MBtu/yr MBtu/yr %
Emissions Base Case
2,501,8962,253,343
1,500,000
2,000,000
2,500,000
3,000,000
lb/y
r
Annual CO2 Emissions
Financial Assumptions Total 7,795.0 7,157.0 638.0 8.2%Base Utilities - Gas 1,534.9 1,534.9 0.0 0.0%
- Total of 12 bulbs per room with 50% designated for replacement- Average Energy Star cost per unit of US$3.40 with bulb life of 6,000 – 12,000 hours- Conventional cost per unit of US$0.60 with bulb life of 750 – 1,000 hours- Common building laborer staff rate- Replacement cost premium is a savings because light bulbs will last longer for the price paid
8.2%
Receptacles - Gas 425.8 425.8 0.0 0.0%
HVAC Fans 374.6 370.2 4.4 1.2%Receptacles - Elec 1,149.8 1,149.8 0.0 0.0%
lighting density is reduced to 0.75 W/sf.
2,501,8962,253,343
0
500,000
1,000,000
1,500,000
2,000,000
2,500,000
3,000,000
Base Case Proposed
lb/y
r
Annual CO2 Emissions
8,992
3,483
8,009
3,121
0
2,000
4,000
6,000
8,000
10,000
SO2 (lb/yr) NOX (lb/yr)
g/yr
Annual SO2 and NOX EmissionsBase Case
Proposed
7,7957,157
01,0002,0003,0004,0005,0006,0007,0008,0009,000
Base Case Proposed
MBt
u/yr
Annual Total Energy Use
Issued February 1, 2011 64 Existing Hotels Energy Analysis - Green Engage/Solutions

Additional Capital CostHVAC Plant First Cost Reductions
Cooling Plant SavingsHeating Plant Savings N/A MBh $0 6 $2 941 $22 071 $25 013
N/A tons $0 5 $0 $21,387 $21,3874 $0 $20,724 $20,724 First Year Yield On Marginal Cost N/A
N/AIRR$2,494 3 $2,709 $20,337 $23,046
Capital Costs Savings Summary 2 $0 $19,958 $19,958
Water & sewer 0 Gals $0.0037 $0 0 $2,494 $0 $2,4941 $0 $19,586 $19,586
Simple Payback Immediate
Natural gas 0 therms $0.9000 $0Electricity 186,973 kWh $0.1028 $19,221 Initial Annual Savings
Cash FlowInitial Marginal Cost ($2,494)
$19,586
Annual Resource Cost Summary Financial Table Financial Results Summary
ResourceAnnual Resource Savings
(+) / Loss (-) Unit CostAnnual Savings (+) /
Loss (-)Yr.
Costs (Marginal/Maint/
Replace)
Savings (+) / Loss (-)
Energy E-09 Zero Use of Incandescent Lamps in Guest Rooms
Individual Resource Calculations Replace at End of Lifetime Existing Hotels Hot-Humid
Heating Plant SavingsAirside Distribution Savings
Total Additional Capital Cost:
Estimated Useful Life (yrs)Percent replacedReplacement Cost Premium (In 2010 Dollars)
Base YearValuation TypeProject Analysis PeriodInflation RateDiscount Rate for Defined ValuationEnergy Escalation Rate (Nominal) (See Table in Assumptions)
100% 12 $3,468 $26,740 $30,209
7.19% 20 $0 $35,348 $35,3482.79% 19 $0 $34,054 $34,054
20 18 $4,090 $32,871 $36,960Defined 17 $0 $31,728 $31,728
2010 16 $0 $30,626 $30,626Financial Analysis 15 $3,766 $29,562 $33,328
14 $0 $28,534 $28,534$2,494 13 $0 $27,623 $27,623
3 11 $0 $25,886 $25,886Replacement Life and Cost Summary 10 $0 $25,059 $25,059
9 $3,194 $24,259 $27,453
$22,778$2,494 8 $0 $23,506 $23,506
$248,298N/A cfm $0 7 $0 $22,778N/A MBh $0 6 $2,941 $22,071 $25,013 NPV
$0
$100,000
$200,000
$300,000
$400,000
$500,000
$600,000
0 5 10 15 20
Net
Cas
h Fl
ow (E
nd o
f Yea
r)
Years
Simple Payback Graph
Issued February 1, 2011 65 Existing Hotels Energy Analysis - Green Engage/Solutions

2.0%Heat Rejection 0.0 0.0 0.0 0.0%Pumps 0.0 0.0 0.0 -16.7%
HVAC Fans 374 6 370 2 4 4 1 2%
Space Heating - Gas 0.0 0.0 0.0 0.0%Space Cooling 2,380.3 2,349.3 31.0 1.3%
Space Heating - Elec 93.7 157.0 -63.3 -67.5%
SO2 (lb/yr) 8,992 8,793 2.2%Lighting 1,835.9 1,678.9 157.0 8.6% NOX (lb/yr)
Proposed % Savings (+) / Loss (-)
CO2 (lb/yr) 2,501,896 2,451,580 2.0%
3,483 3,410 2.1%
Base Case
All 75W incandescent bulbs are replaced with 25W CFLs (20 per floor or 100 in total). The guest room
lighting density is reduced to 0.35 W/sf.
Corridors contain 40 light bulbs per floor. There is a 50/50 split of 75W incandescent bulbs and 25W CFLs, giving a lighting density of 0.7 W/sf. Bulbs operate for
24 hours/day.
Proposed Modifications
Individual Resource Calculations Replace at End of Lifetime Existing Hotels
Energy E-09 Zero Use of Incandescent Lamps in Circulation Spaces
Energy End-Use Benchmark Comparison Environmental Impact Analysis
Hot-Humid
Energy End-Use
Base Case Energy Use
Proposed Energy Use
Savings (+) / Loss (-)
Savings (+) / Loss (-)
MBtu/yr MBtu/yr MBtu/yr %
Emissions Base Case
2,501,896 2,451,580
1,500,000
2,000,000
2,500,000
3,000,000
lb/y
r
Annual CO2 Emissions
Financial Assumptions Total 7,795.0 7,665.9 129.1 1.7%Base Utilities - Gas 1,534.9 1,534.9 0.0 0.0%
- Total of 40 bulbs per corridor with 50% designated for replacement- This amounts to 100 bulbs to be replaced across the entire building- Average Energy Star cost per unit of US$3.40 with bulb life of 6,000 – 12,000 hours- Conventional cost per unit of US$0.60 with bulb life of 750 – 1,000 hours- Common building laborer staff rate- Replacement cost premium is a savings because light bulbs will last longer for the price paid
1.7%
Receptacles - Gas 425.8 425.8 0.0 0.0%
HVAC Fans 374.6 370.2 4.4 1.2%Receptacles - Elec 1,149.8 1,149.8 0.0 0.0%
lighting density is reduced to 0.35 W/sf.
2,501,896 2,451,580
0
500,000
1,000,000
1,500,000
2,000,000
2,500,000
3,000,000
Base Case Proposed
lb/y
r
Annual CO2 Emissions
8,992
3,483
8,793
3,410
0
2,000
4,000
6,000
8,000
10,000
SO2 (lb/yr) NOX (lb/yr)
g/yr
Annual SO2 and NOX EmissionsBase Case
Proposed
7,795 7,666
01,0002,0003,0004,0005,0006,0007,0008,0009,000
Base Case Proposed
MBt
u/yr
Annual Total Energy Use
Issued February 1, 2011 66 Existing Hotels Energy Analysis - Green Engage/Solutions

Additional Capital CostHVAC Plant First Cost Reductions
Cooling Plant SavingsHeating Plant Savings N/A MBh $0 6 $327 $4 468 $4 795
N/A tons $0 5 $318 $4,329 $4,6474 $309 $4,195 $4,505 First Year Yield On Marginal Cost N/A
N/AIRR$277 3 $301 $4,117 $4,418
Capital Costs Savings Summary 2 $293 $4,040 $4,333
Water & sewer 0 Gals $0.0037 $0 0 $277 $0 $2771 $285 $3,965 $4,250
Simple Payback Immediate
Natural gas 0 therms $0.9000 $0Electricity 37,850 kWh $0.1028 $3,891 Initial Annual Savings
Cash FlowInitial Marginal Cost ($277)
$3,965
Annual Resource Cost Summary Financial Table Financial Results Summary
ResourceAnnual Resource Savings
(+) / Loss (-) Unit CostAnnual Savings (+) /
Loss (-)Yr.
Costs (Marginal/Maint/
Replace)
Savings (+) / Loss (-)
Energy E-09 Zero Use of Incandescent Lamps in Circulation Spaces
Individual Resource Calculations Replace at End of Lifetime Existing Hotels Hot-Humid
Heating Plant SavingsAirside Distribution Savings
Total Additional Capital Cost:
Estimated Useful Life (yrs)Percent replacedReplacement Cost Premium (In 2010 Dollars)
Base YearValuation TypeProject Analysis PeriodInflation RateDiscount Rate for Defined ValuationEnergy Escalation Rate (Nominal) (See Table in Assumptions)
100% 12 $385 $5,413 $5,799
7.19% 20 $480 $7,156 $7,6362.79% 19 $467 $6,894 $7,361
20 18 $454 $6,654 $7,109Defined 17 $442 $6,423 $6,865
2010 16 $430 $6,200 $6,630Financial Analysis 15 $418 $5,984 $6,403
14 $407 $5,776 $6,183$277 13 $396 $5,592 $5,988
1 11 $375 $5,240 $5,615Replacement Life and Cost Summary 10 $365 $5,073 $5,438
9 $355 $4,911 $5,266
$4,947$277 8 $345 $4,759 $5,104
$51,617N/A cfm $0 7 $336 $4,611N/A MBh $0 6 $327 $4,468 $4,795 NPV
$0
$20,000
$40,000
$60,000
$80,000
$100,000
$120,000
0 5 10 15 20
Net
Cas
h Fl
ow (E
nd o
f Yea
r)
Years
Simple Payback Graph
Issued February 1, 2011 67 Existing Hotels Energy Analysis - Green Engage/Solutions

0.8%Heat Rejection 0.0 0.0 0.0 0.0%Pumps 0.0 0.0 0.0 -16.7%
HVAC Fans 374 6 372 8 1 8 0 5%
Space Heating - Gas 0.0 0.0 0.0 0.0%Space Cooling 2,380.3 2,363.6 16.7 0.7%
Space Heating - Elec 93.7 96.7 -3.0 -3.2%
SO2 (lb/yr) 8,992 8,911 0.9%Lighting 1,835.9 1,799.0 36.9 2.0% NOX (lb/yr)
Proposed % Savings (+) / Loss (-)
CO2 (lb/yr) 2,501,896 2,481,468 0.8%
3,483 3,454 0.9%
All 75W incandescent bulbs are replaced with 25W CFLs (100 in total). The average lighting density is reduced to
0.7 W/sf.
Offices, food preparation, lockers, laundry, mechanical and electrical spaces contain a total of 200 light bulbs. There is a 50/50 split of 75W incandescent bulbs and 25W CFLs, giving an average lighting density of 1.4 W/sf. Bulbs operate for 8
hours/day.
Proposed Modifications
Individual Resource Calculations Replace at End of Lifetime Existing Hotels
Energy E-09 Zero Use of Incandescent Lamps in Back of House
Energy End-Use Benchmark Comparison Environmental Impact Analysis
Hot-Humid
Base Case
Energy End-Use
Base Case Energy Use
Proposed Energy Use
Savings (+) / Loss (-)
Savings (+) / Loss (-)
MBtu/yr MBtu/yr MBtu/yr %
Emissions Base Case
2,501,896 2,481,468
1,500,000
2,000,000
2,500,000
3,000,000
lb/y
r
Annual CO2 Emissions
Financial Assumptions Total 7,795.0 7,742.6 52.4 0.7%Base Utilities - Gas 1,534.9 1,534.9 0.0 0.0%
- Total of 200 bulbs in back of house with 50% designated for replacement- Average Energy Star cost per unit of US$3.40 with bulb life of 6,000 – 12,000 hours- Conventional cost per unit of US$0.60 with bulb life of 750 – 1,000 hours- Common building laborer staff rate- Replacement cost premium is a savings because light bulbs will last longer for the price paid
0.7%
Receptacles - Gas 425.8 425.8 0.0 0.0%
HVAC Fans 374.6 372.8 1.8 0.5%Receptacles - Elec 1,149.8 1,149.8 0.0 0.0%
2,501,896 2,481,468
0
500,000
1,000,000
1,500,000
2,000,000
2,500,000
3,000,000
Base Case Proposed
lb/y
r
Annual CO2 Emissions
8,992
3,483
8,911
3,454
0
2,000
4,000
6,000
8,000
10,000
SO2 (lb/yr) NOX (lb/yr)
g/yr
Annual SO2 and NOX EmissionsBase Case
Proposed
7,795 7,743
01,0002,0003,0004,0005,0006,0007,0008,0009,000
Base Case Proposed
MBt
u/yr
Annual Total Energy Use
Issued February 1, 2011 68 Existing Hotels Energy Analysis - Green Engage/Solutions

Additional Capital CostHVAC Plant First Cost Reductions
Cooling Plant SavingsHeating Plant Savings N/A MBh $0 6 $327 $1 814 $2 141
N/A tons $0 5 $0 $1,758 $1,7584 $0 $1,703 $1,703 First Year Yield On Marginal Cost N/A
N/AIRR$277 3 $301 $1,671 $1,972
Capital Costs Savings Summary 2 $0 $1,640 $1,640
Water & sewer 0 Gals $0.0037 $0 0 $277 $0 $2771 $0 $1,610 $1,610
Simple Payback Immediate
Natural gas 0 therms $0.9000 $0Electricity 15,367 kWh $0.1028 $1,580 Initial Annual Savings
Cash FlowInitial Marginal Cost ($277)
$1,610
Annual Resource Cost Summary Financial Table Financial Results Summary
ResourceAnnual Resource Savings
(+) / Loss (-) Unit CostAnnual Savings (+) /
Loss (-)Yr.
Costs (Marginal/Maint/
Replace)
Savings (+) / Loss (-)
Energy E-09 Zero Use of Incandescent Lamps in Back of House
Individual Resource Calculations Replace at End of Lifetime Existing Hotels Hot-Humid
Heating Plant SavingsAirside Distribution Savings
Total Additional Capital Cost:
Estimated Useful Life (yrs)Percent replacedReplacement Cost Premium (In 2010 Dollars)
Base YearValuation TypeProject Analysis PeriodInflation RateDiscount Rate for Defined ValuationEnergy Escalation Rate (Nominal) (See Table in Assumptions)
100% 12 $385 $2,198 $2,583
7.19% 20 $0 $2,905 $2,9052.79% 19 $0 $2,799 $2,799
20 18 $454 $2,702 $3,156Defined 17 $0 $2,608 $2,608
2010 16 $0 $2,517 $2,517Financial Analysis 15 $418 $2,430 $2,848
14 $0 $2,345 $2,345$277 13 $0 $2,270 $2,270
3 11 $0 $2,128 $2,128Replacement Life and Cost Summary 10 $0 $2,060 $2,060
9 $355 $1,994 $2,349
$1,872$277 8 $0 $1,932 $1,932
$20,740N/A cfm $0 7 $0 $1,872N/A MBh $0 6 $327 $1,814 $2,141 NPV
$0 $5,000
$10,000 $15,000 $20,000 $25,000 $30,000 $35,000 $40,000 $45,000 $50,000
0 5 10 15 20
Net
Cas
h Fl
ow (E
nd o
f Yea
r)
Years
Simple Payback Graph
Issued February 1, 2011 69 Existing Hotels Energy Analysis - Green Engage/Solutions

0.1%Heat Rejection 0.0 0.0 0.0 0.0%Pumps 0.0 0.0 0.0 0.0%
HVAC Fans 374 6 371 5 3 1 0 8%
Space Heating - Gas 0.0 0.0 0.0 0.0%Space Cooling 2,380.3 2,378.7 1.6 0.1%
Space Heating - Elec 93.7 93.8 -0.1 -0.1%
SO2 (lb/yr) 8,992 8,985 0.1%Lighting 1,835.9 1,835.9 0.0 0.0% NOX (lb/yr)
Proposed % Savings (+) / Loss (-)
CO2 (lb/yr) 2,501,896 2,500,116 0.1%
3,483 3,481 0.1%
VAV supply fan motor replaced with NEMA premium efficiency motor (15 HP capacity).
Constant speed, standard efficiency motor on supply fan for VAV system serving the first floor and corridor
spaces (15 HP capacity).
Proposed Modifications
Base Case
Individual Resource Calculations Replace at End of Lifetime Existing Hotels
Mechanical M-11 NEMA Premium Efficiency Motors
Energy End-Use Benchmark Comparison Environmental Impact Analysis
Hot-Humid
Energy End-Use
Base Case Energy Use
Proposed Energy Use
Savings (+) / Loss (-)
Savings (+) / Loss (-)
MBtu/yr MBtu/yr MBtu/yr %
Emissions Base Case
2,501,896 2,500,116
1,500,000
2,000,000
2,500,000
3,000,000
lb/y
r
Annual CO2 Emissions
Financial Assumptions Total 7,795.0 7,790.5 4.6 0.1%Base Utilities - Gas 1,534.9 1,534.9 0.0 0.0%
NB: demolition costs are not includedAll four climates can install a 15 HP NEMA efficiency motor on the supply fan. - 15 HP NEMA efficiency motor is $1,482- 15 HP normal motor is $1,195- Cost Premium of $287 0.1%
Receptacles - Gas 425.8 425.8 0.0 0.0%
HVAC Fans 374.6 371.5 3.1 0.8%Receptacles - Elec 1,149.8 1,149.8 0.0 0.0%
2,501,896 2,500,116
0
500,000
1,000,000
1,500,000
2,000,000
2,500,000
3,000,000
Base Case Proposed
lb/y
r
Annual CO2 Emissions
8,992
3,483
8,985
3,481
0
2,000
4,000
6,000
8,000
10,000
SO2 (lb/yr) NOX (lb/yr)
g/yr
Annual SO2 and NOX EmissionsBase Case
Proposed
7,795 7,790
01,0002,0003,0004,0005,0006,0007,0008,0009,000
Base Case Proposed
MBt
u/yr
Annual Total Energy Use
Issued February 1, 2011 70 Existing Hotels Energy Analysis - Green Engage/Solutions

Additional Capital CostHVAC Plant First Cost Reductions
Cooling Plant SavingsHeating Plant Savings
N/A tons $0 5 $0 $153 $153N/A MBh $0 6 $0 $158 $158
4 $0 $148 $148 First Year Yield On Marginal Cost 48.9%
51.0%IRR($287) 3 $0 $146 $146
Capital Costs Savings Summary 2 $0 $143 $1431 $0 $140 $140
($287) Simple Payback 2.1 yrsWater & sewer 0 Gals $0.0037 $0 0 ($287) $0
Cash FlowInitial Marginal Cost $287
$140Initial Annual Savings
Annual Resource Cost Summary Financial Table Financial Results Summary
ResourceAnnual Resource Savings
(+) / Loss (-) Unit CostAnnual Savings (+) /
Loss (-)Yr.
Costs (Marginal/Maint/
Replace)
Savings (+) / Loss (-)
Natural gas 0 therms $0.9000 $0Electricity 1,339 kWh $0.1028 $138
Mechanical M-11 NEMA Premium Efficiency Motors
Individual Resource Calculations Replace at End of Lifetime Existing Hotels Hot-Humid
Heating Plant SavingsAirside Distribution Savings
Total Additional Capital Cost:
Estimated Useful Life (yrs)Percent replacedReplacement Cost Premium (In 2010 Dollars)
Base YearValuation TypeProject Analysis PeriodInflation RateDiscount Rate for Defined ValuationEnergy Escalation Rate (Nominal) (See Table in Assumptions)
7.19% 20 $0 $253 $2532.79% 19 $0 $244 $244
20 18 $0 $235 $235Defined 17 $0 $227 $227
2010 16 $0 $219 $219Financial Analysis 15 ($433) $212 ($222)
14 $0 $204 $204($287) 13 $0 $198 $198
$19215 11 $0 $185 $185
Replacement Life and Cost Summary 10 $0 $179 $179
100% 12 $0 $192
9 $0 $174 $174($287) 8 $0 $168 $168
$1,285N/A cfm $0 7 $0 $163N/A MBh $0 6 $0 $158 $158 NPV
$163
($500)$0
$500 $1,000 $1,500 $2,000 $2,500 $3,000 $3,500
0 5 10 15 20Net
Cas
h Fl
ow (E
nd o
f Yea
r)
Years
Simple Payback Graph
Issued February 1, 2011 71 Existing Hotels Energy Analysis - Green Engage/Solutions

Individual Resource Calculations Replace at End of Lifetime Existing Hotels Hot-Humid
Cumulative Scenario Green Engage Lvl 1: Install All New Measures Immediately & Replace Existing Measures when Lifetime is Finished
Base Case Energy End-Use Benchmark Comparison Environmental Impact AnalysisAs detailed in individual measures
Energy End-Use
Base Case Energy Use
Proposed Energy Use
Savings (+) / Loss (-)
Savings (+) / Loss (-)
MBtu/yr MBtu/yr MBtu/yr %
Emissions Base Case Proposed % Savings (+) / Loss (-)
CO2 (lb/yr) 2,501,896 1,884,383 24.7%
3,483 2,617 24.9%Space Heating - Elec 93.7 126.4 -32.7 -34.9%
SO2 (lb/yr) 8,992 6,737 25.1%Lighting 1,835.9 1,098.9 737.1 40.1% NOX (lb/yr)
Space Heating - Gas 0.0 0.0 0.0 0.0%Proposed Modifications Space Cooling 2,380.3 1,809.6 570.7 24.0%
As detailed in individual measures Pumps 0.0 0.0 0.0 -16.7%
HVAC Fans 374 6 373 8 0 8 0 2%
24.7%Heat Rejection 0.0 0.0 0.0 0.0%
2,501,896
1,884,383
1,500,000
2,000,000
2,500,000
3,000,000
lb/y
r
Annual CO2 Emissions
HVAC Fans 374.6 373.8 0.8 0.2%Receptacles - Elec 1,149.8 962.3 187.5 16.3%Receptacles - Gas 425.8 277.1 148.7 34.9%Base Utilities - Gas 1,534.9 1,277.5 257.4 16.8%
All financial assumptions remain the same as in each individual measure.
24.0%
Financial Assumptions Total 7,795.0 5,925.6 1,869.4 24.0%
2,501,896
1,884,383
0
500,000
1,000,000
1,500,000
2,000,000
2,500,000
3,000,000
Base Case Proposed
lb/y
r
Annual CO2 Emissions
8,992
3,483
6,737
2,617
0
2,000
4,000
6,000
8,000
10,000
SO2 (lb/yr) NOX (lb/yr)
g/yr
Annual SO2 and NOX EmissionsBase Case
Proposed
7,795
5,926
01,0002,0003,0004,0005,0006,0007,0008,0009,000
Base Case Proposed
MBt
u/yr
Annual Total Energy Use
Issued February 1, 2011 72 Existing Hotels Energy Analysis - Green Engage/Solutions

Additional Capital CostHVAC Plant First Cost Reductions
Cooling Plant SavingsHeating Plant Savings
Individual Resource Calculations Replace at End of Lifetime Existing Hotels Hot-Humid
Cumulative Scenario Green Engage Lvl 1: Install All New Measures Immediately & Replace Existing Measures when Lifetime is Finished
Annual Resource Cost Summary Financial Table Financial Results Summary
ResourceAnnual Resource Savings
(+) / Loss (-) Unit CostAnnual Savings (+) /
Loss (-)Yr.
Costs (Marginal/Maint/
Replace)Electricity 428,862 kWh $0.1028 $44,087Savings (+) /
Loss (-) Cash FlowInitial Marginal Cost $66,784
Water & sewer 1,037,880 Gals $0.0037 $3,840 0Natural gas 4,062 therms $0.9000 $3,656
Initial Annual Savings $53,005
($66,784) $0 ($66,784) Simple Payback 1.3 yrs
Capital Costs Savings Summary 2 $1,572 $54,184 $55,756 IRR 84.4%($66,784) 3 $4,325 $55,409 $59,733
1 $1,245 $53,005 $54,249
N/A tons $0 5 $1,389 $58,443 $59,8324 $1,661 $56,636 $58,297 First Year Yield On Marginal Cost 79.4%
N/A MBh $0 6 $5 023 $60 323 $65 346Heating Plant SavingsAirside Distribution Savings
Total Additional Capital Cost:
Estimated Useful Life (yrs)Percent replacedReplacement Cost (In 2010 Dollars)
Base YearValuation TypeProject Analysis PeriodInflation RateDiscount Rate for Defined ValuationEnergy Escalation Rate (Nominal)
N/A cfm $0 7 $1,468N/A MBh $0 6 $5,023 $60,323 $65,346
$62,232 $63,699($66,784) 8 $1,854 $64,217 $66,071
NPV $572,120
9 $5,099 $66,284 $71,383
N/A 11 $1,638 $70,679 $72,317Replacement Life and Cost Summary 10 ($34,880) $68,437 $33,557
N/A 13 $1,731 $75,385 $77,116N/A 12 ($2,231) $73,013 $70,782
14 $2,186 $77,855 $80,041
2010 16 $2,310 $83,606 $85,915Financial Analysis 15 ($48,309) $80,699 $32,390
20 18 $6,984 $89,808 $96,792Defined 17 $1,932 $86,640 $88,572
7.19% 20 $2,578 $96,529 $99,1072.79% 19 $2,041 $93,047 $95,088
(See Table in Assumptions)
($200,000)$0
$200,000 $400,000 $600,000 $800,000
$1,000,000 $1,200,000 $1,400,000
0 5 10 15 20Net
Cas
h Fl
ow (E
nd o
f Yea
r)
Years
Simple Payback Graph
Issued February 1, 2011 73 Existing Hotels Energy Analysis - Green Engage/Solutions

Proposed Modifications Space Cooling 2,380.3 1,779.6 600.7 25.2%
Individual Resource Calculations Replace at End of Lifetime Existing Hotels Hot-Humid
NOX (lb/yr) 3,483 2,581MBtu/yr MBtu/yr MBtu/yr
Cumulative Scenario Green Engage Lvl 2: Install All New Measures Immediately & Replace Existing Measures when Lifetime is Finished
Base Case Energy End-Use Benchmark Comparison Environmental Impact AnalysisAs detailed in individual measures
Energy End-Use
Base Case Energy Use
Proposed Energy Use
Savings (+) / Loss (-)
Savings (+) / Loss (-)
8,992CO2 (lb/yr) 2,501,896 1,856,030 25.8%
25.9%Space Heating - Elec 93.7 128.3 -34.6 -36.9%
6,652 26.0%Lighting 1,835.9 1,097.3 738.7 40.2%
Emissions Base Case Proposed % Savings (+) / Loss (-)
% SO2 (lb/yr)
Space Heating - Gas 0.0 0.0 0.0 0.0%
0.0 0.0 0.0 -16.7%
HVAC Fans 374 6 348 7 25 9 6 9%
25.8%Heat Rejection 0.0 0.0 0.0 0.0%
As detailed in individual measures Pumps
2,501,896
1,856,030
1,500,000
2,000,000
2,500,000
3,000,000
lb/y
r
Annual CO2 Emissions
Receptacles - Elec 1,149.8 962.3 187.5 16.3%HVAC Fans 374.6 348.7 25.9 6.9%
Financial Assumptions Total 7,795.0 5,810.7 1,984.3 25.5%
Receptacles - Gas 425.8 277.1 148.7 34.9%Base Utilities - Gas 1,534.9 1,217.4 317.5 20.7%
All financial assumptions remain the same as in each individual measure.
25.5%
2,501,896
1,856,030
0
500,000
1,000,000
1,500,000
2,000,000
2,500,000
3,000,000
Base Case Proposed
lb/y
r
Annual CO2 Emissions
8,992
3,483
6,652
2,581
0
2,000
4,000
6,000
8,000
10,000
SO2 (lb/yr) NOX (lb/yr)
g/yr
Annual SO2 and NOX EmissionsBase Case
Proposed
7,795
5,811
01,0002,0003,0004,0005,0006,0007,0008,0009,000
Base Case Proposed
MBt
u/yr
Annual Total Energy Use
Issued February 1, 2011 74 Existing Hotels Energy Analysis - Green Engage/Solutions

Additional Capital CostHVAC Plant First Cost Reductions
Cooling Plant SavingsHeating Plant Savings
Cumulative Scenario Green Engage Lvl 2: Install All New Measures Immediately & Replace Existing Measures when Lifetime is Finished
Annual Resource Cost Summary Financial Table Financial Results Summary
Individual Resource Calculations Replace at End of Lifetime Existing Hotels Hot-Humid
$85,990
Water & sewer 1,037,880 Gals $0.0037 $3,840 0
Costs (Marginal/Maint/
Replace)Electricity 444,913 kWh $0.1028 $45,737Natural gas 4,663 therms $0.9000 $4,197
Initial Annual Savings $55,256
ResourceAnnual Resource Savings
(+) / Loss (-) Unit CostAnnual Savings (+) /
Loss (-)Yr. Savings (+) /
Loss (-) Cash FlowInitial Marginal Cost
1 $1,245 $55,256 $56,501($85,990) $0 ($85,990) Simple Payback 1.6 yrs
($85,990) 3 $4,325 $57,788 $62,113Capital Costs Savings Summary 2 $1,572 $56,498 $58,071 IRR 68.7%
N/A tons $0 5 $1,389 $60,970 $62,3594 $1,661 $59,083 $60,744 First Year Yield On Marginal Cost 64.3%
N/A MBh $0 6 $5 023 $62 934 $67 956Heating Plant SavingsAirside Distribution Savings
Total Additional Capital Cost:
Estimated Useful Life (yrs)Percent replacedReplacement Cost (In 2010 Dollars)
Base YearValuation TypeProject Analysis PeriodInflation RateDiscount Rate for Defined ValuationEnergy Escalation Rate (Nominal)
N/A cfm $0 7 $1,468N/A MBh $0 6 $5,023 $62,934 $67,956
$64,927 $66,395($85,990) 8 $1,854 $67,002 $68,855
NPV $579,838
9 $5,099 $69,160 $74,259
N/A 11 $1,638 $73,750 $75,389Replacement Life and Cost Summary 10 ($39,670) $71,409 $31,739
N/A 13 $1,731 $78,667 $80,397N/A 12 ($2,231) $76,188 $73,957
14 $2,186 $81,246 $83,432
2010 16 $2,310 $87,267 $89,577Financial Analysis 15 ($48,742) $84,223 $35,480
20 18 $6,984 $93,762 $100,746Defined 17 $1,932 $90,445 $92,377
7.19% 20 $2,578 $100,796 $103,3742.79% 19 $2,041 $97,156 $99,197
(See Table in Assumptions)
($200,000)$0
$200,000 $400,000 $600,000 $800,000
$1,000,000 $1,200,000 $1,400,000 $1,600,000
0 5 10 15 20Net
Cas
h Fl
ow (E
nd o
f Yea
r)
Years
Simple Payback Graph
Issued February 1, 2011 75 Existing Hotels Energy Analysis - Green Engage/Solutions

Arid: Install or Replace Immediately
Issued February 1, 2011 76 Existing Hotels Energy Analysis - Green Engage/Solutions

InstallReplaceReplaceReplaceReplaceReplaceReplaceInstallInstallInstallInstall
Relevant Action Group Measure
Zero Use of Incandescent Lamps in Guest Rooms
Green Engage Level 1 Certification
E-09E-09E-09
Simple Payback IRR
1.8%
3.5%
6.2 yrs 0.9% 11.1%3.7 yrs 4.2% 27.7%
0.1%2.2%
16 yrs20.7%0.8%E-07
E-10 Occupancy Sensors in Corridors for Decorative Fixtures
5.2 yrs
1.3 yrs
Energy Efficient Guest Room Refrigerators
CO2 Reductions
Immediate
1.2%
0.3 yrs
7.4 yrs
2.6 yrs
B-04 Use of Building Appropriate Materials100% of Guest Rooms have 4F Deadband ThermostatsMeet IPC 2006 Maximum Flow Rates
O-04E-07E-07 Energy Efficient TVs
Towel/Sheet ProgramEnergy Efficient Appliances
Zero Use of Incandescent Lamps in Circulation Spaces
First Year Yield On Marginal Cost
The table below summarises the overall energy and financial performance for the modelled existing hotel in the arid climate zone against the baseline building. Energy savings for a specific building may vary based on that building's parameters and financial results may also vary based on local costs and financing structures. For details regarding each measure refer to the individual calculation pages immediately following this page. For detailed assumptions relating to the energy model, utilities, emission factors, financial inputs, cost of capital, etc refer to the assumptions section of this book.Note: CO2 reduction percentages closely match both source energy reductions and annual energy saving cost reductions. Due to different modelling methodologies existing hotel and new hotel CO2 reduction percentages cannot be compared against each other. The stoplight colour legend contained below refers solely to simple payback periods.
AridWest Palm Beach, FL
0.2 yrs 8.6% 635.8% 632.4% $219,8830.1 yrs $56,748
N/A12.3%
N/A13.0%
$
($8,154)
yrs
2.2%
NPV(Over 20 Years)Install New or
Replace %
18.7%
1524.4% 1430.5%
83.8%
M-09W-03
Zero Use of Incandescent Lamps in Back of House Spaces $17,409
37.9% $49,432
15.4% $3,61526.4% $57,438
445.0%81.9%
0.7% 449.5%
40.1%
Energy Modelling Results Summary Install or Replace Immediately Existing Hotels Arid
$11,990
$40,275
0.8% 5.5%
% %
$22,069$19,444
InstallInstallInstall
Replace
N/A
N/A
Legend (Criteria Based On Simple Payback Only):Very Short or Immediate Payback (0 - 3 years)Intermediate Payback (3 - 7 years)Long or No Payback (>7 years)
Green Engage Level 2 Certification
E-10Pipe Insulation 10 yrs
All Measures Installed or Replaced Immediately 2.8 yrs 22.8% 37.6% 34.2% $470,972
$73333.7%
16.7%6 yrsM-11M-11 NEMA Premium Efficiency Motors 0.1%
Variable Frequency Drives 3 yrs
0.7%E-08
Green Engage Level 2 Certification Cumulative Savings Scenarios (Includes Green Engage Level 1)
0.5% 33.8%Occupancy Sensors in Offices 20 yrs 0.0% 0.0% 8.2% ($382)
All Measures Installed or Replaced Immediately 3 yrs 23.8% 34.7% 31.5% $477,648
15.9%
9.0%
$7,264
9.7% $3,360
Green Engage Level 1 Certification Cumulative Savings Scenarios
Issued February 1, 2011 77 Existing Hotels Energy Analysis - Green Engage/Solutions

Individual Resource Calculations Install or Replace Immediately Existing Hotels Arid
O-04 Towel/Sheet Program
Energy End-Use Benchmark Comparison
Operations
MBtu/yr MBtu/yr
Savings (+) / Loss (-)
2,251.2 2.5 0.1%
0.0
0.0
2,253.7
Environmental Impact Analysis
0.1%SO2 (lb/yr)
0.0 0.0
3,618 0.1%%
0.0%MBtu/yr
0.0%
Savings (+) / Loss (-)
0.0 0.0 0.0%
% Savings (+) / Loss (-)ProposedBase CaseEmissions
0.1%
3,6220.1%
NOX (lb/yr)
CO2 (lb/yr) 2,599,589 2,596,627
494 6 0 3 0 1%
The energy consumption of washing machines and dryers is reduced by 17%, based on a study by the
American Hotel & Lodging Association.
-1.1 -0.3%
0.2 0.00.2
HVAC Fans
336.0
-2.3%Proposed Modifications
9,346
Base Case
Heat Rejection
1,835.9
Base Case Energy Use
Proposed Energy Use
LightingSpace Heating - Elec
9,356
3 commercial, non-Energy Star washing machines and dryers, operating for 8 hours per day.
PumpsSpace Cooling
495 0
Energy End-Use
0.0Space Heating - Gas337.1
1,835.9
2,599,589 2,596,627
1,500,000
2,000,000
2,500,000
3,000,000
lb/y
r
Annual CO2 Emissions
494.6 0.3 0.1%
0.0 0.0%8,080.0 8,069.6Total
American Hotel & Lodging Association.
0.1%1,583.7 1,583.7
HVAC Fans
- No additional costs
- Additional savings (apart from energy) from water and laundry detergent - Water savings of 34,606 gallons - Detergent savings of 173 gallons @ $7 per gallon (This is included under the Replacement Life and Cost Summary as a Savings)- Labour cost savings are not included
Base Utilities - Gas
Receptacles - Elec
0.1%
10.4
4.7 0.4%4.0 0.9%
Financial Assumptions
Receptacles - Gas 425.8 421.81,149.8 1,145.0495.0
2,599,589 2,596,627
0
500,000
1,000,000
1,500,000
2,000,000
2,500,000
3,000,000
Base Case Proposed
lb/y
r
Annual CO2 Emissions
9,356
3,622
9,346
3,618
0
2,000
4,000
6,000
8,000
10,000
SO2 (lb/yr) NOX (lb/yr)
g/yr
Annual SO2 and NOX EmissionsBase Case
Proposed
8,080 8,070
01,0002,0003,0004,0005,0006,0007,0008,0009,000
Base Case Proposed
MBt
u/yr
Annual Total Energy Use
Issued February 1, 2011 78 Existing Hotels Energy Analysis - Green Engage/Solutions

Additional Capital CostHVAC Plant First Cost Reductions
Cooling Plant SavingsHeating Plant Savings
Individual Resource Calculations Install or Replace Immediately Existing Hotels Arid
Initial Annual Savings
Initial Marginal Cost
Financial Results Summary
Towel/Sheet Program
0 $0$0
Costs (Marginal/Maint/
Replace)
O-04
$0
$366
$0 $408$395
543
$1,352
Immediate
N/A
N/A$385$376
$1,797$1,747
$128 Simple Payback
$0
First Year Yield On Marginal Cost
IRR
MBhtons
$1,700
$1,611$1,655
Cash FlowSavings (+) / Loss (-)
1
$1 428
therms$0.0037$0.9000$0.1028Unit Cost
Annual Savings (+) / Loss (-)
$0
Operations
Annual Resource Cost Summary
6
1,877
$1 848
Capital Costs Savings Summary$366
$420
$36
N/A
2
ResourceAnnual Resource Savings
(+) / Loss (-)Yr.
Financial Table
kWh $193
N/A
$0
$1,389
$1,315$1,279$1,245
Water & sewerNatural gasElectricity
34,60640
Gals
Heating Plant SavingsAirside Distribution Savings
Total Additional Capital Cost:
Estimated Useful Life (yrs)Percent replacedReplacement Cost (In 2010 Dollars)
Base YearValuation TypeProject Analysis PeriodInflation RateDiscount Rate for Defined ValuationEnergy Escalation Rate (Nominal)
NPVcfmMBh $19,444
$2,128$2,069$2,011$1,955
$2,189$2,252
$537 $2,316
$2,756$2,677
109
12
$1,551$475$460
$1,594
1615
$575
14
$1,879$1,932
$1,828
$2,098 $6592.79%
Financial Analysis
$1,684
$1,779$556
$2,601
7.19%
$521
$2,526$2,454
13$505
1 Replacement Life and Cost Summary
20191817Defined
20
2010
100%$1,211 $1,731
$1,638 $490
$2,384
$637$615$595
(See Table in Assumptions)
$1,986
11
$2,041
$446$1,509$1,468$1,428
$0
$0
876 $1,848$420N/A
N/A $0 $433 $1,901
$0 $5,000
$10,000 $15,000 $20,000 $25,000 $30,000 $35,000 $40,000 $45,000
0 5 10 15 20
Net
Cas
h Fl
ow (E
nd o
f Yea
r)
Years
Simple Payback Graph
Issued February 1, 2011 79 Existing Hotels Energy Analysis - Green Engage/Solutions

All appliances replaced with Energy Star rated equivalents. Overall saving of 30% on electricity and
34% on natural gas.
2.2%Heat Rejection 0.0 0.0 0.0 0.0%Pumps 0.2 0.2 0.0 -2.3%
HVAC Fans 495 0 494 0 1 0 0 2%
Proposed Modifications
3,622 3,549 2.0%Space Heating - Elec 336.0 340.1 -4.2 -1.2%
The following commercial, non-Energy Star appliances located in the food preparation and laundry areas: 3 washing machines, 2 dishwashers, 4 gas ovens, 2
fridges, 2 freezers, 2 icemakers and 5 vending machines
Space Heating - Gas 0.0 0.0 0.0 0.0%Space Cooling 2,253.7 2,245.3 8.4 0.4%
SO2 (lb/yr) 9,356 9,194 1.7%Lighting 1,835.9 1,835.9 0.0 0.0% NOX (lb/yr)
Energy End-Use
Base Case Energy Use
Proposed Energy Use
Savings (+) / Loss (-)
Savings (+) / Loss (-)
MBtu/yr MBtu/yr MBtu/yr %
Emissions Base Case Proposed % Savings (+) / Loss (-)
CO2 (lb/yr) 2,599,589 2,541,632 2.2%
Individual Resource Calculations Install or Replace Immediately Existing Hotels
Energy E-07 Energy Efficient Appliances
Energy End-Use Benchmark Comparison Environmental Impact Analysis
Arid
Base Case
2,599,589 2,541,632
1,500,000
2,000,000
2,500,000
3,000,000
lb/y
r
Annual CO2 Emissions
34% on natural gas.
Financial Assumptions Total 8,080.0 7,828.7 251.3 3.1%Base Utilities - Gas 1,583.7 1,583.7 0.0 0.0%
- Basket of commercial appliances that have an energy star rating- Total weighted basket cost of US$79,451 and a weighted cost premium of US$5,864- Average lifetime of 12 years- Appliances include 3 washing machines, 2 dishwashers, 4 gas ovens, 2 fridges, 2 freezers, 2 icemakers and 5 vending machines
3.1%
Receptacles - Gas 425.8 279.4 146.4 34.4%
HVAC Fans 495.0 494.0 1.0 0.2%Receptacles - Elec 1,149.8 1,050.1 99.7 8.7%
2,599,589 2,541,632
0
500,000
1,000,000
1,500,000
2,000,000
2,500,000
3,000,000
Base Case Proposed
lb/y
r
Annual CO2 Emissions
9,356
3,622
9,194
3,549
0
2,000
4,000
6,000
8,000
10,000
SO2 (lb/yr) NOX (lb/yr)
g/yr
Annual SO2 and NOX EmissionsBase Case
Proposed
8,080 7,829
01,0002,0003,0004,0005,0006,0007,0008,0009,000
Base Case Proposed
MBt
u/yr
Annual Total Energy Use
Issued February 1, 2011 80 Existing Hotels Energy Analysis - Green Engage/Solutions

Additional Capital CostHVAC Plant First Cost Reductions
Cooling Plant SavingsHeating Plant Savings N/A MBh $0 6 $0 $6 089 $6 089
N/A tons $0 5 $0 $5,898 $5,8984 $0 $5,713 $5,713 First Year Yield On Marginal Cost 12.3%
13.0%IRR($42,658) 3 $0 $5,548 $5,548
Capital Costs Savings Summary 2 $0 $5,388 $5,388
Water & sewer 164,438 Gals $0.0037 $608 0 ($42,658) $0 ($42,658)1 $0 $5,235 $5,235
Simple Payback 7.4 yrs
Natural gas 1,464 therms $0.9000 $1,318Electricity 30,742 kWh $0.1028 $3,160 Initial Annual Savings
Cash FlowInitial Marginal Cost $42,658
$5,235
Annual Resource Cost Summary Financial Table Financial Results Summary
ResourceAnnual Resource Savings
(+) / Loss (-) Unit CostAnnual Savings (+) /
Loss (-)Yr.
Costs (Marginal/Maint/
Replace)
Savings (+) / Loss (-)
Energy E-07 Energy Efficient Appliances
Individual Resource Calculations Install or Replace Immediately Existing Hotels Arid
Heating Plant SavingsAirside Distribution Savings
Total Additional Capital Cost:
Estimated Useful Life (yrs)Percent replacedReplacement Cost Premium (In 2010 Dollars)
Base YearValuation TypeProject Analysis PeriodInflation RateDiscount Rate for Defined ValuationEnergy Escalation Rate (Nominal)
$9,15917
(See Table in Assumptions)
100% 12 ($8,154) $7,384 ($769)
18 $0 $9,159
7.19% 20 $0 $9,868 $9,8682.79% 19 $0 $9,511 $9,511
Defined$8,495
Financial Analysis 15 $0 $8,181 $8,181
20
14 $0 $7,880 $7,880($5,864) 13 $0 $7,628 $7,628
$0 $8,821 $8,8212010 16 $0 $8,495
12 11 $0 $7,149 $7,149Replacement Life and Cost Summary 10 $0 $6,920 $6,920
9 $0 $6,700 $6,700
$6,286($42,658) 8 $0 $6,489 $6,489
$22,069N/A cfm $0 7 $0 $6,286N/A MBh $0 6 $0 $6,089 $6,089 NPV
($60,000)($40,000)($20,000)
$0 $20,000 $40,000 $60,000 $80,000
$100,000 $120,000
0 5 10 15 20
Net
Cas
h Fl
ow (E
nd o
f Yea
r)
Years
Simple Payback Graph
Issued February 1, 2011 81 Existing Hotels Energy Analysis - Green Engage/Solutions

Television is replaced with Energy Star rated equivalent. Overall saving of 40% on electricity. 0.8%
Heat Rejection 0.0 0.0 0.0 0.0%Pumps 0.2 0.2 0.0 0.0%
HVAC Fans 495 0 492 5 2 4 0 5%
Proposed Modifications
3,622 3,591 0.8%Space Heating - Elec 336.0 342.8 -6.9 -2.0%
One 32 inch non-Energy Star television per guest room.
Space Heating - Gas 0.0 0.0 0.0 0.0%Space Cooling 2,253.7 2,237.5 16.2 0.7%
SO2 (lb/yr) 9,356 9,274 0.9%Lighting 1,835.9 1,835.9 0.0 0.0% NOX (lb/yr)
Energy End-Use
Base Case Energy Use
Proposed Energy Use
Savings (+) / Loss (-)
Savings (+) / Loss (-)
MBtu/yr MBtu/yr MBtu/yr %
Emissions Base Case Proposed % Savings (+) / Loss (-)
CO2 (lb/yr) 2,599,589 2,578,769 0.8%
Individual Resource Calculations Install or Replace Immediately Existing Hotels
Energy E-07 Energy Efficient Televisions
Energy End-Use Benchmark Comparison Environmental Impact Analysis
Arid
Base Case
2,599,589 2,578,769
1,500,000
2,000,000
2,500,000
3,000,000
lb/y
r
Annual CO2 Emissions
Financial Assumptions Total 8,080.0 8,026.5 53.4 0.7%Base Utilities - Gas 1,583.7 1,583.7 0.0 0.0%
- 150, 32 inch energy star televisions- US$400 average outright cost per unit (including bulk discount)- US$0 cost premium over non-energy star TVs- Average lifetime - 10 years
0.7%
Receptacles - Gas 425.8 425.8 0.0 0.0%
HVAC Fans 495.0 492.5 2.4 0.5%Receptacles - Elec 1,149.8 1,108.1 41.7 3.6%
2,599,589 2,578,769
0
500,000
1,000,000
1,500,000
2,000,000
2,500,000
3,000,000
Base Case Proposed
lb/y
r
Annual CO2 Emissions
9,356
3,622
9,274
3,591
0
2,000
4,000
6,000
8,000
10,000
SO2 (lb/yr) NOX (lb/yr)
g/yr
Annual SO2 and NOX EmissionsBase Case
Proposed
8,080 8,027
01,0002,0003,0004,0005,0006,0007,0008,0009,000
Base Case Proposed
MBt
u/yr
Annual Total Energy Use
Issued February 1, 2011 82 Existing Hotels Energy Analysis - Green Engage/Solutions

Additional Capital CostHVAC Plant First Cost Reductions
Cooling Plant SavingsHeating Plant Savings N/A MBh $0 6 $0 $1 849 $1 849
N/A tons $0 5 $0 $1,791 $1,7914 $0 $1,736 $1,736 First Year Yield On Marginal Cost 5.5%
3.5%IRR($30,000) 3 $0 $1,704 $1,704
Capital Costs Savings Summary 2 $0 $1,672 $1,672
Water & sewer 0 Gals $0.0037 $0 0 ($30,000) $0 ($30,000)1 $0 $1,641 $1,641
Simple Payback 16 yrs
Natural gas 0 therms $0.9000 $0Electricity 15,662 kWh $0.1028 $1,610 Initial Annual Savings
Cash FlowInitial Marginal Cost $30,000
$1,641
Annual Resource Cost Summary Financial Table Financial Results Summary
ResourceAnnual Resource Savings
(+) / Loss (-) Unit CostAnnual Savings (+) /
Loss (-)Yr.
Costs (Marginal/Maint/
Replace)
Savings (+) / Loss (-)
Energy E-07 Energy Efficient Televisions
Individual Resource Calculations Install or Replace Immediately Existing Hotels Arid
Heating Plant SavingsAirside Distribution Savings
Total Additional Capital Cost:
Estimated Useful Life (yrs)Percent replacedReplacement Cost Premium (In 2010 Dollars)
Base YearValuation TypeProject Analysis PeriodInflation RateDiscount Rate for Defined ValuationEnergy Escalation Rate (Nominal)
$2,75317
(See Table in Assumptions)
100% 12 $0 $2,240 $2,240
18 $0 $2,753
7.19% 20 $0 $2,961 $2,9612.79% 19 $0 $2,853 $2,853
Defined$2,565
Financial Analysis 15 $0 $2,476 $2,476
20
14 $0 $2,390 $2,390$0 13 $0 $2,314 $2,314
$0 $2,658 $2,6582010 16 $0 $2,565
10 11 $0 $2,168 $2,168Replacement Life and Cost Summary 10 $0 $2,099 $2,099
9 $0 $2,032 $2,032
$1,908($30,000) 8 $0 $1,969 $1,969
-$8,154N/A cfm $0 7 $0 $1,908N/A MBh $0 6 $0 $1,849 $1,849 NPV
($35,000)($30,000)($25,000)($20,000)($15,000)($10,000)($5,000)
$0 $5,000
$10,000 $15,000 $20,000
0 5 10 15 20
Net
Cas
h Fl
ow (E
nd o
f Yea
r)
Years
Simple Payback Graph
Issued February 1, 2011 83 Existing Hotels Energy Analysis - Green Engage/Solutions
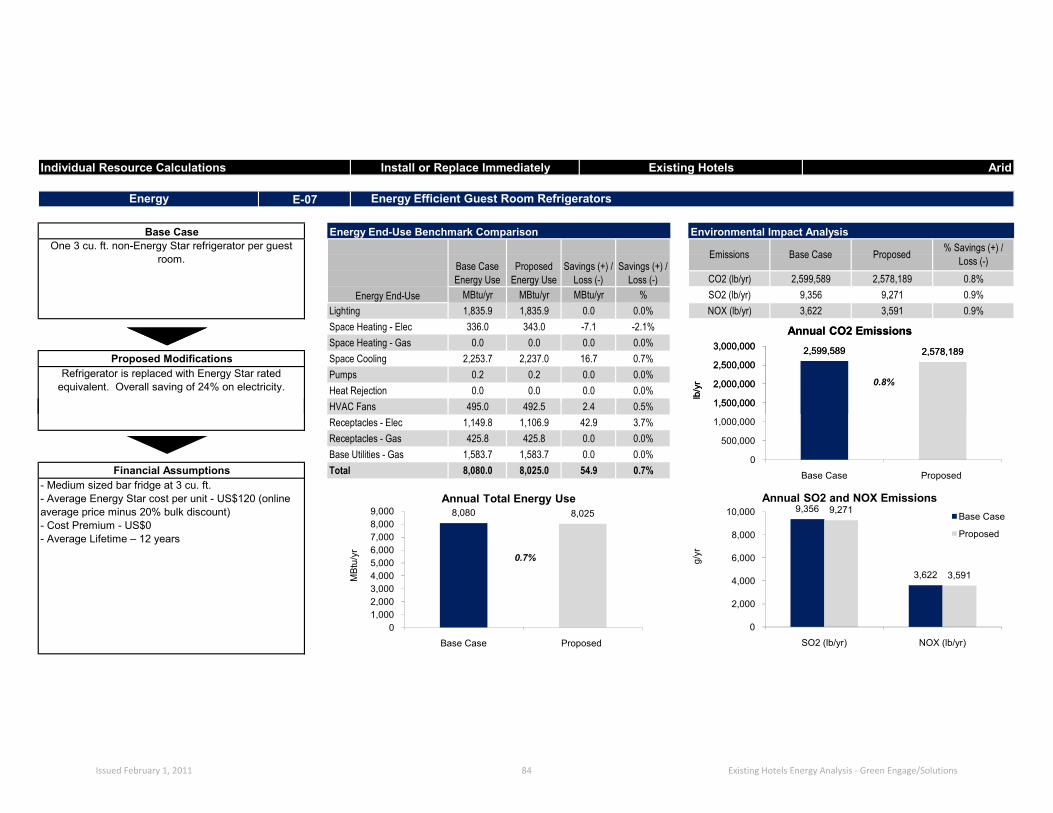
Refrigerator is replaced with Energy Star rated equivalent. Overall saving of 24% on electricity. 0.8%
Heat Rejection 0.0 0.0 0.0 0.0%Pumps 0.2 0.2 0.0 0.0%
HVAC Fans 495 0 492 5 2 4 0 5%
Proposed Modifications
3,622 3,591 0.9%Space Heating - Elec 336.0 343.0 -7.1 -2.1%
One 3 cu. ft. non-Energy Star refrigerator per guest room.
Space Heating - Gas 0.0 0.0 0.0 0.0%Space Cooling 2,253.7 2,237.0 16.7 0.7%
SO2 (lb/yr) 9,356 9,271 0.9%Lighting 1,835.9 1,835.9 0.0 0.0% NOX (lb/yr)
Energy End-Use
Base Case Energy Use
Proposed Energy Use
Savings (+) / Loss (-)
Savings (+) / Loss (-)
MBtu/yr MBtu/yr MBtu/yr %
Emissions Base Case Proposed % Savings (+) / Loss (-)
CO2 (lb/yr) 2,599,589 2,578,189 0.8%
Individual Resource Calculations Install or Replace Immediately Existing Hotels
Energy E-07 Energy Efficient Guest Room Refrigerators
Energy End-Use Benchmark Comparison Environmental Impact Analysis
Arid
Base Case
2,599,589 2,578,189
1,500,000
2,000,000
2,500,000
3,000,000
lb/y
r
Annual CO2 Emissions
Financial Assumptions Total 8,080.0 8,025.0 54.9 0.7%Base Utilities - Gas 1,583.7 1,583.7 0.0 0.0%
- Medium sized bar fridge at 3 cu. ft.- Average Energy Star cost per unit - US$120 (online average price minus 20% bulk discount)- Cost Premium - US$0- Average Lifetime – 12 years
0.7%
Receptacles - Gas 425.8 425.8 0.0 0.0%
HVAC Fans 495.0 492.5 2.4 0.5%Receptacles - Elec 1,149.8 1,106.9 42.9 3.7%
2,599,589 2,578,189
0
500,000
1,000,000
1,500,000
2,000,000
2,500,000
3,000,000
Base Case Proposed
lb/y
r
Annual CO2 Emissions
9,356
3,622
9,271
3,591
0
2,000
4,000
6,000
8,000
10,000
SO2 (lb/yr) NOX (lb/yr)
g/yr
Annual SO2 and NOX EmissionsBase Case
Proposed
8,080 8,025
01,0002,0003,0004,0005,0006,0007,0008,0009,000
Base Case Proposed
MBt
u/yr
Annual Total Energy Use
Issued February 1, 2011 84 Existing Hotels Energy Analysis - Green Engage/Solutions

Additional Capital CostHVAC Plant First Cost Reductions
Cooling Plant SavingsHeating Plant Savings
N/A tons $0 5 $0 $1,841 $1,841N/A MBh $0 6 $0 $1 900 $1 900
4 $0 $1,784 $1,784 First Year Yield On Marginal Cost 18.7%
20.7%IRR($9,000) 3 $0 $1,751 $1,751
Capital Costs Savings Summary 2 $0 $1,718 $1,7181 $0 $1,686 $1,686
($9,000) Simple Payback 5.2 yrsWater & sewer 0 Gals $0.0037 $0 0 ($9,000) $0
Cash FlowInitial Marginal Cost $9,000
$1,686Initial Annual Savings
Annual Resource Cost Summary Financial Table Financial Results Summary
ResourceAnnual Resource Savings
(+) / Loss (-) Unit CostAnnual Savings (+) /
Loss (-)Yr.
Costs (Marginal/Maint/
Replace)
Savings (+) / Loss (-)
Natural gas 0 therms $0.9000 $0Electricity 16,098 kWh $0.1028 $1,655
Energy E-07 Energy Efficient Guest Room Refrigerators
Individual Resource Calculations Install or Replace Immediately Existing Hotels Arid
Heating Plant SavingsAirside Distribution Savings
Total Additional Capital Cost:
Estimated Useful Life (yrs)Percent replacedReplacement Cost Premium (In 2010 Dollars)
Base YearValuation TypeProject Analysis PeriodInflation RateDiscount Rate for Defined ValuationEnergy Escalation Rate (Nominal) (See Table in Assumptions)
$2,30212 11 $0 $2,229 $2,229
Replacement Life and Cost Summary 10 $0 $2,158
7.19% 20 $0 $3,043 $3,0432.79% 19 $0 $2,932 $2,932
20 18 $0 $2,830 $2,830Defined 17 $0 $2,732 $2,732
2010 16 $0 $2,637 $2,637Financial Analysis 15 $0 $2,545 $2,545
14 $0 $2,457 $2,457$0 13 $0 $2,378 $2,378
100% 12 $0 $2,302
9 $0 $2,089 $2,089($9,000) 8 $0 $2,024 $2,024
$11,990
$2,158
N/A cfm $0 7 $0 $1,961N/A MBh $0 6 $0 $1,900 $1,900 NPV
$1,961
($15,000)($10,000)($5,000)
$0 $5,000
$10,000 $15,000 $20,000 $25,000 $30,000 $35,000 $40,000
0 5 10 15 20
Net
Cas
h Fl
ow (E
nd o
f Yea
r)
Years
Simple Payback Graph
Issued February 1, 2011 85 Existing Hotels Energy Analysis - Green Engage/Solutions

All 75W incandescent bulbs are replaced with 25W CFLs (6 per room or 900 in total). The guest room
lighting density is reduced to 0.75 W/sf.
8.6%Heat Rejection 0.0 0.0 0.0 0.0%Pumps 0.2 0.2 0.0 -2.3%
HVAC Fans 495 0 483 3 11 6 2 4%
Proposed Modifications
3,622 3,296 9.0%Space Heating - Elec 336.0 420.1 -84.1 -25.0%
Each guest room contains a total of 12 light bulbs. There is a 50/50 split of 75W incandescent bulbs and
25W CFLs, giving a lighting density of 1.5 W/sf. Bulbs operate for 8 hours/day.
Space Heating - Gas 0.0 0.0 0.0 0.0%Space Cooling 2,253.7 2,087.2 166.5 7.4%
SO2 (lb/yr) 9,356 8,470 9.5%Lighting 1,835.9 1,355.3 480.6 26.2% NOX (lb/yr)
Energy End-Use
Base Case Energy Use
Proposed Energy Use
Savings (+) / Loss (-)
Savings (+) / Loss (-)
MBtu/yr MBtu/yr MBtu/yr %
Emissions Base Case Proposed % Savings (+) / Loss (-)
CO2 (lb/yr) 2,599,589 2,375,690 8.6%
Individual Resource Calculations Install or Replace Immediately Existing Hotels
Energy E-09 Zero Use of Incandescent Lamps in Guest Rooms
Energy End-Use Benchmark Comparison Environmental Impact Analysis
Arid
Base Case
2,599,5892,375,690
1,500,000
2,000,000
2,500,000
3,000,000
lb/y
r
Annual CO2 Emissions
lighting density is reduced to 0.75 W/sf.
Financial Assumptions Total 8,080.0 7,505.3 574.7 7.1%Base Utilities - Gas 1,583.7 1,583.7 0.0 0.0%
- Total of 12 bulbs per room with 50% designated for replacement- Average Energy Star cost per unit of US$3.40 with bulb life of 6,000 – 12,000 hours- Conventional cost per unit of US$0.60 with bulb life of 750 – 1,000 hours- Common building laborer staff rate- Replacement cost premium is a savings because light bulbs will last longer for the price paid
7.1%
Receptacles - Gas 425.8 425.8 0.0 0.0%
HVAC Fans 495.0 483.3 11.6 2.4%Receptacles - Elec 1,149.8 1,149.8 0.0 0.0%
2,599,5892,375,690
0
500,000
1,000,000
1,500,000
2,000,000
2,500,000
3,000,000
Base Case Proposed
lb/y
r
Annual CO2 Emissions
9,356
3,622
8,470
3,296
0
2,000
4,000
6,000
8,000
10,000
SO2 (lb/yr) NOX (lb/yr)
g/yr
Annual SO2 and NOX EmissionsBase Case
Proposed
8,0807,505
01,0002,0003,0004,0005,0006,0007,0008,0009,000
Base Case Proposed
MBt
u/yr
Annual Total Energy Use
Issued February 1, 2011 86 Existing Hotels Energy Analysis - Green Engage/Solutions

Additional Capital CostHVAC Plant First Cost Reductions
Cooling Plant SavingsHeating Plant Savings N/A MBh $0 6 $2 941 $19 882 $22 823
N/A tons $0 5 $0 $19,266 $19,2664 $0 $18,668 $18,668 First Year Yield On Marginal Cost 632.4%
635.8%IRR($2,790) 3 $2,709 $18,320 $21,029
Capital Costs Savings Summary 2 $0 $17,978 $17,978
Water & sewer 0 Gals $0.0037 $0 0 ($2,790) $0 ($2,790)1 $0 $17,643 $17,643
Simple Payback 0.2 yrs
Natural gas 0 therms $0.9000 $0Electricity 168,427 kWh $0.1028 $17,314 Initial Annual Savings
Cash FlowInitial Marginal Cost $2,790
$17,643
Annual Resource Cost Summary Financial Table Financial Results Summary
ResourceAnnual Resource Savings
(+) / Loss (-) Unit CostAnnual Savings (+) /
Loss (-)Yr.
Costs (Marginal/Maint/
Replace)
Savings (+) / Loss (-)
Energy E-09 Zero Use of Incandescent Lamps in Guest Rooms
Individual Resource Calculations Install or Replace Immediately Existing Hotels Arid
Heating Plant SavingsAirside Distribution Savings
Total Additional Capital Cost:
Estimated Useful Life (yrs)Percent replacedReplacement Cost Premium (In 2010 Dollars)
Base YearValuation TypeProject Analysis PeriodInflation RateDiscount Rate for Defined ValuationEnergy Escalation Rate (Nominal)
$29,61017
(See Table in Assumptions)
100% 12 $3,468 $24,088 $27,556
18 $4,090 $33,700
7.19% 20 $0 $31,842 $31,8422.79% 19 $0 $30,676 $30,676
Defined$27,588
Financial Analysis 15 $3,766 $26,629 $30,396
20
14 $0 $25,704 $25,704$2,494 13 $0 $24,883 $24,883
$0 $28,581 $28,5812010 16 $0 $27,588
3 11 $0 $23,319 $23,319Replacement Life and Cost Summary 10 $0 $22,574 $22,574
9 $3,194 $21,852 $25,046
$20,518($2,790) 8 $0 $21,175 $21,175
$219,883N/A cfm $0 7 $0 $20,518N/A MBh $0 6 $2,941 $19,882 $22,823 NPV
($100,000)
$0
$100,000
$200,000
$300,000
$400,000
$500,000
$600,000
0 5 10 15 20Net
Cas
h Fl
ow (E
nd o
f Yea
r)
Years
Simple Payback Graph
Issued February 1, 2011 87 Existing Hotels Energy Analysis - Green Engage/Solutions

All 75W incandescent bulbs are replaced with 25W CFLs (20 per floor or 100 in total). The guest room
lighting density is reduced to 0.35 W/sf.
2.2%Heat Rejection 0.0 0.0 0.0 0.0%Pumps 0.2 0.2 0.0 -4.5%
HVAC Fans 495 0 490 1 4 8 1 0%
Proposed Modifications
3,622 3,540 2.3%Space Heating - Elec 336.0 389.6 -53.7 -16.0%
Corridors contain 40 light bulbs per floor. There is a 50/50 split of 75W incandescent bulbs and 25W CFLs, giving a lighting density of 0.7 W/sf. Bulbs operate for
24 hours/day.
Space Heating - Gas 0.0 0.0 0.0 0.0%Space Cooling 2,253.7 2,217.4 36.3 1.6%
SO2 (lb/yr) 9,356 9,133 2.4%Lighting 1,835.9 1,678.9 157.0 8.6% NOX (lb/yr)
Energy End-Use
Base Case Energy Use
Proposed Energy Use
Savings (+) / Loss (-)
Savings (+) / Loss (-)
MBtu/yr MBtu/yr MBtu/yr %
Emissions Base Case Proposed % Savings (+) / Loss (-)
CO2 (lb/yr) 2,599,589 2,543,312 2.2%
Individual Resource Calculations Install or Replace Immediately Existing Hotels
Energy E-09 Zero Use of Incandescent Lamps in Circulation Spaces
Energy End-Use Benchmark Comparison Environmental Impact Analysis
Arid
Base Case
2,599,589 2,543,312
1,500,000
2,000,000
2,500,000
3,000,000
lb/y
r
Annual CO2 Emissions
lighting density is reduced to 0.35 W/sf.
Financial Assumptions Total 8,080.0 7,935.5 144.4 1.8%Base Utilities - Gas 1,583.7 1,583.7 0.0 0.0%
- Total of 40 bulbs per corridor with 50% designated for replacement- This amounts to 100 bulbs to be replaced across the entire building- Average Energy Star cost per unit of US$3.40 with bulb life of 6,000 – 12,000 hours- Conventional cost per unit of US$0.60 with bulb life of 750 – 1,000 hours- Common building laborer staff rate- Replacement cost premium is a savings because light bulbs will last longer for the price paid
1.8%
Receptacles - Gas 425.8 425.8 0.0 0.0%
HVAC Fans 495.0 490.1 4.8 1.0%Receptacles - Elec 1,149.8 1,149.8 0.0 0.0%
2,599,589 2,543,312
0
500,000
1,000,000
1,500,000
2,000,000
2,500,000
3,000,000
Base Case Proposed
lb/y
r
Annual CO2 Emissions
9,356
3,622
9,133
3,540
0
2,000
4,000
6,000
8,000
10,000
SO2 (lb/yr) NOX (lb/yr)
g/yr
Annual SO2 and NOX EmissionsBase Case
Proposed
8,080 7,936
01,0002,0003,0004,0005,0006,0007,0008,0009,000
Base Case Proposed
MBt
u/yr
Annual Total Energy Use
Issued February 1, 2011 88 Existing Hotels Energy Analysis - Green Engage/Solutions

Additional Capital CostHVAC Plant First Cost Reductions
Cooling Plant SavingsHeating Plant Savings N/A MBh $0 6 $327 $4 997 $5 324
N/A tons $0 5 $318 $4,842 $5,1604 $309 $4,692 $5,002 First Year Yield On Marginal Cost 1430.5%
1524.4%IRR($310) 3 $301 $4,605 $4,906
Capital Costs Savings Summary 2 $293 $4,519 $4,812
Water & sewer 0 Gals $0.0037 $0 0 ($310) $0 ($310)1 $285 $4,435 $4,719
Simple Payback 0.1 yrs
Natural gas 0 therms $0.9000 $0Electricity 42,334 kWh $0.1028 $4,352 Initial Annual Savings
Cash FlowInitial Marginal Cost $310
$4,435
Annual Resource Cost Summary Financial Table Financial Results Summary
ResourceAnnual Resource Savings
(+) / Loss (-) Unit CostAnnual Savings (+) /
Loss (-)Yr.
Costs (Marginal/Maint/
Replace)
Savings (+) / Loss (-)
Energy E-09 Zero Use of Incandescent Lamps in Circulation Spaces
Individual Resource Calculations Install or Replace Immediately Existing Hotels Arid
Heating Plant SavingsAirside Distribution Savings
Total Additional Capital Cost:
Estimated Useful Life (yrs)Percent replacedReplacement Cost Premium (In 2010 Dollars)
Base YearValuation TypeProject Analysis PeriodInflation RateDiscount Rate for Defined ValuationEnergy Escalation Rate (Nominal)
$7,44217
(See Table in Assumptions)
100% 12 $385 $6,055 $6,440
18 $454 $7,897
7.19% 20 $480 $8,003 $8,4832.79% 19 $467 $7,710 $8,177
Defined$7,364
Financial Analysis 15 $418 $6,693 $7,112
20
14 $407 $6,461 $6,868$277 13 $396 $6,254 $6,650
$442 $7,184 $7,6262010 16 $430 $6,934
1 11 $375 $5,861 $6,236Replacement Life and Cost Summary 10 $365 $5,674 $6,039
9 $355 $5,493 $5,847
$5,493($310) 8 $345 $5,322 $5,668
$56,748N/A cfm $0 7 $336 $5,157N/A MBh $0 6 $327 $4,997 $5,324 NPV
($20,000)$0
$20,000 $40,000 $60,000 $80,000
$100,000 $120,000 $140,000
0 5 10 15 20Net
Cas
h Fl
ow (E
nd o
f Yea
r)
Years
Simple Payback Graph
Issued February 1, 2011 89 Existing Hotels Energy Analysis - Green Engage/Solutions

All 75W incandescent bulbs are replaced with 25W CFLs (100 in total). The average lighting density is reduced to
0.7 W/sf.
0.7%Heat Rejection 0.0 0.0 0.0 0.0%Pumps 0.2 0.2 0.0 -2.3%
HVAC Fans 495 0 493 2 1 8 0 4%
Proposed Modifications
3,622 3,596 0.7%Space Heating - Elec 336.0 343.7 -7.7 -2.3%
Offices, food preparation, lockers, laundry, mechanical and electrical spaces contain a total of 200 light bulbs. There is a 50/50 split of 75W incandescent bulbs and 25W CFLs, giving an average lighting density of 1.4 W/sf. Bulbs operate for 8
hours/day.
Space Heating - Gas 0.0 0.0 0.0 0.0%Space Cooling 2,253.7 2,239.8 13.9 0.6%
SO2 (lb/yr) 9,356 9,287 0.7%Lighting 1,835.9 1,799.0 36.9 2.0% NOX (lb/yr)
Energy End-Use
Base Case Energy Use
Proposed Energy Use
Savings (+) / Loss (-)
Savings (+) / Loss (-)
MBtu/yr MBtu/yr MBtu/yr %
Emissions Base Case Proposed % Savings (+) / Loss (-)
CO2 (lb/yr) 2,599,589 2,582,083 0.7%
Individual Resource Calculations Install or Replace Immediately Existing Hotels
Energy E-09 Zero Use of Incandescent Lamps in Back of House
Energy End-Use Benchmark Comparison Environmental Impact Analysis
Arid
Base Case
2,599,589 2,582,083
1,500,000
2,000,000
2,500,000
3,000,000
lb/y
r
Annual CO2 Emissions
Financial Assumptions Total 8,080.0 8,035.0 44.9 0.6%Base Utilities - Gas 1,583.7 1,583.7 0.0 0.0%
- Total of 200 bulbs in back of house with 50% designated for replacement- Average Energy Star cost per unit of US$3.40 with bulb life of 6,000 – 12,000 hours- Conventional cost per unit of US$0.60 with bulb life of 750 – 1,000 hours- Common building laborer staff rate- Replacement cost premium is a savings because light bulbs will last longer for the price paid
0.6%
Receptacles - Gas 425.8 425.8 0.0 0.0%
HVAC Fans 495.0 493.2 1.8 0.4%Receptacles - Elec 1,149.8 1,149.8 0.0 0.0%
2,599,589 2,582,083
0
500,000
1,000,000
1,500,000
2,000,000
2,500,000
3,000,000
Base Case Proposed
lb/y
r
Annual CO2 Emissions
9,356
3,622
9,287
3,596
0
2,000
4,000
6,000
8,000
10,000
SO2 (lb/yr) NOX (lb/yr)
g/yr
Annual SO2 and NOX EmissionsBase Case
Proposed
8,080 8,035
01,0002,0003,0004,0005,0006,0007,0008,0009,000
Base Case Proposed
MBt
u/yr
Annual Total Energy Use
Issued February 1, 2011 90 Existing Hotels Energy Analysis - Green Engage/Solutions

Additional Capital CostHVAC Plant First Cost Reductions
Cooling Plant SavingsHeating Plant Savings N/A MBh $0 6 $327 $1 555 $1 881
N/A tons $0 5 $0 $1,506 $1,5064 $0 $1,460 $1,460 First Year Yield On Marginal Cost 445.0%
449.5%IRR($310) 3 $301 $1,432 $1,733
Capital Costs Savings Summary 2 $0 $1,406 $1,406
Water & sewer 0 Gals $0.0037 $0 0 ($310) $0 ($310)1 $0 $1,379 $1,379
Simple Payback 0.3 yrs
Natural gas 0 therms $0.9000 $0Electricity 13,169 kWh $0.1028 $1,354 Initial Annual Savings
Cash FlowInitial Marginal Cost $310
$1,379
Annual Resource Cost Summary Financial Table Financial Results Summary
ResourceAnnual Resource Savings
(+) / Loss (-) Unit CostAnnual Savings (+) /
Loss (-)Yr.
Costs (Marginal/Maint/
Replace)
Savings (+) / Loss (-)
Energy E-09 Zero Use of Incandescent Lamps in Back of House
Individual Resource Calculations Install or Replace Immediately Existing Hotels Arid
Heating Plant SavingsAirside Distribution Savings
Total Additional Capital Cost:
Estimated Useful Life (yrs)Percent replacedReplacement Cost Premium (In 2010 Dollars)
Base YearValuation TypeProject Analysis PeriodInflation RateDiscount Rate for Defined ValuationEnergy Escalation Rate (Nominal)
$2,31517
(See Table in Assumptions)
100% 12 $385 $1,883 $2,269
18 $454 $2,770
7.19% 20 $0 $2,490 $2,4902.79% 19 $0 $2,399 $2,399
Defined$2,157
Financial Analysis 15 $418 $2,082 $2,501
20
14 $0 $2,010 $2,010$277 13 $0 $1,946 $1,946
$0 $2,235 $2,2352010 16 $0 $2,157
3 11 $0 $1,823 $1,823Replacement Life and Cost Summary 10 $0 $1,765 $1,765
9 $355 $1,709 $2,063
$1,604($310) 8 $0 $1,656 $1,656
$17,409N/A cfm $0 7 $0 $1,604N/A MBh $0 6 $327 $1,555 $1,881 NPV
($5,000)$0
$5,000 $10,000 $15,000 $20,000 $25,000 $30,000 $35,000 $40,000 $45,000
0 5 10 15 20Net
Cas
h Fl
ow (E
nd o
f Yea
r)
Years
Simple Payback Graph
Issued February 1, 2011 91 Existing Hotels Energy Analysis - Green Engage/Solutions

Corridor lighting load reduced by 40% to 0.42 W/sf. Operating schedule remains unchanged. Reduction in load based on US
EPA predictions, assuming lighting levels turn down by 50% h i d
Proposed Modifications
1.8%Heat Rejection 0.0 0.0 0.0 0.0%Pumps 0.2 0.2 0.0 -4.5%
HVAC Fans 495 0 490 9 4 1 0 8%
Space Heating - Gas 0.0 0.0 0.0 0.0%Space Cooling 2,253.7 2,223.6 30.1 1.3%
CO2 (lb/yr) 2,599,589 2,553,010 1.8%
3,622 3,554 1.9%Space Heating - Elec 336.0 375.5 -39.5 -11.8%
SO2 (lb/yr) 9,356 9,172 2.0%Lighting 1,835.9 1,711.0 125.0 6.8% NOX (lb/yr)
Energy End-Use MBtu/yr MBtu/yr %
Corridors have a lighting density of 0.7 W/sf. Lights operate for 24 hours a day.
Individual Resource Calculations Install or Replace Immediately Existing Hotels
Energy E-10 Occupancy Sensors in Corridors for Decorative Features
Energy End-Use Benchmark Comparison Environmental Impact Analysis
Arid
Base Case
Emissions Base Case Proposed % Savings (+) / Loss (-)Base Case
Energy UseProposed
Energy UseSavings (+) /
Loss (-)Savings (+) /
Loss (-)MBtu/yr
2,599,589 2,553,010
1,500,000
2,000,000
2,500,000
3,000,000
lb/y
r
Annual CO2 Emissions
when unoccupied.
Financial Assumptions Total 8,080.0 7,960.4 119.6 1.5%Base Utilities - Gas 1,583.7 1,583.7 0.0 0.0%
- 5 sensors required per floor - therefore, 25 total per building- US$193 per sensor including electrician labour- Sensor lifetime – 10 years- Increase bulb lifetime by 40% (Savings includes this extended lifetime)- All 200 corridor light bulbs are assumed to already be CFLs
1.5%
Receptacles - Gas 425.8 425.8 0.0 0.0%
HVAC Fans 495.0 490.9 4.1 0.8%Receptacles - Elec 1,149.8 1,149.8 0.0 0.0%
2,599,589 2,553,010
0
500,000
1,000,000
1,500,000
2,000,000
2,500,000
3,000,000
Base Case Proposed
lb/y
r
Annual CO2 Emissions
9,356
3,622
9,172
3,554
0
2,000
4,000
6,000
8,000
10,000
SO2 (lb/yr) NOX (lb/yr)
g/yr
Annual SO2 and NOX EmissionsBase Case
Proposed
8,080 7,960
01,0002,0003,0004,0005,0006,0007,0008,0009,000
Base Case Proposed
MBt
u/yr
Annual Total Energy Use
Issued February 1, 2011 92 Existing Hotels Energy Analysis - Green Engage/Solutions
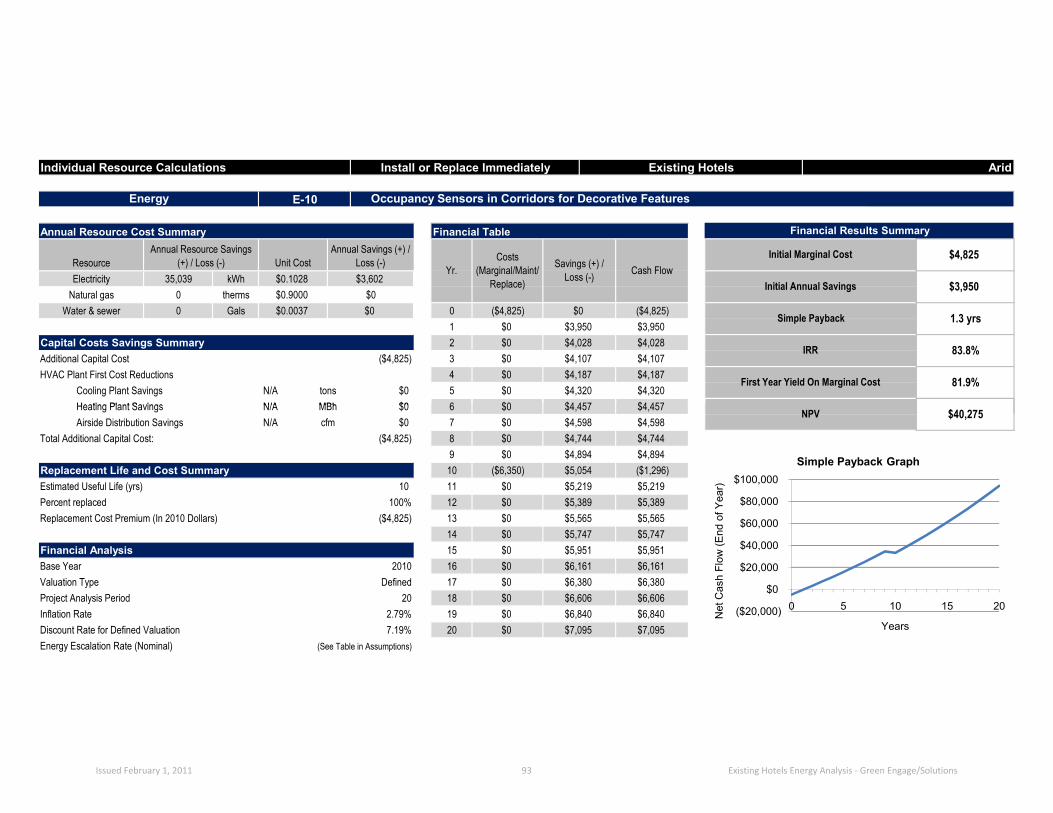
Additional Capital CostHVAC Plant First Cost Reductions
Cooling Plant SavingsHeating Plant Savings
N/A tons $0 5 $0 $4,320 $4,320N/A MBh $0 6 $0 $4 457 $4 457
4 $0 $4,187 $4,187 First Year Yield On Marginal Cost 81.9%
83.8%IRR($4,825) 3 $0 $4,107 $4,107
Capital Costs Savings Summary 2 $0 $4,028 $4,0281 $0 $3,950 $3,950
($4,825) Simple Payback 1.3 yrsWater & sewer 0 Gals $0.0037 $0 0 ($4,825) $0
Initial Marginal Cost $4,825
$3,950Initial Annual Savings
Annual Resource Cost Summary Financial Table Financial Results Summary
ResourceAnnual Resource Savings
(+) / Loss (-) Unit CostAnnual Savings (+) /
Loss (-)Yr.
Costs (Marginal/Maint/
Replace)
Savings (+) / Loss (-)
Natural gas 0 therms $0.9000 $0Electricity 35,039 kWh $0.1028 $3,602
Cash Flow
Energy E-10 Occupancy Sensors in Corridors for Decorative Features
Individual Resource Calculations Install or Replace Immediately Existing Hotels Arid
Heating Plant SavingsAirside Distribution Savings
Total Additional Capital Cost:
Estimated Useful Life (yrs)Percent replacedReplacement Cost Premium (In 2010 Dollars)
Base YearValuation TypeProject Analysis PeriodInflation RateDiscount Rate for Defined ValuationEnergy Escalation Rate (Nominal) (See Table in Assumptions)
$5,38910 11 $0 $5,219 $5,219
Replacement Life and Cost Summary 10 ($6,350)
7.19% 20 $0 $7,095 $7,0952.79% 19 $0 $6,840 $6,840
20 18 $0 $6,606 $6,606Defined 17 $0 $6,380 $6,380
2010 16 $0 $6,161 $6,161Financial Analysis 15 $0 $5,951 $5,951
14 $0 $5,747 $5,747($4,825) 13 $0 $5,565 $5,565
100% 12 $0 $5,389
9 $0 $4,894 $4,894($4,825) 8 $0 $4,744 $4,744
$40,275
$5,054 ($1,296)
N/A cfm $0 7 $0 $4,598N/A MBh $0 6 $0 $4,457 $4,457 NPV
$4,598
($20,000)
$0
$20,000
$40,000
$60,000
$80,000
$100,000
0 5 10 15 20
Net
Cas
h Fl
ow (E
nd o
f Yea
r)
Years
Simple Payback Graph
Issued February 1, 2011 93 Existing Hotels Energy Analysis - Green Engage/Solutions

Infiltration is reduced by a third, to 0.2 air changes per hour, in all perimeter spaces. 0.9%
Heat Rejection 0.0 0.0 0.0 0.0%Pumps 0.2 0.1 0.0 4.5%
HVAC Fans 495 0 482 6 12 4 2 5%
Proposed Modifications
3,622 3,589 0.9%Space Heating - Elec 336.0 305.6 30.4 9.0%
Infiltration of 0.3 air changes per hour in all perimeter spaces.
Space Heating - Gas 0.0 0.0 0.0 0.0%Space Cooling 2,253.7 2,238.7 15.0 0.7%
SO2 (lb/yr) 9,356 9,267 1.0%Lighting 1,835.9 1,835.9 0.0 0.0% NOX (lb/yr)
Energy End-Use
Base Case Energy Use
Proposed Energy Use
Savings (+) / Loss (-)
Savings (+) / Loss (-)
MBtu/yr MBtu/yr MBtu/yr %
Emissions Base Case Proposed % Savings (+) / Loss (-)
CO2 (lb/yr) 2,599,589 2,577,066 0.9%
Individual Resource Calculations Install or Replace Immediately Existing Hotels
Building Materials B-04 Weather Stripping
Energy End-Use Benchmark Comparison Environmental Impact Analysis
Arid
Base Case
2,599,589 2,577,066
1,500,000
2,000,000
2,500,000
3,000,000
lb/y
r
Annual CO2 Emissions
Financial Assumptions Total 8,080.0 8,022.1 57.9 0.7%Base Utilities - Gas 1,583.7 1,583.6 0.1 0.0%
- Material cost of weather stripping – US$0.88/ft- 5ft x 5ft window on 130 rooms requiring 1 hour of carpenter labor rate per window- 5ft x 10ft window on 20 corner rooms requiring 1.5 hour of carpenter labor per window- Average weatherstripping lifetime – 10 years 0.7%
Receptacles - Gas 425.8 425.8 0.0 0.0%
HVAC Fans 495.0 482.6 12.4 2.5%Receptacles - Elec 1,149.8 1,149.8 0.0 0.0%
2,599,589 2,577,066
0
500,000
1,000,000
1,500,000
2,000,000
2,500,000
3,000,000
Base Case Proposed
lb/y
r
Annual CO2 Emissions
9,356
3,622
9,267
3,589
0
2,000
4,000
6,000
8,000
10,000
SO2 (lb/yr) NOX (lb/yr)
g/yr
Annual SO2 and NOX EmissionsBase Case
Proposed
8,080 8,022
01,0002,0003,0004,0005,0006,0007,0008,0009,000
Base Case Proposed
MBt
u/yr
Annual Total Energy Use
Issued February 1, 2011 94 Existing Hotels Energy Analysis - Green Engage/Solutions

Additional Capital CostHVAC Plant First Cost Reductions
Cooling Plant SavingsHeating Plant Savings
N/A tons $0 5 $0 $1,938 $1,938N/A MBh $0 6 $0 $2 000 $2 000
4 $0 $1,878 $1,878 First Year Yield On Marginal Cost 15.4%
11.1%IRR($11,540) 3 $0 $1,843 $1,843
Capital Costs Savings Summary 2 $0 $1,809 $1,809
Water & sewer 0 Gals $0.0037 $0 0 ($11,540) $0 ($11,540)1 $0 $1,775 $1,775
Simple Payback 6.2 yrs
Natural gas 1 therms $0.9000 $1Electricity 16,934 kWh $0.1028 $1,741 Initial Annual Savings
Cash FlowInitial Marginal Cost $11,540
$1,775
Annual Resource Cost Summary Financial Table Financial Results Summary
ResourceAnnual Resource Savings
(+) / Loss (-) Unit CostAnnual Savings (+) /
Loss (-)Yr.
Costs (Marginal/Maint/
Replace)
Savings (+) / Loss (-)
Building Materials B-04 Weather Stripping
Individual Resource Calculations Install or Replace Immediately Existing Hotels Arid
Heating Plant SavingsAirside Distribution Savings
Total Additional Capital Cost:
Estimated Useful Life (yrs)Percent replacedReplacement Cost Premium (In 2010 Dollars)
Base YearValuation TypeProject Analysis PeriodInflation RateDiscount Rate for Defined ValuationEnergy Escalation Rate (Nominal)
$2,97917
(See Table in Assumptions)
100% 12 $0 $2,423 $2,423
18 $0 $2,979
7.19% 20 $0 $3,203 $3,2032.79% 19 $0 $3,086 $3,086
Defined$2,775
Financial Analysis 15 $0 $2,679 $2,679
20
14 $0 $2,586 $2,586($11,540) 13 $0 $2,503 $2,503
$0 $2,875 $2,8752010 16 $0 $2,775
9 $0 $2,198 $2,198
10 11 $0 $2,346 $2,346Replacement Life and Cost Summary 10 ($15,188) $2,271 ($12,917)
($11,540) 8 $0 $2,130 $2,130
$3,615N/A cfm $0 7 $0 $2,064N/A MBh $0 6 $0 $2,000 $2,000 NPV
$2,064
($15,000)($10,000)($5,000)
$0 $5,000
$10,000 $15,000 $20,000 $25,000
0 5 10 15 20
Net
Cas
h Fl
ow (E
nd o
f Yea
r)
Years
Simple Payback Graph
Issued February 1, 2011 95 Existing Hotels Energy Analysis - Green Engage/Solutions

Guest room thermostat setpoints of 76°F (cooling) and 72°F (heating). 4.2%
Heat Rejection 0.0 0.0 0.0 0.0%Pumps 0.2 0.2 0.0 -4.5%
HVAC Fans 495 0 499 8 4 8 1 0%
Proposed Modifications
3,622 3,463 4.4%Space Heating - Elec 336.0 176.1 159.9 47.6%
Guest room thermostat setpoints of 74°F (cooling) and 74°F (heating).
Space Heating - Gas 0.0 0.0 0.0 0.0%Space Cooling 2,253.7 2,128.6 125.1 5.5%
SO2 (lb/yr) 9,356 8,924 4.6%Lighting 1,835.9 1,835.9 0.0 0.0% NOX (lb/yr)
Energy End-Use
Base Case Energy Use
Proposed Energy Use
Savings (+) / Loss (-)
Savings (+) / Loss (-)
MBtu/yr MBtu/yr MBtu/yr %
Emissions Base Case Proposed % Savings (+) / Loss (-)
CO2 (lb/yr) 2,599,589 2,490,434 4.2%
Individual Resource Calculations Install or Replace Immediately Existing Hotels
Mechanical M-09 100% of Guest Rooms have 4F Deadband Thermostats
Energy End-Use Benchmark Comparison Environmental Impact Analysis
Arid
Base Case
2,599,589 2,490,434
1,500,000
2,000,000
2,500,000
3,000,000
lb/y
r
Annual CO2 Emissions
Financial Assumptions Total 8,080.0 7,799.6 280.3 3.5%Base Utilities - Gas 1,583.7 1,583.5 0.2 0.0%
- US$217 per sensor including electrician labour- Average Lifetime – 15 years
3.5%
Receptacles - Gas 425.8 425.8 0.0 0.0%
HVAC Fans 495.0 499.8 -4.8 -1.0%Receptacles - Elec 1,149.8 1,149.8 0.0 0.0%
2,599,589 2,490,434
0
500,000
1,000,000
1,500,000
2,000,000
2,500,000
3,000,000
Base Case Proposed
lb/y
r
Annual CO2 Emissions
9,356
3,622
8,924
3,463
0
2,000
4,000
6,000
8,000
10,000
SO2 (lb/yr) NOX (lb/yr)
g/yr
Annual SO2 and NOX EmissionsBase Case
Proposed
8,080 7,800
01,0002,0003,0004,0005,0006,0007,0008,0009,000
Base Case Proposed
MBt
u/yr
Annual Total Energy Use
Issued February 1, 2011 96 Existing Hotels Energy Analysis - Green Engage/Solutions

Additional Capital CostHVAC Plant First Cost Reductions
Cooling Plant SavingsHeating Plant Savings N/A MBh $0 6 $0 $9 693 $9 693
N/A tons $0 5 $0 $9,393 $9,3934 $0 $9,101 $9,101 First Year Yield On Marginal Cost 26.4%
27.7%IRR($32,550) 3 $0 $8,932 $8,932
Capital Costs Savings Summary 2 $0 $8,765 $8,765
Water & sewer 0 Gals $0.0037 $0 0 ($32,550) $0 ($32,550)1 $0 $8,602 $8,602
Simple Payback 3.7 yrs
Natural gas 2 therms $0.9000 $2Electricity 82,094 kWh $0.1028 $8,439 Initial Annual Savings
Cash FlowInitial Marginal Cost $32,550
$8,602
Annual Resource Cost Summary Financial Table Financial Results Summary
ResourceAnnual Resource Savings
(+) / Loss (-) Unit CostAnnual Savings (+) /
Loss (-)Yr.
Costs (Marginal/Maint/
Replace)
Savings (+) / Loss (-)
Mechanical M-09 100% of Guest Rooms have 4F Deadband Thermostats
Individual Resource Calculations Install or Replace Immediately Existing Hotels Arid
Heating Plant SavingsAirside Distribution Savings
Total Additional Capital Cost:
Estimated Useful Life (yrs)Percent replacedReplacement Cost Premium (In 2010 Dollars)
Base YearValuation TypeProject Analysis PeriodInflation RateDiscount Rate for Defined ValuationEnergy Escalation Rate (Nominal)
$14,43617
(See Table in Assumptions)
100% 12 $0 $11,744 $11,744
18 $0 $14,436
7.19% 20 $0 $15,524 $15,5242.79% 19 $0 $14,956 $14,956
Defined$13,450
Financial Analysis 15 ($49,147) $12,983 ($36,164)
20
14 $0 $12,532 $12,532($32,550) 13 $0 $12,131 $12,131
$0 $13,935 $13,9352010 16 $0 $13,450
15 11 $0 $11,369 $11,369Replacement Life and Cost Summary 10 $0 $11,005 $11,005
9 $0 $10,654 $10,654
$10,003($32,550) 8 $0 $10,324 $10,324
$57,438N/A cfm $0 7 $0 $10,003N/A MBh $0 6 $0 $9,693 $9,693 NPV
($60,000)($40,000)($20,000)
$0 $20,000 $40,000 $60,000 $80,000
$100,000 $120,000 $140,000 $160,000
0 5 10 15 20
Net
Cas
h Fl
ow (E
nd o
f Yea
r)
Years
Simple Payback Graph
Issued February 1, 2011 97 Existing Hotels Energy Analysis - Green Engage/Solutions

Base CaseDomestic hot water load of 7.40 gallons/person/day.
Load calculated by assuming water fixtures exceeding IPC rates by 20%, and default usage by hotel guests.
Proposed ModificationsWater fixtures meet IPC rates, reducing the domestic
hot water load reduced to 6.16 gallons/person/day.
Individual Resource Calculations Install or Replace Immediately Existing Hotels Arid
1.2%Heat Rejection 0.0 0.0 0.0 0.0%Pumps 0.2 0.2 0.0 0.0%
HVAC Fans 495 0 495 0 0 0 0 0%
Space Heating - Gas 0.0 0.0 0.0 0.0%Space Cooling 2,253.7 2,253.7 0.0 0.0%
CO2 (lb/yr) 2,599,589 2,568,608 1.2%
3,622 3,598 0.6%Space Heating - Elec 336.0 336.0 0.0 0.0%
SO2 (lb/yr) 9,356 9,356 0.0%Lighting 1,835.9 1,835.9 0.0 0.0% NOX (lb/yr)
Water W-03 Meet IPC 2006 Maximum Flow Rates
Energy End-Use Benchmark Comparison Environmental Impact Analysis
Energy End-Use
Base Case Energy Use
Proposed Energy Use
Savings (+) / Loss (-)
Savings (+) / Loss (-)
MBtu/yr MBtu/yr MBtu/yr %
Emissions Base Case Proposed % Savings (+) / Loss (-)
2,599,589 2,568,608
1,500,000
2,000,000
2,500,000
3,000,000
lb/y
r
Annual CO2 Emissions
Financial Assumptions Total 8,080.0 7,814.6 265.4 3.3%Base Utilities - Gas 1,583.7 1,318.3 265.4 16.8%
- Install aerator on all bathroom faucets and low-flow shower heads
- Cost of each aerator is US$22.85 including common building labour rates- Aerator lifetime – 15 years
- Cost of each low-flow shower head is US$77.50 including plumber labour rates- Shower head lifetime – 10 years
3.3%
Receptacles - Gas 425.8 425.8 0.0 0.0%
HVAC Fans 495.0 495.0 0.0 0.0%Receptacles - Elec 1,149.8 1,149.8 0.0 0.0%
2,599,589 2,568,608
0
500,000
1,000,000
1,500,000
2,000,000
2,500,000
3,000,000
Base Case Proposed
lb/y
r
Annual CO2 Emissions
9,356
3,622
9,356
3,598
0
2,000
4,000
6,000
8,000
10,000
SO2 (lb/yr) NOX (lb/yr)
g/yr
Annual SO2 and NOX EmissionsBase Case
Proposed
8,080 7,815
01,0002,0003,0004,0005,0006,0007,0008,0009,000
Base Case Proposed
MBt
u/yr
Annual Total Energy Use
Issued February 1, 2011 98 Existing Hotels Energy Analysis - Green Engage/Solutions

Additional Capital CostHVAC Plant First Cost Reductions
Cooling Plant SavingsHeating Plant Savings
Individual Resource Calculations Install or Replace Immediately Existing Hotels Arid
($15,053)Capital Costs Savings Summary $5,933
Water W-03 Meet IPC 2006 Maximum Flow Rates
Cash FlowInitial Marginal Cost $15,053
$5,708
Annual Resource Cost Summary Financial Table Financial Results Summary
N/A MBh $0 6 $0 $6 819 $6 819N/A tons $0 5 $0 $6,613 $6,613
4 $0 $6,413 $6,413 First Year Yield On Marginal Cost 37.9%
40.1%IRR3 $0 $6,168 $6,1682 $0 $5,933
Water & sewer 838,836 Gals $0.0037 $3,104 0 ($15,053) $0 ($15,053)1 $0 $5,708 $5,708
Simple Payback 2.6 yrs
Natural gas 2,655 therms $0.9000 $2,389Electricity 0 kWh $0.1028 $0 Initial Annual Savings
ResourceAnnual Resource Savings
(+) / Loss (-) Unit CostAnnual Savings (+) /
Loss (-)Yr.
Costs (Marginal/Maint/
Replace)
Savings (+) / Loss (-)
Heating Plant SavingsAirside Distribution Savings
Total Additional Capital Cost:
Estimated Useful Life (yrs)Percent replacedReplacement Cost Premium (In 2010 Dollars)
Base YearValuation TypeProject Analysis PeriodInflation RateDiscount Rate for Defined ValuationEnergy Escalation Rate (Nominal)
cfm $0
(See Table in Assumptions)
12 $0 $8,198 $8,198
($15,053)N/A
7.19% 20 $0 $10,819 $10,8192.79% 19 $0 $10,464 $10,464
20 18 $0 $10,087 $10,087Defined 17 $0 $9,725 $9,725
2010 16 $0 $9,376 $9,376Financial Analysis 15 ($5,175) $9,041 $3,866
14 $0 $8,719 $8,71913 $0 $8,454 $8,454
11 $0 $7,950 $7,950Replacement Life and Cost Summary 10 ($15,300) $7,710 ($7,590)
9 $0 $7,476 $7,476
$7,0318 $0 $7,250 $7,250
$49,4327 $0
N/A MBh $0 6 $0 $6,819 $6,819 NPV$7,031
($3,428)100%
15
($11,625)100%
10
($40,000)($20,000)
$0 $20,000 $40,000 $60,000 $80,000
$100,000 $120,000 $140,000
0 5 10 15 20
Net
Cas
h Fl
ow (E
nd o
f Yea
r)
Years
Simple Payback Graph
Issued February 1, 2011 99 Existing Hotels Energy Analysis - Green Engage/Solutions

1 inch thick fibreglass insulation on all domestic hot water piping. 0.7%
0.2 0.0 0.0%
HVAC Fans 495 0 495 0 0 0 0 0%
Pumps 0.2Heat Rejection 0.0 0.0 0.0 0.0%
Proposed Modifications
3,622 3,603 0.5%Space Heating - Elec 336.0 336.0 0.0 0.0%
Insulation on domestic hot water piping is assumed to be of mixed thickness and condition, equivalent to 0.5
inch thick fibreglass insulation.
Space Heating - Gas 0.0 0.0 0.0 0.0%Space Cooling 2,253.7 2,232.0 21.7 1.0%
SO2 (lb/yr) 9,356 9,323 0.4%Lighting 1,835.9 1,835.9 0.0 0.0% NOX (lb/yr)
Energy End-Use
Base Case Energy Use
Proposed Energy Use
Savings (+) / Loss (-)
Savings (+) / Loss (-)
MBtu/yr MBtu/yr MBtu/yr %
Emissions Base Case Proposed % Savings (+) / Loss (-)
CO2 (lb/yr) 2,599,589 2,582,408 0.7%
Individual Resource Calculations Install or Replace Immediately Existing Hotels
Energy E-08 Pipe Insulation
Energy End-Use Benchmark Comparison Environmental Impact Analysis
Arid
Base Case
2,599,589 2,582,408
1,500,000
2,000,000
2,500,000
3,000,000
lb/y
r
Annual CO2 Emissions
Receptacles - Gas 425.8 425.8 0.0 0.0%
Financial Assumptions Total 8,080.0 7,983.4 96.6 1.2%- All pipe insulation is fiberglass with an all service jacket- Cost of insulation depends on width of pipe and thickness of insulation suggested as per Green Engage Energy Charts. Prices range from $4.71 to $12.85 including material, labour, overheard and profit.- Warm climates – insulation on hot water pipes only- Insulation Lifetime – 30 yearsNB: Assumes easy access to all piping within hotel - It does not include any demolition costs.
1.2%
Base Utilities - Gas 1,583.7 1,508.8
HVAC Fans 495.0 495.0 0.0 0.0%Receptacles - Elec 1,149.8 1,149.8 0.0 0.0%
74.9 4.7%
2,599,589 2,582,408
0
500,000
1,000,000
1,500,000
2,000,000
2,500,000
3,000,000
Base Case Proposed
lb/y
r
Annual CO2 Emissions
9,356
3,622
9,323
3,603
0
2,000
4,000
6,000
8,000
10,000
SO2 (lb/yr) NOX (lb/yr)
g/yr
Annual SO2 and NOX EmissionsBase Case
Proposed
8,080 7,983
01,0002,0003,0004,0005,0006,0007,0008,0009,000
Base Case Proposed
MBt
u/yr
Annual Total Energy Use
Issued February 1, 2011 100 Existing Hotels Energy Analysis - Green Engage/Solutions

Additional Capital CostHVAC Plant First Cost Reductions
Cooling Plant SavingsHeating Plant Savings N/A MBh $0 6 $0 $1 641 $1 641
N/A tons $0 5 $0 $1,587 $1,5874 $0 $1,536 $1,536 First Year Yield On Marginal Cost 9.0%
9.7%IRR($15,279) 3 $0 $1,480 $1,480
Capital Costs Savings Summary 2 $0 $1,427 $1,427
Water & sewer 0 Gals $0.0037 $0 0 ($15,279) $0 ($15,279)1 $0 $1,376 $1,376
Simple Payback 10 yrs
Natural gas 749 therms $0.9000 $674Electricity 6,347 kWh $0.1028 $652 Initial Annual Savings
Cash FlowInitial Marginal Cost $15,279
$1,376
Annual Resource Cost Summary Financial Table Financial Results Summary
ResourceAnnual Resource Savings
(+) / Loss (-) Unit CostAnnual Savings (+) /
Loss (-)Yr.
Costs (Marginal/Maint/
Replace)
Savings (+) / Loss (-)
Energy E-08 Pipe Insulation
Individual Resource Calculations Install or Replace Immediately Existing Hotels Arid
Heating Plant SavingsAirside Distribution Savings
Total Additional Capital Cost:
Estimated Useful Life (yrs)Percent replacedReplacement Cost Premium (In 2010 Dollars)
Base YearValuation TypeProject Analysis PeriodInflation RateDiscount Rate for Defined ValuationEnergy Escalation Rate (Nominal)
$2,52617
(See Table in Assumptions)
100% 12 $0 $2,004 $2,004
18 $0 $2,526
7.19% 20 $0 $2,736 $2,7362.79% 19 $0 $2,633 $2,633
Defined$2,326
Financial Analysis 15 $0 $2,233 $2,233
20
14 $0 $2,142 $2,142($15,279) 13 $0 $2,072 $2,072
$0 $2,424 $2,4242010 16 $0 $2,326
30 11 $0 $1,937 $1,937Replacement Life and Cost Summary 10 $0 $1,874 $1,874
9 $0 $1,812 $1,812
$1,696($15,279) 8 $0 $1,753 $1,753
$3,360N/A cfm $0 7 $0 $1,696N/A MBh $0 6 $0 $1,641 $1,641 NPV
($20,000)($15,000)($10,000)($5,000)
$0 $5,000
$10,000 $15,000 $20,000 $25,000 $30,000
0 5 10 15 20
Net
Cas
h Fl
ow (E
nd o
f Yea
r)
Years
Simple Payback Graph
Issued February 1, 2011 101 Existing Hotels Energy Analysis - Green Engage/Solutions

Corridor lighting load is reduced by 25% to 1.35 W/sf. The operating schedule remains unchanged. The reduction in load is based on US EPA predictions,
0.0%Heat Rejection 0.0 0.0 0.0 0.0%Pumps 0.2 0.2 0.0 0.0%
HVAC Fans 495 0 494 9 0 1 0 0%
Proposed Modifications
3,622 3,621 0.0%Space Heating - Elec 336.0 336.3 -0.3 -0.1%
Offices have a lighting density of 1.8 W/sf. Lights operate for 8 hours a day.
Space Heating - Gas 0.0 0.0 0.0 0.0%Space Cooling 2,253.7 2,253.1 0.6 0.0%
SO2 (lb/yr) 9,356 9,353 0.0%Lighting 1,835.9 1,834.3 1.6 0.1% NOX (lb/yr)
Energy End-Use
Base Case Energy Use
Proposed Energy Use
Savings (+) / Loss (-)
Savings (+) / Loss (-)
MBtu/yr MBtu/yr MBtu/yr %
Emissions Base Case Proposed % Savings (+) / Loss (-)
CO2 (lb/yr) 2,599,589 2,598,790 0.0%
Individual Resource Calculations Install or Replace Immediately Existing Hotels
Energy E-10 Occupancy Sensors in Offices
Energy End-Use Benchmark Comparison Environmental Impact Analysis
Arid
Base Case
2,599,589 2,598,790
1,500,000
2,000,000
2,500,000
3,000,000
lb/y
r
Annual CO2 Emissions
reduction in load is based on US EPA predictions, assuming the lighting turns off when unoccupied.
Financial Assumptions Total 8,080.0 8,077.9 2.1 0.0%Base Utilities - Gas 1,583.7 1,583.7 0.0 0.0%
- US$193 per sensor including electrician labour- Four offices per hotel building - Sensor lifetime – 10 years- Increase office bulb lifetime by 25%- Increase office light bulb lifetime by 25%- All 16 office light bulbs are assumed to already be CFLs
0.0%
Receptacles - Gas 425.8 425.8 0.0 0.0%
HVAC Fans 495.0 494.9 0.1 0.0%Receptacles - Elec 1,149.8 1,149.8 0.0 0.0%
2,599,589 2,598,790
0
500,000
1,000,000
1,500,000
2,000,000
2,500,000
3,000,000
Base Case Proposed
lb/y
r
Annual CO2 Emissions
9,356
3,622
9,353
3,621
0
2,000
4,000
6,000
8,000
10,000
SO2 (lb/yr) NOX (lb/yr)
g/yr
Annual SO2 and NOX EmissionsBase Case
Proposed
8,080 8,078
01,0002,0003,0004,0005,0006,0007,0008,0009,000
Base Case Proposed
MBt
u/yr
Annual Total Energy Use
Issued February 1, 2011 102 Existing Hotels Energy Analysis - Green Engage/Solutions

Additional Capital CostHVAC Plant First Cost Reductions
Cooling Plant SavingsHeating Plant Savings N/A MBh $0 6 $0 $87 $87
N/A tons $0 5 $0 $69 $694 $0 $67 $67 First Year Yield On Marginal Cost 8.2%
0.0%IRR($772) 3 $0 $80 $80
Capital Costs Savings Summary 2 $0 $64 $64
Water & sewer 0 Gals $0.0037 $0 0 ($772) $0 ($772)1 $0 $63 $63
Simple Payback 20 yrs
Natural gas 0 therms $0.9000 $0Electricity 601 kWh $0.1028 $62 Initial Annual Savings
Cash FlowInitial Marginal Cost $772
$63
Annual Resource Cost Summary Financial Table Financial Results Summary
ResourceAnnual Resource Savings
(+) / Loss (-) Unit CostAnnual Savings (+) /
Loss (-)Yr.
Costs (Marginal/Maint/
Replace)
Savings (+) / Loss (-)
Energy E-10 Occupancy Sensors in Offices
Individual Resource Calculations Install or Replace Immediately Existing Hotels Arid
Heating Plant SavingsAirside Distribution Savings
Total Additional Capital Cost:
Estimated Useful Life (yrs)Percent replacedReplacement Cost Premium (In 2010 Dollars)
Base YearValuation TypeProject Analysis PeriodInflation RateDiscount Rate for Defined ValuationEnergy Escalation Rate (Nominal)
$12817
(See Table in Assumptions)
100% 12 $0 $105 $105
18 $0 $128
7.19% 20 $0 $114 $1142.79% 19 $0 $109 $109
Defined$98
Financial Analysis 15 $0 $116 $116
20
14 $0 $92 $92($772) 13 $0 $89 $89
$0 $102 $1022010 16 $0 $98
10 11 $0 $83 $83Replacement Life and Cost Summary 10 ($1,016) $81 ($935)
9 $0 $95 $95
$73($772) 8 $0 $76 $76
-$382N/A cfm $0 7 $0 $73N/A MBh $0 6 $0 $87 $87 NPV
($1,200)
($1,000)
($800)
($600)
($400)
($200)
$0
$200
0 5 10 15 20
Net
Cas
h Fl
ow (E
nd o
f Yea
r)
Years
Simple Payback Graph
Issued February 1, 2011 103 Existing Hotels Energy Analysis - Green Engage/Solutions

One VFD (15 HP capacity) installed on VAV supply fan motor. 0.5%
Heat Rejection 0.0 0.0 0.0 0.0%Pumps 0.2 0.2 0.0 -2.3%
HVAC Fans 495 0 467 8 27 1 5 5%
Proposed Modifications
3,622 3,604 0.5%Space Heating - Elec 336.0 342.1 -6.1 -1.8%
Constant speed, standard efficiency motor on supply fan for VAV system serving the first floor and corridor
spaces (15 HP capacity).
Space Heating - Gas 0.0 0.0 0.0 0.0%Space Cooling 2,253.7 2,243.2 10.5 0.5%
SO2 (lb/yr) 9,356 9,307 0.5%Lighting 1,835.9 1,835.9 0.0 0.0% NOX (lb/yr)
Energy End-Use
Base Case Energy Use
Proposed Energy Use
Savings (+) / Loss (-)
Savings (+) / Loss (-)
MBtu/yr MBtu/yr MBtu/yr %
Emissions Base Case Proposed % Savings (+) / Loss (-)
CO2 (lb/yr) 2,599,589 2,587,308 0.5%
Individual Resource Calculations Install or Replace Immediately Existing Hotels
Mechanical M-11 Variable Frequency Drives
Energy End-Use Benchmark Comparison Environmental Impact Analysis
Arid
Base Case
2,599,589 2,587,308
1,500,000
2,000,000
2,500,000
3,000,000
lb/y
r
Annual CO2 Emissions
Financial Assumptions Total 8,080.0 8,048.4 31.5 0.4%Base Utilities - Gas 1,583.7 1,583.7 0.0 0.0%
VFDs only recommended on motors greater than 5HP.
- All four climate zones can install one 15 HP capable VFD for the supply fan motor- Cost of VFD is $2,868 including electrician installation rate- VFD lifetime – 10 years
0.4%
Receptacles - Gas 425.8 425.8 0.0 0.0%
HVAC Fans 495.0 467.8 27.1 5.5%Receptacles - Elec 1,149.8 1,149.8 0.0 0.0%
2,599,589 2,587,308
0
500,000
1,000,000
1,500,000
2,000,000
2,500,000
3,000,000
Base Case Proposed
lb/y
r
Annual CO2 Emissions
9,356
3,622
9,307
3,604
0
2,000
4,000
6,000
8,000
10,000
SO2 (lb/yr) NOX (lb/yr)
g/yr
Annual SO2 and NOX EmissionsBase Case
Proposed
8,080 8,048
01,0002,0003,0004,0005,0006,0007,0008,0009,000
Base Case Proposed
MBt
u/yr
Annual Total Energy Use
Issued February 1, 2011 104 Existing Hotels Energy Analysis - Green Engage/Solutions

Additional Capital CostHVAC Plant First Cost Reductions
Cooling Plant SavingsHeating Plant Savings
N/A tons $0 5 $0 $1,057 $1,057N/A MBh $0 6 $0 $1 091 $1 091
4 $0 $1,024 $1,024 First Year Yield On Marginal Cost 33.7%
33.8%IRR($2,868) 3 $0 $1,005 $1,005
Capital Costs Savings Summary 2 $0 $986 $9861 $0 $968 $968
($2,868) Simple Payback 3 yrsWater & sewer 0 Gals $0.0037 $0 0 ($2,868) $0
Cash FlowInitial Marginal Cost $2,868
$968Initial Annual Savings
Annual Resource Cost Summary Financial Table Financial Results Summary
ResourceAnnual Resource Savings
(+) / Loss (-) Unit CostAnnual Savings (+) /
Loss (-)Yr.
Costs (Marginal/Maint/
Replace)
Savings (+) / Loss (-)
Natural gas 0 therms $0.9000 $0Electricity 9,238 kWh $0.1028 $950
Mechanical M-11 Variable Frequency Drives
Individual Resource Calculations Install or Replace Immediately Existing Hotels Arid
Heating Plant SavingsAirside Distribution Savings
Total Additional Capital Cost:
Estimated Useful Life (yrs)Percent replacedReplacement Cost Premium (In 2010 Dollars)
Base YearValuation TypeProject Analysis PeriodInflation RateDiscount Rate for Defined ValuationEnergy Escalation Rate (Nominal) (See Table in Assumptions)
$1,32110 11 $0 $1,279 $1,279
Replacement Life and Cost Summary 10 ($3,775) $1,238
7.19% 20 $0 $1,746 $1,7462.79% 19 $0 $1,683 $1,683
20 18 $0 $1,624 $1,624Defined 17 $0 $1,568 $1,568
2010 16 $0 $1,513 $1,513Financial Analysis 15 $0 $1,461 $1,461
14 $0 $1,410 $1,410($2,868) 13 $0 $1,365 $1,365
100% 12 $0 $1,321
9 $0 $1,199 $1,199($2,868) 8 $0 $1,161 $1,161
$7,264
($2,537)
N/A cfm $0 7 $0 $1,125N/A MBh $0 6 $0 $1,091 $1,091 NPV
$1,125
($5,000)
$0
$5,000
$10,000
$15,000
$20,000
$25,000
0 5 10 15 20
Net
Cas
h Fl
ow (E
nd o
f Yea
r)
Years
Simple Payback Graph
Issued February 1, 2011 105 Existing Hotels Energy Analysis - Green Engage/Solutions

VAV supply fan motor replaced with NEMA premium efficiency motor (15 HP capacity). 0.1%
Heat Rejection 0.0 0.0 0.0 0.0%Pumps 0.2 0.2 0.0 0.0%
HVAC Fans 495 0 491 5 3 4 0 7%
Proposed Modifications
3,622 3,619 0.1%Space Heating - Elec 336.0 336.5 -0.5 -0.2%
Constant speed, standard efficiency motor on supply fan for VAV system serving the first floor and corridor
spaces (15 HP capacity).
Space Heating - Gas 0.0 0.0 0.0 0.0%Space Cooling 2,253.7 2,252.0 1.7 0.1%
SO2 (lb/yr) 9,356 9,349 0.1%Lighting 1,835.9 1,835.9 0.0 0.0% NOX (lb/yr)
Energy End-Use
Base Case Energy Use
Proposed Energy Use
Savings (+) / Loss (-)
Savings (+) / Loss (-)
MBtu/yr MBtu/yr MBtu/yr %
Emissions Base Case Proposed % Savings (+) / Loss (-)
CO2 (lb/yr) 2,599,589 2,597,804 0.1%
Individual Resource Calculations Install or Replace Immediately Existing Hotels
Mechanical M-11 NEMA Premium Efficiency Motors
Energy End-Use Benchmark Comparison Environmental Impact Analysis
Arid
Base Case
2,599,589 2,597,804
1,500,000
2,000,000
2,500,000
3,000,000
lb/y
r
Annual CO2 Emissions
Financial Assumptions Total 8,080.0 8,075.4 4.6 0.1%Base Utilities - Gas 1,583.7 1,583.7 0.0 0.0%
NB: demolition costs are not includedAll four climates can install a 15 HP NEMA efficiency motor on the supply fan. - 15 HP NEMA efficiency motor is $1,482- 15 HP normal motor is $1,195- Cost Premium of $287 0.1%
Receptacles - Gas 425.8 425.8 0.0 0.0%
HVAC Fans 495.0 491.5 3.4 0.7%Receptacles - Elec 1,149.8 1,149.8 0.0 0.0%
2,599,589 2,597,804
0
500,000
1,000,000
1,500,000
2,000,000
2,500,000
3,000,000
Base Case Proposed
lb/y
r
Annual CO2 Emissions
9,356
3,622
9,349
3,619
0
2,000
4,000
6,000
8,000
10,000
SO2 (lb/yr) NOX (lb/yr)
g/yr
Annual SO2 and NOX EmissionsBase Case
Proposed
8,080 8,075
01,0002,0003,0004,0005,0006,0007,0008,0009,000
Base Case Proposed
MBt
u/yr
Annual Total Energy Use
Issued February 1, 2011 106 Existing Hotels Energy Analysis - Green Engage/Solutions

Additional Capital CostHVAC Plant First Cost Reductions
Cooling Plant SavingsHeating Plant Savings
N/A tons $0 5 $0 $154 $154N/A MBh $0 6 $0 $159 $159
4 $0 $149 $149 First Year Yield On Marginal Cost 15.9%
16.7%IRR($885) 3 $0 $146 $146
Capital Costs Savings Summary 2 $0 $143 $1431 $0 $141 $141
($885) Simple Payback 6 yrsWater & sewer 0 Gals $0.0037 $0 0 ($885) $0
Cash FlowInitial Marginal Cost $885
$141Initial Annual Savings
Annual Resource Cost Summary Financial Table Financial Results Summary
ResourceAnnual Resource Savings
(+) / Loss (-) Unit CostAnnual Savings (+) /
Loss (-)Yr.
Costs (Marginal/Maint/
Replace)
Savings (+) / Loss (-)
Natural gas 0 therms $0.9000 $0Electricity 1,343 kWh $0.1028 $138
Mechanical M-11 NEMA Premium Efficiency Motors
Individual Resource Calculations Install or Replace Immediately Existing Hotels Arid
Heating Plant SavingsAirside Distribution Savings
Total Additional Capital Cost:
Estimated Useful Life (yrs)Percent replacedReplacement Cost Premium (In 2010 Dollars)
Base YearValuation TypeProject Analysis PeriodInflation RateDiscount Rate for Defined ValuationEnergy Escalation Rate (Nominal) (See Table in Assumptions)
$19215 11 $0 $186 $186
Replacement Life and Cost Summary 10 $0 $180
7.19% 20 $0 $254 $2542.79% 19 $0 $245 $245
20 18 $0 $236 $236Defined 17 $0 $228 $228
2010 16 $0 $220 $220Financial Analysis 15 ($433) $212 ($221)
14 $0 $205 $205($287) 13 $0 $198 $198100% 12 $0 $192
9 $0 $174 $174($885) 8 $0 $169 $169
$733
$180
N/A cfm $0 7 $0 $164N/A MBh $0 6 $0 $159 $159 NPV
$164
($1,500)($1,000)
($500)$0
$500 $1,000 $1,500 $2,000 $2,500 $3,000
0 5 10 15 20
Net
Cas
h Fl
ow (E
nd o
f Yea
r)
Years
Simple Payback Graph
Issued February 1, 2011 107 Existing Hotels Energy Analysis - Green Engage/Solutions

Individual Resource Calculations Install or Replace Immediately Existing Hotels Arid
Cumulative Scenario Green Engage Lvl 1: All Measures Installed or Replaced Now
Base Case Energy End-Use Benchmark Comparison Environmental Impact AnalysisAs detailed in individual measures
Energy End-Use
Base Case Energy Use
Proposed Energy Use
Savings (+) / Loss (-)
Savings (+) / Loss (-)
MBtu/yr MBtu/yr MBtu/yr %
Emissions Base Case Proposed % Savings (+) / Loss (-)
CO2 (lb/yr) 2,599,122 2,007,279 22.8%
3,621 2,793 22.9%Space Heating - Elec 336.0 301.3 34.6 10.3%
SO2 (lb/yr) 9,356 7,204 23.0%Lighting 1,835.9 1,098.9 737.1 40.1% NOX (lb/yr)
Space Heating - Gas 0.0 0.0 0.0 0.0%Proposed Modifications Space Cooling 2,253.7 1,839.7 414.0 18.4%
As detailed in individual measures Pumps 0.2 0.2 0.0 -9.1%
HVAC Fans 495 0 471 9 23 0 4 7%
22.8%Heat Rejection 0.0 0.0 0.0 0.0%
2,599,122
2,007,279
1,500,000
2,000,000
2,500,000
3,000,000
lb/y
r
Annual CO2 Emissions
HVAC Fans 495.0 471.9 23.0 4.7%Receptacles - Elec 1,149.8 962.3 187.5 16.3%Receptacles - Gas 421.8 277.1 144.7 34.3%Base Utilities - Gas 1,583.7 1,318.2 265.5 16.8%
All financial assumptions remain the same as in each individual measure.
22.4%
Financial Assumptions Total 8,076.0 6,269.5 1,806.4 22.4%
2,599,122
2,007,279
0
500,000
1,000,000
1,500,000
2,000,000
2,500,000
3,000,000
Base Case Proposed
lb/y
r
Annual CO2 Emissions
9,356
3,621
7,204
2,793
0
2,000
4,000
6,000
8,000
10,000
SO2 (lb/yr) NOX (lb/yr)
g/yr
Annual SO2 and NOX EmissionsBase Case
Proposed
8,076
6,270
01,0002,0003,0004,0005,0006,0007,0008,0009,000
Base Case Proposed
MBt
u/yr
Annual Total Energy Use
Issued February 1, 2011 108 Existing Hotels Energy Analysis - Green Engage/Solutions
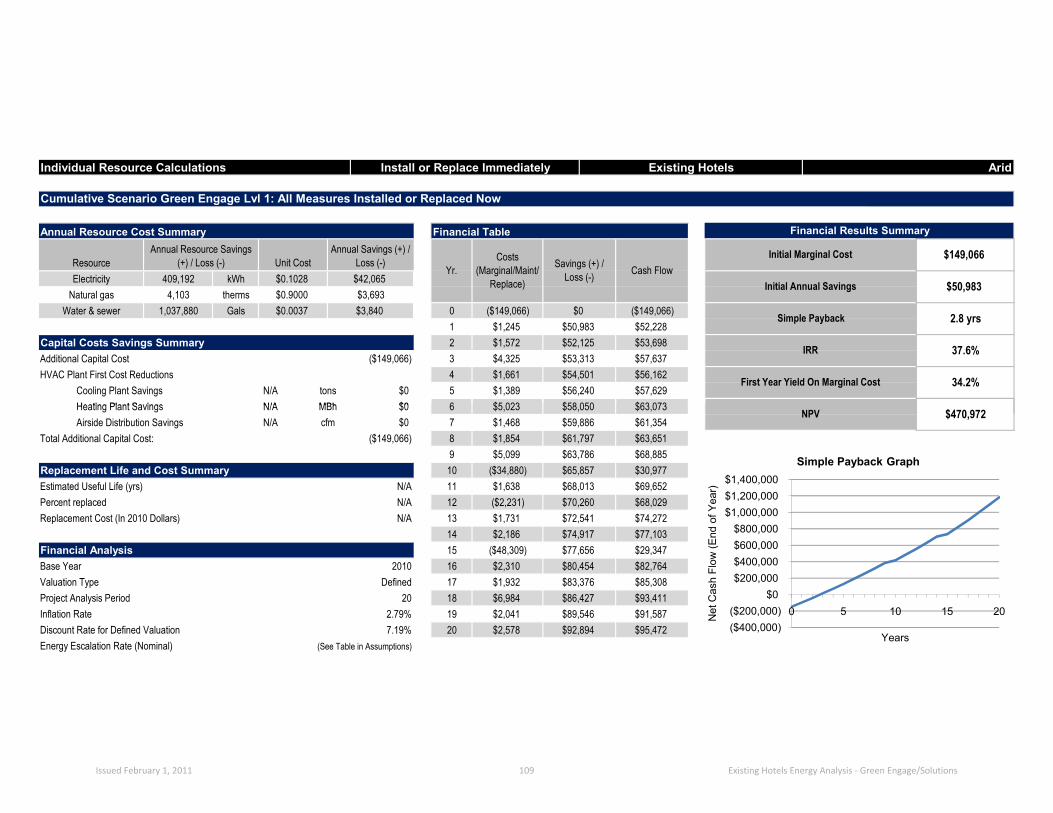
Additional Capital CostHVAC Plant First Cost Reductions
Cooling Plant SavingsHeating Plant Savings
Individual Resource Calculations Install or Replace Immediately Existing Hotels Arid
Cumulative Scenario Green Engage Lvl 1: All Measures Installed or Replaced Now
Annual Resource Cost Summary Financial Table Financial Results Summary
ResourceAnnual Resource Savings
(+) / Loss (-) Unit CostAnnual Savings (+) /
Loss (-)Yr.
Costs (Marginal/Maint/
Replace)Electricity 409,192 kWh $0.1028 $42,065Savings (+) /
Loss (-) Cash FlowInitial Marginal Cost $149,066
Water & sewer 1,037,880 Gals $0.0037 $3,840 0Natural gas 4,103 therms $0.9000 $3,693
Initial Annual Savings $50,983
($149,066) $0 ($149,066) Simple Payback 2.8 yrs
Capital Costs Savings Summary 2 $1,572 $52,125 $53,698 IRR 37.6%($149,066) 3 $4,325 $53,313 $57,637
1 $1,245 $50,983 $52,228
N/A tons $0 5 $1,389 $56,240 $57,6294 $1,661 $54,501 $56,162 First Year Yield On Marginal Cost 34.2%
N/A MBh $0 6 $5 023 $58 050 $63 073Heating Plant SavingsAirside Distribution Savings
Total Additional Capital Cost:
Estimated Useful Life (yrs)Percent replacedReplacement Cost (In 2010 Dollars)
Base YearValuation TypeProject Analysis PeriodInflation RateDiscount Rate for Defined ValuationEnergy Escalation Rate (Nominal)
N/A cfm $0 7 $1,468N/A MBh $0 6 $5,023 $58,050 $63,073
$59,886 $61,354($149,066) 8 $1,854 $61,797 $63,651
NPV $470,972
9 $5,099 $63,786 $68,885
N/A 11 $1,638 $68,013 $69,652Replacement Life and Cost Summary 10 ($34,880) $65,857 $30,977
N/A 13 $1,731 $72,541 $74,272N/A 12 ($2,231) $70,260 $68,029
14 $2,186 $74,917 $77,103
2010 16 $2,310 $80,454 $82,764Financial Analysis 15 ($48,309) $77,656 $29,347
20 18 $6,984 $86,427 $93,411Defined 17 $1,932 $83,376 $85,308
7.19% 20 $2,578 $92,894 $95,4722.79% 19 $2,041 $89,546 $91,587
(See Table in Assumptions)
($400,000)($200,000)
$0 $200,000 $400,000 $600,000 $800,000
$1,000,000 $1,200,000 $1,400,000
0 5 10 15 20Net
Cas
h Fl
ow (E
nd o
f Yea
r)
Years
Simple Payback Graph
Issued February 1, 2011 109 Existing Hotels Energy Analysis - Green Engage/Solutions

Individual Resource Calculations Install or Replace Immediately Existing Hotels Arid
Base Case Energy End-Use Benchmark Comparison Environmental Impact Analysis
Cumulative Scenario Green Engage Lvl 2: All Measures Installed or Replaced Now
444.1 19.7%As detailed in individual measures Pumps 0.2 0.2 0.0 -6.8%
HVAC Fans 495 0 443 9 51 1
As detailed in individual measures
Energy End-Use
Base Case Energy Use
Proposed Energy Use
Savings (+) / Loss (-)
Savings (+) / Loss (-)
MBtu/yr MBtu/yr MBtu/yr %
Emissions Base Case Proposed % Savings (+) / Loss (-)
Space Heating - Gas 0.0 0.0 0.0 0.0%Proposed Modifications Space Cooling 2,253.7 1,809.6
CO2 (lb/yr) 2,599,122 1,979,506 23.8%
3,621 2,758 23.8%Space Heating - Elec 336.0 309.1 26.9 8.0%
SO2 (lb/yr) 9,356 7,124 23.9%Lighting 1,835.9 1,097.3 738.7 40.2% NOX (lb/yr)
10 3%
23.8%Heat Rejection 0.0 0.0 0.0 0.0%
2,599,122
1,979,506
1,500,000
2,000,000
2,500,000
3,000,000
lb/y
r
Annual CO2 Emissions
HVAC Fans 495.0 443.9 51.1 10.3%Receptacles - Elec 1,149.8 962.3 187.5 16.3%Receptacles - Gas 421.8 277.1 144.7 34.3%Base Utilities - Gas 1,583.7 1,254.0 329.7 20.8%
All financial assumptions remain the same as in each individual measure.
23.8%
Financial Assumptions Total 8,076.0 6,153.3 1,922.7 23.8%
2,599,122
1,979,506
0
500,000
1,000,000
1,500,000
2,000,000
2,500,000
3,000,000
Base Case Proposed
lb/y
r
Annual CO2 Emissions
9,356
3,621
7,124
2,758
0
2,000
4,000
6,000
8,000
10,000
SO2 (lb/yr) NOX (lb/yr)
g/yr
Annual SO2 and NOX EmissionsBase Case
Proposed
8,076
6,153
01,0002,0003,0004,0005,0006,0007,0008,0009,000
Base Case Proposed
MBt
u/yr
Annual Total Energy Use
Issued February 1, 2011 110 Existing Hotels Energy Analysis - Green Engage/Solutions

Additional Capital CostHVAC Plant First Cost Reductions
Cooling Plant SavingsHeating Plant Savings
Individual Resource Calculations Install or Replace Immediately Existing Hotels Arid
Cumulative Scenario Green Engage Lvl 2: All Measures Installed or Replaced Now
Annual Resource Cost Summary Financial Table Financial Results Summary
ResourceAnnual Resource Savings
(+) / Loss (-) Unit CostAnnual Savings (+) /
Loss (-)Yr.
Costs (Marginal/Maint/
Replace)
Savings (+) / Loss (-)
Natural gas 4,745 therms $0.9000 $4,271Electricity 424,446 kWh $0.1028 $43,633
Cash FlowInitial Marginal Cost $168,869
$53,190Initial Annual Savings
($168,869) Simple Payback 3 yrsWater & sewer 1,037,880 Gals $0.0037 $3,840 0 ($168,869) $0
($168,869) 3 $4,325 $55,649 $59,973Capital Costs Savings Summary 2 $1,572 $54,396 $55,968
1 $1,245 $53,190 $54,435
4 $1,661 $56,905 $58,566 First Year Yield On Marginal Cost 31.5%
34.7%IRR
N/A tons $0 5 $1,389 $58,723 $60,112N/A MBh $0 6 $5 023 $60 615 $65 638Heating Plant Savings
Airside Distribution SavingsTotal Additional Capital Cost:
Estimated Useful Life (yrs)Percent replacedReplacement Cost (In 2010 Dollars)
Base YearValuation TypeProject Analysis PeriodInflation RateDiscount Rate for Defined ValuationEnergy Escalation Rate (Nominal)
N/A cfm $0 7 $1,468 $62,535N/A MBh $0 6 $5,023 $60,615 $65,638 NPV
$64,003($168,869) 8 $1,854 $64,533 $66,387
$477,648
9 $5,099 $66,612 $71,712
N/A 11 $1,638 $71,033 $72,671Replacement Life and Cost Summary 10 ($39,670) $68,778 $29,107
N/A 13 $1,731 $75,767 $77,498N/A 12 ($2,231) $73,380 $71,150
14 $2,186 $78,251 $80,437
2010 16 $2,310 $84,056 $86,365Financial Analysis 15 ($48,742) $81,121 $32,379
20 18 $6,984 $90,318 $97,302Defined 17 $1,932 $87,119 $89,051
7.19% 20 $2,578 $97,095 $99,6722.79% 19 $2,041 $93,590 $95,631
(See Table in Assumptions)
($400,000)($200,000)
$0 $200,000 $400,000 $600,000 $800,000
$1,000,000 $1,200,000 $1,400,000
0 5 10 15 20
Net
Cas
h Fl
ow (E
nd o
f Yea
r)
Years
Simple Payback Graph
Issued February 1, 2011 111 Existing Hotels Energy Analysis - Green Engage/Solutions

Arid: Replace at End of Lifetime
Issued February 1, 2011 112 Existing Hotels Energy Analysis - Green Engage/Solutions

InstallReplaceReplaceReplaceReplaceReplaceReplaceInstallInstallInstallInstall
N/A
E-09
$20,386
CO2 Reductions First Year Yield On Marginal Cost
NPV(Over 20 Years)
yrsInstall New or
Replace
Immediate
N/A
% %
$56,395
N/A
N/A N/A0.7% N/A
1.2 yrs
Use of Building Appropriate Materials
N/A $17,9572.2%
100% of Guest Rooms have 4F Deadband Thermostats
Simple Payback IRR
Immediate
%
N/A
Occupancy Sensors in Corridors for Decorative Fixtures
Energy Modelling Results Summary Replace at End of Lifetime Existing HotelsThe table below summarises the overall energy and financial performance for the modelled existing hotel in the arid climate zone against the baseline building. Energy savings for a specific building may vary based on that building's parameters and financial results may also vary based on local costs and financing structures. For details regarding each measure refer to the individual calculation pages immediately following this page. For detailed assumptions relating to the energy model, utilities, emission factors, financial inputs, cost of capital, etc refer to the assumptions section of this book.Note: CO2 reduction percentages closely match both source energy reductions and annual energy saving cost reductions. Due to different modelling methodologies existing hotel and new hotel CO2 reduction percentages cannot be compared against each other. The stoplight colour legend contained below refers solely to simple payback periods.
AridWest Palm Beach, FL
Immediate 8.6% N/A N/A $224,812
O-04E-07E-07 Energy Efficient TVs
Towel/Sheet Program
0.8% N/A89.3%92.2%
Relevant Action Group Measure
Zero Use of Incandescent Lamps in Guest Rooms
Green Engage Level 1 Certification
Energy Efficient Guest Room Refrigerators
Meet IPC 2006 Maximum Flow Rates
Immediate
2.2%
E-09
N/A
E-07
E-10
Arid
Immediate $57,295E-09
B-04M-09W-03
Zero Use of Incandescent Lamps in Back of House Spaces
0.8%
$
$19,834Energy Efficient Appliances
Zero Use of Incandescent Lamps in Circulation Spaces
InstallInstallInstall
Replace
N/A
N/A
Legend (Criteria Based On Simple Payback Only):Very Short or Immediate Payback (0 - 3 years)Intermediate Payback (3 - 7 years)Long or No Payback (>7 years)
$1,290
Green Engage Level 2 Certification
0.1% 49.0%Variable Frequency Drives
Pipe Insulation
NEMA Premium Efficiency Motors
E-08
Green Engage Level 1 Certification Cumulative Savings Scenarios
$555,479
N/A
$548,246Install All New Measures Immediately &Replace Existing Measures At End of Lifetime 1.3 yrs 22.8% 81.4% 76.4%
M-11M-11E-10
51.2%2.1 yrs
Occupancy Sensors in Offices
Green Engage Level 2 Certification Cumulative Savings Scenarios (Includes Green Engage Level 1)Install All New Measures Immediately &Replace Existing Measures At End of Lifetime 1.6 yrs 23.9% 66.4% 61.9%
Issued February 1, 2011 113 Existing Hotels Energy Analysis - Green Engage/Solutions

Ari
All appliances replaced with Energy Star rated equivalents. Overall saving of 30% on electricity and
34% on natural gas.
Proposed Modifications
Individual Resource Calculations Replace at End of Lifetime Existing Hotels
Energy E-07 Energy Efficient Appliances
Energy End-Use Benchmark Comparison Environmental Impact Analysis
Arid
Base Case
Energy End-Use
Base Case Energy Use
Proposed Energy Use
Savings (+) / Loss (-)
Savings (+) / Loss (-)
MBtu/yr MBtu/yr MBtu/yr %
The following commercial, non-Energy Star appliances located in the food preparation and laundry areas: 3 washing machines, 2 dishwashers, 4 gas ovens, 2
fridges, 2 freezers, 2 icemakers and 5 vending machines
Emissions Base Case Proposed % Savings (+) / Loss (-)
CO2 (lb/yr) 2,599,589 2,541,632 2.2%
3,622 3,549 2.0%Space Heating - Elec 336.0 340.1 -4.2 -1.2%
SO2 (lb/yr) 9,356 9,194 1.7%Lighting 1,835.9 1,835.9 0.0 0.0% NOX (lb/yr)
Space Heating - Gas 0.0 0.0 0.0 0.0%Space Cooling 2,253.7 2,245.3 8.4 0.4%
HVAC Fans 495 0 494 0 1 0 0 2%
2.2%Heat Rejection 0.0 0.0 0.0 0.0%Pumps 0.2 0.2 0.0 -2.3%
2,599,589 2,541,632
1,500,000
2,000,000
2,500,000
3,000,000
lb/y
r
Annual CO2 Emissions
34% on natural gas. HVAC Fans 495.0 494.0 1.0 0.2%Receptacles - Elec 1,149.8 1,050.1 99.7 8.7%
Base Utilities - Gas 1,583.7 1,583.7 0.0 0.0%
- Basket of commercial appliances that have an energy star rating- Total weighted basket cost of US$79,451 and a weighted cost premium of US$5,864- Average lifetime of 12 years- Appliances include 3 washing machines, 2 dishwashers, 4 gas ovens, 2 fridges, 2 freezers, 2 icemakers and 5 vending machines
3.1%
Receptacles - Gas 425.8 279.4 146.4 34.4%
Financial Assumptions Total 8,080.0 7,828.7 251.3 3.1%
2,599,589 2,541,632
0
500,000
1,000,000
1,500,000
2,000,000
2,500,000
3,000,000
Base Case Proposed
lb/y
r
Annual CO2 Emissions
9,356
3,622
9,194
3,549
0
2,000
4,000
6,000
8,000
10,000
SO2 (lb/yr) NOX (lb/yr)
g/yr
Annual SO2 and NOX EmissionsBase Case
Proposed
8,080 7,829
01,0002,0003,0004,0005,0006,0007,0008,0009,000
Base Case Proposed
MBt
u/yr
Annual Total Energy Use
Issued February 1, 2011 114 Existing Hotels Energy Analysis - Green Engage/Solutions

Additional Capital CostHVAC Plant First Cost Reductions
Cooling Plant SavingsHeating Plant Savings
Energy E-07 Energy Efficient Appliances
Individual Resource Calculations Replace at End of Lifetime Existing Hotels Arid
Annual Resource Cost Summary Financial Table Financial Results Summary
ResourceAnnual Resource Savings
(+) / Loss (-) Unit CostAnnual Savings (+) /
Loss (-)Yr.
Costs (Marginal/Maint/
Replace)
Savings (+) / Loss (-) Cash Flow
Initial Marginal Cost $5,864
$5,235Natural gas 1,464 therms $0.9000 $1,318Electricity 30,742 kWh $0.1028 $3,160 Initial Annual Savings
Water & sewer 164,438 Gals $0.0037 $608 0 ($5,864) $0 ($5,864)1 $0 $5,235 $5,235
Simple Payback 1.2 yrs
($5,864) 3 $0 $5,548 $5,548Capital Costs Savings Summary 2 $0 $5,388 $5,388
4 $0 $5,713 $5,713 First Year Yield On Marginal Cost 89.3%
92.2%IRR
N/A MBh $0 6 $0 $6 089 $6 089N/A tons $0 5 $0 $5,898 $5,898
Heating Plant SavingsAirside Distribution Savings
Total Additional Capital Cost:
Estimated Useful Life (yrs)Percent replacedReplacement Cost Premium (In 2010 Dollars)
Base YearValuation TypeProject Analysis PeriodInflation RateDiscount Rate for Defined ValuationEnergy Escalation Rate (Nominal)
N/A cfm $0 7 $0 $6,286N/A MBh $0 6 $0 $6,089 $6,089 NPV
($5,864) 8 $0 $6,489 $6,489
$56,395
9 $0 $6,700 $6,700
$6,286
12 11 $0 $7,149 $7,149Replacement Life and Cost Summary 10 $0 $6,920 $6,920
14 $0 $7,880 $7,880($5,864) 13 $0 $7,628 $7,628
2010 16 $0 $8,495 $8,495Financial Analysis 15 $0 $8,181 $8,181
20 18 $0 $9,159 $9,159Defined 17 $0 $8,821 $8,821
7.19% 20 $0 $9,868 $9,8682.79% 19 $0 $9,511 $9,511
(See Table in Assumptions)
100% 12 ($8,154) $7,384 ($769)
($20,000)$0
$20,000 $40,000 $60,000 $80,000
$100,000 $120,000 $140,000
0 5 10 15 20Net
Cas
h Fl
ow (E
nd o
f Yea
r)
Years
Simple Payback Graph
Issued February 1, 2011 115 Existing Hotels Energy Analysis - Green Engage/Solutions

Ari
Television is replaced with Energy Star rated equivalent. Overall saving of 40% on electricity.
Proposed Modifications
Individual Resource Calculations Replace at End of Lifetime Existing Hotels
Energy E-07 Energy Efficient Televisions
Energy End-Use Benchmark Comparison Environmental Impact Analysis
Arid
Base Case
Energy End-Use
Base Case Energy Use
Proposed Energy Use
Savings (+) / Loss (-)
Savings (+) / Loss (-)
MBtu/yr MBtu/yr MBtu/yr %
One 32 inch non-Energy Star television per guest room. Emissions Base Case Proposed % Savings (+) /
Loss (-)CO2 (lb/yr) 2,599,589 2,578,769 0.8%
3,622 3,591 0.8%Space Heating - Elec 336.0 342.8 -6.9 -2.0%
SO2 (lb/yr) 9,356 9,274 0.9%Lighting 1,835.9 1,835.9 0.0 0.0% NOX (lb/yr)
Space Heating - Gas 0.0 0.0 0.0 0.0%Space Cooling 2,253.7 2,237.5 16.2 0.7%
HVAC Fans 495 0 492 5 2 4 0 5%
0.8%Heat Rejection 0.0 0.0 0.0 0.0%Pumps 0.2 0.2 0.0 0.0%
2,599,589 2,578,769
1,500,000
2,000,000
2,500,000
3,000,000
lb/y
r
Annual CO2 Emissions
HVAC Fans 495.0 492.5 2.4 0.5%Receptacles - Elec 1,149.8 1,108.1 41.7 3.6%
Base Utilities - Gas 1,583.7 1,583.7 0.0 0.0%
- 150, 32 inch energy star televisions- US$400 average outright cost per unit (including bulk discount)- US$0 cost premium over non-energy star TVs- Average lifetime - 10 years
0.7%
Receptacles - Gas 425.8 425.8 0.0 0.0%
Financial Assumptions Total 8,080.0 8,026.5 53.4 0.7%
2,599,589 2,578,769
0
500,000
1,000,000
1,500,000
2,000,000
2,500,000
3,000,000
Base Case Proposed
lb/y
r
Annual CO2 Emissions
9,356
3,622
9,274
3,591
0
2,000
4,000
6,000
8,000
10,000
SO2 (lb/yr) NOX (lb/yr)
g/yr
Annual SO2 and NOX EmissionsBase Case
Proposed
8,080 8,027
01,0002,0003,0004,0005,0006,0007,0008,0009,000
Base Case Proposed
MBt
u/yr
Annual Total Energy Use
Issued February 1, 2011 116 Existing Hotels Energy Analysis - Green Engage/Solutions

Additional Capital CostHVAC Plant First Cost Reductions
Cooling Plant SavingsHeating Plant Savings
Energy E-07 Energy Efficient Televisions
Individual Resource Calculations Replace at End of Lifetime Existing Hotels Arid
Annual Resource Cost Summary Financial Table Financial Results Summary
ResourceAnnual Resource Savings
(+) / Loss (-) Unit CostAnnual Savings (+) /
Loss (-)Yr.
Costs (Marginal/Maint/
Replace)
Savings (+) / Loss (-) Cash Flow
Initial Marginal Cost $0
$1,641Natural gas 0 therms $0.9000 $0Electricity 15,662 kWh $0.1028 $1,610 Initial Annual Savings
Water & sewer 0 Gals $0.0037 $0 0 $0 $0 $01 $0 $1,641 $1,641
Simple Payback Immediate
$0 3 $0 $1,704 $1,704Capital Costs Savings Summary 2 $0 $1,672 $1,672
4 $0 $1,736 $1,736 First Year Yield On Marginal Cost N/A
N/AIRR
N/A MBh $0 6 $0 $1 849 $1 849N/A tons $0 5 $0 $1,791 $1,791
Heating Plant SavingsAirside Distribution Savings
Total Additional Capital Cost:
Estimated Useful Life (yrs)Percent replacedReplacement Cost Premium (In 2010 Dollars)
Base YearValuation TypeProject Analysis PeriodInflation RateDiscount Rate for Defined ValuationEnergy Escalation Rate (Nominal)
N/A cfm $0 7 $0 $1,908N/A MBh $0 6 $0 $1,849 $1,849 NPV
$0 8 $0 $1,969 $1,969
$19,834
9 $0 $2,032 $2,032
$1,908
10 11 $0 $2,168 $2,168Replacement Life and Cost Summary 10 $0 $2,099 $2,099
14 $0 $2,390 $2,390$0 13 $0 $2,314 $2,314
2010 16 $0 $2,565 $2,565Financial Analysis 15 $0 $2,476 $2,476
20 18 $0 $2,753 $2,753Defined 17 $0 $2,658 $2,658
7.19% 20 $0 $2,961 $2,9612.79% 19 $0 $2,853 $2,853
(See Table in Assumptions)
100% 12 $0 $2,240 $2,240
$0 $5,000
$10,000 $15,000 $20,000 $25,000 $30,000 $35,000 $40,000 $45,000 $50,000
0 5 10 15 20
Net
Cas
h Fl
ow (E
nd o
f Yea
r)
Years
Simple Payback Graph
Issued February 1, 2011 117 Existing Hotels Energy Analysis - Green Engage/Solutions

Ari
Base CaseOne 3 cu. ft. non-Energy Star refrigerator per guest
room.
Refrigerator is replaced with Energy Star rated equivalent. Overall saving of 24% on electricity.
Proposed Modifications
Individual Resource Calculations Replace at End of Lifetime Existing Hotels
Energy E-07 Energy Efficient Guest Room Refrigerators
Energy End-Use Benchmark Comparison Environmental Impact Analysis
Arid
Energy End-Use
Base Case Energy Use
Proposed Energy Use
Savings (+) / Loss (-)
Savings (+) / Loss (-)
MBtu/yr MBtu/yr MBtu/yr %
Emissions Base Case Proposed % Savings (+) / Loss (-)
CO2 (lb/yr) 2,599,589 2,578,189 0.8%
3,622 3,591 0.9%Space Heating - Elec 336.0 343.0 -7.1 -2.1%
SO2 (lb/yr) 9,356 9,271 0.9%Lighting 1,835.9 1,835.9 0.0 0.0% NOX (lb/yr)
Space Heating - Gas 0.0 0.0 0.0 0.0%Space Cooling 2,253.7 2,237.0 16.7 0.7%
HVAC Fans 495 0 492 5 2 4 0 5%
0.8%Heat Rejection 0.0 0.0 0.0 0.0%Pumps 0.2 0.2 0.0 0.0%
2,599,589 2,578,189
1,500,000
2,000,000
2,500,000
3,000,000
lb/y
r
Annual CO2 Emissions
HVAC Fans 495.0 492.5 2.4 0.5%Receptacles - Elec 1,149.8 1,106.9 42.9 3.7%
Base Utilities - Gas 1,583.7 1,583.7 0.0 0.0%
- Medium sized bar fridge at 3 cu. ft.- Average Energy Star cost per unit - US$120 (online average price minus 20% bulk discount)- Cost Premium - US$0- Average Lifetime – 12 years
0.7%
Receptacles - Gas 425.8 425.8 0.0 0.0%
Financial Assumptions Total 8,080.0 8,025.0 54.9 0.7%
2,599,589 2,578,189
0
500,000
1,000,000
1,500,000
2,000,000
2,500,000
3,000,000
Base Case Proposed
lb/y
r
Annual CO2 Emissions
9,356
3,622
9,271
3,591
0
2,000
4,000
6,000
8,000
10,000
SO2 (lb/yr) NOX (lb/yr)
g/yr
Annual SO2 and NOX EmissionsBase Case
Proposed
8,080 8,025
01,0002,0003,0004,0005,0006,0007,0008,0009,000
Base Case Proposed
MBt
u/yr
Annual Total Energy Use
Issued February 1, 2011 118 Existing Hotels Energy Analysis - Green Engage/Solutions

Additional Capital CostHVAC Plant First Cost Reductions
Cooling Plant SavingsHeating Plant Savings
Energy E-07 Energy Efficient Guest Room Refrigerators
Individual Resource Calculations Replace at End of Lifetime Existing Hotels Arid
Annual Resource Cost Summary Financial Table Financial Results Summary
ResourceAnnual Resource Savings
(+) / Loss (-) Unit CostAnnual Savings (+) /
Loss (-)Yr.
Costs (Marginal/Maint/
Replace)
Savings (+) / Loss (-)
Natural gas 0 therms $0.9000 $0Electricity 16,098 kWh $0.1028 $1,655
Cash FlowInitial Marginal Cost $0
$1,686Initial Annual Savings
Water & sewer 0 Gals $0.0037 $0 0 $0 $01 $0 $1,686 $1,686
$0 Simple Payback Immediate
$0 3 $0 $1,751 $1,751Capital Costs Savings Summary 2 $0 $1,718 $1,718
4 $0 $1,784 $1,784 First Year Yield On Marginal Cost N/A
N/AIRR
N/A tons $0 5 $0 $1,841 $1,841N/A MBh $0 6 $0 $1 900 $1 900Heating Plant Savings
Airside Distribution SavingsTotal Additional Capital Cost:
Estimated Useful Life (yrs)Percent replacedReplacement Cost Premium (In 2010 Dollars)
Base YearValuation TypeProject Analysis PeriodInflation RateDiscount Rate for Defined ValuationEnergy Escalation Rate (Nominal)
N/A cfm $0 7 $0 $1,961N/A MBh $0 6 $0 $1,900 $1,900 NPV
$1,961$0 8 $0 $2,024 $2,024
$20,386
9 $0 $2,089 $2,089
$2,30212 11 $0 $2,229 $2,229
Replacement Life and Cost Summary 10 $0 $2,158 $2,158
100% 12 $0 $2,302
14 $0 $2,457 $2,457$0 13 $0 $2,378 $2,378
2010 16 $0 $2,637 $2,637Financial Analysis 15 $0 $2,545 $2,545
20 18 $0 $2,830 $2,830Defined 17 $0 $2,732 $2,732
7.19% 20 $0 $3,043 $3,0432.79% 19 $0 $2,932 $2,932
(See Table in Assumptions)
$0 $5,000
$10,000 $15,000 $20,000 $25,000 $30,000 $35,000 $40,000 $45,000 $50,000
0 5 10 15 20
Net
Cas
h Fl
ow (E
nd o
f Yea
r)
Years
Simple Payback Graph
Issued February 1, 2011 119 Existing Hotels Energy Analysis - Green Engage/Solutions

Ari
All 75W incandescent bulbs are replaced with 25W CFLs (6 per room or 900 in total). The guest room
lighting density is reduced to 0.75 W/sf.
Proposed Modifications
Individual Resource Calculations Replace at End of Lifetime Existing Hotels
Energy E-09 Zero Use of Incandescent Lamps in Guest Rooms
Energy End-Use Benchmark Comparison Environmental Impact Analysis
Arid
Base Case
Energy End-Use
Base Case Energy Use
Proposed Energy Use
Savings (+) / Loss (-)
Savings (+) / Loss (-)
MBtu/yr MBtu/yr MBtu/yr %
Each guest room contains a total of 12 light bulbs. There is a 50/50 split of 75W incandescent bulbs and
25W CFLs, giving a lighting density of 1.5 W/sf. Bulbs operate for 8 hours/day.
Emissions Base Case Proposed % Savings (+) / Loss (-)
CO2 (lb/yr) 2,599,589 2,375,690 8.6%
3,622 3,296 9.0%Space Heating - Elec 336.0 420.1 -84.1 -25.0%
SO2 (lb/yr) 9,356 8,470 9.5%Lighting 1,835.9 1,355.3 480.6 26.2% NOX (lb/yr)
Space Heating - Gas 0.0 0.0 0.0 0.0%Space Cooling 2,253.7 2,087.2 166.5 7.4%
HVAC Fans 495 0 483 3 11 6 2 4%
8.6%Heat Rejection 0.0 0.0 0.0 0.0%Pumps 0.2 0.2 0.0 -2.3%
2,599,5892,375,690
1,500,000
2,000,000
2,500,000
3,000,000
lb/y
r
Annual CO2 Emissions
lighting density is reduced to 0.75 W/sf. HVAC Fans 495.0 483.3 11.6 2.4%Receptacles - Elec 1,149.8 1,149.8 0.0 0.0%
Base Utilities - Gas 1,583.7 1,583.7 0.0 0.0%
- Total of 12 bulbs per room with 50% designated for replacement- Average Energy Star cost per unit of US$3.40 with bulb life of 6,000 – 12,000 hours- Conventional cost per unit of US$0.60 with bulb life of 750 – 1,000 hours- Common building laborer staff rate- Replacement cost premium is a savings because light bulbs will last longer for the price paid
7.1%
Receptacles - Gas 425.8 425.8 0.0 0.0%
Financial Assumptions Total 8,080.0 7,505.3 574.7 7.1%
2,599,5892,375,690
0
500,000
1,000,000
1,500,000
2,000,000
2,500,000
3,000,000
Base Case Proposed
lb/y
r
Annual CO2 Emissions
9,356
3,622
8,470
3,296
0
2,000
4,000
6,000
8,000
10,000
SO2 (lb/yr) NOX (lb/yr)
g/yr
Annual SO2 and NOX EmissionsBase Case
Proposed
8,0807,505
01,0002,0003,0004,0005,0006,0007,0008,0009,000
Base Case Proposed
MBt
u/yr
Annual Total Energy Use
Issued February 1, 2011 120 Existing Hotels Energy Analysis - Green Engage/Solutions

Additional Capital CostHVAC Plant First Cost Reductions
Cooling Plant SavingsHeating Plant Savings
Energy E-09 Zero Use of Incandescent Lamps in Guest Rooms
Individual Resource Calculations Replace at End of Lifetime Existing Hotels Arid
Annual Resource Cost Summary Financial Table Financial Results Summary
ResourceAnnual Resource Savings
(+) / Loss (-) Unit CostAnnual Savings (+) /
Loss (-)Yr.
Costs (Marginal/Maint/
Replace)
Savings (+) / Loss (-) Cash Flow
Initial Marginal Cost ($2,494)
$17,643Natural gas 0 therms $0.9000 $0Electricity 168,427 kWh $0.1028 $17,314 Initial Annual Savings
Water & sewer 0 Gals $0.0037 $0 0 $2,494 $0 $2,4941 $0 $17,643 $17,643
Simple Payback Immediate
$2,494 3 $2,709 $18,320 $21,029Capital Costs Savings Summary 2 $0 $17,978 $17,978
4 $0 $18,668 $18,668 First Year Yield On Marginal Cost N/A
N/AIRR
N/A MBh $0 6 $2 941 $19 882 $22 823N/A tons $0 5 $0 $19,266 $19,266
Heating Plant SavingsAirside Distribution Savings
Total Additional Capital Cost:
Estimated Useful Life (yrs)Percent replacedReplacement Cost Premium (In 2010 Dollars)
Base YearValuation TypeProject Analysis PeriodInflation RateDiscount Rate for Defined ValuationEnergy Escalation Rate (Nominal)
N/A cfm $0 7 $0 $20,518N/A MBh $0 6 $2,941 $19,882 $22,823 NPV
$2,494 8 $0 $21,175 $21,175
$224,812
9 $3,194 $21,852 $25,046
$20,518
3 11 $0 $23,319 $23,319Replacement Life and Cost Summary 10 $0 $22,574 $22,574
14 $0 $25,704 $25,704$2,494 13 $0 $24,883 $24,883
2010 16 $0 $27,588 $27,588Financial Analysis 15 $3,766 $26,629 $30,396
20 18 $4,090 $29,610 $33,700Defined 17 $0 $28,581 $28,581
7.19% 20 $0 $31,842 $31,8422.79% 19 $0 $30,676 $30,676
(See Table in Assumptions)
100% 12 $3,468 $24,088 $27,556
$0
$100,000
$200,000
$300,000
$400,000
$500,000
$600,000
0 5 10 15 20
Net
Cas
h Fl
ow (E
nd o
f Yea
r)
Years
Simple Payback Graph
Issued February 1, 2011 121 Existing Hotels Energy Analysis - Green Engage/Solutions

Ari
All 75W incandescent bulbs are replaced with 25W CFLs (20 per floor or 100 in total). The guest room
lighting density is reduced to 0.35 W/sf.
Proposed Modifications
Individual Resource Calculations Replace at End of Lifetime Existing Hotels
Energy E-09 Zero Use of Incandescent Lamps in Circulation Spaces
Energy End-Use Benchmark Comparison Environmental Impact Analysis
Arid
Base Case
Energy End-Use
Base Case Energy Use
Proposed Energy Use
Savings (+) / Loss (-)
Savings (+) / Loss (-)
MBtu/yr MBtu/yr MBtu/yr %
Corridors contain 40 light bulbs per floor. There is a 50/50 split of 75W incandescent bulbs and 25W CFLs, giving a lighting density of 0.7 W/sf. Bulbs operate for
24 hours/day.
Emissions Base Case Proposed % Savings (+) / Loss (-)
CO2 (lb/yr) 2,599,589 2,543,312 2.2%
3,622 3,540 2.3%Space Heating - Elec 336.0 389.6 -53.7 -16.0%
SO2 (lb/yr) 9,356 9,133 2.4%Lighting 1,835.9 1,678.9 157.0 8.6% NOX (lb/yr)
Space Heating - Gas 0.0 0.0 0.0 0.0%Space Cooling 2,253.7 2,217.4 36.3 1.6%
HVAC Fans 495 0 490 1 4 8 1 0%
2.2%Heat Rejection 0.0 0.0 0.0 0.0%Pumps 0.2 0.2 0.0 -4.5%
2,599,589 2,543,312
1,500,000
2,000,000
2,500,000
3,000,000
lb/y
r
Annual CO2 Emissions
lighting density is reduced to 0.35 W/sf. HVAC Fans 495.0 490.1 4.8 1.0%Receptacles - Elec 1,149.8 1,149.8 0.0 0.0%
Base Utilities - Gas 1,583.7 1,583.7 0.0 0.0%
- Total of 40 bulbs per corridor with 50% designated for replacement- This amounts to 100 bulbs to be replaced across the entire building- Average Energy Star cost per unit of US$3.40 with bulb life of 6,000 – 12,000 hours- Conventional cost per unit of US$0.60 with bulb life of 750 – 1,000 hours- Common building laborer staff rate- Replacement cost premium is a savings because light bulbs will last longer for the price paid
1.8%
Receptacles - Gas 425.8 425.8 0.0 0.0%
Financial Assumptions Total 8,080.0 7,935.5 144.4 1.8%
2,599,589 2,543,312
0
500,000
1,000,000
1,500,000
2,000,000
2,500,000
3,000,000
Base Case Proposed
lb/y
r
Annual CO2 Emissions
9,356
3,622
9,133
3,540
0
2,000
4,000
6,000
8,000
10,000
SO2 (lb/yr) NOX (lb/yr)
g/yr
Annual SO2 and NOX EmissionsBase Case
Proposed
8,080 7,936
01,0002,0003,0004,0005,0006,0007,0008,0009,000
Base Case Proposed
MBt
u/yr
Annual Total Energy Use
Issued February 1, 2011 122 Existing Hotels Energy Analysis - Green Engage/Solutions

Additional Capital CostHVAC Plant First Cost Reductions
Cooling Plant SavingsHeating Plant Savings
Energy E-09 Zero Use of Incandescent Lamps in Circulation Spaces
Individual Resource Calculations Replace at End of Lifetime Existing Hotels Arid
Annual Resource Cost Summary Financial Table Financial Results Summary
ResourceAnnual Resource Savings
(+) / Loss (-) Unit CostAnnual Savings (+) /
Loss (-)Yr.
Costs (Marginal/Maint/
Replace)
Savings (+) / Loss (-) Cash Flow
Initial Marginal Cost ($277)
$4,435Natural gas 0 therms $0.9000 $0Electricity 42,334 kWh $0.1028 $4,352 Initial Annual Savings
Water & sewer 0 Gals $0.0037 $0 0 $277 $0 $2771 $285 $4,435 $4,719
Simple Payback Immediate
$277 3 $301 $4,605 $4,906Capital Costs Savings Summary 2 $293 $4,519 $4,812
4 $309 $4,692 $5,002 First Year Yield On Marginal Cost N/A
N/AIRR
N/A MBh $0 6 $327 $4 997 $5 324N/A tons $0 5 $318 $4,842 $5,160
Heating Plant SavingsAirside Distribution Savings
Total Additional Capital Cost:
Estimated Useful Life (yrs)Percent replacedReplacement Cost Premium (In 2010 Dollars)
Base YearValuation TypeProject Analysis PeriodInflation RateDiscount Rate for Defined ValuationEnergy Escalation Rate (Nominal)
N/A cfm $0 7 $336 $5,157N/A MBh $0 6 $327 $4,997 $5,324 NPV
$277 8 $345 $5,322 $5,668
$57,295
9 $355 $5,493 $5,847
$5,493
1 11 $375 $5,861 $6,236Replacement Life and Cost Summary 10 $365 $5,674 $6,039
14 $407 $6,461 $6,868$277 13 $396 $6,254 $6,650
2010 16 $430 $6,934 $7,364Financial Analysis 15 $418 $6,693 $7,112
20 18 $454 $7,442 $7,897Defined 17 $442 $7,184 $7,626
7.19% 20 $480 $8,003 $8,4832.79% 19 $467 $7,710 $8,177
(See Table in Assumptions)
100% 12 $385 $6,055 $6,440
$0
$20,000
$40,000
$60,000
$80,000
$100,000
$120,000
$140,000
0 5 10 15 20
Net
Cas
h Fl
ow (E
nd o
f Yea
r)
Years
Simple Payback Graph
Issued February 1, 2011 123 Existing Hotels Energy Analysis - Green Engage/Solutions

Ari
All 75W incandescent bulbs are replaced with 25W CFLs (100 in total). The average lighting density is reduced to
0.7 W/sf.
Proposed Modifications
Individual Resource Calculations Replace at End of Lifetime Existing Hotels
Energy E-09 Zero Use of Incandescent Lamps in Back of House
Energy End-Use Benchmark Comparison Environmental Impact Analysis
Arid
Base Case
Energy End-Use
Base Case Energy Use
Proposed Energy Use
Savings (+) / Loss (-)
Savings (+) / Loss (-)
MBtu/yr MBtu/yr MBtu/yr %
Offices, food preparation, lockers, laundry, mechanical and electrical spaces contain a total of 200 light bulbs. There is a 50/50 split of 75W incandescent bulbs and 25W CFLs, giving an average lighting density of 1.4 W/sf. Bulbs operate for 8
hours/day.
Emissions Base Case Proposed % Savings (+) / Loss (-)
CO2 (lb/yr) 2,599,589 2,582,083 0.7%
3,622 3,596 0.7%Space Heating - Elec 336.0 343.7 -7.7 -2.3%
SO2 (lb/yr) 9,356 9,287 0.7%Lighting 1,835.9 1,799.0 36.9 2.0% NOX (lb/yr)
Space Heating - Gas 0.0 0.0 0.0 0.0%Space Cooling 2,253.7 2,239.8 13.9 0.6%
HVAC Fans 495 0 493 2 1 8 0 4%
0.7%Heat Rejection 0.0 0.0 0.0 0.0%Pumps 0.2 0.2 0.0 -2.3%
2,599,589 2,582,083
1,500,000
2,000,000
2,500,000
3,000,000
lb/y
r
Annual CO2 Emissions
HVAC Fans 495.0 493.2 1.8 0.4%Receptacles - Elec 1,149.8 1,149.8 0.0 0.0%
Base Utilities - Gas 1,583.7 1,583.7 0.0 0.0%
- Total of 200 bulbs in back of house with 50% designated for replacement- Average Energy Star cost per unit of US$3.40 with bulb life of 6,000 – 12,000 hours- Conventional cost per unit of US$0.60 with bulb life of 750 – 1,000 hours- Common building laborer staff rate- Replacement cost premium is a savings because light bulbs will last longer for the price paid
0.6%
Receptacles - Gas 425.8 425.8 0.0 0.0%
Financial Assumptions Total 8,080.0 8,035.0 44.9 0.6%
2,599,589 2,582,083
0
500,000
1,000,000
1,500,000
2,000,000
2,500,000
3,000,000
Base Case Proposed
lb/y
r
Annual CO2 Emissions
9,356
3,622
9,287
3,596
0
2,000
4,000
6,000
8,000
10,000
SO2 (lb/yr) NOX (lb/yr)
g/yr
Annual SO2 and NOX EmissionsBase Case
Proposed
8,080 8,035
01,0002,0003,0004,0005,0006,0007,0008,0009,000
Base Case Proposed
MBt
u/yr
Annual Total Energy Use
Issued February 1, 2011 124 Existing Hotels Energy Analysis - Green Engage/Solutions

Additional Capital CostHVAC Plant First Cost Reductions
Cooling Plant SavingsHeating Plant Savings
Energy E-09 Zero Use of Incandescent Lamps in Back of House
Individual Resource Calculations Replace at End of Lifetime Existing Hotels Arid
Annual Resource Cost Summary Financial Table Financial Results Summary
ResourceAnnual Resource Savings
(+) / Loss (-) Unit CostAnnual Savings (+) /
Loss (-)Yr.
Costs (Marginal/Maint/
Replace)
Savings (+) / Loss (-) Cash Flow
Initial Marginal Cost ($277)
$1,379Natural gas 0 therms $0.9000 $0Electricity 13,169 kWh $0.1028 $1,354 Initial Annual Savings
Water & sewer 0 Gals $0.0037 $0 0 $277 $0 $2771 $0 $1,379 $1,379
Simple Payback Immediate
$277 3 $301 $1,432 $1,733Capital Costs Savings Summary 2 $0 $1,406 $1,406
4 $0 $1,460 $1,460 First Year Yield On Marginal Cost N/A
N/AIRR
N/A MBh $0 6 $327 $1 555 $1 881N/A tons $0 5 $0 $1,506 $1,506
Heating Plant SavingsAirside Distribution Savings
Total Additional Capital Cost:
Estimated Useful Life (yrs)Percent replacedReplacement Cost Premium (In 2010 Dollars)
Base YearValuation TypeProject Analysis PeriodInflation RateDiscount Rate for Defined ValuationEnergy Escalation Rate (Nominal)
N/A cfm $0 7 $0 $1,604N/A MBh $0 6 $327 $1,555 $1,881 NPV
$277 8 $0 $1,656 $1,656
$17,957
9 $355 $1,709 $2,063
$1,604
3 11 $0 $1,823 $1,823Replacement Life and Cost Summary 10 $0 $1,765 $1,765
14 $0 $2,010 $2,010$277 13 $0 $1,946 $1,946
2010 16 $0 $2,157 $2,157Financial Analysis 15 $418 $2,082 $2,501
20 18 $454 $2,315 $2,770Defined 17 $0 $2,235 $2,235
7.19% 20 $0 $2,490 $2,4902.79% 19 $0 $2,399 $2,399
(See Table in Assumptions)
100% 12 $385 $1,883 $2,269
$0 $5,000
$10,000 $15,000 $20,000 $25,000 $30,000 $35,000 $40,000 $45,000
0 5 10 15 20
Net
Cas
h Fl
ow (E
nd o
f Yea
r)
Years
Simple Payback Graph
Issued February 1, 2011 125 Existing Hotels Energy Analysis - Green Engage/Solutions

Ari
Constant speed, standard efficiency motor on supply fan for VAV system serving the first floor and corridor
spaces (15 HP capacity).
Emissions Base Case Proposed
Individual Resource Calculations Replace at End of Lifetime Existing Hotels
Mechanical M-11 NEMA Premium Efficiency Motors
Energy End-Use Benchmark Comparison Environmental Impact Analysis
Arid
Base Case% Savings (+) /
Loss (-)Base Case Energy Use
Proposed Energy Use
Savings (+) / Loss (-)
Savings (+) / Loss (-)
MBtu/yr MBtu/yr MBtu/yr %CO2 (lb/yr) 2,599,589 2,597,804 0.1%
3,622 3,619 0.1%Space Heating - Elec 336.0 336.5 -0.5 -0.2%
SO2 (lb/yr) 9,356 9,349 0.1%Lighting 1,835.9 1,835.9 0.0 0.0% NOX (lb/yr)
Energy End-Use
Space Heating - Gas 0.0 0.0 0.0 0.0%Space Cooling 2,253.7 2,252.0 1.7 0.1%Proposed Modifications
0.0%
HVAC Fans 495 0 491 5 3 4 0 7%
VAV supply fan motor replaced with NEMA premium efficiency motor (15 HP capacity). 0.1%
Heat Rejection 0.0 0.0 0.0 0.0%Pumps 0.2 0.2 0.0
2,599,589 2,597,804
1,500,000
2,000,000
2,500,000
3,000,000
lb/y
r
Annual CO2 Emissions
HVAC Fans 495.0 491.5 3.4 0.7%Receptacles - Elec 1,149.8 1,149.8 0.0 0.0%
Base Utilities - Gas 1,583.7 1,583.7 0.0 0.0%
NB: demolition costs are not includedAll four climates can install a 15 HP NEMA efficiency motor on the supply fan. - 15 HP NEMA efficiency motor is $1,482- 15 HP normal motor is $1,195- Cost Premium of $287 0.1%
Receptacles - Gas 425.8 425.8 0.0 0.0%
Financial Assumptions Total 8,080.0 8,075.4 4.6 0.1%
2,599,589 2,597,804
0
500,000
1,000,000
1,500,000
2,000,000
2,500,000
3,000,000
Base Case Proposed
lb/y
r
Annual CO2 Emissions
9,356
3,622
9,349
3,619
0
2,000
4,000
6,000
8,000
10,000
SO2 (lb/yr) NOX (lb/yr)
g/yr
Annual SO2 and NOX EmissionsBase Case
Proposed
8,080 8,075
01,0002,0003,0004,0005,0006,0007,0008,0009,000
Base Case Proposed
MBt
u/yr
Annual Total Energy Use
Issued February 1, 2011 126 Existing Hotels Energy Analysis - Green Engage/Solutions

Additional Capital CostHVAC Plant First Cost Reductions
Cooling Plant SavingsHeating Plant Savings
Mechanical M-11 NEMA Premium Efficiency Motors
Individual Resource Calculations Replace at End of Lifetime Existing Hotels Arid
Annual Resource Cost Summary Financial Table Financial Results Summary
ResourceAnnual Resource Savings
(+) / Loss (-) Unit CostAnnual Savings (+) /
Loss (-)Yr.
Costs (Marginal/Maint/
Replace)
Savings (+) / Loss (-)
Natural gas 0 therms $0.9000 $0Electricity 1,343 kWh $0.1028 $138
Cash FlowInitial Marginal Cost $287
$141Initial Annual Savings
Water & sewer 0 Gals $0.0037 $0 0 ($287) $01 $0 $141 $141
($287) Simple Payback 2.1 yrs
($287) 3 $0 $146 $146Capital Costs Savings Summary 2 $0 $143 $143
4 $0 $149 $149 First Year Yield On Marginal Cost 49.0%
51.2%IRR
N/A tons $0 5 $0 $154 $154N/A MBh $0 6 $0 $159 $159Heating Plant Savings
Airside Distribution SavingsTotal Additional Capital Cost:
Estimated Useful Life (yrs)Percent replacedReplacement Cost Premium (In 2010 Dollars)
Base YearValuation TypeProject Analysis PeriodInflation RateDiscount Rate for Defined ValuationEnergy Escalation Rate (Nominal)
N/A cfm $0 7 $0 $164N/A MBh $0 6 $0 $159 $159 NPV
$164($287) 8 $0 $169 $169
$1,290
9 $0 $174 $174
$19215 11 $0 $186 $186
Replacement Life and Cost Summary 10 $0 $180 $180
100% 12 $0 $192
14 $0 $205 $205($287) 13 $0 $198 $198
2010 16 $0 $220 $220Financial Analysis 15 ($433) $212 ($221)
20 18 $0 $236 $236Defined 17 $0 $228 $228
7.19% 20 $0 $254 $2542.79% 19 $0 $245 $245
(See Table in Assumptions)
($500)$0
$500 $1,000 $1,500 $2,000 $2,500 $3,000 $3,500
0 5 10 15 20Net
Cas
h Fl
ow (E
nd o
f Yea
r)
Years
Simple Payback Graph
Issued February 1, 2011 127 Existing Hotels Energy Analysis - Green Engage/Solutions

Ari
Individual Resource Calculations Replace at End of Lifetime Existing Hotels Arid
Cumulative Scenario Green Engage Lvl 1: Install All New Measures Immediately & Replace Existing Measures when Lifetime is Finished
Base Case Energy End-Use Benchmark Comparison Environmental Impact AnalysisAs detailed in individual measures
Energy End-Use
Base Case Energy Use
Proposed Energy Use
Savings (+) / Loss (-)
Savings (+) / Loss (-)
MBtu/yr MBtu/yr MBtu/yr %
Emissions Base Case Proposed % Savings (+) / Loss (-)
CO2 (lb/yr) 2,599,589 2,007,279 22.8%
3,622 2,793 22.9%Space Heating - Elec 336.0 301.3 34.6 10.3%
SO2 (lb/yr) 9,356 7,204 23.0%Lighting 1,835.9 1,098.9 737.1 40.1% NOX (lb/yr)
Space Heating - Gas 0.0 0.0 0.0 0.0%Proposed Modifications Space Cooling 2,253.7 1,839.7 414.0 18.4%
As detailed in individual measures Pumps 0.2 0.2 0.0 -9.1%
HVAC Fans 495 0 471 9 23 0 4 7%
22.8%Heat Rejection 0.0 0.0 0.0 0.0%
2,599,589
2,007,279
1,500,000
2,000,000
2,500,000
3,000,000
lb/y
r
Annual CO2 Emissions
HVAC Fans 495.0 471.9 23.0 4.7%Receptacles - Elec 1,149.8 962.3 187.5 16.3%Receptacles - Gas 425.8 277.1 148.7 34.9%Base Utilities - Gas 1,583.7 1,318.2 265.5 16.8%
All financial assumptions remain the same as in each individual measure.
22.4%
Financial Assumptions Total 8,080.0 6,269.5 1,810.4 22.4%
2,599,589
2,007,279
0
500,000
1,000,000
1,500,000
2,000,000
2,500,000
3,000,000
Base Case Proposed
lb/y
r
Annual CO2 Emissions
9,356
3,622
7,204
2,793
0
2,000
4,000
6,000
8,000
10,000
SO2 (lb/yr) NOX (lb/yr)
g/yr
Annual SO2 and NOX EmissionsBase Case
Proposed
8,080
6,270
01,0002,0003,0004,0005,0006,0007,0008,0009,000
Base Case Proposed
MBt
u/yr
Annual Total Energy Use
Issued February 1, 2011 128 Existing Hotels Energy Analysis - Green Engage/Solutions

Additional Capital CostHVAC Plant First Cost Reductions
Cooling Plant SavingsHeating Plant Savings
Individual Resource Calculations Replace at End of Lifetime Existing Hotels Arid
Cumulative Scenario Green Engage Lvl 1: Install All New Measures Immediately & Replace Existing Measures when Lifetime is Finished
Annual Resource Cost Summary Financial Table Financial Results Summary
ResourceAnnual Resource Savings
(+) / Loss (-) Unit CostAnnual Savings (+) /
Loss (-)Yr.
Costs (Marginal/Maint/
Replace)Electricity 409,192 kWh $0.1028 $42,065Savings (+) /
Loss (-) Cash FlowInitial Marginal Cost $66,784
Water & sewer 1,037,880 Gals $0.0037 $3,840 0Natural gas 4,143 therms $0.9000 $3,729
Initial Annual Savings $51,021
($66,784) $0 ($66,784) Simple Payback 1.3 yrs
Capital Costs Savings Summary 2 $1,572 $52,165 $53,738 IRR 81.4%($66,784) 3 $4,325 $53,355 $57,679
1 $1,245 $51,021 $52,266
N/A tons $0 5 $1,389 $56,286 $57,6754 $1,661 $54,546 $56,207 First Year Yield On Marginal Cost 76.4%
N/A MBh $0 6 $5 023 $58 098 $63 121Heating Plant SavingsAirside Distribution Savings
Total Additional Capital Cost:
Estimated Useful Life (yrs)Percent replacedReplacement Cost (In 2010 Dollars)
Base YearValuation TypeProject Analysis PeriodInflation RateDiscount Rate for Defined ValuationEnergy Escalation Rate (Nominal)
N/A cfm $0 7 $1,468N/A MBh $0 6 $5,023 $58,098 $63,121
$59,935 $61,403($66,784) 8 $1,854 $61,848 $63,702
NPV $548,246
9 $5,099 $63,839 $68,938
N/A 11 $1,638 $68,070 $69,708Replacement Life and Cost Summary 10 ($34,880) $65,911 $31,032
N/A 13 $1,731 $72,602 $74,333N/A 12 ($2,231) $70,318 $68,087
14 $2,186 $74,980 $77,166
2010 16 $2,310 $80,523 $82,832Financial Analysis 15 ($48,309) $77,722 $29,413
20 18 $6,984 $86,503 $93,487Defined 17 $1,932 $83,448 $85,380
7.19% 20 $2,578 $92,976 $95,5542.79% 19 $2,041 $89,625 $91,665
(See Table in Assumptions)
($200,000)$0
$200,000 $400,000 $600,000 $800,000
$1,000,000 $1,200,000 $1,400,000
0 5 10 15 20Net
Cas
h Fl
ow (E
nd o
f Yea
r)
Years
Simple Payback Graph
Issued February 1, 2011 129 Existing Hotels Energy Analysis - Green Engage/Solutions

Ari
23.9%Heat Rejection 0.0 0.0 0.0 0.0%
As detailed in individual measures Pumps
Space Heating - Gas 0.0 0.0 0.0 0.0%
0.2 0.2 0.0 -6.8%
HVAC Fans 495 0 443 9 51 1 10 3%
CO2 (lb/yr) 2,599,589 1,979,506 23.9%
23.9%Space Heating - Elec 336.0 309.1 26.9 8.0%
7,124 23.9%Lighting 1,835.9 1,097.3 738.7 40.2%
Emissions Base Case Proposed % Savings (+) / Loss (-)
% SO2 (lb/yr)
Arid
NOX (lb/yr) 3,622 2,758MBtu/yr MBtu/yr MBtu/yr
Cumulative Scenario Green Engage Lvl 2: Install All New Measures Immediately & Replace Existing Measures when Lifetime is Finished
Base Case Energy End-Use Benchmark Comparison Environmental Impact AnalysisAs detailed in individual measures
Energy End-Use
Base Case Energy Use
Proposed Energy Use
Savings (+) / Loss (-)
Savings (+) / Loss (-)
9,356
Proposed Modifications Space Cooling 2,253.7 1,809.6 444.1 19.7%
Individual Resource Calculations Replace at End of Lifetime Existing Hotels
2,599,589
1,979,506
1,500,000
2,000,000
2,500,000
3,000,000
lb/y
r
Annual CO2 Emissions
All financial assumptions remain the same as in each individual measure.
23.8%
Financial Assumptions Total 8,080.0 6,153.3 1,926.7 23.8%
Receptacles - Gas 425.8 277.1 148.7 34.9%Base Utilities - Gas 1,583.7 1,254.0 329.7 20.8%
Receptacles - Elec 1,149.8 962.3 187.5 16.3%HVAC Fans 495.0 443.9 51.1 10.3%
2,599,589
1,979,506
0
500,000
1,000,000
1,500,000
2,000,000
2,500,000
3,000,000
Base Case Proposed
lb/y
r
Annual CO2 Emissions
9,356
3,622
7,124
2,758
0
2,000
4,000
6,000
8,000
10,000
SO2 (lb/yr) NOX (lb/yr)
g/yr
Annual SO2 and NOX EmissionsBase Case
Proposed
8,080
6,153
01,0002,0003,0004,0005,0006,0007,0008,0009,000
Base Case Proposed
MBt
u/yr
Annual Total Energy Use
Issued February 1, 2011 130 Existing Hotels Energy Analysis - Green Engage/Solutions

Additional Capital CostHVAC Plant First Cost Reductions
Cooling Plant SavingsHeating Plant Savings N/A MBh $0 6 $5 023 $60 663 $65 685
N/A tons $0 5 $1,389 $58,769 $60,1584 $1,661 $56,950 $58,611 First Year Yield On Marginal Cost 61.9%
($85,990) 3 $4,325 $55,691 $60,015Capital Costs Savings Summary 2 $1,572 $54,436 $56,008 IRR 66.4%
1 $1,245 $53,228 $54,473($85,990) $0 ($85,990) Simple Payback 1.6 yrs
Natural gas 4,785 therms $0.9000 $4,307Initial Annual Savings $53,228
ResourceAnnual Resource Savings
(+) / Loss (-) Unit CostAnnual Savings (+) /
Loss (-)Yr. Savings (+) /
Loss (-) Cash FlowInitial Marginal Cost
Water & sewer 1,037,880 Gals $0.0037 $3,840 0
Costs (Marginal/Maint/
Replace)Electricity 424,446 kWh $0.1028 $43,633
Cumulative Scenario Green Engage Lvl 2: Install All New Measures Immediately & Replace Existing Measures when Lifetime is Finished
Annual Resource Cost Summary Financial Table Financial Results Summary
Individual Resource Calculations Replace at End of Lifetime Existing Hotels Arid
$85,990
Heating Plant SavingsAirside Distribution Savings
Total Additional Capital Cost:
Estimated Useful Life (yrs)Percent replacedReplacement Cost (In 2010 Dollars)
Base YearValuation TypeProject Analysis PeriodInflation RateDiscount Rate for Defined ValuationEnergy Escalation Rate (Nominal) (See Table in Assumptions)
7.19% 20 $2,578 $97,177 $99,7542.79% 19 $2,041 $93,669 $95,710
20 18 $6,984 $90,394 $97,378Defined 17 $1,932 $87,191 $89,123
2010 16 $2,310 $84,124 $86,434Financial Analysis 15 ($48,742) $81,187 $32,445
14 $2,186 $78,314 $80,500N/A 13 $1,731 $75,828 $77,558N/A 12 ($2,231) $73,439 $71,208N/A 11 $1,638 $71,089 $72,727
Replacement Life and Cost Summary 10 ($39,670) $68,833 $29,1629 $5,099 $66,665 $71,764
($85,990) 8 $1,854 $64,584 $66,438
NPV $555,479N/A cfm $0 7 $1,468N/A MBh $0 6 $5,023 $60,663 $65,685
$62,584 $64,052
($200,000)$0
$200,000 $400,000 $600,000 $800,000
$1,000,000 $1,200,000 $1,400,000
0 5 10 15 20Net
Cas
h Fl
ow (E
nd o
f Yea
r)
Years
Simple Payback Graph
Issued February 1, 2011 131 Existing Hotels Energy Analysis - Green Engage/Solutions

Temperate: Install or Replace Immediately
Issued February 1, 2011 132 Existing Hotels Energy Analysis - Green Engage/Solutions

InstallReplaceReplaceReplaceReplaceReplaceReplaceInstallInstallInstallInstall
Install New or Replace
Energy Modelling Results Summary Install or Replace Immediately Existing Hotels Temperate
2.4%
2.3 yrs 1.7% 45.3% 42.7%
0.3 yrs
0.1%2.3%
CO2 Reductions
0.6% 344.9% 340.4% $12,97183.6%
$59,073
7.1 yrs 0.7% 8.6% 12.1% $1,3655.3 yrs 3.0% 17.6% $27,176
Zero Use of Incandescent Lamps in Guest Rooms
Green Engage Level 1 Certification
E-09
First Year Yield On Marginal Cost
$6,357
$39,385
0.6% 4.1%
% %
$19,508$18,679
13.9%
82.4%
1573.3% 1480.3%
0.7%
The table below summarises the overall energy and financial performance for the modelled existing hotel in the temperate climate zone against the baseline building. Energy savings for a specific building may vary based on that building's parameters and financial results may also vary based on local costs and financing structures. For details regarding each measure refer to the individual calculation pages immediately following this page. For detailed assumptions relating to the energy model, utilities, emission factors, financial inputs, cost of capital, etc refer to the assumptions section of this book.Note: CO2 reduction percentages closely match both source energy reductions and annual energy saving cost reductions. Due to different modelling methodologies existing hotel and new hotel CO2 reduction percentages cannot be compared against each other. The stoplight colour legend contained below refers solely to simple payback periods.
TemperateWest Palm Beach, FL
0.3 yrs 7.4% 501.1% 497.8% $169,7160.1 yrs $57,090
yrs
O-04E-07E-07 Energy Efficient TVs
Towel/Sheet Program Immediate7.7 yrs
6.9 yrsE-07
Relevant Action Group
Energy Efficient Appliances
Zero Use of Incandescent Lamps in Circulation Spaces
Measure
E-09
NPV(Over 20 Years)
Energy Efficient Guest Room Refrigerators
Simple Payback IRR
20 yrs
%
0.4%
B-04M-09W-03
Zero Use of Incandescent Lamps in Back of House Spaces
18.2%
N/A11.8%
N/A12.4%
$
($13,656)14.9%
E-09
Occupancy Sensors in Corridors for Decorative Fixtures 2.0%Use of Building Appropriate Materials100% of Guest Rooms have 4F Deadband ThermostatsMeet IPC 2006 Maximum Flow Rates
1.3 yrsE-10
InstallInstallInstall
Replace
N/A
N/A
Legend (Criteria Based On Simple Payback Only):Very Short or Immediate Payback (0 - 3 years)Intermediate Payback (3 - 7 years)Long or No Payback (>7 years)
Green Engage Level 2 Certification Cumulative Savings Scenarios (Includes Green Engage Level 1)
All Measures Installed or Replaced Immediately 3.8 yrs 22.5% 27.8% 24.9% $385,518
All Measures Installed or Replaced Immediately 3.3 yrs 20.5% 32.2% 28.9% $375,026
1.9%Never 0.0% N/A 6.3% ($577)
Green Engage Level 2 Certification
0.1% 13.9%
10.7%
$1
12.1% $15,396E-10E-08 Pipe Insulation 8.2 yrs
0.2%7.1 yrs
Green Engage Level 1 Certification Cumulative Savings Scenarios
7.2%13.9%6.9 yrsM-11 NEMA Premium Efficiency Motors
Occupancy Sensors in Offices
$66014.3%M-11 Variable Frequency Drives
Issued February 1, 2011 133 Existing Hotels Energy Analysis - Green Engage/Solutions

Individual Resource Calculations Install or Replace Immediately Existing Hotels Temperate
PumpsSpace CoolingSpace Heating - Gas
409 6
0.01,831.3
Base Case Energy Use
Proposed Energy Use
LightingSpace Heating - Elec
Base Case3 commercial, non-Energy Star washing machines and
dryers, operating for 8 hours per day.
The energy consumption of washing machines and dryers is reduced by 17%, based on a study by the
American Hotel & Lodging Association.
Proposed Modifications
0.0
903.7
0.0
0.1%
Base CaseEmissions
0.1%
1,831.3
HVAC FansHeat Rejection
0 1%409 4 0 3
Operations
3,698.6 3,705.0 -6.4 -0.2%
MBtu/yr MBtu/yr
0.0 0.0%
O-04 Towel/Sheet Program
25.5
Energy End-Use Benchmark Comparison
Energy End-Use
Savings (+) / Loss (-)
2,992
25.4 0.0
Environmental Impact Analysis
CO2 (lb/yr)
0.0 0.0
2,989 0.1%%
0.0%MBtu/yr
0.0%
902.2 1.5 0.2%
0.0
Savings (+) / Loss (-)
0.2%NOX (lb/yr)
2,401,837 2,399,566 0.1%SO2 (lb/yr) 6,658 6,648
% Savings (+) / Loss (-)Proposed
2,401,837 2,399,566
1,500,000
2,000,000
2,500,000
3,000,000
lb/y
r
Annual CO2 Emissions
409.6
0.0%
4.1Financial Assumptions
Receptacles - Gas 425.8 421.80.0 0.0%
1,149.8 1,145.0 4.7 0.4%
0.0%2,033.7 2,033.7
10,473.8
American Hotel & Lodging Association.
- No additional costs
- Additional savings (apart from energy) from water and laundry detergent - Water savings of 34,606 gallons - Detergent savings of 173 gallons @ $7 per gallon (This is included under the Replacement Life and Cost Summary as a Savings)- Labour cost savings are not included
10,477.9Base Utilities - Gas
Receptacles - Elec4.0 0.9%
HVAC Fans 0.1%409.4 0.3
Total
2,401,837 2,399,566
0
500,000
1,000,000
1,500,000
2,000,000
2,500,000
3,000,000
Base Case Proposed
lb/y
r
Annual CO2 Emissions
6,658
2,992
6,648
2,989
0
2,000
4,000
6,000
8,000
SO2 (lb/yr) NOX (lb/yr)
g/yr
Annual SO2 and NOX EmissionsBase Case
Proposed
10,478 10,474
0
2,000
4,000
6,000
8,000
10,000
12,000
Base Case Proposed
MBt
u/yr
Annual Total Energy Use
Issued February 1, 2011 134 Existing Hotels Energy Analysis - Green Engage/Solutions

Additional Capital CostHVAC Plant First Cost Reductions
Cooling Plant SavingsHeating Plant Savings
Individual Resource Calculations Install or Replace Immediately Existing Hotels Temperate
$0
Operations
$1 428$1,389
$1,315$1,279$1,245
Water & sewerNatural gas
1,919Electricity
34,606-24
Capital Costs Savings Summary$310
$349
-$22$197
therms$0.0037$0.9000$0.1028Unit Cost
N/AN/A
2
$0
Annual Resource Savings (+) / Loss (-)
Yr.
Financial Table
kWhResource
$322$316
$1,728$1,681$1,637
$1,555$1,596
Costs (Marginal/Maint/
Replace)Cash FlowSavings (+) /
Loss (-)
Simple Payback$0$0
Annual Savings (+) / Loss (-)
Annual Resource Cost Summary
Gals
6 $1 777
$0
First Year Yield On Marginal Cost
IRR
MBhtons $0 $339
$329543
$1,352
Immediate
N/A
N/A
10$128
$0
O-04 Towel/Sheet Program
Initial Annual Savings
Initial Marginal Cost
Financial Results Summary
$310
Heating Plant SavingsAirside Distribution Savings
Total Additional Capital Cost:
Estimated Useful Life (yrs)Percent replacedReplacement Cost (In 2010 Dollars)
Base YearValuation TypeProject Analysis PeriodInflation RateDiscount Rate for Defined ValuationEnergy Escalation Rate (Nominal)
$1,468$1,428 $349
N/A $0N/A $0
$0
1 Replacement Life and Cost Summary
20191817Defined
20
2010
100%$1,211 $1,731
$1,638 $405
$2,286
$518$502$487
(See Table in Assumptions)
$1,986
11
$2,041 $2,5592.79%
Financial Analysis
$1,684
$1,779$457
$2,488
7.19%
$430
$2,418$2,351
13
$2,098 $535 $2,633
$359 $1,827
$417
876
$370$1,509
109
12
$1,551$393$381
$1,594
$1,777
1615
$472
14
$1,879
$443 $2,222
$1,932
$1,828
$2,043$1,987$1,932$1,879
$2,101$2,161
NPVcfmMBh $18,679
$0 $5,000
$10,000 $15,000 $20,000 $25,000 $30,000 $35,000 $40,000 $45,000
0 5 10 15 20
Net
Cas
h Fl
ow (E
nd o
f Yea
r)
Years
Simple Payback Graph
Issued February 1, 2011 135 Existing Hotels Energy Analysis - Green Engage/Solutions

Base CaseThe following commercial, non-Energy Star appliances
located in the food preparation and laundry areas: 3 washing machines, 2 dishwashers, 4 gas ovens, 2
fridges, 2 freezers, 2 icemakers and 5 vending machines
All appliances replaced with Energy Star rated equivalents. Overall saving of 30% on electricity and
34% on natural gas.
Proposed Modifications
Base Case Proposed % Savings (+) / Loss (-)
Individual Resource Calculations Install or Replace Immediately Existing Hotels
2,992 2,921 2.4%Space Heating - Elec 0.0 0.0 0.0 0.0%Lighting 1,831.3 1,831.3 0.0 0.0% NOX (lb/yr)
CO2 (lb/yr) 2,401,837 2,346,190 2.3%
Temperate
Energy E-07 Energy Efficient Appliances
Energy End-Use Benchmark Comparison Environmental Impact Analysis
Energy End-Use
Base Case Energy Use
Proposed Energy Use
Savings (+) / Loss (-)
Savings (+) / Loss (-)
SO2 (lb/yr) 6,658 6,495 2.4%MBtu/yr %
Emissions
MBtu/yr MBtu/yr
Pumps 25.5 25.4 0.1 0.4%
HVAC Fans 409 6 408 8 0 9 0 2%
Space Heating - Gas 3,698.6 3,720.2 -21.6 -0.6%Space Cooling 903.7 898.9 4.8 0.5%
2.3%Heat Rejection 0.0 0.0 0.0 0.0%
2,401,837 2,346,190
1,500,000
2,000,000
2,500,000
3,000,000
lb/y
r
Annual CO2 Emissions
34% on natural gas. HVAC Fans 409.6 408.8 0.9 0.2%Receptacles - Elec 1,149.8 1,050.1 99.7 8.7%Receptacles - Gas 425.8 279.4 146.4 34.4%Base Utilities - Gas 2,033.7 2,033.7 0.0 0.0%
- Basket of commercial appliances that have an energy star rating- Total weighted basket cost of US$79,451 and a weighted cost premium of US$5,864- Average lifetime of 12 years- Appliances include 3 washing machines, 2 dishwashers, 4 gas ovens, 2 fridges, 2 freezers, 2 icemakers and 5 vending machines
2.2%
Financial Assumptions Total 10,477.9 10,247.7 230.2 2.2%
2,401,837 2,346,190
0
500,000
1,000,000
1,500,000
2,000,000
2,500,000
3,000,000
Base Case Proposed
lb/y
r
Annual CO2 Emissions
6,658
2,992
6,495
2,921
0
2,000
4,000
6,000
8,000
SO2 (lb/yr) NOX (lb/yr)
g/yr
Annual SO2 and NOX EmissionsBase Case
Proposed
10,478 10,248
0
2,000
4,000
6,000
8,000
10,000
12,000
Base Case Proposed
MBt
u/yr
Annual Total Energy Use
Issued February 1, 2011 136 Existing Hotels Energy Analysis - Green Engage/Solutions
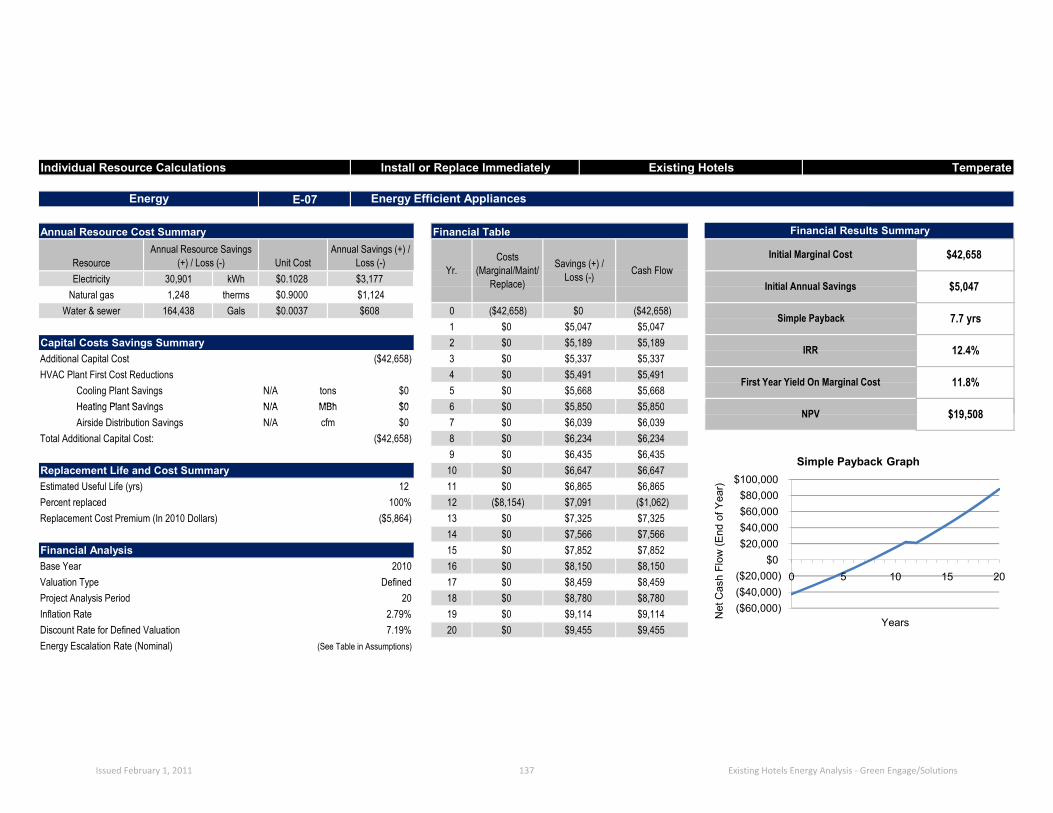
Additional Capital CostHVAC Plant First Cost Reductions
Cooling Plant SavingsHeating Plant Savings
Energy E-07 Energy Efficient Appliances
Individual Resource Calculations Install or Replace Immediately Existing Hotels Temperate
Annual Resource Cost Summary Financial Table Financial Results Summary
ResourceAnnual Resource Savings
(+) / Loss (-) Unit CostAnnual Savings (+) /
Loss (-)Yr.
Costs (Marginal/Maint/
Replace)
Savings (+) / Loss (-) Cash Flow
Initial Marginal Cost $42,658
$5,047Natural gas 1,248 therms $0.9000 $1,124Electricity 30,901 kWh $0.1028 $3,177 Initial Annual Savings
Water & sewer 164,438 Gals $0.0037 $608 0 ($42,658) $0 ($42,658)1 $0 $5,047 $5,047
Simple Payback 7.7 yrs
($42,658) 3 $0 $5,337 $5,337Capital Costs Savings Summary 2 $0 $5,189 $5,189
4 $0 $5,491 $5,491 First Year Yield On Marginal Cost 11.8%
12.4%IRR
N/A MBh $0 6 $0 $5 850 $5 850N/A tons $0 5 $0 $5,668 $5,668
Heating Plant SavingsAirside Distribution Savings
Total Additional Capital Cost:
Estimated Useful Life (yrs)Percent replacedReplacement Cost Premium (In 2010 Dollars)
Base YearValuation TypeProject Analysis PeriodInflation RateDiscount Rate for Defined ValuationEnergy Escalation Rate (Nominal)
N/A cfm $0 7 $0 $6,039N/A MBh $0 6 $0 $5,850 $5,850 NPV
($42,658) 8 $0 $6,234 $6,234
$19,508
9 $0 $6,435 $6,435
$6,039
12 11 $0 $6,865 $6,865Replacement Life and Cost Summary 10 $0 $6,647 $6,647
14 $0 $7,566 $7,566($5,864) 13 $0 $7,325 $7,325
2010 16 $0 $8,150 $8,150Financial Analysis 15 $0 $7,852 $7,852
20 18 $0 $8,780 $8,780Defined 17 $0 $8,459 $8,459
7.19% 20 $0 $9,455 $9,4552.79% 19 $0 $9,114 $9,114
(See Table in Assumptions)
100% 12 ($8,154) $7,091 ($1,062)
($60,000)($40,000)($20,000)
$0 $20,000 $40,000 $60,000 $80,000
$100,000
0 5 10 15 20
Net
Cas
h Fl
ow (E
nd o
f Yea
r)
Years
Simple Payback Graph
Issued February 1, 2011 137 Existing Hotels Energy Analysis - Green Engage/Solutions

Base CaseOne 32 inch non-Energy Star television per guest
room.
Television is replaced with Energy Star rated equivalent. Overall saving of 40% on electricity.
Proposed Modifications
Base Case Proposed % Savings (+) / Loss (-)
Individual Resource Calculations Install or Replace Immediately Existing Hotels
2,992 2,966 0.9%Space Heating - Elec 0.0 0.0 0.0 0.0%Lighting 1,831.3 1,831.3 0.0 0.0% NOX (lb/yr)
CO2 (lb/yr) 2,401,837 2,385,794 0.7%
Temperate
Energy E-07 Energy Efficient Guest Room Refrigerators
Energy End-Use Benchmark Comparison Environmental Impact Analysis
Energy End-Use
Base Case Energy Use
Proposed Energy Use
Savings (+) / Loss (-)
Savings (+) / Loss (-)
SO2 (lb/yr) 6,658 6,580 1.2%MBtu/yr %
Emissions
MBtu/yr MBtu/yr
Pumps 25.5 25.5 0.0 0.0%
HVAC Fans 409 6 409 2 0 4 0 1%
Space Heating - Gas 3,698.6 3,730.4 -31.8 -0.9%Space Cooling 903.7 896.3 7.4 0.8%
0.7%Heat Rejection 0.0 0.0 0.0 0.0%
2,401,837 2,385,794
1,500,000
2,000,000
2,500,000
3,000,000
lb/y
r
Annual CO2 Emissions
HVAC Fans 409.6 409.2 0.4 0.1%Receptacles - Elec 1,149.8 1,106.9 42.9 3.7%Receptacles - Gas 425.8 425.8 0.0 0.0%Base Utilities - Gas 2,033.7 2,033.7 0.0 0.0%
- Medium sized bar fridge at 3 cu. ft.- Average Energy Star cost per unit - US$120 (online average price minus 20% bulk discount)- Cost Premium - US$0- Average Lifetime – 12 years
0.2%
Financial Assumptions Total 10,477.9 10,459.0 18.9 0.2%
2,401,837 2,385,794
0
500,000
1,000,000
1,500,000
2,000,000
2,500,000
3,000,000
Base Case Proposed
lb/y
r
Annual CO2 Emissions
6,658
2,992
6,580
2,966
0
2,000
4,000
6,000
8,000
SO2 (lb/yr) NOX (lb/yr)
g/yr
Annual SO2 and NOX EmissionsBase Case
Proposed
10,478 10,459
0
2,000
4,000
6,000
8,000
10,000
12,000
Base Case Proposed
MBt
u/yr
Annual Total Energy Use
Issued February 1, 2011 138 Existing Hotels Energy Analysis - Green Engage/Solutions

Additional Capital CostHVAC Plant First Cost Reductions
Cooling Plant SavingsHeating Plant Savings
Energy E-07 Energy Efficient Guest Room Refrigerators
Individual Resource Calculations Install or Replace Immediately Existing Hotels Temperate
Annual Resource Cost Summary Financial Table Financial Results Summary
ResourceAnnual Resource Savings
(+) / Loss (-) Unit CostAnnual Savings (+) /
Loss (-)Yr.
Costs (Marginal/Maint/
Replace)
Savings (+) / Loss (-)
Natural gas -318 therms $0.9000 -$286Electricity 14,861 kWh $0.1028 $1,528
Cash FlowInitial Marginal Cost $9,000
$1,255Initial Annual Savings
Water & sewer 0 Gals $0.0037 $0 0 ($9,000) $01 $0 $1,255 $1,255
($9,000) Simple Payback 6.9 yrs
($9,000) 3 $0 $1,281 $1,281Capital Costs Savings Summary 2 $0 $1,268 $1,268
4 $0 $1,294 $1,294 First Year Yield On Marginal Cost 13.9%
14.9%IRR
N/A tons $0 5 $0 $1,334 $1,334N/A MBh $0 6 $0 $1 376 $1 376Heating Plant Savings
Airside Distribution SavingsTotal Additional Capital Cost:
Estimated Useful Life (yrs)Percent replacedReplacement Cost Premium (In 2010 Dollars)
Base YearValuation TypeProject Analysis PeriodInflation RateDiscount Rate for Defined ValuationEnergy Escalation Rate (Nominal)
N/A cfm $0 7 $0 $1,419N/A MBh $0 6 $0 $1,376 $1,376 NPV
$1,419($9,000) 8 $0 $1,463 $1,463
$6,357
9 $0 $1,509 $1,509
12 11 $0 $1,608 $1,608Replacement Life and Cost Summary 10 $0 $1,557 $1,557
$0 13 $0 $1,714 $1,714100% 12 $0 $1,660 $1,660
14 $0 $1,770 $1,770
2010 16 $0 $1,888 $1,888Financial Analysis 15 $0 $1,828 $1,828
20 18 $0 $2,014 $2,014Defined 17 $0 $1,950 $1,950
7.19% 20 $0 $2,157 $2,1572.79% 19 $0 $2,080 $2,080
(See Table in Assumptions)
($15,000)($10,000)($5,000)
$0 $5,000
$10,000 $15,000 $20,000 $25,000 $30,000
0 5 10 15 20
Net
Cas
h Fl
ow (E
nd o
f Yea
r)
Years
Simple Payback Graph
Issued February 1, 2011 139 Existing Hotels Energy Analysis - Green Engage/Solutions

Base CaseOne 3 cu. ft. non-Energy Star refrigerator per guest
room.
Refrigerator is replaced with Energy Star rated equivalent. Overall saving of 24% on electricity.
Proposed Modifications
Base Case Proposed % Savings (+) / Loss (-)
Individual Resource Calculations Install or Replace Immediately Existing Hotels
2,992 2,967 0.8%Space Heating - Elec 0.0 0.0 0.0 0.0%Lighting 1,831.3 1,831.3 0.0 0.0% NOX (lb/yr)
CO2 (lb/yr) 2,401,837 2,386,252 0.6%
Temperate
Energy E-07 Energy Efficient Televisions
Energy End-Use Benchmark Comparison Environmental Impact Analysis
Energy End-Use
Base Case Energy Use
Proposed Energy Use
Savings (+) / Loss (-)
Savings (+) / Loss (-)
SO2 (lb/yr) 6,658 6,582 1.1%MBtu/yr %
Emissions
MBtu/yr MBtu/yr
Pumps 25.5 25.5 0.0 0.0%
HVAC Fans 409 6 409 2 0 4 0 1%
Space Heating - Gas 3,698.6 3,729.5 -30.9 -0.8%Space Cooling 903.7 896.5 7.2 0.8%
0.6%Heat Rejection 0.0 0.0 0.0 0.0%
2,401,837 2,386,252
1,500,000
2,000,000
2,500,000
3,000,000
lb/y
r
Annual CO2 Emissions
HVAC Fans 409.6 409.2 0.4 0.1%Receptacles - Elec 1,149.8 1,108.1 41.7 3.6%Receptacles - Gas 425.8 425.8 0.0 0.0%Base Utilities - Gas 2,033.7 2,033.7 0.0 0.0%
- 150, 32 inch energy star televisions- US$400 average outright cost per unit (including bulk discount)- US$0 cost premium over non-energy star TVs- Average lifetime - 10 years
0.2%
Financial Assumptions Total 10,477.9 10,459.6 18.4 0.2%
2,401,837 2,386,252
0
500,000
1,000,000
1,500,000
2,000,000
2,500,000
3,000,000
Base Case Proposed
lb/y
r
Annual CO2 Emissions
6,658
2,992
6,582
2,967
0
2,000
4,000
6,000
8,000
SO2 (lb/yr) NOX (lb/yr)
g/yr
Annual SO2 and NOX EmissionsBase Case
Proposed
10,478 10,460
0
2,000
4,000
6,000
8,000
10,000
12,000
Base Case Proposed
MBt
u/yr
Annual Total Energy Use
Issued February 1, 2011 140 Existing Hotels Energy Analysis - Green Engage/Solutions

Additional Capital CostHVAC Plant First Cost Reductions
Cooling Plant SavingsHeating Plant Savings
Energy E-07 Energy Efficient Televisions
Individual Resource Calculations Install or Replace Immediately Existing Hotels Temperate
Annual Resource Cost Summary Financial Table Financial Results Summary
ResourceAnnual Resource Savings
(+) / Loss (-) Unit CostAnnual Savings (+) /
Loss (-)Yr.
Costs (Marginal/Maint/
Replace)
Savings (+) / Loss (-) Cash Flow
Initial Marginal Cost $30,000
$1,219Natural gas -309 therms $0.9000 -$278Electricity 14,437 kWh $0.1028 $1,484 Initial Annual Savings
Water & sewer 0 Gals $0.0037 $0 0 ($30,000) $0 ($30,000)1 $0 $1,219 $1,219
Simple Payback 20 yrs
($30,000) 3 $0 $1,245 $1,245Capital Costs Savings Summary 2 $0 $1,232 $1,232
4 $0 $1,257 $1,257 First Year Yield On Marginal Cost 4.1%
0.4%IRR
N/A MBh $0 6 $0 $1 336 $1 336N/A tons $0 5 $0 $1,296 $1,296
Heating Plant SavingsAirside Distribution Savings
Total Additional Capital Cost:
Estimated Useful Life (yrs)Percent replacedReplacement Cost Premium (In 2010 Dollars)
Base YearValuation TypeProject Analysis PeriodInflation RateDiscount Rate for Defined ValuationEnergy Escalation Rate (Nominal)
N/A cfm $0 7 $0 $1,378N/A MBh $0 6 $0 $1,336 $1,336 NPV
($30,000) 8 $0 $1,421 $1,421
-$13,656
9 $0 $1,465 $1,465
$1,378
10 11 $0 $1,562 $1,562Replacement Life and Cost Summary 10 $0 $1,513 $1,513
14 $0 $1,719 $1,719$0 13 $0 $1,665 $1,665
2010 16 $0 $1,834 $1,834Financial Analysis 15 $0 $1,776 $1,776
20 18 $0 $1,956 $1,956Defined 17 $0 $1,894 $1,894
7.19% 20 $0 $2,096 $2,0962.79% 19 $0 $2,020 $2,020
(See Table in Assumptions)
100% 12 $0 $1,613 $1,613
($35,000)($30,000)($25,000)($20,000)($15,000)($10,000)($5,000)
$0 $5,000
0 5 10 15 20
Net
Cas
h Fl
ow (E
nd o
f Yea
r)
Years
Simple Payback Graph
Issued February 1, 2011 141 Existing Hotels Energy Analysis - Green Engage/Solutions

Base CaseEach guest room contains a total of 12 light bulbs.
There is a 50/50 split of 75W incandescent bulbs and 25W CFLs, giving a lighting density of 1.5 W/sf. Bulbs
operate for 8 hours/day.
All 75W incandescent bulbs are replaced with 25W CFLs (6 per room or 900 in total). The guest room
lighting density is reduced to 0.75 W/sf.
Proposed Modifications
Base Case Proposed % Savings (+) / Loss (-)
Individual Resource Calculations Install or Replace Immediately Existing Hotels
2,992 2,703 9.6%Space Heating - Elec 0.0 0.0 0.0 0.0%Lighting 1,831.3 1,350.6 480.6 26.2% NOX (lb/yr)
CO2 (lb/yr) 2,401,837 2,224,243 7.4%
Temperate
Energy E-09 Zero Use of Incandescent Lamps in Guest Rooms
Energy End-Use Benchmark Comparison Environmental Impact Analysis
Energy End-Use
Base Case Energy Use
Proposed Energy Use
Savings (+) / Loss (-)
Savings (+) / Loss (-)
SO2 (lb/yr) 6,658 5,787 13.1%MBtu/yr %
Emissions
MBtu/yr MBtu/yr
Pumps 25.5 25.5 0.0 -0.1%
HVAC Fans 409 6 405 2 4 4 1 1%
Space Heating - Gas 3,698.6 4,062.2 -363.6 -9.8%Space Cooling 903.7 823.9 79.7 8.8%
7.4%Heat Rejection 0.0 0.0 0.0 0.0%
2,401,8372,224,243
1,500,000
2,000,000
2,500,000
3,000,000
lb/y
r
Annual CO2 Emissions
lighting density is reduced to 0.75 W/sf. HVAC Fans 409.6 405.2 4.4 1.1%Receptacles - Elec 1,149.8 1,149.8 0.0 0.0%Receptacles - Gas 425.8 425.8 0.0 0.0%Base Utilities - Gas 2,033.7 2,033.7 0.0 0.0%
- Total of 12 bulbs per room with 50% designated for replacement- Average Energy Star cost per unit of US$3.40 with bulb life of 6,000 – 12,000 hours- Conventional cost per unit of US$0.60 with bulb life of 750 – 1,000 hours- Common building laborer staff rate- Replacement cost premium is a savings because light bulbs will last longer for the price paid
1.9%
Financial Assumptions Total 10,477.9 10,276.7 201.2 1.9%
2,401,8372,224,243
0
500,000
1,000,000
1,500,000
2,000,000
2,500,000
3,000,000
Base Case Proposed
lb/y
r
Annual CO2 Emissions
6,658
2,992
5,787
2,703
0
2,000
4,000
6,000
8,000
SO2 (lb/yr) NOX (lb/yr)
g/yr
Annual SO2 and NOX EmissionsBase Case
Proposed
10,478 10,277
0
2,000
4,000
6,000
8,000
10,000
12,000
Base Case Proposed
MBt
u/yr
Annual Total Energy Use
Issued February 1, 2011 142 Existing Hotels Energy Analysis - Green Engage/Solutions
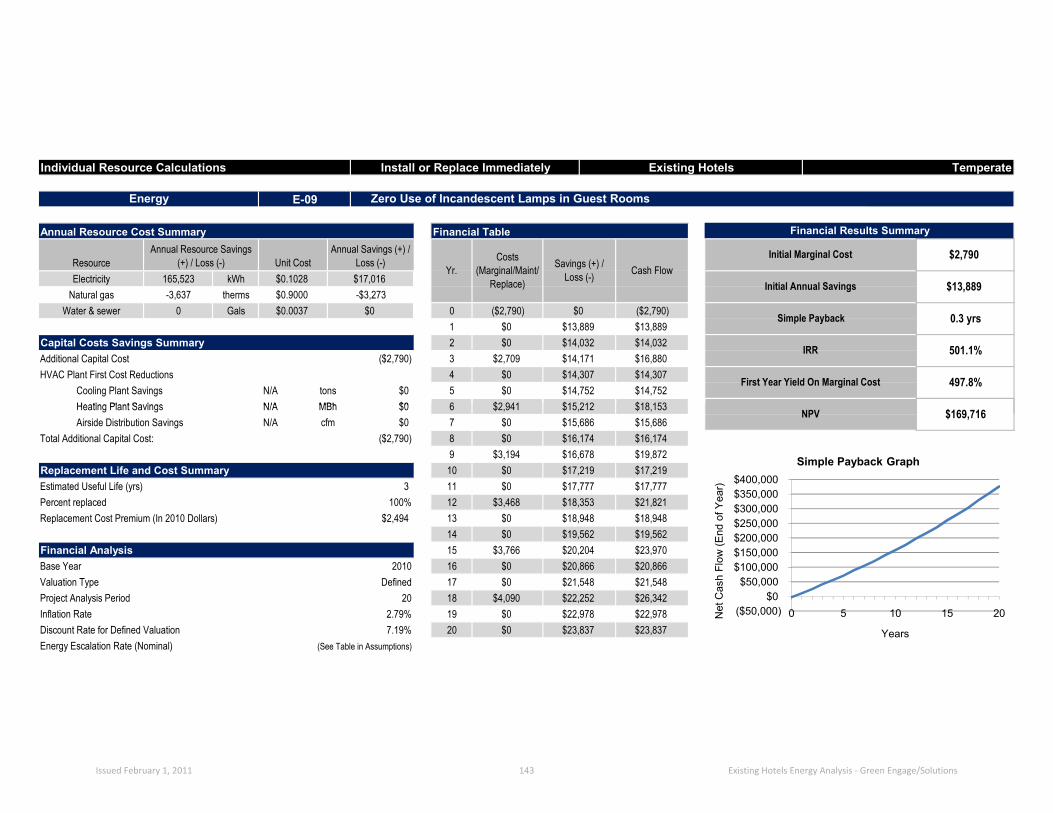
Additional Capital CostHVAC Plant First Cost Reductions
Cooling Plant SavingsHeating Plant Savings
Energy E-09 Zero Use of Incandescent Lamps in Guest Rooms
Individual Resource Calculations Install or Replace Immediately Existing Hotels Temperate
Annual Resource Cost Summary Financial Table Financial Results Summary
ResourceAnnual Resource Savings
(+) / Loss (-) Unit CostAnnual Savings (+) /
Loss (-)Yr.
Costs (Marginal/Maint/
Replace)
Savings (+) / Loss (-) Cash Flow
Initial Marginal Cost $2,790
$13,889Natural gas -3,637 therms $0.9000 -$3,273Electricity 165,523 kWh $0.1028 $17,016 Initial Annual Savings
Water & sewer 0 Gals $0.0037 $0 0 ($2,790) $0 ($2,790)1 $0 $13,889 $13,889
Simple Payback 0.3 yrs
($2,790) 3 $2,709 $14,171 $16,880Capital Costs Savings Summary 2 $0 $14,032 $14,032
4 $0 $14,307 $14,307 First Year Yield On Marginal Cost 497.8%
501.1%IRR
N/A MBh $0 6 $2 941 $15 212 $18 153N/A tons $0 5 $0 $14,752 $14,752
Heating Plant SavingsAirside Distribution Savings
Total Additional Capital Cost:
Estimated Useful Life (yrs)Percent replacedReplacement Cost Premium (In 2010 Dollars)
Base YearValuation TypeProject Analysis PeriodInflation RateDiscount Rate for Defined ValuationEnergy Escalation Rate (Nominal)
N/A cfm $0 7 $0 $15,686N/A MBh $0 6 $2,941 $15,212 $18,153 NPV
($2,790) 8 $0 $16,174 $16,174
$169,716
9 $3,194 $16,678 $19,872
$15,686
3 11 $0 $17,777 $17,777Replacement Life and Cost Summary 10 $0 $17,219 $17,219
14 $0 $19,562 $19,562$2,494 13 $0 $18,948 $18,948
2010 16 $0 $20,866 $20,866Financial Analysis 15 $3,766 $20,204 $23,970
20 18 $4,090 $22,252 $26,342Defined 17 $0 $21,548 $21,548
7.19% 20 $0 $23,837 $23,8372.79% 19 $0 $22,978 $22,978
(See Table in Assumptions)
100% 12 $3,468 $18,353 $21,821
($50,000)$0
$50,000 $100,000 $150,000 $200,000 $250,000 $300,000 $350,000 $400,000
0 5 10 15 20Net
Cas
h Fl
ow (E
nd o
f Yea
r)
Years
Simple Payback Graph
Issued February 1, 2011 143 Existing Hotels Energy Analysis - Green Engage/Solutions

Base CaseCorridors contain 40 light bulbs per floor. There is a
50/50 split of 75W incandescent bulbs and 25W CFLs, giving a lighting density of 0.7 W/sf. Bulbs operate for
24 hours/day.
All 75W incandescent bulbs are replaced with 25W CFLs (20 per floor or 100 in total). The guest room
lighting density is reduced to 0.35 W/sf.
Proposed Modifications
Base Case Proposed % Savings (+) / Loss (-)
Individual Resource Calculations Install or Replace Immediately Existing Hotels
2,992 2,897 3.2%Space Heating - Elec 0.0 0.0 0.0 0.0%Lighting 1,831.3 1,674.3 157.0 8.6% NOX (lb/yr)
CO2 (lb/yr) 2,401,837 2,343,176 2.4%
Temperate
Energy E-09 Zero Use of Incandescent Lamps in Circulation Spaces
Energy End-Use Benchmark Comparison Environmental Impact Analysis
Energy End-Use
Base Case Energy Use
Proposed Energy Use
Savings (+) / Loss (-)
Savings (+) / Loss (-)
SO2 (lb/yr) 6,658 6,372 4.3%MBtu/yr %
Emissions
MBtu/yr MBtu/yr
Pumps 25.5 25.5 0.0 -0.1%
HVAC Fans 409 6 406 0 3 7 0 9%
Space Heating - Gas 3,698.6 3,814.4 -115.8 -3.1%Space Cooling 903.7 879.1 24.6 2.7%
2.4%Heat Rejection 0.0 0.0 0.0 0.0%
2,401,837 2,343,176
1,500,000
2,000,000
2,500,000
3,000,000
lb/y
r
Annual CO2 Emissions
lighting density is reduced to 0.35 W/sf. HVAC Fans 409.6 406.0 3.7 0.9%Receptacles - Elec 1,149.8 1,149.8 0.0 0.0%Receptacles - Gas 425.8 425.8 0.0 0.0%Base Utilities - Gas 2,033.7 2,033.7 0.0 0.0%
- Total of 40 bulbs per corridor with 50% designated for replacement- This amounts to 100 bulbs to be replaced across the entire building- Average Energy Star cost per unit of US$3.40 with bulb life of 6,000 – 12,000 hours- Conventional cost per unit of US$0.60 with bulb life of 750 – 1,000 hours- Common building laborer staff rate- Replacement cost premium is a savings because light bulbs will last longer for the price paid
0.7%
Financial Assumptions Total 10,477.9 10,408.5 69.5 0.7%
2,401,837 2,343,176
0
500,000
1,000,000
1,500,000
2,000,000
2,500,000
3,000,000
Base Case Proposed
lb/y
r
Annual CO2 Emissions
6,658
2,992
6,372
2,897
0
2,000
4,000
6,000
8,000
SO2 (lb/yr) NOX (lb/yr)
g/yr
Annual SO2 and NOX EmissionsBase Case
Proposed
10,478 10,408
0
2,000
4,000
6,000
8,000
10,000
12,000
Base Case Proposed
MBt
u/yr
Annual Total Energy Use
Issued February 1, 2011 144 Existing Hotels Energy Analysis - Green Engage/Solutions

Additional Capital CostHVAC Plant First Cost Reductions
Cooling Plant SavingsHeating Plant Savings
Energy E-09 Zero Use of Incandescent Lamps in Circulation Spaces
Individual Resource Calculations Install or Replace Immediately Existing Hotels Temperate
Annual Resource Cost Summary Financial Table Financial Results Summary
ResourceAnnual Resource Savings
(+) / Loss (-) Unit CostAnnual Savings (+) /
Loss (-)Yr.
Costs (Marginal/Maint/
Replace)
Savings (+) / Loss (-) Cash Flow
Initial Marginal Cost $310
$4,589Natural gas -1,158 therms $0.9000 -$1,042Electricity 54,296 kWh $0.1028 $5,582 Initial Annual Savings
Water & sewer 0 Gals $0.0037 $0 0 ($310) $0 ($310)1 $285 $4,589 $4,874
Simple Payback 0.1 yrs
($310) 3 $301 $4,685 $4,986Capital Costs Savings Summary 2 $293 $4,638 $4,930
4 $309 $4,731 $5,041 First Year Yield On Marginal Cost 1480.3%
1573.3%IRR
N/A MBh $0 6 $327 $5 031 $5 358N/A tons $0 5 $318 $4,879 $5,197
Heating Plant SavingsAirside Distribution Savings
Total Additional Capital Cost:
Estimated Useful Life (yrs)Percent replacedReplacement Cost Premium (In 2010 Dollars)
Base YearValuation TypeProject Analysis PeriodInflation RateDiscount Rate for Defined ValuationEnergy Escalation Rate (Nominal)
N/A cfm $0 7 $336 $5,188N/A MBh $0 6 $327 $5,031 $5,358 NPV
($310) 8 $345 $5,350 $5,695
$57,090
9 $355 $5,517 $5,871
$5,524
1 11 $375 $5,880 $6,255Replacement Life and Cost Summary 10 $365 $5,696 $6,060
14 $407 $6,471 $6,879$277 13 $396 $6,268 $6,664
2010 16 $430 $6,904 $7,334Financial Analysis 15 $418 $6,684 $7,103
20 18 $454 $7,365 $7,819Defined 17 $442 $7,131 $7,573
7.19% 20 $480 $7,890 $8,3702.79% 19 $467 $7,606 $8,073
(See Table in Assumptions)
100% 12 $385 $6,071 $6,456
($20,000)$0
$20,000 $40,000 $60,000 $80,000
$100,000 $120,000 $140,000
0 5 10 15 20Net
Cas
h Fl
ow (E
nd o
f Yea
r)
Years
Simple Payback Graph
Issued February 1, 2011 145 Existing Hotels Energy Analysis - Green Engage/Solutions

Base CaseOffices, food preparation, lockers, laundry, mechanical and
electrical spaces contain a total of 200 light bulbs. There is a 50/50 split of 75W incandescent bulbs and 25W CFLs, giving an average lighting density of 1.4 W/sf. Bulbs operate for 8
hours/day.
All 75W incandescent bulbs are replaced with 25W CFLs (100 in total). The average lighting density is reduced to
0.7 W/sf.
Proposed Modifications
Base Case Proposed % Savings (+) / Loss (-)
Individual Resource Calculations Install or Replace Immediately Existing Hotels
2,992 2,969 0.8%Space Heating - Elec 0.0 0.0 0.0 0.0%Lighting 1,831.3 1,794.3 36.9 2.0% NOX (lb/yr)
CO2 (lb/yr) 2,401,837 2,388,301 0.6%
Temperate
Energy E-09 Zero Use of Incandescent Lamps in Back of House
Energy End-Use Benchmark Comparison Environmental Impact Analysis
Energy End-Use
Base Case Energy Use
Proposed Energy Use
Savings (+) / Loss (-)
Savings (+) / Loss (-)
SO2 (lb/yr) 6,658 6,586 1.1%MBtu/yr %
Emissions
MBtu/yr MBtu/yr
Pumps 25.5 25.3 0.2 0.8%
HVAC Fans 409 6 408 1 1 5 0 4%
Space Heating - Gas 3,698.6 3,737.9 -39.3 -1.1%Space Cooling 903.7 895.8 7.9 0.9%
0.6%Heat Rejection 0.0 0.0 0.0 0.0%
2,401,837 2,388,301
1,500,000
2,000,000
2,500,000
3,000,000
lb/y
r
Annual CO2 Emissions
HVAC Fans 409.6 408.1 1.5 0.4%Receptacles - Elec 1,149.8 1,149.8 0.0 0.0%Receptacles - Gas 425.8 425.8 0.0 0.0%Base Utilities - Gas 2,033.7 2,033.8 -0.1 0.0%
- Total of 200 bulbs in back of house with 50% designated for replacement- Average Energy Star cost per unit of US$3.40 with bulb life of 6,000 – 12,000 hours- Conventional cost per unit of US$0.60 with bulb life of 750 – 1,000 hours- Common building laborer staff rate- Replacement cost premium is a savings because light bulbs will last longer for the price paid
0.1%
Financial Assumptions Total 10,477.9 10,470.8 7.1 0.1%
2,401,837 2,388,301
0
500,000
1,000,000
1,500,000
2,000,000
2,500,000
3,000,000
Base Case Proposed
lb/y
r
Annual CO2 Emissions
6,658
2,992
6,586
2,969
0
2,000
4,000
6,000
8,000
SO2 (lb/yr) NOX (lb/yr)
g/yr
Annual SO2 and NOX EmissionsBase Case
Proposed
10,478 10,471
0
2,000
4,000
6,000
8,000
10,000
12,000
Base Case Proposed
MBt
u/yr
Annual Total Energy Use
Issued February 1, 2011 146 Existing Hotels Energy Analysis - Green Engage/Solutions

Additional Capital CostHVAC Plant First Cost Reductions
Cooling Plant SavingsHeating Plant Savings
Energy E-09 Zero Use of Incandescent Lamps in Back of House
Individual Resource Calculations Install or Replace Immediately Existing Hotels Temperate
Annual Resource Cost Summary Financial Table Financial Results Summary
ResourceAnnual Resource Savings
(+) / Loss (-) Unit CostAnnual Savings (+) /
Loss (-)Yr.
Costs (Marginal/Maint/
Replace)
Savings (+) / Loss (-) Cash Flow
Initial Marginal Cost $310
$1,055Natural gas -394 therms $0.9000 -$355Electricity 13,642 kWh $0.1028 $1,402 Initial Annual Savings
Water & sewer 0 Gals $0.0037 $0 0 ($310) $0 ($310)1 $0 $1,055 $1,055
Simple Payback 0.3 yrs
($310) 3 $301 $1,069 $1,369Capital Costs Savings Summary 2 $0 $1,062 $1,062
4 $0 $1,074 $1,074 First Year Yield On Marginal Cost 340.4%
344.9%IRR
N/A MBh $0 6 $327 $1 141 $1 468N/A tons $0 5 $0 $1,107 $1,107
Heating Plant SavingsAirside Distribution Savings
Total Additional Capital Cost:
Estimated Useful Life (yrs)Percent replacedReplacement Cost Premium (In 2010 Dollars)
Base YearValuation TypeProject Analysis PeriodInflation RateDiscount Rate for Defined ValuationEnergy Escalation Rate (Nominal)
N/A cfm $0 7 $0 $1,177N/A MBh $0 6 $327 $1,141 $1,468 NPV
($310) 8 $0 $1,213 $1,213
$12,971
9 $355 $1,250 $1,605
$1,177
3 11 $0 $1,332 $1,332Replacement Life and Cost Summary 10 $0 $1,290 $1,290
14 $0 $1,464 $1,464$277 13 $0 $1,419 $1,419
2010 16 $0 $1,558 $1,558Financial Analysis 15 $418 $1,510 $1,929
20 18 $454 $1,656 $2,111Defined 17 $0 $1,606 $1,606
7.19% 20 $0 $1,771 $1,7712.79% 19 $0 $1,708 $1,708
(See Table in Assumptions)
100% 12 $385 $1,375 $1,760
($5,000)$0
$5,000 $10,000 $15,000 $20,000 $25,000 $30,000 $35,000
0 5 10 15 20Net
Cas
h Fl
ow (E
nd o
f Yea
r)
Years
Simple Payback Graph
Issued February 1, 2011 147 Existing Hotels Energy Analysis - Green Engage/Solutions

Base Case
Corridor lighting load reduced by 40% to 0.42 W/sf. Operating schedule remains unchanged. Reduction in load based on US
EPA predictions, assuming lighting levels turn down by 50% h i d
Corridors have a lighting density of 0.7 W/sf. Lights operate for 24 hours a day.
Proposed Modifications
Base Case Proposed % Savings (+) / Loss (-)
Individual Resource Calculations Install or Replace Immediately Existing Hotels
2,992 2,916 2.5%Space Heating - Elec 0.0 0.0 0.0 0.0%Lighting 1,831.3 1,706.3 125.0 6.8% NOX (lb/yr)
CO2 (lb/yr) 2,401,837 2,354,615 2.0%
Temperate
Energy E-10 Occupancy Sensors in Corridors for Decorative Features
Energy End-Use Benchmark Comparison Environmental Impact Analysis
Energy End-Use
Base Case Energy Use
Proposed Energy Use
Savings (+) / Loss (-)
Savings (+) / Loss (-)
SO2 (lb/yr) 6,658 6,429 3.4%MBtu/yr %
Emissions
MBtu/yr MBtu/yr
Pumps 25.5 25.5 0.0 0.0%
HVAC Fans 409 6 406 6 3 1 0 8%
Space Heating - Gas 3,698.6 3,788.8 -90.2 -2.4%Space Cooling 903.7 883.5 20.2 2.2%
2.0%Heat Rejection 0.0 0.0 0.0 0.0%
2,401,837 2,354,615
1,500,000
2,000,000
2,500,000
3,000,000
lb/y
r
Annual CO2 Emissions
when unoccupied. HVAC Fans 409.6 406.6 3.1 0.8%Receptacles - Elec 1,149.8 1,149.8 0.0 0.0%Receptacles - Gas 425.8 425.8 0.0 0.0%Base Utilities - Gas 2,033.7 2,033.7 0.0 0.0%
- 5 sensors required per floor - therefore, 25 total per building- US$193 per sensor including electrician labour- Sensor lifetime – 10 years- Increase bulb lifetime by 40% (Savings includes this extended lifetime)- All 200 corridor light bulbs are assumed to already be CFLs
0.6%
Financial Assumptions Total 10,477.9 10,419.9 58.0 0.6%
2,401,837 2,354,615
0
500,000
1,000,000
1,500,000
2,000,000
2,500,000
3,000,000
Base Case Proposed
lb/y
r
Annual CO2 Emissions
6,658
2,992
6,429
2,916
0
2,000
4,000
6,000
8,000
SO2 (lb/yr) NOX (lb/yr)
g/yr
Annual SO2 and NOX EmissionsBase Case
Proposed
10,478 10,420
0
2,000
4,000
6,000
8,000
10,000
12,000
Base Case Proposed
MBt
u/yr
Annual Total Energy Use
Issued February 1, 2011 148 Existing Hotels Energy Analysis - Green Engage/Solutions

Additional Capital CostHVAC Plant First Cost Reductions
Cooling Plant SavingsHeating Plant Savings
Energy E-10 Occupancy Sensors in Corridors for Decorative Features
Individual Resource Calculations Install or Replace Immediately Existing Hotels Temperate
Annual Resource Cost Summary Financial Table Financial Results Summary
ResourceAnnual Resource Savings
(+) / Loss (-) Unit CostAnnual Savings (+) /
Loss (-)Yr.
Costs (Marginal/Maint/
Replace)
Savings (+) / Loss (-)
Natural gas -902 therms $0.9000 -$812Electricity 43,443 kWh $0.1028 $4,466
Cash FlowInitial Marginal Cost $4,825
$3,974Initial Annual Savings
($4,825) Simple Payback 1.3 yrsWater & sewer 0 Gals $0.0037 $0 0 ($4,825) $0
($4,825) 3 $0 $4,070 $4,070Capital Costs Savings Summary 2 $0 $4,023 $4,023
1 $0 $3,974 $3,974
4 $0 $4,117 $4,117 First Year Yield On Marginal Cost 82.4%
83.6%IRR
N/A tons $0 5 $0 $4,244 $4,244N/A MBh $0 6 $0 $4 375 $4 375Heating Plant Savings
Airside Distribution SavingsTotal Additional Capital Cost:
Estimated Useful Life (yrs)Percent replacedReplacement Cost Premium (In 2010 Dollars)
Base YearValuation TypeProject Analysis PeriodInflation RateDiscount Rate for Defined ValuationEnergy Escalation Rate (Nominal)
N/A cfm $0 7 $0 $4,511N/A MBh $0 6 $0 $4,375 $4,375 NPV
$4,511($4,825) 8 $0 $4,651 $4,651
$39,385
9 $0 $4,795 $4,795
10 11 $0 $5,108 $5,108Replacement Life and Cost Summary 10 ($6,350) $4,949 ($1,402)
($4,825) 13 $0 $5,441 $5,441100% 12 $0 $5,272 $5,272
14 $0 $5,616 $5,616
2010 16 $0 $5,988 $5,988Financial Analysis 15 $0 $5,799 $5,799
20 18 $0 $6,385 $6,385Defined 17 $0 $6,183 $6,183
7.19% 20 $0 $6,835 $6,8352.79% 19 $0 $6,592 $6,592
(See Table in Assumptions)
($20,000)
$0
$20,000
$40,000
$60,000
$80,000
$100,000
0 5 10 15 20
Net
Cas
h Fl
ow (E
nd o
f Yea
r)
Years
Simple Payback Graph
Issued February 1, 2011 149 Existing Hotels Energy Analysis - Green Engage/Solutions

Base Case
Proposed ModificationsInfiltration is reduced by a third, to 0.2 air changes per
hour, in all perimeter spaces.
Base Case Proposed % Savings (+) / Loss (-)
Individual Resource Calculations Install or Replace Immediately Existing Hotels
2,992 2,982 0.3%Space Heating - Elec 0.0 0.0 0.0 0.0%Lighting 1,831.3 1,831.3 0.0 0.0% NOX (lb/yr)
Space Heating - Gas
CO2 (lb/yr) 2,401,837 2,384,799 0.7%
Temperate
Building Materials B-04 Weather Stripping
Energy End-Use Benchmark Comparison Environmental Impact Analysis
Energy End-Use
Base Case Energy Use
Proposed Energy Use
Savings (+) / Loss (-)
Savings (+) / Loss (-)
SO2 (lb/yr) 6,658 6,673 -0.2%MBtu/yr %
Emissions
MBtu/yr MBtu/yr
Infiltration of 0.3 air changes per hour in all perimeter spaces.
Pumps 25.5 25.2 0.3 1.0%
HVAC Fans 409 6 409 0 0 7 0 2%
3,698.6 3,520.0 178.6 4.8%Space Cooling 903.7 914.4 -10.7 -1.2%
0.7%Heat Rejection 0.0 0.0 0.0 0.0%
2,401,837 2,384,799
1,500,000
2,000,000
2,500,000
3,000,000
lb/y
r
Annual CO2 Emissions
HVAC Fans 409.6 409.0 0.7 0.2%Receptacles - Elec 1,149.8 1,149.8 0.0 0.0%Receptacles - Gas 425.8 425.8 0.0 0.0%Base Utilities - Gas 2,033.7 2,033.6 0.1 0.0%
- Material cost of weather stripping – US$0.88/ft- 5ft x 5ft window on 130 rooms requiring 1 hour of carpenter labor rate per window- 5ft x 10ft window on 20 corner rooms requiring 1.5 hour of carpenter labor per window- Average weatherstripping lifetime – 10 years 1.6%
Financial Assumptions Total 10,477.9 10,309.0 168.9 1.6%
2,401,837 2,384,799
0
500,000
1,000,000
1,500,000
2,000,000
2,500,000
3,000,000
Base Case Proposed
lb/y
r
Annual CO2 Emissions
6,658
2,992
6,673
2,982
0
2,000
4,000
6,000
8,000
SO2 (lb/yr) NOX (lb/yr)
g/yr
Annual SO2 and NOX EmissionsBase Case
Proposed
10,478 10,309
0
2,000
4,000
6,000
8,000
10,000
12,000
Base Case Proposed
MBt
u/yr
Annual Total Energy Use
Issued February 1, 2011 150 Existing Hotels Energy Analysis - Green Engage/Solutions

Additional Capital CostHVAC Plant First Cost Reductions
Cooling Plant SavingsHeating Plant Savings
Building Materials B-04 Weather Stripping
Individual Resource Calculations Install or Replace Immediately Existing Hotels Temperate
Annual Resource Cost Summary Financial Table Financial Results Summary
ResourceAnnual Resource Savings
(+) / Loss (-) Unit CostAnnual Savings (+) /
Loss (-)Yr.
Costs (Marginal/Maint/
Replace)
Savings (+) / Loss (-) Cash Flow
Initial Marginal Cost $11,540
$1,394Natural gas 1,788 therms $0.9000 $1,609Electricity -2,875 kWh $0.1028 ($296) Initial Annual Savings
Water & sewer 0 Gals $0.0037 $0 0 ($11,540) $0 ($11,540)1 $0 $1,394 $1,394
Simple Payback 7.1 yrs
($11,540) 3 $0 $1,571 $1,571Capital Costs Savings Summary 2 $0 $1,480 $1,480
4 $0 $1,667 $1,667 First Year Yield On Marginal Cost 12.1%
8.6%IRR
N/A tons $0 5 $0 $1,726 $1,726N/A MBh $0 6 $0 $1 787 $1 787Heating Plant Savings
Airside Distribution SavingsTotal Additional Capital Cost:
Estimated Useful Life (yrs)Percent replacedReplacement Cost Premium (In 2010 Dollars)
Base YearValuation TypeProject Analysis PeriodInflation RateDiscount Rate for Defined ValuationEnergy Escalation Rate (Nominal)
N/A cfm $0 7 $0 $1,851N/A MBh $0 6 $0 $1,787 $1,787 NPV
$1,851($11,540) 8 $0 $1,917 $1,917
$1,365
9 $0 $1,985 $1,985
10 11 $0 $2,128 $2,128Replacement Life and Cost Summary 10 ($15,188) $2,055 ($13,133)
14 $0 $2,362 $2,362($11,540) 13 $0 $2,281 $2,281
2010 16 $0 $2,599 $2,599Financial Analysis 15 $0 $2,478 $2,478
20 18 $0 $2,860 $2,860Defined 17 $0 $2,727 $2,727
7.19% 20 $0 $3,121 $3,1212.79% 19 $0 $3,000 $3,000
(See Table in Assumptions)
100% 12 $0 $2,203 $2,203
($15,000)
($10,000)
($5,000)
$0
$5,000
$10,000
$15,000
$20,000
0 5 10 15 20
Net
Cas
h Fl
ow (E
nd o
f Yea
r)
Years
Simple Payback Graph
Issued February 1, 2011 151 Existing Hotels Energy Analysis - Green Engage/Solutions

Base Case
Proposed ModificationsGuest room thermostat setpoints of 76°F (cooling) and
72°F (heating).
Base Case Proposed % Savings (+) / Loss (-)
Individual Resource Calculations Install or Replace Immediately Existing Hotels
2,992 2,917 2.5%Space Heating - Elec 0.0 0.0 0.0 0.0%Lighting 1,831.3 1,831.3 0.0 0.0% NOX (lb/yr)
Space Heating - Gas
CO2 (lb/yr) 2,401,837 2,330,490 3.0%
Temperate
Mechanical M-09 100% of Guest Rooms have 4F Deadband Thermostats
Energy End-Use Benchmark Comparison Environmental Impact Analysis
Energy End-Use
Base Case Energy Use
Proposed Energy Use
Savings (+) / Loss (-)
Savings (+) / Loss (-)
SO2 (lb/yr) 6,658 6,535 1.8%MBtu/yr %
Emissions
MBtu/yr MBtu/yr
Guest room thermostat setpoints of 74°F (cooling) and 74°F (heating).
Pumps 25.5 25.6 -0.1 -0.3%
HVAC Fans 409 6 411 6 1 9 0 5%
3,698.6 3,352.8 345.8 9.3%Space Cooling 903.7 822.1 81.6 9.0%
3.0%Heat Rejection 0.0 0.0 0.0 0.0%
2,401,837 2,330,490
1,500,000
2,000,000
2,500,000
3,000,000
lb/y
r
Annual CO2 Emissions
HVAC Fans 409.6 411.6 -1.9 -0.5%Receptacles - Elec 1,149.8 1,149.8 0.0 0.0%Receptacles - Gas 425.8 425.8 0.0 0.0%Base Utilities - Gas 2,033.7 2,033.8 -0.1 0.0%
- US$217 per sensor including electrician labour- Average Lifetime – 15 years
4.1%
Financial Assumptions Total 10,477.9 10,052.7 425.3 4.1%
2,401,837 2,330,490
0
500,000
1,000,000
1,500,000
2,000,000
2,500,000
3,000,000
Base Case Proposed
lb/y
r
Annual CO2 Emissions
6,658
2,992
6,535
2,917
0
2,000
4,000
6,000
8,000
SO2 (lb/yr) NOX (lb/yr)
g/yr
Annual SO2 and NOX EmissionsBase Case
Proposed
10,478 10,053
0
2,000
4,000
6,000
8,000
10,000
12,000
Base Case Proposed
MBt
u/yr
Annual Total Energy Use
Issued February 1, 2011 152 Existing Hotels Energy Analysis - Green Engage/Solutions

Additional Capital CostHVAC Plant First Cost Reductions
Cooling Plant SavingsHeating Plant Savings
Mechanical M-09 100% of Guest Rooms have 4F Deadband Thermostats
Individual Resource Calculations Install or Replace Immediately Existing Hotels Temperate
Annual Resource Cost Summary Financial Table Financial Results Summary
ResourceAnnual Resource Savings
(+) / Loss (-) Unit CostAnnual Savings (+) /
Loss (-)Yr.
Costs (Marginal/Maint/
Replace)
Savings (+) / Loss (-) Cash Flow
Initial Marginal Cost $32,550
$5,722Natural gas 3,458 therms $0.9000 $3,112Electricity 23,314 kWh $0.1028 $2,397 Initial Annual Savings
Water & sewer 0 Gals $0.0037 $0 0 ($32,550) $0 ($32,550)1 $0 $5,722 $5,722
Simple Payback 5.3 yrs
($32,550) 3 $0 $6,180 $6,180Capital Costs Savings Summary 2 $0 $5,946 $5,946
4 $0 $6,425 $6,425 First Year Yield On Marginal Cost 17.6%
18.2%IRR
N/A MBh $0 6 $0 $6 867 $6 867N/A tons $0 5 $0 $6,642 $6,642
Heating Plant SavingsAirside Distribution Savings
Total Additional Capital Cost:
Estimated Useful Life (yrs)Percent replacedReplacement Cost Premium (In 2010 Dollars)
Base YearValuation TypeProject Analysis PeriodInflation RateDiscount Rate for Defined ValuationEnergy Escalation Rate (Nominal)
N/A cfm $0 7 $0 $7,099N/A MBh $0 6 $0 $6,867 $6,867 NPV
($32,550) 8 $0 $7,339 $7,339
$27,176
9 $0 $7,587 $7,587
$7,099
15 11 $0 $8,114 $8,114Replacement Life and Cost Summary 10 $0 $7,846 $7,846
14 $0 $8,976 $8,976($32,550) 13 $0 $8,679 $8,679
2010 16 $0 $9,758 $9,758Financial Analysis 15 ($49,147) $9,359 ($39,788)
20 18 $0 $10,609 $10,609Defined 17 $0 $10,175 $10,175
7.19% 20 $0 $11,497 $11,4972.79% 19 $0 $11,063 $11,063
(See Table in Assumptions)
100% 12 $0 $8,392 $8,392
($40,000)
($20,000)
$0
$20,000
$40,000
$60,000
$80,000
$100,000
0 5 10 15 20
Net
Cas
h Fl
ow (E
nd o
f Yea
r)
Years
Simple Payback Graph
Issued February 1, 2011 153 Existing Hotels Energy Analysis - Green Engage/Solutions

Domestic hot water load of 7.40 gallons/person/day. Load calculated by assuming water fixtures exceeding IPC rates by 20%, and default usage by hotel guests.
Base Case
Proposed ModificationsWater fixtures meet IPC rates, reducing the domestic hot water load reduced to 6.16 gallons/person/day.
Individual Resource Calculations Install or Replace Immediately Existing Hotels Temperate
Space Heating - Gas 3,698.6 3,698.6 0.0 0.0%Space Cooling 903.7 903.7 0.0 0.0%Pumps 25.5
Water W-03 Meet IPC 2006 Maximum Flow Rates
Energy End-Use Benchmark Comparison Environmental Impact Analysis
Energy End-Use
Base Case Energy Use
Proposed Energy Use
Savings (+) / Loss (-)
Savings (+) / Loss (-)
MBtu/yr MBtu/yr MBtu/yr %
Emissions Base Case Proposed % Savings (+) / Loss (-)
CO2 (lb/yr) 2,401,837 2,362,054 1.7%
2,992 2,962 1.0%Space Heating - Elec 0.0 0.0 0.0 0.0%
SO2 (lb/yr) 6,658 6,658 0.0%Lighting 1,831.3 1,831.3 0.0 0.0% NOX (lb/yr)
1.7%Heat Rejection 0.0 0.0 0.0 0.0%
25.5 0.0 0.0%
HVAC Fans 409 6 409 6 0 0 0 0%
2,401,837 2,362,054
1,500,000
2,000,000
2,500,000
3,000,000
lb/y
r
Annual CO2 Emissions
Receptacles - Gas 425.8 425.8 0.0 0.0%
HVAC Fans 409.6 409.6 0.0 0.0%Receptacles - Elec 1,149.8 1,149.8 0.0 0.0%
Base Utilities - Gas 2,033.7 1,692.9 340.8 16.8%
- Install aerator on all bathroom faucets and low-flow shower heads
- Cost of each aerator is US$22.85 including common building labour rates- Aerator lifetime – 15 years
- Cost of each low-flow shower head is US$77.50 including plumber labour rates- Shower head lifetime – 10 years
3.3%
Financial Assumptions Total 10,477.9 10,137.1 340.8 3.3%
2,401,837 2,362,054
0
500,000
1,000,000
1,500,000
2,000,000
2,500,000
3,000,000
Base Case Proposed
lb/y
r
Annual CO2 Emissions
6,658
2,992
6,658
2,962
0
2,000
4,000
6,000
8,000
SO2 (lb/yr) NOX (lb/yr)
g/yr
Annual SO2 and NOX EmissionsBase Case
Proposed
10,478 10,137
0
2,000
4,000
6,000
8,000
10,000
12,000
Base Case Proposed
MBt
u/yr
Annual Total Energy Use
Issued February 1, 2011 154 Existing Hotels Energy Analysis - Green Engage/Solutions

Additional Capital CostHVAC Plant First Cost Reductions
Cooling Plant SavingsHeating Plant Savings
Individual Resource Calculations Install or Replace Immediately Existing Hotels Temperate
Water W-03 Meet IPC 2006 Maximum Flow Rates
Annual Resource Cost Summary Financial Table Financial Results Summary
ResourceAnnual Resource Savings
(+) / Loss (-) Unit CostAnnual Savings (+) /
Loss (-)Yr.
Costs (Marginal/Maint/
Replace)
Savings (+) / Loss (-) Cash Flow
Initial Marginal Cost $15,053
$6,424Natural gas 3,409 therms $0.9000 $3,068Electricity 0 kWh $0.1028 $0 Initial Annual Savings
Water & sewer 838,836 Gals $0.0037 $3,104 0 ($15,053) $0 ($15,053)1 $0 $6,424 $6,424
Simple Payback 2.3 yrs
($15,053) 3 $0 $6,963 $6,963Capital Costs Savings Summary 2 $0 $6,687 $6,687
4 $0 $7,251 $7,251 First Year Yield On Marginal Cost 42.7%
45.3%IRR
N/A MBh $0 6 $0 $7 716 $7 716N/A tons $0 5 $0 $7,480 $7,480
Heating Plant SavingsAirside Distribution Savings
Total Additional Capital Cost:
Estimated Useful Life (yrs)Percent replacedReplacement Cost Premium (In 2010 Dollars)
Base YearValuation TypeProject Analysis PeriodInflation RateDiscount Rate for Defined ValuationEnergy Escalation Rate (Nominal)
($3,428)100%
15
($11,625)100%
10
N/A cfm $0 7 $0 $7,960N/A MBh $0 6 $0 $7,716 $7,716 NPV
9 $0 $8,471 $8,471
$7,9608 $0 $8,211 $8,211
$59,073
11 $0 $9,016 $9,016Replacement Life and Cost Summary 10 ($15,300) $8,739 ($6,561)
14 $0 $9,900 $9,90013 $0 $9,596 $9,596
2010 16 $0 $10,672 $10,672Financial Analysis 15 ($5,175) $10,278 $5,103
20 18 $0 $11,507 $11,507Defined 17 $0 $11,081 $11,081
7.19% 20 $0 $12,365 $12,3652.79% 19 $0 $11,950 $11,950
(See Table in Assumptions)
12 $0 $9,302 $9,302
($15,053)
($40,000)($20,000)
$0 $20,000 $40,000 $60,000 $80,000
$100,000 $120,000 $140,000 $160,000
0 5 10 15 20
Net
Cas
h Fl
ow (E
nd o
f Yea
r)
Years
Simple Payback Graph
Issued February 1, 2011 155 Existing Hotels Energy Analysis - Green Engage/Solutions
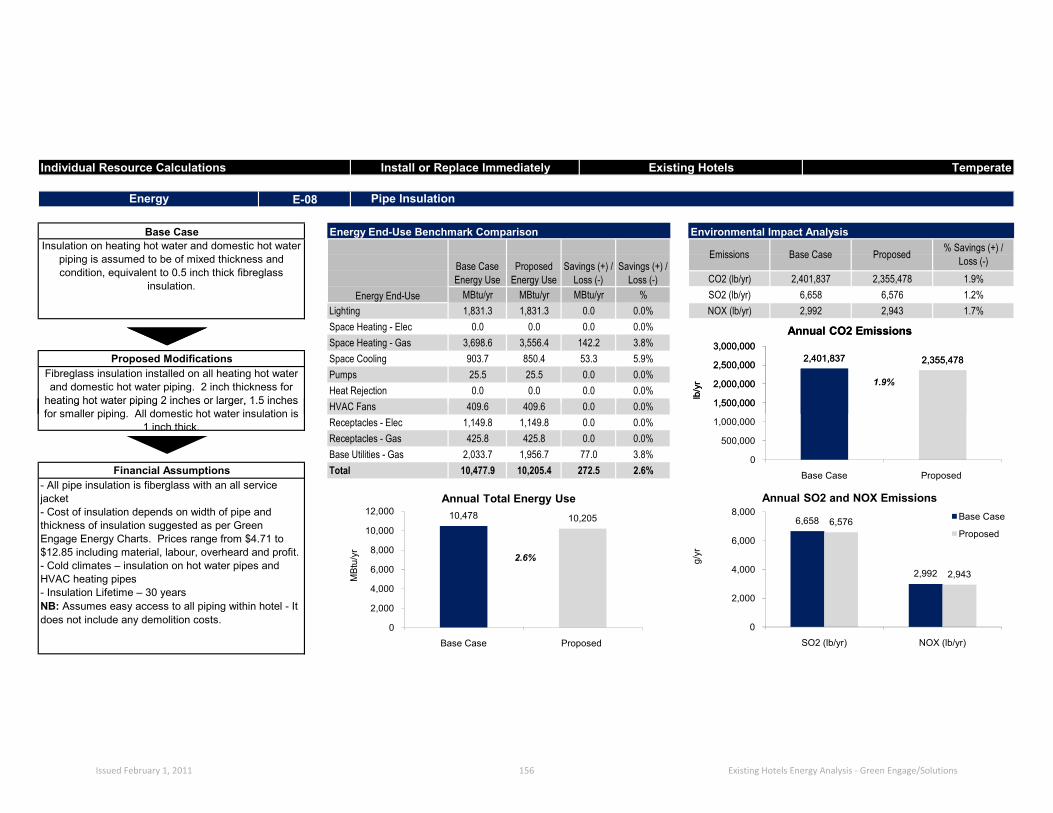
Insulation on heating hot water and domestic hot water piping is assumed to be of mixed thickness and condition, equivalent to 0.5 inch thick fibreglass
insulation.
Base Case
Proposed ModificationsFibreglass insulation installed on all heating hot water and domestic hot water piping. 2 inch thickness for
heating hot water piping 2 inches or larger, 1.5 inches
Emissions Base Case Proposed % Savings (+) / Loss (-)
2,992 2,943 1.7%Space Heating - Elec 0.0 0.0 0.0 0.0%
1.2%Lighting 1,831.3 1,831.3 0.0 0.0% NOX (lb/yr)
Individual Resource Calculations Install or Replace Immediately Existing Hotels
CO2 (lb/yr) 2,401,837 2,355,478 1.9%
Temperate
Energy E-08 Pipe Insulation
Energy End-Use Benchmark Comparison Environmental Impact Analysis
Energy End-Use
Base Case Energy Use
Proposed Energy Use
Savings (+) / Loss (-)
Savings (+) / Loss (-)
MBtu/yr MBtu/yr SO2 (lb/yr) 6,658 6,576MBtu/yr %
Space Heating - Gas 3,698.6 3,556.4 142.2 3.8%Space Cooling 903.7 850.4 53.3 5.9%
1.9%Heat Rejection 0.0 0.0 0.0 0.0%Pumps 25.5 25.5 0.0 0.0%
HVAC Fans 409 6 409 6 0 0 0 0%
2,401,837 2,355,478
1,500,000
2,000,000
2,500,000
3,000,000
lb/y
r
Annual CO2 Emissions
heating hot water piping 2 inches or larger, 1.5 inches for smaller piping. All domestic hot water insulation is
1 inch thick.
- All pipe insulation is fiberglass with an all service jacket- Cost of insulation depends on width of pipe and thickness of insulation suggested as per Green Engage Energy Charts. Prices range from $4.71 to $12.85 including material, labour, overheard and profit.- Cold climates – insulation on hot water pipes and HVAC heating pipes- Insulation Lifetime – 30 yearsNB: Assumes easy access to all piping within hotel - It does not include any demolition costs.
Receptacles - Elec 1,149.8 1,149.8 0.0 0.0%HVAC Fans 409.6 409.6 0.0 0.0%
Receptacles - Gas 425.8 425.8 0.0 0.0%Base Utilities - Gas 2,033.7 1,956.7 77.0 3.8%
2.6%
Financial Assumptions Total 10,477.9 10,205.4 272.5 2.6%
2,401,837 2,355,478
0
500,000
1,000,000
1,500,000
2,000,000
2,500,000
3,000,000
Base Case Proposed
lb/y
r
Annual CO2 Emissions
6,658
2,992
6,576
2,943
0
2,000
4,000
6,000
8,000
SO2 (lb/yr) NOX (lb/yr)
g/yr
Annual SO2 and NOX EmissionsBase Case
Proposed
10,478 10,205
0
2,000
4,000
6,000
8,000
10,000
12,000
Base Case Proposed
MBt
u/yr
Annual Total Energy Use
Issued February 1, 2011 156 Existing Hotels Energy Analysis - Green Engage/Solutions

Additional Capital CostHVAC Plant First Cost Reductions
Cooling Plant SavingsHeating Plant Savings
Energy E-08 Pipe Insulation
Individual Resource Calculations Install or Replace Immediately Existing Hotels Temperate
Annual Resource Cost Summary Financial Table Financial Results Summary
ResourceAnnual Resource Savings
(+) / Loss (-) Unit CostAnnual Savings (+) /
Loss (-)Yr.
Costs (Marginal/Maint/
Replace)
Savings (+) / Loss (-) Cash Flow
Initial Marginal Cost $34,748
$3,717Natural gas 2,193 therms $0.9000 $1,973Electricity 15,625 kWh $0.1028 $1,606 Initial Annual Savings
Water & sewer 0 Gals $0.0037 $0 0 ($34,748) $0 ($34,748)1 $0 $3,717 $3,717
Simple Payback 8.2 yrs
($34,748) 3 $0 $4,010 $4,010Capital Costs Savings Summary 2 $0 $3,860 $3,860
4 $0 $4,167 $4,167 First Year Yield On Marginal Cost 10.7%
12.1%IRR
N/A MBh $0 6 $0 $4 453 $4 453N/A tons $0 5 $0 $4,308 $4,308
Heating Plant SavingsAirside Distribution Savings
Total Additional Capital Cost:
Estimated Useful Life (yrs)Percent replacedReplacement Cost Premium (In 2010 Dollars)
Base YearValuation TypeProject Analysis PeriodInflation RateDiscount Rate for Defined ValuationEnergy Escalation Rate (Nominal)
N/A cfm $0 7 $0 $4,604N/A MBh $0 6 $0 $4,453 $4,453 NPV
($34,748) 8 $0 $4,759 $4,759
$15,396
9 $0 $4,920 $4,920
$4,604
30 11 $0 $5,262 $5,262Replacement Life and Cost Summary 10 $0 $5,088 $5,088
14 $0 $5,820 $5,820($34,748) 13 $0 $5,628 $5,628
2010 16 $0 $6,325 $6,325Financial Analysis 15 $0 $6,067 $6,067
20 18 $0 $6,875 $6,875Defined 17 $0 $6,594 $6,594
7.19% 20 $0 $7,449 $7,4492.79% 19 $0 $7,168 $7,168
(See Table in Assumptions)
100% 12 $0 $5,442 $5,442
($60,000)
($40,000)
($20,000)
$0
$20,000
$40,000
$60,000
$80,000
0 5 10 15 20
Net
Cas
h Fl
ow (E
nd o
f Yea
r)
Years
Simple Payback Graph
Issued February 1, 2011 157 Existing Hotels Energy Analysis - Green Engage/Solutions

Base Case
Proposed ModificationsCorridor lighting load is reduced by 25% to 1.35 W/sf.
The operating schedule remains unchanged. The reduction in load is based on US EPA predictions,
Base Case Proposed % Savings (+) / Loss (-)
Individual Resource Calculations Install or Replace Immediately Existing Hotels
2,992 2,991 0.0%Space Heating - Elec 0.0 0.0 0.0 0.0%Lighting 1,831.3 1,829.6 1.7 0.1% NOX (lb/yr)
Space Heating - Gas
CO2 (lb/yr) 2,401,837 2,401,211 0.0%
Temperate
Energy E-10 Occupancy Sensors in Offices
Energy End-Use Benchmark Comparison Environmental Impact Analysis
Energy End-Use
Base Case Energy Use
Proposed Energy Use
Savings (+) / Loss (-)
Savings (+) / Loss (-)
SO2 (lb/yr) 6,658 6,655 0.0%MBtu/yr %
Emissions
MBtu/yr MBtu/yr
Offices have a lighting density of 1.8 W/sf. Lights operate for 8 hours a day.
Pumps 25.5 25.5 0.0 0.0%
HVAC Fans 409 6 409 6 0 1 0 0%
3,698.6 3,700.4 -1.8 0.0%Space Cooling 903.7 903.3 0.4 0.0%
0.0%Heat Rejection 0.0 0.0 0.0 0.0%
2,401,837 2,401,211
1,500,000
2,000,000
2,500,000
3,000,000
lb/y
r
Annual CO2 Emissions
reduction in load is based on US EPA predictions, assuming the lighting turns off when unoccupied. HVAC Fans 409.6 409.6 0.1 0.0%
Receptacles - Elec 1,149.8 1,149.8 0.0 0.0%Receptacles - Gas 425.8 425.8 0.0 0.0%Base Utilities - Gas 2,033.7 2,033.7 0.0 0.0%
- US$193 per sensor including electrician labour- Four offices per hotel building - Sensor lifetime – 10 years- Increase office bulb lifetime by 25%- Increase office light bulb lifetime by 25%- All 16 office light bulbs are assumed to already be CFLs
0.0%
Financial Assumptions Total 10,477.9 10,477.6 0.3 0.0%
2,401,837 2,401,211
0
500,000
1,000,000
1,500,000
2,000,000
2,500,000
3,000,000
Base Case Proposed
lb/y
r
Annual CO2 Emissions
6,658
2,992
6,655
2,991
0
2,000
4,000
6,000
8,000
SO2 (lb/yr) NOX (lb/yr)
g/yr
Annual SO2 and NOX EmissionsBase Case
Proposed
10,478 10,478
0
2,000
4,000
6,000
8,000
10,000
12,000
Base Case Proposed
MBt
u/yr
Annual Total Energy Use
Issued February 1, 2011 158 Existing Hotels Energy Analysis - Green Engage/Solutions

Additional Capital CostHVAC Plant First Cost Reductions
Cooling Plant SavingsHeating Plant Savings
Energy E-10 Occupancy Sensors in Offices
Individual Resource Calculations Install or Replace Immediately Existing Hotels Temperate
Annual Resource Cost Summary Financial Table Financial Results Summary
ResourceAnnual Resource Savings
(+) / Loss (-) Unit CostAnnual Savings (+) /
Loss (-)Yr.
Costs (Marginal/Maint/
Replace)
Savings (+) / Loss (-) Cash Flow
Initial Marginal Cost $772
$49Natural gas -18 therms $0.9000 -$16Electricity 629 kWh $0.1028 $65 Initial Annual Savings
Water & sewer 0 Gals $0.0037 $0 0 ($772) $0 ($772)1 $0 $49 $49
Simple Payback Never
($772) 3 $0 $64 $64Capital Costs Savings Summary 2 $0 $49 $49
4 $0 $50 $50 First Year Yield On Marginal Cost 6.3%
N/AIRR
N/A MBh $0 6 $0 $69 $69N/A tons $0 5 $0 $51 $51
Heating Plant SavingsAirside Distribution Savings
Total Additional Capital Cost:
Estimated Useful Life (yrs)Percent replacedReplacement Cost Premium (In 2010 Dollars)
Base YearValuation TypeProject Analysis PeriodInflation RateDiscount Rate for Defined ValuationEnergy Escalation Rate (Nominal)
N/A cfm $0 7 $0 $54N/A MBh $0 6 $0 $69 $69 NPV
($772) 8 $0 $56 $56
-$577
9 $0 $75 $75
$54
10 11 $0 $62 $62Replacement Life and Cost Summary 10 ($1,016) $60 ($956)
14 $0 $68 $68($772) 13 $0 $66 $66
2010 16 $0 $72 $72Financial Analysis 15 $0 $90 $90
20 18 $0 $99 $99Defined 17 $0 $74 $74
7.19% 20 $0 $82 $822.79% 19 $0 $79 $79
(See Table in Assumptions)
100% 12 $0 $83 $83
($1,400)
($1,200)
($1,000)
($800)
($600)
($400)
($200)
$0 0 5 10 15 20
Net
Cas
h Fl
ow (E
nd o
f Yea
r)
Years
Simple Payback Graph
Issued February 1, 2011 159 Existing Hotels Energy Analysis - Green Engage/Solutions

Base Case
Proposed ModificationsOne VFD (15 HP capacity) installed on VAV supply fan
motor.
Base Case Proposed % Savings (+) / Loss (-)
Individual Resource Calculations Install or Replace Immediately Existing Hotels
2,992 2,981 0.4%Space Heating - Elec 0.0 0.0 0.0 0.0%Lighting 1,831.3 1,831.3 0.0 0.0% NOX (lb/yr)
Space Heating - Gas
CO2 (lb/yr) 2,401,837 2,396,486 0.2%
Temperate
Mechanical M-11 Variable Frequency Drives
Energy End-Use Benchmark Comparison Environmental Impact Analysis
Energy End-Use
Base Case Energy Use
Proposed Energy Use
Savings (+) / Loss (-)
Savings (+) / Loss (-)
SO2 (lb/yr) 6,658 6,618 0.6%MBtu/yr %
Emissions
MBtu/yr MBtu/yr
Constant speed, standard efficiency motor on supply fan for VAV system serving the first floor and corridor
spaces (15 HP capacity).
Pumps 25.5 25.5 0.0 0.0%
HVAC Fans 409 6 384 7 25 0 6 1%
3,698.6 3,738.3 -39.7 -1.1%Space Cooling 903.7 903.0 0.6 0.1%
0.2%Heat Rejection 0.0 0.0 0.0 0.0%
2,401,837 2,396,486
1,500,000
2,000,000
2,500,000
3,000,000
lb/y
r
Annual CO2 Emissions
HVAC Fans 409.6 384.7 25.0 6.1%Receptacles - Elec 1,149.8 1,149.8 0.0 0.0%Receptacles - Gas 425.8 425.8 0.0 0.0%Base Utilities - Gas 2,033.7 2,033.7 0.0 0.0%
VFDs only recommended on motors greater than 5HP.
- All four climate zones can install one 15 HP capable VFD for the supply fan motor- Cost of VFD is $2,868 including electrician installation rate- VFD lifetime – 10 years
-0.1%
Financial Assumptions Total 10,477.9 10,492.0 -14.1 -0.1%
2,401,837 2,396,486
0
500,000
1,000,000
1,500,000
2,000,000
2,500,000
3,000,000
Base Case Proposed
lb/y
r
Annual CO2 Emissions
6,658
2,992
6,618
2,981
0
2,000
4,000
6,000
8,000
SO2 (lb/yr) NOX (lb/yr)
g/yr
Annual SO2 and NOX EmissionsBase Case
Proposed
10,478 10,492
0
2,000
4,000
6,000
8,000
10,000
12,000
Base Case Proposed
MBt
u/yr
Annual Total Energy Use
Issued February 1, 2011 160 Existing Hotels Energy Analysis - Green Engage/Solutions

Additional Capital CostHVAC Plant First Cost Reductions
Cooling Plant SavingsHeating Plant Savings
Mechanical M-11 Variable Frequency Drives
Individual Resource Calculations Install or Replace Immediately Existing Hotels Temperate
Annual Resource Cost Summary Financial Table Financial Results Summary
ResourceAnnual Resource Savings
(+) / Loss (-) Unit CostAnnual Savings (+) /
Loss (-)Yr.
Costs (Marginal/Maint/
Replace)
Savings (+) / Loss (-)
Natural gas -397 therms $0.9000 -$357Electricity 7,511 kWh $0.1028 $772
Cash FlowInitial Marginal Cost $2,868
$410Initial Annual Savings
Water & sewer 0 Gals $0.0037 $0 0 ($2,868) $01 $0 $410 $410
($2,868) Simple Payback 7.1 yrs
($2,868) 3 $0 $399 $399Capital Costs Savings Summary 2 $0 $405 $405
4 $0 $391 $391 First Year Yield On Marginal Cost 14.3%
7.2%IRR
N/A tons $0 5 $0 $403 $403N/A MBh $0 6 $0 $414 $414Heating Plant Savings
Airside Distribution SavingsTotal Additional Capital Cost:
Estimated Useful Life (yrs)Percent replacedReplacement Cost Premium (In 2010 Dollars)
Base YearValuation TypeProject Analysis PeriodInflation RateDiscount Rate for Defined ValuationEnergy Escalation Rate (Nominal)
N/A cfm $0 7 $0 $426N/A MBh $0 6 $0 $414 $414 NPV
$426($2,868) 8 $0 $438 $438
$1
9 $0 $451 $451
10 11 $0 $479 $479Replacement Life and Cost Summary 10 ($3,775) $464 ($3,310)
($2,868) 13 $0 $509 $509100% 12 $0 $493 $493
14 $0 $524 $524
2010 16 $0 $548 $548Financial Analysis 15 $0 $536 $536
20 18 $0 $573 $573Defined 17 $0 $560 $560
7.19% 20 $0 $606 $6062.79% 19 $0 $585 $585
(See Table in Assumptions)
($4,000)($3,000)($2,000)($1,000)
$0 $1,000 $2,000 $3,000 $4,000
0 5 10 15 20
Net
Cas
h Fl
ow (E
nd o
f Yea
r)
Years
Simple Payback Graph
Issued February 1, 2011 161 Existing Hotels Energy Analysis - Green Engage/Solutions

Base Case
Proposed ModificationsVAV supply fan motor replaced with NEMA premium efficiency motor (15 HP capacity). Heating hot water
circulator pump replaced with NEMA premium
Base Case Proposed % Savings (+) / Loss (-)
Individual Resource Calculations Install or Replace Immediately Existing Hotels
2,992 2,989 0.1%Space Heating - Elec 0.0 0.0 0.0 0.0%Lighting 1,831.3 1,831.3 0.0 0.0% NOX (lb/yr)
Space Heating - Gas
CO2 (lb/yr) 2,401,837 2,399,712 0.1%
Temperate
Mechanical M-11 NEMA Premium Efficiency Motors
Energy End-Use Benchmark Comparison Environmental Impact Analysis
Energy End-Use
Base Case Energy Use
Proposed Energy Use
Savings (+) / Loss (-)
Savings (+) / Loss (-)
SO2 (lb/yr) 6,658 6,648 0.1%MBtu/yr %
Emissions
MBtu/yr MBtu/yr
Constant speed, standard efficiency motor on supply fan for VAV system serving the first floor and corridor spaces (15 HP capacity). Constant speed, standard
efficiency motor for heating hot water circulator pump (1 HP capacity).
Pumps 25.5 23.0 2.5 9.8%
HVAC Fans 409 6 406 5 3 1 0 8%
3,698.6 3,701.7 -3.1 -0.1%Space Cooling 903.7 902.9 0.8 0.1%
0.1%Heat Rejection 0.0 0.0 0.0 0.0%
2,401,837 2,399,712
1,500,000
2,000,000
2,500,000
3,000,000
lb/y
r
Annual CO2 Emissions
circulator pump replaced with NEMA premium efficiency motor (1 HP capacity). HVAC Fans 409.6 406.5 3.1 0.8%
Receptacles - Elec 1,149.8 1,149.8 0.0 0.0%Receptacles - Gas 425.8 425.8 0.0 0.0%Base Utilities - Gas 2,033.7 2,033.7 0.0 0.0%
NB: demolition costs are not includedAll four climates can install a 15 HP NEMA efficiency motor on the supply fan. - 15 HP NEMA efficiency motor is $1,482- 15 HP normal motor is $1,195- Cost Premium of $287
Two colder climates can also install a 1HP NEMA efficiency motor on the hot water heating loop.- 1 HP NEMA efficiency motor is $531- 1 HP normal motor is $430- Cost Premium of $101
0.0%
Financial Assumptions Total 10,477.9 10,474.7 3.3 0.0%
2,401,837 2,399,712
0
500,000
1,000,000
1,500,000
2,000,000
2,500,000
3,000,000
Base Case Proposed
lb/y
r
Annual CO2 Emissions
6,658
2,992
6,648
2,989
0
2,000
4,000
6,000
8,000
SO2 (lb/yr) NOX (lb/yr)
g/yr
Annual SO2 and NOX EmissionsBase Case
Proposed
10,478 10,475
0
2,000
4,000
6,000
8,000
10,000
12,000
Base Case Proposed
MBt
u/yr
Annual Total Energy Use
Issued February 1, 2011 162 Existing Hotels Energy Analysis - Green Engage/Solutions

Additional Capital CostHVAC Plant First Cost Reductions
Cooling Plant SavingsHeating Plant Savings
Mechanical M-11 NEMA Premium Efficiency Motors
Individual Resource Calculations Install or Replace Immediately Existing Hotels Temperate
Annual Resource Cost Summary Financial Table Financial Results Summary
ResourceAnnual Resource Savings
(+) / Loss (-) Unit CostAnnual Savings (+) /
Loss (-)Yr.
Costs (Marginal/Maint/
Replace)
Savings (+) / Loss (-)
Natural gas -31 therms $0.9000 -$28Electricity 1,871 kWh $0.1028 $192
Cash FlowInitial Marginal Cost $1,201
$167Initial Annual Savings
Water & sewer 0 Gals $0.0037 $0 0 ($1,201) $01 $0 $167 $167
($1,201)Simple Payback 6.9 yrs
($1,201) 3 $0 $171 $171Capital Costs Savings Summary 2 $0 $169 $169
4 $0 $173 $173 First Year Yield On Marginal Cost 13.9%
13.9%IRR
N/A tons $0 5 $0 $178 $178N/A MBh $0 6 $0 $184 $184Heating Plant Savings
Airside Distribution SavingsTotal Additional Capital Cost:
Estimated Useful Life (yrs)Percent replacedReplacement Cost Premium (In 2010 Dollars)
Base YearValuation TypeProject Analysis PeriodInflation RateDiscount Rate for Defined ValuationEnergy Escalation Rate (Nominal)
N/A cfm $0 7 $0 $190N/A MBh $0 6 $0 $184 $184 NPV
$190($1,201) 8 $0 $196 $196
$660
9 $0 $202 $202
15 11 $0 $215 $215Replacement Life and Cost Summary 10 $0 $208 $208
($388) 13 $0 $229 $229100% 12 $0 $222 $222
14 $0 $237 $237
2010 16 $0 $253 $253Financial Analysis 15 ($586) $245 ($341)
20 18 $0 $271 $271Defined 17 $0 $262 $262
7.19% 20 $0 $290 $2902.79% 19 $0 $280 $280
(See Table in Assumptions)
($1,500)($1,000)
($500)$0
$500 $1,000 $1,500 $2,000 $2,500 $3,000
0 5 10 15 20
Net
Cas
h Fl
ow (E
nd o
f Yea
r)
Years
Simple Payback Graph
Issued February 1, 2011 163 Existing Hotels Energy Analysis - Green Engage/Solutions

20.5%Heat Rejection 0.0 0.0 0.0 0.0%
As detailed in individual measures Pumps 25.5 25.2 0.3 1.2%
HVAC Fans 409 6 398 1 11 5 2 8%
Space Heating - Gas 3,705.0 3,808.3 -103.3 -2.8%Proposed Modifications Space Cooling 903.7 692.6 211.0 23.4%
CO2 (lb/yr) 2,402,117 1,910,501 20.5%
2,992 2,308 22.9%Space Heating - Elec 0.0 0.0 0.0 0.0%
SO2 (lb/yr) 6,658 4,889 26.6%Lighting 1,831.3 1,094.2 737.1 40.2% NOX (lb/yr)
Individual Resource Calculations Install or Replace Immediately Existing Hotels Temperate
Cumulative Scenario Green Engage Lvl 1: All Measures Installed or Replaced Now
Base Case Energy End-Use Benchmark Comparison Environmental Impact AnalysisAs detailed in individual measures
Energy End-Use
Base Case Energy Use
Proposed Energy Use
Savings (+) / Loss (-)
Savings (+) / Loss (-)
MBtu/yr MBtu/yr MBtu/yr %
Emissions Base Case Proposed % Savings (+) / Loss (-)
2,402,117
1,910,501
1,500,000
2,000,000
2,500,000
3,000,000
lb/y
r
Annual CO2 Emissions
Base Utilities - Gas 2,033.7 1,693.0 340.7 16.8%
All financial assumptions remain the same as in each individual measure.
14.6%
Financial Assumptions Total 10,480.3 8,950.9 1,529.5 14.6%
Receptacles - Gas 421.8 277.1 144.7 34.3%
HVAC Fans 409.6 398.1 11.5 2.8%Receptacles - Elec 1,149.8 962.3 187.5 16.3%
2,402,117
1,910,501
0
500,000
1,000,000
1,500,000
2,000,000
2,500,000
3,000,000
Base Case Proposed
lb/y
r
Annual CO2 Emissions
6,658
2,992
4,889
2,308
0
2,000
4,000
6,000
8,000
SO2 (lb/yr) NOX (lb/yr)
g/yr
Annual SO2 and NOX EmissionsBase Case
Proposed
10,4808,951
0
2,000
4,000
6,000
8,000
10,000
12,000
Base Case Proposed
MBt
u/yr
Annual Total Energy Use
Issued February 1, 2011 164 Existing Hotels Energy Analysis - Green Engage/Solutions

Additional Capital CostHVAC Plant First Cost Reductions
Cooling Plant SavingsHeating Plant Savings N/A MBh $0 6 $5 023 $49 107 $54 130
N/A tons $0 5 $1,389 $47,575 $48,9644 $1,661 $46,106 $47,767 First Year Yield On Marginal Cost 28.9%
Capital Costs Savings Summary 2 $1,572 $44,060 $45,632 IRR 32.2%($149,066) 3 $4,325 $45,084 $49,408
1 $1,245 $43,077 $44,322($149,066) $0 ($149,066) Simple Payback 3.3 yrsWater & sewer 1,037,880 Gals $0.0037 $3,840 0
Natural gas 3,822 therms $0.9000 $3,440Initial Annual Savings $43,077Electricity 336,264 kWh $0.1028 $34,568
Savings (+) / Loss (-) Cash Flow
Initial Marginal Cost $149,066
Cumulative Scenario Green Engage Lvl 1: All Measures Installed or Replaced Now
Annual Resource Cost Summary Financial Table Financial Results Summary
ResourceAnnual Resource Savings
(+) / Loss (-) Unit CostAnnual Savings (+) /
Loss (-)Yr.
Costs (Marginal/Maint/
Replace)
Individual Resource Calculations Install or Replace Immediately Existing Hotels Temperate
Heating Plant SavingsAirside Distribution Savings
Total Additional Capital Cost:
Estimated Useful Life (yrs)Percent replacedReplacement Cost (In 2010 Dollars)
Base YearValuation TypeProject Analysis PeriodInflation RateDiscount Rate for Defined ValuationEnergy Escalation Rate (Nominal) (See Table in Assumptions)
7.19% 20 $2,578 $78,531 $81,1092.79% 19 $2,041 $75,709 $77,750
20 18 $6,984 $73,077 $80,061Defined 17 $1,932 $70,495 $72,427
2010 16 $2,310 $68,026 $70,335Financial Analysis 15 ($48,309) $65,665 $17,356
14 $2,186 $63,347 $65,533N/A 13 $1,731 $61,342 $63,072N/A 12 ($2,231) $59,419 $57,188N/A 11 $1,638 $57,519 $59,158
Replacement Life and Cost Summary 10 ($34,880) $55,699 $20,8199 $5,099 $53,953 $59,053
($149,066) 8 $1,854 $52,270 $54,124
NPV $375,026N/A cfm $0 7 $1,468N/A MBh $0 6 $5,023 $49,107 $54,130
$50,655 $52,123
($400,000)($200,000)
$0 $200,000 $400,000 $600,000 $800,000
$1,000,000 $1,200,000
0 5 10 15 20
Net
Cas
h Fl
ow (E
nd o
f Yea
r)
Years
Simple Payback Graph
Issued February 1, 2011 165 Existing Hotels Energy Analysis - Green Engage/Solutions

22.5%Heat Rejection 0.0 0.0 0.0 0.0%
As detailed in individual measures Pumps 25.5 22.7 2.8 10.8%
HVAC Fans 409 6 371 1 38 6 9 4%
Space Heating - Gas 3,705.0 3,698.7 6.3 0.2%Proposed Modifications Space Cooling 903.7 648.9 254.7 28.2%
CO2 (lb/yr) 2,402,117 1,861,191 22.5%
24.8%Space Heating - Elec 0.0 0.0 0.0 0.0%
4,774 28.3%Lighting 1,831.3 1,092.6 738.7 40.3% NOX (lb/yr) 2,992 2,250
MBtu/yr MBtu/yr MBtu/yr
Individual Resource Calculations Install or Replace Immediately Existing Hotels Temperate
Cumulative Scenario Green Engage Lvl 2: All Measures Installed or Replaced Now
Base Case Energy End-Use Benchmark Comparison Environmental Impact AnalysisAs detailed in individual measures
Energy End-Use
Base Case Energy Use
Proposed Energy Use
Savings (+) / Loss (-)
Savings (+) / Loss (-)
Emissions Base Case Proposed % Savings (+) / Loss (-)
% SO2 (lb/yr) 6,658
2,402,117
1,861,191
1,500,000
2,000,000
2,500,000
3,000,000
lb/y
r
Annual CO2 Emissions
Financial Assumptions Total 10,480.3 8,703.3 1,777.0 17.0%Base Utilities - Gas 2,033.7 1,629.9 403.8 19.9%
All financial assumptions remain the same as in each individual measure.
17.0%
Receptacles - Gas 421.8 277.1 144.7 34.3%
HVAC Fans 409.6 371.1 38.6 9.4%Receptacles - Elec 1,149.8 962.3 187.5 16.3%
2,402,117
1,861,191
0
500,000
1,000,000
1,500,000
2,000,000
2,500,000
3,000,000
Base Case Proposed
lb/y
r
Annual CO2 Emissions
6,658
2,992
4,774
2,250
0
2,000
4,000
6,000
8,000
SO2 (lb/yr) NOX (lb/yr)
g/yr
Annual SO2 and NOX EmissionsBase Case
Proposed
10,480
8,703
0
2,000
4,000
6,000
8,000
10,000
12,000
Base Case Proposed
MBt
u/yr
Annual Total Energy Use
Issued February 1, 2011 166 Existing Hotels Energy Analysis - Green Engage/Solutions

Additional Capital CostHVAC Plant First Cost Reductions
Cooling Plant SavingsHeating Plant Savings N/A MBh $0 6 $5 023 $53 751 $58 774
N/A tons $0 5 $1,389 $52,069 $53,4584 $1,661 $50,455 $52,116 First Year Yield On Marginal Cost 24.9%
($188,654) 3 $4,325 $49,290 $53,614Capital Costs Savings Summary 2 $1,572 $48,128 $49,700 IRR 27.8%
1 $1,245 $47,013 $48,257($188,654) $0 ($188,654) Simple Payback 3.8 yrsWater & sewer 1,037,880 Gals $0.0037 $3,840 0
Natural gas 5,550 therms $0.9000 $4,995$36,822 Initial Annual Savings $47,013
Savings (+) / Loss (-) Cash Flow
Initial Marginal Cost $188,654Resource
Annual Resource Savings (+) / Loss (-) Unit Cost
Annual Savings (+) / Loss (-)
Yr.Costs
(Marginal/Maint/Replace)Electricity 358,192 kWh $0.1028
Cumulative Scenario Green Engage Lvl 2: All Measures Installed or Replaced Now
Annual Resource Cost Summary Financial Table Financial Results Summary
Individual Resource Calculations Install or Replace Immediately Existing Hotels Temperate
Heating Plant SavingsAirside Distribution Savings
Total Additional Capital Cost:
Estimated Useful Life (yrs)Percent replacedReplacement Cost (In 2010 Dollars)
Base YearValuation TypeProject Analysis PeriodInflation RateDiscount Rate for Defined ValuationEnergy Escalation Rate (Nominal) (See Table in Assumptions)
7.19% 20 $2,578 $86,218 $88,7962.79% 19 $2,041 $83,108 $85,149
20 18 $6,984 $80,185 $87,169Defined 17 $1,932 $77,322 $79,254
2010 16 $2,310 $74,585 $76,894Financial Analysis 15 ($48,895) $71,966 $23,071
14 $2,186 $69,400 $71,586N/A 13 $1,731 $67,196 $68,927N/A 12 ($2,231) $65,081 $62,850N/A 11 $1,638 $62,996 $64,635
Replacement Life and Cost Summary 10 ($39,670) $60,996 $21,3269 $5,099 $59,077 $64,177
($188,654) 8 $1,854 $57,229 $59,082
NPV $385,518N/A cfm $0 7 $1,468N/A MBh $0 6 $5,023 $53,751 $58,774
$55,454 $56,922
($400,000)($200,000)
$0 $200,000 $400,000 $600,000 $800,000
$1,000,000 $1,200,000
0 5 10 15 20
Net
Cas
h Fl
ow (E
nd o
f Yea
r)
Years
Simple Payback Graph
Issued February 1, 2011 167 Existing Hotels Energy Analysis - Green Engage/Solutions

Temperate: Replace at End of Lifetime
Issued February 1, 2011 168 Existing Hotels Energy Analysis - Green Engage/Solutions

InstallReplaceReplaceReplaceReplaceReplaceReplaceInstallInstallInstallInstall
0.6% N/A N/A $13,5182.4%
Install New or Replace
0.7%
2.3%
N/AUse of Building Appropriate Materials100% of Guest Rooms have 4F Deadband ThermostatsMeet IPC 2006 Maximum Flow Rates
Immediate
O-04E-07
E-09 Zero Use of Incandescent Lamps in Circulation Spaces$174,645
N/A1.2 yrs
Zero Use of Incandescent Lamps in Guest RoomsN/A N/A
Relevant Action Group Measure
NPV(Over 20 Years)Simple Payback IRR
Immediate
%
N/A86.1%
0.6% N/A
% %
$53,83488.9%
$
Green Engage Level 1 Certification
E-09
$14,332E-07 Energy Efficient TVs
Towel/Sheet ProgramEnergy Efficient Appliances
M-09W-03
E-07 Energy Efficient Guest Room Refrigerators
Energy Modelling Results Summary Replace at End of Lifetime Existing Hotels Temperate
N/A
Immediate $57,638E-09
B-04
The table below summarises the overall energy and financial performance for the modelled existing hotel in the temperate climate zone against the baseline building. Energy savings for a specific building may vary based on that building's parameters and financial results may also vary based on local costs and financing structures. For details regarding each measure refer to the individual calculation pages immediately following this page. For detailed assumptions relating to the energy model, utilities, emission factors, financial inputs, cost of capital, etc refer to the assumptions section of this book.Note: CO2 reduction percentages closely match both source energy reductions and annual energy saving cost reductions. Due to different modelling methodologies existing hotel and new hotel CO2 reduction percentages cannot be compared against each other. The stoplight colour legend contained below refers solely to simple payback periods.
TemperateWest Palm Beach, FL
Immediate 7.4% N/A N/A
CO2 Reductions First Year Yield On Marginal Cost
yrs
$14,754N/A
Zero Use of Incandescent Lamps in Back of House Spaces
Immediate
E-10 Occupancy Sensors in Corridors for Decorative Fixtures
InstallInstallInstall
Replace
N/A
N/A
Legend (Criteria Based On Simple Payback Only):Very Short or Immediate Payback (0 - 3 years)Intermediate Payback (3 - 7 years)Long or No Payback (>7 years)
M-11 44.6%2.4 yrs
Green Engage Level 2 Certification
Occupancy Sensors in OfficesE-08
$1,418M-11 Variable Frequency Drives
0.1%NEMA Premium Efficiency Motors 42.9%
$451,482Install All New Measures Immediately &Replace Existing Measures At End of Lifetime 1.5 yrs 20.5%
Green Engage Level 2 Certification Cumulative Savings Scenarios (Includes Green Engage Level 1)Install All New Measures Immediately &Replace Existing Measures At End of Lifetime 2.2 yrs
E-10
22.5% 48.6% 44.5% $462,732
N/A
69.6% 64.5%
Pipe Insulation
Green Engage Level 1 Certification Cumulative Savings Scenarios
Issued February 1, 2011 169 Existing Hotels Energy Analysis - Green Engage/Solutions

All appliances replaced with Energy Star rated equivalents. Overall saving of 30% on electricity and
34% on natural gas.
Proposed Modifications
Individual Resource Calculations Replace at End of Lifetime Existing Hotels
Energy E-07 Energy Efficient Appliances
Energy End-Use Benchmark Comparison Environmental Impact Analysis
Temperate
Base Case
Energy End-Use
Base Case Energy Use
Proposed Energy Use
Savings (+) / Loss (-)
Savings (+) / Loss (-)
MBtu/yr MBtu/yr MBtu/yr %
The following commercial, non-Energy Star appliances located in the food preparation and laundry areas: 3 washing machines, 2 dishwashers, 4 gas ovens, 2
fridges, 2 freezers, 2 icemakers and 5 vending machines
Emissions Base Case Proposed % Savings (+) / Loss (-)
CO2 (lb/yr) 2,401,837 2,346,190 2.3%
2,992 2,921 2.4%Space Heating - Elec 0.0 0.0 0.0 0.0%
SO2 (lb/yr) 6,658 6,495 2.4%Lighting 1,831.3 1,831.3 0.0 0.0% NOX (lb/yr)
Space Heating - Gas 3,698.6 3,720.2 -21.6 -0.6%Space Cooling 903.7 898.9 4.8 0.5%
HVAC Fans 409 6 408 8 0 9 0 2%
2.3%Heat Rejection 0.0 0.0 0.0 0.0%Pumps 25.5 25.4 0.1 0.4%
2,401,837 2,346,190
1,500,000
2,000,000
2,500,000
3,000,000
lb/y
r
Annual CO2 Emissions
34% on natural gas. HVAC Fans 409.6 408.8 0.9 0.2%Receptacles - Elec 1,149.8 1,050.1 99.7 8.7%
Base Utilities - Gas 2,033.7 2,033.7 0.0 0.0%
- Basket of commercial appliances that have an energy star rating- Total weighted basket cost of US$79,451 and a weighted cost premium of US$5,864- Average lifetime of 12 years- Appliances include 3 washing machines, 2 dishwashers, 4 gas ovens, 2 fridges, 2 freezers, 2 icemakers and 5 vending machines
2.2%
Receptacles - Gas 425.8 279.4 146.4 34.4%
Financial Assumptions Total 10,477.9 10,247.7 230.2 2.2%
2,401,837 2,346,190
0
500,000
1,000,000
1,500,000
2,000,000
2,500,000
3,000,000
Base Case Proposed
lb/y
r
Annual CO2 Emissions
6,658
2,992
6,495
2,921
0
2,000
4,000
6,000
8,000
SO2 (lb/yr) NOX (lb/yr)
g/yr
Annual SO2 and NOX EmissionsBase Case
Proposed
10,478 10,248
0
2,000
4,000
6,000
8,000
10,000
12,000
Base Case Proposed
MBt
u/yr
Annual Total Energy Use
Issued February 1, 2011 170 Existing Hotels Energy Analysis - Green Engage/Solutions

Additional Capital CostHVAC Plant First Cost Reductions
Cooling Plant SavingsHeating Plant Savings
Energy E-07 Energy Efficient Appliances
Individual Resource Calculations Replace at End of Lifetime Existing Hotels Temperate
Annual Resource Cost Summary Financial Table Financial Results Summary
ResourceAnnual Resource Savings
(+) / Loss (-) Unit CostAnnual Savings (+) /
Loss (-)Yr.
Costs (Marginal/Maint/
Replace)
Savings (+) / Loss (-) Cash Flow
Initial Marginal Cost $5,864
$5,047Natural gas 1,248 therms $0.9000 $1,124Electricity 30,901 kWh $0.1028 $3,177 Initial Annual Savings
Water & sewer 164,438 Gals $0.0037 $608 0 ($5,864) $0 ($5,864)1 $0 $5,047 $5,047
Simple Payback 1.2 yrs
($5,864) 3 $0 $5,337 $5,337Capital Costs Savings Summary 2 $0 $5,189 $5,189
4 $0 $5,491 $5,491 First Year Yield On Marginal Cost 86.1%
88.9%IRR
N/A MBh $0 6 $0 $5 850 $5 850N/A tons $0 5 $0 $5,668 $5,668
Heating Plant SavingsAirside Distribution Savings
Total Additional Capital Cost:
Estimated Useful Life (yrs)Percent replacedReplacement Cost Premium (In 2010 Dollars)
Base YearValuation TypeProject Analysis PeriodInflation RateDiscount Rate for Defined ValuationEnergy Escalation Rate (Nominal)
N/A cfm $0 7 $0 $6,039N/A MBh $0 6 $0 $5,850 $5,850 NPV
($5,864) 8 $0 $6,234 $6,234
$53,834
9 $0 $6,435 $6,435
$6,039
12 11 $0 $6,865 $6,865Replacement Life and Cost Summary 10 $0 $6,647 $6,647
14 $0 $7,566 $7,566($5,864) 13 $0 $7,325 $7,325
2010 16 $0 $8,150 $8,150Financial Analysis 15 $0 $7,852 $7,852
20 18 $0 $8,780 $8,780Defined 17 $0 $8,459 $8,459
7.19% 20 $0 $9,455 $9,4552.79% 19 $0 $9,114 $9,114
(See Table in Assumptions)
100% 12 ($8,154) $7,091 ($1,062)
($20,000)$0
$20,000 $40,000 $60,000 $80,000
$100,000 $120,000 $140,000
0 5 10 15 20Net
Cas
h Fl
ow (E
nd o
f Yea
r)
Years
Simple Payback Graph
Issued February 1, 2011 171 Existing Hotels Energy Analysis - Green Engage/Solutions

Television is replaced with Energy Star rated equivalent. Overall saving of 40% on electricity.
Proposed Modifications
Individual Resource Calculations Replace at End of Lifetime Existing Hotels
Energy E-07 Energy Efficient Televisions
Energy End-Use Benchmark Comparison Environmental Impact Analysis
Temperate
Base Case
Energy End-Use
Base Case Energy Use
Proposed Energy Use
Savings (+) / Loss (-)
Savings (+) / Loss (-)
MBtu/yr MBtu/yr MBtu/yr %
One 32 inch non-Energy Star television per guest room. Emissions Base Case Proposed % Savings (+) /
Loss (-)CO2 (lb/yr) 2,401,837 2,386,252 0.6%
2,992 2,967 0.8%Space Heating - Elec 0.0 0.0 0.0 0.0%
SO2 (lb/yr) 6,658 6,582 1.1%Lighting 1,831.3 1,831.3 0.0 0.0% NOX (lb/yr)
Space Heating - Gas 3,698.6 3,729.5 -30.9 -0.8%Space Cooling 903.7 896.5 7.2 0.8%
HVAC Fans 409 6 409 2 0 4 0 1%
0.6%Heat Rejection 0.0 0.0 0.0 0.0%Pumps 25.5 25.5 0.0 0.0%
2,401,837 2,386,252
1,500,000
2,000,000
2,500,000
3,000,000
lb/y
r
Annual CO2 Emissions
HVAC Fans 409.6 409.2 0.4 0.1%Receptacles - Elec 1,149.8 1,108.1 41.7 3.6%
Base Utilities - Gas 2,033.7 2,033.7 0.0 0.0%
- 150, 32 inch energy star televisions- US$400 average outright cost per unit (including bulk discount)- US$0 cost premium over non-energy star TVs- Average lifetime - 10 years
0.2%
Receptacles - Gas 425.8 425.8 0.0 0.0%
Financial Assumptions Total 10,477.9 10,459.6 18.4 0.2%
2,401,837 2,386,252
0
500,000
1,000,000
1,500,000
2,000,000
2,500,000
3,000,000
Base Case Proposed
lb/y
r
Annual CO2 Emissions
6,658
2,992
6,582
2,967
0
2,000
4,000
6,000
8,000
SO2 (lb/yr) NOX (lb/yr)
g/yr
Annual SO2 and NOX EmissionsBase Case
Proposed
10,478 10,460
0
2,000
4,000
6,000
8,000
10,000
12,000
Base Case Proposed
MBt
u/yr
Annual Total Energy Use
Issued February 1, 2011 172 Existing Hotels Energy Analysis - Green Engage/Solutions

Additional Capital CostHVAC Plant First Cost Reductions
Cooling Plant SavingsHeating Plant Savings
Energy E-07 Energy Efficient Televisions
Individual Resource Calculations Replace at End of Lifetime Existing Hotels Temperate
Annual Resource Cost Summary Financial Table Financial Results Summary
ResourceAnnual Resource Savings
(+) / Loss (-) Unit CostAnnual Savings (+) /
Loss (-)Yr.
Costs (Marginal/Maint/
Replace)
Savings (+) / Loss (-) Cash Flow
Initial Marginal Cost $0
$1,219Natural gas -309 therms $0.9000 -$278Electricity 14,437 kWh $0.1028 $1,484 Initial Annual Savings
Water & sewer 0 Gals $0.0037 $0 0 $0 $0 $01 $0 $1,219 $1,219
Simple Payback Immediate
$0 3 $0 $1,245 $1,245Capital Costs Savings Summary 2 $0 $1,232 $1,232
4 $0 $1,257 $1,257 First Year Yield On Marginal Cost N/A
N/AIRR
N/A MBh $0 6 $0 $1 336 $1 336N/A tons $0 5 $0 $1,296 $1,296
Heating Plant SavingsAirside Distribution Savings
Total Additional Capital Cost:
Estimated Useful Life (yrs)Percent replacedReplacement Cost Premium (In 2010 Dollars)
Base YearValuation TypeProject Analysis PeriodInflation RateDiscount Rate for Defined ValuationEnergy Escalation Rate (Nominal)
N/A cfm $0 7 $0 $1,378N/A MBh $0 6 $0 $1,336 $1,336 NPV
$0 8 $0 $1,421 $1,421
$14,332
9 $0 $1,465 $1,465
$1,378
10 11 $0 $1,562 $1,562Replacement Life and Cost Summary 10 $0 $1,513 $1,513
14 $0 $1,719 $1,719$0 13 $0 $1,665 $1,665
2010 16 $0 $1,834 $1,834Financial Analysis 15 $0 $1,776 $1,776
20 18 $0 $1,956 $1,956Defined 17 $0 $1,894 $1,894
7.19% 20 $0 $2,096 $2,0962.79% 19 $0 $2,020 $2,020
(See Table in Assumptions)
100% 12 $0 $1,613 $1,613
$0
$5,000
$10,000
$15,000
$20,000
$25,000
$30,000
$35,000
0 5 10 15 20
Net
Cas
h Fl
ow (E
nd o
f Yea
r)
Years
Simple Payback Graph
Issued February 1, 2011 173 Existing Hotels Energy Analysis - Green Engage/Solutions

Base CaseOne 3 cu. ft. non-Energy Star refrigerator per guest
room.
Refrigerator is replaced with Energy Star rated equivalent. Overall saving of 24% on electricity.
Proposed Modifications
Individual Resource Calculations Replace at End of Lifetime Existing Hotels
Energy E-07 Energy Efficient Guest Room Refrigerators
Energy End-Use Benchmark Comparison Environmental Impact Analysis
Temperate
Energy End-Use
Base Case Energy Use
Proposed Energy Use
Savings (+) / Loss (-)
Savings (+) / Loss (-)
MBtu/yr MBtu/yr MBtu/yr %
Emissions Base Case Proposed % Savings (+) / Loss (-)
CO2 (lb/yr) 2,401,837 2,385,794 0.7%
2,992 2,966 0.9%Space Heating - Elec 0.0 0.0 0.0 0.0%
SO2 (lb/yr) 6,658 6,580 1.2%Lighting 1,831.3 1,831.3 0.0 0.0% NOX (lb/yr)
Space Heating - Gas 3,698.6 3,730.4 -31.8 -0.9%Space Cooling 903.7 896.3 7.4 0.8%
HVAC Fans 409 6 409 2 0 4 0 1%
0.7%Heat Rejection 0.0 0.0 0.0 0.0%Pumps 25.5 25.5 0.0 0.0%
2,401,837 2,385,794
1,500,000
2,000,000
2,500,000
3,000,000
lb/y
r
Annual CO2 Emissions
HVAC Fans 409.6 409.2 0.4 0.1%Receptacles - Elec 1,149.8 1,106.9 42.9 3.7%
Base Utilities - Gas 2,033.7 2,033.7 0.0 0.0%
- Medium sized bar fridge at 3 cu. ft.- Average Energy Star cost per unit - US$120 (online average price minus 20% bulk discount)- Cost Premium - US$0- Average Lifetime – 12 years
0.2%
Receptacles - Gas 425.8 425.8 0.0 0.0%
Financial Assumptions Total 10,477.9 10,459.0 18.9 0.2%
2,401,837 2,385,794
0
500,000
1,000,000
1,500,000
2,000,000
2,500,000
3,000,000
Base Case Proposed
lb/y
r
Annual CO2 Emissions
6,658
2,992
6,580
2,966
0
2,000
4,000
6,000
8,000
SO2 (lb/yr) NOX (lb/yr)
g/yr
Annual SO2 and NOX EmissionsBase Case
Proposed
10,478 10,459
0
2,000
4,000
6,000
8,000
10,000
12,000
Base Case Proposed
MBt
u/yr
Annual Total Energy Use
Issued February 1, 2011 174 Existing Hotels Energy Analysis - Green Engage/Solutions

Additional Capital CostHVAC Plant First Cost Reductions
Cooling Plant SavingsHeating Plant Savings
Energy E-07 Energy Efficient Guest Room Refrigerators
Individual Resource Calculations Replace at End of Lifetime Existing Hotels Temperate
Annual Resource Cost Summary Financial Table Financial Results Summary
ResourceAnnual Resource Savings
(+) / Loss (-) Unit CostAnnual Savings (+) /
Loss (-)Yr.
Costs (Marginal/Maint/
Replace)
Savings (+) / Loss (-)
Natural gas -318 therms $0.9000 -$286Electricity 14,861 kWh $0.1028 $1,528
Cash FlowInitial Marginal Cost $0
$1,255Initial Annual Savings
Water & sewer 0 Gals $0.0037 $0 0 $0 $01 $0 $1,255 $1,255
$0 Simple Payback Immediate
$0 3 $0 $1,281 $1,281Capital Costs Savings Summary 2 $0 $1,268 $1,268
4 $0 $1,294 $1,294 First Year Yield On Marginal Cost N/A
N/AIRR
N/A tons $0 5 $0 $1,334 $1,334N/A MBh $0 6 $0 $1 376 $1 376Heating Plant Savings
Airside Distribution SavingsTotal Additional Capital Cost:
Estimated Useful Life (yrs)Percent replacedReplacement Cost Premium (In 2010 Dollars)
Base YearValuation TypeProject Analysis PeriodInflation RateDiscount Rate for Defined ValuationEnergy Escalation Rate (Nominal)
N/A cfm $0 7 $0 $1,419N/A MBh $0 6 $0 $1,376 $1,376 NPV
$1,419$0 8 $0 $1,463 $1,463
$14,754
9 $0 $1,509 $1,509
$1,66012 11 $0 $1,608 $1,608
Replacement Life and Cost Summary 10 $0 $1,557 $1,557
100% 12 $0 $1,660
14 $0 $1,770 $1,770$0 13 $0 $1,714 $1,714
2010 16 $0 $1,888 $1,888Financial Analysis 15 $0 $1,828 $1,828
20 18 $0 $2,014 $2,014Defined 17 $0 $1,950 $1,950
7.19% 20 $0 $2,157 $2,1572.79% 19 $0 $2,080 $2,080
(See Table in Assumptions)
$0
$5,000
$10,000
$15,000
$20,000
$25,000
$30,000
$35,000
0 5 10 15 20
Net
Cas
h Fl
ow (E
nd o
f Yea
r)
Years
Simple Payback Graph
Issued February 1, 2011 175 Existing Hotels Energy Analysis - Green Engage/Solutions

All 75W incandescent bulbs are replaced with 25W CFLs (6 per room or 900 in total). The guest room
lighting density is reduced to 0.75 W/sf.
Proposed Modifications
Individual Resource Calculations Replace at End of Lifetime Existing Hotels
Energy E-09 Zero Use of Incandescent Lamps in Guest Rooms
Energy End-Use Benchmark Comparison Environmental Impact Analysis
Temperate
Base Case
Energy End-Use
Base Case Energy Use
Proposed Energy Use
Savings (+) / Loss (-)
Savings (+) / Loss (-)
MBtu/yr MBtu/yr MBtu/yr %
Each guest room contains a total of 12 light bulbs. There is a 50/50 split of 75W incandescent bulbs and
25W CFLs, giving a lighting density of 1.5 W/sf. Bulbs operate for 8 hours/day.
Emissions Base Case Proposed % Savings (+) / Loss (-)
CO2 (lb/yr) 2,401,837 2,224,243 7.4%
2,992 2,703 9.6%Space Heating - Elec 0.0 0.0 0.0 0.0%
SO2 (lb/yr) 6,658 5,787 13.1%Lighting 1,831.3 1,350.6 480.6 26.2% NOX (lb/yr)
Space Heating - Gas 3,698.6 4,062.2 -363.6 -9.8%Space Cooling 903.7 823.9 79.7 8.8%
HVAC Fans 409 6 405 2 4 4 1 1%
7.4%Heat Rejection 0.0 0.0 0.0 0.0%Pumps 25.5 25.5 0.0 -0.1%
2,401,8372,224,243
1,500,000
2,000,000
2,500,000
3,000,000
lb/y
r
Annual CO2 Emissions
lighting density is reduced to 0.75 W/sf. HVAC Fans 409.6 405.2 4.4 1.1%Receptacles - Elec 1,149.8 1,149.8 0.0 0.0%
Base Utilities - Gas 2,033.7 2,033.7 0.0 0.0%
- Total of 12 bulbs per room with 50% designated for replacement- Average Energy Star cost per unit of US$3.40 with bulb life of 6,000 – 12,000 hours- Conventional cost per unit of US$0.60 with bulb life of 750 – 1,000 hours- Common building laborer staff rate- Replacement cost premium is a savings because light bulbs will last longer for the price paid
1.9%
Receptacles - Gas 425.8 425.8 0.0 0.0%
Financial Assumptions Total 10,477.9 10,276.7 201.2 1.9%
2,401,8372,224,243
0
500,000
1,000,000
1,500,000
2,000,000
2,500,000
3,000,000
Base Case Proposed
lb/y
r
Annual CO2 Emissions
6,658
2,992
5,787
2,703
0
2,000
4,000
6,000
8,000
SO2 (lb/yr) NOX (lb/yr)
g/yr
Annual SO2 and NOX EmissionsBase Case
Proposed
10,478 10,277
0
2,000
4,000
6,000
8,000
10,000
12,000
Base Case Proposed
MBt
u/yr
Annual Total Energy Use
Issued February 1, 2011 176 Existing Hotels Energy Analysis - Green Engage/Solutions

Additional Capital CostHVAC Plant First Cost Reductions
Cooling Plant SavingsHeating Plant Savings
Energy E-09 Zero Use of Incandescent Lamps in Guest Rooms
Individual Resource Calculations Replace at End of Lifetime Existing Hotels Temperate
Annual Resource Cost Summary Financial Table Financial Results Summary
ResourceAnnual Resource Savings
(+) / Loss (-) Unit CostAnnual Savings (+) /
Loss (-)Yr.
Costs (Marginal/Maint/
Replace)
Savings (+) / Loss (-) Cash Flow
Initial Marginal Cost ($2,494)
$13,889Natural gas -3,637 therms $0.9000 -$3,273Electricity 165,523 kWh $0.1028 $17,016 Initial Annual Savings
Water & sewer 0 Gals $0.0037 $0 0 $2,494 $0 $2,4941 $0 $13,889 $13,889
Simple Payback Immediate
$2,494 3 $2,709 $14,171 $16,880Capital Costs Savings Summary 2 $0 $14,032 $14,032
4 $0 $14,307 $14,307 First Year Yield On Marginal Cost N/A
N/AIRR
N/A MBh $0 6 $2 941 $15 212 $18 153N/A tons $0 5 $0 $14,752 $14,752
Heating Plant SavingsAirside Distribution Savings
Total Additional Capital Cost:
Estimated Useful Life (yrs)Percent replacedReplacement Cost Premium (In 2010 Dollars)
Base YearValuation TypeProject Analysis PeriodInflation RateDiscount Rate for Defined ValuationEnergy Escalation Rate (Nominal)
N/A cfm $0 7 $0 $15,686N/A MBh $0 6 $2,941 $15,212 $18,153 NPV
$2,494 8 $0 $16,174 $16,174
$174,645
9 $3,194 $16,678 $19,872
$15,686
3 11 $0 $17,777 $17,777Replacement Life and Cost Summary 10 $0 $17,219 $17,219
14 $0 $19,562 $19,562$2,494 13 $0 $18,948 $18,948
2010 16 $0 $20,866 $20,866Financial Analysis 15 $3,766 $20,204 $23,970
20 18 $4,090 $22,252 $26,342Defined 17 $0 $21,548 $21,548
7.19% 20 $0 $23,837 $23,8372.79% 19 $0 $22,978 $22,978
(See Table in Assumptions)
100% 12 $3,468 $18,353 $21,821
$0 $50,000
$100,000 $150,000 $200,000 $250,000 $300,000 $350,000 $400,000 $450,000
0 5 10 15 20
Net
Cas
h Fl
ow (E
nd o
f Yea
r)
Years
Simple Payback Graph
Issued February 1, 2011 177 Existing Hotels Energy Analysis - Green Engage/Solutions

All 75W incandescent bulbs are replaced with 25W CFLs (20 per floor or 100 in total). The guest room
lighting density is reduced to 0.35 W/sf.
Proposed Modifications
Individual Resource Calculations Replace at End of Lifetime Existing Hotels
Energy E-09 Zero Use of Incandescent Lamps in Circulation Spaces
Energy End-Use Benchmark Comparison Environmental Impact Analysis
Temperate
Base Case
Energy End-Use
Base Case Energy Use
Proposed Energy Use
Savings (+) / Loss (-)
Savings (+) / Loss (-)
MBtu/yr MBtu/yr MBtu/yr %
Corridors contain 40 light bulbs per floor. There is a 50/50 split of 75W incandescent bulbs and 25W CFLs, giving a lighting density of 0.7 W/sf. Bulbs operate for
24 hours/day.
Emissions Base Case Proposed % Savings (+) / Loss (-)
CO2 (lb/yr) 2,401,837 2,343,176 2.4%
2,992 2,897 3.2%Space Heating - Elec 0.0 0.0 0.0 0.0%
SO2 (lb/yr) 6,658 6,372 4.3%Lighting 1,831.3 1,674.3 157.0 8.6% NOX (lb/yr)
Space Heating - Gas 3,698.6 3,814.4 -115.8 -3.1%Space Cooling 903.7 879.1 24.6 2.7%
HVAC Fans 409 6 406 0 3 7 0 9%
2.4%Heat Rejection 0.0 0.0 0.0 0.0%Pumps 25.5 25.5 0.0 -0.1%
2,401,837 2,343,176
1,500,000
2,000,000
2,500,000
3,000,000
lb/y
r
Annual CO2 Emissions
lighting density is reduced to 0.35 W/sf. HVAC Fans 409.6 406.0 3.7 0.9%Receptacles - Elec 1,149.8 1,149.8 0.0 0.0%
Base Utilities - Gas 2,033.7 2,033.7 0.0 0.0%
- Total of 40 bulbs per corridor with 50% designated for replacement- This amounts to 100 bulbs to be replaced across the entire building- Average Energy Star cost per unit of US$3.40 with bulb life of 6,000 – 12,000 hours- Conventional cost per unit of US$0.60 with bulb life of 750 – 1,000 hours- Common building laborer staff rate- Replacement cost premium is a savings because light bulbs will last longer for the price paid
0.7%
Receptacles - Gas 425.8 425.8 0.0 0.0%
Financial Assumptions Total 10,477.9 10,408.5 69.5 0.7%
2,401,837 2,343,176
0
500,000
1,000,000
1,500,000
2,000,000
2,500,000
3,000,000
Base Case Proposed
lb/y
r
Annual CO2 Emissions
6,658
2,992
6,372
2,897
0
2,000
4,000
6,000
8,000
SO2 (lb/yr) NOX (lb/yr)
g/yr
Annual SO2 and NOX EmissionsBase Case
Proposed
10,478 10,408
0
2,000
4,000
6,000
8,000
10,000
12,000
Base Case Proposed
MBt
u/yr
Annual Total Energy Use
Issued February 1, 2011 178 Existing Hotels Energy Analysis - Green Engage/Solutions

Additional Capital CostHVAC Plant First Cost Reductions
Cooling Plant SavingsHeating Plant Savings
Energy E-09 Zero Use of Incandescent Lamps in Circulation Spaces
Individual Resource Calculations Replace at End of Lifetime Existing Hotels Temperate
Annual Resource Cost Summary Financial Table Financial Results Summary
ResourceAnnual Resource Savings
(+) / Loss (-) Unit CostAnnual Savings (+) /
Loss (-)Yr.
Costs (Marginal/Maint/
Replace)
Savings (+) / Loss (-) Cash Flow
Initial Marginal Cost ($277)
$4,589Natural gas -1,158 therms $0.9000 -$1,042Electricity 54,296 kWh $0.1028 $5,582 Initial Annual Savings
Water & sewer 0 Gals $0.0037 $0 0 $277 $0 $2771 $285 $4,589 $4,874
Simple Payback Immediate
$277 3 $301 $4,685 $4,986Capital Costs Savings Summary 2 $293 $4,638 $4,930
4 $309 $4,731 $5,041 First Year Yield On Marginal Cost N/A
N/AIRR
N/A MBh $0 6 $327 $5 031 $5 358N/A tons $0 5 $318 $4,879 $5,197
Heating Plant SavingsAirside Distribution Savings
Total Additional Capital Cost:
Estimated Useful Life (yrs)Percent replacedReplacement Cost Premium (In 2010 Dollars)
Base YearValuation TypeProject Analysis PeriodInflation RateDiscount Rate for Defined ValuationEnergy Escalation Rate (Nominal)
N/A cfm $0 7 $336 $5,188N/A MBh $0 6 $327 $5,031 $5,358 NPV
$277 8 $345 $5,350 $5,695
$57,638
9 $355 $5,517 $5,871
$5,524
1 11 $375 $5,880 $6,255Replacement Life and Cost Summary 10 $365 $5,696 $6,060
14 $407 $6,471 $6,879$277 13 $396 $6,268 $6,664
2010 16 $430 $6,904 $7,334Financial Analysis 15 $418 $6,684 $7,103
20 18 $454 $7,365 $7,819Defined 17 $442 $7,131 $7,573
7.19% 20 $480 $7,890 $8,3702.79% 19 $467 $7,606 $8,073
(See Table in Assumptions)
100% 12 $385 $6,071 $6,456
$0
$20,000
$40,000
$60,000
$80,000
$100,000
$120,000
$140,000
0 5 10 15 20
Net
Cas
h Fl
ow (E
nd o
f Yea
r)
Years
Simple Payback Graph
Issued February 1, 2011 179 Existing Hotels Energy Analysis - Green Engage/Solutions

All 75W incandescent bulbs are replaced with 25W CFLs (100 in total). The average lighting density is reduced to
0.7 W/sf.
Proposed Modifications
Individual Resource Calculations Replace at End of Lifetime Existing Hotels
Energy E-09 Zero Use of Incandescent Lamps in Back of House
Energy End-Use Benchmark Comparison Environmental Impact Analysis
Temperate
Base Case
Energy End-Use
Base Case Energy Use
Proposed Energy Use
Savings (+) / Loss (-)
Savings (+) / Loss (-)
MBtu/yr MBtu/yr MBtu/yr %
Offices, food preparation, lockers, laundry, mechanical and electrical spaces contain a total of 200 light bulbs. There is a 50/50 split of 75W incandescent bulbs and 25W CFLs, giving an average lighting density of 1.4 W/sf. Bulbs operate for 8
hours/day.
Emissions Base Case Proposed % Savings (+) / Loss (-)
CO2 (lb/yr) 2,401,837 2,388,301 0.6%
2,992 2,969 0.8%Space Heating - Elec 0.0 0.0 0.0 0.0%
SO2 (lb/yr) 6,658 6,586 1.1%Lighting 1,831.3 1,794.3 36.9 2.0% NOX (lb/yr)
Space Heating - Gas 3,698.6 3,737.9 -39.3 -1.1%Space Cooling 903.7 895.8 7.9 0.9%
HVAC Fans 409 6 408 1 1 5 0 4%
0.6%Heat Rejection 0.0 0.0 0.0 0.0%Pumps 25.5 25.3 0.2 0.8%
2,401,837 2,388,301
1,500,000
2,000,000
2,500,000
3,000,000
lb/y
r
Annual CO2 Emissions
HVAC Fans 409.6 408.1 1.5 0.4%Receptacles - Elec 1,149.8 1,149.8 0.0 0.0%
Base Utilities - Gas 2,033.7 2,033.8 -0.1 0.0%
- Total of 200 bulbs in back of house with 50% designated for replacement- Average Energy Star cost per unit of US$3.40 with bulb life of 6,000 – 12,000 hours- Conventional cost per unit of US$0.60 with bulb life of 750 – 1,000 hours- Common building laborer staff rate- Replacement cost premium is a savings because light bulbs will last longer for the price paid
0.1%
Receptacles - Gas 425.8 425.8 0.0 0.0%
Financial Assumptions Total 10,477.9 10,470.8 7.1 0.1%
2,401,837 2,388,301
0
500,000
1,000,000
1,500,000
2,000,000
2,500,000
3,000,000
Base Case Proposed
lb/y
r
Annual CO2 Emissions
6,658
2,992
6,586
2,969
0
2,000
4,000
6,000
8,000
SO2 (lb/yr) NOX (lb/yr)
g/yr
Annual SO2 and NOX EmissionsBase Case
Proposed
10,478 10,471
0
2,000
4,000
6,000
8,000
10,000
12,000
Base Case Proposed
MBt
u/yr
Annual Total Energy Use
Issued February 1, 2011 180 Existing Hotels Energy Analysis - Green Engage/Solutions

Additional Capital CostHVAC Plant First Cost Reductions
Cooling Plant SavingsHeating Plant Savings
Energy E-09 Zero Use of Incandescent Lamps in Back of House
Individual Resource Calculations Replace at End of Lifetime Existing Hotels Temperate
Annual Resource Cost Summary Financial Table Financial Results Summary
ResourceAnnual Resource Savings
(+) / Loss (-) Unit CostAnnual Savings (+) /
Loss (-)Yr.
Costs (Marginal/Maint/
Replace)
Savings (+) / Loss (-) Cash Flow
Initial Marginal Cost ($277)
$1,055Natural gas -394 therms $0.9000 -$355Electricity 13,642 kWh $0.1028 $1,402 Initial Annual Savings
Water & sewer 0 Gals $0.0037 $0 0 $277 $0 $2771 $0 $1,055 $1,055
Simple Payback Immediate
$277 3 $301 $1,069 $1,369Capital Costs Savings Summary 2 $0 $1,062 $1,062
4 $0 $1,074 $1,074 First Year Yield On Marginal Cost N/A
N/AIRR
N/A MBh $0 6 $327 $1 141 $1 468N/A tons $0 5 $0 $1,107 $1,107
Heating Plant SavingsAirside Distribution Savings
Total Additional Capital Cost:
Estimated Useful Life (yrs)Percent replacedReplacement Cost Premium (In 2010 Dollars)
Base YearValuation TypeProject Analysis PeriodInflation RateDiscount Rate for Defined ValuationEnergy Escalation Rate (Nominal)
N/A cfm $0 7 $0 $1,177N/A MBh $0 6 $327 $1,141 $1,468 NPV
$277 8 $0 $1,213 $1,213
$13,518
9 $355 $1,250 $1,605
$1,177
3 11 $0 $1,332 $1,332Replacement Life and Cost Summary 10 $0 $1,290 $1,290
14 $0 $1,464 $1,464$277 13 $0 $1,419 $1,419
2010 16 $0 $1,558 $1,558Financial Analysis 15 $418 $1,510 $1,929
20 18 $454 $1,656 $2,111Defined 17 $0 $1,606 $1,606
7.19% 20 $0 $1,771 $1,7712.79% 19 $0 $1,708 $1,708
(See Table in Assumptions)
100% 12 $385 $1,375 $1,760
$0
$5,000
$10,000
$15,000
$20,000
$25,000
$30,000
$35,000
0 5 10 15 20
Net
Cas
h Fl
ow (E
nd o
f Yea
r)
Years
Simple Payback Graph
Issued February 1, 2011 181 Existing Hotels Energy Analysis - Green Engage/Solutions

Constant speed, standard efficiency motor on supply fan for VAV system serving the first floor and corridor spaces (15 HP capacity). Constant speed, standard
efficiency motor for heating hot water circulator pump (1 HP capacity).
Emissions Base Case Proposed
Individual Resource Calculations Replace at End of Lifetime Existing Hotels
Mechanical M-11 NEMA Premium Efficiency Motors
Energy End-Use Benchmark Comparison Environmental Impact Analysis
Temperate
Base Case% Savings (+) /
Loss (-)Base Case Energy Use
Proposed Energy Use
Savings (+) / Loss (-)
Savings (+) / Loss (-)
MBtu/yr MBtu/yr MBtu/yr %CO2 (lb/yr) 2,401,837 2,399,712 0.1%
2,992 2,989 0.1%Space Heating - Elec 0.0 0.0 0.0 0.0%
SO2 (lb/yr) 6,658 6,648 0.1%Lighting 1,831.3 1,831.3 0.0 0.0% NOX (lb/yr)
Energy End-Use
Space Heating - Gas 3,698.6 3,701.7 -3.1 -0.1%Space Cooling 903.7 902.9 0.8 0.1%Proposed Modifications
9.8%
HVAC Fans 409 6 406 5 3 1 0 8%
VAV supply fan motor replaced with NEMA premium efficiency motor (15 HP capacity). Heating hot water
circulator pump replaced with NEMA premium
0.1%Heat Rejection 0.0 0.0 0.0 0.0%Pumps 25.5 23.0 2.5
2,401,837 2,399,712
1,500,000
2,000,000
2,500,000
3,000,000
lb/y
r
Annual CO2 Emissions
HVAC Fans 409.6 406.5 3.1 0.8%Receptacles - Elec 1,149.8 1,149.8 0.0 0.0%
circulator pump replaced with NEMA premium efficiency motor (1 HP capacity).
Base Utilities - Gas 2,033.7 2,033.7 0.0 0.0%
NB: demolition costs are not includedAll four climates can install a 15 HP NEMA efficiency motor on the supply fan. - 15 HP NEMA efficiency motor is $1,482- 15 HP normal motor is $1,195- Cost Premium of $287
Two colder climates can also install a 1HP NEMA efficiency motor on the hot water heating loop.- 1 HP NEMA efficiency motor is $531- 1 HP normal motor is $430- Cost Premium of $101
0.0%
Receptacles - Gas 425.8 425.8 0.0 0.0%
Financial Assumptions Total 10,477.9 10,474.7 3.3 0.0%
2,401,837 2,399,712
0
500,000
1,000,000
1,500,000
2,000,000
2,500,000
3,000,000
Base Case Proposed
lb/y
r
Annual CO2 Emissions
6,658
2,992
6,648
2,989
0
2,000
4,000
6,000
8,000
SO2 (lb/yr) NOX (lb/yr)
g/yr
Annual SO2 and NOX EmissionsBase Case
Proposed
10,478 10,475
0
2,000
4,000
6,000
8,000
10,000
12,000
Base Case Proposed
MBt
u/yr
Annual Total Energy Use
Issued February 1, 2011 182 Existing Hotels Energy Analysis - Green Engage/Solutions

Additional Capital CostHVAC Plant First Cost Reductions
Cooling Plant SavingsHeating Plant Savings
Mechanical M-11 NEMA Premium Efficiency Motors
Individual Resource Calculations Replace at End of Lifetime Existing Hotels Temperate
Annual Resource Cost Summary Financial Table Financial Results Summary
ResourceAnnual Resource Savings
(+) / Loss (-) Unit CostAnnual Savings (+) /
Loss (-)Yr.
Costs (Marginal/Maint/
Replace)
Savings (+) / Loss (-)
Natural gas -31 therms $0.9000 -$28Electricity 1,871 kWh $0.1028 $192
Cash FlowInitial Marginal Cost $388
$167Initial Annual Savings
Water & sewer 0 Gals $0.0037 $0 0 ($388) $01 $0 $167 $167
($388) Simple Payback 2.4 yrs
($388) 3 $0 $171 $171Capital Costs Savings Summary 2 $0 $169 $169
4 $0 $173 $173 First Year Yield On Marginal Cost 42.9%
44.6%IRR
N/A tons $0 5 $0 $178 $178N/A MBh $0 6 $0 $184 $184Heating Plant Savings
Airside Distribution SavingsTotal Additional Capital Cost:
Estimated Useful Life (yrs)Percent replacedReplacement Cost Premium (In 2010 Dollars)
Base YearValuation TypeProject Analysis PeriodInflation RateDiscount Rate for Defined ValuationEnergy Escalation Rate (Nominal)
N/A cfm $0 7 $0 $190N/A MBh $0 6 $0 $184 $184 NPV
$190($388) 8 $0 $196 $196
$1,418
9 $0 $202 $202
$22215 11 $0 $215 $215
Replacement Life and Cost Summary 10 $0 $208 $208
100% 12 $0 $222
14 $0 $237 $237($388) 13 $0 $229 $229
2010 16 $0 $253 $253Financial Analysis 15 ($586) $245 ($341)
20 18 $0 $271 $271Defined 17 $0 $262 $262
7.19% 20 $0 $290 $2902.79% 19 $0 $280 $280
(See Table in Assumptions)
($1,000)($500)
$0 $500
$1,000 $1,500 $2,000 $2,500 $3,000 $3,500 $4,000
0 5 10 15 20
Net
Cas
h Fl
ow (E
nd o
f Yea
r)
Years
Simple Payback Graph
Issued February 1, 2011 183 Existing Hotels Energy Analysis - Green Engage/Solutions

Individual Resource Calculations Replace at End of Lifetime Existing Hotels Temperate
Cumulative Scenario Green Engage Lvl 1: Install All New Measures Immediately & Replace Existing Measures when Lifetime is Finished
Base Case Energy End-Use Benchmark Comparison Environmental Impact AnalysisAs detailed in individual measures
Energy End-Use
Base Case Energy Use
Proposed Energy Use
Savings (+) / Loss (-)
Savings (+) / Loss (-)
MBtu/yr MBtu/yr MBtu/yr %
Emissions Base Case Proposed % Savings (+) / Loss (-)
CO2 (lb/yr) 2,401,837 1,910,501 20.5%
2,992 2,308 22.9%Space Heating - Elec 0.0 0.0 0.0 0.0%
SO2 (lb/yr) 6,658 4,889 26.6%Lighting 1,831.3 1,094.2 737.1 40.2% NOX (lb/yr)
Space Heating - Gas 3,698.6 3,808.3 -109.7 -3.0%Proposed Modifications Space Cooling 903.7 692.6 211.0 23.4%
As detailed in individual measures Pumps 25.5 25.2 0.3 1.2%
HVAC Fans 409 6 398 1 11 5 2 8%
20.5%Heat Rejection 0.0 0.0 0.0 0.0%
2,401,837
1,910,501
1,500,000
2,000,000
2,500,000
3,000,000
lb/y
r
Annual CO2 Emissions
HVAC Fans 409.6 398.1 11.5 2.8%Receptacles - Elec 1,149.8 962.3 187.5 16.3%Receptacles - Gas 425.8 277.1 148.7 34.9%Base Utilities - Gas 2,033.7 1,693.0 340.7 16.8%
All financial assumptions remain the same as in each individual measure.
14.6%
Financial Assumptions Total 10,477.9 8,950.9 1,527.1 14.6%
2,401,837
1,910,501
0
500,000
1,000,000
1,500,000
2,000,000
2,500,000
3,000,000
Base Case Proposed
lb/y
r
Annual CO2 Emissions
6,658
2,992
4,889
2,308
0
2,000
4,000
6,000
8,000
SO2 (lb/yr) NOX (lb/yr)
g/yr
Annual SO2 and NOX EmissionsBase Case
Proposed
10,4788,951
0
2,000
4,000
6,000
8,000
10,000
12,000
Base Case Proposed
MBt
u/yr
Annual Total Energy Use
Issued February 1, 2011 184 Existing Hotels Energy Analysis - Green Engage/Solutions

Additional Capital CostHVAC Plant First Cost Reductions
Cooling Plant SavingsHeating Plant Savings
Individual Resource Calculations Replace at End of Lifetime Existing Hotels Temperate
Cumulative Scenario Green Engage Lvl 1: Install All New Measures Immediately & Replace Existing Measures when Lifetime is Finished
Annual Resource Cost Summary Financial Table Financial Results Summary
ResourceAnnual Resource Savings
(+) / Loss (-) Unit CostAnnual Savings (+) /
Loss (-)Yr.
Costs (Marginal/Maint/
Replace)Electricity 336,264 kWh $0.1028 $34,568Savings (+) /
Loss (-) Cash FlowInitial Marginal Cost $66,784
Water & sewer 1,037,880 Gals $0.0037 $3,840 0Natural gas 3,798 therms $0.9000 $3,418
Initial Annual Savings $43,054
($66,784) $0 ($66,784) Simple Payback 1.5 yrs
Capital Costs Savings Summary 2 $1,572 $44,036 $45,608 IRR 69.6%($66,784) 3 $4,325 $45,059 $49,383
1 $1,245 $43,054 $44,299
N/A tons $0 5 $1,389 $47,547 $48,9374 $1,661 $46,079 $47,740 First Year Yield On Marginal Cost 64.5%
N/A MBh $0 6 $5 023 $49 079 $54 101Heating Plant SavingsAirside Distribution Savings
Total Additional Capital Cost:
Estimated Useful Life (yrs)Percent replacedReplacement Cost (In 2010 Dollars)
Base YearValuation TypeProject Analysis PeriodInflation RateDiscount Rate for Defined ValuationEnergy Escalation Rate (Nominal)
N/A cfm $0 7 $1,468N/A MBh $0 6 $5,023 $49,079 $54,101
$50,626 $52,094($66,784) 8 $1,854 $52,239 $54,093
NPV $451,482
9 $5,099 $53,922 $59,021
N/A 11 $1,638 $57,485 $59,124Replacement Life and Cost Summary 10 ($34,880) $55,666 $20,786
N/A 13 $1,731 $61,305 $63,036N/A 12 ($2,231) $59,383 $57,153
14 $2,186 $63,310 $65,496
2010 16 $2,310 $67,985 $70,294Financial Analysis 15 ($48,309) $65,625 $17,316
20 18 $6,984 $73,032 $80,016Defined 17 $1,932 $70,452 $72,384
7.19% 20 $2,578 $78,482 $81,0592.79% 19 $2,041 $75,662 $77,703
(See Table in Assumptions)
($200,000)
$0
$200,000
$400,000
$600,000
$800,000
$1,000,000
$1,200,000
0 5 10 15 20Net
Cas
h Fl
ow (E
nd o
f Yea
r)
Years
Simple Payback Graph
Issued February 1, 2011 185 Existing Hotels Energy Analysis - Green Engage/Solutions

NOX (lb/yr) 2,992 2,250MBtu/yr MBtu/yr MBtu/yr
Cumulative Scenario Green Engage Lvl 2: Install All New Measures Immediately & Replace Existing Measures when Lifetime is Finished
Base Case Energy End-Use Benchmark Comparison Environmental Impact AnalysisAs detailed in individual measures
Energy End-Use
Base Case Energy Use
Proposed Energy Use
Savings (+) / Loss (-)
Savings (+) / Loss (-)
Emissions Base Case Proposed % Savings (+) / Loss (-)
% SO2 (lb/yr) 6,658
Proposed Modifications Space Cooling 903.7 648.9 254.7 28.2%
CO2 (lb/yr) 2,401,837 1,861,191 22.5%
24.8%Space Heating - Elec 0.0 0.0 0.0 0.0%
4,774 28.3%Lighting 1,831.3 1,092.6 738.7 40.3%
Space Heating - Gas 3,698.6 3,698.7 -0.1 0.0%
25.5 22.7 2.8 10.8%As detailed in individual measures Pumps
HVAC Fans 409 6 371 1 38 6 9 4%
22.5%Heat Rejection 0.0 0.0 0.0 0.0%
Individual Resource Calculations Replace at End of Lifetime Existing Hotels Temperate
2,401,837
1,861,191
1,500,000
2,000,000
2,500,000
3,000,000
lb/y
r
Annual CO2 Emissions
34.9%Base Utilities - Gas 2,033.7 1,629.9 403.8 19.9%
Receptacles - Elec 1,149.8 962.3 187.5 16.3%HVAC Fans 409.6 371.1 38.6 9.4%
All financial assumptions remain the same as in each individual measure.
16.9%
Financial Assumptions Total 10,477.9 8,703.3 1,774.6 16.9%
Receptacles - Gas 425.8 277.1 148.7
2,401,837
1,861,191
0
500,000
1,000,000
1,500,000
2,000,000
2,500,000
3,000,000
Base Case Proposed
lb/y
r
Annual CO2 Emissions
6,658
2,992
4,774
2,250
0
2,000
4,000
6,000
8,000
SO2 (lb/yr) NOX (lb/yr)
g/yr
Annual SO2 and NOX EmissionsBase Case
Proposed
10,478
8,703
0
2,000
4,000
6,000
8,000
10,000
12,000
Base Case Proposed
MBt
u/yr
Annual Total Energy Use
Issued February 1, 2011 186 Existing Hotels Energy Analysis - Green Engage/Solutions

Additional Capital CostHVAC Plant First Cost Reductions
Cooling Plant SavingsHeating Plant Savings
Costs (Marginal/Maint/
Replace)
Cumulative Scenario Green Engage Lvl 2: Install All New Measures Immediately & Replace Existing Measures when Lifetime is Finished
Annual Resource Cost Summary Financial Table Financial Results Summary
Electricity 358,192 kWh $0.1028 $36,822Savings (+) /
Loss (-) Cash FlowInitial Marginal Cost $105,560
Water & sewer 1,037,880 Gals $0.0037 $3,840 0Natural gas 5,526 therms $0.9000 $4,973
Initial Annual Savings $46,990
ResourceAnnual Resource Savings
(+) / Loss (-) Unit CostAnnual Savings (+) /
Loss (-)Yr.
1 $1,245 $46,990 $48,235($105,560) $0 ($105,560) Simple Payback 2.2 yrs
($105,560) 3 $4,325 $49,264 $53,589Capital Costs Savings Summary 2 $1,572 $48,104 $49,676 IRR 48.6%
N/A tons $0 5 $1,389 $52,042 $53,4314 $1,661 $50,429 $52,089 First Year Yield On Marginal Cost 44.5%
N/A MBh $0 6 $5 023 $53 722 $58 745
Individual Resource Calculations Replace at End of Lifetime Existing Hotels Temperate
Heating Plant SavingsAirside Distribution Savings
Total Additional Capital Cost:
Estimated Useful Life (yrs)Percent replacedReplacement Cost (In 2010 Dollars)
Base YearValuation TypeProject Analysis PeriodInflation RateDiscount Rate for Defined ValuationEnergy Escalation Rate (Nominal)
N/A cfm $0 7 $1,468N/A MBh $0 6 $5,023 $53,722 $58,745
$55,425 $56,892($105,560) 8 $1,854 $57,198 $59,052
NPV $462,732
($39,670) $60,964 $21,2939 $5,099 $59,046 $64,145
14 $2,186 $69,363 $71,54913 $1,731 $67,160 $68,891
2010 16 $2,310 $74,543 $76,853Financial Analysis 15 ($48,895) $71,926 $23,031
20 18 $6,984 $80,139 $87,123Defined 17 $1,932 $77,279 $79,211
7.19% 20 $2,578 $86,169 $88,7462.79% 19 $2,041 $83,061 $85,102
(See Table in Assumptions)
N/AN/A 12 ($2,231) $65,046 $62,815N/A 11 $1,638 $62,963 $64,601
Replacement Life and Cost Summary 10
($200,000)
$0
$200,000
$400,000
$600,000
$800,000
$1,000,000
$1,200,000
0 5 10 15 20Net
Cas
h Fl
ow (E
nd o
f Yea
r)
Years
Simple Payback Graph
Issued February 1, 2011 187 Existing Hotels Energy Analysis - Green Engage/Solutions

Cold-Alpine: Install or Replace Immediately
Issued February 1, 2011 188 Existing Hotels Energy Analysis - Green Engage/Solutions

InstallReplaceReplaceReplaceReplaceReplaceReplaceInstallInstallInstallInstall
Energy Modelling Results Summary Install or Replace Immediately Existing Hotels Cold-Alpine
$4,8980.5% 3.7%
% %
$20,025$110,952
12.7%
1494.0% 1401.0%0.5% 383.2%
O-04E-07E-07 Energy Efficient TVs
Towel/Sheet ProgramEnergy Efficient Appliances
Zero Use of Incandescent Lamps in Circulation Spaces
Install New or Replace
378.9% $14,487
45.7% $65,261
25.2% $20,89818.6% $31,938
0.1%2.0%
Immediate7.6 yrs
IRR
> 20 yrs
%
N/A
CO2 Reductions NPV(Over 20 Years)Simple Payback
E-07 7.6 yrsEnergy Efficient Guest Room Refrigerators
M-09W-03
Zero Use of Incandescent Lamps in Back of House Spaces
2.2 yrs
B-04 Use of Building Appropriate Materials100% of Guest Rooms have 4F Deadband ThermostatsMeet IPC 2006 Maximum Flow Rates 1.6%
0.3 yrs1.3 yrs 1.6% 78.7%E-10 Occupancy Sensors in Corridors for Decorative Fixtures
0.5%
The table below summarises the overall energy and financial performance for the modeled existing hotel in the cold-alpine climate zone against the baseline building. Energy savings for a specific building may vary based on that building's parameters and financial results may also vary based on local costs and financing structures. For details regarding each measure refer to the individual calculation pages immediately following this page. For detailed assumptions relating to the energy model, utilities, emission factors, financial inputs, cost of capital, etc refer to the assumptions section of this book.Note: CO2 reduction percentages closely match both source energy reductions and annual energy saving cost reductions. Due to different modelling methodologies existing hotel and new hotel CO2 reduction percentages cannot be compared against each other. The stoplight colour legend contained below refers solely to simple payback periods.
Cold/DryWest Palm Beach, FL
0.3 yrs 5.8% 456.6% 453.3% $153,7600.1 yrs $54,055
N/A11.9%
N/A12.6%
$
($15,073)
yrs
2.0%
First Year Yield On Marginal Cost
13.3%
Relevant Action Group Measure
Zero Use of Incandescent Lamps in Guest Rooms
Green Engage Level 1 Certification
E-09E-09E-09
48.7%
3.8 yrs 1.3%77.5% $36,488
26.1%5 yrs 2.7% 19.6%
InstallInstallInstall
Replace
N/A
N/A
Legend (Criteria Based On Simple Payback Only):Very Short or Immediate Payback (0 - 3 years)Intermediate Payback (3 - 7 years)Long or No Payback (>7 years)
9.8%($1,335)
Occupancy Sensors in Offices 0.0% N/A 6.3% ($576)Variable Frequency Drives Never 0.2% N/A
Never9.1%
7.8%10 yrs 0.1%
10 yrs 1.3%
All Measures Installed or Replaced Immediately 3.2 yrs 17.7% 32.2% 28.9% $376,544
$5011.1%
Green Engage Level 2 Certification
E-108.5% $5,631
M-11M-11 NEMA Premium Efficiency Motors
Green Engage Level 1 Certification Cumulative Savings Scenarios
Green Engage Level 2 Certification Cumulative Savings Scenarios (Includes Green Engage Level 1)
All Measures Installed or Replaced Immediately 3.8 yrs 19.0% 27.3% 24.4% $374,685
E-08 Pipe Insulation
Issued February 1, 2011 189 Existing Hotels Energy Analysis - Green Engage/Solutions

Individual Resource Calculations Install or Replace Immediately Existing Hotels Cold-Alpine
PumpsSpace CoolingSpace Heating - Gas
419 0
0.01,828.7
Base Case Energy Use
Proposed Energy Use
LightingSpace Heating - Elec
0.0-0.2%
772.8
0.01,828.7
HVAC FansHeat Rejection
6,461
% Savings (+) / Loss (-)ProposedBase CaseEmissions
0.1%
0.2%NOX (lb/yr)
419 0 0 0
Operations
7,112.3 7,117.4 -5.1 -0.1%
MBtu/yr MBtu/yr
0.0 0.0%
O-04 Towel/Sheet Program
28.8
Energy End-Use Benchmark Comparison
Energy End-Use
Savings (+) / Loss (-)
3,249
28.8
0 0%
Environmental Impact Analysis
CO2 (lb/yr) 2,787,041 2,784,423 0.1%
Base Case3 commercial, non-Energy Star washing machines and
dryers, operating for 8 hours per day.
Proposed ModificationsThe energy consumption of washing machines and dryers is reduced by 17%, based on a study by the
American Hotel & Lodging Association.
-0.10.0 0.0
3,245 0.1%%
0.0%MBtu/yr
0.0%
770.4 2.4 0.3%
0.0
Savings (+) / Loss (-)
SO2 (lb/yr) 6,472
2,787,041 2,784,423
1,500,000
2,000,000
2,500,000
3,000,000
lb/y
r
Annual CO2 Emissions
419.0
0.0%
5.9 0.0%2,322.8 2,322.9Base Utilities - Gas
Receptacles - Elec 1,149.8 1,145.0 4.7 0.4%
- No additional costs
- Additional savings (apart from energy) from water and laundry detergent - Water savings of 34,606 gallons - Detergent savings of 173 gallons @ $7 per gallon (This is included under the Replacement Life and Cost Summary as a Savings)- Labour cost savings are not included
14,060.0Financial Assumptions
Receptacles - Gas 425.8 421.8 4.0 0.9%
HVAC Fans
14,054.1
419.0 0.0
Total
0.0%
-0.1 0.0%
American Hotel & Lodging Association.
2,787,041 2,784,423
0
500,000
1,000,000
1,500,000
2,000,000
2,500,000
3,000,000
Base Case Proposed
lb/y
r
Annual CO2 Emissions
6,472
3,249
6,461
3,245
0
2,000
4,000
6,000
8,000
SO2 (lb/yr) NOX (lb/yr)
g/yr
Annual SO2 and NOX EmissionsBase Case
Proposed
14,060 14,054
02,0004,0006,0008,000
10,00012,00014,00016,000
Base Case Proposed
MBt
u/yr
Annual Total Energy Use
Issued February 1, 2011 190 Existing Hotels Energy Analysis - Green Engage/Solutions

Additional Capital CostHVAC Plant First Cost Reductions
Cooling Plant SavingsHeating Plant Savings
Individual Resource Calculations Install or Replace Immediately Existing Hotels Cold-Alpine
$0
Operations
$1 428$1,389
$1,315$1,279$1,245
Water & sewerNatural gas
2,075Electricity
25,920-12
ResourceAnnual Resource Savings
(+) / Loss (-)Yr.
Financial Table
kWh
$10 582
Capital Costs Savings Summary$7,979
$9 154
-$11$213
Annual Savings (+) / Loss (-)
Annual Resource Cost Summary
Galstherms
$0.0037$0.9000$0.1028Unit Cost
N/AN/A
2
$0
$8,430
$0
$8,201
$10,295$10,016$9,745
$9,224$9,481
Costs (Marginal/Maint/
Replace)Cash FlowSavings (+) /
Loss (-)
6
$0
First Year Yield On Marginal Cost
IRR
MBhtons $0 $8,906
$8,664543
$1,352
Immediate
N/A
N/A
10$96 Simple Payback$0$0
O-04 Towel/Sheet Program
Initial Annual Savings
Initial Marginal Cost
Financial Results Summary
$7,979
Heating Plant SavingsAirside Distribution Savings
Total Additional Capital Cost:
Estimated Useful Life (yrs)Percent replacedReplacement Cost (In 2010 Dollars)
Base YearValuation TypeProject Analysis PeriodInflation RateDiscount Rate for Defined ValuationEnergy Escalation Rate (Nominal)
N/A $0 $1,468$1,428 $10,582$9,154N/A $0
$0
1 Replacement Life and Cost Summary
20191817Defined
20
2010
100%$1,211 $1,731
$1,638 $10,501
$13,549
$13,082$12,728$12,383
(See Table in Assumptions)
$1,986
11
$2,041 $15,1232.79%
Financial Analysis
$1,684
$1,779$11,721
$14,713
7.19%
$11,094
$14,315$13,927
13
$2,098 $13,447 $15,544
$9,409 $10,876
$10,794
876
$9,671$1,509
109
12
$1,551$10,217$9,940
$1,594
1615
$12,047
14
$1,879
$11,403 $13,182
$1,932
$1,828
$12,140$11,811$11,491$11,179
$12,478$12,825
NPVcfmMBh $110,952
$0
$50,000
$100,000
$150,000
$200,000
$250,000
$300,000
0 5 10 15 20
Net
Cas
h Fl
ow (E
nd o
f Yea
r)
Years
Simple Payback Graph
Issued February 1, 2011 191 Existing Hotels Energy Analysis - Green Engage/Solutions

Base Case Proposed % Savings (+) / Loss (-)
Individual Resource Calculations Install or Replace Immediately Existing Hotels
CO2 (lb/yr) 2,787,041 2,730,876 2.0%
Cold-Alpine
Energy E-07 Energy Efficient Appliances
Energy End-Use Benchmark Comparison Environmental Impact Analysis
Energy End-Use
Base Case Energy Use
Proposed Energy Use
Savings (+) / Loss (-)
Savings (+) / Loss (-)
Base CaseThe following commercial, non-Energy Star appliances
located in the food preparation and laundry areas: 3 washing machines, 2 dishwashers, 4 gas ovens, 2
fridges, 2 freezers, 2 icemakers and 5 vending machines
3,249 3,177 2.2%Space Heating - Elec 0.0 0.0 0.0 0.0%
SO2 (lb/yr) 6,472 6,308 2.5%Lighting 1,828.7 1,828.7 0.0 0.0% NOX (lb/yr)
MBtu/yr %
Emissions
Space Heating - Gas 7,112.3 7,132.4 -20.1 -0.3%Space Cooling 772.8 766.0 6.8 0.9%
MBtu/yr MBtu/yr
2.0%Heat Rejection 0.0 0.0 0.0 0.0%Pumps 28.8 29.0 -0.2 -0.6%
HVAC Fans 419 0 419 0 0 1 0 0%
Proposed ModificationsAll appliances replaced with Energy Star rated
equivalents. Overall saving of 30% on electricity and 34% on natural gas.
2,787,041 2,730,876
1,500,000
2,000,000
2,500,000
3,000,000
lb/y
r
Annual CO2 Emissions
99.7 8.7%Receptacles - Gas 425.8 279.4 146.4 34.4%
HVAC Fans 419.0 419.0 0.1 0.0%Receptacles - Elec 1,149.8 1,050.1
Base Utilities - Gas 2,322.8 2,322.9 -0.1 0.0%
- Basket of commercial appliances that have an energy star rating- Total weighted basket cost of US$79,451 and a weighted cost premium of US$5,864- Average lifetime of 12 years- Appliances include 3 washing machines, 2 dishwashers, 4 gas ovens, 2 fridges, 2 freezers, 2 icemakers and 5 vending machines
1.7%
Financial Assumptions Total 14,060.0 13,827.5 232.5 1.7%
34% on natural gas.
2,787,041 2,730,876
0
500,000
1,000,000
1,500,000
2,000,000
2,500,000
3,000,000
Base Case Proposed
lb/y
r
Annual CO2 Emissions
6,472
3,249
6,308
3,177
0
2,000
4,000
6,000
8,000
SO2 (lb/yr) NOX (lb/yr)
g/yr
Annual SO2 and NOX EmissionsBase Case
Proposed
14,060 13,827
02,0004,0006,0008,000
10,00012,00014,00016,000
Base Case Proposed
MBt
u/yr
Annual Total Energy Use
Issued February 1, 2011 192 Existing Hotels Energy Analysis - Green Engage/Solutions

Additional Capital CostHVAC Plant First Cost Reductions
Cooling Plant SavingsHeating Plant Savings
Energy E-07 Energy Efficient Appliances
Individual Resource Calculations Install or Replace Immediately Existing Hotels Cold-Alpine
Annual Resource Cost Summary Financial Table Financial Results Summary
ResourceAnnual Resource Savings
(+) / Loss (-) Unit CostAnnual Savings (+) /
Loss (-)Yr.
Costs (Marginal/Maint/
Replace)
Savings (+) / Loss (-) Cash Flow
Initial Marginal Cost $42,658
$5,088Natural gas 1,262 therms $0.9000 $1,136Electricity 31,168 kWh $0.1028 $3,204 Initial Annual Savings
Water & sewer 164,438 Gals $0.0037 $608 0 ($42,658) $0 ($42,658)1 $0 $5,088 $5,088
Simple Payback 7.6 yrs
($42,658) 3 $0 $5,381 $5,381Capital Costs Savings Summary 2 $0 $5,232 $5,232
4 $0 $5,536 $5,536 First Year Yield On Marginal Cost 11.9%
12.6%IRR
N/A MBh $0 6 $0 $5 899 $5 899N/A tons $0 5 $0 $5,714 $5,714
Heating Plant SavingsAirside Distribution Savings
Total Additional Capital Cost:
Estimated Useful Life (yrs)Percent replacedReplacement Cost Premium (In 2010 Dollars)
Base YearValuation TypeProject Analysis PeriodInflation RateDiscount Rate for Defined ValuationEnergy Escalation Rate (Nominal)
N/A cfm $0 7 $0 $6,089N/A MBh $0 6 $0 $5,899 $5,899 NPV
($42,658) 8 $0 $6,285 $6,285
$20,025
9 $0 $6,488 $6,488
$6,089
12 11 $0 $6,922 $6,922Replacement Life and Cost Summary 10 $0 $6,702 $6,702
14 $0 $7,628 $7,628($5,864) 13 $0 $7,385 $7,385
17 $0 $8,530 $8,5302010 16 $0 $8,218 $8,218
Financial Analysis 15 $0 $7,917 $7,917
$8,854
7.19% 20 $0 $9,534 $9,5342.79% 19 $0 $9,190 $9,190
Defined
(See Table in Assumptions)
100% 12 ($8,154) $7,150 ($1,004)
20 18 $0 $8,854($60,000)($40,000)($20,000)
$0 $20,000 $40,000 $60,000 $80,000
$100,000
0 5 10 15 20
Net
Cas
h Fl
ow (E
nd o
f Yea
r)
Years
Simple Payback Graph
Issued February 1, 2011 193 Existing Hotels Energy Analysis - Green Engage/Solutions

Base Case Proposed % Savings (+) / Loss (-)
Individual Resource Calculations Install or Replace Immediately Existing Hotels
CO2 (lb/yr) 2,787,041 2,772,836 0.5%
Cold-Alpine
Energy E-07 Energy Efficient Televisions
Energy End-Use Benchmark Comparison Environmental Impact Analysis
Energy End-Use
Base Case Energy Use
Proposed Energy Use
Savings (+) / Loss (-)
Savings (+) / Loss (-)
Base CaseOne 32 inch non-Energy Star television per guest
room.
3,249 3,225 0.7%Space Heating - Elec 0.0 0.0 0.0 0.0%
SO2 (lb/yr) 6,472 6,398 1.1%Lighting 1,828.7 1,828.7 0.0 0.0% NOX (lb/yr)
MBtu/yr %
Emissions
Space Heating - Gas 7,112.3 7,149.4 -37.1 -0.5%Space Cooling 772.8 767.3 5.5 0.7%
MBtu/yr MBtu/yr
0.5%Heat Rejection 0.0 0.0 0.0 0.0%Pumps 28.8 28.8 0.0 0.0%
HVAC Fans 419 0 418 6 0 4 0 1%
Proposed ModificationsTelevision is replaced with Energy Star rated
equivalent. Overall saving of 40% on electricity.
2,787,041 2,772,836
1,500,000
2,000,000
2,500,000
3,000,000
lb/y
r
Annual CO2 Emissions
41.7 3.6%Receptacles - Gas 425.8 425.8 0.0 0.0%
HVAC Fans 419.0 418.6 0.4 0.1%Receptacles - Elec 1,149.8 1,108.1
Base Utilities - Gas 2,322.8 2,322.8 0.0 0.0%
- 150, 32 inch energy star televisions- US$400 average outright cost per unit (including bulk discount)- US$0 cost premium over non-energy star TVs- Average lifetime - 10 years
0.1%
Financial Assumptions Total 14,060.0 14,049.5 10.5 0.1%
2,787,041 2,772,836
0
500,000
1,000,000
1,500,000
2,000,000
2,500,000
3,000,000
Base Case Proposed
lb/y
r
Annual CO2 Emissions
6,472
3,249
6,398
3,225
0
2,000
4,000
6,000
8,000
SO2 (lb/yr) NOX (lb/yr)
g/yr
Annual SO2 and NOX EmissionsBase Case
Proposed
14,060 14,050
02,0004,0006,0008,000
10,00012,00014,00016,000
Base Case Proposed
MBt
u/yr
Annual Total Energy Use
Issued February 1, 2011 194 Existing Hotels Energy Analysis - Green Engage/Solutions

Additional Capital CostHVAC Plant First Cost Reductions
Cooling Plant SavingsHeating Plant Savings
Energy E-07 Energy Efficient Televisions
Individual Resource Calculations Install or Replace Immediately Existing Hotels Cold-Alpine
Annual Resource Cost Summary Financial Table Financial Results Summary
ResourceAnnual Resource Savings
(+) / Loss (-) Unit CostAnnual Savings (+) /
Loss (-)Yr.
Costs (Marginal/Maint/
Replace)
Savings (+) / Loss (-) Cash Flow
Initial Marginal Cost $30,000
$1,109Natural gas -371 therms $0.9000 -$334Electricity 13,944 kWh $0.1028 $1,433 Initial Annual Savings
Water & sewer 0 Gals $0.0037 $0 0 ($30,000) $0 ($30,000)1 $0 $1,109 $1,109
Simple Payback > 20 yrs
($30,000) 3 $0 $1,126 $1,126Capital Costs Savings Summary 2 $0 $1,117 $1,117
4 $0 $1,133 $1,133 First Year Yield On Marginal Cost 3.7%
N/AIRR
N/A MBh $0 6 $0 $1 204 $1 204N/A tons $0 5 $0 $1,168 $1,168
Heating Plant SavingsAirside Distribution Savings
Total Additional Capital Cost:
Estimated Useful Life (yrs)Percent replacedReplacement Cost Premium (In 2010 Dollars)
Base YearValuation TypeProject Analysis PeriodInflation RateDiscount Rate for Defined ValuationEnergy Escalation Rate (Nominal)
N/A cfm $0 7 $0 $1,242N/A MBh $0 6 $0 $1,204 $1,204 NPV
($30,000) 8 $0 $1,280 $1,280
-$15,073
9 $0 $1,320 $1,320
$1,242
10 11 $0 $1,406 $1,406Replacement Life and Cost Summary 10 $0 $1,362 $1,362
14 $0 $1,547 $1,547$0 13 $0 $1,498 $1,498
17 $0 $1,699 $1,6992010 16 $0 $1,647 $1,647
Financial Analysis 15 $0 $1,596 $1,596
$1,753
7.19% 20 $0 $1,875 $1,8752.79% 19 $0 $1,808 $1,808
Defined
(See Table in Assumptions)
100% 12 $0 $1,451 $1,451
20 18 $0 $1,753($35,000)
($30,000)
($25,000)
($20,000)
($15,000)
($10,000)
($5,000)
$0 0 5 10 15 20
Net
Cas
h Fl
ow (E
nd o
f Yea
r)
Years
Simple Payback Graph
Issued February 1, 2011 195 Existing Hotels Energy Analysis - Green Engage/Solutions

Base Case Proposed % Savings (+) / Loss (-)
Individual Resource Calculations Install or Replace Immediately Existing Hotels
CO2 (lb/yr) 2,787,041 2,772,418 0.5%
Cold-Alpine
Energy E-07 Energy Efficient Guest Room Refrigerators
Energy End-Use Benchmark Comparison Environmental Impact Analysis
Energy End-Use
Base Case Energy Use
Proposed Energy Use
Savings (+) / Loss (-)
Savings (+) / Loss (-)
Base CaseOne 3 cu. ft. non-Energy Star refrigerator per guest
room.
3,249 3,224 0.8%Space Heating - Elec 0.0 0.0 0.0 0.0%
SO2 (lb/yr) 6,472 6,396 1.2%Lighting 1,828.7 1,828.7 0.0 0.0% NOX (lb/yr)
MBtu/yr %
Emissions
Space Heating - Gas 7,112.3 7,150.5 -38.2 -0.5%Space Cooling 772.8 767.1 5.7 0.7%
MBtu/yr MBtu/yr
0.5%Heat Rejection 0.0 0.0 0.0 0.0%Pumps 28.8 28.8 0.0 0.0%
HVAC Fans 419 0 418 6 0 4 0 1%
Proposed ModificationsRefrigerator is replaced with Energy Star rated
equivalent. Overall saving of 24% on electricity.
2,787,041 2,772,418
1,500,000
2,000,000
2,500,000
3,000,000
lb/y
r
Annual CO2 Emissions
42.9 3.7%Receptacles - Gas 425.8 425.8 0.0 0.0%
HVAC Fans 419.0 418.6 0.4 0.1%Receptacles - Elec 1,149.8 1,106.9
Base Utilities - Gas 2,322.8 2,322.8 0.0 0.0%
- Medium sized bar fridge at 3 cu. ft.- Average Energy Star cost per unit - US$120 (online average price minus 20% bulk discount)- Cost Premium - US$0- Average Lifetime – 12 years
0.1%
Financial Assumptions Total 14,060.0 14,049.2 10.8 0.1%
2,787,041 2,772,418
0
500,000
1,000,000
1,500,000
2,000,000
2,500,000
3,000,000
Base Case Proposed
lb/y
r
Annual CO2 Emissions
6,472
3,249
6,396
3,224
0
2,000
4,000
6,000
8,000
SO2 (lb/yr) NOX (lb/yr)
g/yr
Annual SO2 and NOX EmissionsBase Case
Proposed
14,060 14,049
02,0004,0006,0008,000
10,00012,00014,00016,000
Base Case Proposed
MBt
u/yr
Annual Total Energy Use
Issued February 1, 2011 196 Existing Hotels Energy Analysis - Green Engage/Solutions

Additional Capital CostHVAC Plant First Cost Reductions
Cooling Plant SavingsHeating Plant Savings
Energy E-07 Energy Efficient Guest Room Refrigerators
Individual Resource Calculations Install or Replace Immediately Existing Hotels Cold-Alpine
Annual Resource Cost Summary Financial Table Financial Results Summary
ResourceAnnual Resource Savings
(+) / Loss (-) Unit CostAnnual Savings (+) /
Loss (-)Yr.
Costs (Marginal/Maint/
Replace)
Savings (+) / Loss (-)
Natural gas -382 therms $0.9000 -$344Electricity 14,355 kWh $0.1028 $1,476
Cash FlowInitial Marginal Cost $9,000
$1,141Initial Annual Savings
Water & sewer 0 Gals $0.0037 $0 0 ($9,000) $01 $0 $1,141 $1,141
($9,000) Simple Payback 7.6 yrs
($9,000) 3 $0 $1,159 $1,159Capital Costs Savings Summary 2 $0 $1,150 $1,150
4 $0 $1,167 $1,167 First Year Yield On Marginal Cost 12.7%
13.3%IRR
N/A tons $0 5 $0 $1,203 $1,203N/A MBh $0 6 $0 $1 240 $1 240Heating Plant Savings
Airside Distribution SavingsTotal Additional Capital Cost:
Estimated Useful Life (yrs)Percent replacedReplacement Cost Premium (In 2010 Dollars)
Base YearValuation TypeProject Analysis PeriodInflation RateDiscount Rate for Defined ValuationEnergy Escalation Rate (Nominal)
N/A cfm $0 7 $0 $1,278N/A MBh $0 6 $0 $1,240 $1,240 NPV
$1,278($9,000) 8 $0 $1,318 $1,318
$4,898
9 $0 $1,358 $1,358
11 $0 $1,447 $1,447Replacement Life and Cost Summary 10 $0 $1,402 $1,402
14 $0 $1,592 $1,592$0 13 $0 $1,542 $1,542
2010 16 $0 $1,695 $1,695Financial Analysis 15 $0 $1,643 $1,643
20 18 $0 $1,804 $1,804Defined 17 $0 $1,749 $1,749
7.19% 20 $0 $1,931 $1,9312.79% 19 $0 $1,861 $1,861
(See Table in Assumptions)
100% 12 $0 $1,494 $1,49412
($15,000)($10,000)($5,000)
$0 $5,000
$10,000 $15,000 $20,000 $25,000
0 5 10 15 20
Net
Cas
h Fl
ow (E
nd o
f Yea
r)
Years
Simple Payback Graph
Issued February 1, 2011 197 Existing Hotels Energy Analysis - Green Engage/Solutions

Base Case Proposed % Savings (+) / Loss (-)
Individual Resource Calculations Install or Replace Immediately Existing Hotels
CO2 (lb/yr) 2,787,041 2,624,952 5.8%
Cold-Alpine
Energy E-09 Zero Use of Incandescent Lamps in Guest Rooms
Energy End-Use Benchmark Comparison Environmental Impact Analysis
Energy End-Use
Base Case Energy Use
Proposed Energy Use
Savings (+) / Loss (-)
Savings (+) / Loss (-)
Base CaseEach guest room contains a total of 12 light bulbs.
There is a 50/50 split of 75W incandescent bulbs and 25W CFLs, giving a lighting density of 1.5 W/sf. Bulbs
operate for 8 hours/day.
3,249 2,977 8.4%Space Heating - Elec 0.0 0.0 0.0 0.0%
SO2 (lb/yr) 6,472 5,630 13.0%Lighting 1,828.7 1,348.1 480.6 26.3% NOX (lb/yr)
MBtu/yr %
Emissions
Space Heating - Gas 7,112.3 7,547.0 -434.7 -6.1%Space Cooling 772.8 711.5 61.3 7.9%
MBtu/yr MBtu/yr
5.8%Heat Rejection 0.0 0.0 0.0 0.0%Pumps 28.8 28.9 -0.1 -0.3%
HVAC Fans 419 0 414 5 4 5 1 1%
Proposed ModificationsAll 75W incandescent bulbs are replaced with 25W CFLs (6 per room or 900 in total). The guest room
lighting density is reduced to 0.75 W/sf.
2,787,041 2,624,952
1,500,000
2,000,000
2,500,000
3,000,000
lb/y
r
Annual CO2 Emissions
0.0 0.0%Receptacles - Gas 425.8 425.8 0.0 0.0%
HVAC Fans 419.0 414.5 4.5 1.1%Receptacles - Elec 1,149.8 1,149.8
Base Utilities - Gas 2,322.8 2,322.9 -0.1 0.0%
- Total of 12 bulbs per room with 50% designated for replacement- Average Energy Star cost per unit of US$3.40 with bulb life of 6,000 – 12,000 hours- Conventional cost per unit of US$0.60 with bulb life of 750 – 1,000 hours- Common building laborer staff rate- Replacement cost premium is a savings because light bulbs will last longer for the price paid
0.8%
Financial Assumptions Total 14,060.0 13,948.5 111.5 0.8%
lighting density is reduced to 0.75 W/sf.
2,787,041 2,624,952
0
500,000
1,000,000
1,500,000
2,000,000
2,500,000
3,000,000
Base Case Proposed
lb/y
r
Annual CO2 Emissions
6,472
3,249
5,630
2,977
0
2,000
4,000
6,000
8,000
SO2 (lb/yr) NOX (lb/yr)
g/yr
Annual SO2 and NOX EmissionsBase Case
Proposed
14,060 13,948
02,0004,0006,0008,000
10,00012,00014,00016,000
Base Case Proposed
MBt
u/yr
Annual Total Energy Use
Issued February 1, 2011 198 Existing Hotels Energy Analysis - Green Engage/Solutions

Additional Capital CostHVAC Plant First Cost Reductions
Cooling Plant SavingsHeating Plant Savings
Energy E-09 Zero Use of Incandescent Lamps in Guest Rooms
Individual Resource Calculations Install or Replace Immediately Existing Hotels Cold-Alpine
Annual Resource Cost Summary Financial Table Financial Results Summary
ResourceAnnual Resource Savings
(+) / Loss (-) Unit CostAnnual Savings (+) /
Loss (-)Yr.
Costs (Marginal/Maint/
Replace)
Savings (+) / Loss (-) Cash Flow
Initial Marginal Cost $2,790
$12,647Natural gas -4,349 therms $0.9000 -$3,914Electricity 160,112 kWh $0.1028 $16,460 Initial Annual Savings
Water & sewer 0 Gals $0.0037 $0 0 ($2,790) $0 ($2,790)1 $0 $12,647 $12,647
Simple Payback 0.3 yrs
($2,790) 3 $2,709 $12,832 $15,541Capital Costs Savings Summary 2 $0 $12,742 $12,742
4 $0 $12,916 $12,916 First Year Yield On Marginal Cost 453.3%
456.6%IRR
N/A MBh $0 6 $2 941 $13 726 $16 667N/A tons $0 5 $0 $13,315 $13,315
Heating Plant SavingsAirside Distribution Savings
Total Additional Capital Cost:
Estimated Useful Life (yrs)Percent replacedReplacement Cost Premium (In 2010 Dollars)
Base YearValuation TypeProject Analysis PeriodInflation RateDiscount Rate for Defined ValuationEnergy Escalation Rate (Nominal)
N/A cfm $0 7 $0 $14,149N/A MBh $0 6 $2,941 $13,726 $16,667 NPV
($2,790) 8 $0 $14,586 $14,586
$153,760
9 $3,194 $15,036 $18,230
$14,149
3 11 $0 $16,021 $16,021Replacement Life and Cost Summary 10 $0 $15,521 $15,521
14 $0 $17,621 $17,621$2,494 13 $0 $17,071 $17,071
17 $0 $19,349 $19,3492010 16 $0 $18,756 $18,756
Financial Analysis 15 $3,766 $18,180 $21,946
$24,049
7.19% 20 $0 $21,353 $21,3532.79% 19 $0 $20,588 $20,588
Defined
(See Table in Assumptions)
100% 12 $3,468 $16,538 $20,006
20 18 $4,090 $19,960($50,000)
$0 $50,000
$100,000 $150,000 $200,000 $250,000 $300,000 $350,000 $400,000
0 5 10 15 20Net
Cas
h Fl
ow (E
nd o
f Yea
r)
Years
Simple Payback Graph
Issued February 1, 2011 199 Existing Hotels Energy Analysis - Green Engage/Solutions

Base Case Proposed % Savings (+) / Loss (-)
Individual Resource Calculations Install or Replace Immediately Existing Hotels
CO2 (lb/yr) 2,787,041 2,731,479 2.0%
Cold-Alpine
Energy E-09 Zero Use of Incandescent Lamps in Circulation Spaces
Energy End-Use Benchmark Comparison Environmental Impact Analysis
Energy End-Use
Base Case Energy Use
Proposed Energy Use
Savings (+) / Loss (-)
Savings (+) / Loss (-)
Base CaseCorridors contain 40 light bulbs per floor. There is a
50/50 split of 75W incandescent bulbs and 25W CFLs, giving a lighting density of 0.7 W/sf. Bulbs operate for
24 hours/day.
3,249 3,158 2.8%Space Heating - Elec 0.0 0.0 0.0 0.0%
SO2 (lb/yr) 6,472 6,196 4.3%Lighting 1,828.7 1,671.7 157.0 8.6% NOX (lb/yr)
MBtu/yr %
Emissions
Space Heating - Gas 7,112.3 7,233.0 -120.7 -1.7%Space Cooling 772.8 753.6 19.2 2.5%
MBtu/yr MBtu/yr
2.0%Heat Rejection 0.0 0.0 0.0 0.0%Pumps 28.8 28.8 0.0 0.0%
HVAC Fans 419 0 416 4 2 6 0 6%
Proposed ModificationsAll 75W incandescent bulbs are replaced with 25W CFLs (20 per floor or 100 in total). The guest room
lighting density is reduced to 0.35 W/sf.
2,787,041 2,731,479
1,500,000
2,000,000
2,500,000
3,000,000
lb/y
r
Annual CO2 Emissions
0.0 0.0%Receptacles - Gas 425.8 425.8 0.0 0.0%
HVAC Fans 419.0 416.4 2.6 0.6%Receptacles - Elec 1,149.8 1,149.8
Base Utilities - Gas 2,322.8 2,322.9 -0.1 0.0%
- Total of 40 bulbs per corridor with 50% designated for replacement- This amounts to 100 bulbs to be replaced across the entire building- Average Energy Star cost per unit of US$3.40 with bulb life of 6,000 – 12,000 hours- Conventional cost per unit of US$0.60 with bulb life of 750 – 1,000 hours- Common building laborer staff rate- Replacement cost premium is a savings because light bulbs will last longer for the price paid
0.4%
Financial Assumptions Total 14,060.0 14,002.0 58.0 0.4%
lighting density is reduced to 0.35 W/sf.
2,787,041 2,731,479
0
500,000
1,000,000
1,500,000
2,000,000
2,500,000
3,000,000
Base Case Proposed
lb/y
r
Annual CO2 Emissions
6,472
3,249
6,196
3,158
0
2,000
4,000
6,000
8,000
SO2 (lb/yr) NOX (lb/yr)
g/yr
Annual SO2 and NOX EmissionsBase Case
Proposed
14,060 14,002
02,0004,0006,0008,000
10,00012,00014,00016,000
Base Case Proposed
MBt
u/yr
Annual Total Energy Use
Issued February 1, 2011 200 Existing Hotels Energy Analysis - Green Engage/Solutions

Additional Capital CostHVAC Plant First Cost Reductions
Cooling Plant SavingsHeating Plant Savings
Energy E-09 Zero Use of Incandescent Lamps in Circulation Spaces
Individual Resource Calculations Install or Replace Immediately Existing Hotels Cold-Alpine
Annual Resource Cost Summary Financial Table Financial Results Summary
ResourceAnnual Resource Savings
(+) / Loss (-) Unit CostAnnual Savings (+) /
Loss (-)Yr.
Costs (Marginal/Maint/
Replace)
Savings (+) / Loss (-) Cash Flow
Initial Marginal Cost $310
$4,343Natural gas -1,208 therms $0.9000 -$1,088Electricity 52,404 kWh $0.1028 $5,387 Initial Annual Savings
Water & sewer 0 Gals $0.0037 $0 0 ($310) $0 ($310)1 $285 $4,343 $4,628
Simple Payback 0.1 yrs
($310) 3 $301 $4,427 $4,728Capital Costs Savings Summary 2 $293 $4,386 $4,678
4 $309 $4,466 $4,776 First Year Yield On Marginal Cost 1401.0%
1494.0%IRR
N/A MBh $0 6 $327 $4 748 $5 075N/A tons $0 5 $318 $4,605 $4,923
Heating Plant SavingsAirside Distribution Savings
Total Additional Capital Cost:
Estimated Useful Life (yrs)Percent replacedReplacement Cost Premium (In 2010 Dollars)
Base YearValuation TypeProject Analysis PeriodInflation RateDiscount Rate for Defined ValuationEnergy Escalation Rate (Nominal)
N/A cfm $0 7 $336 $4,896N/A MBh $0 6 $327 $4,748 $5,075 NPV
($310) 8 $345 $5,048 $5,393
$54,055
9 $355 $5,205 $5,560
$5,232
1 11 $375 $5,548 $5,923Replacement Life and Cost Summary 10 $365 $5,374 $5,738
14 $407 $6,104 $6,511$277 13 $396 $5,913 $6,309
17 $442 $6,720 $7,1622010 16 $430 $6,508 $6,938
Financial Analysis 15 $418 $6,303 $6,722
$7,392
7.19% 20 $480 $7,430 $7,9102.79% 19 $467 $7,163 $7,630
Defined
(See Table in Assumptions)
100% 12 $385 $5,727 $6,113
20 18 $454 $6,938($20,000)
$0 $20,000 $40,000 $60,000 $80,000
$100,000 $120,000 $140,000
0 5 10 15 20Net
Cas
h Fl
ow (E
nd o
f Yea
r)
Years
Simple Payback Graph
Issued February 1, 2011 201 Existing Hotels Energy Analysis - Green Engage/Solutions

Base Case Proposed % Savings (+) / Loss (-)
Individual Resource Calculations Install or Replace Immediately Existing Hotels
CO2 (lb/yr) 2,787,041 2,772,012 0.5%
Cold-Alpine
Energy E-09 Zero Use of Incandescent Lamps in Back of House
Energy End-Use Benchmark Comparison Environmental Impact Analysis
Energy End-Use
Base Case Energy Use
Proposed Energy Use
Savings (+) / Loss (-)
Savings (+) / Loss (-)
Base CaseOffices, food preparation, lockers, laundry, mechanical and
electrical spaces contain a total of 200 light bulbs. There is a 50/50 split of 75W incandescent bulbs and 25W CFLs, giving an average lighting density of 1.4 W/sf. Bulbs operate for 8
hours/day.
3,249 3,224 0.8%Space Heating - Elec 0.0 0.0 0.0 0.0%
SO2 (lb/yr) 6,472 6,397 1.2%Lighting 1,828.7 1,791.8 36.9 2.0% NOX (lb/yr)
MBtu/yr %
Emissions
Space Heating - Gas 7,112.3 7,146.0 -33.7 -0.5%Space Cooling 772.8 760.9 11.9 1.5%
MBtu/yr MBtu/yr
0.5%Heat Rejection 0.0 0.0 0.0 0.0%Pumps 28.8 29.1 -0.3 -1.1%
HVAC Fans 419 0 418 9 0 2 0 0%
Proposed ModificationsAll 75W incandescent bulbs are replaced with 25W CFLs (100 in total). The average lighting density is reduced to
0.7 W/sf.
2,787,041 2,772,012
1,500,000
2,000,000
2,500,000
3,000,000
lb/y
r
Annual CO2 Emissions
0.0 0.0%Receptacles - Gas 425.8 425.8 0.0 0.0%
HVAC Fans 419.0 418.9 0.2 0.0%Receptacles - Elec 1,149.8 1,149.8
Base Utilities - Gas 2,322.8 2,322.9 -0.1 0.0%
- Total of 200 bulbs in back of house with 50% designated for replacement- Average Energy Star cost per unit of US$3.40 with bulb life of 6,000 – 12,000 hours- Conventional cost per unit of US$0.60 with bulb life of 750 – 1,000 hours- Common building laborer staff rate- Replacement cost premium is a savings because light bulbs will last longer for the price paid
0.1%
Financial Assumptions Total 14,060.0 14,045.1 14.9 0.1%
2,787,041 2,772,012
0
500,000
1,000,000
1,500,000
2,000,000
2,500,000
3,000,000
Base Case Proposed
lb/y
r
Annual CO2 Emissions
6,472
3,249
6,397
3,224
0
2,000
4,000
6,000
8,000
SO2 (lb/yr) NOX (lb/yr)
g/yr
Annual SO2 and NOX EmissionsBase Case
Proposed
14,060 14,045
02,0004,0006,0008,000
10,00012,00014,00016,000
Base Case Proposed
MBt
u/yr
Annual Total Energy Use
Issued February 1, 2011 202 Existing Hotels Energy Analysis - Green Engage/Solutions

Additional Capital CostHVAC Plant First Cost Reductions
Cooling Plant SavingsHeating Plant Savings
Energy E-09 Zero Use of Incandescent Lamps in Back of House
Individual Resource Calculations Install or Replace Immediately Existing Hotels Cold-Alpine
Annual Resource Cost Summary Financial Table Financial Results Summary
ResourceAnnual Resource Savings
(+) / Loss (-) Unit CostAnnual Savings (+) /
Loss (-)Yr.
Costs (Marginal/Maint/
Replace)
Savings (+) / Loss (-) Cash Flow
Initial Marginal Cost $310
$1,175Natural gas -338 therms $0.9000 -$304Electricity 14,274 kWh $0.1028 $1,467 Initial Annual Savings
Water & sewer 0 Gals $0.0037 $0 0 ($310) $0 ($310)1 $0 $1,175 $1,175
Simple Payback 0.3 yrs
($310) 3 $301 $1,196 $1,497Capital Costs Savings Summary 2 $0 $1,186 $1,186
4 $0 $1,207 $1,207 First Year Yield On Marginal Cost 378.9%
383.2%IRR
N/A MBh $0 6 $327 $1 283 $1 610N/A tons $0 5 $0 $1,244 $1,244
Heating Plant SavingsAirside Distribution Savings
Total Additional Capital Cost:
Estimated Useful Life (yrs)Percent replacedReplacement Cost Premium (In 2010 Dollars)
Base YearValuation TypeProject Analysis PeriodInflation RateDiscount Rate for Defined ValuationEnergy Escalation Rate (Nominal)
N/A cfm $0 7 $0 $1,323N/A MBh $0 6 $327 $1,283 $1,610 NPV
($310) 8 $0 $1,364 $1,364
$14,487
9 $355 $1,406 $1,761
$1,323
3 11 $0 $1,498 $1,498Replacement Life and Cost Summary 10 $0 $1,451 $1,451
14 $0 $1,649 $1,649$277 13 $0 $1,597 $1,597
17 $0 $1,814 $1,8142010 16 $0 $1,757 $1,757
Financial Analysis 15 $418 $1,702 $2,121
$2,327
7.19% 20 $0 $2,005 $2,0052.79% 19 $0 $1,933 $1,933
Defined
(See Table in Assumptions)
100% 12 $385 $1,547 $1,932
20 18 $454 $1,873($5,000)
$0 $5,000
$10,000 $15,000 $20,000 $25,000 $30,000 $35,000
0 5 10 15 20Net
Cas
h Fl
ow (E
nd o
f Yea
r)
Years
Simple Payback Graph
Issued February 1, 2011 203 Existing Hotels Energy Analysis - Green Engage/Solutions

Base Case Proposed % Savings (+) / Loss (-)
Individual Resource Calculations Install or Replace Immediately Existing Hotels
CO2 (lb/yr) 2,787,041 2,742,756 1.6%
Cold-Alpine
Energy E-10 Occupancy Sensors in Corridors for Decorative Features
Energy End-Use Benchmark Comparison Environmental Impact Analysis
Energy End-Use
Base Case Energy Use
Proposed Energy Use
Savings (+) / Loss (-)
Savings (+) / Loss (-)
Base Case
3,249 3,176 2.2%Space Heating - Elec 0.0 0.0 0.0 0.0%
SO2 (lb/yr) 6,472 6,252 3.4%Lighting 1,828.7 1,703.8 125.0 6.8% NOX (lb/yr)
MBtu/yr %
Corridor lighting load reduced by 40% to 0.42 W/sf. Operating schedule remains unchanged. Reduction in load based on US
EPA predictions, assuming lighting levels turn down by 50% h i d
Emissions
Space Heating - Gas 7,112.3 7,208.4 -96.1 -1.4%Space Cooling 772.8 757.4 15.4 2.0%
MBtu/yr MBtu/yr
Corridors have a lighting density of 0.7 W/sf. Lights operate for 24 hours a day.
Proposed Modifications
1.6%Heat Rejection 0.0 0.0 0.0 0.0%Pumps 28.8 28.8 0.0 0.0%
HVAC Fans 419 0 416 9 2 2 0 5%
2,787,041 2,742,756
1,500,000
2,000,000
2,500,000
3,000,000
lb/y
r
Annual CO2 Emissions
0.0 0.0%when unoccupied.
Receptacles - Gas 425.8 425.8 0.0 0.0%
HVAC Fans 419.0 416.9 2.2 0.5%Receptacles - Elec 1,149.8 1,149.8
Base Utilities - Gas 2,322.8 2,322.9 -0.1 0.0%
- 5 sensors required per floor - therefore, 25 total per building- US$193 per sensor including electrician labour- Sensor lifetime – 10 years- Increase bulb lifetime by 40% (Savings includes this extended lifetime)- All 200 corridor light bulbs are assumed to already be CFLs
0.3%
Financial Assumptions Total 14,060.0 14,013.7 46.3 0.3%
2,787,041 2,742,756
0
500,000
1,000,000
1,500,000
2,000,000
2,500,000
3,000,000
Base Case Proposed
lb/y
r
Annual CO2 Emissions
6,472
3,249
6,252
3,176
0
2,000
4,000
6,000
8,000
SO2 (lb/yr) NOX (lb/yr)
g/yr
Annual SO2 and NOX EmissionsBase Case
Proposed
14,060 14,014
02,0004,0006,0008,000
10,00012,00014,00016,000
Base Case Proposed
MBt
u/yr
Annual Total Energy Use
Issued February 1, 2011 204 Existing Hotels Energy Analysis - Green Engage/Solutions

Additional Capital CostHVAC Plant First Cost Reductions
Cooling Plant SavingsHeating Plant Savings
Energy E-10 Occupancy Sensors in Corridors for Decorative Features
Individual Resource Calculations Install or Replace Immediately Existing Hotels Cold-Alpine
Annual Resource Cost Summary Financial Table Financial Results Summary
ResourceAnnual Resource Savings
(+) / Loss (-) Unit CostAnnual Savings (+) /
Loss (-)Yr.
Costs (Marginal/Maint/
Replace)
Savings (+) / Loss (-)
Natural gas -962 therms $0.9000 -$866Electricity 41,761 kWh $0.1028 $4,293
Cash FlowInitial Marginal Cost $4,825
$3,741Initial Annual Savings
($4,825) Simple Payback 1.3 yrsWater & sewer 0 Gals $0.0037 $0 0 ($4,825) $0
($4,825) 3 $0 $3,824 $3,824Capital Costs Savings Summary 2 $0 $3,783 $3,783
1 $0 $3,741 $3,741
4 $0 $3,863 $3,863 First Year Yield On Marginal Cost 77.5%
78.7%IRR
N/A tons $0 5 $0 $3,983 $3,983N/A MBh $0 6 $0 $4 105 $4 105Heating Plant Savings
Airside Distribution SavingsTotal Additional Capital Cost:
Estimated Useful Life (yrs)Percent replacedReplacement Cost Premium (In 2010 Dollars)
Base YearValuation TypeProject Analysis PeriodInflation RateDiscount Rate for Defined ValuationEnergy Escalation Rate (Nominal)
Replacement Life and Cost Summary 10 ($6,350) $4,641 ($1,709)
N/A cfm $0 7 $0 $4,232N/A MBh $0 6
($4,825) 8 $0 $4,363 $4,363
$36,488$0 $4,105 $4,105 NPV$4,232
9 $0 $4,497 $4,497
14 $0 $5,265 $5,265
2010 16 $0 $5,610 $5,610Financial Analysis 15 $0 $5,435 $5,435
20 18 $0 $5,976 $5,976Defined 17 $0 $5,790 $5,790
7.19% 20 $0 $6,393 $6,3932.79% 19 $0 $6,168 $6,168
(See Table in Assumptions)
100% 12 $0 $4,943 $4,94310 11 $0 $4,790 $4,790
($4,825) 13 $0 $5,102 $5,102
($10,000)$0
$10,000 $20,000 $30,000 $40,000 $50,000 $60,000 $70,000 $80,000 $90,000
0 5 10 15 20Net
Cas
h Fl
ow (E
nd o
f Yea
r)
Years
Simple Payback Graph
Issued February 1, 2011 205 Existing Hotels Energy Analysis - Green Engage/Solutions

Base Case Proposed % Savings (+) / Loss (-)
Individual Resource Calculations Install or Replace Immediately Existing Hotels
CO2 (lb/yr) 2,787,041 2,751,084 1.3%
Cold-Alpine
Building Materials B-04 Weather Stripping
Energy End-Use Benchmark Comparison Environmental Impact Analysis
Energy End-Use
Base Case Energy Use
Proposed Energy Use
Savings (+) / Loss (-)
Savings (+) / Loss (-)
Base Case
3,249 3,218 0.9%Space Heating - Elec 0.0 0.0 0.0 0.0%
SO2 (lb/yr) 6,472 6,454 0.3%Lighting 1,828.7 1,828.7 0.0 0.0% NOX (lb/yr)
MBtu/yr %
Emissions
Space Heating - Gas 7,112.3 6,843.4 268.9 3.8%Space Cooling 772.8 765.6 7.2 0.9%
MBtu/yr MBtu/yr
1.3%Heat Rejection 0.0 0.0 0.0 0.0%Pumps 28.8 27.5 1.3 4.6%
HVAC Fans 419 0 415 9 3 1 0 7%
Proposed Modifications
Infiltration of 0.3 air changes per hour in all perimeter spaces.
Infiltration is reduced by a third, to 0.2 air changes per hour, in all perimeter spaces.
2,787,041 2,751,084
1,500,000
2,000,000
2,500,000
3,000,000
lb/y
r
Annual CO2 Emissions
0.0 0.0%Receptacles - Gas 425.8 425.8 0.0 0.0%
HVAC Fans 419.0 415.9 3.1 0.7%Receptacles - Elec 1,149.8 1,149.8
Base Utilities - Gas 2,322.8 2,322.3 0.5 0.0%
- Material cost of weather stripping – US$0.88/ft- 5ft x 5ft window on 130 rooms requiring 1 hour of carpenter labor rate per window- 5ft x 10ft window on 20 corner rooms requiring 1.5 hour of carpenter labor per window- Average weatherstripping lifetime – 10 years 2.0%
Financial Assumptions Total 14,060.0 13,779.0 281.0 2.0%
2,787,041 2,751,084
0
500,000
1,000,000
1,500,000
2,000,000
2,500,000
3,000,000
Base Case Proposed
lb/y
r
Annual CO2 Emissions
6,472
3,249
6,454
3,218
0
2,000
4,000
6,000
8,000
SO2 (lb/yr) NOX (lb/yr)
g/yr
Annual SO2 and NOX EmissionsBase Case
Proposed
14,060 13,779
02,0004,0006,0008,000
10,00012,00014,00016,000
Base Case Proposed
MBt
u/yr
Annual Total Energy Use
Issued February 1, 2011 206 Existing Hotels Energy Analysis - Green Engage/Solutions
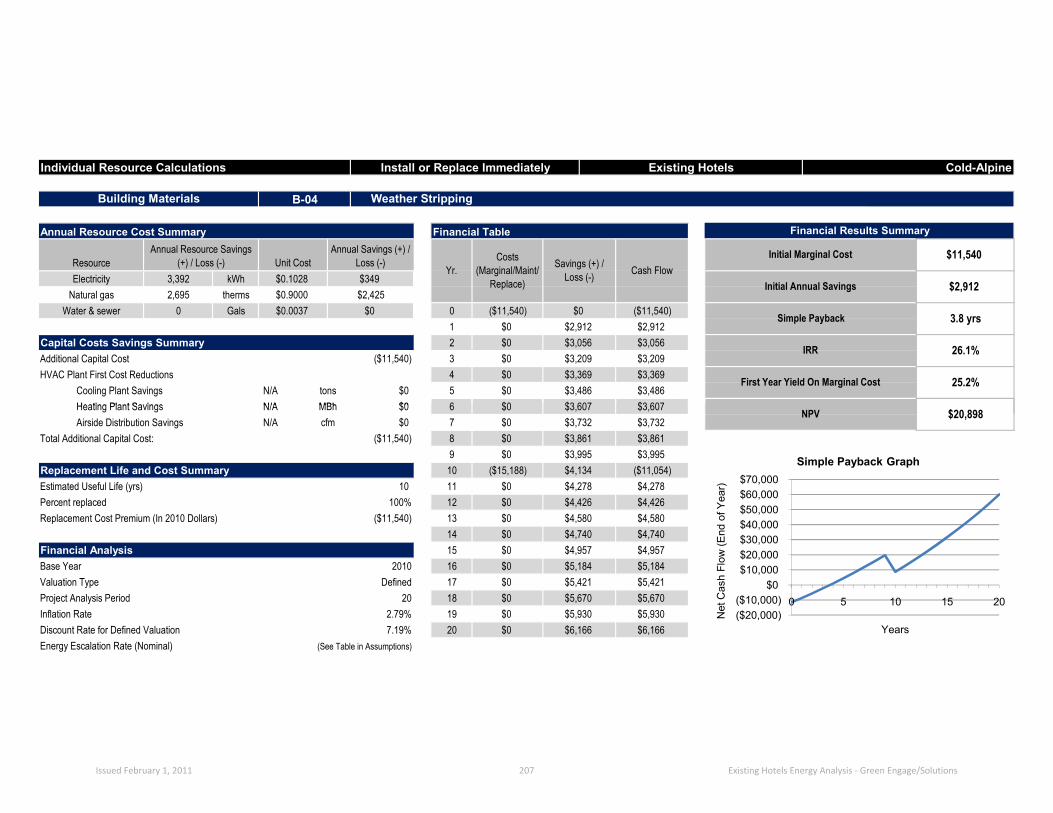
Additional Capital CostHVAC Plant First Cost Reductions
Cooling Plant SavingsHeating Plant Savings
Building Materials B-04 Weather Stripping
Individual Resource Calculations Install or Replace Immediately Existing Hotels Cold-Alpine
Annual Resource Cost Summary Financial Table Financial Results Summary
ResourceAnnual Resource Savings
(+) / Loss (-) Unit CostAnnual Savings (+) /
Loss (-)Yr.
Costs (Marginal/Maint/
Replace)
Savings (+) / Loss (-) Cash Flow
Initial Marginal Cost $11,540
$2,912Natural gas 2,695 therms $0.9000 $2,425Electricity 3,392 kWh $0.1028 $349 Initial Annual Savings
Water & sewer 0 Gals $0.0037 $0 0 ($11,540) $0 ($11,540)1 $0 $2,912 $2,912
Simple Payback 3.8 yrs
($11,540) 3 $0 $3,209 $3,209Capital Costs Savings Summary 2 $0 $3,056 $3,056
4 $0 $3,369 $3,369 First Year Yield On Marginal Cost 25.2%
26.1%IRR
N/A tons $0 5 $0 $3,486 $3,486N/A MBh $0 6 $0 $3 607 $3 607Heating Plant Savings
Airside Distribution SavingsTotal Additional Capital Cost:
Estimated Useful Life (yrs)Percent replacedReplacement Cost Premium (In 2010 Dollars)
Base YearValuation TypeProject Analysis PeriodInflation RateDiscount Rate for Defined ValuationEnergy Escalation Rate (Nominal)
N/A cfm $0 7 $0 $3,732N/A MBh $0 6 $0 $3,607 $3,607 NPV
$3,732($11,540) 8 $0 $3,861 $3,861
$20,898
9 $0 $3,995 $3,995
10 11 $0 $4,278 $4,278Replacement Life and Cost Summary 10 ($15,188) $4,134 ($11,054)
14 $0 $4,740 $4,740($11,540) 13 $0 $4,580 $4,580
2010 16 $0 $5,184 $5,184Financial Analysis 15 $0 $4,957 $4,957
Defined 17 $0 $5,421 $5,421
$4,426
7.19% 20 $0 $6,166 $6,1662.79% 19 $0 $5,930 $5,930
20 18 $0 $5,670 $5,670
(See Table in Assumptions)
100% 12 $0 $4,426
($20,000)($10,000)
$0 $10,000 $20,000 $30,000 $40,000 $50,000 $60,000 $70,000
0 5 10 15 20
Net
Cas
h Fl
ow (E
nd o
f Yea
r)
Years
Simple Payback Graph
Issued February 1, 2011 207 Existing Hotels Energy Analysis - Green Engage/Solutions

Base Case Proposed % Savings (+) / Loss (-)
Individual Resource Calculations Install or Replace Immediately Existing Hotels
CO2 (lb/yr) 2,787,041 2,711,853 2.7%
Cold-Alpine
Mechanical M-09 100% of Guest Rooms have 4F Deadband Thermostats
Energy End-Use Benchmark Comparison Environmental Impact Analysis
Energy End-Use
Base Case Energy Use
Proposed Energy Use
Savings (+) / Loss (-)
Savings (+) / Loss (-)
Base CaseGuest room thermostat setpoints of 74°F (cooling) and
74°F (heating).
3,249 3,173 2.3%Space Heating - Elec 0.0 0.0 0.0 0.0%
SO2 (lb/yr) 6,472 6,365 1.7%Lighting 1,828.7 1,828.7 0.0 0.0% NOX (lb/yr)
MBtu/yr %
Emissions
Space Heating - Gas 7,112.3 6,700.2 412.1 5.8%Space Cooling 772.8 701.8 71.0 9.2%
MBtu/yr MBtu/yr
2.7%Heat Rejection 0.0 0.0 0.0 0.0%Pumps 28.8 28.9 -0.2 -0.5%
HVAC Fans 419 0 420 3 1 2 0 3%
Proposed ModificationsGuest room thermostat setpoints of 76°F (cooling) and
72°F (heating).
2,787,041 2,711,853
1,500,000
2,000,000
2,500,000
3,000,000
lb/y
r
Annual CO2 Emissions
0.0 0.0%Receptacles - Gas 425.8 425.8 0.0 0.0%
HVAC Fans 419.0 420.3 -1.2 -0.3%Receptacles - Elec 1,149.8 1,149.8
Base Utilities - Gas 2,322.8 2,323.0 -0.2 0.0%
- US$217 per sensor including electrician labour- Average Lifetime – 15 years
3.4%
Financial Assumptions Total 14,060.0 13,578.5 481.5 3.4%
2,787,041 2,711,853
0
500,000
1,000,000
1,500,000
2,000,000
2,500,000
3,000,000
Base Case Proposed
lb/y
r
Annual CO2 Emissions
6,472
3,249
6,365
3,173
0
2,000
4,000
6,000
8,000
SO2 (lb/yr) NOX (lb/yr)
g/yr
Annual SO2 and NOX EmissionsBase Case
Proposed
14,060 13,579
02,0004,0006,0008,000
10,00012,00014,00016,000
Base Case Proposed
MBt
u/yr
Annual Total Energy Use
Issued February 1, 2011 208 Existing Hotels Energy Analysis - Green Engage/Solutions

Additional Capital CostHVAC Plant First Cost Reductions
Cooling Plant SavingsHeating Plant Savings
Mechanical M-09 100% of Guest Rooms have 4F Deadband Thermostats
Individual Resource Calculations Install or Replace Immediately Existing Hotels Cold-Alpine
Annual Resource Cost Summary Financial Table Financial Results Summary
ResourceAnnual Resource Savings
(+) / Loss (-) Unit CostAnnual Savings (+) /
Loss (-)Yr.
Costs (Marginal/Maint/
Replace)
Savings (+) / Loss (-) Cash Flow
Initial Marginal Cost $32,550
$6,044Natural gas 4,120 therms $0.9000 $3,708Electricity 20,390 kWh $0.1028 $2,096 Initial Annual Savings
Water & sewer 0 Gals $0.0037 $0 0 ($32,550) $0 ($32,550)1 $0 $6,044 $6,044
Simple Payback 5 yrs
($32,550) 3 $0 $6,560 $6,560Capital Costs Savings Summary 2 $0 $6,296 $6,296
4 $0 $6,836 $6,836 First Year Yield On Marginal Cost 18.6%
19.6%IRR
N/A MBh $0 6 $0 $7 309 $7 309N/A tons $0 5 $0 $7,069 $7,069
Heating Plant SavingsAirside Distribution Savings
Total Additional Capital Cost:
Estimated Useful Life (yrs)Percent replacedReplacement Cost Premium (In 2010 Dollars)
Base YearValuation TypeProject Analysis PeriodInflation RateDiscount Rate for Defined ValuationEnergy Escalation Rate (Nominal)
N/A cfm $0 7 $0 $7,558N/A MBh $0 6 $0 $7,309 $7,309 NPV
($32,550) 8 $0 $7,815 $7,815
$31,938
9 $0 $8,081 $8,081
$7,558
15 11 $0 $8,645 $8,645Replacement Life and Cost Summary 10 $0 $8,358 $8,358
14 $0 $9,567 $9,567($32,550) 13 $0 $9,249 $9,249
17 $0 $10,869 $10,8692010 16 $0 $10,416 $10,416
Financial Analysis 15 ($49,147) $9,983 ($39,164)
$11,342
7.19% 20 $0 $12,302 $12,3022.79% 19 $0 $11,836 $11,836
Defined
(See Table in Assumptions)
100% 12 $0 $8,942 $8,942
20 18 $0 $11,342($40,000)
($20,000)
$0
$20,000
$40,000
$60,000
$80,000
$100,000
0 5 10 15 20
Net
Cas
h Fl
ow (E
nd o
f Yea
r)
Years
Simple Payback Graph
Issued February 1, 2011 209 Existing Hotels Energy Analysis - Green Engage/Solutions

Individual Resource Calculations Install or Replace Immediately Existing Hotels Cold-Alpine
Water W-03 Meet IPC 2006 Maximum Flow Rates
Energy End-Use Benchmark Comparison Environmental Impact Analysis
Energy End-Use
Base Case Energy Use
Proposed Energy Use
Savings (+) / Loss (-)
Savings (+) / Loss (-)
Emissions Base Case Proposed % Savings (+) / Loss (-)
CO2 (lb/yr) 2,787,041 2,741,609 1.6%
3,249 3,214 1.1%Space Heating - Elec 0.0 0.0 0.0 0.0%
SO2 (lb/yr) 6,472 6,472 0.0%Lighting 1,828.7 1,828.7 0.0 0.0% NOX (lb/yr)
MBtu/yr MBtu/yr MBtu/yr %
Space Heating - Gas 7,112.3 7,112.3 0.0 0.0%Space Cooling 772.8 772.8 0.0 0.0%
1.6%Heat Rejection 0.0 0.0 0.0 0.0%Pumps 28.8 28.8 0.0 0.0%
HVAC Fans 419 0 419 0 0 0 0 0%
Base CaseDomestic hot water load of 7.40 gallons/person/day.
Load calculated by assuming water fixtures exceeding IPC rates by 20%, and default usage by hotel guests.
Proposed ModificationsWater fixtures meet IPC rates, reducing the domestic
hot water load reduced to 6.16 gallons/person/day.
2,787,041 2,741,609
1,500,000
2,000,000
2,500,000
3,000,000
lb/y
r
Annual CO2 Emissions
0.0 0.0%Receptacles - Gas 425.8 425.8 0.0 0.0%
HVAC Fans 419.0 419.0 0.0 0.0%Receptacles - Elec 1,149.8 1,149.8
Base Utilities - Gas 2,322.8 1,933.6 389.2 16.8%
- Install aerator on all bathroom faucets and low-flow shower heads
- Cost of each aerator is US$22.85 including common building labour rates- Aerator lifetime – 15 years
- Cost of each low-flow shower head is US$77.50 including plumber labour rates- Shower head lifetime – 10 years
2.8%
Financial Assumptions Total 14,060.0 13,670.8 389.2 2.8%
2,787,041 2,741,609
0
500,000
1,000,000
1,500,000
2,000,000
2,500,000
3,000,000
Base Case Proposed
lb/y
r
Annual CO2 Emissions
6,472
3,249
6,472
3,214
0
2,000
4,000
6,000
8,000
SO2 (lb/yr) NOX (lb/yr)
g/yr
Annual SO2 and NOX EmissionsBase Case
Proposed
14,060 13,671
02,0004,0006,0008,000
10,00012,00014,00016,000
Base Case Proposed
MBt
u/yr
Annual Total Energy Use
Issued February 1, 2011 210 Existing Hotels Energy Analysis - Green Engage/Solutions

Additional Capital CostHVAC Plant First Cost Reductions
Cooling Plant SavingsHeating Plant Savings
Individual Resource Calculations Install or Replace Immediately Existing Hotels Cold-Alpine
Water W-03 Meet IPC 2006 Maximum Flow Rates
Annual Resource Cost Summary Financial Table Financial Results Summary
ResourceAnnual Resource Savings
(+) / Loss (-) Unit CostAnnual Savings (+) /
Loss (-)Yr.
Costs (Marginal/Maint/
Replace)
Savings (+) / Loss (-) Cash Flow
Initial Marginal Cost $15,053
$6,883Natural gas 3,893 therms $0.9000 $3,504Electricity 0 kWh $0.1028 $0 Initial Annual Savings
Water & sewer 838,836 Gals $0.0037 $3,104 0 ($15,053) $0 ($15,053)1 $0 $6,883 $6,883
Simple Payback 2.2 yrs
($15,053) 3 $0 $7,473 $7,473Capital Costs Savings Summary 2 $0 $7,171 $7,171
4 $0 $7,788 $7,788 First Year Yield On Marginal Cost 45.7%
48.7%IRR
N/A MBh $0 6 $0 $8 292 $8 292N/A tons $0 5 $0 $8,036 $8,036
Heating Plant SavingsAirside Distribution Savings
Total Additional Capital Cost:
Estimated Useful Life (yrs)Percent replacedReplacement Cost Premium (In 2010 Dollars)
Base YearValuation TypeProject Analysis PeriodInflation RateDiscount Rate for Defined ValuationEnergy Escalation Rate (Nominal)
($3,428)100%
15
($11,625)100%
10
N/A cfm $0 7 $0 $8,556N/A MBh $0 6 $0 $8,292 $8,292 NPV
9 $0 $9,110 $9,110
$8,5568 $0 $8,829 $8,829
$65,261
11 $0 $9,700 $9,700Replacement Life and Cost Summary 10 ($15,300) $9,400 ($5,900)
14 $0 $10,659 $10,65913 $0 $10,329 $10,329
2010 16 $0 $11,503 $11,503Financial Analysis 15 ($5,175) $11,073 $5,897
$12,419Defined 17 $0 $11,952 $11,952
($15,053)
7.19% 20 $0 $13,357 $13,3572.79% 19 $0 $12,905 $12,905
20 18 $0 $12,419
(See Table in Assumptions)
12 $0 $10,010 $10,010
($40,000)($20,000)
$0 $20,000 $40,000 $60,000 $80,000
$100,000 $120,000 $140,000 $160,000 $180,000
0 5 10 15 20
Net
Cas
h Fl
ow (E
nd o
f Yea
r)
Years
Simple Payback Graph
Issued February 1, 2011 211 Existing Hotels Energy Analysis - Green Engage/Solutions

Base Case Proposed % Savings (+) / Loss (-)
Individual Resource Calculations Install or Replace Immediately Existing Hotels
CO2 (lb/yr) 2,787,041 2,750,333 1.3%
Cold-Alpine
Energy E-08 Pipe Insulation
Energy End-Use Benchmark Comparison Environmental Impact Analysis
Energy End-Use
Base Case Energy Use
Proposed Energy Use
Savings (+) / Loss (-)
Savings (+) / Loss (-)
Base CaseInsulation on heating hot water and domestic hot water
piping is assumed to be of mixed thickness and condition, equivalent to 0.5 inch thick fibreglass
insulation.
3,249 3,210 1.2%Space Heating - Elec 0.0 0.0 0.0 0.0%
SO2 (lb/yr) 6,472 6,412 0.9%Lighting 1,828.7 1,828.7 0.0 0.0% NOX (lb/yr)
MBtu/yr %
Emissions
Space Heating - Gas 7,112.3 7,005.8 106.5 1.5%Space Cooling 772.8 734.0 38.8 5.0%
MBtu/yr MBtu/yr
1.3%Heat Rejection 0.0 0.0 0.0 0.0%Pumps 28.8 28.8 0.0 0.0%
HVAC Fans 419 0 419 0 0 0 0 0%
Proposed ModificationsFibreglass insulation installed on all heating hot water and domestic hot water piping. 2 inch thickness for
heating hot water piping 2 inches or larger, 1.5 inches
2,787,041 2,750,333
1,500,000
2,000,000
2,500,000
3,000,000
lb/y
r
Annual CO2 Emissions
0.0 0.0%Receptacles - Gas 425.8 425.8 0.0 0.0%
HVAC Fans 419.0 419.0 0.0 0.0%Receptacles - Elec 1,149.8 1,149.8
Base Utilities - Gas 2,322.8 2,244.4 78.4 3.4%
- All pipe insulation is fiberglass with an all service jacket- Cost of insulation depends on width of pipe and thickness of insulation suggested as per Green Engage Energy Charts. Prices range from $4.71 to $12.85 including material, labour, overheard and profit.- Cold climates – insulation on hot water pipes and HVAC heating pipes- Insulation Lifetime – 30 yearsNB: Assumes easy access to all piping within hotel - It does not include any demolition costs.
1.6%
Financial Assumptions Total 14,060.0 13,836.3 223.7 1.6%
heating hot water piping 2 inches or larger, 1.5 inches for smaller piping. All domestic hot water insulation is
1 inch thick.
2,787,041 2,750,333
0
500,000
1,000,000
1,500,000
2,000,000
2,500,000
3,000,000
Base Case Proposed
lb/y
r
Annual CO2 Emissions
6,472
3,249
6,412
3,210
0
2,000
4,000
6,000
8,000
SO2 (lb/yr) NOX (lb/yr)
g/yr
Annual SO2 and NOX EmissionsBase Case
Proposed
14,060 13,836
02,0004,0006,0008,000
10,00012,00014,00016,000
Base Case Proposed
MBt
u/yr
Annual Total Energy Use
Issued February 1, 2011 212 Existing Hotels Energy Analysis - Green Engage/Solutions

Additional Capital CostHVAC Plant First Cost Reductions
Cooling Plant SavingsHeating Plant Savings
Energy E-08 Pipe Insulation
Individual Resource Calculations Install or Replace Immediately Existing Hotels Cold-Alpine
Annual Resource Cost Summary Financial Table Financial Results Summary
ResourceAnnual Resource Savings
(+) / Loss (-) Unit CostAnnual Savings (+) /
Loss (-)Yr.
Costs (Marginal/Maint/
Replace)
Savings (+) / Loss (-) Cash Flow
Initial Marginal Cost $34,748
$2,946Natural gas 1,850 therms $0.9000 $1,665Electricity 11,377 kWh $0.1028 $1,170 Initial Annual Savings
Water & sewer 0 Gals $0.0037 $0 0 ($34,748) $0 ($34,748)1 $0 $2,946 $2,946
Simple Payback 10 yrs
($34,748) 3 $0 $3,187 $3,187Capital Costs Savings Summary 2 $0 $3,064 $3,064
4 $0 $3,315 $3,315 First Year Yield On Marginal Cost 8.5%
9.1%IRR
N/A MBh $0 6 $0 $3 544 $3 544N/A tons $0 5 $0 $3,428 $3,428
Heating Plant SavingsAirside Distribution Savings
Total Additional Capital Cost:
Estimated Useful Life (yrs)Percent replacedReplacement Cost Premium (In 2010 Dollars)
Base YearValuation TypeProject Analysis PeriodInflation RateDiscount Rate for Defined ValuationEnergy Escalation Rate (Nominal)
N/A cfm $0 7 $0 $3,664N/A MBh $0 6 $0 $3,544 $3,544 NPV
($34,748) 8 $0 $3,788 $3,788
$5,631
9 $0 $3,916 $3,916
$3,664
30 11 $0 $4,189 $4,189Replacement Life and Cost Summary 10 $0 $4,050 $4,050
14 $0 $4,634 $4,634($34,748) 13 $0 $4,481 $4,481
17 $0 $5,257 $5,2572010 16 $0 $5,040 $5,040
Financial Analysis 15 $0 $4,833 $4,833
$5,482
7.19% 20 $0 $5,943 $5,9432.79% 19 $0 $5,718 $5,718
Defined
(See Table in Assumptions)
100% 12 $0 $4,332 $4,332
20 18 $0 $5,482($40,000)($30,000)($20,000)($10,000)
$0 $10,000 $20,000 $30,000 $40,000 $50,000 $60,000
0 5 10 15 20
Net
Cas
h Fl
ow (E
nd o
f Yea
r)
Years
Simple Payback Graph
Issued February 1, 2011 213 Existing Hotels Energy Analysis - Green Engage/Solutions

Base Case Proposed % Savings (+) / Loss (-)
Individual Resource Calculations Install or Replace Immediately Existing Hotels
CO2 (lb/yr) 2,787,041 2,786,416 0.0%
Cold-Alpine
Energy E-10 Occupancy Sensors in Offices
Energy End-Use Benchmark Comparison Environmental Impact Analysis
Energy End-Use
Base Case Energy Use
Proposed Energy Use
Savings (+) / Loss (-)
Savings (+) / Loss (-)
Base Case
3,249 3,247 0.0%Space Heating - Elec 0.0 0.0 0.0 0.0%
SO2 (lb/yr) 6,472 6,469 0.1%Lighting 1,828.7 1,827.1 1.6 0.1% NOX (lb/yr)
MBtu/yr %
Emissions
Space Heating - Gas 7,112.3 7,114.0 -1.7 0.0%Space Cooling 772.8 772.3 0.5 0.1%
MBtu/yr MBtu/yr
0.0%Heat Rejection 0.0 0.0 0.0 0.0%Pumps 28.8 28.8 0.0 0.0%
HVAC Fans 419 0 419 0 0 0 0 0%
Proposed Modifications
Offices have a lighting density of 1.8 W/sf. Lights operate for 8 hours a day.
Corridor lighting load is reduced by 25% to 1.35 W/sf. The operating schedule remains unchanged. The reduction in load is based on US EPA predictions,
2,787,041 2,786,416
1,500,000
2,000,000
2,500,000
3,000,000
lb/y
r
Annual CO2 Emissions
0.0 0.0%Receptacles - Gas 425.8 425.8 0.0 0.0%
HVAC Fans 419.0 419.0 0.0 0.0%Receptacles - Elec 1,149.8 1,149.8
Base Utilities - Gas 2,322.8 2,322.8 0.0 0.0%
- US$193 per sensor including electrician labour- Four offices per hotel building - Sensor lifetime – 10 years- Increase office bulb lifetime by 25%- Increase office light bulb lifetime by 25%- All 16 office light bulbs are assumed to already be CFLs
0.0%
Financial Assumptions Total 14,060.0 14,059.6 0.4 0.0%
reduction in load is based on US EPA predictions, assuming the lighting turns off when unoccupied.
2,787,041 2,786,416
0
500,000
1,000,000
1,500,000
2,000,000
2,500,000
3,000,000
Base Case Proposed
lb/y
r
Annual CO2 Emissions
6,472
3,249
6,469
3,247
0
2,000
4,000
6,000
8,000
SO2 (lb/yr) NOX (lb/yr)
g/yr
Annual SO2 and NOX EmissionsBase Case
Proposed
14,060 14,060
02,0004,0006,0008,000
10,00012,00014,00016,000
Base Case Proposed
MBt
u/yr
Annual Total Energy Use
Issued February 1, 2011 214 Existing Hotels Energy Analysis - Green Engage/Solutions

Additional Capital CostHVAC Plant First Cost Reductions
Cooling Plant SavingsHeating Plant Savings
Energy E-10 Occupancy Sensors in Offices
Individual Resource Calculations Install or Replace Immediately Existing Hotels Cold-Alpine
Annual Resource Cost Summary Financial Table Financial Results Summary
ResourceAnnual Resource Savings
(+) / Loss (-) Unit CostAnnual Savings (+) /
Loss (-)Yr.
Costs (Marginal/Maint/
Replace)
Savings (+) / Loss (-) Cash Flow
Initial Marginal Cost $772
$49Natural gas -17 therms $0.9000 -$15Electricity 620 kWh $0.1028 $64 Initial Annual Savings
Water & sewer 0 Gals $0.0037 $0 0 ($772) $0 ($772)1 $0 $49 $49
Simple Payback Never
($772) 3 $0 $64 $64Capital Costs Savings Summary 2 $0 $49 $49
4 $0 $50 $50 First Year Yield On Marginal Cost 6.3%
N/AIRR
N/A MBh $0 6 $0 $69 $69N/A tons $0 5 $0 $51 $51
Heating Plant SavingsAirside Distribution Savings
Total Additional Capital Cost:
Estimated Useful Life (yrs)Percent replacedReplacement Cost Premium (In 2010 Dollars)
Base YearValuation TypeProject Analysis PeriodInflation RateDiscount Rate for Defined ValuationEnergy Escalation Rate (Nominal)
N/A cfm $0 7 $0 $55N/A MBh $0 6 $0 $69 $69 NPV
($772) 8 $0 $56 $56
-$576
9 $0 $75 $75
$55
10 11 $0 $62 $62Replacement Life and Cost Summary 10 ($1,016) $60 ($956)
14 $0 $68 $68($772) 13 $0 $66 $66
2010 16 $0 $72 $72Financial Analysis 15 $0 $91 $91
Defined 17 $0 $75 $75
7.19% 20 $0 $82 $822.79% 19 $0 $79 $79
20 18 $0 $99 $99
(See Table in Assumptions)
100% 12 $0 $83 $83
($1,400)
($1,200)
($1,000)
($800)
($600)
($400)
($200)
$0 0 5 10 15 20
Net
Cas
h Fl
ow (E
nd o
f Yea
r)
Years
Simple Payback Graph
Issued February 1, 2011 215 Existing Hotels Energy Analysis - Green Engage/Solutions

Base Case Proposed % Savings (+) / Loss (-)
Individual Resource Calculations Install or Replace Immediately Existing Hotels
CO2 (lb/yr) 2,787,041 2,782,795 0.2%
Cold-Alpine
Mechanical M-11 Variable Frequency Drives
Energy End-Use Benchmark Comparison Environmental Impact Analysis
Energy End-Use
Base Case Energy Use
Proposed Energy Use
Savings (+) / Loss (-)
Savings (+) / Loss (-)
Base Case
3,249 3,238 0.3%Space Heating - Elec 0.0 0.0 0.0 0.0%
SO2 (lb/yr) 6,472 6,429 0.7%Lighting 1,828.7 1,828.7 0.0 0.0% NOX (lb/yr)
MBtu/yr %
Emissions
Space Heating - Gas 7,112.3 7,169.0 -56.7 -0.8%Space Cooling 772.8 773.3 -0.5 -0.1%
MBtu/yr MBtu/yr
0.2%Heat Rejection 0.0 0.0 0.0 0.0%Pumps 28.8 28.8 0.0 0.0%
HVAC Fans 419 0 390 6 28 4 6 8%
Proposed Modifications
Constant speed, standard efficiency motor on supply fan for VAV system serving the first floor and corridor
spaces (15 HP capacity).
One VFD (15 HP capacity) installed on VAV supply fan motor.
2,787,041 2,782,795
1,500,000
2,000,000
2,500,000
3,000,000
lb/y
r
Annual CO2 Emissions
0.0 0.0%Receptacles - Gas 425.8 425.8 0.0 0.0%
HVAC Fans 419.0 390.6 28.4 6.8%Receptacles - Elec 1,149.8 1,149.8
Base Utilities - Gas 2,322.8 2,322.9 -0.1 0.0%
VFDs only recommended on motors greater than 5HP.
- All four climate zones can install one 15 HP capable VFD for the supply fan motor- Cost of VFD is $2,868 including electrician installation rate- VFD lifetime – 10 years
-0.2%
Financial Assumptions Total 14,060.0 14,088.9 -28.9 -0.2%
2,787,041 2,782,795
0
500,000
1,000,000
1,500,000
2,000,000
2,500,000
3,000,000
Base Case Proposed
lb/y
r
Annual CO2 Emissions
6,472
3,249
6,429
3,238
0
2,000
4,000
6,000
8,000
SO2 (lb/yr) NOX (lb/yr)
g/yr
Annual SO2 and NOX EmissionsBase Case
Proposed
14,060 14,089
02,0004,0006,0008,000
10,00012,00014,00016,000
Base Case Proposed
MBt
u/yr
Annual Total Energy Use
Issued February 1, 2011 216 Existing Hotels Energy Analysis - Green Engage/Solutions

Additional Capital CostHVAC Plant First Cost Reductions
Cooling Plant SavingsHeating Plant Savings
Mechanical M-11 Variable Frequency Drives
Individual Resource Calculations Install or Replace Immediately Existing Hotels Cold-Alpine
Annual Resource Cost Summary Financial Table Financial Results Summary
ResourceAnnual Resource Savings
(+) / Loss (-) Unit CostAnnual Savings (+) /
Loss (-)Yr.
Costs (Marginal/Maint/
Replace)
Savings (+) / Loss (-)
Natural gas -568 therms $0.9000 -$511Electricity 8,182 kWh $0.1028 $841
Cash FlowInitial Marginal Cost $2,868
$318Initial Annual Savings
Water & sewer 0 Gals $0.0037 $0 0 ($2,868) $01 $0 $318 $318
($2,868) Simple Payback Never
($2,868) 3 $0 $291 $291Capital Costs Savings Summary 2 $0 $305 $305
4 $0 $276 $276 First Year Yield On Marginal Cost 11.1%
N/AIRR
N/A tons $0 5 $0 $283 $283N/A MBh $0 6 $0 $290 $290Heating Plant Savings
Airside Distribution SavingsTotal Additional Capital Cost:
Estimated Useful Life (yrs)Percent replacedReplacement Cost Premium (In 2010 Dollars)
Base YearValuation TypeProject Analysis PeriodInflation RateDiscount Rate for Defined ValuationEnergy Escalation Rate (Nominal)
N/A cfm $0 7 $0 $297N/A MBh $0 6 $0 $290 $290 NPV
$297($2,868) 8 $0 $304 $304
-$1,335
9 $0 $312 $312
10 11 $0 $330 $330Replacement Life and Cost Summary 10 ($3,775) $321 ($3,454)
14 $0 $358 $358($2,868) 13 $0 $349 $349
2010 16 $0 $364 $364Financial Analysis 15 $0 $362 $362
20 18 $0 $369 $369Defined 17 $0 $367 $367
7.19% 20 $0 $382 $3822.79% 19 $0 $370 $370
(See Table in Assumptions)
100% 12 $0 $339 $339
($4,000)($3,500)($3,000)($2,500)($2,000)($1,500)($1,000)
($500)$0
0 5 10 15 20
Net
Cas
h Fl
ow (E
nd o
f Yea
r)
Years
Simple Payback Graph
Issued February 1, 2011 217 Existing Hotels Energy Analysis - Green Engage/Solutions

Base Case Proposed % Savings (+) / Loss (-)
Individual Resource Calculations Install or Replace Immediately Existing Hotels
CO2 (lb/yr) 2,787,041 2,785,525 0.1%
Cold-Alpine
Mechanical M-11 NEMA Premium Efficiency Motors
Energy End-Use Benchmark Comparison Environmental Impact Analysis
Energy End-Use
Base Case Energy Use
Proposed Energy Use
Savings (+) / Loss (-)
Savings (+) / Loss (-)
Base Case
3,249 3,246 0.1%Space Heating - Elec 0.0 0.0 0.0 0.0%
SO2 (lb/yr) 6,472 6,464 0.1%Lighting 1,828.7 1,828.7 0.0 0.0% NOX (lb/yr)
MBtu/yr %
Emissions
Space Heating - Gas 7,112.3 7,117.2 -4.9 -0.1%Space Cooling 772.8 772.2 0.6 0.1%
MBtu/yr MBtu/yr
0.1%Heat Rejection 0.0 0.0 0.0 0.0%Pumps 28.8 27.4 1.4 4.7%
HVAC Fans 419 0 415 7 3 4 0 8%
Proposed Modifications
Constant speed, standard efficiency motor on supply fan for VAV system serving the first floor and corridor spaces (15 HP capacity). Constant speed, standard
efficiency motor for heating hot water circulator pump (1 HP capacity).
VAV supply fan motor replaced with NEMA premium efficiency motor (15 HP capacity). Heating hot water
circulator pump replaced with NEMA premium
2,787,041 2,785,525
1,500,000
2,000,000
2,500,000
3,000,000
lb/y
r
Annual CO2 Emissions
0.0 0.0%Receptacles - Gas 425.8 425.8 0.0 0.0%
HVAC Fans 419.0 415.7 3.4 0.8%Receptacles - Elec 1,149.8 1,149.8
Base Utilities - Gas 2,322.8 2,322.8 0.0 0.0%
NB: demolition costs are not includedAll four climates can install a 15 HP NEMA efficiency motor on the supply fan. - 15 HP NEMA efficiency motor is $1,482- 15 HP normal motor is $1,195- Cost Premium of $287
Two colder climates can also install a 1HP NEMA efficiency motor on the hot water heating loop.- 1 HP NEMA efficiency motor is $531- 1 HP normal motor is $430- Cost Premium of $101
0.0%
Financial Assumptions Total 14,060.0 14,059.5 0.5 0.0%
circulator pump replaced with NEMA premium efficiency motor (1 HP capacity).
2,787,041 2,785,525
0
500,000
1,000,000
1,500,000
2,000,000
2,500,000
3,000,000
Base Case Proposed
lb/y
r
Annual CO2 Emissions
6,472
3,249
6,464
3,246
0
2,000
4,000
6,000
8,000
SO2 (lb/yr) NOX (lb/yr)
g/yr
Annual SO2 and NOX EmissionsBase Case
Proposed
14,060 14,060
02,0004,0006,0008,000
10,00012,00014,00016,000
Base Case Proposed
MBt
u/yr
Annual Total Energy Use
Issued February 1, 2011 218 Existing Hotels Energy Analysis - Green Engage/Solutions

Additional Capital CostHVAC Plant First Cost Reductions
Cooling Plant SavingsHeating Plant Savings
Mechanical M-11 NEMA Premium Efficiency Motors
Individual Resource Calculations Install or Replace Immediately Existing Hotels Cold-Alpine
Annual Resource Cost Summary Financial Table Financial Results Summary
ResourceAnnual Resource Savings
(+) / Loss (-) Unit CostAnnual Savings (+) /
Loss (-)Yr.
Costs (Marginal/Maint/
Replace)
Savings (+) / Loss (-)
Natural gas -49 therms $0.9000 -$44Electricity 1,571 kWh $0.1028 $161
Cash FlowInitial Marginal Cost $1,201
$118Initial Annual Savings
Water & sewer 0 Gals $0.0037 $0 0 ($1,201) $01 $0 $118 $118
($1,201) Simple Payback 10 yrs
($1,201) 3 $0 $119 $119Capital Costs Savings Summary 2 $0 $119 $119
4 $0 $120 $120 First Year Yield On Marginal Cost 9.8%
7.8%IRR
N/A tons $0 5 $0 $123 $123N/A MBh $0 6 $0 $127 $127Heating Plant Savings
Airside Distribution SavingsTotal Additional Capital Cost:
Estimated Useful Life (yrs)Percent replacedReplacement Cost Premium (In 2010 Dollars)
Base YearValuation TypeProject Analysis PeriodInflation RateDiscount Rate for Defined ValuationEnergy Escalation Rate (Nominal)
N/A cfm $0 7 $0 $131N/A MBh $0 6 $0 $127 $127 NPV
$131($1,201) 8 $0 $135 $135
$50
9 $0 $139 $139
15 11 $0 $148 $148Replacement Life and Cost Summary 10 $0 $144 $144
14 $0 $163 $163($388) 13 $0 $158 $158
2010 16 $0 $173 $173Financial Analysis 15 ($586) $168 ($418)
20 18 $0 $184 $184Defined 17 $0 $178 $178
7.19% 20 $0 $197 $1972.79% 19 $0 $190 $190
(See Table in Assumptions)
100% 12 $0 $153 $153
($1,500)
($1,000)
($500)
$0
$500
$1,000
$1,500
0 5 10 15 20
Net
Cas
h Fl
ow (E
nd o
f Yea
r)
Years
Simple Payback Graph
Issued February 1, 2011 219 Existing Hotels Energy Analysis - Green Engage/Solutions

Individual Resource Calculations Install or Replace Immediately Existing Hotels Cold-Alpine
Cumulative Scenario Green Engage Lvl 1: All Measures Installed or Replaced Now
Base Case Energy End-Use Benchmark Comparison Environmental Impact AnalysisAs detailed in individual measures
Energy End-Use
Base Case Energy Use
Proposed Energy Use
Savings (+) / Loss (-)
Savings (+) / Loss (-)
MBtu/yr MBtu/yr MBtu/yr %
Emissions Base Case Proposed % Savings (+) / Loss (-)
CO2 (lb/yr) 2,787,181 2,295,019 17.7%
3,249 2,570 20.9%Space Heating - Elec 0.0 0.0 0.0 0.0%
SO2 (lb/yr) 6,472 4,740 26.8%Lighting 1,828.7 1,091.7 737.1 40.3% NOX (lb/yr)
Space Heating - Gas 7,117.4 7,185.3 -67.9 -1.0%Proposed Modifications Space Cooling 772.8 586.5 186.3 24.1%
As detailed in individual measures Pumps 28.8 27.9 0.9 3.0%
HVAC Fans 419 0 407 1 11 9 2 9%
17.7%Heat Rejection 0.0 0.0 0.0 0.0%
2,787,181
2,295,019
1,500,000
2,000,000
2,500,000
3,000,000
lb/y
r
Annual CO2 Emissions
HVAC Fans 419.0 407.1 11.9 2.9%Receptacles - Elec 1,149.8 962.3 187.5 16.3%Receptacles - Gas 421.8 277.1 144.7 34.3%Base Utilities - Gas 2,322.9 1,933.8 389.1 16.8%
All financial assumptions remain the same as in each individual measure.
11.3%
Financial Assumptions Total 14,061.2 12,471.6 1,589.6 11.3%
2,787,181
2,295,019
0
500,000
1,000,000
1,500,000
2,000,000
2,500,000
3,000,000
Base Case Proposed
lb/y
r
Annual CO2 Emissions
6,472
3,249
4,740
2,570
0
2,000
4,000
6,000
8,000
SO2 (lb/yr) NOX (lb/yr)
g/yr
Annual SO2 and NOX EmissionsBase Case
Proposed
14,06112,472
02,0004,0006,0008,000
10,00012,00014,00016,000
Base Case Proposed
MBt
u/yr
Annual Total Energy Use
Issued February 1, 2011 220 Existing Hotels Energy Analysis - Green Engage/Solutions
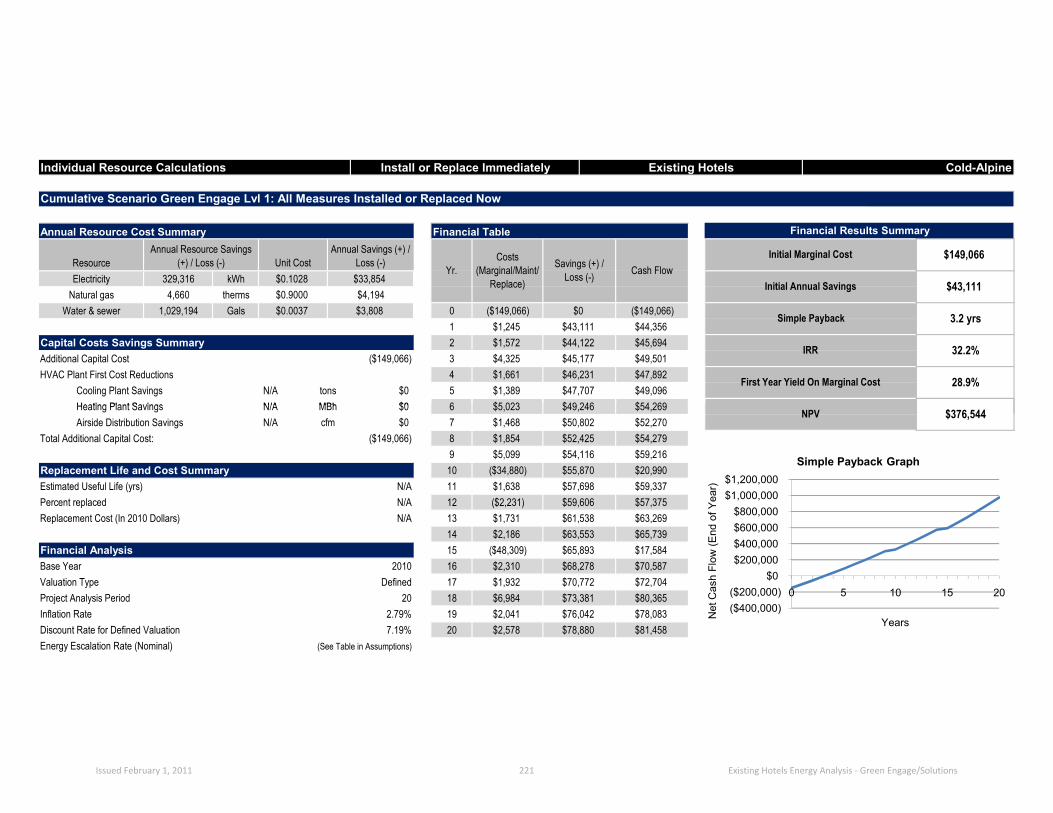
Additional Capital CostHVAC Plant First Cost Reductions
Cooling Plant SavingsHeating Plant Savings
Individual Resource Calculations Install or Replace Immediately Existing Hotels Cold-Alpine
Cumulative Scenario Green Engage Lvl 1: All Measures Installed or Replaced Now
Annual Resource Cost Summary Financial Table Financial Results Summary
ResourceAnnual Resource Savings
(+) / Loss (-) Unit CostAnnual Savings (+) /
Loss (-)Yr.
Costs (Marginal/Maint/
Replace)Electricity 329,316 kWh $0.1028 $33,854Savings (+) /
Loss (-) Cash FlowInitial Marginal Cost $149,066
Water & sewer 1,029,194 Gals $0.0037 $3,808 0Natural gas 4,660 therms $0.9000 $4,194
Initial Annual Savings $43,111
($149,066) $0 ($149,066) Simple Payback 3.2 yrs
Capital Costs Savings Summary 2 $1,572 $44,122 $45,694 IRR 32.2%($149,066) 3 $4,325 $45,177 $49,501
1 $1,245 $43,111 $44,356
N/A tons $0 5 $1,389 $47,707 $49,0964 $1,661 $46,231 $47,892 First Year Yield On Marginal Cost 28.9%
N/A MBh $0 6 $5 023 $49 246 $54 269Heating Plant SavingsAirside Distribution Savings
Total Additional Capital Cost:
Estimated Useful Life (yrs)Percent replacedReplacement Cost (In 2010 Dollars)
Base YearValuation TypeProject Analysis PeriodInflation RateDiscount Rate for Defined ValuationEnergy Escalation Rate (Nominal)
N/A cfm $0 7 $1,468N/A MBh $0 6 $5,023 $49,246 $54,269
$50,802 $52,270($149,066) 8 $1,854 $52,425 $54,279
NPV $376,544
9 $5,099 $54,116 $59,216
N/A 11 $1,638 $57,698 $59,337Replacement Life and Cost Summary 10 ($34,880) $55,870 $20,990
N/A 13 $1,731 $61,538 $63,269N/A 12 ($2,231) $59,606 $57,375
14 $2,186 $63,553 $65,739
2010 16 $2,310 $68,278 $70,587Financial Analysis 15 ($48,309) $65,893 $17,584
20 18 $6,984 $73,381 $80,365Defined 17 $1,932 $70,772 $72,704
7.19% 20 $2,578 $78,880 $81,4582.79% 19 $2,041 $76,042 $78,083
(See Table in Assumptions)
($400,000)($200,000)
$0 $200,000 $400,000 $600,000 $800,000
$1,000,000 $1,200,000
0 5 10 15 20
Net
Cas
h Fl
ow (E
nd o
f Yea
r)
Years
Simple Payback Graph
Issued February 1, 2011 221 Existing Hotels Energy Analysis - Green Engage/Solutions
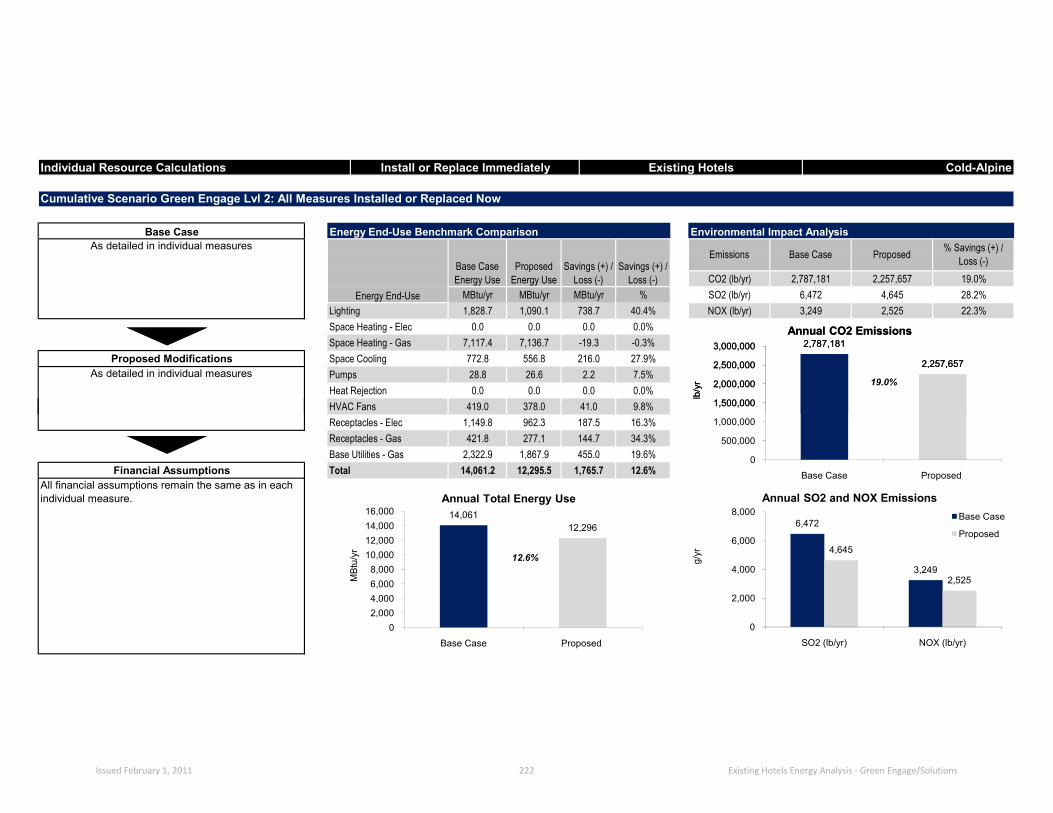
Individual Resource Calculations Install or Replace Immediately Existing Hotels Cold-Alpine
CO2 (lb/yr) 2,787,181 2,257,657 19.0%
Cumulative Scenario Green Engage Lvl 2: All Measures Installed or Replaced Now
Base Case Energy End-Use Benchmark Comparison Environmental Impact AnalysisAs detailed in individual measures
Energy End-Use
Base Case Energy Use
Proposed Energy Use
Savings (+) / Loss (-)
Savings (+) / Loss (-)
Emissions Base Case Proposed % Savings (+) / Loss (-)
%
Space Heating - Elec 0.0 0.0 0.0 0.0%
4,645 28.2%Lighting 1,828.7 1,090.1 738.7 40.4% NOX (lb/yr) 3,249 2,525
MBtu/yr MBtu/yr MBtu/yr SO2 (lb/yr) 6,47222.3%
Space Heating - Gas 7,117.4 7,136.7 -19.3 -0.3%Proposed Modifications Space Cooling 772.8 556.8 216.0 27.9%
As detailed in individual measures Pumps 28.8 26.6 2.2 7.5%
HVAC Fans 419 0 378 0 41 0 9 8%
19.0%Heat Rejection 0.0 0.0 0.0 0.0%
2,787,181
2,257,657
1,500,000
2,000,000
2,500,000
3,000,000
lb/y
r
Annual CO2 Emissions
HVAC Fans 419.0 378.0 41.0 9.8%Receptacles - Elec 1,149.8 962.3 187.5 16.3%Receptacles - Gas 421.8 277.1 144.7 34.3%Base Utilities - Gas 2,322.9 1,867.9 455.0 19.6%
All financial assumptions remain the same as in each individual measure.
12.6%
Financial Assumptions Total 14,061.2 12,295.5 1,765.7 12.6%
2,787,181
2,257,657
0
500,000
1,000,000
1,500,000
2,000,000
2,500,000
3,000,000
Base Case Proposed
lb/y
r
Annual CO2 Emissions
6,472
3,249
4,645
2,525
0
2,000
4,000
6,000
8,000
SO2 (lb/yr) NOX (lb/yr)
g/yr
Annual SO2 and NOX EmissionsBase Case
Proposed
14,06112,296
02,0004,0006,0008,000
10,00012,00014,00016,000
Base Case Proposed
MBt
u/yr
Annual Total Energy Use
Issued February 1, 2011 222 Existing Hotels Energy Analysis - Green Engage/Solutions

Additional Capital CostHVAC Plant First Cost Reductions
Cooling Plant SavingsHeating Plant Savings
Individual Resource Calculations Install or Replace Immediately Existing Hotels Cold-Alpine
Cumulative Scenario Green Engage Lvl 2: All Measures Installed or Replaced Now
Annual Resource Cost Summary Financial Table Financial Results Summary
ResourceAnnual Resource Savings
(+) / Loss (-) Unit CostAnnual Savings (+) /
Loss (-)Yr.
Costs (Marginal/Maint/
Replace)Electricity 347,367 kWh $0.1028Savings (+) /
Loss (-) Cash FlowInitial Marginal Cost $188,654
Water & sewer 1,029,194 Gals $0.0037 $3,808 0Natural gas 5,806 therms $0.9000 $5,225
$35,709 Initial Annual Savings $46,089
1 $1,245 $46,089 $47,333($188,654) $0 ($188,654) Simple Payback 3.8 yrs
($188,654) 3 $4,325 $48,347 $52,672Capital Costs Savings Summary 2 $1,572 $47,194 $48,766 IRR 27.3%
N/A tons $0 5 $1,389 $51,088 $52,4784 $1,661 $49,504 $51,165 First Year Yield On Marginal Cost 24.4%
N/A MBh $0 6 $5 023 $52 740 $57 763Heating Plant SavingsAirside Distribution Savings
Total Additional Capital Cost:
Estimated Useful Life (yrs)Percent replacedReplacement Cost (In 2010 Dollars)
Base YearValuation TypeProject Analysis PeriodInflation RateDiscount Rate for Defined ValuationEnergy Escalation Rate (Nominal)
N/A cfm $0 7 $1,468N/A MBh $0 6 $5,023 $52,740 $57,763
$54,412 $55,880($188,654) 8 $1,854 $56,154 $58,008
NPV $374,685
9 $5,099 $57,969 $63,069
N/A 11 $1,638 $61,816 $63,454Replacement Life and Cost Summary 10 ($39,670) $59,853 $20,182
N/A 13 $1,731 $65,939 $67,669N/A 12 ($2,231) $63,863 $61,632
14 $2,186 $68,102 $70,288
2010 16 $2,310 $73,201 $75,511Financial Analysis 15 ($48,895) $70,626 $21,731
20 18 $6,984 $78,711 $85,695Defined 17 $1,932 $75,895 $77,826
7.19% 20 $2,578 $84,641 $87,2182.79% 19 $2,041 $81,587 $83,628
(See Table in Assumptions)
($400,000)($200,000)
$0 $200,000 $400,000 $600,000 $800,000
$1,000,000 $1,200,000
0 5 10 15 20
Net
Cas
h Fl
ow (E
nd o
f Yea
r)
Years
Simple Payback Graph
Issued February 1, 2011 223 Existing Hotels Energy Analysis - Green Engage/Solutions
Cold-Alpine: Replace at End of Lifetime
Issued February 1, 2011 224 Existing Hotels Energy Analysis - Green Engage/Solutions
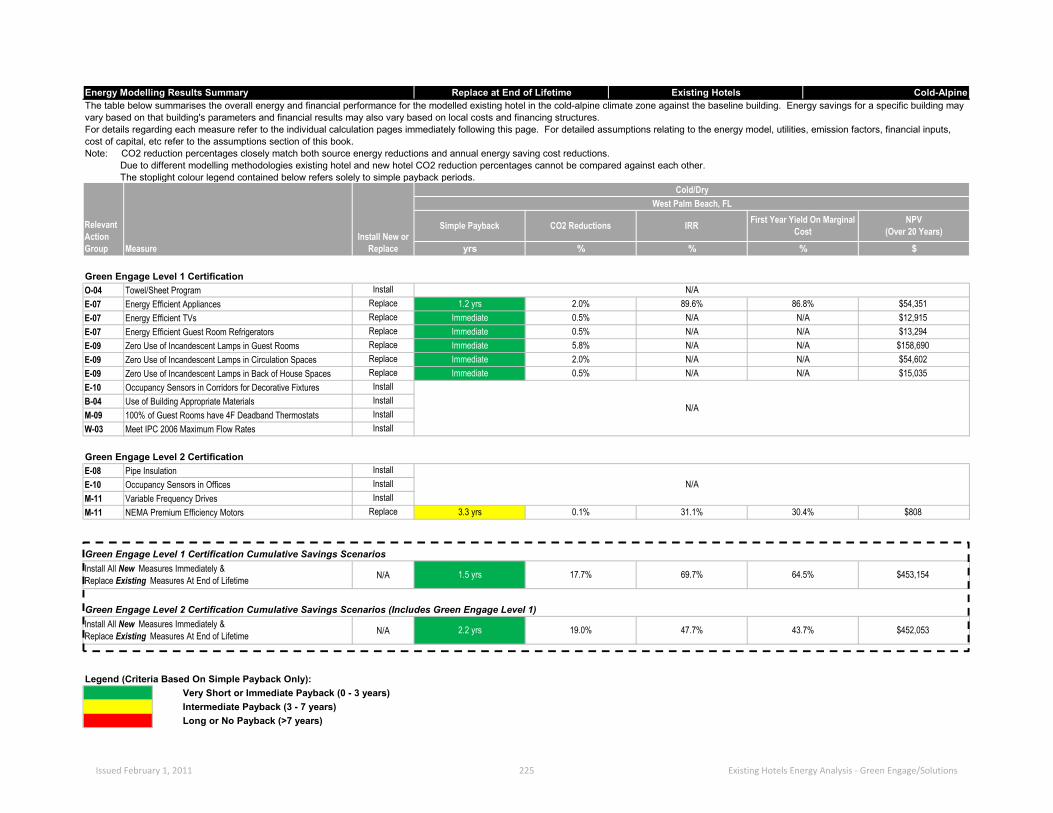
InstallReplaceReplaceReplaceReplaceReplaceReplaceInstallInstallInstallInstall
B-04M-09
0.5%Occupancy Sensors in Corridors for Decorative Fixtures
W-03
2.0%N/A N/A
E-09
N/A
$13,2940.5% N/A
Zero Use of Incandescent Lamps in Guest RoomsE-09E-09
Immediate 5.8% $158,690
E-10
Towel/Sheet Program1.2 yrs 2.0% $54,351
N/A N/A $15,035$54,602
N/AE-07
ImmediateZero Use of Incandescent Lamps in Back of House Spaces
N/A
N/A N/A
Use of Building Appropriate Materials100% of Guest Rooms have 4F Deadband ThermostatsMeet IPC 2006 Maximum Flow Rates
Immediate
Immediate 0.5%
NPV(Over 20 Years)
Energy Efficient Guest Room Refrigerators
Simple Payback IRR
Immediate
%
N/A86.8%89.6%
$
$12,915
Relevant Action Group yrs
O-04E-07 Energy Efficient Appliances
Zero Use of Incandescent Lamps in Circulation Spaces
E-07 Energy Efficient TVs
Energy Modelling Results Summary Replace at End of Lifetime Existing Hotels Cold-Alpine
Measure
Green Engage Level 1 Certification
The table below summarises the overall energy and financial performance for the modelled existing hotel in the cold-alpine climate zone against the baseline building. Energy savings for a specific building may vary based on that building's parameters and financial results may also vary based on local costs and financing structures. For details regarding each measure refer to the individual calculation pages immediately following this page. For detailed assumptions relating to the energy model, utilities, emission factors, financial inputs, cost of capital, etc refer to the assumptions section of this book.Note: CO2 reduction percentages closely match both source energy reductions and annual energy saving cost reductions. Due to different modelling methodologies existing hotel and new hotel CO2 reduction percentages cannot be compared against each other. The stoplight colour legend contained below refers solely to simple payback periods.
Cold/DryWest Palm Beach, FL
%%Install New or
Replace
CO2 Reductions First Year Yield On Marginal Cost
N/A
InstallInstallInstall
Replace
N/A
N/A
Legend (Criteria Based On Simple Payback Only):Very Short or Immediate Payback (0 - 3 years)Intermediate Payback (3 - 7 years)Long or No Payback (>7 years)
Green Engage Level 2 Certification
NEMA Premium Efficiency Motors
Occupancy Sensors in OfficesVariable Frequency Drives
Pipe InsulationE-08
Green Engage Level 2 Certification Cumulative Savings Scenarios (Includes Green Engage Level 1)Install All New Measures Immediately &Replace Existing Measures At End of Lifetime 2.2 yrs 19.0% 47.7% 43.7% $452,053
N/A
31.1%3.3 yrsM-11
$453,154Install All New Measures Immediately &Replace Existing Measures At End of Lifetime 1.5 yrs 17.7% 69.7% 64.5%
E-10
0.1% 30.4%M-11 $808
Green Engage Level 1 Certification Cumulative Savings Scenarios
Issued February 1, 2011 225 Existing Hotels Energy Analysis - Green Engage/Solutions

The following commercial, non-Energy Star appliances located in the food preparation and laundry areas: 3 washing machines, 2 dishwashers, 4 gas ovens, 2
fridges, 2 freezers, 2 icemakers and 5 vending machines
Emissions Base Case Proposed
Individual Resource Calculations Replace at End of Lifetime Existing Hotels
Energy E-07 Energy Efficient Appliances
Energy End-Use Benchmark Comparison Environmental Impact Analysis
Cold-Alpine
Base Case% Savings (+) /
Loss (-)Base Case Energy Use
Proposed Energy Use
Savings (+) / Loss (-)
Savings (+) / Loss (-)
MBtu/yr MBtu/yr MBtu/yr %CO2 (lb/yr) 2,787,041 2,730,876 2.0%
3,249 3,177 2.2%Space Heating - Elec 0.0 0.0 0.0 0.0%
SO2 (lb/yr) 6,472 6,308 2.5%Lighting 1,828.7 1,828.7 0.0 0.0% NOX (lb/yr)
Energy End-Use
Space Heating - Gas 7,112.3 7,132.4 -20.1 -0.3%Space Cooling 772.8 766.0 6.8 0.9%Proposed Modifications
-0.6%
HVAC Fans 419 0 419 0 0 1 0 0%
All appliances replaced with Energy Star rated equivalents. Overall saving of 30% on electricity and
34% on natural gas.
2.0%Heat Rejection 0.0 0.0 0.0 0.0%Pumps 28.8 29.0 -0.2
2,787,041 2,730,876
1,500,000
2,000,000
2,500,000
3,000,000
lb/y
r
Annual CO2 Emissions
HVAC Fans 419.0 419.0 0.1 0.0%Receptacles - Elec 1,149.8 1,050.1 99.7 8.7%
34% on natural gas.
Base Utilities - Gas 2,322.8 2,322.9 -0.1 0.0%
- Basket of commercial appliances that have an energy star rating- Total weighted basket cost of US$79,451 and a weighted cost premium of US$5,864- Average lifetime of 12 years- Appliances include 3 washing machines, 2 dishwashers, 4 gas ovens, 2 fridges, 2 freezers, 2 icemakers and 5 vending machines
1.7%
Receptacles - Gas 425.8 279.4 146.4 34.4%
Financial Assumptions Total 14,060.0 13,827.5 232.5 1.7%
2,787,041 2,730,876
0
500,000
1,000,000
1,500,000
2,000,000
2,500,000
3,000,000
Base Case Proposed
lb/y
r
Annual CO2 Emissions
6,472
3,249
6,308
3,177
0
2,000
4,000
6,000
8,000
SO2 (lb/yr) NOX (lb/yr)
g/yr
Annual SO2 and NOX EmissionsBase Case
Proposed
14,060 13,827
02,0004,0006,0008,000
10,00012,00014,00016,000
Base Case Proposed
MBt
u/yr
Annual Total Energy Use
Issued February 1, 2011 226 Existing Hotels Energy Analysis - Green Engage/Solutions

Additional Capital CostHVAC Plant First Cost Reductions
Cooling Plant SavingsHeating Plant Savings
Energy E-07 Energy Efficient Appliances
Individual Resource Calculations Replace at End of Lifetime Existing Hotels Cold-Alpine
Annual Resource Cost Summary Financial Table Financial Results Summary
ResourceAnnual Resource Savings
(+) / Loss (-) Unit CostAnnual Savings (+) /
Loss (-)Yr.
Costs (Marginal/Maint/
Replace)
Savings (+) / Loss (-) Cash Flow
Initial Marginal Cost $5,864
$5,088Natural gas 1,262 therms $0.9000 $1,136Electricity 31,168 kWh $0.1028 $3,204 Initial Annual Savings
Water & sewer 164,438 Gals $0.0037 $608 0 ($5,864) $0 ($5,864)1 $0 $5,088 $5,088
Simple Payback 1.2 yrs
($5,864) 3 $0 $5,381 $5,381Capital Costs Savings Summary 2 $0 $5,232 $5,232
4 $0 $5,536 $5,536 First Year Yield On Marginal Cost 86.8%
89.6%IRR
N/A MBh $0 6 $0 $5 899 $5 899N/A tons $0 5 $0 $5,714 $5,714
Heating Plant SavingsAirside Distribution Savings
Total Additional Capital Cost:
Estimated Useful Life (yrs)Percent replacedReplacement Cost Premium (In 2010 Dollars)
Base YearValuation TypeProject Analysis PeriodInflation RateDiscount Rate for Defined ValuationEnergy Escalation Rate (Nominal)
N/A cfm $0 7 $0 $6,089N/A MBh $0 6 $0 $5,899 $5,899 NPV
($5,864) 8 $0 $6,285 $6,285
$54,351
9 $0 $6,488 $6,488
$6,089
12 11 $0 $6,922 $6,922Replacement Life and Cost Summary 10 $0 $6,702 $6,702
14 $0 $7,628 $7,628($5,864) 13 $0 $7,385 $7,385
2010 16 $0 $8,218 $8,218Financial Analysis 15 $0 $7,917 $7,917
20 18 $0 $8,854 $8,854Defined 17 $0 $8,530 $8,530
7.19% 20 $0 $9,534 $9,5342.79% 19 $0 $9,190 $9,190
(See Table in Assumptions)
100% 12 ($8,154) $7,150 ($1,004)
($20,000)$0
$20,000 $40,000 $60,000 $80,000
$100,000 $120,000 $140,000
0 5 10 15 20Net
Cas
h Fl
ow (E
nd o
f Yea
r)
Years
Simple Payback Graph
Issued February 1, 2011 227 Existing Hotels Energy Analysis - Green Engage/Solutions

One 32 inch non-Energy Star television per guest room. Emissions Base Case Proposed
Individual Resource Calculations Replace at End of Lifetime Existing Hotels
Energy E-07 Energy Efficient Televisions
Energy End-Use Benchmark Comparison Environmental Impact Analysis
Cold-Alpine
Base Case% Savings (+) /
Loss (-)Base Case Energy Use
Proposed Energy Use
Savings (+) / Loss (-)
Savings (+) / Loss (-)
MBtu/yr MBtu/yr MBtu/yr %CO2 (lb/yr) 2,787,041 2,772,836 0.5%
3,249 3,225 0.7%Space Heating - Elec 0.0 0.0 0.0 0.0%
SO2 (lb/yr) 6,472 6,398 1.1%Lighting 1,828.7 1,828.7 0.0 0.0% NOX (lb/yr)
Energy End-Use
Space Heating - Gas 7,112.3 7,149.4 -37.1 -0.5%Space Cooling 772.8 767.3 5.5 0.7%Proposed Modifications
0.0%
HVAC Fans 419 0 418 6 0 4 0 1%
Television is replaced with Energy Star rated equivalent. Overall saving of 40% on electricity. 0.5%
Heat Rejection 0.0 0.0 0.0 0.0%Pumps 28.8 28.8 0.0
2,787,041 2,772,836
1,500,000
2,000,000
2,500,000
3,000,000
lb/y
r
Annual CO2 Emissions
HVAC Fans 419.0 418.6 0.4 0.1%Receptacles - Elec 1,149.8 1,108.1 41.7 3.6%
Base Utilities - Gas 2,322.8 2,322.8 0.0 0.0%
- 150, 32 inch energy star televisions- US$400 average outright cost per unit (including bulk discount)- US$0 cost premium over non-energy star TVs- Average lifetime - 10 years
0.1%
Receptacles - Gas 425.8 425.8 0.0 0.0%
Financial Assumptions Total 14,060.0 14,049.5 10.5 0.1%
2,787,041 2,772,836
0
500,000
1,000,000
1,500,000
2,000,000
2,500,000
3,000,000
Base Case Proposed
lb/y
r
Annual CO2 Emissions
6,472
3,249
6,398
3,225
0
2,000
4,000
6,000
8,000
SO2 (lb/yr) NOX (lb/yr)
g/yr
Annual SO2 and NOX EmissionsBase Case
Proposed
14,060 14,050
02,0004,0006,0008,000
10,00012,00014,00016,000
Base Case Proposed
MBt
u/yr
Annual Total Energy Use
Issued February 1, 2011 228 Existing Hotels Energy Analysis - Green Engage/Solutions

Additional Capital CostHVAC Plant First Cost Reductions
Cooling Plant SavingsHeating Plant Savings
Energy E-07 Energy Efficient Televisions
Individual Resource Calculations Replace at End of Lifetime Existing Hotels Cold-Alpine
Annual Resource Cost Summary Financial Table Financial Results Summary
ResourceAnnual Resource Savings
(+) / Loss (-) Unit CostAnnual Savings (+) /
Loss (-)Yr.
Costs (Marginal/Maint/
Replace)
Savings (+) / Loss (-) Cash Flow
Initial Marginal Cost $0
$1,109Natural gas -371 therms $0.9000 -$334Electricity 13,944 kWh $0.1028 $1,433 Initial Annual Savings
Water & sewer 0 Gals $0.0037 $0 0 $0 $0 $01 $0 $1,109 $1,109
Simple Payback Immediate
$0 3 $0 $1,126 $1,126Capital Costs Savings Summary 2 $0 $1,117 $1,117
4 $0 $1,133 $1,133 First Year Yield On Marginal Cost N/A
N/AIRR
N/A MBh $0 6 $0 $1 204 $1 204N/A tons $0 5 $0 $1,168 $1,168
Heating Plant SavingsAirside Distribution Savings
Total Additional Capital Cost:
Estimated Useful Life (yrs)Percent replacedReplacement Cost Premium (In 2010 Dollars)
Base YearValuation TypeProject Analysis PeriodInflation RateDiscount Rate for Defined ValuationEnergy Escalation Rate (Nominal)
N/A cfm $0 7 $0 $1,242N/A MBh $0 6 $0 $1,204 $1,204 NPV
$0 8 $0 $1,280 $1,280
$12,915
9 $0 $1,320 $1,320
$1,242
10 11 $0 $1,406 $1,406Replacement Life and Cost Summary 10 $0 $1,362 $1,362
14 $0 $1,547 $1,547$0 13 $0 $1,498 $1,498
2010 16 $0 $1,647 $1,647Financial Analysis 15 $0 $1,596 $1,596
20 18 $0 $1,753 $1,753Defined 17 $0 $1,699 $1,699
7.19% 20 $0 $1,875 $1,8752.79% 19 $0 $1,808 $1,808
(See Table in Assumptions)
100% 12 $0 $1,451 $1,451
$0
$5,000
$10,000
$15,000
$20,000
$25,000
$30,000
0 5 10 15 20
Net
Cas
h Fl
ow (E
nd o
f Yea
r)
Years
Simple Payback Graph
Issued February 1, 2011 229 Existing Hotels Energy Analysis - Green Engage/Solutions

One 3 cu. ft. non-Energy Star refrigerator per guest room. Emissions Base Case Proposed
Individual Resource Calculations Replace at End of Lifetime Existing Hotels
Energy E-07 Energy Efficient Guest Room Refrigerators
Energy End-Use Benchmark Comparison Environmental Impact Analysis
Cold-Alpine
Base Case% Savings (+) /
Loss (-)Base Case Energy Use
Proposed Energy Use
Savings (+) / Loss (-)
Savings (+) / Loss (-)
MBtu/yr MBtu/yr MBtu/yr %CO2 (lb/yr) 2,787,041 2,772,418 0.5%
3,249 3,224 0.8%Space Heating - Elec 0.0 0.0 0.0 0.0%
SO2 (lb/yr) 6,472 6,396 1.2%Lighting 1,828.7 1,828.7 0.0 0.0% NOX (lb/yr)
Energy End-Use
Space Heating - Gas 7,112.3 7,150.5 -38.2 -0.5%Space Cooling 772.8 767.1 5.7 0.7%Proposed Modifications
0.0%
HVAC Fans 419 0 418 6 0 4 0 1%
Refrigerator is replaced with Energy Star rated equivalent. Overall saving of 24% on electricity. 0.5%
Heat Rejection 0.0 0.0 0.0 0.0%Pumps 28.8 28.8 0.0
2,787,041 2,772,418
1,500,000
2,000,000
2,500,000
3,000,000
lb/y
r
Annual CO2 Emissions
HVAC Fans 419.0 418.6 0.4 0.1%Receptacles - Elec 1,149.8 1,106.9 42.9 3.7%
Base Utilities - Gas 2,322.8 2,322.8 0.0 0.0%
- Medium sized bar fridge at 3 cu. ft.- Average Energy Star cost per unit - US$120 (online average price minus 20% bulk discount)- Cost Premium - US$0- Average Lifetime – 12 years
0.1%
Receptacles - Gas 425.8 425.8 0.0 0.0%
Financial Assumptions Total 14,060.0 14,049.2 10.8 0.1%
2,787,041 2,772,418
0
500,000
1,000,000
1,500,000
2,000,000
2,500,000
3,000,000
Base Case Proposed
lb/y
r
Annual CO2 Emissions
6,472
3,249
6,396
3,224
0
2,000
4,000
6,000
8,000
SO2 (lb/yr) NOX (lb/yr)
g/yr
Annual SO2 and NOX EmissionsBase Case
Proposed
14,060 14,049
02,0004,0006,0008,000
10,00012,00014,00016,000
Base Case Proposed
MBt
u/yr
Annual Total Energy Use
Issued February 1, 2011 230 Existing Hotels Energy Analysis - Green Engage/Solutions

Additional Capital CostHVAC Plant First Cost Reductions
Cooling Plant SavingsHeating Plant Savings
Energy E-07 Energy Efficient Guest Room Refrigerators
Individual Resource Calculations Replace at End of Lifetime Existing Hotels Cold-Alpine
Annual Resource Cost Summary Financial Table Financial Results Summary
ResourceAnnual Resource Savings
(+) / Loss (-) Unit CostAnnual Savings (+) /
Loss (-)Yr.
Costs (Marginal/Maint/
Replace)
Savings (+) / Loss (-)
Natural gas -382 therms $0.9000 -$344Electricity 14,355 kWh $0.1028 $1,476
Cash FlowInitial Marginal Cost $0
$1,141Initial Annual Savings
Water & sewer 0 Gals $0.0037 $0 0 $0 $01 $0 $1,141 $1,141
$0 Simple Payback Immediate
$0 3 $0 $1,159 $1,159Capital Costs Savings Summary 2 $0 $1,150 $1,150
4 $0 $1,167 $1,167 First Year Yield On Marginal Cost N/A
N/AIRR
N/A tons $0 5 $0 $1,203 $1,203N/A MBh $0 6 $0 $1 240 $1 240Heating Plant Savings
Airside Distribution SavingsTotal Additional Capital Cost:
Estimated Useful Life (yrs)Percent replacedReplacement Cost Premium (In 2010 Dollars)
Base YearValuation TypeProject Analysis PeriodInflation RateDiscount Rate for Defined ValuationEnergy Escalation Rate (Nominal)
N/A cfm $0 7 $0 $1,278N/A MBh $0 6 $0 $1,240 $1,240 NPV
$1,278$0 8 $0 $1,318 $1,318
$13,294
9 $0 $1,358 $1,358
$1,49412 11 $0 $1,447 $1,447
Replacement Life and Cost Summary 10 $0 $1,402 $1,402
100% 12 $0 $1,494
14 $0 $1,592 $1,592$0 13 $0 $1,542 $1,542
2010 16 $0 $1,695 $1,695Financial Analysis 15 $0 $1,643 $1,643
20 18 $0 $1,804 $1,804Defined 17 $0 $1,749 $1,749
7.19% 20 $0 $1,931 $1,9312.79% 19 $0 $1,861 $1,861
(See Table in Assumptions)
$0
$5,000
$10,000
$15,000
$20,000
$25,000
$30,000
$35,000
0 5 10 15 20
Net
Cas
h Fl
ow (E
nd o
f Yea
r)
Years
Simple Payback Graph
Issued February 1, 2011 231 Existing Hotels Energy Analysis - Green Engage/Solutions

Each guest room contains a total of 12 light bulbs. There is a 50/50 split of 75W incandescent bulbs and
25W CFLs, giving a lighting density of 1.5 W/sf. Bulbs operate for 8 hours/day.
Emissions Base Case Proposed
Individual Resource Calculations Replace at End of Lifetime Existing Hotels
Energy E-09 Zero Use of Incandescent Lamps in Guest Rooms
Energy End-Use Benchmark Comparison Environmental Impact Analysis
Cold-Alpine
Base Case% Savings (+) /
Loss (-)Base Case Energy Use
Proposed Energy Use
Savings (+) / Loss (-)
Savings (+) / Loss (-)
MBtu/yr MBtu/yr MBtu/yr %CO2 (lb/yr) 2,787,041 2,624,952 5.8%
3,249 2,977 8.4%Space Heating - Elec 0.0 0.0 0.0 0.0%
SO2 (lb/yr) 6,472 5,630 13.0%Lighting 1,828.7 1,348.1 480.6 26.3% NOX (lb/yr)
Energy End-Use
Space Heating - Gas 7,112.3 7,547.0 -434.7 -6.1%Space Cooling 772.8 711.5 61.3 7.9%Proposed Modifications
-0.3%
HVAC Fans 419 0 414 5 4 5 1 1%
All 75W incandescent bulbs are replaced with 25W CFLs (6 per room or 900 in total). The guest room
lighting density is reduced to 0.75 W/sf.
5.8%Heat Rejection 0.0 0.0 0.0 0.0%Pumps 28.8 28.9 -0.1
2,787,041 2,624,952
1,500,000
2,000,000
2,500,000
3,000,000
lb/y
r
Annual CO2 Emissions
HVAC Fans 419.0 414.5 4.5 1.1%Receptacles - Elec 1,149.8 1,149.8 0.0 0.0%
lighting density is reduced to 0.75 W/sf.
Base Utilities - Gas 2,322.8 2,322.9 -0.1 0.0%
- Total of 12 bulbs per room with 50% designated for replacement- Average Energy Star cost per unit of US$3.40 with bulb life of 6,000 – 12,000 hours- Conventional cost per unit of US$0.60 with bulb life of 750 – 1,000 hours- Common building laborer staff rate- Replacement cost premium is a savings because light bulbs will last longer for the price paid
0.8%
Receptacles - Gas 425.8 425.8 0.0 0.0%
Financial Assumptions Total 14,060.0 13,948.5 111.5 0.8%
2,787,041 2,624,952
0
500,000
1,000,000
1,500,000
2,000,000
2,500,000
3,000,000
Base Case Proposed
lb/y
r
Annual CO2 Emissions
6,472
3,249
5,630
2,977
0
2,000
4,000
6,000
8,000
SO2 (lb/yr) NOX (lb/yr)
g/yr
Annual SO2 and NOX EmissionsBase Case
Proposed
14,060 13,948
02,0004,0006,0008,000
10,00012,00014,00016,000
Base Case Proposed
MBt
u/yr
Annual Total Energy Use
Issued February 1, 2011 232 Existing Hotels Energy Analysis - Green Engage/Solutions

Additional Capital CostHVAC Plant First Cost Reductions
Cooling Plant SavingsHeating Plant Savings
Energy E-09 Zero Use of Incandescent Lamps in Guest Rooms
Individual Resource Calculations Replace at End of Lifetime Existing Hotels Cold-Alpine
Annual Resource Cost Summary Financial Table Financial Results Summary
ResourceAnnual Resource Savings
(+) / Loss (-) Unit CostAnnual Savings (+) /
Loss (-)Yr.
Costs (Marginal/Maint/
Replace)
Savings (+) / Loss (-) Cash Flow
Initial Marginal Cost ($2,494)
$12,647Natural gas -4,349 therms $0.9000 -$3,914Electricity 160,112 kWh $0.1028 $16,460 Initial Annual Savings
Water & sewer 0 Gals $0.0037 $0 0 $2,494 $0 $2,4941 $0 $12,647 $12,647
Simple Payback Immediate
$2,494 3 $2,709 $12,832 $15,541Capital Costs Savings Summary 2 $0 $12,742 $12,742
4 $0 $12,916 $12,916 First Year Yield On Marginal Cost N/A
N/AIRR
N/A MBh $0 6 $2 941 $13 726 $16 667N/A tons $0 5 $0 $13,315 $13,315
Heating Plant SavingsAirside Distribution Savings
Total Additional Capital Cost:
Estimated Useful Life (yrs)Percent replacedReplacement Cost Premium (In 2010 Dollars)
Base YearValuation TypeProject Analysis PeriodInflation RateDiscount Rate for Defined ValuationEnergy Escalation Rate (Nominal)
N/A cfm $0 7 $0 $14,149N/A MBh $0 6 $2,941 $13,726 $16,667 NPV
$2,494 8 $0 $14,586 $14,586
$158,690
9 $3,194 $15,036 $18,230
$14,149
3 11 $0 $16,021 $16,021Replacement Life and Cost Summary 10 $0 $15,521 $15,521
14 $0 $17,621 $17,621$2,494 13 $0 $17,071 $17,071
2010 16 $0 $18,756 $18,756Financial Analysis 15 $3,766 $18,180 $21,946
20 18 $4,090 $19,960 $24,049Defined 17 $0 $19,349 $19,349
7.19% 20 $0 $21,353 $21,3532.79% 19 $0 $20,588 $20,588
(See Table in Assumptions)
100% 12 $3,468 $16,538 $20,006
$0 $50,000
$100,000 $150,000 $200,000 $250,000 $300,000 $350,000 $400,000
0 5 10 15 20
Net
Cas
h Fl
ow (E
nd o
f Yea
r)
Years
Simple Payback Graph
Issued February 1, 2011 233 Existing Hotels Energy Analysis - Green Engage/Solutions

Corridors contain 40 light bulbs per floor. There is a 50/50 split of 75W incandescent bulbs and 25W CFLs, giving a lighting density of 0.7 W/sf. Bulbs operate for
24 hours/day.
Emissions Base Case Proposed
Individual Resource Calculations Replace at End of Lifetime Existing Hotels
Energy E-09 Zero Use of Incandescent Lamps in Circulation Spaces
Energy End-Use Benchmark Comparison Environmental Impact Analysis
Cold-Alpine
Base Case% Savings (+) /
Loss (-)Base Case Energy Use
Proposed Energy Use
Savings (+) / Loss (-)
Savings (+) / Loss (-)
MBtu/yr MBtu/yr MBtu/yr %CO2 (lb/yr) 2,787,041 2,731,479 2.0%
3,249 3,158 2.8%Space Heating - Elec 0.0 0.0 0.0 0.0%
SO2 (lb/yr) 6,472 6,196 4.3%Lighting 1,828.7 1,671.7 157.0 8.6% NOX (lb/yr)
Energy End-Use
Space Heating - Gas 7,112.3 7,233.0 -120.7 -1.7%Space Cooling 772.8 753.6 19.2 2.5%Proposed Modifications
0.0%
HVAC Fans 419 0 416 4 2 6 0 6%
All 75W incandescent bulbs are replaced with 25W CFLs (20 per floor or 100 in total). The guest room
lighting density is reduced to 0.35 W/sf.
2.0%Heat Rejection 0.0 0.0 0.0 0.0%Pumps 28.8 28.8 0.0
2,787,041 2,731,479
1,500,000
2,000,000
2,500,000
3,000,000
lb/y
r
Annual CO2 Emissions
HVAC Fans 419.0 416.4 2.6 0.6%Receptacles - Elec 1,149.8 1,149.8 0.0 0.0%
lighting density is reduced to 0.35 W/sf.
Base Utilities - Gas 2,322.8 2,322.9 -0.1 0.0%
- Total of 40 bulbs per corridor with 50% designated for replacement- This amounts to 100 bulbs to be replaced across the entire building- Average Energy Star cost per unit of US$3.40 with bulb life of 6,000 – 12,000 hours- Conventional cost per unit of US$0.60 with bulb life of 750 – 1,000 hours- Common building laborer staff rate- Replacement cost premium is a savings because light bulbs will last longer for the price paid
0.4%
Receptacles - Gas 425.8 425.8 0.0 0.0%
Financial Assumptions Total 14,060.0 14,002.0 58.0 0.4%
2,787,041 2,731,479
0
500,000
1,000,000
1,500,000
2,000,000
2,500,000
3,000,000
Base Case Proposed
lb/y
r
Annual CO2 Emissions
6,472
3,249
6,196
3,158
0
2,000
4,000
6,000
8,000
SO2 (lb/yr) NOX (lb/yr)
g/yr
Annual SO2 and NOX EmissionsBase Case
Proposed
14,060 14,002
02,0004,0006,0008,000
10,00012,00014,00016,000
Base Case Proposed
MBt
u/yr
Annual Total Energy Use
Issued February 1, 2011 234 Existing Hotels Energy Analysis - Green Engage/Solutions
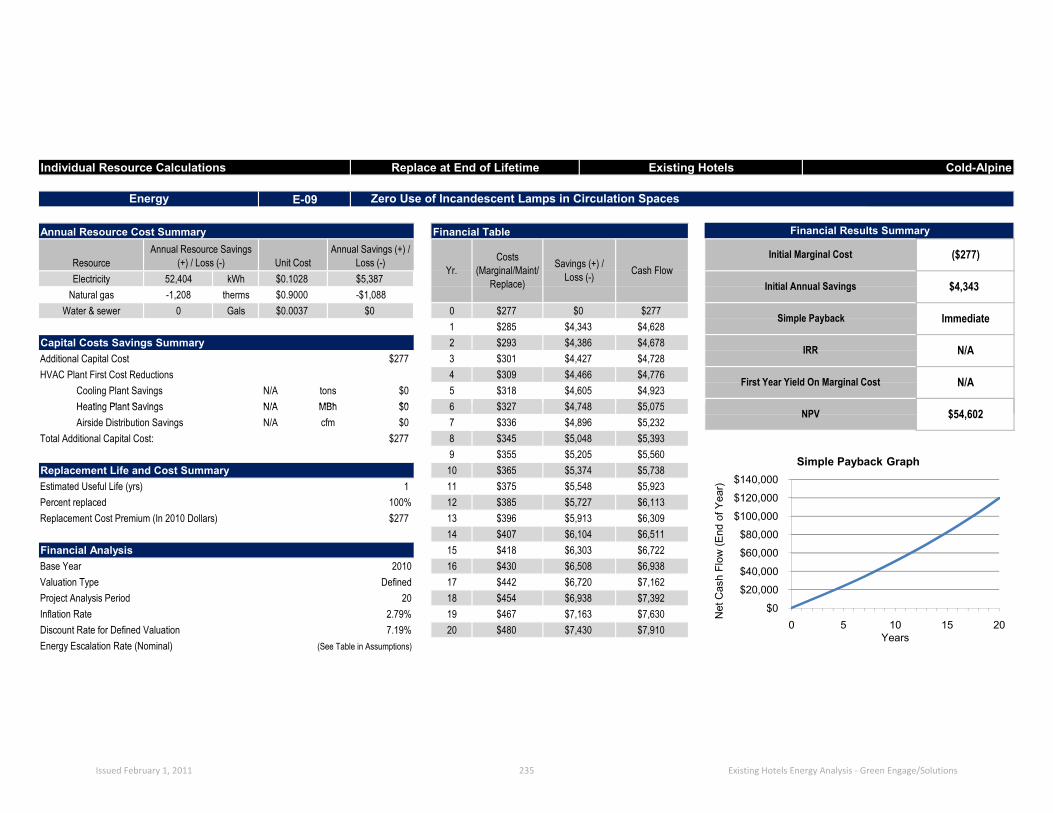
Additional Capital CostHVAC Plant First Cost Reductions
Cooling Plant SavingsHeating Plant Savings
Energy E-09 Zero Use of Incandescent Lamps in Circulation Spaces
Individual Resource Calculations Replace at End of Lifetime Existing Hotels Cold-Alpine
Annual Resource Cost Summary Financial Table Financial Results Summary
ResourceAnnual Resource Savings
(+) / Loss (-) Unit CostAnnual Savings (+) /
Loss (-)Yr.
Costs (Marginal/Maint/
Replace)
Savings (+) / Loss (-) Cash Flow
Initial Marginal Cost ($277)
$4,343Natural gas -1,208 therms $0.9000 -$1,088Electricity 52,404 kWh $0.1028 $5,387 Initial Annual Savings
Water & sewer 0 Gals $0.0037 $0 0 $277 $0 $2771 $285 $4,343 $4,628
Simple Payback Immediate
$277 3 $301 $4,427 $4,728Capital Costs Savings Summary 2 $293 $4,386 $4,678
4 $309 $4,466 $4,776 First Year Yield On Marginal Cost N/A
N/AIRR
N/A MBh $0 6 $327 $4 748 $5 075N/A tons $0 5 $318 $4,605 $4,923
Heating Plant SavingsAirside Distribution Savings
Total Additional Capital Cost:
Estimated Useful Life (yrs)Percent replacedReplacement Cost Premium (In 2010 Dollars)
Base YearValuation TypeProject Analysis PeriodInflation RateDiscount Rate for Defined ValuationEnergy Escalation Rate (Nominal)
N/A cfm $0 7 $336 $4,896N/A MBh $0 6 $327 $4,748 $5,075 NPV
$277 8 $345 $5,048 $5,393
$54,602
9 $355 $5,205 $5,560
$5,232
1 11 $375 $5,548 $5,923Replacement Life and Cost Summary 10 $365 $5,374 $5,738
14 $407 $6,104 $6,511$277 13 $396 $5,913 $6,309
2010 16 $430 $6,508 $6,938Financial Analysis 15 $418 $6,303 $6,722
20 18 $454 $6,938 $7,392Defined 17 $442 $6,720 $7,162
7.19% 20 $480 $7,430 $7,9102.79% 19 $467 $7,163 $7,630
(See Table in Assumptions)
100% 12 $385 $5,727 $6,113
$0
$20,000
$40,000
$60,000
$80,000
$100,000
$120,000
$140,000
0 5 10 15 20
Net
Cas
h Fl
ow (E
nd o
f Yea
r)
Years
Simple Payback Graph
Issued February 1, 2011 235 Existing Hotels Energy Analysis - Green Engage/Solutions

Offices, food preparation, lockers, laundry, mechanical and electrical spaces contain a total of 200 light bulbs. There is a 50/50 split of 75W incandescent bulbs and 25W CFLs, giving an average lighting density of 1.4 W/sf. Bulbs operate for 8
hours/day.
Emissions Base Case Proposed
Individual Resource Calculations Replace at End of Lifetime Existing Hotels
Energy E-09 Zero Use of Incandescent Lamps in Back of House
Energy End-Use Benchmark Comparison Environmental Impact Analysis
Cold-Alpine
Base Case% Savings (+) /
Loss (-)Base Case Energy Use
Proposed Energy Use
Savings (+) / Loss (-)
Savings (+) / Loss (-)
MBtu/yr MBtu/yr MBtu/yr %CO2 (lb/yr) 2,787,041 2,772,012 0.5%
3,249 3,224 0.8%Space Heating - Elec 0.0 0.0 0.0 0.0%
SO2 (lb/yr) 6,472 6,397 1.2%Lighting 1,828.7 1,791.8 36.9 2.0% NOX (lb/yr)
Energy End-Use
Space Heating - Gas 7,112.3 7,146.0 -33.7 -0.5%Space Cooling 772.8 760.9 11.9 1.5%Proposed Modifications
-1.1%
HVAC Fans 419 0 418 9 0 2 0 0%
All 75W incandescent bulbs are replaced with 25W CFLs (100 in total). The average lighting density is reduced to
0.7 W/sf.
0.5%Heat Rejection 0.0 0.0 0.0 0.0%Pumps 28.8 29.1 -0.3
2,787,041 2,772,012
1,500,000
2,000,000
2,500,000
3,000,000
lb/y
r
Annual CO2 Emissions
HVAC Fans 419.0 418.9 0.2 0.0%Receptacles - Elec 1,149.8 1,149.8 0.0 0.0%
Base Utilities - Gas 2,322.8 2,322.9 -0.1 0.0%
- Total of 200 bulbs in back of house with 50% designated for replacement- Average Energy Star cost per unit of US$3.40 with bulb life of 6,000 – 12,000 hours- Conventional cost per unit of US$0.60 with bulb life of 750 – 1,000 hours- Common building laborer staff rate- Replacement cost premium is a savings because light bulbs will last longer for the price paid
0.1%
Receptacles - Gas 425.8 425.8 0.0 0.0%
Financial Assumptions Total 14,060.0 14,045.1 14.9 0.1%
2,787,041 2,772,012
0
500,000
1,000,000
1,500,000
2,000,000
2,500,000
3,000,000
Base Case Proposed
lb/y
r
Annual CO2 Emissions
6,472
3,249
6,397
3,224
0
2,000
4,000
6,000
8,000
SO2 (lb/yr) NOX (lb/yr)
g/yr
Annual SO2 and NOX EmissionsBase Case
Proposed
14,060 14,045
02,0004,0006,0008,000
10,00012,00014,00016,000
Base Case Proposed
MBt
u/yr
Annual Total Energy Use
Issued February 1, 2011 236 Existing Hotels Energy Analysis - Green Engage/Solutions

Additional Capital CostHVAC Plant First Cost Reductions
Cooling Plant SavingsHeating Plant Savings
Energy E-09 Zero Use of Incandescent Lamps in Back of House
Individual Resource Calculations Replace at End of Lifetime Existing Hotels Cold-Alpine
Annual Resource Cost Summary Financial Table Financial Results Summary
ResourceAnnual Resource Savings
(+) / Loss (-) Unit CostAnnual Savings (+) /
Loss (-)Yr.
Costs (Marginal/Maint/
Replace)
Savings (+) / Loss (-) Cash Flow
Initial Marginal Cost ($277)
$1,175Natural gas -338 therms $0.9000 -$304Electricity 14,274 kWh $0.1028 $1,467 Initial Annual Savings
Water & sewer 0 Gals $0.0037 $0 0 $277 $0 $2771 $0 $1,175 $1,175
Simple Payback Immediate
$277 3 $301 $1,196 $1,497Capital Costs Savings Summary 2 $0 $1,186 $1,186
4 $0 $1,207 $1,207 First Year Yield On Marginal Cost N/A
N/AIRR
N/A MBh $0 6 $327 $1 283 $1 610N/A tons $0 5 $0 $1,244 $1,244
Heating Plant SavingsAirside Distribution Savings
Total Additional Capital Cost:
Estimated Useful Life (yrs)Percent replacedReplacement Cost Premium (In 2010 Dollars)
Base YearValuation TypeProject Analysis PeriodInflation RateDiscount Rate for Defined ValuationEnergy Escalation Rate (Nominal)
N/A cfm $0 7 $0 $1,323N/A MBh $0 6 $327 $1,283 $1,610 NPV
$277 8 $0 $1,364 $1,364
$15,035
9 $355 $1,406 $1,761
$1,323
3 11 $0 $1,498 $1,498Replacement Life and Cost Summary 10 $0 $1,451 $1,451
14 $0 $1,649 $1,649$277 13 $0 $1,597 $1,597
2010 16 $0 $1,757 $1,757Financial Analysis 15 $418 $1,702 $2,121
20 18 $454 $1,873 $2,327Defined 17 $0 $1,814 $1,814
7.19% 20 $0 $2,005 $2,0052.79% 19 $0 $1,933 $1,933
(See Table in Assumptions)
100% 12 $385 $1,547 $1,932
$0
$5,000
$10,000
$15,000
$20,000
$25,000
$30,000
$35,000
0 5 10 15 20
Net
Cas
h Fl
ow (E
nd o
f Yea
r)
Years
Simple Payback Graph
Issued February 1, 2011 237 Existing Hotels Energy Analysis - Green Engage/Solutions

Constant speed, standard efficiency motor on supply fan for VAV system serving the first floor and corridor spaces (15 HP capacity). Constant speed, standard
efficiency motor for heating hot water circulator pump (1 HP capacity).
Emissions Base Case Proposed
Individual Resource Calculations Replace at End of Lifetime Existing Hotels
Mechanical M-11 NEMA Premium Efficiency Motors
Energy End-Use Benchmark Comparison Environmental Impact Analysis
Cold-Alpine
Base Case% Savings (+) /
Loss (-)Base Case Energy Use
Proposed Energy Use
Savings (+) / Loss (-)
Savings (+) / Loss (-)
MBtu/yr MBtu/yr MBtu/yr %CO2 (lb/yr) 2,787,041 2,785,525 0.1%
3,249 3,246 0.1%Space Heating - Elec 0.0 0.0 0.0 0.0%
SO2 (lb/yr) 6,472 6,464 0.1%Lighting 1,828.7 1,828.7 0.0 0.0% NOX (lb/yr)
Energy End-Use
Space Heating - Gas 7,112.3 7,117.2 -4.9 -0.1%Space Cooling 772.8 772.2 0.6 0.1%Proposed Modifications
4.7%
HVAC Fans 419 0 415 7 3 4 0 8%
VAV supply fan motor replaced with NEMA premium efficiency motor (15 HP capacity). Heating hot water
circulator pump replaced with NEMA premium
0.1%Heat Rejection 0.0 0.0 0.0 0.0%Pumps 28.8 27.4 1.4
2,787,041 2,785,525
1,500,000
2,000,000
2,500,000
3,000,000
lb/y
r
Annual CO2 Emissions
HVAC Fans 419.0 415.7 3.4 0.8%Receptacles - Elec 1,149.8 1,149.8 0.0 0.0%
circulator pump replaced with NEMA premium efficiency motor (1 HP capacity).
Base Utilities - Gas 2,322.8 2,322.8 0.0 0.0%
NB: demolition costs are not includedAll four climates can install a 15 HP NEMA efficiency motor on the supply fan. - 15 HP NEMA efficiency motor is $1,482- 15 HP normal motor is $1,195- Cost Premium of $287
Two colder climates can also install a 1HP NEMA efficiency motor on the hot water heating loop.- 1 HP NEMA efficiency motor is $531- 1 HP normal motor is $430- Cost Premium of $101
0.0%
Receptacles - Gas 425.8 425.8 0.0 0.0%
Financial Assumptions Total 14,060.0 14,059.5 0.5 0.0%
2,787,041 2,785,525
0
500,000
1,000,000
1,500,000
2,000,000
2,500,000
3,000,000
Base Case Proposed
lb/y
r
Annual CO2 Emissions
6,472
3,249
6,464
3,246
0
2,000
4,000
6,000
8,000
SO2 (lb/yr) NOX (lb/yr)
g/yr
Annual SO2 and NOX EmissionsBase Case
Proposed
14,060 14,060
02,0004,0006,0008,000
10,00012,00014,00016,000
Base Case Proposed
MBt
u/yr
Annual Total Energy Use
Issued February 1, 2011 238 Existing Hotels Energy Analysis - Green Engage/Solutions

Additional Capital CostHVAC Plant First Cost Reductions
Cooling Plant SavingsHeating Plant Savings
Mechanical M-11 NEMA Premium Efficiency Motors
Individual Resource Calculations Replace at End of Lifetime Existing Hotels Cold-Alpine
Annual Resource Cost Summary Financial Table Financial Results Summary
ResourceAnnual Resource Savings
(+) / Loss (-) Unit CostAnnual Savings (+) /
Loss (-)Yr.
Costs (Marginal/Maint/
Replace)
Savings (+) / Loss (-)
Natural gas -49 therms $0.9000 -$44Electricity 1,571 kWh $0.1028 $161
Cash FlowInitial Marginal Cost $388
$118Initial Annual Savings
Water & sewer 0 Gals $0.0037 $0 0 ($388) $01 $0 $118 $118
($388) Simple Payback 3.3 yrs
($388) 3 $0 $119 $119Capital Costs Savings Summary 2 $0 $119 $119
4 $0 $120 $120 First Year Yield On Marginal Cost 30.4%
31.1%IRR
N/A tons $0 5 $0 $123 $123N/A MBh $0 6 $0 $127 $127Heating Plant Savings
Airside Distribution SavingsTotal Additional Capital Cost:
Estimated Useful Life (yrs)Percent replacedReplacement Cost Premium (In 2010 Dollars)
Base YearValuation TypeProject Analysis PeriodInflation RateDiscount Rate for Defined ValuationEnergy Escalation Rate (Nominal)
N/A cfm $0 7 $0 $131N/A MBh $0 6 $0 $127 $127 NPV
$131($388) 8 $0 $135 $135
$808
9 $0 $139 $139
$15315 11 $0 $148 $148
Replacement Life and Cost Summary 10 $0 $144 $144
100% 12 $0 $153
14 $0 $163 $163($388) 13 $0 $158 $158
2010 16 $0 $173 $173Financial Analysis 15 ($586) $168 ($418)
20 18 $0 $184 $184Defined 17 $0 $178 $178
7.19% 20 $0 $197 $1972.79% 19 $0 $190 $190
(See Table in Assumptions)
($1,000)
($500)
$0
$500
$1,000
$1,500
$2,000
$2,500
0 5 10 15 20
Net
Cas
h Fl
ow (E
nd o
f Yea
r)
Years
Simple Payback Graph
Issued February 1, 2011 239 Existing Hotels Energy Analysis - Green Engage/Solutions
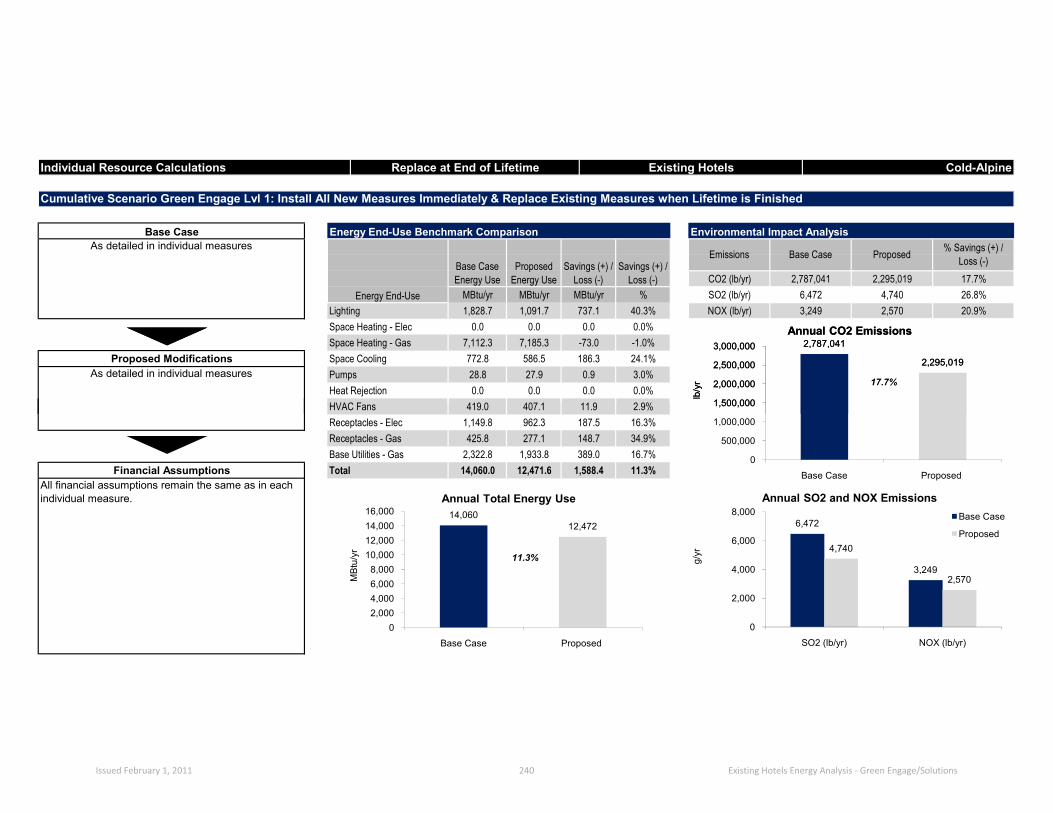
Individual Resource Calculations Replace at End of Lifetime Existing Hotels Cold-Alpine
Cumulative Scenario Green Engage Lvl 1: Install All New Measures Immediately & Replace Existing Measures when Lifetime is Finished
Base Case Energy End-Use Benchmark Comparison Environmental Impact AnalysisAs detailed in individual measures
Energy End-Use
Base Case Energy Use
Proposed Energy Use
Savings (+) / Loss (-)
Savings (+) / Loss (-)
MBtu/yr MBtu/yr MBtu/yr %
Emissions Base Case Proposed % Savings (+) / Loss (-)
CO2 (lb/yr) 2,787,041 2,295,019 17.7%
3,249 2,570 20.9%Space Heating - Elec 0.0 0.0 0.0 0.0%
SO2 (lb/yr) 6,472 4,740 26.8%Lighting 1,828.7 1,091.7 737.1 40.3% NOX (lb/yr)
Space Heating - Gas 7,112.3 7,185.3 -73.0 -1.0%Proposed Modifications Space Cooling 772.8 586.5 186.3 24.1%
As detailed in individual measures Pumps 28.8 27.9 0.9 3.0%
HVAC Fans 419 0 407 1 11 9 2 9%
17.7%Heat Rejection 0.0 0.0 0.0 0.0%
2,787,041
2,295,019
1,500,000
2,000,000
2,500,000
3,000,000
lb/y
r
Annual CO2 Emissions
HVAC Fans 419.0 407.1 11.9 2.9%Receptacles - Elec 1,149.8 962.3 187.5 16.3%Receptacles - Gas 425.8 277.1 148.7 34.9%Base Utilities - Gas 2,322.8 1,933.8 389.0 16.7%
All financial assumptions remain the same as in each individual measure.
11.3%
Financial Assumptions Total 14,060.0 12,471.6 1,588.4 11.3%
2,787,041
2,295,019
0
500,000
1,000,000
1,500,000
2,000,000
2,500,000
3,000,000
Base Case Proposed
lb/y
r
Annual CO2 Emissions
6,472
3,249
4,740
2,570
0
2,000
4,000
6,000
8,000
SO2 (lb/yr) NOX (lb/yr)
g/yr
Annual SO2 and NOX EmissionsBase Case
Proposed
14,06012,472
02,0004,0006,0008,000
10,00012,00014,00016,000
Base Case Proposed
MBt
u/yr
Annual Total Energy Use
Issued February 1, 2011 240 Existing Hotels Energy Analysis - Green Engage/Solutions

Additional Capital CostHVAC Plant First Cost Reductions
Cooling Plant SavingsHeating Plant Savings
Individual Resource Calculations Replace at End of Lifetime Existing Hotels Cold-Alpine
Cumulative Scenario Green Engage Lvl 1: Install All New Measures Immediately & Replace Existing Measures when Lifetime is Finished
Annual Resource Cost Summary Financial Table Financial Results Summary
ResourceAnnual Resource Savings
(+) / Loss (-) Unit CostAnnual Savings (+) /
Loss (-)Yr.
Costs (Marginal/Maint/
Replace)Electricity 329,316 kWh $0.1028 $33,854Savings (+) /
Loss (-) Cash FlowInitial Marginal Cost $66,784
Water & sewer 1,029,194 Gals $0.0037 $3,808 0Natural gas 4,648 therms $0.9000 $4,183
Initial Annual Savings $43,100
($66,784) $0 ($66,784) Simple Payback 1.5 yrs
Capital Costs Savings Summary 2 $1,572 $44,110 $45,682 IRR 69.7%($66,784) 3 $4,325 $45,164 $49,488
1 $1,245 $43,100 $44,345
N/A tons $0 5 $1,389 $47,693 $49,0834 $1,661 $46,218 $47,879 First Year Yield On Marginal Cost 64.5%
N/A MBh $0 6 $5 023 $49 232 $54 255Heating Plant SavingsAirside Distribution Savings
Total Additional Capital Cost:
Estimated Useful Life (yrs)Percent replacedReplacement Cost (In 2010 Dollars)
Base YearValuation TypeProject Analysis PeriodInflation RateDiscount Rate for Defined ValuationEnergy Escalation Rate (Nominal)
N/A cfm $0 7 $1,468N/A MBh $0 6 $5,023 $49,232 $54,255
$50,788 $52,255($66,784) 8 $1,854 $52,409 $54,263
NPV $453,154
9 $5,099 $54,101 $59,200
N/A 11 $1,638 $57,682 $59,320Replacement Life and Cost Summary 10 ($34,880) $55,853 $20,974
N/A 13 $1,731 $61,520 $63,251N/A 12 ($2,231) $59,589 $57,358
14 $2,186 $63,534 $65,720
2010 16 $2,310 $68,257 $70,566Financial Analysis 15 ($48,309) $65,873 $17,564
20 18 $6,984 $73,359 $80,343Defined 17 $1,932 $70,750 $72,682
7.19% 20 $2,578 $78,855 $81,4332.79% 19 $2,041 $76,018 $78,059
(See Table in Assumptions)
($200,000)
$0
$200,000
$400,000
$600,000
$800,000
$1,000,000
$1,200,000
0 5 10 15 20Net
Cas
h Fl
ow (E
nd o
f Yea
r)
Years
Simple Payback Graph
Issued February 1, 2011 241 Existing Hotels Energy Analysis - Green Engage/Solutions

19.0%Heat Rejection 0.0 0.0 0.0 0.0%
As detailed in individual measures Pumps
Space Heating - Gas 7,112.3 7,136.7 -24.4 -0.3%
28.8 26.6 2.2 7.5%
HVAC Fans 419 0 378 0 41 0 9 8%
CO2 (lb/yr) 2,787,041 2,257,657 19.0%
22.3%Space Heating - Elec 0.0 0.0 0.0 0.0%
4,645 28.2%Lighting 1,828.7 1,090.1 738.7 40.4%
Emissions Base Case Proposed % Savings (+) / Loss (-)
% SO2 (lb/yr)
Cold-Alpine
NOX (lb/yr) 3,249 2,525MBtu/yr MBtu/yr MBtu/yr
Cumulative Scenario Green Engage Lvl 2: Install All New Measures Immediately & Replace Existing Measures when Lifetime is Finished
Base Case Energy End-Use Benchmark Comparison Environmental Impact AnalysisAs detailed in individual measures
Energy End-Use
Base Case Energy Use
Proposed Energy Use
Savings (+) / Loss (-)
Savings (+) / Loss (-)
6,472
Proposed Modifications Space Cooling 772.8 556.8 216.0 27.9%
Individual Resource Calculations Replace at End of Lifetime Existing Hotels
2,787,041
2,257,657
1,500,000
2,000,000
2,500,000
3,000,000
lb/y
r
Annual CO2 Emissions
All financial assumptions remain the same as in each individual measure.
12.5%
Financial Assumptions Total 14,060.0 12,295.5 1,764.5 12.5%
Receptacles - Gas 425.8 277.1 148.7 34.9%Base Utilities - Gas 2,322.8 1,867.9 454.9 19.6%
Receptacles - Elec 1,149.8 962.3 187.5 16.3%HVAC Fans 419.0 378.0 41.0 9.8%
2,787,041
2,257,657
0
500,000
1,000,000
1,500,000
2,000,000
2,500,000
3,000,000
Base Case Proposed
lb/y
r
Annual CO2 Emissions
6,472
3,249
4,645
2,525
0
2,000
4,000
6,000
8,000
SO2 (lb/yr) NOX (lb/yr)
g/yr
Annual SO2 and NOX EmissionsBase Case
Proposed
14,06012,296
02,0004,0006,0008,000
10,00012,00014,00016,000
Base Case Proposed
MBt
u/yr
Annual Total Energy Use
Issued February 1, 2011 242 Existing Hotels Energy Analysis - Green Engage/Solutions

Additional Capital CostHVAC Plant First Cost Reductions
Cooling Plant SavingsHeating Plant Savings N/A MBh $0 6 $5 023 $52 726 $57 748
N/A tons $0 5 $1,389 $51,075 $52,4644 $1,661 $49,491 $51,152 First Year Yield On Marginal Cost 43.7%
($105,560) 3 $4,325 $48,334 $52,659Capital Costs Savings Summary 2 $1,572 $47,182 $48,754 IRR 47.7%
1 $1,245 $46,077 $47,322($105,560) $0 ($105,560) Simple Payback 2.2 yrs
Natural gas 5,794 therms $0.9000 $5,214Initial Annual Savings $46,077
ResourceAnnual Resource Savings
(+) / Loss (-) Unit CostAnnual Savings (+) /
Loss (-)Yr. Savings (+) /
Loss (-) Cash FlowInitial Marginal Cost
Water & sewer 1,029,194 Gals $0.0037 $3,808 0
Costs (Marginal/Maint/
Replace)Electricity 347,367 kWh $0.1028 $35,709
Cumulative Scenario Green Engage Lvl 2: Install All New Measures Immediately & Replace Existing Measures when Lifetime is Finished
Annual Resource Cost Summary Financial Table Financial Results Summary
Individual Resource Calculations Replace at End of Lifetime Existing Hotels Cold-Alpine
$105,560
Heating Plant SavingsAirside Distribution Savings
Total Additional Capital Cost:
Estimated Useful Life (yrs)Percent replacedReplacement Cost (In 2010 Dollars)
Base YearValuation TypeProject Analysis PeriodInflation RateDiscount Rate for Defined ValuationEnergy Escalation Rate (Nominal) (See Table in Assumptions)
7.19% 20 $2,578 $84,616 $87,1942.79% 19 $2,041 $81,564 $83,604
20 18 $6,984 $78,688 $85,672Defined 17 $1,932 $75,873 $77,805
2010 16 $2,310 $73,181 $75,490Financial Analysis 15 ($48,895) $70,606 $21,711
14 $2,186 $68,083 $70,269N/A 13 $1,731 $65,920 $67,651N/A 12 ($2,231) $63,845 $61,615N/A 11 $1,638 $61,799 $63,437
Replacement Life and Cost Summary 10 ($39,670) $59,836 $20,1669 $5,099 $57,954 $63,053
($105,560) 8 $1,854 $56,139 $57,993
NPV $452,053N/A cfm $0 7 $1,468N/A MBh $0 6 $5,023 $52,726 $57,748
$54,397 $55,865
($200,000)
$0
$200,000
$400,000
$600,000
$800,000
$1,000,000
$1,200,000
0 5 10 15 20Net
Cas
h Fl
ow (E
nd o
f Yea
r)
Years
Simple Payback Graph
Issued February 1, 2011 243 Existing Hotels Energy Analysis - Green Engage/Solutions
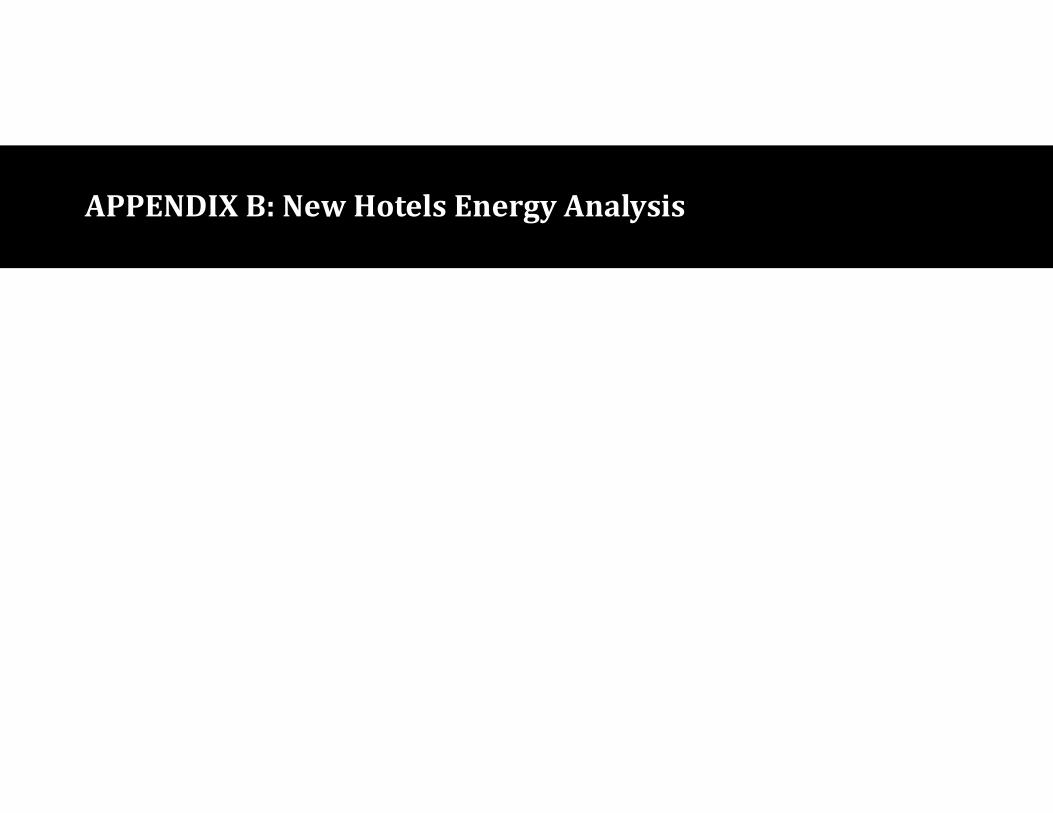
APPENDIX B: New Hotels Energy Analysis

Introduction 1How to Use this Appendix 2How to Read the Overall Summary Page 3How to Read the Climate Summary Pages 4How to Read the Individual ECM CalculationSheets
5
Energy Model Assumptions: General 7Energy Model Assumptions: Financial 9Global Climate Map 10Climate Data 11
Energy Charts 13
Calculation Sheets 22Overall Summary 23Hot-Humid 24Arid 54Temperate 84Cold-Alpine 118
APPENDIX B: New Hotels Energy Analysis

Introduction
Issued February 1, 2011 1 New Hotels Energy Analysis - Green Engage/Solutions

Green Engage/Solu ons for New Hotels contains 55 Level 1Prerequisite Ac ons and 15 Level 2 Prerequisite Ac ons (70Prerequisites in total). These ac ons are designed to improvethe sustainable opera ons of a hotel across a wide range ofareas including water use, waste management, products andmaterials, guest comfort, and par cularly energy use.
In designing a new hotel, there are a number of decisions tobe made about the building and the systems to be put insideit - decisions that can signi cantly impact the energy e ciencyof the hotel. This appendix has been developed to help hotelsmake the right design choices for their building type andclimate.
The Energy Charts are a set guidelines covering all aspects ofhotel design, which provide a prescrip ve path for achievingenergy savings of up to 25% over a typical new hotel.
The Calcula on Sheets contain detailed analysis of the cost andsavings of speci c design op ons, such as one type of HVACsystem over another, in four di erent climate zones. Thesesheets are designed to allow those looking for even greatersavings to quickly and easily weigh up which op on makes themost sense.
The diagram to the right shows how these sheets t together.Detailed instruc ons on how to read and interpret these sheetsare provided on the following four pages
For informa on on the climate zones, and help determiningwhich climate zone your hotel is located in, refer to the GlobalClimate Map and Climate Data sec ons.
While the results of this energy analysis are applicable to hotelsin a wide variety of loca ons and brands, obviously in the realworld actual results may vary. If you'd like to look in moredetail at how the energy model was created, and determinewhether these assump ons apply to your par cular property,refer to the Energy Modelling Assump ons sec on.
How to Use this Appendix
Issued February 1, 2011 2 New Hotels Energy Analysis - Green Engage/Solutions

How to Read the Overall Summary Page
Issued February 1, 2011 3 New Hotels Energy Analysis - Green Engage/Solutions

How to Read the Climate Summary Pages
Issued February 1, 2011 4 New Hotels Energy Analysis - Green Engage/Solutions

How to Read the Individual ECM Calculation Sheets (1/2)
Issued February 1, 2011 5 New Hotels Energy Analysis - Green Engage/Solutions

How to Read the Individual ECM Calculation Sheets (2/2)
Issued February 1, 2011 6 New Hotels Energy Analysis - Green Engage/Solutions

Introduction:
The energy cost associated with opera ng a hotelis dependent upon the building’s layout, climate,occupancy rate, available facili es, construc onmaterials, engineering systems, and energy pricing.Every hotel will have varia ons so predic ng the energysavings would require modelling of each hotel.
For this study, a generic hotel, representa ve of asample IHG Hotel was modelled using Trane Trace. Thisis of average size, construc on, and layout. The modelwas run for four di erent climates.
The baseline hotel is of standard construc on, usage,and engineering systems as de ned by ASHRAE 90.1-2004, Appendix G. This standard is the minimumrequirements allowed for new buildings in the US andde nes prac ce for calcula ng a building’s energysavings. This is also the acceptable method used byLEED to de ne energy savings required by Energy andAtmosphere Prerequisite 1 and Credit 1.
The ndings from the energy report are presented inthe prescrip ve measures charts. Use of these chartswill allow IHG to build a hotel that is approximately15% more energy e cient than the ASHRAE 90.1-2004baseline hotel for buildings similar to those modelled.Varia ons in climate, building geometry, facili es,occupancy and building construc on will producedi erent energy savings. To fully realise a property’senergy savings, an energy model should be done for thatspeci c project.
The following assump ons were used to create abaseline hotel for this study.
Climates Modelled:
The model was run in four climate zones, covering thefull range of loca ons of IHG’s proper es. The followingweather data was used to simulate these four zones:
• Hot-Humid: West Palm Beach, Florida
• Arid: Phoenix, Arizona
• Temperate: New York, New York
• Cold-Alpine: Fargo, North Dakota
Building Geometry:• 6 oors consis ng of guest rooms only
• 20 guest rooms on each oor, all with at least oneexterior wall
• Each room approximately 45 square meters or 484square feet
• Each oor is square (having equal length exposuresin the north, south, east, and west direc ons)
• Exterior walls have 40% glazing and are 60%opaque
Building Envelope Construction:• Walls are 4” lightweight block with 4” insula on
• Wall insula on: based on ASHRAE minimum infollowing chart
• Roof insula on: based on ASHRAE minimum infollowing chart
Climate Zone
BuildingEnvelopeComponent
Hot -Humid Arid Temperate Cold -
Alpine
RoofConstruc on
R-15.0,U=0.063
R-15.0,U=0.063
R-15.0,U=0.063
R-15.0,U=0.063
WallConstruc on
R-5.7,U=0.151
R-7.6,U=0.123
R-9.5,U=0.104
R-13.3,U=0.08
Fixed Glazing U=1.22 U=0.57 U=0.57 U=0.57
OperableGlazing U=1.27 U=0.67 U=0.67 U=0.67
Glazing SHGC 0.25 0.25 0.39 0.49
The four base models were built with the listedconstruc on and assump on. Addi onal test models wererun with energy e cient electrical systems, improvedmechanical systems and designs, and improved envelopeconstruc on. These op ons were used to develop theCredited Ac ons outlined in this report.
Room Loads:• Each room has two people
• Each room has a ligh ng density of 1.0 Wa s/squarefoot
• Each room has an equipment density of 0.5 Wa s/square foot (for TV, laptop, etc.)
Guest Occupancy Schedule:• Midnight – 9 AM: 100%
• 9 AM to 11 AM: 20%
• 11 AM to 5 PM: 0%
• 5 PM to Midnight: 100%
Energy Model Assumptions: General (1/2)
Issued February 1, 2011 7 New Hotels Energy Analysis - Green Engage/Solutions

Energy Model Assumptions: General (2/2)
Mechanical Systems:• Individual room air-cooled PTACs
• Ven la on air delivered directly through the wallinto the room units
• Systems can run 24-7, as temperature requires
• No central plant (none required for air-cooledPTACs)
Issued February 1, 2011 8 New Hotels Energy Analysis - Green Engage/Solutions

Utilities:U lity values for electricity and natural gaswere obtained from the US Energy Informa onAdministra on for the baseline 2008 year across all fourclimate zones. These gures are for the commercialstate averages of Florida, Arizona, New York and NorthDakota.
ClimateZone
Hot &Humid
Hot &Dry Temperate Cold
Alpine
Electricity(kWh) $0.0965 $0.0802 $0.1535 $0.0622
Natural Gas(therms) N/A N/A $1.5056 $1.1906
NPV Financial Inputs:
• Base year for analysis: 2008
• Building Analysis/Study Period : 20 years
• Projected average (nominal) fuel escala onrate was obtained from the US Department ofCommerce for the commercial end-use sector as anaverage for both electricity and natural gas – 3.5%
• Discount Rate (nominal) – 6%
HVAC Plant First Cost Reductions:Measures might have the impact of reducing (orincreasing) the required size of the HVAC plant. Todetermine this capital cost change the following gureswere sourced from RS Means 2008.
• Cooling plant costs - $450/ton
• Hea ng plant costs - $7.55/MBtu
• Airside distribu on costs - $3.5/cfm
Emission Factors:Emission factors for electricity depend on the state orcountry electricity mix. However, for comparison acrossclimate zones the average emission for CO2, SO2 andNOX across the US has been used. These gures weresourced from the EPA’s eGRID 2007, the EIA and theEERE.
Energy Type CO2(lb/MWh)
SO2(lb/MWh)
NOX(lb/MWh)
Electricity 1,329.35 5.2589 1.9366
Natural Gas 398.31 0 0.2994
Energy Model Assumptions: Financial
Issued February 1, 2011 9 New Hotels Energy Analysis - Green Engage/Solutions

Source: Peel et.al. Updated world map of the Koppen-Geiger climate classi ca on, Hydrol. Earth Syst. Sci., 11, 1633–1644, 2007
Global Climate Map
Issued February 1, 2011 10 New Hotels Energy Analysis - Green Engage/Solutions

Hot-Humid: West Palm Beach, Florida
Climate Data
Arid: Phoenix, Arizona
Issued February 1, 2011 11 New Hotels Energy Analysis - Green Engage/Solutions

Temperate: New York City, New York
Climate Data
Cold-Alpine: Fargo, North Dakota
Issued February 1, 2011 12 New Hotels Energy Analysis - Green Engage/Solutions

New Hotel Energy Charts
Issued February 1, 2011 13 New Hotels Energy Analysis - Green Engage/Solutions
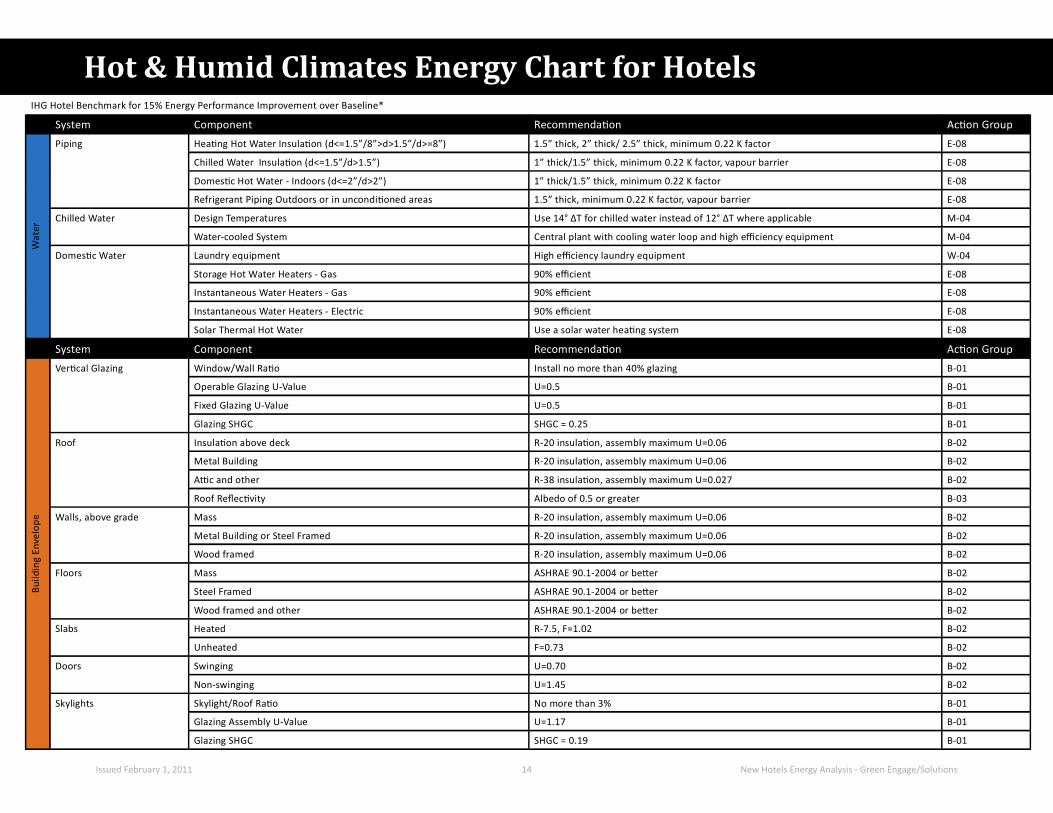
Hot & Humid Climates Energy Chart for HotelsIHG Hotel Benchmark for 15% Energy Performance Improvement over Baseline*
System Component Recommenda on Ac on Group
Wat
er
Piping Hea ng Hot Water Insula on (d<=1.5”/8”>d>1.5”/d>=8”) 1.5” thick, 2” thick/ 2.5” thick, minimum 0.22 K factor E-08
Chilled Water Insula on (d<=1.5”/d>1.5”) 1” thick/1.5” thick, minimum 0.22 K factor, vapour barrier E-08
Domes c Hot Water - Indoors (d<=2”/d>2”) 1” thick/1.5” thick, minimum 0.22 K factor E-08
Refrigerant Piping Outdoors or in uncondi oned areas 1.5” thick, minimum 0.22 K factor, vapour barrier E-08
Chilled Water Design Temperatures Use 14° T for chilled water instead of 12° T where applicable M-04
Water-cooled System Central plant with cooling water loop and high e ciency equipment M-04
Domes c Water Laundry equipment High e ciency laundry equipment W-04
Storage Hot Water Heaters - Gas 90% e cient E-08
Instantaneous Water Heaters - Gas 90% e cient E-08
Instantaneous Water Heaters - Electric 90% e cient E-08
Solar Thermal Hot Water Use a solar water hea ng system E-08
System Component Recommenda on Ac on Group
Build
ing
Enve
lope
Ver cal Glazing Window/Wall Ra o Install no more than 40% glazing B-01
Operable Glazing U-Value U=0.5 B-01
Fixed Glazing U-Value U=0.5 B-01
Glazing SHGC SHGC = 0.25 B-01
Roof Insula on above deck R-20 insula on, assembly maximum U=0.06 B-02
Metal Building R-20 insula on, assembly maximum U=0.06 B-02
A c and other R-38 insula on, assembly maximum U=0.027 B-02
Roof Re ec vity Albedo of 0.5 or greater B-03
Walls, above grade Mass R-20 insula on, assembly maximum U=0.06 B-02
Metal Building or Steel Framed R-20 insula on, assembly maximum U=0.06 B-02
Wood framed R-20 insula on, assembly maximum U=0.06 B-02
Floors Mass ASHRAE 90.1-2004 or be er B-02
Steel Framed ASHRAE 90.1-2004 or be er B-02
Wood framed and other ASHRAE 90.1-2004 or be er B-02
Slabs Heated R-7.5, F=1.02 B-02
Unheated F=0.73 B-02
Doors Swinging U=0.70 B-02
Non-swinging U=1.45 B-02
Skylights Skylight/Roof Ra o No more than 3% B-01
Glazing Assembly U-Value U=1.17 B-01
Glazing SHGC SHGC = 0.19 B-01
Issued February 1, 2011 14 New Hotels Energy Analysis - Green Engage/Solutions
Hot & Humid Climates Energy Chart for HotelsIHG Hotel Benchmark for 15% Energy Performance Improvement over Baseline*
System Component Recommenda on Ac on Group
Mec
hani
cal
HVAC Systems Water Source Heat Pumps in Guest Rooms 13 SEER/7.7 HSPF, 0.00025 KW/CFM full load energy rate M-03
4 Pipe Fan Coils in Guest Rooms 0.00025 KW/CFM e ciency full load energy rate M-03
Central Air Handling Units (VAV & CV) 13 SEER, 0.00025 KW/CFM-in wg e ciency full load energy rate M-03
VFDs VFDs on all equipment over 5 HP M-11
Economiser Mode in Central Air Handlers ASHRAE 90.1-2004 or be er M-07
Humidity Control Provide dehumidi ca on and humidistats M-01
Ven la on Ven la on Air Delivery Central outside air unit ducted to each room with motorised dampers M-01, M-10, E-06
Demand Ven la on Minimum ow rates when room is unoccupied through use of CO2 sensors N/A
Ductwork Fric on in secondary duct work 0.08” w.c./100’ maximum N/A
Velocity in primary duct work 2000 FPM maximum N/A
Sealing Seal Class B N/A
Supply Duct Insula on R-6 N/A
Return Duct Insula on R-6 N/A
Exterior Duct or Duct in Unvented A cs Insula on R-8 N/A
System Component Recommenda on Ac on Group
Elec
tric
al
Interior Ligh ng Lower ligh ng levels 0.9 W/sf overall E-10
Occupancy sensors Occupancy sensors in all mul - occupancy spaces E-09
Equipment Use compact uorescent bulbs E-10
Ballast Electronic ballast E-10
Dimming Controls Dim Fixtures within 12’ of north/south windows or 8’ of skylight B-01
Interior Room Surface Re ectance Minimum 80% on ceilings, 70% on walls and ver cal par ons E-3
** This outline is based on the ASHRAE Advanced Energy Design Guide for Small O ce Buildings prescrip ve chart, modi ed by the results of the energy model of the baseline IHG hotel. Baselinecase and modelled case assump ons are listed in the document “Energy Model Assump ons” at the front of this document. Devia on from the modelled hotel may result in a di erent energy savingspercentage. This chart may not be applicable to exis ng hotels due to exis ng constraints. If the table list “ASHRAE 90.1-2004 or be er” for a component, meet either ASHRAE Standard 90.1-2004 orthe local code requirements, whichever is more stringent. In the event that local code is more stringent than the benchmark prescrip ve, always refer to local code.
Issued February 1, 2011 15 New Hotels Energy Analysis - Green Engage/Solutions

Arid Climates Energy Chart for HotelsIHG Hotel Benchmark for 15% Energy Performance Improvement over Baseline*
System Component Recommenda on N/A
Wat
er
Piping Hea ng Hot Water Insula on (d<=1.5”/8”>d>1.5”/d>=8”) 1.5” thick, 2” thick/ 2.5” thick, minimum 0.22 K factor E-08
Chilled Water Insula on (d<=1.5”/d>1.5”) 1” thick/1.5” thick, minimum 0.22 K factor, vapour barrier E-08
Domes c Hot Water - Indoors (d<=2”/d>2”) 1” thick/1.5” thick, minimum 0.22 K factor E-08
Refrigerant Piping Outdoors or in uncondi oned areas 1.5” thick, minimum 0.22 K factor, vapour barrier E-08
Chilled Water Design Temperatures Use 14° T for chilled water instead of 12° T where applicable M-04
Water-cooled System Central plant with cooling water loop and high e ciency equipment M-04
Domes c Water Laundry equipment High e ciency laundry equipment W-04
Storage Hot Water Heaters - Gas 90% e cient E-08
Instantaneous Water Heaters - Gas 90% e cient E-08
Instantaneous Water Heaters - Electric 90% e cient E-08
Solar Thermal Hot Water Use a solar water hea ng system E-08
System Component Recommenda on Ac on Group
Build
ing
Enve
lope
Ver cal Glazing Window/Wall Ra o Install no more than 40% glazing B-01
Operable Glazing U-Value U=0.5 B-01
Fixed Glazing U-Value U=0.5 B-01
Glazing SHGC SHGC = 0.25 B-01
Roof Insula on above deck R-20 insula on, assembly maximum U=0.06 B-02
Metal Building R-20 insula on, assembly maximum U=0.06 B-02
A c and other R-38 insula on, assembly maximum U=0.027 B-02
Roof Re ec vity Albedo of 0.5 or greater B-03
Walls, above grade Mass R-20 insula on, assembly maximum U=0.06 B-02
Metal Building or Steel Framed R-20 insula on, assembly maximum U=0.06 B-02
Wood framed R-20 insula on, assembly maximum U=0.06 B-02
Floors Mass ASHRAE 90.1-2004 or be er B-02
Steel Framed ASHRAE 90.1-2004 or be er B-02
Wood framed and other ASHRAE 90.1-2004 or be er B-02
Slabs Heated R-7.5, F=1.02 B-02
Unheated F=0.73 B-02
Doors Swinging U=0.70 B-02
Non-swinging U=0.50 B-02
Skylights Skylight/Roof Ra o No more than 3% B-01
Glazing Assembly U-Value U=1.36 B-01
Glazing SHGC SHGC = 0.19 B-01
Issued February 1, 2011 16 New Hotels Energy Analysis - Green Engage/Solutions

Arid Climates Energy Chart for HotelsIHG Hotel Benchmark for 15% Energy Performance Improvement over Baseline*
System Component Recommenda on Ac on Group
Mec
hani
cal
HVAC Systems Water Source Heat Pumps in Guest Rooms 13 SEER/7.7 HSPF, 0.00025 KW/CFM full load energy rate M-03
4 Pipe Fan Coils in Guest Rooms 0.00025 KW/CFM e ciency full load energy rate M-03
Central Air Handling Units (VAV & CV) 13 SEER, 0.00025 KW/CFM-in wg e ciency full load energy rate M-03
VFDs VFDs on all equipment over 5 HP M-11
Economiser Mode in Central Air Handlers ASHRAE 90.1-2004 or be er M-07
Ven la on Ven la on Air Delivery Central outside air unit ducted to each room with motorised dampers M-01
Demand Ven la on Minimum ow rates when room is unoccupied through use of CO2 sensors M-01, M-10, E-06
Ductwork Fric on in secondary duct work 0.08” w.c./100’ maximum N/A
Velocity in primary duct work 2000 FPM maximum N/A
Sealing Seal Class B N/A
Supply Duct Insula on R-6 N/A
Return Duct Insula on R-3.5 N/A
Exterior Duct or Duct in Unvented A cs Insula on R-8 N/A
System Component Recommenda on Ac on Group
Elec
tric
al
Interior Ligh ng Lower ligh ng levels 0.9 W/sf overall E-09
Occupancy sensors Occupancy sensors in all mul - occupancy spaces E-10
Equipment Use compact uorescent bulbs E-09
Ballast Electronic ballast E-10
Dimming Controls Dim Fixtures within 12’ of north/south windows or 8’ of skylight E-10
Interior Room Surface Re ectance Minimum 80% on ceilings, 70% on walls and ver cal par ons B-01
** This outline is based on the ASHRAE Advanced Energy Design Guide for Small O ce Buildings prescrip ve chart, modi ed by the results of the energy model of the baseline IHG hotel. Baselinecase and modelled case assump ons are listed in the document “Energy Model Assump ons” at the front of this document. Devia on from the modelled hotel may result in a di erent energy savingspercentage. This chart may not be applicable to exis ng hotels due to exis ng constraints. If the table list “ASHRAE 90.1-2004 or be er” for a component, meet either ASHRAE Standard 90.1-2004 orthe local code requirements, whichever is more stringent. In the event that local code is more stringent than the benchmark prescrip ve, always refer to local code.
Issued February 1, 2011 17 New Hotels Energy Analysis - Green Engage/Solutions

Temperate Climates Energy Chart for HotelsIHG Hotel Benchmark for 15% Energy Performance Improvement over Baseline*
System Component Recommenda on Ac on Group
Wat
er
Piping Hea ng Hot Water Insula on (d<=1.5”/8”>d>1.5”/d>=8”) 1.5” thick, 2” thick/ 2.5” thick, minimum 0.22 K factor E-08
Chilled Water Insula on (d<=1.5”/d>1.5”) 1” thick/1.5” thick, minimum 0.22 K factor, vapour barrier E-08
Domes c Hot Water - Indoors (d<=2”/d>2”) 1” thick/1.5” thick, minimum 0.22 K factor E-08
Refrigerant Piping Outdoors or in uncondi oned areas 1.5” thick, minimum 0.22 K factor, vapour barrier E-08
Chilled Water Design Temperatures Use 14° T for chilled water instead of 12° T where applicable M-04
Water-cooled System Central plant with cooling water loop and high e ciency equipment M-04
Domes c Water Laundry equipment High e ciency laundry equipment W-04
Storage Hot Water Heaters - Gas 90% e cient E-08
Instantaneous Water Heaters - Gas 90% e cient E-08
Instantaneous Water Heaters - Electric 90% e cient E-08
Solar Thermal Hot Water Use a solar water hea ng system E-08
System Component Recommenda on Ac on Group
Build
ing
Enve
lope
Ver cal Glazing Window/Wall Ra o Install no more than 40% glazing B-01
Operable Glazing U-Value U=0.30 B-01
Fixed Glazing U-Value U=0.30 B-01
Glazing SHGC SHGC = 0.39 B-01
Roof Insula on above deck R-20 insula on, assembly maximum U=0.06 B-02
Metal Building R-20 insula on, assembly maximum U=0.06 B-02
A c and other R-38 insula on, assembly maximum U=0.027 B-02
Roof Re ec vity Albedo of 0.5 or greater B-03
Walls, above grade Mass R-20 insula on, assembly maximum U=0.06 B-02
Metal Building or Steel Framed R-20 insula on, assembly maximum U=0.06 B-02
Wood framed R-20 insula on, assembly maximum U=0.06 B-02
Floors Mass ASHRAE 90.1-2004 or be er B-02
Steel Framed ASHRAE 90.1-2004 or be er B-02
Wood framed and other ASHRAE 90.1-2004 or be er B-02
Slabs Heated R-10, 0.78 B-02
Unheated R-10, 0.54 B-02
Doors Swinging U=0.70 B-02
Non-swinging U=0.50 B-02
Skylights Skylight/Roof Ra o No more than 3% B-01
Glazing Assembly U-Value U=1.17 B-01
Glazing SHGC SHGC = 0.64 B-01
Issued February 1, 2011 18 New Hotels Energy Analysis - Green Engage/Solutions

Temperate Climates Energy Chart for HotelsIHG Hotel Benchmark for 15% Energy Performance Improvement over Baseline*
System Component Recommenda on Ac on Group
Mec
hani
cal
HVAC Systems Water Source Heat Pumps in Guest Rooms 13 SEER/7.7 HSPF, 0.00025 KW/CFM full load energy rate M-03
4 Pipe Fan Coils in Guest Rooms 0.00025 KW/CFM e ciency full load energy rate M-03
Central Air Handling Units (VAV & CV) 13 SEER, 0.00025 KW/CFM-in wg e ciency full load energy rate M-03
VFDs VFDs on all equipment over 5 HP M-11
Economiser Mode in Central Air Handlers ASHRAE 90.1-2004 or be er M-07
Ven la on Ven la on Air Delivery Central outside air unit ducted to each room with motorised dampers M-01
Demand Ven la on Minimum ow rates when room is unoccupied through use of CO2 sensors M-01, M-10, E-06
Ductwork Fric on in secondary duct work 0.08” w.c./100’ maximum N/A
Velocity in primary duct work 2000 FPM maximum N/A
Sealing Seal Class B N/A
Supply Duct Insula on R-6 N/A
Return Duct Insula on R-3.5 N/A
Exterior Duct or Duct in Unvented A cs Insula on R-6 N/A
System Component Recommenda on Ac on Group
Elec
tric
al
Interior Ligh ng Lower ligh ng levels 0.9 W/sf overall E-09
Occupancy sensors Occupancy sensors in all mul - occupancy spaces E-10
Equipment Use compact uorescent bulbs E-09
Ballast Electronic ballast E-10
Dimming Controls Dim Fixtures within 12’ of north/south windows or 8’ of skylight E-10
Interior Room Surface Re ectance Minimum 80% on ceilings, 70% on walls and ver cal par ons B-01
** This outline is based on the ASHRAE Advanced Energy Design Guide for Small O ce Buildings prescrip ve chart, modi ed by the results of the energy model of the baseline IHG hotel. Baselinecase and modelled case assump ons are listed in the document “Energy Model Assump ons” at the front of this document. Devia on from the modelled hotel may result in a di erent energy savingspercentage. This chart may not be applicable to exis ng hotels due to exis ng constraints. If the table list “ASHRAE 90.1-2004 or be er” for a component, meet either ASHRAE Standard 90.1-2004 orthe local code requirements, whichever is more stringent. In the event that local code is more stringent than the benchmark prescrip ve, always refer to local code.
Issued February 1, 2011 19 New Hotels Energy Analysis - Green Engage/Solutions

IHG Hotel Benchmark for 15% Energy Performance Improvement over Baseline*
System Recommenda on Ac on Group
Wat
er
Piping Hea ng Hot Water Insula on (d<=1.5”/8”>d>1.5”/d>=8”) 1.5” thick, 2” thick/ 2.5” thick, minimum 0.22 K factor E-08
Chilled Water Insula on (d<=1.5”/d>1.5”) 1” thick/1.5” thick, minimum 0.22 K factor, vapour barrier E-08
Domes c Hot Water - Indoors (d<=2”/d>2”) 1” thick/1.5” thick, minimum 0.22 K factor E-08
Refrigerant Piping Outdoors or in uncondi oned areas 1.5” thick, minimum 0.22 K factor, vapour barrier E-08
Chilled Water Design Temperatures Use 14° T for chilled water instead of 12° T where applicable M-04
Water-cooled System Central plant with cooling water loop and high e ciency equipment M-04
Domes c Water Laundry equipment High e ciency laundry equipment W-04
Storage Hot Water Heaters - Gas 90% e cient E-08
Instantaneous Water Heaters - Gas 90% e cient E-08
Instantaneous Water Heaters - Electric 90% e cient E-08
Solar Thermal Hot Water Use a solar water hea ng system E-08
System Component Recommenda on Ac on Group
Build
ing
Enve
lope
Ver cal Glazing Window/Wall Ra o Install no more than 40% glazing B-01
Operable Glazing U-Value U=0.30 B-01
Fixed Glazing U-Value U=0.30 B-01
Glazing SHGC SHGC = 0.49 B-01
Roof Insula on above deck R-20 insula on, assembly maximum U=0.06 B-02
Metal Building R-20 insula on, assembly maximum U=0.06 B-02
A c and other R-38 insula on, assembly maximum U=0.027 B-02
Roof Re ec vity Albedo of 0.5 or greater B-03
Walls, above grade Mass R-20 insula on, assembly maximum U=0.06 B-02
Metal Building or Steel Framed R-20 insula on, assembly maximum U=0.06 B-02
Wood framed R-20 insula on, assembly maximum U=0.06 B-02
Floors Mass ASHRAE 90.1-2004 or be er B-02
Steel Framed ASHRAE 90.1-2004 or be er B-02
Wood framed and other ASHRAE 90.1-2004 or be er B-02
Slabs Heated ASHRAE 90.1-2004 or be er B-02
Unheated ASHRAE 90.1-2004 or be er B-02
Doors Swinging U=0.50 B-02
Non-swinging U=0.50 B-02
Skylights Skylight/Roof Ra o No more than 3% B-01
Glazing Assembly U-Value U=0.98 B-01
Glazing SHGC SHGC = 0.19 B-01
Cold Climates Energy Chart for Hotels
Issued February 1, 2011 20 New Hotels Energy Analysis - Green Engage/Solutions
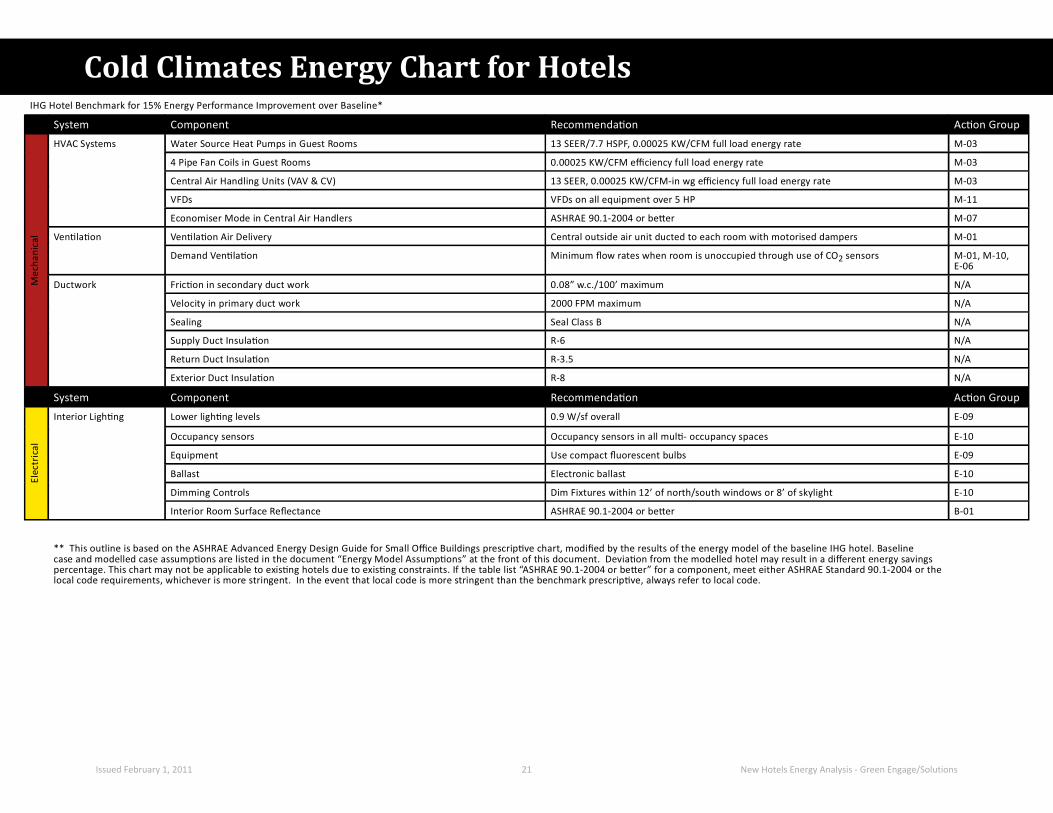
IHG Hotel Benchmark for 15% Energy Performance Improvement over Baseline*
System Component Recommenda on Ac on Group
Mec
hani
cal
HVAC Systems Water Source Heat Pumps in Guest Rooms 13 SEER/7.7 HSPF, 0.00025 KW/CFM full load energy rate M-03
4 Pipe Fan Coils in Guest Rooms 0.00025 KW/CFM e ciency full load energy rate M-03
Central Air Handling Units (VAV & CV) 13 SEER, 0.00025 KW/CFM-in wg e ciency full load energy rate M-03
VFDs VFDs on all equipment over 5 HP M-11
Economiser Mode in Central Air Handlers ASHRAE 90.1-2004 or be er M-07
Ven la on Ven la on Air Delivery Central outside air unit ducted to each room with motorised dampers M-01
Demand Ven la on Minimum ow rates when room is unoccupied through use of CO2 sensors M-01, M-10,E-06
Ductwork Fric on in secondary duct work 0.08” w.c./100’ maximum N/A
Velocity in primary duct work 2000 FPM maximum N/A
Sealing Seal Class B N/A
Supply Duct Insula on R-6 N/A
Return Duct Insula on R-3.5 N/A
Exterior Duct Insula on R-8 N/A
System Component Recommenda on Ac on Group
Elec
tric
al
Interior Ligh ng Lower ligh ng levels 0.9 W/sf overall E-09
Occupancy sensors Occupancy sensors in all mul - occupancy spaces E-10
Equipment Use compact uorescent bulbs E-09
Ballast Electronic ballast E-10
Dimming Controls Dim Fixtures within 12’ of north/south windows or 8’ of skylight E-10
Interior Room Surface Re ectance ASHRAE 90.1-2004 or be er B-01
** This outline is based on the ASHRAE Advanced Energy Design Guide for Small O ce Buildings prescrip ve chart, modi ed by the results of the energy model of the baseline IHG hotel. Baselinecase and modelled case assump ons are listed in the document “Energy Model Assump ons” at the front of this document. Devia on from the modelled hotel may result in a di erent energy savingspercentage. This chart may not be applicable to exis ng hotels due to exis ng constraints. If the table list “ASHRAE 90.1-2004 or be er” for a component, meet either ASHRAE Standard 90.1-2004 or thelocal code requirements, whichever is more stringent. In the event that local code is more stringent than the benchmark prescrip ve, always refer to local code.
Cold Climates Energy Chart for Hotels
Issued February 1, 2011 21 New Hotels Energy Analysis - Green Engage/Solutions

Calculation Sheets
Issued February 1, 2011 22 New Hotels Energy Analysis - Green Engage/Solutions

Legend (Criteria Based On Simple Payback Only):Very Short or Immediate Payback (0 - 3 years)Intermediate Payback (3 - 7 years)Long or No Payback (>7 years)
All Climate Zones Energy Modelling Results Summary New HotelsThe table below summarises the financial performance, in terms of simple payback, for the modeled new hotel in 4 climate zones against various baseline models. Energy savings for a specific building may vary based on that building's parameters and financial results may also vary based on local costs and financing structures.For details regarding each measure and for additional energy and financial performance metrics (CO2 reduction, IRR, first year yield on marginal cost and NPV) refer to the summary pages and individual calculation pages immediately following this page. For detailed assumptions relating to the energy model, utilities, emission factors, financial inputs, cost of capital, etc refer to the assumptions section of this book.
Relevant Action Group Measure
M-2
AridHot/Humid Cold-AlpineFargo, NDNew York, NY
TemperatePhoenix, AR
Condenser Water Heat Pump
Optimise Building InsulationDedicated outside air unit
yrs
West Palm Beach, FL
Base Case: Identical VAV system but without fan-powered parallel terminal units. Note: FPPs not modelled in hot climates.
M-7M-7
Base Case: PTAC units with air-cooled unitary cooling and electric resistance heating.
M-7
Heat Recovery
Fan Coil Units
Water Cooled VAV with FPPAir Cooled VAV with FPP
Water Cooled VAV
Optimise Glazing
Air Cooled VAVM-72.8 yrs2.9 yrs
4.2 yrsImmediate
Base Case: Best performing HVAC system: water cooled VAV system
3.4 yrs19 yrs
B-1B-3
M-13
Demand Ventilation
M-9M-12M-13
Variable Frequency DrivesWater-Cooled ChillerEvaporative CoolingThermal Storage
Economiser Modes
M-2M-3M-4
M-7M-7
Simple Payback
Immediate> 20 yrs
5.2 yrs6.9 yrs
Simple Payback yrs
Simple Payback yrs
Simple Payback yrs
4.9 yrs> 20 yrs1.2 yrs3.7 yrs
> 20 yrs20 yrs
6.7 yrs5.5 yrs
N/A
Immediate> 20 yrs
6.6 yrs8.3 yrs10 yrs5.9 yrs
7 yrs12 yrs1.7 yrs5.3 yrs17 yrsNever
4.9 yrs12 yrs5.2 yrs3.3 yrs5.3 yrs6.5 yrs3 yrs
Immediate2.2 yrs11 yrs
3.3 yrs3.3 yrs
2.5 yrs3 yrs
11 yrs> 20 yrs11 yrs7.2 yrs8.3 yrs4.9 yrs4 yrsNever
11 yrs6.8 yrs
Immediate2 yrs
2.1 yrs2.1 yrs
5.2 yrs5 yrs
Issued February 1, 2011 23 New Hotels Energy Analysis - Green Engage/Solutions

Hot-Humid
Issued February 1, 2011 24 New Hotels Energy Analysis - Green Engage/Solutions

Legend (Criteria Based On Simple Payback Only):Very Short or Immediate Payback (0 - 3 years)Intermediate Payback (3 - 7 years)Long or No Payback (>7 years)
M-9M-12M-13
Variable Frequency DrivesWater-Cooled ChillerEvaporative Cooling
B-1B-3
M-2M-3M-4
Heat Recovery
26.5%($9,546)$14,076
Demand Ventilation
2.1%
20 yrs
CO2 Reductions First Year Yield On Marginal Cost
13.2% 22.9%
($12,984)$11,463
23.1% 13.1%17.9%
$17,040
20.6%
% %
$134,306$214,692
$271,005
Fan Coil Units
Water Cooled VAV with FPP
11.7%1.2%
3.7 yrs1.2 yrs
> 20 yrs
N/A
2.4%N/AN/A
N/AN/AN/A
26.0%
29.7%87.5%
N/A
3.6%0.5%
0.1%
84.0%3.2%
4.2 yrs
0.8%
0.1%
22.1% 19.4%
M-2
yrs
M-7M-7
M-7M-7 Air Cooled VAV
Condenser Water Heat Pump
Optimise Building InsulationDedicated outside air unit
> 20 yrs
26.4%19.5%
5.5 yrs6.7 yrs
32.1%
> 20 yrsImmediate
16.9%13.6%
19.4%15.6%
$
$153,124
$97,874($17,545)
Relevant Action Group Measure
N/A
Base Case: Identical VAV system but without fan-powered parallel terminal units. Note: FPPs not modelled in hot climates.
Base Case: Best performing HVAC system: water cooled VAV system
Air Cooled VAV with FPP
Base Case: PTAC units with air-cooled unitary cooling and electric resistance heating.
M-7M-7
%
15.0%
1.0%1.3%Immediate
2.3%
The table below summarises the overall energy and financial performance for the modeled new hotel in the hot-humid climate zone against the baseline building. Energy savings for a specific building may vary based on that building's parameters and financial results may also vary based on local costs and financing structures. For details regarding each measure refer to the individual calculation pages immediately following this page. For detailed assumptions relating to the energy model, utilities, emission factors, financial inputs, cost of capital, etc refer to the assumptions section of this book.Note: CO2 reduction percentages closely match both source energy reductions and annual energy savings cost reductions. Due to different modeling methodologies existing hotel and new hotel CO2 reduction percentages cannot be compared against each other. The colour key contained below refers solely to simple payback periods.
Hot/HumidWest Palm Beach, FL
Energy Modelling Results Summary New Hotels Hot-Humid
$59,653
$110,938($11,720)
M-13 4.9 yrs
NPV(Over 20 Years)
0.0%Thermal Storage
Water Cooled VAV
Optimise Glazing
Economiser Modes
Simple Payback IRR
5.2 yrs6.9 yrs
Issued February 1, 2011 25 New Hotels Energy Analysis - Green Engage/Solutions

Proposed ModificationsAs with Base Case, but with improved glazing
properties. SHGC is unchanged, U-value is reduced to 0.5.
VAV system with reheat used for all rooms. Cooling provided by water-cooled chiller with cooling tower. Electric resistance heating. Demand ventilation.
Standard ASHRAE construction for climate zone 2.
PumpsSpace CoolingSpace Heating - Gas
88 7
0.31,186.6
Base Case Energy Use
Proposed Energy Use
HVAC FansHeat Rejection
N/A
0.8%NOX (lb/yr)
86 5 2 2 2 5%
Environmental Impact Analysis
CO2 (lb/yr) 840,588 833,459 0.8%SO2 (lb/yr) 3,325 3,297
Savings (+) / Loss (-)
% Savings (+) / Loss (-)ProposedBase CaseEmissions
0.8%212.2
669.7
0.41,186.6
B-1 Optimize Glazing
Base Case
N/A
Energy End-Use Benchmark Comparison
Energy End-Use
Savings (+) / Loss (-)
Building Envelope
0.0 0.0 0.0 0.0%
MBtu/yr MBtu/yrLightingSpace Heating - Elec 0.1 25.0%
1,225
N/A N/A
Individual Resource Calculations New Hotels Hot-Humid
190.9 21.3
1,214 0.8%%
0.0%MBtu/yr
10.0%
675.0 -5.3 -0.8%
0.0
840,588 833,459
500,000
1,000,000
lb/y
r
Annual CO2 Emissions
0.5.
Assumptions
88.7HVAC Fans
2,139.3
N/A
Base UtilitiesReceptacles N/A N/A N/A N/A
0.8%
18.3 0.8%N/A N/A
86.5 2.2 2.5%
N/A N/A2,157.6Total
840,588 833,459
0
500,000
1,000,000
Base Case Proposed
lb/y
r
Annual CO2 Emissions
3,325
1,225
3,297
1,214
0
2,000
4,000
SO2 (lb/yr) NOX (lb/yr)
g/yr
Annual SO2 and NOX EmissionsBase Case
Proposed
2,158 2,139
0
500
1,000
1,500
2,000
2,500
Base Case Proposed
MBt
u/yr
Annual Total Energy Use
Issued February 1, 2011 26 New Hotels Energy Analysis - Green Engage/Solutions

Additional Capital CostHVAC Plant First Cost Reductions
Cooling Plant Savings ($450/ton)Heating Plant Savings ($7 55/MBh)
($21,896)
Building Envelope
$0$0
$0$0$0
Water & sewerNatural gasElectricity
00
5,363Resource
Annual Resource Savings (+) / Loss (-)
Yr.
Financial Table
kWh
$636
Capital Costs Savings Summary$536
$636
$0$518
Annual Savings (+) / Loss (-)
Annual Resource Cost Summary
Galstherms
N/AN/A
$0.0965Unit Cost
15202
2$574$554
Savings (+) / Loss (-)
($21,896)
Costs (Marginal/Maint/
Replace)Cash Flow
6543
$0$615$594
$0
($63,866)
First Year Yield On Marginal Cost
IRR
MBhtons
2.4%
N/A
$1 527$615$6,840
$0 Simple Payback > 20 yrs10
$594$574
$536$554
B-1 Optimize Glazing
Initial Annual Savings
Initial Marginal Cost
Financial Results Summary
$21,896
$536
Individual Resource Calculations New Hotels Hot-Humid
Heating Plant Savings ($7.55/MBh)Airside Distribution Savings ($3.5/cfm)
Total Additional Capital Cost:
Estimated Useful Life (yrs)Percent replacedReplacement Cost
Base YearValuation TypeProject Analysis PeriodDiscount Rate for Defined ValuationEnergy Escalation Rate (Nominal)
9,601 $33,604 $0$0 $636$636202
($21,896)
20 Replacement Life and Cost Summary
20191817Defined
20
2008
0%$0 $0
$0 $756
$867
$995$961$929
3.50%
$0
1112
6.00%$0 $1,030 $1,030$0 $995
Financial Analysis
$0
$0$867
$838
$0
$0
$809$809
876
$682$0
109 $0
$730$705
$0
$961$929$89716
15$897
14
$0
$83813
$658
$756$730$705$682$658
$782 $782
-$12,984NPVcfmMBh $1,527
($25,000)
($20,000)
($15,000)
($10,000)
($5,000)
$0 0 5 10 15 20
Net
Cas
h Fl
ow (E
nd o
f Yea
r)
Years
Simple Payback Graph
Issued February 1, 2011 27 New Hotels Energy Analysis - Green Engage/Solutions

212.2
669.7Space Cooling
VAV system with reheat used for all rooms. Cooling provided by water-cooled chiller with cooling tower. Electric resistance heating. Demand ventilation.
Standard ASHRAE construction for climate zone 2.
1.0%
% Savings (+) / Loss (-)ProposedBase CaseEmissions
1,212 1.0%
Proposed ModificationsAs with Base Case, but with the overall wall U-value
reduced to 0.06.
1.0%SO2 (lb/yr) 3,325 3,291 1.0%
88 7
NOX (lb/yr) 1,225
N/A N/A N/A
1,186.6 0.0
1.6%
Space Heating - ElecSpace Heating - Gas
0.0%1,186.6
HVAC FansHeat RejectionPumps
0.7 -0.3 -75.0%
86 1 2 6 2 9%202.6
Base Case Energy Use
0.0
MBtu/yrLighting
MBtu/yr
Proposed Energy Use
Savings (+) / Loss (-)
Savings (+) / Loss (-)
Building Envelope
0.0 0.0 0.0%0.4
MBtu/yr %
9.6 4.5%
Individual Resource Calculations New Hotels Hot-Humid
B-3 Optimize Building Insulation
Base Case
N/A
Energy End-Use Benchmark Comparison
Energy End-Use
10.4659.3
Environmental Impact Analysis
CO2 (lb/yr) 840,588 831,900
840,588 831,900
400,000500,000600,000700,000800,000900,000
lb/y
r
Annual CO2 Emissions
1.0%
AssumptionsN/A
88.7N/AN/A
1.0%N/A N/A
HVAC Fans 86.1 2.6 2.9%
TotalBase UtilitiesReceptacles
N/AN/A
2,157.6 2,135.3 22.3
N/A N/A
840,588 831,900
0100,000200,000300,000400,000500,000600,000700,000800,000900,000
Base Case Proposed
lb/y
r
Annual CO2 Emissions
3,325
1,225
3,291
1,212
0
500
1,000
1,500
2,000
2,500
3,000
3,500
SO2 (lb/yr) NOX (lb/yr)
g/yr
Annual SO2 and NOX EmissionsBase Case
Proposed
2,158 2,135
0
500
1,000
1,500
2,000
2,500
Base Case Proposed
MBt
u/yr
Annual Total Energy Use
Issued February 1, 2011 28 New Hotels Energy Analysis - Green Engage/Solutions

Additional Capital CostHVAC Plant First Cost Reductions
Cooling Plant Savings ($450/ton)Heating Plant Savings ($7 55/MBh) $365
Galstherms
($12,650)Capital Costs Savings Summary
ResourceAnnual Resource Savings
(+) / Loss (-)Annual Savings (+) /
Loss (-)
$2,240$0
kWh
N/AN/A
$0.0965
Water & sewerNatural gasElectricity
00
6,535 $631Unit Cost
Annual Resource Cost Summary
$0$0
$0$0$0
Yr.
Financial Table
Initial Annual Savings
Initial Marginal Cost
Financial Results Summary
$724$699
$653$676
$699$676$653
N/A
6 $2,835
$0
$749$7244
32
Savings (+) / Loss (-)
48
Costs (Marginal/Maint/
Replace)Cash Flow
$775 $775
$0$749
$653
65
MBhtons
$2,24010 $0 Simple Payback
First Year Yield On Marginal Cost
IRR
Immediate
N/A
($2,240)
Building Envelope
Individual Resource Calculations New Hotels Hot-Humid
B-3 Optimize Building Insulation
Heating Plant Savings ($7.55/MBh)Airside Distribution Savings ($3.5/cfm)
Total Additional Capital Cost:
Estimated Useful Life (yrs)Percent replacedReplacement Cost
Base YearValuation TypeProject Analysis PeriodDiscount Rate for Defined ValuationEnergy Escalation Rate (Nominal)
$365$0$0 NPV
$921
Defined20
2008
0%$0
3,340 $11,69048
$0
$0
$0
$0
$0$0
$0
$0109
3.50%6.00% $1,212$1,212$0
201918171615
$0 $1,255 $1,255
$1,171$1,132$1,094$1,057
$1,171$1,132
$0
$1,057
$953 $953
$1,021 $1,021
$0$1,094$0
$921$890$860$830
$986
$802$775
$890$860$830$802$775
$986
$11,463
$2,240
20 11
141312
Financial Analysis
876
cfmMBh
Replacement Life and Cost Summary
$0
$5,000
$10,000
$15,000
$20,000
$25,000
0 5 10 15 20
Net
Cas
h Fl
ow (E
nd o
f Yea
r)
Years
Simple Payback Graph
Issued February 1, 2011 29 New Hotels Energy Analysis - Green Engage/Solutions

N/A
1,186.6 0.0MBtu/yr
Space Heating - Elec
Space CoolingSpace Heating - Gas
Base Case Energy Use
N/A1.3%
840,588 829,757 1.3%
1,186.6
Heat RejectionPumps
M-2 Dedicated Outside Air Unit
VAV system with reheat used for all rooms. Cooling provided by water-cooled chiller with cooling tower. Electric resistance heating. Demand ventilation.
Standard ASHRAE construction for climate zone 2.
% Savings (+) / Loss (-)
SO2 (lb/yr) 3,325 3,283 1.3%NOX (lb/yr) 1,225 1,209 1.3%
Environmental Impact Analysis
CO2 (lb/yr)
Energy End-Use Benchmark Comparison
Energy End-UseLighting 0.0%
Proposed Energy Use
Savings (+) / Loss (-)
Savings (+) / Loss (-)
ProposedBase CaseEmissions
21 1%
Hot-Humid
MBtu/yr %
-5.3%
8.6%N/A
18 7-11.3
57.8
Mechanical
0.0 0.0 0.0 0.0%
MBtu/yr
212.2
669.7
0.4
N/A
88 7 107 4
Base Case
0.4 0.0 0.0%
Individual Resource Calculations New Hotels
Proposed ModificationsAs with Base Case, but including a dedicated outside
air unit. 223.5
611.9
HVAC Fans
840,588 829,757
500,000
1,000,000
lb/y
r
Annual CO2 Emissions
TotalBase UtilitiesReceptacles
1.3%
2,129.8 27.8 1.3%N/A N/A N/A
-21.1%N/A N/A N/AN/A
-18.788.7 107.4
Assumptions
HVAC Fans
2,157.6
N/A
N/A
840,588 829,757
0
500,000
1,000,000
Base Case Proposed
lb/y
r
Annual CO2 Emissions
3,325
1,225
3,283
1,209
0
2,000
4,000
SO2 (lb/yr) NOX (lb/yr)
g/yr
Annual SO2 and NOX EmissionsBase Case
Proposed
2,158 2,130
0
500
1,000
1,500
2,000
2,500
Base Case Proposed
MBt
u/yr
Annual Total Energy Use
Issued February 1, 2011 30 New Hotels Energy Analysis - Green Engage/Solutions

Additional Capital CostHVAC Plant First Cost Reductions
Cooling Plant Savings ($450/ton)Heating Plant Savings ($7 55/MBh)
$814
($5,708)
$966 $966
$0
($9,695)
Mechanical
$786
MBhtons
Immediate
N/A
N/A
Costs (Marginal/Maint/
Replace)Cash Flow
$902$0$872$842
Simple Payback
Annual Savings (+) / Loss (-)
54
$0
Financial Table
M-2 Dedicated Outside Air Unit
Financial Results Summary
$814
Annual Resource Cost Summary
Resource
3
$934 $934$902$872
$0
21
6
Savings (+) / Loss (-)
$5,708
Initial Annual Savings
Initial Marginal Cost
GalsthermskWh
N/AN/A
$0.0965
$0
$0$0$0
Capital Costs Savings Summary
First Year Yield On Marginal Cost
IRR
Water & sewerNatural gasElectricity
00
8,147
0 $0$814
Individual Resource Calculations New Hotels Hot-Humid
-12 ($5,490)121 $911
Annual Resource Savings (+) / Loss (-)
Yr.Unit Cost
$842
$5,708
Heating Plant Savings ($7.55/MBh)Airside Distribution Savings ($3.5/cfm)
Total Additional Capital Cost:
Estimated Useful Life (yrs)Percent replacedReplacement Cost
Base YearValuation TypeProject Analysis PeriodDiscount Rate for Defined ValuationEnergy Escalation Rate (Nominal)
$1,460$1,411
$1,317
$1,230
NPV $17,040
$0
$0
$1,460$1,411
$966
$1,148$1,109$1,072$1,035$1,000$966
3.50%6.00%
201918171615
$0 $1,564 $1,564$0 $1,512$1,512$0
$1,363$1,363$0Defined
20
2008
0%$0
5,709 $19,982
Financial Analysis
Replacement Life and Cost Summary
$5,708
20
cfmMBh
11
141312 $1,188 $1,188
$1,273 $1,273
$0
$0$0
$0
$0
$1,148
$1,317
$1,230
$0$0
$1,109$1,072$1,035$0
$0
$1,000
109876121 $911
$0
$5,000
$10,000
$15,000
$20,000
$25,000
$30,000
$35,000
0 5 10 15 20
Net
Cas
h Fl
ow (E
nd o
f Yea
r)
Years
Simple Payback Graph
Issued February 1, 2011 31 New Hotels Energy Analysis - Green Engage/Solutions

VAV system with reheat used for all rooms. Cooling provided by water-cooled chiller with cooling tower.
Gas-fired boilers provide heating. No demand ventilation. Standard ASHRAE construction for climate
zone 2.
13.2%
% Savings (+) / Loss (-)Proposed
N/A
1,186.6 0.0MBtu/yr MBtu/yr %
1,186.6
968,180 840,588 13.2%
Heat RejectionPumpsSpace CoolingSpace Heating - Gas
Savings (+) / Loss (-)
Base CaseEmissions
M-2 Improved Ventilation Air Delivery: Demand Ventilation
Proposed ModificationsAs with Base Case, but with demand ventilation.
1,225 13.2%
Environmental Impact AnalysisEnergy End-Use Benchmark Comparison
Energy End-UseLighting
897.0 25.3%
94 7 88 7 6 0
669.7 227.3
0.4 15.10.0%
291.3
CO2 (lb/yr)SO2 (lb/yr) 3,830 3,325 13.2%NOX (lb/yr) 1,410
97.4%
27.2%
15.5
N/A N/A
Proposed Energy Use
Savings (+) / Loss (-)
6 3%
Base Case
N/A
Base Case Energy Use
HVAC Fans
Space Heating - Elec
Individual Resource Calculations New Hotels Hot-Humid
Mechanical
0.0 0.0 0.0 0.0%
MBtu/yr
212.2 79.1968,180
840,5881,000,000
1,500,000
lb/y
r
Annual CO2 Emissions
13.2%
N/AAssumptions
TotalBase UtilitiesReceptacles
2,485.1 2,157.6 327.5 13.2%N/A N/A N/A
94.7 88.7 6.0N/A N/A
6.3%HVAC FansN/A N/A
N/A
968,180840,588
0
500,000
1,000,000
1,500,000
Base Case Proposed
lb/y
r
Annual CO2 Emissions
3,830
1,410
3,325
1,225
0
2,000
4,000
6,000
SO2 (lb/yr) NOX (lb/yr)
g/yr
Annual SO2 and NOX EmissionsBase Case
Proposed2,485
2,158
0
500
1,000
1,500
2,000
2,500
3,000
Base Case Proposed
MBt
u/yr
Annual Total Energy Use
Issued February 1, 2011 32 New Hotels Energy Analysis - Green Engage/Solutions

Additional Capital CostHVAC Plant First Cost Reductions
Cooling Plant Savings ($450/ton)Heating Plant Savings ($7 55/MBh)
Annual Resource Savings (+) / Loss (-)
Yr.
Financial Table
95,981
$0$0
$0$0
GalsthermskWh
N/AN/A
$0.0965Savings (+) /
Loss (-)
Costs (Marginal/Maint/
Replace)
Initial Marginal Cost
Financial Results Summary
Capital Costs Savings Summary
MBhtons
1 $9,586$0
$00 $1353
Annual Resource Cost Summary
Resource
Water & sewerNatural gasElectricity
0
Unit Cost
$0 $0
M-2
$11 38665
($41,802)
Improved Ventilation Air Delivery: Demand Ventilation
$9,586Initial Annual Savings
First Year Yield On Marginal Cost
Cash Flow
$11 386$11,001$10,629$10,269
$9,586$9,922
($41,802) 4.2 yrs
22.9%
26.0%
$24
($42,000) $10,26934
$11,001$10,629
IRR$9,922
Simple Payback
2
0
Individual Resource Calculations New Hotels Hot-Humid
$41,802
Mechanical
0 $0$9,262
Annual Savings (+) / Loss (-)
Heating Plant Savings ($7.55/MBh)Airside Distribution Savings ($3.5/cfm)
Total Additional Capital Cost:
Estimated Useful Life (yrs)Percent replacedReplacement Cost
Base YearValuation TypeProject Analysis PeriodDiscount Rate for Defined ValuationEnergy Escalation Rate (Nominal)
$0$0 NPV
cfmMBh
$0
$11,784
3.50%6.00% $17,806
$17,204$17,806
2019
$0 $18,430 $18,430
$17,204$0
Defined20
2008
0%$0
11 $393
181716
$0
$0
$13,99620
$11,386
876
$13,522$13,065
$0$16,060$0
$0
$0$14,486
9
$13,522$13,996
$14,993
$16,623
$0
$16,060$15,517$15,517
$14,486
$16,623
$97,874
$13,065$12,623$12,196$11,784$11,386
15
11
141312
$24
Financial Analysis
Replacement Life and Cost Summary$12,623$12,196$0
$0
$14,993
$010
($41,802)
($100,000)
($50,000)
$0
$50,000
$100,000
$150,000
$200,000
$250,000
0 5 10 15 20
Net
Cas
h Fl
ow (E
nd o
f Yea
r)
Years
Simple Payback Graph
Issued February 1, 2011 33 New Hotels Energy Analysis - Green Engage/Solutions

VAV system with reheat used for all rooms. Cooling provided by water-cooled chiller with cooling tower. Electric resistance heating. Demand ventilation.
Standard ASHRAE construction for climate zone 2.
2.3%
% Savings (+) / Loss (-)Proposed
N/A
1,186.6 0.0MBtu/yr MBtu/yr %
1,186.6
840,588 821,303 2.3%
Heat RejectionPumpsSpace CoolingSpace Heating - Gas
Savings (+) / Loss (-)
Base CaseEmissions
M-3 Heat Recovery
Proposed ModificationsAs with Base Case, but including a dedicated outside
air unit and a ventilation heat recovery unit.
1,196 2.3%
Environmental Impact AnalysisEnergy End-Use Benchmark Comparison
Energy End-UseLighting
669.7 12.0%
88 7 115 4 26 7
589.2 80.5
0.2 0.20.0%
212.2
CO2 (lb/yr)SO2 (lb/yr) 3,325 3,249 2.3%NOX (lb/yr) 1,225
50.0%
-2.1%
0.4
N/A N/A
Proposed Energy Use
Savings (+) / Loss (-)
30 1%
Base Case
N/A
Base Case Energy Use
HVAC Fans
Space Heating - Elec
Individual Resource Calculations New Hotels Hot-Humid
Mechanical
0.0 0.0 0.0 0.0%
MBtu/yr
216.7 -4.5
840,588 821,303
500,000
1,000,000
lb/y
r
Annual CO2 Emissions
2.3%
N/AAssumptions
TotalBase UtilitiesReceptacles
2,157.6 2,108.1 49.5 2.3%N/A N/A N/A
88.7 115.4 -26.7N/A N/A
-30.1%HVAC FansN/A N/A
N/A
840,588 821,303
0
500,000
1,000,000
Base Case Proposed
lb/y
r
Annual CO2 Emissions
3,325
1,225
3,249
1,196
0
2,000
4,000
SO2 (lb/yr) NOX (lb/yr)
g/yr
Annual SO2 and NOX EmissionsBase Case
Proposed
2,158 2,108
0
500
1,000
1,500
2,000
2,500
Base Case Proposed
MBt
u/yr
Annual Total Energy Use
Issued February 1, 2011 34 New Hotels Energy Analysis - Green Engage/Solutions

Additional Capital CostHVAC Plant First Cost Reductions
Cooling Plant Savings ($450/ton)Heating Plant Savings ($7 55/MBh)
Annual Resource Savings (+) / Loss (-)
Yr.
Financial Table
14,507
$0$0
$0$0
GalsthermskWh
N/AN/A
$0.0965Savings (+) /
Loss (-)
Costs (Marginal/Maint/
Replace)
Initial Marginal Cost
Financial Results Summary
Capital Costs Savings Summary
MBhtons
1 $1,449$0
$0-7 ($3,015)
166
Annual Resource Cost Summary
Resource
Water & sewerNatural gasElectricity
0
Unit Cost
$0 $0
M-3
$1 72165
($40,597)
Heat Recovery
$1,449Initial Annual Savings
First Year Yield On Marginal Cost
Cash Flow
$1 721$1,663$1,606$1,552
$1,449$1,500
($40,597) 20 yrs
3.6%
0.1%
$1 254
($64,337) $1,55234
$1,663$1,606
IRR$1,500
Simple Payback
2
0
Individual Resource Calculations New Hotels Hot-Humid
$40,597
Mechanical
0 $0$1,400
Annual Savings (+) / Loss (-)
Heating Plant Savings ($7.55/MBh)Airside Distribution Savings ($3.5/cfm)
Total Additional Capital Cost:
Estimated Useful Life (yrs)Percent replacedReplacement Cost
Base YearValuation TypeProject Analysis PeriodDiscount Rate for Defined ValuationEnergy Escalation Rate (Nominal)
$0$0 NPV
cfmMBh
$0
$1,781
3.50%6.00% $2,691
$2,600$2,691
2019
$0 $2,786 $2,786
$2,600$0
Defined20
2008
0%$0
7,286 $25,501166
181716
$0
$0
$2,11520
$1,721
876
$2,044$1,975
$0$2,427$0
$0
$0$2,189
9
$2,044$2,115
$2,266
$2,512
$0
$2,427$2,345$2,345
$2,189
$2,512
-$17,545
$1,975$1,908$1,843$1,781$1,721
15
11
141312
$1,254
Financial Analysis
Replacement Life and Cost Summary$1,908$1,843$0
$0
$2,266
$010
($40,597)
($45,000)($40,000)($35,000)($30,000)($25,000)($20,000)($15,000)($10,000)($5,000)
$0 $5,000
0 5 10 15 20
Net
Cas
h Fl
ow (E
nd o
f Yea
r)
Years
Simple Payback Graph
Issued February 1, 2011 35 New Hotels Energy Analysis - Green Engage/Solutions

VAV system with reheat used for all rooms. Cooling provided by water-cooled chiller with cooling tower. Electric resistance heating. Demand ventilation.
Standard ASHRAE construction for climate zone 2.
0.1%
% Savings (+) / Loss (-)Proposed
N/A
1,186.6 0.0MBtu/yr MBtu/yr %
1,186.6
840,588 839,848 0.1%
Heat RejectionPumpsSpace CoolingSpace Heating - Gas
Savings (+) / Loss (-)
Base CaseEmissions
M-4 Economizer Modes
Proposed ModificationsAs with Base Case, but with an enthalpy economizer.
1,223 0.1%
Environmental Impact AnalysisEnergy End-Use Benchmark Comparison
Energy End-UseLighting
669.7 0.3%
88 7 88 7 0 0
667.8 1.9
0.4 0.00.0%
212.2
CO2 (lb/yr)SO2 (lb/yr) 3,325 3,322 0.1%NOX (lb/yr) 1,225
0.0%
0.0%
0.4
N/A N/A
Proposed Energy Use
Savings (+) / Loss (-)
0 0%
Base Case
N/A
Base Case Energy Use
HVAC Fans
Space Heating - Elec
Individual Resource Calculations New Hotels Hot-Humid
Mechanical
0.0 0.0 0.0 0.0%
MBtu/yr
212.2 0.0
840,588 839,848
500,000
1,000,000
lb/y
r
Annual CO2 Emissions
0.1%
N/AAssumptions
TotalBase UtilitiesReceptacles
2,157.6 2,155.7 1.9 0.1%N/A N/A N/A
88.7 88.7 0.0N/A N/A
0.0%HVAC FansN/A N/A
N/A
840,588 839,848
0
500,000
1,000,000
Base Case Proposed
lb/y
r
Annual CO2 Emissions
3,325
1,225
3,322
1,223
0
2,000
4,000
SO2 (lb/yr) NOX (lb/yr)
g/yr
Annual SO2 and NOX EmissionsBase Case
Proposed
2,158 2,156
0
500
1,000
1,500
2,000
2,500
Base Case Proposed
MBt
u/yr
Annual Total Energy Use
Issued February 1, 2011 36 New Hotels Energy Analysis - Green Engage/Solutions

Additional Capital CostHVAC Plant First Cost Reductions
Cooling Plant Savings ($450/ton)Heating Plant Savings ($7 55/MBh)
Annual Resource Savings (+) / Loss (-)
Yr.
Financial Table
557
$0$0
$0$0
GalsthermskWh
N/AN/A
$0.0965Savings (+) /
Loss (-)
Costs (Marginal/Maint/
Replace)
Initial Marginal Cost
Financial Results Summary
Capital Costs Savings Summary
MBhtons
1 $56$0
$00 $00
Annual Resource Cost Summary
Resource
Water & sewerNatural gasElectricity
0
Unit Cost
$0 $0
M-4
$6665
($10,963)
Economizer Modes
$56Initial Annual Savings
First Year Yield On Marginal Cost
Cash Flow
$66$64$62$60
$56$58
($10,963) > 20 yrs
0.5%
N/A
$0
($10,963) $6034
$64$62
IRR$58
Simple Payback
2
0
Individual Resource Calculations New Hotels Hot-Humid
$10,963
Mechanical
0 $0$54
Annual Savings (+) / Loss (-)
Heating Plant Savings ($7.55/MBh)Airside Distribution Savings ($3.5/cfm)
Total Additional Capital Cost:
Estimated Useful Life (yrs)Percent replacedReplacement Cost
Base YearValuation TypeProject Analysis PeriodDiscount Rate for Defined ValuationEnergy Escalation Rate (Nominal)
$0$0 NPV
cfmMBh
$0
$68
3.50%6.00% $103
$100$103
2019
$0 $107 $107
$100$0
Defined20
2008
0%$0
0 $00
181716
$0
$0
$8120
$66
876
$78$76
$0$93$0
$0
$0$84
9
$78$81
$87
$96
$0
$93$90$90
$84
$96
-$9,546
$76$73$71$68$66
15
11
141312
$0
Financial Analysis
Replacement Life and Cost Summary$73$71$0
$0
$87
$010
($10,963)
($11,500)
($11,000)
($10,500)
($10,000)
($9,500)
($9,000)
($8,500)0 5 10 15 20
Net
Cas
h Fl
ow (E
nd o
f Yea
r)
Years
Simple Payback Graph
Issued February 1, 2011 37 New Hotels Energy Analysis - Green Engage/Solutions

N/A216.7N/A
M-7 Guest Room Equipment Selection: Condensor Water Heat Pump
Baseline ASHRAE HVAC system: PTAC units used for all rooms. Air-cooled unitary cooling. Electric
resistance heating. Demand ventilation. Standard ASHRAE construction for climate zone 2.
26.4%
% Savings (+) / Loss (-)Proposed
Heat RejectionPumpsSpace CoolingSpace Heating - Gas
Mechanical
0.0 0.0%
MBtu/yr
-61.7 -39.8%155.0
26.4%NOX (lb/yr) 1,804
1,153.2
0.3
Proposed ModificationsPTACs replaced by heat pumps. Condenser water
cooling. Electric resistance heating. Demand ventilation. Identical construction to Base Case. 683 9 126 7 557 2
29.8%
HVAC Fans
MBtu/yr MBtu/yr %1,186.6
0.0 0.0
1,186.6 0.0
Energy End-Use Benchmark Comparison
Energy End-UseLighting
N/A809.0 344.2
0.0%Space Heating - Elec 0.8 -0.5 -166.7%
81 5%
Base Case
N/A
Base Case Energy Use
Proposed Energy Use
Savings (+) / Loss (-)
Savings (+) / Loss (-) CO2 (lb/yr) 1,238,519
Individual Resource Calculations New Hotels Hot-Humid
Environmental Impact Analysis
4,900 3,6061,328 26.4%
SO2 (lb/yr)
Base CaseEmissions
911,572 26.4%
1,238,519
911,572
600,000
800,000
1,000,000
1,200,000
1,400,000
lb/y
r
Annual CO2 Emissions
N/A
N/A N/A
26.4%
ventilation. Identical construction to Base Case.
Assumptions
683.9 126.7 557.2HVAC Fans
3,179.0 2,339.8 839.2 26.4%N/A N/A N/A N/A
81.5%N/A N/A
TotalBase UtilitiesReceptacles
1,238,519
911,572
0
200,000
400,000
600,000
800,000
1,000,000
1,200,000
1,400,000
Base Case Proposed
lb/y
r
Annual CO2 Emissions
4,900
1,804
3,606
1,328
0
1,000
2,000
3,000
4,000
5,000
6,000
SO2 (lb/yr) NOX (lb/yr)
g/yr
Annual SO2 and NOX EmissionsBase Case
Proposed
3,179
2,340
0
500
1,000
1,500
2,000
2,500
3,000
3,500
Base Case Proposed
MBt
u/yr
Annual Total Energy Use
Issued February 1, 2011 38 New Hotels Energy Analysis - Green Engage/Solutions

Additional Capital CostHVAC Plant First Cost Reductions
Cooling Plant Savings ($450/ton)Heating Plant Savings ($7 55/MBh)
Annual Resource Savings (+) / Loss (-)
Financial Table
($145,387)$0
M-7 Guest Room Equipment Selection: Condensor Water Heat Pump
Initial Annual Savings
Annual Resource Cost Summary
Resource$23,734
Annual Savings (+) / Loss (-)Unit Cost
Yr.Initial Marginal Cost
Financial Results Summary
$145,387
$0$0$0
First Year Yield On Marginal Cost
IRR
$29 175$0
43
Water & sewerNatural gasElectricity
2
$29 175
$0
00
6
0
245,945
($145,400)
$0
MBh
$0.0965
$28,188$27,235
tons
Capital Costs Savings Summary1
5
GalsthermskWh
N/AN/A
Mechanical
0
5.5 yrs
16.9%
19.4%
$24,564
Simple Payback
$26,314
$24,564$25,424
Savings (+) / Loss (-)
Costs (Marginal/Maint/
Replace)Cash Flow
$28,188$27,235
$20 $0 $0
($145,387)
$26,314
$24,564$0
$25,424
Individual Resource Calculations New Hotels Hot-Humid
Heating Plant Savings ($7.55/MBh)Airside Distribution Savings ($3.5/cfm)
Total Additional Capital Cost:
Estimated Useful Life (yrs)Percent replacedReplacement Cost
Base YearValuation TypeProject Analysis PeriodDiscount Rate for Defined ValuationEnergy Escalation Rate (Nominal)
NPV$30,196$29,175
$0$0 $29,175
$33,479109876
($145,387)cfmMBh
$37,118$35,863 $35,863
$38,418 $38,418
$34,651
3.50%6.00%
Defined20
2008
0%$0
3 $110
2019181716
$0 $47,225 $47,225$45,628$44,085$42,594$41,154
$45,628$44,085$42,594
$0$0
$0
$0 $39,762$39,762
$214,692
$0
$0$37,118$0
$0
$0
$34,65120
$41,154$0
$33,479$32,347$31,253$30,196
15
11
141312
$2
Financial Analysis
Replacement Life and Cost Summary$32,347$31,253$0
$0
($200,000)($100,000)
$0 $100,000 $200,000 $300,000 $400,000 $500,000 $600,000
0 5 10 15 20
Net
Cas
h Fl
ow (E
nd o
f Yea
r)
Years
Simple Payback Graph
Issued February 1, 2011 39 New Hotels Energy Analysis - Green Engage/Solutions

N/A211.2N/A
M-7 Guest Room Equipment Selection: Fan Coil Units
Baseline ASHRAE HVAC system: PTAC units used for all rooms. Air-cooled unitary cooling. Electric
resistance heating. Demand ventilation. Standard ASHRAE construction for climate zone 2.
19.5%
% Savings (+) / Loss (-)Proposed
Heat RejectionPumpsSpace CoolingSpace Heating - Gas
Mechanical
0.0 0.0%
MBtu/yr
-56.2 -36.3%155.0
19.5%NOX (lb/yr) 1,804
1,153.2
0.3
Proposed ModificationsPTACs replaced by fan coil units. Water-cooled chiller
cooling. Electric resistance heating. Demand ventilation. Identical construction to Base Case. 683 9 586 2 97 7
50.3%
HVAC Fans
MBtu/yr MBtu/yr %1,186.6
0.0 0.0
1,186.6 0.0
Energy End-Use Benchmark Comparison
Energy End-UseLighting
N/A573.6 579.6
0.0%Space Heating - Elec 0.3 0.0 0.0%
14 3%
Base Case
N/A
Base Case Energy Use
Proposed Energy Use
Savings (+) / Loss (-)
Savings (+) / Loss (-) CO2 (lb/yr) 1,238,519
Individual Resource Calculations New Hotels Hot-Humid
Environmental Impact Analysis
4,900 3,9421,452 19.5%
SO2 (lb/yr)
Base CaseEmissions
996,543 19.5%
1,238,519
996,543
600,000
800,000
1,000,000
1,200,000
1,400,000
lb/y
r
Annual CO2 Emissions
N/A
N/A N/A
19.5%
ventilation. Identical construction to Base Case.
Assumptions
683.9 586.2 97.7HVAC Fans
3,179.0 2,557.9 621.1 19.5%N/A N/A N/A N/A
14.3%N/A N/A
TotalBase UtilitiesReceptacles
1,238,519
996,543
0
200,000
400,000
600,000
800,000
1,000,000
1,200,000
1,400,000
Base Case Proposed
lb/y
r
Annual CO2 Emissions
4,900
1,804
3,942
1,452
0
1,000
2,000
3,000
4,000
5,000
6,000
SO2 (lb/yr) NOX (lb/yr)
g/yr
Annual SO2 and NOX EmissionsBase Case
Proposed
3,179
2,558
0
500
1,000
1,500
2,000
2,500
3,000
3,500
Base Case Proposed
MBt
u/yr
Annual Total Energy Use
Issued February 1, 2011 40 New Hotels Energy Analysis - Green Engage/Solutions

Additional Capital CostHVAC Plant First Cost Reductions
Cooling Plant Savings ($450/ton)Heating Plant Savings ($7 55/MBh)
Annual Resource Savings (+) / Loss (-)
Financial Table
($133,667)$0
M-7 Guest Room Equipment Selection: Fan Coil Units
Initial Annual Savings
Annual Resource Cost Summary
Resource$17,566
Annual Savings (+) / Loss (-)Unit Cost
Yr.Initial Marginal Cost
Financial Results Summary
$133,667
$0$0$0
First Year Yield On Marginal Cost
IRR
$21 593$0
43
Water & sewerNatural gasElectricity
2
$21 593
$0
00
6
0
182,026
($133,680)
$0
MBh
$0.0965
$20,862$20,157
tons
Capital Costs Savings Summary1
5
GalsthermskWh
N/AN/A
Mechanical
0
6.7 yrs
13.6%
15.6%
$18,180
Simple Payback
$19,475
$18,180$18,817
Savings (+) / Loss (-)
Costs (Marginal/Maint/
Replace)Cash Flow
$20,862$20,157
$20 $0 $0
($133,667)
$19,475
$18,180$0
$18,817
Individual Resource Calculations New Hotels Hot-Humid
Heating Plant Savings ($7.55/MBh)Airside Distribution Savings ($3.5/cfm)
Total Additional Capital Cost:
Estimated Useful Life (yrs)Percent replacedReplacement Cost
Base YearValuation TypeProject Analysis PeriodDiscount Rate for Defined ValuationEnergy Escalation Rate (Nominal)
NPV$22,348$21,593
$0$0 $21,593
$24,778109876
($133,667)cfmMBh
$27,472$26,543 $26,543
$28,433 $28,433
$25,645
3.50%6.00%
Defined20
2008
0%$0
3 $110
2019181716
$0 $34,952 $34,952$33,770$32,628$31,524$30,458
$33,770$32,628$31,524
$0$0
$0
$0 $29,428$29,428
$134,306
$0
$0$27,472$0
$0
$0
$25,64520
$30,458$0
$24,778$23,940$23,130$22,348
15
11
141312
$2
Financial Analysis
Replacement Life and Cost Summary$23,940$23,130$0
$0
($200,000)
($100,000)
$0
$100,000
$200,000
$300,000
$400,000
$500,000
0 5 10 15 20
Net
Cas
h Fl
ow (E
nd o
f Yea
r)
Years
Simple Payback Graph
Issued February 1, 2011 41 New Hotels Energy Analysis - Green Engage/Solutions

N/A123.9N/A
M-7 Guest Room Equipment Selection: Air Cooled VAV
Baseline ASHRAE HVAC system: Air-cooled PTAC units used for all rooms. Electric resistance heating.
Demand ventilation. Standard ASHRAE construction for climate zone 2.
23.1%
% Savings (+) / Loss (-)Proposed
Heat RejectionPumpsSpace CoolingSpace Heating - Gas
Mechanical
0.0 0.0%
MBtu/yr
31.1 20.1%155.0
23.1%NOX (lb/yr) 1,804
1,153.2
0.3
Proposed ModificationsPTACs replaced by a VAV system. Air-cooled chiller
cooling. Electric resistance heating. Demand ventilation. Identical construction to Base Case. 683 9 88 7 595 2
9.4%
HVAC Fans
MBtu/yr MBtu/yr %1,186.6
0.0 0.0
1,186.6 0.0
Energy End-Use Benchmark Comparison
Energy End-UseLighting
N/A1,045.1 108.1
0.0%Space Heating - Elec 0.4 -0.1 -33.3%
87 0%
Base Case
N/A
Base Case Energy Use
Proposed Energy Use
Savings (+) / Loss (-)
Savings (+) / Loss (-) CO2 (lb/yr) 1,238,519
Individual Resource Calculations New Hotels Hot-Humid
Environmental Impact Analysis
4,900 3,7681,388 23.1%
SO2 (lb/yr)
Base CaseEmissions
952,441 23.1%
1,238,519
952,4411,000,000
1,500,000
lb/y
r
Annual CO2 Emissions
N/A
N/A N/A
23.1%
ventilation. Identical construction to Base Case.
Assumptions
683.9 88.7 595.2HVAC Fans
3,179.0 2,444.7 734.3 23.1%N/A N/A N/A N/A
87.0%N/A N/A
TotalBase UtilitiesReceptacles
1,238,519
952,441
0
500,000
1,000,000
1,500,000
Base Case Proposed
lb/y
r
Annual CO2 Emissions
4,900
1,804
3,768
1,388
0
2,000
4,000
6,000
SO2 (lb/yr) NOX (lb/yr)
g/yr
Annual SO2 and NOX EmissionsBase Case
Proposed
3,179
2,445
0
500
1,000
1,500
2,000
2,500
3,000
3,500
Base Case Proposed
MBt
u/yr
Annual Total Energy Use
Issued February 1, 2011 42 New Hotels Energy Analysis - Green Engage/Solutions
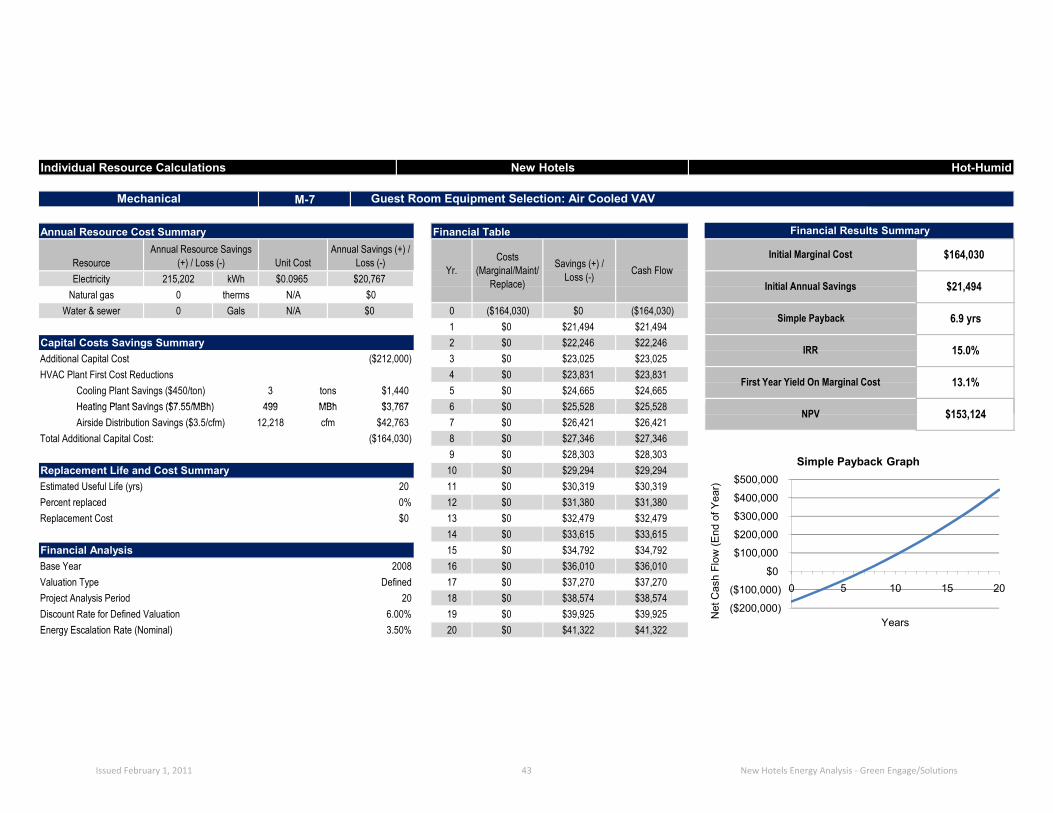
Additional Capital CostHVAC Plant First Cost Reductions
Cooling Plant Savings ($450/ton)Heating Plant Savings ($7 55/MBh)
Annual Resource Savings (+) / Loss (-)
Financial Table
($164,030)$0
M-7 Guest Room Equipment Selection: Air Cooled VAV
Initial Annual Savings
Annual Resource Cost Summary
Resource$20,767
Annual Savings (+) / Loss (-)Unit Cost
Yr.Initial Marginal Cost
Financial Results Summary
$164,030
$0$0$0
First Year Yield On Marginal Cost
IRR
$25 528$0
43
Water & sewerNatural gasElectricity
2
$25 528
$0
00
6
0
215,202
($212,000)
$0
MBh
$0.0965
$24,665$23,831
tons
Capital Costs Savings Summary1
5
GalsthermskWh
N/AN/A
Mechanical
499
6.9 yrs
13.1%
15.0%
$21,494
Simple Payback
$23,025
$21,494$22,246
Savings (+) / Loss (-)
Costs (Marginal/Maint/
Replace)Cash Flow
$24,665$23,831
$3 7673 $1,440 $0
($164,030)
$23,025
$21,494$0
$22,246
Individual Resource Calculations New Hotels Hot-Humid
Heating Plant Savings ($7.55/MBh)Airside Distribution Savings ($3.5/cfm)
Total Additional Capital Cost:
Estimated Useful Life (yrs)Percent replacedReplacement Cost
Base YearValuation TypeProject Analysis PeriodDiscount Rate for Defined ValuationEnergy Escalation Rate (Nominal)
NPV$26,421$25,528
$0$0 $25,528
$29,294109876
($164,030)cfmMBh
$32,479$31,380 $31,380
$33,615 $33,615
$30,319
3.50%6.00%
Defined20
2008
0%$0
12,218 $42,763499
2019181716
$0 $41,322 $41,322$39,925$38,574$37,270$36,010
$39,925$38,574$37,270
$0$0
$0
$0 $34,792$34,792
$153,124
$0
$0$32,479$0
$0
$0
$30,31920
$36,010$0
$29,294$28,303$27,346$26,421
15
11
141312
$3,767
Financial Analysis
Replacement Life and Cost Summary$28,303$27,346$0
$0
($200,000)
($100,000)
$0
$100,000
$200,000
$300,000
$400,000
$500,000
0 5 10 15 20
Net
Cas
h Fl
ow (E
nd o
f Yea
r)
Years
Simple Payback Graph
Issued February 1, 2011 43 New Hotels Energy Analysis - Green Engage/Solutions
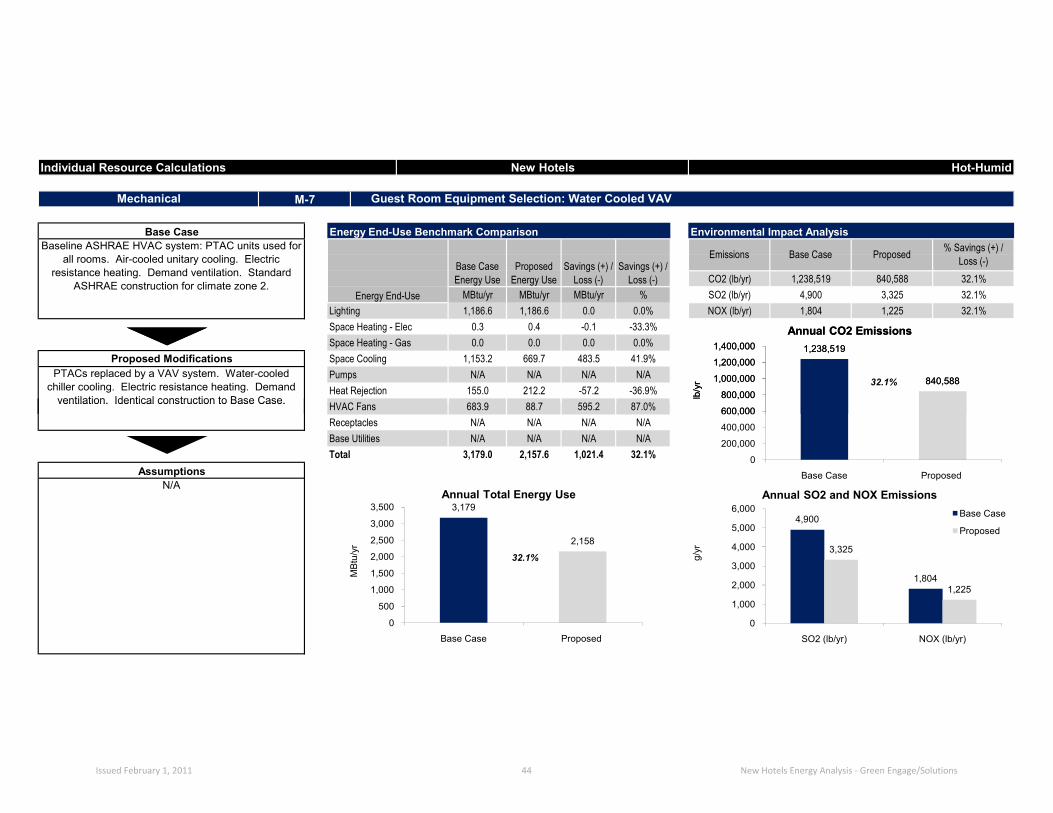
M-7 Guest Room Equipment Selection: Water Cooled VAV
Baseline ASHRAE HVAC system: PTAC units used for all rooms. Air-cooled unitary cooling. Electric
resistance heating. Demand ventilation. Standard ASHRAE construction for climate zone 2.
32.1%
0.0%
Environmental Impact Analysis
N/A N/A
683 9 88 7 595 2
669.7 483.5 41.9%
0.4
SO2 (lb/yr) 4,900 3,325 32.1%NOX (lb/yr) 1,804 1,225 32.1%
CO2 (lb/yr) 1,238,519 840,588 32.1%
212.2 -57.2 -36.9%155.0HVAC Fans
PTACs replaced by a VAV system. Water-cooled chiller cooling. Electric resistance heating. Demand
ventilation. Identical construction to Base Case.
Mechanical
0.0 0.0 0.0
1,186.6 0.0MBtu/yrMBtu/yr MBtu/yr %
1,186.6
Heat RejectionPumps N/A
Individual Resource Calculations New Hotels Hot-Humid
Space Heating - Elec -0.1 -33.3%
87 0%
Proposed Modifications
Base Case
N/A
Base Case Energy Use
Proposed Energy Use
Savings (+) / Loss (-)
Savings (+) / Loss (-)
Energy End-Use Benchmark Comparison
Energy End-UseLighting 0.0%
Space CoolingSpace Heating - Gas
1,153.2
0.3
% Savings (+) / Loss (-)ProposedBase CaseEmissions
1,238,519
840,588
600,000
800,000
1,000,000
1,200,000
1,400,000
lb/y
r
Annual CO2 Emissions
3,179.0 2,157.6 1,021.4N/A N/A
683.9 88.7 595.2
32.1%
HVAC FansN/A N/A N/A
ventilation. Identical construction to Base Case.
N/A
N/A32.1%
N/A
87.0%N/A
AssumptionsTotalBase UtilitiesReceptacles
1,238,519
840,588
0
200,000
400,000
600,000
800,000
1,000,000
1,200,000
1,400,000
Base Case Proposed
lb/y
r
Annual CO2 Emissions
4,900
1,804
3,325
1,225
0
1,000
2,000
3,000
4,000
5,000
6,000
SO2 (lb/yr) NOX (lb/yr)
g/yr
Annual SO2 and NOX EmissionsBase Case
Proposed
3,179
2,158
0
500
1,000
1,500
2,000
2,500
3,000
3,500
Base Case Proposed
MBt
u/yr
Annual Total Energy Use
Issued February 1, 2011 44 New Hotels Energy Analysis - Green Engage/Solutions

Additional Capital CostHVAC Plant First Cost Reductions
Cooling Plant Savings ($450/ton)Heating Plant Savings ($7 55/MBh)
N/AN/A
$0.0965Unit Cost
Annual Resource Savings (+) / Loss (-)
Natural gasElectricity
00
MBhtons
432
Yr.
Financial Table Financial Results Summary
$28,887
0
$0
Initial Annual Savings
$0$0$0
Capital Costs Savings Summary
($166,670)1
Initial Marginal Cost
GalsthermskWh
$35 509$0
$32,027$30,944
$34,308$33,148$32,027
$29,898$30,944
Guest Room Equipment Selection: Water Cooled VAV
65
$29,898
Annual Resource Cost Summary
Resource
Water & sewer
Savings (+) / Loss (-)299,343
New Hotels
Mechanical
Individual Resource Calculations Hot-Humid
Annual Savings (+) / Loss (-)
5.2 yrs
17.9%
20.6%
3499 $3 767
Costs (Marginal/Maint/
Replace)Cash Flow
$35 509$0$34,308$33,148
$29,898
$166,670
$1,440
($214,640)
($166,670)
First Year Yield On Marginal Cost
IRR
$0 $0 Simple Payback
$0
M-7
Heating Plant Savings ($7.55/MBh)Airside Distribution Savings ($3.5/cfm)
Total Additional Capital Cost:
Estimated Useful Life (yrs)Percent replacedReplacement Cost
Base YearValuation TypeProject Analysis PeriodDiscount Rate for Defined ValuationEnergy Escalation Rate (Nominal)
NPVcfmMBh
$40,747$39,369$38,038$36,752$35,5096
3.50%6.00%
Defined20
2008
0%$0
12,218 $42,763499 $3,767
Financial Analysis
Replacement Life and Cost Summary
$0
$55,534$53,657$51,842$50,089$48,395
$55,534$53,657$51,842
$39,369$38,038$0
$0
$36,752
201918171615
$0 $57,478 $57,478$0
$50,089
$35,509$0$0
$0
$0$45,177$0
$0
$0
$0
11
141312
$0
$0
$42,174
$48,395
$45,177
$42,174
$271,005
($166,670)
20 $43,650 $43,650
$46,759 $46,759
$40,74710987
($300,000)($200,000)($100,000)
$0 $100,000 $200,000 $300,000 $400,000 $500,000 $600,000 $700,000 $800,000
0 5 10 15 20
Net
Cas
h Fl
ow (E
nd o
f Yea
r)
Years
Simple Payback Graph
Issued February 1, 2011 45 New Hotels Energy Analysis - Green Engage/Solutions

M-9 Variable Frequency Drives
VAV system with reheat used for all rooms. Cooling provided by water-cooled chiller with cooling tower. Electric resistance heating. Demand ventilation.
Standard ASHRAE construction for climate zone 2.
2.1%
0.0%
Environmental Impact Analysis
N/A N/A
88 7 44 0 44 7
669.7 0.0 0.0%
0.4
SO2 (lb/yr) 3,325 3,256 2.1%NOX (lb/yr) 1,225 1,199 2.1%
CO2 (lb/yr) 840,588 823,173 2.1%
212.2 0.0 0.0%212.2HVAC Fans
As with Base Case, but with variable frequency drives (VFDs) used in VAV system.
Mechanical
0.0 0.0 0.0
1,186.6 0.0MBtu/yrMBtu/yr MBtu/yr %
1,186.6
Heat RejectionPumps N/A
Individual Resource Calculations New Hotels Hot-Humid
Space Heating - Elec 0.0 0.0%
50 4%
Proposed Modifications
Base Case
N/A
Base Case Energy Use
Proposed Energy Use
Savings (+) / Loss (-)
Savings (+) / Loss (-)
Energy End-Use Benchmark Comparison
Energy End-UseLighting 0.0%
Space CoolingSpace Heating - Gas
669.7
0.4
% Savings (+) / Loss (-)ProposedBase CaseEmissions
840,588 823,173
400,000500,000600,000700,000800,000900,000
lb/y
r
Annual CO2 Emissions
2,157.6 2,112.9 44.7N/A N/A
88.7 44.0 44.7
2.1%
HVAC FansN/A N/A N/A
N/A
N/A2.1%N/A
50.4%N/A
AssumptionsTotalBase UtilitiesReceptacles
840,588 823,173
0100,000200,000300,000400,000500,000600,000700,000800,000900,000
Base Case Proposed
lb/y
r
Annual CO2 Emissions
3,325
1,225
3,256
1,199
0
500
1,000
1,500
2,000
2,500
3,000
3,500
SO2 (lb/yr) NOX (lb/yr)
g/yr
Annual SO2 and NOX EmissionsBase Case
Proposed
2,158 2,113
0
500
1,000
1,500
2,000
2,500
Base Case Proposed
MBt
u/yr
Annual Total Energy Use
Issued February 1, 2011 46 New Hotels Energy Analysis - Green Engage/Solutions

Additional Capital CostHVAC Plant First Cost Reductions
Cooling Plant Savings ($450/ton)Heating Plant Savings ($7 55/MBh)
N/AN/A
$0.0965Unit Cost
Annual Resource Savings (+) / Loss (-)
Natural gasElectricity
00
MBhtons
432
Yr.
Financial Table Financial Results Summary
$1,264
0
$0
Initial Annual Savings
$0$0$0
Capital Costs Savings Summary
($4,945)1
Initial Marginal Cost
GalsthermskWh
$1 554$0
$1,402$1,354
$1,501$1,451$1,402
$1,308$1,354
Variable Frequency Drives
65
$1,308
Annual Resource Cost Summary
Resource
Water & sewer
Savings (+) / Loss (-)13,100
New Hotels
Mechanical
Individual Resource Calculations Hot-Humid
Annual Savings (+) / Loss (-)
3.7 yrs
26.5%
29.7%
00 $0
Costs (Marginal/Maint/
Replace)Cash Flow
$1 554$0$1,501$1,451
$1,308
$4,945
$0
($4,945)
($4,945)
First Year Yield On Marginal Cost
IRR
$0 $0 Simple Payback
$0
M-9
Heating Plant Savings ($7.55/MBh)Airside Distribution Savings ($3.5/cfm)
Total Additional Capital Cost:
Estimated Useful Life (yrs)Percent replacedReplacement Cost
Base YearValuation TypeProject Analysis PeriodDiscount Rate for Defined ValuationEnergy Escalation Rate (Nominal)
NPVcfmMBh
$1,783$1,723$1,665$1,608$1,5546
3.50%6.00%
Defined20
2008
0%$0
0 $00 $0
Financial Analysis
Replacement Life and Cost Summary
$0
$2,430$2,348$2,269$2,192$2,118
$2,430$2,348$2,269
$1,723$1,665$0
$0
$1,608
201918171615
$0 $2,515 $2,515$0
$2,192
$1,554$0$0
$0
$0$1,977$0
$0
$0
$0
11
141312
$0
$0
$1,846
$2,118
$1,977
$1,846
$14,076
($4,945)
20 $1,910 $1,910
$2,046 $2,046
$1,78310987
($10,000)($5,000)
$0 $5,000
$10,000 $15,000 $20,000 $25,000 $30,000 $35,000
0 5 10 15 20
Net
Cas
h Fl
ow (E
nd o
f Yea
r)
Years
Simple Payback Graph
Issued February 1, 2011 47 New Hotels Energy Analysis - Green Engage/Solutions

Energy End-Use Benchmark Comparison
Energy End-UseLighting 0.0%
Proposed Energy Use
Savings (+) / Loss (-)
Savings (+) / Loss (-)
MBtu/yr
0 0%212.2
Mechanical
0.0 0.0 0.0 0.0%
As with Base Case, but with a water-cooled chiller and cooling tower.
Base Case
Space Heating - Elec
Base Case Energy Use
N/AProposed Modifications
% Savings (+) / Loss (-)ProposedBase CaseEmissions
11.7%
952,441 840,588 11.7%
669.7 375.4 35.9%
0.4 0.0 0.0%
N/A123.9
1,045.1N/A N/A
88 7 88 7 0 0HVAC Fans
0.4
VAV system with reheat used for all rooms. Cooling provided by air-cooled chiller. Electric resistance heating. Demand ventilation. Standard ASHRAE
construction for climate zone 2.
11.7%
SO2 (lb/yr) 3,768 3,325 11.7%
Individual Resource Calculations New Hotels Hot-Humid
M-12 Water Cooled Chiller
Environmental Impact Analysis
CO2 (lb/yr)
1,186.6 0.0MBtu/yr MBtu/yr %
1,186.6
Space CoolingSpace Heating - Gas
NOX (lb/yr) 1,388 1,225
Heat RejectionPumps
-88.3 -71.3%
952,441840,588
600,000
800,000
1,000,000
1,200,000
lb/y
r
Annual CO2 Emissions
TotalBase UtilitiesReceptacles
0.0%N/A N/A N/A
Assumptions287.1 11.7%
N/A N/A N/A2,157.6
88.7 88.7 0.0HVAC Fans
11.7%
2,444.7N/A
N/A
N/A
952,441840,588
0
200,000
400,000
600,000
800,000
1,000,000
1,200,000
Base Case Proposed
lb/y
r
Annual CO2 Emissions
3,768
1,388
3,325
1,225
0500
1,0001,5002,0002,5003,0003,5004,000
SO2 (lb/yr) NOX (lb/yr)
g/yr
Annual SO2 and NOX EmissionsBase Case
Proposed2,445
2,158
0
500
1,000
1,500
2,000
2,500
3,000
Base Case Proposed
MBt
u/yr
Annual Total Energy Use
Issued February 1, 2011 48 New Hotels Energy Analysis - Green Engage/Solutions

Additional Capital CostHVAC Plant First Cost Reductions
Cooling Plant Savings ($450/ton)Heating Plant Savings ($7 55/MBh)
Costs (Marginal/Maint/
Replace)Cash FlowSavings (+) /
Loss (-)
($10,000)
($10,000)
$8,404
$10,000
$0$9,002
$9,644$9,317$9,002
$9,644
$0
$9 981$0
$8,698
$0
84,141
0
84.0%
87.5%
Simple Payback$0
0 $0
$0$8,120
Annual Savings (+) / Loss (-)
43
5
Capital Costs Savings Summary
$0
$9,317
$8,404$8,698
($10,000)$8,404
6$0 $9 981
Mechanical
$0$0
2
Initial Annual Savings
First Year Yield On Marginal Cost
IRR
MBhtons
Annual Resource Cost Summary
Resource
Water & sewerNatural gasElectricity
0
Yr.
Financial Table
GalsthermskWh
N/AN/A
$0.0965Unit Cost
Annual Resource Savings (+) / Loss (-)
00
M-12 Water Cooled Chiller
1.2 yrs1
Initial Marginal Cost
Financial Results Summary
Individual Resource Calculations New Hotels Hot-Humid
Heating Plant Savings ($7.55/MBh)Airside Distribution Savings ($3.5/cfm)
Total Additional Capital Cost:
Estimated Useful Life (yrs)Percent replacedReplacement Cost
Base YearValuation TypeProject Analysis PeriodDiscount Rate for Defined ValuationEnergy Escalation Rate (Nominal)
$110,938
18171615
$14,079$14,079
$0$0
$15,082$14,572
$15,082$14,572
$13,603$0 $13,603
$12,269 $12,269
$13,143 $13,143$12,699$0
$0
$0
$11,854
$0
$11,066$10,692$10,330$9,981
3.50%6.00%
2019
$0 $16,156 $16,156$0 $15,610$15,610
0%$0
0 $0
11
0
$11,453$11,066$10,692$0
$0
$10,330
$0$12,699
($10,000)
20
$0$0
$11,453
20
2008
$11,854109876$0
Financial Analysis
Replacement Life and Cost Summary
Defined
14
$9,981
1312
$0
NPVcfmMBh
($50,000)
$0
$50,000
$100,000
$150,000
$200,000
$250,000
0 5 10 15 20
Net
Cas
h Fl
ow (E
nd o
f Yea
r)
Years
Simple Payback Graph
Issued February 1, 2011 49 New Hotels Energy Analysis - Green Engage/Solutions

Energy End-Use Benchmark Comparison
Energy End-UseLighting 0.0%
Proposed Energy Use
Savings (+) / Loss (-)
Savings (+) / Loss (-)
MBtu/yr
0 8%205.2
Mechanical
0.0 0.0 0.0 0.0%
As with Base Case, but with an evaporative cooling system.
Base Case
Space Heating - Elec
Base Case Energy Use
N/AProposed Modifications
% Savings (+) / Loss (-)ProposedBase CaseEmissions
1.2%
840,588 830,264 1.2%
650.9 18.8 2.8%
0.4 0.0 0.0%
N/A212.2
669.7N/A N/A
88 7 88 0 0 7HVAC Fans
0.4
VAV system with reheat used for all rooms. Cooling provided by water-cooled chiller with cooling tower. Electric resistance heating. Demand ventilation.
Standard ASHRAE construction for climate zone 2.
1.2%
SO2 (lb/yr) 3,325 3,285 1.2%
Individual Resource Calculations New Hotels Hot-Humid
M-13 Evaporative Cooling
Environmental Impact Analysis
CO2 (lb/yr)
1,186.6 0.0MBtu/yr MBtu/yr %
1,186.6
Space CoolingSpace Heating - Gas
NOX (lb/yr) 1,225 1,210
Heat RejectionPumps
7.0 3.3%
840,588 830,264
400,000500,000600,000700,000800,000900,000
lb/y
r
Annual CO2 Emissions
TotalBase UtilitiesReceptacles
0.8%N/A N/A N/A
Assumptions26.5 1.2%
N/A N/A N/A2,131.1
88.7 88.0 0.7HVAC Fans
1.2%
2,157.6N/A
N/A
N/A
840,588 830,264
0100,000200,000300,000400,000500,000600,000700,000800,000900,000
Base Case Proposed
lb/y
r
Annual CO2 Emissions
3,325
1,225
3,285
1,210
0
500
1,000
1,500
2,000
2,500
3,000
3,500
SO2 (lb/yr) NOX (lb/yr)
g/yr
Annual SO2 and NOX EmissionsBase Case
Proposed
2,158 2,131
0
500
1,000
1,500
2,000
2,500
Base Case Proposed
MBt
u/yr
Annual Total Energy Use
Issued February 1, 2011 50 New Hotels Energy Analysis - Green Engage/Solutions

Additional Capital CostHVAC Plant First Cost Reductions
Cooling Plant Savings ($450/ton)Heating Plant Savings ($7 55/MBh)
Costs (Marginal/Maint/
Replace)Cash FlowSavings (+) /
Loss (-)
($24,200)
($24,200)
$776
$24,200
$0$831
$890$860$831
$890
$0
$921$0
$803
$0
7,766
0
3.2%
N/A
Simple Payback$0
0 $0
$0$749
Annual Savings (+) / Loss (-)
43
5
Capital Costs Savings Summary
$0
$860
$776$803
($24,200)$776
6$0 $921
Mechanical
$0$0
2
Initial Annual Savings
First Year Yield On Marginal Cost
IRR
MBhtons
Annual Resource Cost Summary
Resource
Water & sewerNatural gasElectricity
0
Yr.
Financial Table
GalsthermskWh
N/AN/A
$0.0965Unit Cost
Annual Resource Savings (+) / Loss (-)
00
M-13 Evaporative Cooling
> 20 yrs1
Initial Marginal Cost
Financial Results Summary
Individual Resource Calculations New Hotels Hot-Humid
Heating Plant Savings ($7.55/MBh)Airside Distribution Savings ($3.5/cfm)
Total Additional Capital Cost:
Estimated Useful Life (yrs)Percent replacedReplacement Cost
Base YearValuation TypeProject Analysis PeriodDiscount Rate for Defined ValuationEnergy Escalation Rate (Nominal)
-$11,720
18171615
$1,300$1,300
$0$0
$1,392$1,345
$1,392$1,345
$1,256$0 $1,256
$1,132 $1,132
$1,213 $1,213$1,172$0
$0
$0
$1,094
$0
$1,021$987$954$921
3.50%6.00%
2019
$0 $1,491 $1,491$0 $1,441$1,441
0%$0
0 $0
11
0
$1,057$1,021$987$0
$0
$954
$0$1,172
($24,200)
20
$0$0
$1,057
20
2008
$1,094109876$0
Financial Analysis
Replacement Life and Cost Summary
Defined
14
$921
1312
$0
NPVcfmMBh
($30,000)
($25,000)
($20,000)
($15,000)
($10,000)
($5,000)
$0 0 5 10 15 20
Net
Cas
h Fl
ow (E
nd o
f Yea
r)
Years
Simple Payback Graph
Issued February 1, 2011 51 New Hotels Energy Analysis - Green Engage/Solutions

Energy End-Use Benchmark Comparison
Energy End-UseLighting 0.0%
Proposed Energy Use
Savings (+) / Loss (-)
Savings (+) / Loss (-)
MBtu/yr
0 0%212.2
Mechanical
0.0 0.0 0.0 0.0%
As with Base Case, but including a thermal storage unit.
Base Case
Space Heating - Elec
Base Case Energy Use
N/AProposed Modifications
% Savings (+) / Loss (-)ProposedBase CaseEmissions
0.0%
840,588 840,588 0.0%
669.7 0.0 0.0%
0.4 0.0 0.0%
N/A212.2
669.7N/A N/A
88 7 88 7 0 0HVAC Fans
0.4
VAV system with reheat used for all rooms. Cooling provided by water-cooled chiller with cooling tower. Electric resistance heating. Demand ventilation.
Standard ASHRAE construction for climate zone 2.
0.0%
SO2 (lb/yr) 3,325 3,325 0.0%
Individual Resource Calculations New Hotels Hot-Humid
M-13 Thermal Storage
Environmental Impact Analysis
CO2 (lb/yr)
1,186.6 0.0MBtu/yr MBtu/yr %
1,186.6
Space CoolingSpace Heating - Gas
NOX (lb/yr) 1,225 1,225
Heat RejectionPumps
0.0 0.0%
840,588 840,588
400,000500,000600,000700,000800,000900,000
lb/y
r
Annual CO2 Emissions
TotalBase UtilitiesReceptacles
0.0%N/A N/A N/A
Assumptions0.0 0.0%
N/A N/A N/A2,157.6
88.7 88.7 0.0HVAC Fans
0.0%
2,157.6N/A
N/A
N/A
840,588 840,588
0100,000200,000300,000400,000500,000600,000700,000800,000900,000
Base Case Proposed
lb/y
r
Annual CO2 Emissions
3,325
1,225
3,325
1,225
0
500
1,000
1,500
2,000
2,500
3,000
3,500
SO2 (lb/yr) NOX (lb/yr)
g/yr
Annual SO2 and NOX EmissionsBase Case
Proposed
2,158 2,158
0
500
1,000
1,500
2,000
2,500
Base Case Proposed
MBt
u/yr
Annual Total Energy Use
Issued February 1, 2011 52 New Hotels Energy Analysis - Green Engage/Solutions

Additional Capital CostHVAC Plant First Cost Reductions
Cooling Plant Savings ($450/ton)Heating Plant Savings ($7 55/MBh)
Costs (Marginal/Maint/
Replace)Cash FlowSavings (+) /
Loss (-)
($50,000)
($32,626)
$6,314
$32,626
$0$6,763
$7,245$7,000$6,763
$7,245
$0
$7 498$0
$6,534
$0
0
0
19.4%
22.1%
Simple Payback$0
39 $17,375
$0$6,100
Annual Savings (+) / Loss (-)
43
5
Capital Costs Savings Summary
$0
$7,000
$6,314$6,534
($32,626)$6,314
6$0 $7 498
Mechanical
$0$0
2
Initial Annual Savings
First Year Yield On Marginal Cost
IRR
MBhtons
Annual Resource Cost Summary
Resource
Water & sewerNatural gasElectricity
0
Yr.
Financial Table
GalsthermskWh
N/AN/A
$0.0965Unit Cost
Annual Resource Savings (+) / Loss (-)
00
M-13 Thermal Storage
4.9 yrs1
Initial Marginal Cost
Financial Results Summary
Individual Resource Calculations New Hotels Hot-Humid
Heating Plant Savings ($7.55/MBh)Airside Distribution Savings ($3.5/cfm)
Total Additional Capital Cost:
Estimated Useful Life (yrs)Percent replacedReplacement Cost
Base YearValuation TypeProject Analysis PeriodDiscount Rate for Defined ValuationEnergy Escalation Rate (Nominal)
$59,653
18171615
$10,577$10,577
$0$0
$11,331$10,948
$11,331$10,948
$10,220$0 $10,220
$9,218 $9,218
$9,874 $9,874$9,540$0
$0
$0
$8,906
$0
$8,314$8,033$7,761$7,498
3.50%6.00%
2019
$0 $12,138 $12,138$0 $11,727$11,727
0%$0
0 $0
11
0
$8,605$8,314$8,033$0
$0
$7,761
$0$9,540
($32,626)
20
$0$0
$8,605
20
2008
$8,906109876$0
Financial Analysis
Replacement Life and Cost Summary
Defined
14
$7,498
1312
$0
NPVcfmMBh
($60,000)($40,000)($20,000)
$0 $20,000 $40,000 $60,000 $80,000
$100,000 $120,000 $140,000 $160,000
0 5 10 15 20
Net
Cas
h Fl
ow (E
nd o
f Yea
r)
Years
Simple Payback Graph
Issued February 1, 2011 53 New Hotels Energy Analysis - Green Engage/Solutions

Arid
Issued February 1, 2011 54 New Hotels Energy Analysis - Green Engage/Solutions

Legend (Criteria Based On Simple Payback Only):Very Short or Immediate Payback (0 - 3 years)Intermediate Payback (3 - 7 years)Long or No Payback (>7 years)
Energy Modelling Results Summary New Hotels Arid
Base Case: PTAC units with air-cooled unitary cooling and electric resistance heating. M-7 Condenser Water Heat Pump 5.9 yrs 32.5% 17.9% 15.6% $187,558
NPV(Over 20 Years)
yrs % % % $
The table below summarises the overall energy and financial performance for the modeled new hotel in the arid climate zone against the baseline building. Energy savings for a specific building may vary based on that building's parameters and financial results may also vary based on local costs and financing structures. For details regarding each measure refer to the individual calculation pages immediately following this page. For detailed assumptions relating to the energy model, utilities, emission factors, financial inputs, cost of capital, etc refer to the assumptions section of this book.Note: CO2 reduction percentages closely match both source energy reductions and annual energy savings cost reductions. Due to different modeling methodologies existing hotel and new hotel CO2 reduction percentages cannot be compared against each other. The colour key contained below refers solely to simple payback periods.
Relevant Action Group Measure
AridPhoenix, AR
Simple Payback CO2 Reductions
M-7 Air Cooled VAV 8.3 yrs 27.0% 11.9% 10.7% $103,401M-7 Fan Coil Units 10 yrs 18.3% 10.5% 9.6%
IRR First Year Yield On Marginal Cost
Base Case: Best performing HVAC system: water cooled VAV systemB-1 Optimise Glazing > 20 yrs 0.6% N/A 0.5% ($45,370)
$185,837
Base Case: Identical VAV system but without fan-powered parallel terminal units. Note: FPPs not modelled in hot climates.M-7 Air Cooled VAV with FPP N/AM-7 Water Cooled VAV with FPP
M-7 Water Cooled VAV 6.6 yrs 35.5% 15.9% 13.8%
$57,117
$9,733M-2 Dedicated outside air unit 19 yrs 0.8% 1.0% 4.0% ($3,528)B-3 Optimise Building Insulation Immediate 1.5% N/A N/A
$134,248M-3 Heat Recovery Never -1.0% N/A N/A ($67,484)M-2 Demand Ventilation 3.4 yrs 21.2% 32.3% 29.0%
($2,992)M-9 Variable Frequency Drives 5.3 yrs 1.9% 20.3% 17.7% $7,875M-4 Economiser Modes 17 yrs 1.1% 2.5% 4.7%
$75,493M-13 Evaporative Cooling 12 yrs 4.0% 7.3% 7.4% $2,843M-12 Water-Cooled Chiller 1.7 yrs 11.6% 62.8% 59.3%
$31,551M-13 Thermal Storage 7 yrs 0.0% 14.8% 12.9%
Issued February 1, 2011 55 New Hotels Energy Analysis - Green Engage/Solutions

VAV system with reheat used for all rooms. Cooling provided by water-cooled chiller with cooling tower. Electric resistance heating. Demand ventilation.
Standard ASHRAE construction for climate zone 3.
B-1 Optimize GlazingBuilding Envelope
Base Case Energy End-Use Benchmark Comparison Environmental Impact Analysis
Energy End-Use
Base Case Energy Use
Proposed Energy Use
Savings (+) / Loss (-)
Savings (+) / Loss (-)
% Savings (+) / Loss (-)
Lighting
Emissions Base Case Proposed
CO2 (lb/yr) 721,762 717,749 0.6%MBtu/yr MBtu/yr MBtu/yr %
0.0%Space Cooling 396.1 396.9 -0.8 -0.2%Pumps N/A N/A
70.9 61.0 9.9 14.0%1,186.6 1,186.6 0.0 0.0%
SO2 (lb/yr) 2,855 2,839 0.6%1,051 1,046 0.6%NOX (lb/yr)
1.3%HVAC Fans 74 7 75 1 0 4 0 5%
Proposed ModificationsAs with Base Case, but with improved glazing
properties. SHGC is unchanged, U-value is reduced to 0.5.
AridIndividual Resource Calculations New Hotels
Space Heating - Elec
Heat Rejection 124.3 122.7 1.6N/A N/A
0.6%
Space Heating - Gas 0.0 0.0 0.0
721,762 717,749
500,000
1,000,000
lb/y
r
Annual CO2 Emissions
HVAC Fans 74.7 75.1 -0.4
Base Utilities N/A N/A N/A N/A
-0.5%Receptacles N/A N/A N/A N/A
Total 1,852.6 1,842.3 10.3 0.6%
0.6%
N/A
0.5.
Assumptions
721,762 717,749
0
500,000
1,000,000
Base Case Proposed
lb/y
r
Annual CO2 Emissions
2,855
1,051
2,839
1,046
0
2,000
4,000
SO2 (lb/yr) NOX (lb/yr)
g/yr
Annual SO2 and NOX EmissionsBase Case
Proposed
1,853 1,842
0
500
1,000
1,500
2,000
Base Case Proposed
MBt
u/yr
Annual Total Energy Use
Issued February 1, 2011 56 New Hotels Energy Analysis - Green Engage/Solutions

Additional Capital CostHVAC Plant First Cost Reductions
Cooling Plant Savings ($450/ton)Heating Plant Savings ($7 55/MBh)
> 20 yrs
Savings (+) / Loss (-)
Building Envelope
Natural gas 0 therms N/A $0Electricity 3,019 kWh Initial Annual Savings
$51,896
$250
B-1
$0 ($51,896) Simple Payback
Financial Results Summary
Costs (Marginal/Maint/
Replace)Cash Flow
Initial Marginal Cost
($51,896)
$2682 $0
4 $0 $278 $278 First Year Yield On Marginal Cost
$298
0.5%
$259 $259 IRR
55 MBh $411 6 $0 $298
3 $0 $268
tons $2,340 5 $0 $2875
N/ACapital Costs Savings Summary($63,866)
$287
Annual Resource Cost Summary Financial Table
1 $0 $250 $250Water & sewer 0 Gals N/A $0 0
ResourceAnnual Resource Savings
(+) / Loss (-) Unit CostAnnual Savings (+) /
Loss (-)Yr.
Individual Resource Calculations New Hotels Arid
$0.0802 $242
Optimize Glazing
Heating Plant Savings ($7.55/MBh)Airside Distribution Savings ($3.5/cfm)
Total Additional Capital Cost:
Estimated Useful Life (yrs)Percent replacedReplacement Cost
Base YearValuation TypeProject Analysis PeriodDiscount Rate for Defined ValuationEnergy Escalation Rate (Nominal)
7$298 NPV55 MBh $411 6 $0 $298$308
8 $0 $319 $319
-$45,370
20 11 $0 $353 $353Replacement Life and Cost Summary 10 $0 $341 $341
$379
$40514 $0 $392 $39215 $0
20 18 $0 $450 $450Defined
2008 16 $0 $420 $42017 $0 $434 $434
6.00% 19 $0 $465 $4653.50% 20 $0 $482 $482
0% 12 $0 $366 $366
$0 $308
Financial Analysis
($51,896)2,634 cfm $9,219
$330 $3309 $0
$405
$0 13 $0 $379
($54,000)
($52,000)
($50,000)
($48,000)
($46,000)
($44,000)
($42,000)
($40,000)0 5 10 15 20
Net
Cas
h Fl
ow (E
nd o
f Yea
r)
Years
Simple Payback Graph
Issued February 1, 2011 57 New Hotels Energy Analysis - Green Engage/Solutions

VAV system with reheat used for all rooms. Cooling provided by water-cooled chiller with cooling tower. Electric resistance heating. Demand ventilation.
Standard ASHRAE construction for climate zone 3.
B-3 Optimize Building InsulationBuilding Envelope
Base Case Energy End-Use Benchmark Comparison Environmental Impact Analysis
Energy End-Use
Base Case Energy Use
Proposed Energy Use
Savings (+) / Loss (-)
Savings (+) / Loss (-) 1.5%
% Savings (+) / Loss (-)
MBtu/yr MBtu/yr MBtu/yr %Lighting 1,186.6 1,186.6 0.0 0.0%
Emissions Base Case Proposed
SO2 (g/yr) 2,855 2,812 1.5%CO2 (lb/yr) 721,762 710,931
1,051 1,036 1.5%NOX (g/yr)
Heat Rejection 124.3 117.9 6.4N/A N/A
1.5%
Space Heating - Gas 0.0 0.0 0.0 0.0%
5.1%
Space Cooling 396.1 387.1 9.0 2.3%Pumps N/A N/A
Space Heating - Elec 70.9 59.1 11.8 16.6%
0 8%HVAC Fans 74 7 74 1 0 6
Proposed ModificationsAs with Base Case, but with the overall wall U-value
reduced to 0.06.
Individual Resource Calculations New Hotels Arid
721,762 710,931
500,000
1,000,000
lb/y
r
Annual CO2 Emissions
0.8%Receptacles N/A N/A N/A N/A
Total 1,852.6 1,824.8 27.8
HVAC Fans 74.7 74.1 0.6
Base Utilities N/A N/A N/A N/A
1.5%
1.5%Assumptions
N/A
721,762 710,931
0
500,000
1,000,000
Base Case Proposed
lb/y
r
Annual CO2 Emissions
2,855
1,051
2,812
1,036
0
2,000
4,000
SO2 (g/yr) NOX (g/yr)
g/yr
Annual SO2 and NOX EmissionsBase Case
Proposed
1,853 1,825
0
500
1,000
1,500
2,000
Base Case Proposed
MBt
u/yr
Annual Total Energy Use
Issued February 1, 2011 58 New Hotels Energy Analysis - Green Engage/Solutions

Additional Capital CostHVAC Plant First Cost Reductions
Cooling Plant Savings ($450/ton)Heating Plant Savings ($7 55/MBh)
Financial Results Summary
Cash FlowInitial Marginal Cost ($52)
Electricity 8,147 kWh $0.0802 $653
B-3 Optimize Building Insulation
Costs (Marginal/Maint/
Replace)
Savings (+) / Loss (-)
Building Envelope
Natural gas 0 therms N/A $0N/A $0 0 $52
ResourceAnnual Resource Savings
(+) / Loss (-) Unit CostAnnual Savings (+) /
Loss (-)Yr.
Water & sewer 0 Gals
$676
Simple Payback Immediate
Initial Annual Savings
$803
4 $0 $750 $750 First Year Yield On Marginal Cost N/A
$676
$803$776
($11,500)
6 tons $2,745 5 $0 $77639 MBh $291 6 $0
2 $0 $700$724$700
Individual Resource Calculations New Hotels Arid
Capital Costs Savings Summary
Annual Resource Cost Summary Financial Table
IRR
1 $0 $676
N/A
$0 $52
3 $0 $724
Heating Plant Savings ($7.55/MBh)Airside Distribution Savings ($3.5/cfm)
Total Additional Capital Cost:
Estimated Useful Life (yrs)Percent replacedReplacement Cost
Base YearValuation TypeProject Analysis PeriodDiscount Rate for Defined ValuationEnergy Escalation Rate (Nominal)
$803$831
$9,733$803 NPV
$860
14 $0 $1,057 $1,057
20 11 $0 $954 $954
$1,022 $1,022
Defined 17 $0 $1,172 $1,172
Financial Analysis 15 $0 $1,094 $1,0942008 16 $0 $1,133 $1,133
6.00% 19 $0 $1,256 $1,2563.50% 20 $0 $1,300 $1,300
0% 12 $0
$890 $890
$0
9
20 18 $0
$921 $921$0
8 $0 $860
39 MBh $291 6 $0
$522,433 cfm $8,516
$987 $987
$1,213 $1,213
$0 13 $0
Replacement Life and Cost Summary 10 $0
7 $831
$0
$5,000
$10,000
$15,000
$20,000
$25,000
0 5 10 15 20
Net
Cas
h Fl
ow (E
nd o
f Yea
r)
Years
Simple Payback Graph
Issued February 1, 2011 59 New Hotels Energy Analysis - Green Engage/Solutions

MBtu/yr MBtu/yr MBtu/yr %
VAV system with reheat used for all rooms. Cooling provided by water-cooled chiller with cooling tower.
Gas-fired boilers provide heating. No demand ventilation. Standard ASHRAE construction for climate
zone 3.
Mechanical
Base Case Energy End-Use Benchmark Comparison Environmental Impact Analysis
Energy End-Use
Base Case Energy Use
Proposed Energy Use
Savings (+) / Loss (-)
Savings (+) / Loss (-) 21.2%
% Savings (+) / Loss (-)
Lighting 1,186.6 1,186.6 0.0 0.0%
M-2 Improved Ventilation Air Delivery: Demand Ventilation
Emissions Base Case Proposed
SO2 (g/yr) 3,624 2,855 21.2%CO2 (lb/yr) 916,052 721,762
1,335 1,051 21.2%NOX (g/yr)
Heat Rejection 199.7 124.3 75.4N/A N/A
21.2%
Space Heating - Gas 0.0 0.0 0.0 0.0%
37.8%
Space Cooling 561.2 396.1 165.1 29.4%Pumps N/A N/A
Space Heating - Elec 311.3 70.9 240.4 77.2%
HVAC Fans 92 5 74 7 17 8
Proposed ModificationsAs with Base Case, but including a dedicated outside
air unit.
Individual Resource Calculations New Hotels Arid
19 2%
916,052
721,762
500,000
1,000,000
lb/y
r
Annual CO2 Emissions
N/A N/A
Total 2,351.3 1,852.6 498.7
HVAC Fans 92.5 74.7 17.8
N/AAssumptions
21.2%
Base Utilities N/A N/A N/A N/A21.2%
19.2%Receptacles N/A N/A
916,052
721,762
0
500,000
1,000,000
Base Case Proposed
lb/y
r
Annual CO2 Emissions
3,624
1,335
2,855
1,051
0
2,000
4,000
SO2 (g/yr) NOX (g/yr)
g/yr
Annual SO2 and NOX EmissionsBase Case
Proposed
2,351
1,853
0
500
1,000
1,500
2,000
2,500
Base Case Proposed
MBt
u/yr
Annual Total Energy Use
Issued February 1, 2011 60 New Hotels Energy Analysis - Green Engage/Solutions

Additional Capital CostHVAC Plant First Cost Reductions
Cooling Plant Savings ($450/ton)Heating Plant Savings ($7 55/MBh)
$0Electricity 146,155 kWh $0.0802 $11,718
Yr.Costs
(Marginal/Maint/Replace)
Savings (+) / Loss (-)
Natural gas 0 therms N/A
Cash FlowInitial Annual Savings
Initial Marginal Cost $41,840
$12,128
Gals N/A $0 0
IRR
$0 ($41,840) Simple Payback 3.4 yrs
3 $0 $12,992 $12,9922 $0
($41,840)
4 $0 $13,447 $13,447 First Year Yield On Marginal Cost
$14 4053 MBh $25 6 $0 $14 405tons $135 5 $0 $13,917 $13,917
($42,000)
0
Capital Costs Savings Summary
Annual Resource Cost Summary Financial Table
ResourceAnnual Resource Savings
(+) / Loss (-)
1 $0 $12,128 $12,128
29.0%
32.3%$12,553 $12,553
Water & sewer 0
Individual Resource Calculations New Hotels Arid
Improved Ventilation Air Delivery: Demand Ventilation
Financial Results Summary
Unit CostAnnual Savings (+) /
Loss (-)
Mechanical M-2
Heating Plant Savings ($7.55/MBh)Airside Distribution Savings ($3.5/cfm)
Total Additional Capital Cost:
Estimated Useful Life (yrs)Percent replacedReplacement Cost
Base YearValuation TypeProject Analysis PeriodDiscount Rate for Defined ValuationEnergy Escalation Rate (Nominal)
7$14,405 NPV
8 $0 $15,431 $15,431
$134,2483 MBh $25 6 $0 $14,405$0 $14,909
$15,971 $15,971
20 11 $0 $17,108 $17,108Replacement Life and Cost Summary 10 $0 $16,530 $16,530
14 $0 $18,968 $18,968
Defined $0 $21,030 $21,0302008 16 $0 $20,319 $20,319
Financial Analysis 15 $0 $19,632 $19,632
6.00% 19 $0 $22,528 $22,5283.50% 20 $0 $23,317 $23,317
0% 12 $0 $17,707
20 18 $0
($41,840)0 cfm $0 $14,909
9 $0
$17,707
17$21,766 $21,766
$0 13 $0 $18,327 $18,327
($100,000)($50,000)
$0 $50,000
$100,000 $150,000 $200,000 $250,000 $300,000 $350,000
0 5 10 15 20
Net
Cas
h Fl
ow (E
nd o
f Yea
r)
Years
Simple Payback Graph
Issued February 1, 2011 61 New Hotels Energy Analysis - Green Engage/Solutions

Proposed ModificationsAs with Base Case, but including a dedicated outside
air unit.
HVAC Fans 74 7 75 1 0 4 0 5%128.3 -4.0 -3.2%
-2.7%PumpsSpace Cooling 396.1 406.9 -10.8
Space Heating - Elec 70.9 40.3 30.6 43.2%
N/A N/A N/A N/A0.8%
Space Heating - Gas 0.0 0.0 0.0 0.0%
Emissions Base Case Proposed
1,051 1,043 0.8%NOX (g/yr)
CO2 (lb/yr) 721,762 715,762 0.8%
Individual Resource Calculations New Hotels
SO2 (g/yr) 2,855 2,832 0.8%
% Savings (+) / Loss (-)
Arid
Mechanical
Base Case Energy End-Use Benchmark Comparison Environmental Impact Analysis
Energy End-Use
Base Case Energy Use
Proposed Energy Use
Savings (+) / Loss (-)
Savings (+) / Loss (-)
MBtu/yr MBtu/yr MBtu/yr %
VAV system with reheat used for all rooms. Cooling provided by water-cooled chiller with cooling tower. Electric resistance heating. Demand ventilation.
Standard ASHRAE construction for climate zone 3.
Lighting 1,186.6 1,186.6 0.0 0.0%
M-2 Dedicated Outside Air Unit
Heat Rejection 124.3
721,762 715,762
500,000
1,000,000
lb/y
r
Annual CO2 Emissions
Assumptions
0.8%
N/A
0.8%Total 1,852.6 1,837.2 15.4
HVAC Fans 74.7 75.1 -0.4 -0.5%Receptacles N/A N/A N/A N/ABase Utilities N/A N/A N/A N/A
721,762 715,762
0
500,000
1,000,000
Base Case Proposed
lb/y
r
Annual CO2 Emissions
2,855
1,051
2,832
1,043
0
2,000
4,000
SO2 (g/yr) NOX (g/yr)
g/yr
Annual SO2 and NOX EmissionsBase Case
Proposed
1,853 1,837
0
500
1,000
1,500
2,000
Base Case Proposed
MBt
u/yr
Annual Total Energy Use
Issued February 1, 2011 62 New Hotels Energy Analysis - Green Engage/Solutions

Additional Capital CostHVAC Plant First Cost Reductions
Cooling Plant Savings ($450/ton)Heating Plant Savings ($7 55/MBh)
Dedicated Outside Air Unit
1 $0 $375 $375Capital Costs Savings Summary
-2 tons ($1,035) 5 $0 $430
Water & sewer 0 Gals N/A $0
($9,695) 3 $0 $401 $4012 $0 $388 $388 IRR
$4304.0%4
0
Cash Flow
173 $1 304 6 $0 $445 $445MBh
($9,426)
$0 $415 $415 First Year Yield On Marginal Cost
$0 ($9,426) Simple Payback 19 yrs
1.0%
Initial Marginal Cost $9,426
$375
Financial Results Summary
ResourceAnnual Resource Savings
(+) / Loss (-)
M-2
Initial Annual SavingskWh $0.0802 $362Unit Cost
Annual Savings (+) / Loss (-)
Mechanical
Natural gas 0 therms N/A $0Electricity 4,513
Yr.Costs
(Marginal/Maint/Replace)
Savings (+) / Loss (-)
Annual Resource Cost Summary Financial Table
Individual Resource Calculations New Hotels Arid
Heating Plant Savings ($7.55/MBh)Airside Distribution Savings ($3.5/cfm)
Total Additional Capital Cost:
Estimated Useful Life (yrs)Percent replacedReplacement Cost
Base YearValuation TypeProject Analysis PeriodDiscount Rate for Defined ValuationEnergy Escalation Rate (Nominal)
$0 $460
9
0% 12 $0 $547 $547
19 $0 $696 $696
15 $0 $606 $606
3.50% 20 $0 $720 $7206.00%
Defined 17 $0 $649 $64920 18 $0 $672 $672
2008 16 $0 $627 $627Financial Analysis
$0 13 $0 $566 $56614 $0 $586 $586
Replacement Life and Cost Summary 10 $0 $510 $510
173 $1,304 6 $0
($9,426)0 cfm $0
$0 $493 $493
7
20 11 $0 $528 $528
$445 $445 NPV
8 $0 $476 $476
-$3,528$460
MBh
($10,000)
($8,000)
($6,000)
($4,000)
($2,000)
$0
$2,000
0 5 10 15 20
Net
Cas
h Fl
ow (E
nd o
f Yea
r)
Years
Simple Payback Graph
Issued February 1, 2011 63 New Hotels Energy Analysis - Green Engage/Solutions

MBtu/yr MBtu/yr MBtu/yr %
VAV system with reheat used for all rooms. Cooling provided by water-cooled chiller with cooling tower. Electric resistance heating. Demand ventilation.
Standard ASHRAE construction for climate zone 3.
Mechanical
Base Case Energy End-Use Benchmark Comparison Environmental Impact Analysis
Energy End-Use
Base Case Energy Use
Proposed Energy Use
Savings (+) / Loss (-)
Savings (+) / Loss (-) -1.0%
% Savings (+) / Loss (-)
Lighting 1,186.6 1,186.6 0.0 0.0%
M-3 Heat Recovery
Emissions Base Case Proposed
SO2 (g/yr) 2,855 2,883 -1.0%CO2 (lb/yr) 721,762 728,736
1,051 1,062 -1.0%NOX (g/yr)
Heat Rejection 124.3 131.1 -6.8N/A N/A
-1.0%
Space Heating - Gas 0.0 0.0 0.0 0.0%
-5.5%
Space Cooling 396.1 421.2 -25.1 -6.3%Pumps N/A N/A
Space Heating - Elec 70.9 21.7 49.2 69.4%
HVAC Fans 74 7 109 9 35 2
Proposed ModificationsAs with Base Case, but including a dedicated outside
air unit and a ventilation heat recovery unit.
Individual Resource Calculations New Hotels Arid
47 1%
721,762 728,736
500,000
1,000,000
lb/y
r
Annual CO2 Emissions
N/A N/A
Total 1,852.6 1,870.5 -17.9
HVAC Fans 74.7 109.9 -35.2
N/AAssumptions
-1.0%
Base Utilities N/A N/A N/A N/A-1.0%
-47.1%Receptacles N/A N/A
721,762 728,736
0
500,000
1,000,000
Base Case Proposed
lb/y
r
Annual CO2 Emissions
2,855
1,051
2,883
1,062
0
2,000
4,000
SO2 (g/yr) NOX (g/yr)
g/yr
Annual SO2 and NOX EmissionsBase Case
Proposed
1,853 1,871
0
500
1,000
1,500
2,000
Base Case Proposed
MBt
u/yr
Annual Total Energy Use
Issued February 1, 2011 64 New Hotels Energy Analysis - Green Engage/Solutions

Additional Capital CostHVAC Plant First Cost Reductions
Cooling Plant Savings ($450/ton)Heating Plant Savings ($7 55/MBh)
$0Electricity -5,246 kWh $0.0802 ($421)
Yr.Costs
(Marginal/Maint/Replace)
Savings (+) / Loss (-)
Natural gas 0 therms N/A
Cash FlowInitial Annual Savings
Initial Marginal Cost $64,923
($435)
Gals N/A $0 0
IRR
$0 ($64,923) Simple Payback Never
3 $0 ($466) ($466)2 $0
($64,923)
4 $0 ($483) ($483) First Year Yield On Marginal Cost
($517)173 MBh $1 304 6 $0 ($517)tons ($1,890) 5 $0 ($500) ($500)
($64,337)
-4
Capital Costs Savings Summary
Annual Resource Cost Summary Financial Table
ResourceAnnual Resource Savings
(+) / Loss (-)
1 $0 ($435) ($435)
N/A
N/A($451) ($451)
Water & sewer 0
Individual Resource Calculations New Hotels Arid
Heat Recovery
Financial Results Summary
Unit CostAnnual Savings (+) /
Loss (-)
Mechanical M-3
Heating Plant Savings ($7.55/MBh)Airside Distribution Savings ($3.5/cfm)
Total Additional Capital Cost:
Estimated Useful Life (yrs)Percent replacedReplacement Cost
Base YearValuation TypeProject Analysis PeriodDiscount Rate for Defined ValuationEnergy Escalation Rate (Nominal)
7($517) NPV
8 $0 ($554) ($554)
-$67,484173 MBh $1,304 6 $0 ($517)$0 ($535)
($573) ($573)
20 11 $0 ($614) ($614)Replacement Life and Cost Summary 10 $0 ($593) ($593)
14 $0 ($681) ($681)
Defined $0 ($755) ($755)2008 16 $0 ($729) ($729)
Financial Analysis 15 $0 ($705) ($705)
6.00% 19 $0 ($809) ($809)3.50% 20 $0 ($837) ($837)
0% 12 $0 ($636)
20 18 $0
($64,923)0 cfm $0 ($535)
9 $0
($636)
17($781) ($781)
$0 13 $0 ($658) ($658)
($80,000)($78,000)($76,000)($74,000)($72,000)($70,000)($68,000)($66,000)($64,000)($62,000)($60,000)($58,000)
0 5 10 15 20
Net
Cas
h Fl
ow (E
nd o
f Yea
r)
Years
Simple Payback Graph
Issued February 1, 2011 65 New Hotels Energy Analysis - Green Engage/Solutions

MBtu/yr MBtu/yr MBtu/yr %
VAV system with reheat used for all rooms. Cooling provided by water-cooled chiller with cooling tower. Electric resistance heating. Demand ventilation.
Standard ASHRAE construction for climate zone 3.
Mechanical
Base Case Energy End-Use Benchmark Comparison Environmental Impact Analysis
Energy End-Use
Base Case Energy Use
Proposed Energy Use
Savings (+) / Loss (-)
Savings (+) / Loss (-) 1.1%
% Savings (+) / Loss (-)
Lighting 1,186.6 1,186.6 0.0 0.0%
M-4 Economizer Modes
Emissions Base Case Proposed
SO2 (g/yr) 2,855 2,823 1.1%CO2 (lb/yr) 721,762 713,541
1,051 1,039 1.1%NOX (g/yr)
Heat Rejection 124.3 120.3 4.0N/A N/A
1.1%
Space Heating - Gas 0.0 0.0 0.0 0.0%
3.2%
Space Cooling 396.1 378.6 17.5 4.4%Pumps N/A N/A
Space Heating - Elec 70.9 71.3 -0.4 -0.6%
HVAC Fans 74 7 74 7 0 0
Proposed ModificationsAs with Base Case, but with an enthalpy economizer.
Individual Resource Calculations New Hotels Arid
0 0%
721,762 713,541
500,000
1,000,000
lb/y
r
Annual CO2 Emissions
N/A N/A
Total 1,852.6 1,831.5 21.1
HVAC Fans 74.7 74.7 0.0
N/AAssumptions
1.1%
Base Utilities N/A N/A N/A N/A1.1%
0.0%Receptacles N/A N/A
721,762 713,541
0
500,000
1,000,000
Base Case Proposed
lb/y
r
Annual CO2 Emissions
2,855
1,051
2,823
1,039
0
2,000
4,000
SO2 (g/yr) NOX (g/yr)
g/yr
Annual SO2 and NOX EmissionsBase Case
Proposed
1,853 1,832
0
500
1,000
1,500
2,000
Base Case Proposed
MBt
u/yr
Annual Total Energy Use
Issued February 1, 2011 66 New Hotels Energy Analysis - Green Engage/Solutions

Additional Capital CostHVAC Plant First Cost Reductions
Cooling Plant Savings ($450/ton)Heating Plant Savings ($7 55/MBh)
$0Electricity 6,184 kWh $0.0802 $496
Yr.Costs
(Marginal/Maint/Replace)
Savings (+) / Loss (-)
Natural gas 0 therms N/A
Cash FlowInitial Annual Savings
Initial Marginal Cost $10,963
$513
Gals N/A $0 0
IRR
$0 ($10,963) Simple Payback 17 yrs
3 $0 $550 $5502 $0
($10,963)
4 $0 $569 $569 First Year Yield On Marginal Cost
$6090 MBh $0 6 $0 $609tons $0 5 $0 $589 $589
($10,963)
0
Capital Costs Savings Summary
Annual Resource Cost Summary Financial Table
ResourceAnnual Resource Savings
(+) / Loss (-)
1 $0 $513 $513
4.7%
2.5%$531 $531
Water & sewer 0
Individual Resource Calculations New Hotels Arid
Economizer Modes
Financial Results Summary
Unit CostAnnual Savings (+) /
Loss (-)
Mechanical M-4
Heating Plant Savings ($7.55/MBh)Airside Distribution Savings ($3.5/cfm)
Total Additional Capital Cost:
Estimated Useful Life (yrs)Percent replacedReplacement Cost
Base YearValuation TypeProject Analysis PeriodDiscount Rate for Defined ValuationEnergy Escalation Rate (Nominal)
7$609 NPV
8 $0 $653 $653
-$2,9920 MBh $0 6 $0 $609$0 $631
$676 $676
20 11 $0 $724 $724Replacement Life and Cost Summary 10 $0 $699 $699
14 $0 $803 $803
Defined $0 $890 $8902008 16 $0 $860 $860
Financial Analysis 15 $0 $831 $831
6.00% 19 $0 $953 $9533.50% 20 $0 $987 $987
0% 12 $0 $749
20 18 $0
($10,963)0 cfm $0 $631
9 $0
$749
17$921 $921
$0 13 $0 $775 $775
($12,000)($10,000)($8,000)($6,000)($4,000)($2,000)
$0 $2,000 $4,000 $6,000
0 5 10 15 20
Net
Cas
h Fl
ow (E
nd o
f Yea
r)
Years
Simple Payback Graph
Issued February 1, 2011 67 New Hotels Energy Analysis - Green Engage/Solutions

MBtu/yr MBtu/yr MBtu/yr %
Baseline ASHRAE HVAC system: PTAC units used for all rooms. Air-cooled unitary cooling. Electric
resistance heating. Demand ventilation. Standard ASHRAE construction for climate zone 3.
Mechanical
Base Case Energy End-Use Benchmark Comparison Environmental Impact Analysis
Energy End-Use
Base Case Energy Use
Proposed Energy Use
Savings (+) / Loss (-)
Savings (+) / Loss (-) 32.5%
% Savings (+) / Loss (-)
Lighting 1,186.6 1,186.6 0.0 0.0%
M-7 Guest Room Equipment Selection: Condensor Water Heat Pump
Emissions Base Case Proposed
SO2 (g/yr) 4,426 2,990 32.5%CO2 (lb/yr) 1,118,875 755,696
1,630 1,101 32.5%NOX (g/yr)
Heat Rejection 113.4 122.8 -9.4N/A N/A
32.5%
Space Heating - Gas 0.0 0.0 0.0 0.0%
-8.3%
Space Cooling 826.4 491.6 334.8 40.5%Pumps N/A N/A
Space Heating - Elec 109.0 43.0 66.0 60.6%
HVAC Fans 636 5 95 7 540 8
Proposed ModificationsPTACs replaced by heat pumps. Condenser water
cooling. Electric resistance heating. Demand ventilation. Identical construction to Base Case.
Individual Resource Calculations New Hotels Arid
85 0%
1,118,875
755,6961,000,000
1,500,000
lb/y
r
Annual CO2 Emissions
N/A N/A
Total 2,871.9 1,939.7 932.2
HVAC Fans 636.5 95.7 540.8
N/A
ventilation. Identical construction to Base Case.
Assumptions
32.5%
Base Utilities N/A N/A N/A N/A32.5%
85.0%Receptacles N/A N/A
1,118,875
755,696
0
500,000
1,000,000
1,500,000
Base Case Proposed
lb/y
r
Annual CO2 Emissions
4,426
1,630
2,990
1,101
0
2,000
4,000
6,000
SO2 (g/yr) NOX (g/yr)
g/yr
Annual SO2 and NOX EmissionsBase Case
Proposed2,872
1,940
0
500
1,000
1,500
2,000
2,500
3,000
3,500
Base Case Proposed
MBt
u/yr
Annual Total Energy Use
Issued February 1, 2011 68 New Hotels Energy Analysis - Green Engage/Solutions

Additional Capital CostHVAC Plant First Cost Reductions
Cooling Plant Savings ($450/ton)Heating Plant Savings ($7 55/MBh)
$0Electricity 273,201 kWh $0.0802 $21,904
Yr.Costs
(Marginal/Maint/Replace)
Savings (+) / Loss (-)
Natural gas 0 therms N/A
Cash FlowInitial Annual Savings
Initial Marginal Cost $145,400
$22,671
Gals N/A $0 0
IRR
$0 ($145,400) Simple Payback 5.9 yrs
3 $0 $24,286 $24,2862 $0
($145,400)
4 $0 $25,136 $25,136 First Year Yield On Marginal Cost
$26 9260 MBh $0 6 $0 $26 926tons $0 5 $0 $26,015 $26,015
($145,400)
0
Capital Costs Savings Summary
Annual Resource Cost Summary Financial Table
ResourceAnnual Resource Savings
(+) / Loss (-)
1 $0 $22,671 $22,671
15.6%
17.9%$23,464 $23,464
Water & sewer 0
Individual Resource Calculations New Hotels Arid
Guest Room Equipment Selection: Condensor Water Heat Pump
Financial Results Summary
Unit CostAnnual Savings (+) /
Loss (-)
Mechanical M-7
Heating Plant Savings ($7.55/MBh)Airside Distribution Savings ($3.5/cfm)
Total Additional Capital Cost:
Estimated Useful Life (yrs)Percent replacedReplacement Cost
Base YearValuation TypeProject Analysis PeriodDiscount Rate for Defined ValuationEnergy Escalation Rate (Nominal)
7$26,926 NPV
8 $0 $28,844 $28,844
$187,5580 MBh $0 6 $0 $26,926$0 $27,868
$29,853 $29,853
20 11 $0 $31,980 $31,980Replacement Life and Cost Summary 10 $0 $30,898 $30,898
14 $0 $35,456 $35,456
Defined $0 $39,311 $39,3112008 16 $0 $37,982 $37,982
Financial Analysis 15 $0 $36,697 $36,697
6.00% 19 $0 $42,111 $42,1113.50% 20 $0 $43,585 $43,585
0% 12 $0 $33,099
20 18 $0
($145,400)0 cfm $0 $27,868
9 $0
$33,099
17$40,687 $40,687
$0 13 $0 $34,257 $34,257
($200,000)($100,000)
$0 $100,000 $200,000 $300,000 $400,000 $500,000 $600,000
0 5 10 15 20
Net
Cas
h Fl
ow (E
nd o
f Yea
r)
Years
Simple Payback Graph
Issued February 1, 2011 69 New Hotels Energy Analysis - Green Engage/Solutions

MBtu/yr MBtu/yr MBtu/yr %
Baseline ASHRAE HVAC system: PTAC units used for all rooms. Air-cooled unitary cooling. Electric
resistance heating. Demand ventilation. Standard ASHRAE construction for climate zone 3.
Mechanical
Base Case Energy End-Use Benchmark Comparison Environmental Impact Analysis
Energy End-Use
Base Case Energy Use
Proposed Energy Use
Savings (+) / Loss (-)
Savings (+) / Loss (-) 18.3%
% Savings (+) / Loss (-)
Lighting 1,186.6 1,186.6 0.0 0.0%
M-7 Guest Room Equipment Selection: Fan Coil Units
Emissions Base Case Proposed
SO2 (g/yr) 4,426 3,616 18.3%CO2 (lb/yr) 1,118,875 913,949
1,630 1,331 18.3%NOX (g/yr)
Heat Rejection 113.4 135.7 -22.3N/A N/A
18.3%
Space Heating - Gas 0.0 0.0 0.0 0.0%
-19.7%
Space Cooling 826.4 369.0 457.4 55.3%Pumps N/A N/A
Space Heating - Elec 109.0 109.0 0.0 0.0%
HVAC Fans 636 5 545 6 90 9
Proposed ModificationsPTACs replaced by fan coil units. Water-cooled chiller
cooling. Electric resistance heating. Demand ventilation. Identical construction to Base Case.
Individual Resource Calculations New Hotels Arid
14 3%
1,118,875913,9491,000,000
1,500,000
lb/y
r
Annual CO2 Emissions
N/A N/A
Total 2,871.9 2,345.9 526.0
HVAC Fans 636.5 545.6 90.9
N/A
ventilation. Identical construction to Base Case.
Assumptions
18.3%
Base Utilities N/A N/A N/A N/A18.3%
14.3%Receptacles N/A N/A
1,118,875913,949
0
500,000
1,000,000
1,500,000
Base Case Proposed
lb/y
r
Annual CO2 Emissions
4,426
1,630
3,616
1,331
0
2,000
4,000
6,000
SO2 (g/yr) NOX (g/yr)
g/yr
Annual SO2 and NOX EmissionsBase Case
Proposed2,872
2,346
0
500
1,000
1,500
2,000
2,500
3,000
3,500
Base Case Proposed
MBt
u/yr
Annual Total Energy Use
Issued February 1, 2011 70 New Hotels Energy Analysis - Green Engage/Solutions

Additional Capital CostHVAC Plant First Cost Reductions
Cooling Plant Savings ($450/ton)Heating Plant Savings ($7 55/MBh)
$0Electricity 154,155 kWh $0.0802 $12,360
Yr.Costs
(Marginal/Maint/Replace)
Savings (+) / Loss (-)
Natural gas 0 therms N/A
Cash FlowInitial Annual Savings
Initial Marginal Cost $133,680
$12,792
Gals N/A $0 0
IRR
$0 ($133,680) Simple Payback 10 yrs
3 $0 $13,703 $13,7032 $0
($133,680)
4 $0 $14,183 $14,183 First Year Yield On Marginal Cost
$15 1930 MBh $0 6 $0 $15 193tons $0 5 $0 $14,679 $14,679
($133,680)
0
Capital Costs Savings Summary
Annual Resource Cost Summary Financial Table
ResourceAnnual Resource Savings
(+) / Loss (-)
1 $0 $12,792 $12,792
9.6%
10.5%$13,240 $13,240
Water & sewer 0
Individual Resource Calculations New Hotels Arid
Guest Room Equipment Selection: Fan Coil Units
Financial Results Summary
Unit CostAnnual Savings (+) /
Loss (-)
Mechanical M-7
Heating Plant Savings ($7.55/MBh)Airside Distribution Savings ($3.5/cfm)
Total Additional Capital Cost:
Estimated Useful Life (yrs)Percent replacedReplacement Cost
Base YearValuation TypeProject Analysis PeriodDiscount Rate for Defined ValuationEnergy Escalation Rate (Nominal)
7$15,193 NPV
8 $0 $16,275 $16,275
$57,1170 MBh $0 6 $0 $15,193$0 $15,725
$16,845 $16,845
20 11 $0 $18,045 $18,045Replacement Life and Cost Summary 10 $0 $17,434 $17,434
14 $0 $20,006 $20,006
Defined $0 $22,181 $22,1812008 16 $0 $21,431 $21,431
Financial Analysis 15 $0 $20,707 $20,707
6.00% 19 $0 $23,761 $23,7613.50% 20 $0 $24,593 $24,593
0% 12 $0 $18,676
20 18 $0
($133,680)0 cfm $0 $15,725
9 $0
$18,676
17$22,958 $22,958
$0 13 $0 $19,330 $19,330
($200,000)($150,000)($100,000)
($50,000)$0
$50,000 $100,000 $150,000 $200,000 $250,000
0 5 10 15 20
Net
Cas
h Fl
ow (E
nd o
f Yea
r)
Years
Simple Payback Graph
Issued February 1, 2011 71 New Hotels Energy Analysis - Green Engage/Solutions
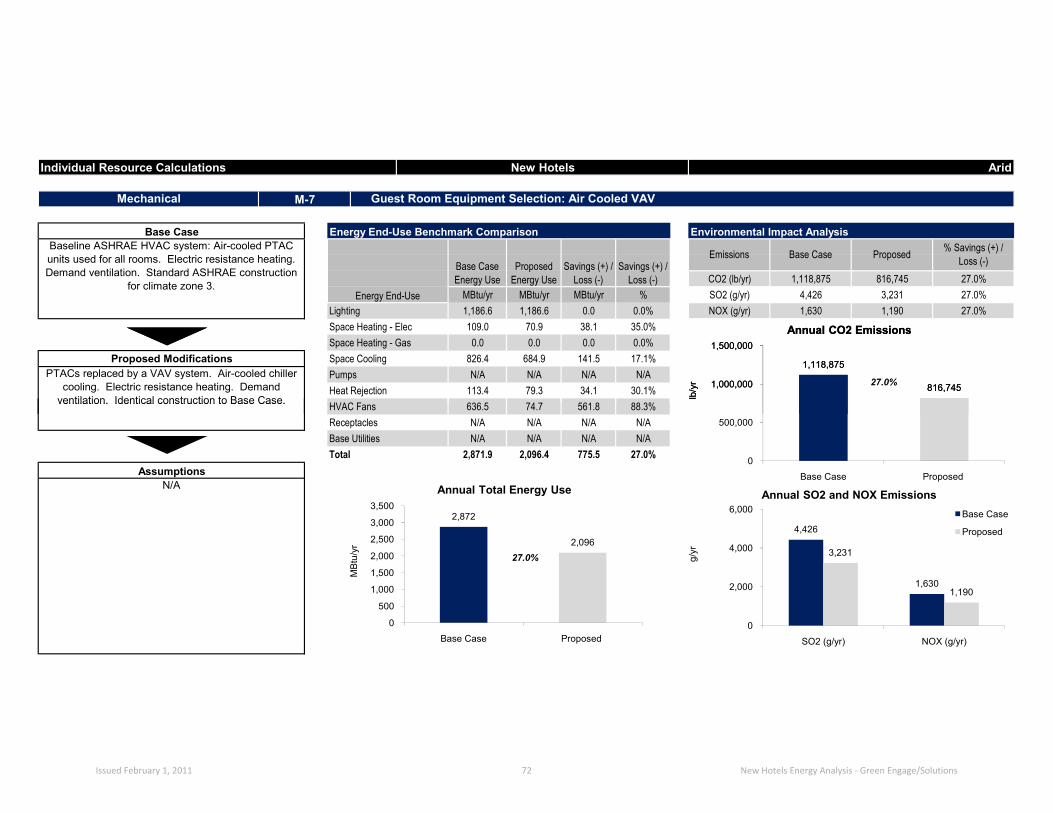
MBtu/yr MBtu/yr MBtu/yr %
Baseline ASHRAE HVAC system: Air-cooled PTAC units used for all rooms. Electric resistance heating. Demand ventilation. Standard ASHRAE construction
for climate zone 3.
Mechanical
Base Case Energy End-Use Benchmark Comparison Environmental Impact Analysis
Energy End-Use
Base Case Energy Use
Proposed Energy Use
Savings (+) / Loss (-)
Savings (+) / Loss (-) 27.0%
% Savings (+) / Loss (-)
Lighting 1,186.6 1,186.6 0.0 0.0%
M-7 Guest Room Equipment Selection: Air Cooled VAV
Emissions Base Case Proposed
SO2 (g/yr) 4,426 3,231 27.0%CO2 (lb/yr) 1,118,875 816,745
1,630 1,190 27.0%NOX (g/yr)
Heat Rejection 113.4 79.3 34.1N/A N/A
27.0%
Space Heating - Gas 0.0 0.0 0.0 0.0%
30.1%
Space Cooling 826.4 684.9 141.5 17.1%Pumps N/A N/A
Space Heating - Elec 109.0 70.9 38.1 35.0%
HVAC Fans 636 5 74 7 561 8
Proposed ModificationsPTACs replaced by a VAV system. Air-cooled chiller
cooling. Electric resistance heating. Demand ventilation. Identical construction to Base Case.
Individual Resource Calculations New Hotels Arid
88 3%
1,118,875
816,7451,000,000
1,500,000
lb/y
r
Annual CO2 Emissions
N/A N/A
Total 2,871.9 2,096.4 775.5
HVAC Fans 636.5 74.7 561.8
N/A
ventilation. Identical construction to Base Case.
Assumptions
27.0%
Base Utilities N/A N/A N/A N/A27.0%
88.3%Receptacles N/A N/A
1,118,875
816,745
0
500,000
1,000,000
1,500,000
Base Case Proposed
lb/y
r
Annual CO2 Emissions
4,426
1,630
3,231
1,190
0
2,000
4,000
6,000
SO2 (g/yr) NOX (g/yr)
g/yr
Annual SO2 and NOX EmissionsBase Case
Proposed2,872
2,096
0
500
1,000
1,500
2,000
2,500
3,000
3,500
Base Case Proposed
MBt
u/yr
Annual Total Energy Use
Issued February 1, 2011 72 New Hotels Energy Analysis - Green Engage/Solutions

Additional Capital CostHVAC Plant First Cost Reductions
Cooling Plant Savings ($450/ton)Heating Plant Savings ($7 55/MBh)
$0Electricity 227,277 kWh $0.0802 $18,222
Yr.Costs
(Marginal/Maint/Replace)
Savings (+) / Loss (-)
Natural gas 0 therms N/A
Cash FlowInitial Annual Savings
Initial Marginal Cost $176,746
$18,860
Gals N/A $0 0
IRR
$0 ($176,746) Simple Payback 8.3 yrs
3 $0 $20,203 $20,2032 $0
($176,746)
4 $0 $20,910 $20,910 First Year Yield On Marginal Cost
$22 400389 MBh $2 938 6 $0 $22 400tons $4,095 5 $0 $21,642 $21,642
($212,000)
9
Capital Costs Savings Summary
Annual Resource Cost Summary Financial Table
ResourceAnnual Resource Savings
(+) / Loss (-)
1 $0 $18,860 $18,860
10.7%
11.9%$19,520 $19,520
Water & sewer 0
Individual Resource Calculations New Hotels Arid
Guest Room Equipment Selection: Air Cooled VAV
Financial Results Summary
Unit CostAnnual Savings (+) /
Loss (-)
Mechanical M-7
Heating Plant Savings ($7.55/MBh)Airside Distribution Savings ($3.5/cfm)
Total Additional Capital Cost:
Estimated Useful Life (yrs)Percent replacedReplacement Cost
Base YearValuation TypeProject Analysis PeriodDiscount Rate for Defined ValuationEnergy Escalation Rate (Nominal)
7$22,400 NPV
8 $0 $23,995 $23,995
$103,401389 MBh $2,938 6 $0 $22,400$0 $23,184
$24,835 $24,835
20 11 $0 $26,604 $26,604Replacement Life and Cost Summary 10 $0 $25,704 $25,704
14 $0 $29,496 $29,496
Defined $0 $32,703 $32,7032008 16 $0 $31,597 $31,597
Financial Analysis 15 $0 $30,529 $30,529
6.00% 19 $0 $35,032 $35,0323.50% 20 $0 $36,258 $36,258
0% 12 $0 $27,535
20 18 $0
($176,746)8,063 cfm $28,221 $23,184
9 $0
$27,535
17$33,848 $33,848
$0 13 $0 $28,499 $28,499
($300,000)
($200,000)
($100,000)
$0
$100,000
$200,000
$300,000
$400,000
0 5 10 15 20
Net
Cas
h Fl
ow (E
nd o
f Yea
r)
Years
Simple Payback Graph
Issued February 1, 2011 73 New Hotels Energy Analysis - Green Engage/Solutions

MBtu/yr MBtu/yr MBtu/yr %
Baseline ASHRAE HVAC system: PTAC units used for all rooms. Air-cooled unitary cooling. Electric
resistance heating. Demand ventilation. Standard ASHRAE construction for climate zone 3.
Mechanical
Base Case Energy End-Use Benchmark Comparison Environmental Impact Analysis
Energy End-Use
Base Case Energy Use
Proposed Energy Use
Savings (+) / Loss (-)
Savings (+) / Loss (-) 35.5%
% Savings (+) / Loss (-)
Lighting 1,186.6 1,186.6 0.0 0.0%
M-7 Guest Room Equipment Selection: Water Cooled VAV
Emissions Base Case Proposed
SO2 (g/yr) 4,426 2,855 35.5%CO2 (lb/yr) 1,118,875 721,762
1,630 1,051 35.5%NOX (g/yr)
Heat Rejection 113.4 124.3 -10.9N/A N/A
35.5%
Space Heating - Gas 0.0 0.0 0.0 0.0%
-9.6%
Space Cooling 826.4 396.1 430.3 52.1%Pumps N/A N/A
Space Heating - Elec 109.0 70.9 38.1 35.0%
HVAC Fans 636 5 74 7 561 8
Proposed ModificationsPTACs replaced by a VAV system. Water-cooled
chiller cooling. Electric resistance heating. Demand ventilation. Identical construction to Base Case.
Individual Resource Calculations New Hotels Arid
88 3%
1,118,875
721,7621,000,000
1,500,000
lb/y
r
Annual CO2 Emissions
N/A N/A
Total 2,871.9 1,852.6 1,019.3
HVAC Fans 636.5 74.7 561.8
N/A
ventilation. Identical construction to Base Case.
Assumptions
35.5%
Base Utilities N/A N/A N/A N/A35.5%
88.3%Receptacles N/A N/A
1,118,875
721,762
0
500,000
1,000,000
1,500,000
Base Case Proposed
lb/y
r
Annual CO2 Emissions
4,426
1,630
2,855
1,051
0
2,000
4,000
6,000
SO2 (g/yr) NOX (g/yr)
g/yr
Annual SO2 and NOX EmissionsBase Case
Proposed2,872
1,853
0
500
1,000
1,500
2,000
2,500
3,000
3,500
Base Case Proposed
MBt
u/yr
Annual Total Energy Use
Issued February 1, 2011 74 New Hotels Energy Analysis - Green Engage/Solutions

Additional Capital CostHVAC Plant First Cost Reductions
Cooling Plant Savings ($450/ton)Heating Plant Savings ($7 55/MBh)
$0Electricity 298,727 kWh $0.0802 $23,951
Yr.Costs
(Marginal/Maint/Replace)
Savings (+) / Loss (-)
Natural gas 0 therms N/A
Cash FlowInitial Annual Savings
Initial Marginal Cost $179,386
$24,789
Gals N/A $0 0
IRR
$0 ($179,386) Simple Payback 6.6 yrs
3 $0 $26,555 $26,5552 $0
($179,386)
4 $0 $27,484 $27,484 First Year Yield On Marginal Cost
$29 442389 MBh $2 938 6 $0 $29 442tons $4,095 5 $0 $28,446 $28,446
($214,640)
9
Capital Costs Savings Summary
Annual Resource Cost Summary Financial Table
ResourceAnnual Resource Savings
(+) / Loss (-)
1 $0 $24,789 $24,789
13.8%
15.9%$25,657 $25,657
Water & sewer 0
Individual Resource Calculations New Hotels Arid
Guest Room Equipment Selection: Water Cooled VAV
Financial Results Summary
Unit CostAnnual Savings (+) /
Loss (-)
Mechanical M-7
Heating Plant Savings ($7.55/MBh)Airside Distribution Savings ($3.5/cfm)
Total Additional Capital Cost:
Estimated Useful Life (yrs)Percent replacedReplacement Cost
Base YearValuation TypeProject Analysis PeriodDiscount Rate for Defined ValuationEnergy Escalation Rate (Nominal)
7$29,442 NPV
8 $0 $31,539 $31,539
$185,837389 MBh $2,938 6 $0 $29,442$0 $30,472
$32,643 $32,643
20 11 $0 $34,968 $34,968Replacement Life and Cost Summary 10 $0 $33,785 $33,785
14 $0 $38,769 $38,769
Defined $0 $42,984 $42,9842008 16 $0 $41,530 $41,530
Financial Analysis 15 $0 $40,126 $40,126
6.00% 19 $0 $46,046 $46,0463.50% 20 $0 $47,657 $47,657
0% 12 $0 $36,191
20 18 $0
($179,386)8,063 cfm $28,221 $30,472
9 $0
$36,191
17$44,488 $44,488
$0 13 $0 $37,458 $37,458
($300,000)($200,000)($100,000)
$0 $100,000 $200,000 $300,000 $400,000 $500,000 $600,000
0 5 10 15 20
Net
Cas
h Fl
ow (E
nd o
f Yea
r)
Years
Simple Payback Graph
Issued February 1, 2011 75 New Hotels Energy Analysis - Green Engage/Solutions

MBtu/yr MBtu/yr MBtu/yr %
VAV system with reheat used for all rooms. Cooling provided by water-cooled chiller with cooling tower. Electric resistance heating. Demand ventilation.
Standard ASHRAE construction for climate zone 3.
Mechanical
Base Case Energy End-Use Benchmark Comparison Environmental Impact Analysis
Energy End-Use
Base Case Energy Use
Proposed Energy Use
Savings (+) / Loss (-)
Savings (+) / Loss (-) 1.9%
% Savings (+) / Loss (-)
Lighting 1,186.6 1,186.6 0.0 0.0%
M-9 Variable Frequency Drives
Emissions Base Case Proposed
SO2 (g/yr) 2,855 2,800 1.9%CO2 (lb/yr) 721,762 707,737
1,051 1,031 1.9%NOX (g/yr)
Heat Rejection 124.3 124.3 0.0N/A N/A
1.9%
Space Heating - Gas 0.0 0.0 0.0 0.0%
0.0%
Space Cooling 396.1 396.1 0.0 0.0%Pumps N/A N/A
Space Heating - Elec 70.9 70.9 0.0 0.0%
HVAC Fans 74 7 38 7 36 0
Proposed ModificationsAs with Base Case, but with variable frequency drives
(VFDs) used in VAV system.
Individual Resource Calculations New Hotels Arid
48 2%
721,762 707,737
500,000
1,000,000
lb/y
r
Annual CO2 Emissions
N/A N/A
Total 1,852.6 1,816.6 36.0
HVAC Fans 74.7 38.7 36.0
N/AAssumptions
1.9%
Base Utilities N/A N/A N/A N/A1.9%
48.2%Receptacles N/A N/A
721,762 707,737
0
500,000
1,000,000
Base Case Proposed
lb/y
r
Annual CO2 Emissions
2,855
1,051
2,800
1,031
0
2,000
4,000
SO2 (g/yr) NOX (g/yr)
g/yr
Annual SO2 and NOX EmissionsBase Case
Proposed
1,853 1,817
0
500
1,000
1,500
2,000
Base Case Proposed
MBt
u/yr
Annual Total Energy Use
Issued February 1, 2011 76 New Hotels Energy Analysis - Green Engage/Solutions

Additional Capital CostHVAC Plant First Cost Reductions
Cooling Plant Savings ($450/ton)Heating Plant Savings ($7 55/MBh)
$0Electricity 10,551 kWh $0.0802 $846
Yr.Costs
(Marginal/Maint/Replace)
Savings (+) / Loss (-)
Natural gas 0 therms N/A
Cash FlowInitial Annual Savings
Initial Marginal Cost $4,945
$876
Gals N/A $0 0
IRR
$0 ($4,945) Simple Payback 5.3 yrs
3 $0 $938 $9382 $0
($4,945)
4 $0 $971 $971 First Year Yield On Marginal Cost
$1 0400 MBh $0 6 $0 $1 040tons $0 5 $0 $1,005 $1,005
($4,945)
0
Capital Costs Savings Summary
Annual Resource Cost Summary Financial Table
ResourceAnnual Resource Savings
(+) / Loss (-)
1 $0 $876 $876
17.7%
20.3%$906 $906
Water & sewer 0
Individual Resource Calculations New Hotels Arid
Variable Frequency Drives
Financial Results Summary
Unit CostAnnual Savings (+) /
Loss (-)
Mechanical M-9
Heating Plant Savings ($7.55/MBh)Airside Distribution Savings ($3.5/cfm)
Total Additional Capital Cost:
Estimated Useful Life (yrs)Percent replacedReplacement Cost
Base YearValuation TypeProject Analysis PeriodDiscount Rate for Defined ValuationEnergy Escalation Rate (Nominal)
7$1,040 NPV
8 $0 $1,114 $1,114
$7,8750 MBh $0 6 $0 $1,040$0 $1,076
$1,153 $1,153
20 11 $0 $1,235 $1,235Replacement Life and Cost Summary 10 $0 $1,193 $1,193
14 $0 $1,369 $1,369
Defined $0 $1,518 $1,5182008 16 $0 $1,467 $1,467
Financial Analysis 15 $0 $1,417 $1,417
6.00% 19 $0 $1,626 $1,6263.50% 20 $0 $1,683 $1,683
0% 12 $0 $1,278
20 18 $0
($4,945)0 cfm $0 $1,076
9 $0
$1,278
17$1,571 $1,571
$0 13 $0 $1,323 $1,323
($10,000)
($5,000)
$0
$5,000
$10,000
$15,000
$20,000
$25,000
0 5 10 15 20
Net
Cas
h Fl
ow (E
nd o
f Yea
r)
Years
Simple Payback Graph
Issued February 1, 2011 77 New Hotels Energy Analysis - Green Engage/Solutions

Proposed ModificationsAs with Base Case, but with a water-cooled chiller and
cooling tower.
HVAC Fans 74 7 74 7 0 0 0 0%124.3 -45.0 -56.7%
42.2%PumpsSpace Cooling 684.9 396.1 288.8
Space Heating - Elec 70.9 70.9 0.0 0.0%
N/A N/A N/A N/A11.6%
Space Heating - Gas 0.0 0.0 0.0 0.0%
Emissions Base Case Proposed
1,190 1,051 11.6%NOX (g/yr)
CO2 (lb/yr) 816,745 721,762 11.6%
Individual Resource Calculations New Hotels
SO2 (g/yr) 3,231 2,855 11.6%
% Savings (+) / Loss (-)
Arid
Mechanical
Base Case Energy End-Use Benchmark Comparison Environmental Impact Analysis
Energy End-Use
Base Case Energy Use
Proposed Energy Use
Savings (+) / Loss (-)
Savings (+) / Loss (-)
MBtu/yr MBtu/yr MBtu/yr %
VAV system with reheat used for all rooms. Cooling provided by air-cooled chiller. Electric resistance heating. Demand ventilation. Standard ASHRAE
construction for climate zone 3.
Lighting 1,186.6 1,186.6 0.0 0.0%
M-12 Water Cooled Chiller
Heat Rejection 79.3
816,745721,762
500,000
1,000,000
lb/y
r
Annual CO2 Emissions
Assumptions
11.6%
N/A
11.6%Total 2,096.4 1,852.6 243.8
HVAC Fans 74.7 74.7 0.0 0.0%Receptacles N/A N/A N/A N/ABase Utilities N/A N/A N/A N/A
816,745721,762
0
500,000
1,000,000
Base Case Proposed
lb/y
r
Annual CO2 Emissions
3,231
1,190
2,855
1,051
0
2,000
4,000
SO2 (g/yr) NOX (g/yr)
g/yr
Annual SO2 and NOX EmissionsBase Case
Proposed
2,0961,853
0
500
1,000
1,500
2,000
2,500
Base Case Proposed
MBt
u/yr
Annual Total Energy Use
Issued February 1, 2011 78 New Hotels Energy Analysis - Green Engage/Solutions

Additional Capital CostHVAC Plant First Cost Reductions
Cooling Plant Savings ($450/ton)Heating Plant Savings ($7 55/MBh)
Water Cooled Chiller
1 $0 $5,929 $5,929Capital Costs Savings Summary
0 tons $0 5 $0 $6,804
Water & sewer 0 Gals N/A $0
($10,000) 3 $0 $6,351 $6,3512 $0 $6,137 $6,137 IRR
$6,80459.3%4
0
Cash Flow
0 $0 6 $0 $7 042 $7 042MBh
($10,000)
$0 $6,574 $6,574 First Year Yield On Marginal Cost
$0 ($10,000) Simple Payback 1.7 yrs
62.8%
Initial Marginal Cost $10,000
$5,929
Financial Results Summary
ResourceAnnual Resource Savings
(+) / Loss (-)
M-12
Initial Annual SavingskWh $0.0802 $5,729Unit Cost
Annual Savings (+) / Loss (-)
Mechanical
Natural gas 0 therms N/A $0Electricity 71,451
Yr.Costs
(Marginal/Maint/Replace)
Savings (+) / Loss (-)
Annual Resource Cost Summary Financial Table
Individual Resource Calculations New Hotels Arid
Heating Plant Savings ($7.55/MBh)Airside Distribution Savings ($3.5/cfm)
Total Additional Capital Cost:
Estimated Useful Life (yrs)Percent replacedReplacement Cost
Base YearValuation TypeProject Analysis PeriodDiscount Rate for Defined ValuationEnergy Escalation Rate (Nominal)
$0 $7,288
9
0% 12 $0 $8,656 $8,656
19 $0 $11,013 $11,013
15 $0 $9,598 $9,598
3.50% 20 $0 $11,399 $11,3996.00%
Defined 17 $0 $10,281 $10,28120 18 $0 $10,641 $10,641
2008 16 $0 $9,933 $9,933Financial Analysis
$0 13 $0 $8,959 $8,95914 $0 $9,273 $9,273
Replacement Life and Cost Summary 10 $0 $8,081 $8,081
0 $0 6 $0
($10,000)0 cfm $0
$0 $7,808 $7,808
7
20 11 $0 $8,364 $8,364
$7,042 $7,042 NPV
8 $0 $7,544 $7,544
$75,493$7,288
MBh
($20,000)$0
$20,000 $40,000 $60,000 $80,000
$100,000 $120,000 $140,000 $160,000 $180,000
0 5 10 15 20Net
Cas
h Fl
ow (E
nd o
f Yea
r)
Years
Simple Payback Graph
Issued February 1, 2011 79 New Hotels Energy Analysis - Green Engage/Solutions

Proposed ModificationsAs with Base Case, but with an evaporative cooling
system.
HVAC Fans 74 7 72 6 2 1 2 8%106.7 17.6 14.2%
13.6%PumpsSpace Cooling 396.1 342.1 54.0
Space Heating - Elec 70.9 70.9 0.0 0.0%
N/A N/A N/A N/A4.0%
Space Heating - Gas 0.0 0.0 0.0 0.0%
Emissions Base Case Proposed
1,051 1,010 4.0%NOX (g/yr)
CO2 (lb/yr) 721,762 693,049 4.0%
Individual Resource Calculations New Hotels
SO2 (g/yr) 2,855 2,742 4.0%
% Savings (+) / Loss (-)
Arid
Mechanical
Base Case Energy End-Use Benchmark Comparison Environmental Impact Analysis
Energy End-Use
Base Case Energy Use
Proposed Energy Use
Savings (+) / Loss (-)
Savings (+) / Loss (-)
MBtu/yr MBtu/yr MBtu/yr %
VAV system with reheat used for all rooms. Cooling provided by water-cooled chiller with cooling tower. Electric resistance heating. Demand ventilation.
Standard ASHRAE construction for climate zone 3.
Lighting 1,186.6 1,186.6 0.0 0.0%
M-13 Evaporative Cooling
Heat Rejection 124.3
721,762 693,049
500,000
1,000,000
lb/y
r
Annual CO2 Emissions
Assumptions
4.0%
N/A
4.0%Total 1,852.6 1,778.9 73.7
HVAC Fans 74.7 72.6 2.1 2.8%Receptacles N/A N/A N/A N/ABase Utilities N/A N/A N/A N/A
721,762 693,049
0
500,000
1,000,000
Base Case Proposed
lb/y
r
Annual CO2 Emissions
2,855
1,051
2,742
1,010
0
2,000
4,000
SO2 (g/yr) NOX (g/yr)
g/yr
Annual SO2 and NOX EmissionsBase Case
Proposed
1,853 1,779
0
500
1,000
1,500
2,000
Base Case Proposed
MBt
u/yr
Annual Total Energy Use
Issued February 1, 2011 80 New Hotels Energy Analysis - Green Engage/Solutions

Additional Capital CostHVAC Plant First Cost Reductions
Cooling Plant Savings ($450/ton)Heating Plant Savings ($7 55/MBh)
Evaporative Cooling
1 $0 $1,792 $1,792Capital Costs Savings Summary
0 tons $0 5 $0 $2,057
Water & sewer 0 Gals N/A $0
($24,200) 3 $0 $1,920 $1,9202 $0 $1,855 $1,855 IRR
$2,0577.4%4
0
Cash Flow
0 $0 6 $0 $2 129 $2 129MBh
($24,200)
$0 $1,987 $1,987 First Year Yield On Marginal Cost
$0 ($24,200) Simple Payback 12 yrs
7.3%
Initial Marginal Cost $24,200
$1,792
Financial Results Summary
ResourceAnnual Resource Savings
(+) / Loss (-)
M-13
Initial Annual SavingskWh $0.0802 $1,732Unit Cost
Annual Savings (+) / Loss (-)
Mechanical
Natural gas 0 therms N/A $0Electricity 21,599
Yr.Costs
(Marginal/Maint/Replace)
Savings (+) / Loss (-)
Annual Resource Cost Summary Financial Table
Individual Resource Calculations New Hotels Arid
Heating Plant Savings ($7.55/MBh)Airside Distribution Savings ($3.5/cfm)
Total Additional Capital Cost:
Estimated Useful Life (yrs)Percent replacedReplacement Cost
Base YearValuation TypeProject Analysis PeriodDiscount Rate for Defined ValuationEnergy Escalation Rate (Nominal)
$0 $2,203
9
0% 12 $0 $2,617 $2,617
19 $0 $3,329 $3,329
15 $0 $2,901 $2,901
3.50% 20 $0 $3,446 $3,4466.00%
Defined 17 $0 $3,108 $3,10820 18 $0 $3,217 $3,217
2008 16 $0 $3,003 $3,003Financial Analysis
$0 13 $0 $2,708 $2,70814 $0 $2,803 $2,803
Replacement Life and Cost Summary 10 $0 $2,443 $2,443
0 $0 6 $0
($24,200)0 cfm $0
$0 $2,360 $2,360
7
20 11 $0 $2,528 $2,528
$2,129 $2,129 NPV
8 $0 $2,280 $2,280
$2,843$2,203
MBh
($30,000)
($20,000)
($10,000)
$0
$10,000
$20,000
$30,000
0 5 10 15 20
Net
Cas
h Fl
ow (E
nd o
f Yea
r)
Years
Simple Payback Graph
Issued February 1, 2011 81 New Hotels Energy Analysis - Green Engage/Solutions

Proposed ModificationsAs with Base Case, but including a thermal storage
unit.
HVAC Fans 74 7 74 7 0 0 0 0%124.3 0.0 0.0%
0.0%PumpsSpace Cooling 396.1 396.1 0.0
Space Heating - Elec 70.9 70.9 0.0 0.0%
N/A N/A N/A N/A0.0%
Space Heating - Gas 0.0 0.0 0.0 0.0%
Emissions Base Case Proposed
1,051 1,051 0.0%NOX (g/yr)
CO2 (lb/yr) 721,762 721,762 0.0%
Individual Resource Calculations New Hotels
SO2 (g/yr) 2,855 2,855 0.0%
% Savings (+) / Loss (-)
Arid
Mechanical
Base Case Energy End-Use Benchmark Comparison Environmental Impact Analysis
Energy End-Use
Base Case Energy Use
Proposed Energy Use
Savings (+) / Loss (-)
Savings (+) / Loss (-)
MBtu/yr MBtu/yr MBtu/yr %
VAV system with reheat used for all rooms. Cooling provided by water-cooled chiller with cooling tower. Electric resistance heating. Demand ventilation.
Standard ASHRAE construction for climate zone 3.
Lighting 1,186.6 1,186.6 0.0 0.0%
M-13 Thermal Storage
Heat Rejection 124.3
721,762 721,762
500,000
1,000,000
lb/y
r
Annual CO2 Emissions
Assumptions
0.0%
N/A
0.0%Total 1,852.6 1,852.6 0.0
HVAC Fans 74.7 74.7 0.0 0.0%Receptacles N/A N/A N/A N/ABase Utilities N/A N/A N/A N/A
721,762 721,762
0
500,000
1,000,000
Base Case Proposed
lb/y
r
Annual CO2 Emissions
2,855
1,051
2,855
1,051
0
2,000
4,000
SO2 (g/yr) NOX (g/yr)
g/yr
Annual SO2 and NOX EmissionsBase Case
Proposed
1,853 1,853
0
500
1,000
1,500
2,000
Base Case Proposed
MBt
u/yr
Annual Total Energy Use
Issued February 1, 2011 82 New Hotels Energy Analysis - Green Engage/Solutions

Additional Capital CostHVAC Plant First Cost Reductions
Cooling Plant Savings ($450/ton)Heating Plant Savings ($7 55/MBh)
Thermal Storage
1 $0 $4,505 $4,505Capital Costs Savings Summary
33 tons $15,039 5 $0 $5,170
Water & sewer 0 Gals N/A $0
($50,000) 3 $0 $4,826 $4,8262 $0 $4,663 $4,663 IRR
$5,17012.9%4
0
Cash Flow
0 $0 6 $0 $5 351 $5 351MBh
($34,961)
$0 $4,995 $4,995 First Year Yield On Marginal Cost
$0 ($34,961) Simple Payback 7 yrs
14.8%
Initial Marginal Cost $34,961
$4,505
Financial Results Summary
ResourceAnnual Resource Savings
(+) / Loss (-)
M-13
Initial Annual SavingskWh $0.0802 $4,353Unit Cost
Annual Savings (+) / Loss (-)
Mechanical
Natural gas 0 therms N/A $0Electricity 0
Yr.Costs
(Marginal/Maint/Replace)
Savings (+) / Loss (-)
Annual Resource Cost Summary Financial Table
Individual Resource Calculations New Hotels Arid
Heating Plant Savings ($7.55/MBh)Airside Distribution Savings ($3.5/cfm)
Total Additional Capital Cost:
Estimated Useful Life (yrs)Percent replacedReplacement Cost
Base YearValuation TypeProject Analysis PeriodDiscount Rate for Defined ValuationEnergy Escalation Rate (Nominal)
$0 $5,538
9
0% 12 $0 $6,578 $6,578
19 $0 $8,369 $8,369
15 $0 $7,293 $7,293
3.50% 20 $0 $8,662 $8,6626.00%
Defined 17 $0 $7,812 $7,81220 18 $0 $8,086 $8,086
2008 16 $0 $7,548 $7,548Financial Analysis
$0 13 $0 $6,808 $6,80814 $0 $7,046 $7,046
Replacement Life and Cost Summary 10 $0 $6,140 $6,140
0 $0 6 $0
($34,961)0 cfm $0
$0 $5,933 $5,933
7
20 11 $0 $6,355 $6,355
$5,351 $5,351 NPV
8 $0 $5,732 $5,732
$31,551$5,538
MBh
($60,000)($40,000)($20,000)
$0 $20,000 $40,000 $60,000 $80,000
$100,000
0 5 10 15 20
Net
Cas
h Fl
ow (E
nd o
f Yea
r)
Years
Simple Payback Graph
Issued February 1, 2011 83 New Hotels Energy Analysis - Green Engage/Solutions

Temperate
Issued February 1, 2011 84 New Hotels Energy Analysis - Green Engage/Solutions

Legend (Criteria Based On Simple Payback Only):Very Short or Immediate Payback (0 - 3 years)Intermediate Payback (3 - 7 years)Long or No Payback (>7 years)
19.4% $67,307$3,240
M-13 Thermal Storage 4.9 yrs 0.0% 22.2%M-13 Evaporative Cooling 12 yrs 2.2% 7.5% 7.5%
$15,938M-12 Water-Cooled Chiller 5.2 yrs 2.2% 20.9%M-9 Variable Frequency Drives 3.3 yrs 1.8% 32.4% 29.1%
18.2% $16,636
17.8% $17,617$27,836
M-4 Economiser Modes 5.3 yrs 2.4% 20.4%M-3 Heat Recovery 6.5 yrs 3.8% 16.1% 14.0%
32.7% $156,653$54,167
M-2 Demand Ventilation 3 yrs 13.8% 36.1%M-2 Dedicated outside air unit Immediate 2.1% N/A N/AB-3 Optimise Building Insulation 2.2 yrs 1.6% 49.1% 45.6% $17,687
Base Case: Best performing HVAC system: water cooled VAV systemB-1 Optimise Glazing 11 yrs 5.0% 8.2% 8.0% $11,910
M-7 Water Cooled VAV with FPP 3.3 yrs 7.8% 33.0%M-7 Air Cooled VAV with FPP
29.7% $78,9753.3 yrs 7.6% 33.1% 29.8% $79,109
$658,118
Base Case: Identical VAV system but without fan-powered parallel terminal units. Note: FPPs not modelled in hot climates.
M-7 Water Cooled VAV 2.8 yrs 41.5% 38.1% 34.7%34.5% $636,142
$627,987M-7 Air Cooled VAV 2.9 yrs 40.2% 37.9%M-7 Fan Coil Units 2.5 yrs 38.4% 42.4% 39.0%
Base Case: PTAC units with air-cooled unitary cooling and electric resistance heating. M-7 Condenser Water Heat Pump 3 yrs 33.9% 36.0% 32.6% $541,790
NPV(Over 20 Years)
yrs % % % $
Energy Modelling Results Summary New Hotels TemperateThe table below summarises the overall energy and financial performance for the modeled new hotel in the temperate climate zone against the baseline building. Energy savings for a specific building may vary based on that building's parameters and financial results may also vary based on local costs and financing structures. For details regarding each measure refer to the individual calculation pages immediately following this page. For detailed assumptions relating to the energy model, utilities, emission factors, financial inputs, cost of capital, etc refer to the assumptions section of this book.Note: CO2 reduction percentages closely match both source energy reductions and annual energy savings cost reductions. Due to different modeling methodologies existing hotel and new hotel CO2 reduction percentages cannot be compared against each other. The colour key contained below refers solely to simple payback periods.
Relevant Action Group Measure
TemperateNew York, NY
Simple Payback CO2 Reductions IRR First Year Yield On Marginal Cost
Issued February 1, 2011 85 New Hotels Energy Analysis - Green Engage/Solutions

Individual Resource Calculations New Hotels
VAV system with reheat used for all rooms. Cooling provided by water-cooled chiller with cooling tower.
Gas-fired boilers provide heating. Demand ventilation. Standard ASHRAE construction for climate zone 4.
B-1 Optimize GlazingBuilding Envelope
Base Case Energy End-Use Benchmark Comparison Environmental Impact Analysis
Energy End-Use
Base Case Energy Use
Proposed Energy Use
Savings (+) / Loss (-)
Savings (+) / Loss (-)
% Savings (+) / Loss (-)
Lighting
Emissions Base Case Proposed
Temperate
14.6 4.4 23.2%1,186.6 1,186.6 0.0 0.0%MBtu/yr MBtu/yr MBtu/yr %
N/A N/A
SO2 (lb/yr) 2,356 2,427 -3.0%935 922 1.4%NOX (lb/yr)
CO2 (lb/yr) 685,223 651,234 5.0%
19.0
-11.1%HVAC Fans 53 9 62 7 8 8 16 3%
Proposed ModificationsAs with Base Case, but with improved glazing
properties. SHGC is unchanged, U-value is reduced to 0.3.
Space Heating - Elec
Heat Rejection 73.3 81.4 -8.1N/A N/A
5.0%
Space Heating - Gas 769.0 323.3 445.7 58.0%Space Cooling 195.6 229.4 -33.8 -17.3%Pumps 685,223 651,234
500,000
1,000,000
lb/y
r
Annual CO2 Emissions
HVAC Fans 53.9 62.7 -8.8
Base Utilities N/A N/A N/A N/A
-16.3%Receptacles N/A N/A N/A N/A
Total 2,297.4 1,898.0 399.4 17.4%
17.4%
N/A
0.3.
Assumptions
685,223 651,234
0
500,000
1,000,000
Base Case Proposed
lb/y
r
Annual CO2 Emissions
2,356
935
2,427
922
0
2,000
4,000
SO2 (lb/yr) NOX (lb/yr)
g/yr
Annual SO2 and NOX EmissionsBase Case
Proposed
2,297
1,898
0
500
1,000
1,500
2,000
2,500
Base Case Proposed
MBt
u/yr
Annual Total Energy Use
Issued February 1, 2011 86 New Hotels Energy Analysis - Green Engage/Solutions

Additional Capital CostHVAC Plant First Cost Reductions
Cooling Plant Savings ($450/ton)Heating Plant Savings ($7 55/MBh)
11 yrs
Savings (+) / Loss (-)
Building Envelope
Natural gas 4,458 therms $1.5056 $6,712Electricity -13,569 kWh Initial Annual Savings
$60,133
$4,792
B-1
$0 ($60,133) Simple Payback
Financial Results Summary
Costs (Marginal/Maint/
Replace)Cash Flow
Initial Marginal Cost
($60,133)
$5,1332 $0
4 $0 $5,313 $5,313 First Year Yield On Marginal Cost
$5 691
8.0%
$4,960 $4,960 IRR
112 MBh $849 6 $0 $5 691
3 $0 $5,133
tons $1,512 5 $0 $5,4993
8.2%Capital Costs Savings Summary($63,866)
$5,499
Optimize Glazing
1 $0 $4,792 $4,792Water & sewer 0 Gals N/A $0 0
$0.1535 ($2,082)
Annual Resource Cost Summary Financial Table
ResourceAnnual Resource Savings
(+) / Loss (-) Unit CostAnnual Savings (+) /
Loss (-)Yr.
Individual Resource Calculations New Hotels Temperate
Heating Plant Savings ($7.55/MBh)Airside Distribution Savings ($3.5/cfm)
Total Additional Capital Cost:
Estimated Useful Life (yrs)Percent replacedReplacement Cost
Base YearValuation TypeProject Analysis PeriodDiscount Rate for Defined ValuationEnergy Escalation Rate (Nominal)
7$5,691 NPV112 MBh $849 6 $0 $5,691$5,891
8 $0 $6,097 $6,097
$11,910
20 11 $0 $6,760 $6,760Replacement Life and Cost Summary 10 $0 $6,531 $6,531
$7,241
$7,75714 $0 $7,495 $7,49515 $0
20 18 $0 $8,600 $8,600Defined
2008 16 $0 $8,028 $8,02817 $0 $8,309 $8,309
6.00% 19 $0 $8,901 $8,9013.50% 20 $0 $9,213 $9,213
0% 12 $0 $6,996 $6,996
$0 $5,891
Financial Analysis
($60,133)392 cfm $1,372
$6,310 $6,3109 $0
$7,757
$0 13 $0 $7,241
($80,000)($60,000)($40,000)($20,000)
$0 $20,000 $40,000 $60,000 $80,000
$100,000
0 5 10 15 20
Net
Cas
h Fl
ow (E
nd o
f Yea
r)
Years
Simple Payback Graph
Issued February 1, 2011 87 New Hotels Energy Analysis - Green Engage/Solutions

Individual Resource Calculations New Hotels Temperate
VAV system with reheat used for all rooms. Cooling provided by water-cooled chiller with cooling tower.
Gas-fired boilers provide heating. Demand ventilation. Standard ASHRAE construction for climate zone 4.
B-3 Optimize Building InsulationBuilding Envelope
Base Case Energy End-Use Benchmark Comparison Environmental Impact Analysis
Energy End-Use
Base Case Energy Use
Proposed Energy Use
Savings (+) / Loss (-)
Savings (+) / Loss (-) 1.6%
% Savings (+) / Loss (-)
MBtu/yr MBtu/yr MBtu/yr %Lighting 1,186.6 1,186.6 0.0 0.0%
Emissions Base Case Proposed
SO2 (lb/yr) 2,356 2,355 0.0%CO2 (lb/yr) 685,223 674,398
935 927 0.9%NOX (lb/yr)
Heat Rejection 73.3 72.5 0.8N/A N/A
1.6%
Space Heating - Gas 769.0 677.6 91.4 11.9%
1.1%
Space Cooling 195.6 197.5 -1.9 -1.0%Pumps N/A N/A
Space Heating - Elec 19.0 18.1 0.9 4.7%
1 1%HVAC Fans 53 9 53 3 0 6
Proposed ModificationsAs with Base Case, but with the overall wall U-value
reduced to 0.06.685,223 674,398
500,000
1,000,000
lb/y
r
Annual CO2 Emissions
1.1%Receptacles N/A N/A N/A N/A
Total 2,297.4 2,205.6 91.8
HVAC Fans 53.9 53.3 0.6
Base Utilities N/A N/A N/A N/A
4.0%
4.0%
N/AAssumptions
685,223 674,398
0
500,000
1,000,000
Base Case Proposed
lb/y
r
Annual CO2 Emissions
2,356
935
2,355
927
0
2,000
4,000
SO2 (lb/yr) NOX (lb/yr)
g/yr
Annual SO2 and NOX EmissionsBase Case
Proposed
2,297 2,206
0
500
1,000
1,500
2,000
2,500
Base Case Proposed
MBt
u/yr
Annual Total Energy Use
Issued February 1, 2011 88 New Hotels Energy Analysis - Green Engage/Solutions

Additional Capital CostHVAC Plant First Cost Reductions
Cooling Plant Savings ($450/ton)Heating Plant Savings ($7 55/MBh)
Initial Annual Savings
Financial Results Summary
Cash FlowInitial Marginal Cost $3,166
Electricity 117 kWh $0.1535 $18
B-3 Optimize Building Insulation
Costs (Marginal/Maint/
Replace)
Savings (+) / Loss (-)
Building Envelope
Natural gas 914 therms $1.5056 $1,377N/A $0 0 ($3,166)
ResourceAnnual Resource Savings
(+) / Loss (-) Unit CostAnnual Savings (+) /
Loss (-)Yr.
Water & sewer 0 Gals
$1,443
Simple Payback 2.2 yrs
$1,546$1,494$1,443
4 $0 $1,600 $1,600 First Year Yield On Marginal Cost 45.6%$1,6563 tons $1,265 5 $0 $1,656$1 71429 MBh $219 6 $0 $1 714
($10,120)
Individual Resource Calculations New Hotels Temperate
Capital Costs Savings Summary
Annual Resource Cost Summary Financial Table
IRR
1 $0 $1,443
49.1%
$0 ($3,166)
3 $0 $1,5462 $0 $1,494
Heating Plant Savings ($7.55/MBh)Airside Distribution Savings ($3.5/cfm)
Total Additional Capital Cost:
Estimated Useful Life (yrs)Percent replacedReplacement Cost
Base YearValuation TypeProject Analysis PeriodDiscount Rate for Defined ValuationEnergy Escalation Rate (Nominal)
7 $1,774
$0
$1,714 NPV
8 $0 $1,836 $1,836
29 MBh $219 6 $0 $1,714$1,774
$17,687
14 $0 $2,257 $2,257
20 11 $0 $2,036 $2,0360% 12 $0
Financial Analysis 15 $0 $2,336 $2,3362008 16 $0 $2,418 $2,418
3.50% 20 $0 $2,775 $2,7756.00% 19 $0 $2,681 $2,681
Defined 17 $0 $2,503 $2,50320 18 $0
$1,901 $1,901
$0
9$1,967 $1,967
($3,166)1,563 cfm $5,471
$2,107 $2,107
$2,590 $2,590
$0 13 $0 $2,181 $2,181
Replacement Life and Cost Summary 10 $0
($10,000)($5,000)
$0 $5,000
$10,000 $15,000 $20,000 $25,000 $30,000 $35,000 $40,000
0 5 10 15 20
Net
Cas
h Fl
ow (E
nd o
f Yea
r)
Years
Simple Payback Graph
Issued February 1, 2011 89 New Hotels Energy Analysis - Green Engage/Solutions

Energy End-Use Benchmark Comparison
Individual Resource Calculations New Hotels Temperate
Proposed ModificationsAs with Base Case, but including a dedicated outside
air unit. 73.3 70.6 2.7HVAC Fans 53 9 44 0 9 9 18 4%
Space Cooling 195.6 210.6 -15.0
Space Heating - Elec 19.0 9.7 9.3 48.9%
N/A N/A N/A N/A2.1%
Space Heating - Gas 769.0 670.4 98.6 12.8%
SO2 (lb/yr) 2,356 2,345 0.5%
% Savings (+) / Loss (-)Emissions Base Case Proposed
935 922 1.3%NOX (lb/yr)
CO2 (lb/yr) 685,223 671,025 2.1%
VAV system with reheat used for all rooms. Cooling provided by water-cooled chiller with cooling tower.
Gas-fired boilers provide heating. Demand ventilation. Standard ASHRAE construction for climate zone 4.
Lighting 1,186.6 1,186.6 0.0 0.0%
M-2 Dedicated Outside Air Unit
Heat Rejection
Environmental Impact Analysis
Energy End-Use
Base Case Energy Use
Proposed Energy Use
Savings (+) / Loss (-)
Savings (+) / Loss (-)
MBtu/yr MBtu/yr MBtu/yr %
3.7%
-7.7%Pumps
Mechanical
Base Case
685,223 671,025
500,000
1,000,000
lb/y
r
Annual CO2 Emissions
Assumptions
4.6%
N/A
4.6%Total 2,297.4 2,191.9 105.5
HVAC Fans 53.9 44.0 9.9 18.4%Receptacles N/A N/A N/A N/ABase Utilities N/A N/A N/A N/A
685,223 671,025
0
500,000
1,000,000
Base Case Proposed
lb/y
r
Annual CO2 Emissions
2,356
935
2,345
922
0
2,000
4,000
SO2 (lb/yr) NOX (lb/yr)
g/yr
Annual SO2 and NOX EmissionsBase Case
Proposed
2,297 2,192
0
500
1,000
1,500
2,000
2,500
Base Case Proposed
MBt
u/yr
Annual Total Energy Use
Issued February 1, 2011 90 New Hotels Energy Analysis - Green Engage/Solutions

Additional Capital CostHVAC Plant First Cost Reductions
Cooling Plant Savings ($450/ton)Heating Plant Savings ($7 55/MBh)
5 tons $2,318 5 $0 $2,132
Dedicated Outside Air Unit
Water & sewer 0 Gals N/A $0
($9,695) 3 $0 $1,990 $1,9902 $0 $1,923 $1,923 IRR
1 $0 $1,858 $1,858Capital Costs Savings Summary
$2,132N/A4
0
Cash FlowSavings (+) / Loss (-)
440 $3 322 6 $0 $2 207 $2 207MBh
$29,205
$0 $2,060 $2,060 First Year Yield On Marginal Cost
$0 $29,205 Simple Payback Immediate
N/A
Initial Marginal Cost ($29,205)
$1,858
ResourceAnnual Resource Savings
(+) / Loss (-)
M-2
Initial Annual SavingskWh $0.1535 $310Unit Cost
Annual Savings (+) / Loss (-)
Mechanical
Natural gas 986 therms $1.5056 $1,485Electricity 2,022
Yr.Costs
(Marginal/Maint/Replace)
Annual Resource Cost Summary Financial Table
Individual Resource Calculations New Hotels Temperate
Financial Results Summary
Heating Plant Savings ($7.55/MBh)Airside Distribution Savings ($3.5/cfm)
Total Additional Capital Cost:
Estimated Useful Life (yrs)Percent replacedReplacement Cost
Base YearValuation TypeProject Analysis PeriodDiscount Rate for Defined ValuationEnergy Escalation Rate (Nominal)
$0 $2,284
9
0% 12 $0 $2,713 $2,713
19 $0 $3,451 $3,451
15 $0 $3,008 $3,008
3.50% 20 $0 $3,572 $3,5726.00%
Defined 17 $0 $3,222 $3,22220 18 $0 $3,335 $3,335
2008 16 $0 $3,113 $3,113Financial Analysis
$0 13 $0 $2,808 $2,80814 $0 $2,906 $2,906
Replacement Life and Cost Summary 10 $0 $2,532 $2,532
440 $3,322 6 $0
$29,2059,503 cfm $33,261
$0 $2,447 $2,447
7
20 11 $0 $2,621 $2,621
$2,207 $2,207 NPV
8 $0 $2,364 $2,364
$54,167$2,284
MBh
$0 $10,000 $20,000 $30,000 $40,000 $50,000 $60,000 $70,000 $80,000 $90,000
0 5 10 15 20
Net
Cas
h Fl
ow (E
nd o
f Yea
r)
Years
Simple Payback Graph
Issued February 1, 2011 91 New Hotels Energy Analysis - Green Engage/Solutions
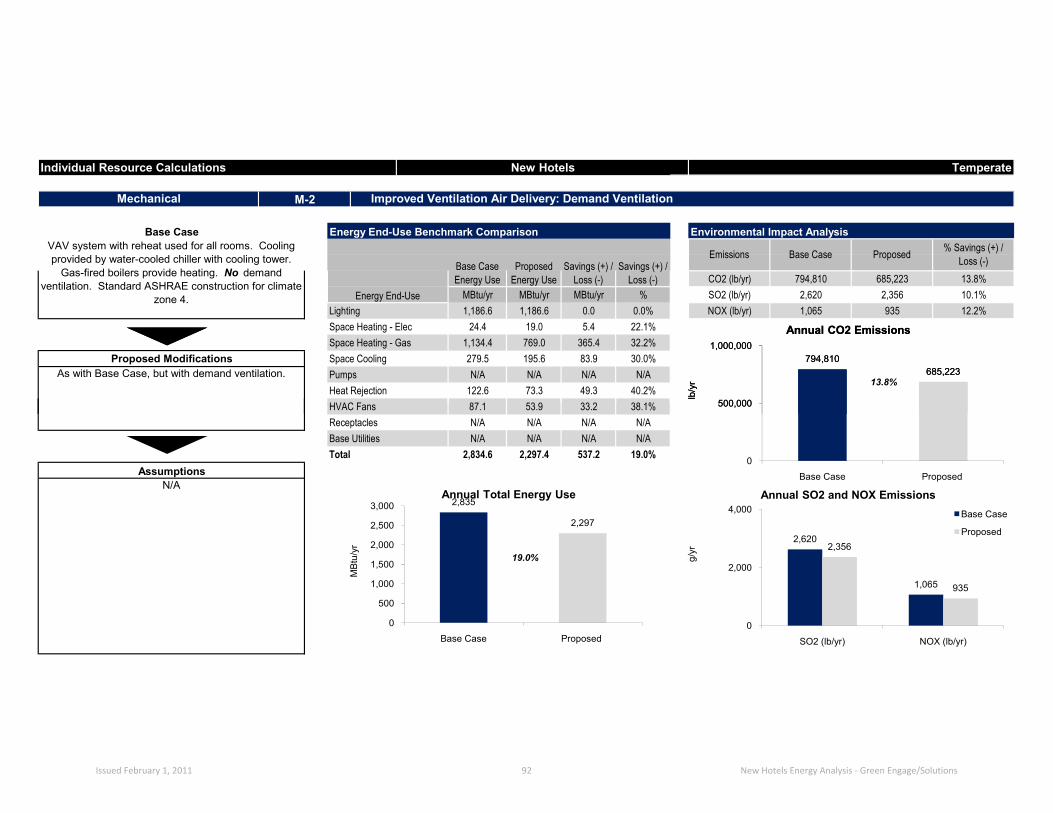
Individual Resource Calculations New Hotels Temperate
MBtu/yr MBtu/yr MBtu/yr %
VAV system with reheat used for all rooms. Cooling provided by water-cooled chiller with cooling tower.
Gas-fired boilers provide heating. No demand ventilation. Standard ASHRAE construction for climate
zone 4.
Mechanical
Base Case Energy End-Use Benchmark Comparison Environmental Impact Analysis
Energy End-Use
Base Case Energy Use
Proposed Energy Use
Savings (+) / Loss (-)
Savings (+) / Loss (-) 13.8%
% Savings (+) / Loss (-)
Lighting 1,186.6 1,186.6 0.0 0.0%
M-2 Improved Ventilation Air Delivery: Demand Ventilation
Emissions Base Case Proposed
SO2 (lb/yr) 2,620 2,356 10.1%CO2 (lb/yr) 794,810 685,223
1,065 935 12.2%NOX (lb/yr)
Heat Rejection 122.6 73.3 49.3N/A N/A
13.8%
Space Heating - Gas 1,134.4 769.0 365.4 32.2%
40.2%
Space Cooling 279.5 195.6 83.9 30.0%Pumps N/A N/A
Space Heating - Elec 24.4 19.0 5.4 22.1%
38 1%HVAC Fans 87 1 53 9 33 2
Proposed ModificationsAs with Base Case, but with demand ventilation.
794,810685,223
500,000
1,000,000
lb/y
r
Annual CO2 Emissions
38.1%Receptacles N/A N/A N/A N/A
Total 2,834.6 2,297.4 537.2
HVAC Fans 87.1 53.9 33.2
19.0%
Base Utilities N/A N/A N/A N/A19.0%
N/AAssumptions
794,810685,223
0
500,000
1,000,000
Base Case Proposed
lb/y
r
Annual CO2 Emissions
2,620
1,065
2,356
935
0
2,000
4,000
SO2 (lb/yr) NOX (lb/yr)
g/yr
Annual SO2 and NOX EmissionsBase Case
Proposed
2,835
2,297
0
500
1,000
1,500
2,000
2,500
3,000
Base Case Proposed
MBt
u/yr
Annual Total Energy Use
Issued February 1, 2011 92 New Hotels Energy Analysis - Green Engage/Solutions

Additional Capital CostHVAC Plant First Cost Reductions
Cooling Plant Savings ($450/ton)Heating Plant Savings ($7 55/MBh)
$5,503Electricity 50,350 kWh $0.1535 $7,727
Yr.Costs
(Marginal/Maint/Replace)
Savings (+) / Loss (-)
Mechanical
Natural gas 3,655 therms $1.5056
M-2
Annual Resource Cost Summary
Cash FlowInitial Annual Savings
Initial Marginal Cost $41,847
$13,693
$0 ($41,847) Simple Payback 3 yrs
4 $0 $15,182 $15,182 First Year Yield On Marginal Cost
$16 263
IRR3 $0 $14,668 $14,6682 $0
3 MBh $23 6 $0 $16 263tons $99 5 $0 $15,713 $15,713
($42,000)36.1%$14,172 $14,172
Water & sewer 0 Gals N/A $0 0 ($41,847)
Individual Resource Calculations New Hotels Temperate
Improved Ventilation Air Delivery: Demand Ventilation
Financial Results Summary
Unit CostAnnual Savings (+) /
Loss (-)
0
Capital Costs Savings Summary
32.7%
Financial Table
ResourceAnnual Resource Savings
(+) / Loss (-)
1 $0 $13,693 $13,693
Heating Plant Savings ($7.55/MBh)Airside Distribution Savings ($3.5/cfm)
Total Additional Capital Cost:
Estimated Useful Life (yrs)Percent replacedReplacement Cost
Base YearValuation TypeProject Analysis PeriodDiscount Rate for Defined ValuationEnergy Escalation Rate (Nominal)
7$16,263 NPV
8 $0 $17,421 $17,421
$156,6533 MBh $23 6 $0 $16,263$0 $16,832
$18,031 $18,031
20 11 $0 $19,315 $19,315Replacement Life and Cost Summary 10 $0 $18,662 $18,662
$0 $22,165 $22,16514 $0 $21,415 $21,415
3.50% 20 $0 $26,325 $26,3256.00% 19 $0 $25,434 $25,434
$19,991
Defined $0 $23,743 $23,74320 18 $0
$0 $20,691 $20,691
2008 16 $0 $22,940 $22,940Financial Analysis 15
($41,847)9 cfm $32 $16,832
9 $0
$19,991
17$24,574 $24,574
$0 130% 12 $0
($100,000)($50,000)
$0 $50,000
$100,000 $150,000 $200,000 $250,000 $300,000 $350,000 $400,000
0 5 10 15 20
Net
Cas
h Fl
ow (E
nd o
f Yea
r)
Years
Simple Payback Graph
Issued February 1, 2011 93 New Hotels Energy Analysis - Green Engage/Solutions

Individual Resource Calculations New Hotels Temperate
MBtu/yr MBtu/yr MBtu/yr %
VAV system with reheat used for all rooms. Cooling provided by water-cooled chiller with cooling tower.
Gas-fired boilers provide heating. Demand ventilation. Standard ASHRAE construction for climate zone 4.
Mechanical
Base Case Energy End-Use Benchmark Comparison Environmental Impact Analysis
Energy End-Use
Base Case Energy Use
Proposed Energy Use
Savings (+) / Loss (-)
Savings (+) / Loss (-) 3.8%
% Savings (+) / Loss (-)
Lighting 1,186.6 1,186.6 0.0 0.0%
M-3 Heat Recovery
Emissions Base Case Proposed
SO2 (lb/yr) 2,356 2,403 -2.0%CO2 (lb/yr) 685,223 659,047
935 924 1.2%NOX (lb/yr)
Heat Rejection 73.3 74.3 -1.0N/A N/A
3.8%
Space Heating - Gas 769.0 441.3 327.7 42.6%
-1.4%
Space Cooling 195.6 220.9 -25.3 -12.9%Pumps N/A N/A
Space Heating - Elec 19.0 9.7 9.3 48.9%
26 0%HVAC Fans 53 9 67 9 14 0
Proposed ModificationsAs with Base Case, but including a dedicated outside
air unit and a ventilation heat recovery unit.685,223 659,047
500,000
1,000,000
lb/y
r
Annual CO2 Emissions
-26.0%Receptacles N/A N/A N/A N/A
Total 2,297.4 2,000.7 296.7
HVAC Fans 53.9 67.9 -14.0
12.9%
Base Utilities N/A N/A N/A N/A12.9%
N/AAssumptions
685,223 659,047
0
500,000
1,000,000
Base Case Proposed
lb/y
r
Annual CO2 Emissions
2,356
935
2,403
924
0
2,000
4,000
SO2 (lb/yr) NOX (lb/yr)
g/yr
Annual SO2 and NOX EmissionsBase Case
Proposed
2,2972,001
0
500
1,000
1,500
2,000
2,500
Base Case Proposed
MBt
u/yr
Annual Total Energy Use
Issued February 1, 2011 94 New Hotels Energy Analysis - Green Engage/Solutions
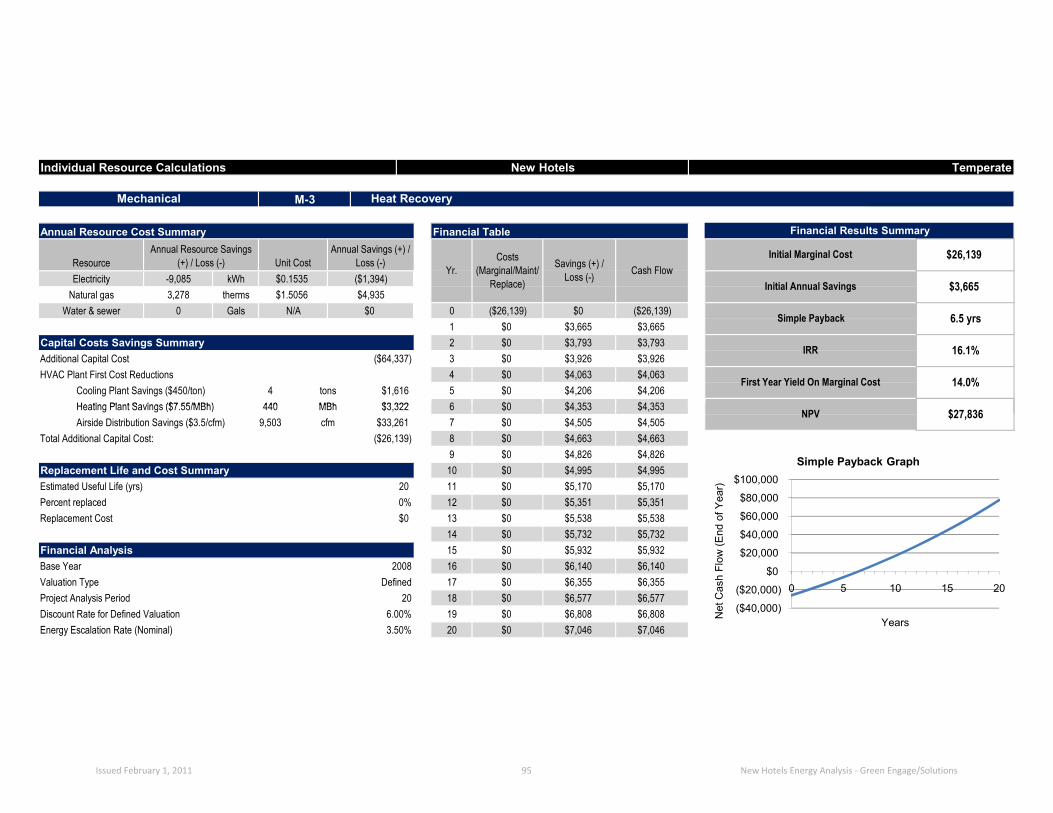
Additional Capital CostHVAC Plant First Cost Reductions
Cooling Plant Savings ($450/ton)Heating Plant Savings ($7 55/MBh)
$4,935Electricity -9,085 kWh $0.1535 ($1,394)
Yr.Costs
(Marginal/Maint/Replace)
Savings (+) / Loss (-)
Mechanical
Natural gas 3,278 therms $1.5056
M-3
Annual Resource Cost Summary
Cash FlowInitial Annual Savings
Initial Marginal Cost $26,139
$3,665
$0 ($26,139) Simple Payback 6.5 yrs
4 $0 $4,063 $4,063 First Year Yield On Marginal Cost
$4 353
IRR3 $0 $3,926 $3,9262 $0
440 MBh $3 322 6 $0 $4 353tons $1,616 5 $0 $4,206 $4,206
($64,337)16.1%$3,793 $3,793
Water & sewer 0 Gals N/A $0 0 ($26,139)
Individual Resource Calculations New Hotels Temperate
Heat Recovery
Financial Results Summary
Unit CostAnnual Savings (+) /
Loss (-)
4
Capital Costs Savings Summary
14.0%
Financial Table
ResourceAnnual Resource Savings
(+) / Loss (-)
1 $0 $3,665 $3,665
Heating Plant Savings ($7.55/MBh)Airside Distribution Savings ($3.5/cfm)
Total Additional Capital Cost:
Estimated Useful Life (yrs)Percent replacedReplacement Cost
Base YearValuation TypeProject Analysis PeriodDiscount Rate for Defined ValuationEnergy Escalation Rate (Nominal)
7$4,353 NPV
8 $0 $4,663 $4,663
$27,836440 MBh $3,322 6 $0 $4,353$0 $4,505
$4,826 $4,826
20 11 $0 $5,170 $5,170Replacement Life and Cost Summary 10 $0 $4,995 $4,995
$0 $5,932 $5,93214 $0 $5,732 $5,732
3.50% 20 $0 $7,046 $7,0466.00% 19 $0 $6,808 $6,808
$5,351
Defined $0 $6,355 $6,35520 18 $0
$0 $5,538 $5,538
2008 16 $0 $6,140 $6,140Financial Analysis 15
($26,139)9,503 cfm $33,261 $4,505
9 $0
$5,351
17$6,577 $6,577
$0 130% 12 $0
($40,000)
($20,000)
$0
$20,000
$40,000
$60,000
$80,000
$100,000
0 5 10 15 20
Net
Cas
h Fl
ow (E
nd o
f Yea
r)
Years
Simple Payback Graph
Issued February 1, 2011 95 New Hotels Energy Analysis - Green Engage/Solutions

Individual Resource Calculations New Hotels Temperate
MBtu/yr MBtu/yr MBtu/yr %
VAV system with reheat used for all rooms. Cooling provided by water-cooled chiller with cooling tower.
Gas-fired boilers provide heating. Demand ventilation. Standard ASHRAE construction for climate zone 4.
Mechanical
Base Case Energy End-Use Benchmark Comparison Environmental Impact Analysis
Energy End-Use
Base Case Energy Use
Proposed Energy Use
Savings (+) / Loss (-)
Savings (+) / Loss (-) 2.4%
% Savings (+) / Loss (-)
Lighting 1,186.6 1,186.6 0.0 0.0%
M-4 Economizer Modes
Emissions Base Case Proposed
SO2 (lb/yr) 2,356 2,291 2.7%CO2 (lb/yr) 685,223 668,884
935 911 2.5%NOX (lb/yr)
Heat Rejection 73.3 64.0 9.3N/A N/A
2.4%
Space Heating - Gas 769.0 769.2 -0.2 0.0%
12.7%
Space Cooling 195.6 162.9 32.7 16.7%Pumps N/A N/A
Space Heating - Elec 19.0 19.1 -0.1 -0.5%
0 2%HVAC Fans 53 9 53 8 0 1
Proposed ModificationsAs with Base Case, but with an enthalpy economizer. 685,223 668,884
500,000
1,000,000
lb/y
r
Annual CO2 Emissions
0.2%Receptacles N/A N/A N/A N/A
Total 2,297.4 2,255.6 41.8
HVAC Fans 53.9 53.8 0.1
1.8%
Base Utilities N/A N/A N/A N/A1.8%
N/AAssumptions
685,223 668,884
0
500,000
1,000,000
Base Case Proposed
lb/y
r
Annual CO2 Emissions
2,356
935
2,291
911
0
2,000
4,000
SO2 (lb/yr) NOX (lb/yr)
g/yr
Annual SO2 and NOX EmissionsBase Case
Proposed
2,297 2,256
0
500
1,000
1,500
2,000
2,500
Base Case Proposed
MBt
u/yr
Annual Total Energy Use
Issued February 1, 2011 96 New Hotels Energy Analysis - Green Engage/Solutions

Additional Capital CostHVAC Plant First Cost Reductions
Cooling Plant Savings ($450/ton)Heating Plant Savings ($7 55/MBh)
-$3Electricity 12,309 kWh $0.1535 $1,889
Yr.Costs
(Marginal/Maint/Replace)
Savings (+) / Loss (-)
Mechanical
Natural gas -2 therms $1.5056
M-4
Annual Resource Cost Summary
Cash FlowInitial Annual Savings
Initial Marginal Cost $10,963
$1,952
$0 ($10,963) Simple Payback 5.3 yrs
4 $0 $2,164 $2,164 First Year Yield On Marginal Cost
$2 318
IRR3 $0 $2,091 $2,0912 $0
0 MBh $0 6 $0 $2 318tons $0 5 $0 $2,240 $2,240
($10,963)20.4%$2,020 $2,020
Water & sewer 0 Gals N/A $0 0 ($10,963)
Individual Resource Calculations New Hotels Temperate
Economizer Modes
Financial Results Summary
Unit CostAnnual Savings (+) /
Loss (-)
0
Capital Costs Savings Summary
17.8%
Financial Table
ResourceAnnual Resource Savings
(+) / Loss (-)
1 $0 $1,952 $1,952
Heating Plant Savings ($7.55/MBh)Airside Distribution Savings ($3.5/cfm)
Total Additional Capital Cost:
Estimated Useful Life (yrs)Percent replacedReplacement Cost
Base YearValuation TypeProject Analysis PeriodDiscount Rate for Defined ValuationEnergy Escalation Rate (Nominal)
7$2,318 NPV
8 $0 $2,483 $2,483
$17,6170 MBh $0 6 $0 $2,318$0 $2,399
$2,570 $2,570
20 11 $0 $2,753 $2,753Replacement Life and Cost Summary 10 $0 $2,660 $2,660
$0 $3,160 $3,16014 $0 $3,053 $3,053
3.50% 20 $0 $3,753 $3,7536.00% 19 $0 $3,626 $3,626
$2,850
Defined $0 $3,385 $3,38520 18 $0
$0 $2,950 $2,950
2008 16 $0 $3,270 $3,270Financial Analysis 15
($10,963)0 cfm $0 $2,399
9 $0
$2,850
17$3,503 $3,503
$0 130% 12 $0
($20,000)
($10,000)
$0
$10,000
$20,000
$30,000
$40,000
$50,000
0 5 10 15 20
Net
Cas
h Fl
ow (E
nd o
f Yea
r)
Years
Simple Payback Graph
Issued February 1, 2011 97 New Hotels Energy Analysis - Green Engage/Solutions

Individual Resource Calculations New Hotels Temperate
MBtu/yr MBtu/yr MBtu/yr %
Baseline ASHRAE HVAC system: PTAC units used for all rooms. Air-cooled unitary cooling. Electric
resistance heating. Demand ventilation. Standard ASHRAE construction for climate zone 4.
Mechanical
Base Case Energy End-Use Benchmark Comparison Environmental Impact Analysis
Energy End-Use
Base Case Energy Use
Proposed Energy Use
Savings (+) / Loss (-)
Savings (+) / Loss (-) 33.9%
% Savings (+) / Loss (-)
Lighting 1,186.6 1,186.6 0.0 0.0%
M-7 Guest Room Equipment Selection: Condensor Water Heat Pump
Emissions Base Case Proposed
SO2 (lb/yr) 4,631 3,061 33.9%CO2 (lb/yr) 1,170,535 773,812
1,705 1,127 33.9%NOX (lb/yr)
Heat Rejection 45.9 74.8 -28.9N/A N/A
33.9%
Space Heating - Gas 0.0 0.0 0.0 0.0%
-63.0%
Space Cooling 329.8 226.3 103.5 31.4%Pumps N/A N/A
Space Heating - Elec 766.2 429.2 337.0 44.0%
89 7%HVAC Fans 676 0 69 3 606 7
Proposed ModificationsPTACs replaced by heat pumps. Condenser water
cooling. Electric resistance heating. Demand ventilation. Identical construction to Base Case.
1,170,535
773,812
600,000
800,000
1,000,000
1,200,000
1,400,000
lb/y
r
Annual CO2 Emissions
89.7%Receptacles N/A N/A N/A N/A
Total 3,004.5 1,986.2 1,018.3
HVAC Fans 676.0 69.3 606.7
33.9%
Base Utilities N/A N/A N/A N/A33.9%
N/A
ventilation. Identical construction to Base Case.
Assumptions
1,170,535
773,812
0
200,000
400,000
600,000
800,000
1,000,000
1,200,000
1,400,000
Base Case Proposed
lb/y
r
Annual CO2 Emissions
4,631
1,705
3,061
1,127
0
1,000
2,000
3,000
4,000
5,000
SO2 (lb/yr) NOX (lb/yr)
g/yr
Annual SO2 and NOX EmissionsBase Case
Proposed
3,005
1,986
0
500
1,000
1,500
2,000
2,500
3,000
3,500
Base Case Proposed
MBt
u/yr
Annual Total Energy Use
Issued February 1, 2011 98 New Hotels Energy Analysis - Green Engage/Solutions

Additional Capital CostHVAC Plant First Cost Reductions
Cooling Plant Savings ($450/ton)Heating Plant Savings ($7 55/MBh)
$0Electricity 298,434 kWh $0.1535 $45,799
Yr.Costs
(Marginal/Maint/Replace)
Savings (+) / Loss (-)
Mechanical
Natural gas 0 therms $1.5056
M-7
Annual Resource Cost Summary
Cash FlowInitial Annual Savings
Initial Marginal Cost $145,400
$47,402
$0 ($145,400) Simple Payback 3 yrs
4 $0 $52,555 $52,555 First Year Yield On Marginal Cost
$56 298
IRR3 $0 $50,778 $50,7782 $0
0 MBh $0 6 $0 $56 298tons $0 5 $0 $54,394 $54,394
($145,400)36.0%$49,061 $49,061
Water & sewer 0 Gals N/A $0 0 ($145,400)
Individual Resource Calculations New Hotels Temperate
Guest Room Equipment Selection: Condensor Water Heat Pump
Financial Results Summary
Unit CostAnnual Savings (+) /
Loss (-)
0
Capital Costs Savings Summary
32.6%
Financial Table
ResourceAnnual Resource Savings
(+) / Loss (-)
1 $0 $47,402 $47,402
Heating Plant Savings ($7.55/MBh)Airside Distribution Savings ($3.5/cfm)
Total Additional Capital Cost:
Estimated Useful Life (yrs)Percent replacedReplacement Cost
Base YearValuation TypeProject Analysis PeriodDiscount Rate for Defined ValuationEnergy Escalation Rate (Nominal)
7$56,298 NPV
8 $0 $60,308 $60,308
$541,7900 MBh $0 6 $0 $56,298$0 $58,269
$62,419 $62,419
20 11 $0 $66,865 $66,865Replacement Life and Cost Summary 10 $0 $64,604 $64,604
$0 $76,729 $76,72914 $0 $74,134 $74,134
3.50% 20 $0 $91,130 $91,1306.00% 19 $0 $88,048 $88,048
$69,205
Defined $0 $82,194 $82,19420 18 $0
$0 $71,627 $71,627
2008 16 $0 $79,414 $79,414Financial Analysis 15
($145,400)0 cfm $0 $58,269
9 $0
$69,205
17$85,070 $85,070
$0 130% 12 $0
($400,000)($200,000)
$0 $200,000 $400,000 $600,000 $800,000
$1,000,000 $1,200,000 $1,400,000
0 5 10 15 20
Net
Cas
h Fl
ow (E
nd o
f Yea
r)
Years
Simple Payback Graph
Issued February 1, 2011 99 New Hotels Energy Analysis - Green Engage/Solutions
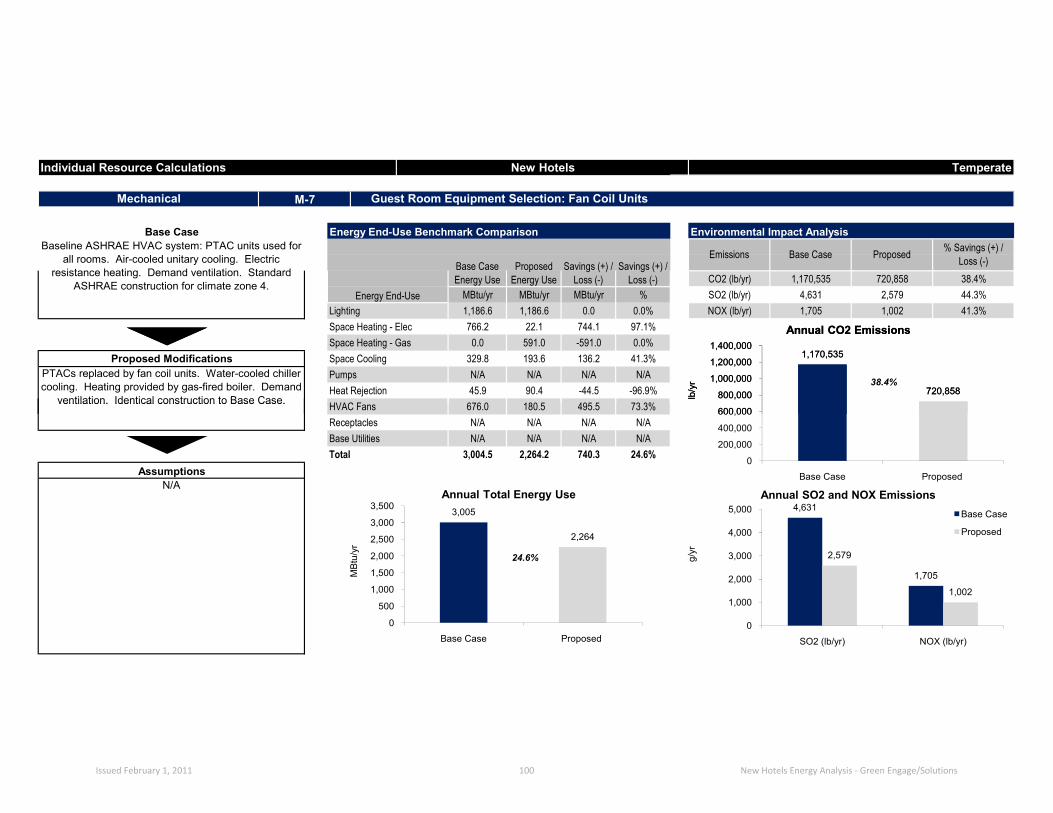
Individual Resource Calculations New Hotels Temperate
MBtu/yr MBtu/yr MBtu/yr %
Baseline ASHRAE HVAC system: PTAC units used for all rooms. Air-cooled unitary cooling. Electric
resistance heating. Demand ventilation. Standard ASHRAE construction for climate zone 4.
Mechanical
Base Case Energy End-Use Benchmark Comparison Environmental Impact Analysis
Energy End-Use
Base Case Energy Use
Proposed Energy Use
Savings (+) / Loss (-)
Savings (+) / Loss (-) 38.4%
% Savings (+) / Loss (-)
Lighting 1,186.6 1,186.6 0.0 0.0%
M-7 Guest Room Equipment Selection: Fan Coil Units
Emissions Base Case Proposed
SO2 (lb/yr) 4,631 2,579 44.3%CO2 (lb/yr) 1,170,535 720,858
1,705 1,002 41.3%NOX (lb/yr)
Heat Rejection 45.9 90.4 -44.5N/A N/A
38.4%
Space Heating - Gas 0.0 591.0 -591.0 0.0%
-96.9%
Space Cooling 329.8 193.6 136.2 41.3%Pumps N/A N/A
Space Heating - Elec 766.2 22.1 744.1 97.1%
73 3%HVAC Fans 676 0 180 5 495 5
Proposed ModificationsPTACs replaced by fan coil units. Water-cooled chiller cooling. Heating provided by gas-fired boiler. Demand
ventilation. Identical construction to Base Case.
1,170,535
720,858
600,000
800,000
1,000,000
1,200,000
1,400,000
lb/y
r
Annual CO2 Emissions
73.3%Receptacles N/A N/A N/A N/A
Total 3,004.5 2,264.2 740.3
HVAC Fans 676.0 180.5 495.5
24.6%
Base Utilities N/A N/A N/A N/A24.6%
N/A
ventilation. Identical construction to Base Case.
Assumptions
1,170,535
720,858
0
200,000
400,000
600,000
800,000
1,000,000
1,200,000
1,400,000
Base Case Proposed
lb/y
r
Annual CO2 Emissions
4,631
1,705
2,579
1,002
0
1,000
2,000
3,000
4,000
5,000
SO2 (lb/yr) NOX (lb/yr)
g/yr
Annual SO2 and NOX EmissionsBase Case
Proposed
3,005
2,264
0
500
1,000
1,500
2,000
2,500
3,000
3,500
Base Case Proposed
MBt
u/yr
Annual Total Energy Use
Issued February 1, 2011 100 New Hotels Energy Analysis - Green Engage/Solutions

Additional Capital CostHVAC Plant First Cost Reductions
Cooling Plant Savings ($450/ton)Heating Plant Savings ($7 55/MBh)
-$8,901Electricity 390,165 kWh $0.1535 $59,876
Yr.Costs
(Marginal/Maint/Replace)
Savings (+) / Loss (-)
Mechanical
Natural gas -5,912 therms $1.5056
M-7
Annual Resource Cost Summary
Cash FlowInitial Annual Savings
Initial Marginal Cost $135,380
$52,759
$0 ($135,380) Simple Payback 2.5 yrs
4 $0 $58,495 $58,495 First Year Yield On Marginal Cost
$62 662
IRR3 $0 $56,517 $56,5172 $0
0 MBh $0 6 $0 $62 662tons $0 5 $0 $60,543 $60,543
($135,380)42.4%$54,606 $54,606
Water & sewer 0 Gals N/A $0 0 ($135,380)
Individual Resource Calculations New Hotels Temperate
Guest Room Equipment Selection: Fan Coil Units
Financial Results Summary
Unit CostAnnual Savings (+) /
Loss (-)
0
Capital Costs Savings Summary
39.0%
Financial Table
ResourceAnnual Resource Savings
(+) / Loss (-)
1 $0 $52,759 $52,759
Heating Plant Savings ($7.55/MBh)Airside Distribution Savings ($3.5/cfm)
Total Additional Capital Cost:
Estimated Useful Life (yrs)Percent replacedReplacement Cost
Base YearValuation TypeProject Analysis PeriodDiscount Rate for Defined ValuationEnergy Escalation Rate (Nominal)
7$62,662 NPV
8 $0 $67,125 $67,125
$627,9870 MBh $0 6 $0 $62,662$0 $64,855
$69,474 $69,474
20 11 $0 $74,422 $74,422Replacement Life and Cost Summary 10 $0 $71,906 $71,906
$0 $85,401 $85,40114 $0 $82,514 $82,514
3.50% 20 $0 $101,430 $101,4306.00% 19 $0 $98,000 $98,000
$77,027
Defined $0 $91,484 $91,48420 18 $0
$0 $79,723 $79,723
2008 16 $0 $88,391 $88,391Financial Analysis 15
($135,380)0 cfm $0 $64,855
9 $0
$77,027
17$94,686 $94,686
$0 130% 12 $0
($400,000)($200,000)
$0 $200,000 $400,000 $600,000 $800,000
$1,000,000 $1,200,000 $1,400,000 $1,600,000
0 5 10 15 20
Net
Cas
h Fl
ow (E
nd o
f Yea
r)
Years
Simple Payback Graph
Issued February 1, 2011 101 New Hotels Energy Analysis - Green Engage/Solutions

Individual Resource Calculations New Hotels Temperate
MBtu/yr MBtu/yr MBtu/yr %
Baseline ASHRAE HVAC system: Air-cooled PTAC units used for all rooms. Electric resistance heating.
Demand ventilation. Standard ASHRAE construction for climate zone 4.
Mechanical
Base Case Energy End-Use Benchmark Comparison Environmental Impact Analysis
Energy End-Use
Base Case Energy Use
Proposed Energy Use
Savings (+) / Loss (-)
Savings (+) / Loss (-) 40.2%
% Savings (+) / Loss (-)
Lighting 1,186.6 1,186.6 0.0 0.0%
M-7 Guest Room Equipment Selection: Air Cooled VAV
Emissions Base Case Proposed
SO2 (lb/yr) 4,631 2,416 47.8%CO2 (lb/yr) 1,170,535 700,456
1,705 957 43.9%NOX (lb/yr)
Heat Rejection 45.9 34.9 11.0N/A N/A
40.2%
Space Heating - Gas 0.0 769.0 -769.0 0.0%
24.0%
Space Cooling 329.8 273.1 56.7 17.2%Pumps N/A N/A
Space Heating - Elec 766.2 19.0 747.2 97.5%
92 0%HVAC Fans 676 0 53 9 622 1
Proposed ModificationsPTACs replaced by a VAV system. Air-cooled chiller
cooling. Heating provided by gas-fired boiler. Demand ventilation. Identical construction to Base Case.
1,170,535
700,4561,000,000
1,500,000
lb/y
r
Annual CO2 Emissions
92.0%Receptacles N/A N/A N/A N/A
Total 3,004.5 2,336.5 668.0
HVAC Fans 676.0 53.9 622.1
22.2%
Base Utilities N/A N/A N/A N/A22.2%
N/A
ventilation. Identical construction to Base Case.
Assumptions
1,170,535
700,456
0
500,000
1,000,000
1,500,000
Base Case Proposed
lb/y
r
Annual CO2 Emissions
4,631
1,7052,416
957
0
2,000
4,000
6,000
SO2 (lb/yr) NOX (lb/yr)
g/yr
Annual SO2 and NOX EmissionsBase Case
Proposed
3,005
2,337
0
500
1,000
1,500
2,000
2,500
3,000
3,500
Base Case Proposed
MBt
u/yr
Annual Total Energy Use
Issued February 1, 2011 102 New Hotels Energy Analysis - Green Engage/Solutions

Additional Capital CostHVAC Plant First Cost Reductions
Cooling Plant Savings ($450/ton)Heating Plant Savings ($7 55/MBh)
-$11,581Electricity 421,143 kWh $0.1535 $64,630
Yr.Costs
(Marginal/Maint/Replace)
Savings (+) / Loss (-)
Mechanical
Natural gas -7,692 therms $1.5056
M-7
Annual Resource Cost Summary
Cash FlowInitial Annual Savings
Initial Marginal Cost $159,314
$54,905
$0 ($159,314) Simple Payback 2.9 yrs
4 $0 $60,874 $60,874 First Year Yield On Marginal Cost
$65 210
IRR3 $0 $58,816 $58,8162 $0
361 MBh $2 726 6 $0 $65 210tons $4,856 5 $0 $63,005 $63,005
($212,000)37.9%$56,827 $56,827
Water & sewer 0 Gals N/A $0 0 ($159,314)
Individual Resource Calculations New Hotels Temperate
Guest Room Equipment Selection: Air Cooled VAV
Financial Results Summary
Unit CostAnnual Savings (+) /
Loss (-)
11
Capital Costs Savings Summary
34.5%
Financial Table
ResourceAnnual Resource Savings
(+) / Loss (-)
1 $0 $54,905 $54,905
Heating Plant Savings ($7.55/MBh)Airside Distribution Savings ($3.5/cfm)
Total Additional Capital Cost:
Estimated Useful Life (yrs)Percent replacedReplacement Cost
Base YearValuation TypeProject Analysis PeriodDiscount Rate for Defined ValuationEnergy Escalation Rate (Nominal)
7$65,210 NPV
8 $0 $69,855 $69,855
$636,142361 MBh $2,726 6 $0 $65,210$0 $67,493
$72,300 $72,300
20 11 $0 $77,449 $77,449Replacement Life and Cost Summary 10 $0 $74,830 $74,830
$0 $88,875 $88,87514 $0 $85,869 $85,869
3.50% 20 $0 $105,555 $105,5556.00% 19 $0 $101,986 $101,986
$80,160
Defined $0 $95,205 $95,20520 18 $0
$0 $82,966 $82,966
2008 16 $0 $91,985 $91,985Financial Analysis 15
($159,314)12,887 cfm $45,105 $67,493
9 $0
$80,160
17$98,537 $98,537
$0 130% 12 $0
($400,000)($200,000)
$0 $200,000 $400,000 $600,000 $800,000
$1,000,000 $1,200,000 $1,400,000 $1,600,000
0 5 10 15 20
Net
Cas
h Fl
ow (E
nd o
f Yea
r)
Years
Simple Payback Graph
Issued February 1, 2011 103 New Hotels Energy Analysis - Green Engage/Solutions

Individual Resource Calculations New Hotels Temperate
MBtu/yr MBtu/yr MBtu/yr %
Baseline ASHRAE HVAC system: PTAC units used for all rooms. Air-cooled unitary cooling. Electric
resistance heating. Demand ventilation. Standard ASHRAE construction for climate zone 4.
Mechanical
Base Case Energy End-Use Benchmark Comparison Environmental Impact Analysis
Energy End-Use
Base Case Energy Use
Proposed Energy Use
Savings (+) / Loss (-)
Savings (+) / Loss (-) 41.5%
% Savings (+) / Loss (-)
Lighting 1,186.6 1,186.6 0.0 0.0%
M-7 Guest Room Equipment Selection: Water Cooled VAV
Emissions Base Case Proposed
SO2 (lb/yr) 4,631 2,356 49.1%CO2 (lb/yr) 1,170,535 685,223
1,705 935 45.2%NOX (lb/yr)
Heat Rejection 45.9 73.3 -27.4N/A N/A
41.5%
Space Heating - Gas 0.0 769.0 -769.0 0.0%
-59.7%
Space Cooling 329.8 195.6 134.2 40.7%Pumps N/A N/A
Space Heating - Elec 766.2 19.0 747.2 97.5%
92 0%HVAC Fans 676 0 53 9 622 1
Proposed ModificationsPTACs replaced by a VAV system. Water-cooled
chiller cooling. Heating provided by gas-fired boiler. Demand ventilation. Identical construction to Base
1,170,535
685,223
600,000
800,000
1,000,000
1,200,000
1,400,000
lb/y
r
Annual CO2 Emissions
92.0%Receptacles N/A N/A N/A N/A
Total 3,004.5 2,297.4 707.1
HVAC Fans 676.0 53.9 622.1
23.5%
Base Utilities N/A N/A N/A N/A23.5%
N/A
Demand ventilation. Identical construction to Base Case.
Assumptions
1,170,535
685,223
0
200,000
400,000
600,000
800,000
1,000,000
1,200,000
1,400,000
Base Case Proposed
lb/y
r
Annual CO2 Emissions
4,631
1,7052,356
935
0
1,000
2,000
3,000
4,000
5,000
SO2 (lb/yr) NOX (lb/yr)
g/yr
Annual SO2 and NOX EmissionsBase Case
Proposed
3,005
2,297
0
500
1,000
1,500
2,000
2,500
3,000
3,500
Base Case Proposed
MBt
u/yr
Annual Total Energy Use
Issued February 1, 2011 104 New Hotels Energy Analysis - Green Engage/Solutions

Additional Capital CostHVAC Plant First Cost Reductions
Cooling Plant Savings ($450/ton)Heating Plant Savings ($7 55/MBh)
-$11,581Electricity 432,602 kWh $0.1535 $66,388
Yr.Costs
(Marginal/Maint/Replace)
Savings (+) / Loss (-)
Mechanical
Natural gas -7,692 therms $1.5056
M-7
Annual Resource Cost Summary
Cash FlowInitial Annual Savings
Initial Marginal Cost $163,654
$56,725
$0 ($163,654) Simple Payback 2.8 yrs
4 $0 $62,892 $62,892 First Year Yield On Marginal Cost
$67 372
IRR3 $0 $60,766 $60,7662 $0
361 MBh $2 726 6 $0 $67 372tons $4,856 5 $0 $65,094 $65,094
($216,340)38.1%$58,711 $58,711
Water & sewer 0 Gals N/A $0 0 ($163,654)
Individual Resource Calculations New Hotels Temperate
Guest Room Equipment Selection: Water Cooled VAV
Financial Results Summary
Unit CostAnnual Savings (+) /
Loss (-)
11
Capital Costs Savings Summary
34.7%
Financial Table
ResourceAnnual Resource Savings
(+) / Loss (-)
1 $0 $56,725 $56,725
Heating Plant Savings ($7.55/MBh)Airside Distribution Savings ($3.5/cfm)
Total Additional Capital Cost:
Estimated Useful Life (yrs)Percent replacedReplacement Cost
Base YearValuation TypeProject Analysis PeriodDiscount Rate for Defined ValuationEnergy Escalation Rate (Nominal)
7$67,372 NPV
8 $0 $72,170 $72,170
$658,118361 MBh $2,726 6 $0 $67,372$0 $69,730
$74,696 $74,696
20 11 $0 $80,017 $80,017Replacement Life and Cost Summary 10 $0 $77,311 $77,311
$0 $91,821 $91,82114 $0 $88,716 $88,716
3.50% 20 $0 $109,055 $109,0556.00% 19 $0 $105,367 $105,367
$82,817
Defined $0 $98,361 $98,36120 18 $0
$0 $85,716 $85,716
2008 16 $0 $95,035 $95,035Financial Analysis 15
($163,654)12,887 cfm $45,105 $69,730
9 $0
$82,817
17$101,804 $101,804
$0 130% 12 $0
($400,000)($200,000)
$0 $200,000 $400,000 $600,000 $800,000
$1,000,000 $1,200,000 $1,400,000 $1,600,000
0 5 10 15 20
Net
Cas
h Fl
ow (E
nd o
f Yea
r)
Years
Simple Payback Graph
Issued February 1, 2011 105 New Hotels Energy Analysis - Green Engage/Solutions

Individual Resource Calculations New Hotels Temperate
MBtu/yr MBtu/yr MBtu/yr %
VAV system with reheat used for all rooms. Cooling provided by air-cooled chiller. Gas-fired boilers provide
heating. Demand ventilation. Standard ASHRAE construction for climate zone 4.
Mechanical
Base Case Energy End-Use Benchmark Comparison Environmental Impact Analysis
Energy End-Use
Base Case Energy Use
Proposed Energy Use
Savings (+) / Loss (-)
Savings (+) / Loss (-) 7.6%
% Savings (+) / Loss (-)
Lighting 1,186.6 1,186.6 0.0 0.0%
M-7 Guest Room Equipment Selection: Air Cooled VAV with FPP
Emissions Base Case Proposed
SO2 (lb/yr) 2,416 2,400 0.6%CO2 (lb/yr) 700,456 646,922
957 914 4.5%NOX (lb/yr)
Heat Rejection 34.9 34.9 0.0N/A N/A
7.6%
Space Heating - Gas 769.0 344.1 424.9 55.3%
0.0%
Space Cooling 273.1 272.7 0.4 0.1%Pumps N/A N/A
Space Heating - Elec 19.0 18.8 0.2 1.1%
17 6%HVAC Fans 53 9 44 4 9 5
Proposed ModificationsAs with Base Case, but with fan-powered parallel
terminal units instead of standard VAV boxes. (Note: FPP systems have not been modelled for hot-humid or hot-dry
700,456 646,922
500,000
1,000,000
lb/y
r
Annual CO2 Emissions
17.6%Receptacles N/A N/A N/A N/A
Total 2,336.5 1,901.5 435.0
HVAC Fans 53.9 44.4 9.5
18.6%
Base Utilities N/A N/A N/A N/A18.6%
N/A
( y yclimates as there are insufficient cooling loads for this system to be
viable).
Assumptions
700,456 646,922
0
500,000
1,000,000
Base Case Proposed
lb/y
r
Annual CO2 Emissions
2,416
957
2,400
914
0
2,000
4,000
SO2 (lb/yr) NOX (lb/yr)
g/yr
Annual SO2 and NOX EmissionsBase Case
Proposed
2,337
1,902
0
500
1,000
1,500
2,000
2,500
Base Case Proposed
MBt
u/yr
Annual Total Energy Use
Issued February 1, 2011 106 New Hotels Energy Analysis - Green Engage/Solutions

Additional Capital CostHVAC Plant First Cost Reductions
Cooling Plant Savings ($450/ton)Heating Plant Savings ($7 55/MBh)
$6,399Electricity 2,960 kWh $0.1535 $454
Yr.Costs
(Marginal/Maint/Replace)
Savings (+) / Loss (-)
Mechanical
Natural gas 4,250 therms $1.5056
M-7
Annual Resource Cost Summary
Cash FlowInitial Annual Savings
Initial Marginal Cost $23,841
$7,093
$0 ($23,841) Simple Payback 3.3 yrs
4 $0 $7,864 $7,864 First Year Yield On Marginal Cost
$8 425
IRR3 $0 $7,598 $7,5982 $0
21 MBh $159 6 $0 $8 425tons $0 5 $0 $8,140 $8,140
($24,000)33.1%$7,342 $7,342
Water & sewer 0 Gals N/A $0 0 ($23,841)
Individual Resource Calculations New Hotels Temperate
Guest Room Equipment Selection: Air Cooled VAV with FPP
Financial Results Summary
Unit CostAnnual Savings (+) /
Loss (-)
0
Capital Costs Savings Summary
29.8%
Financial Table
ResourceAnnual Resource Savings
(+) / Loss (-)
1 $0 $7,093 $7,093
Heating Plant Savings ($7.55/MBh)Airside Distribution Savings ($3.5/cfm)
Total Additional Capital Cost:
Estimated Useful Life (yrs)Percent replacedReplacement Cost
Base YearValuation TypeProject Analysis PeriodDiscount Rate for Defined ValuationEnergy Escalation Rate (Nominal)
7$8,425 NPV
8 $0 $9,025 $9,025
$79,10921 MBh $159 6 $0 $8,425$0 $8,719
$9,340 $9,340
20 11 $0 $10,006 $10,006Replacement Life and Cost Summary 10 $0 $9,667 $9,667
$0 $11,482 $11,48214 $0 $11,094 $11,094
3.50% 20 $0 $13,637 $13,6376.00% 19 $0 $13,176 $13,176
$10,356
Defined $0 $12,300 $12,30020 18 $0
$0 $10,718 $10,718
2008 16 $0 $11,884 $11,884Financial Analysis 15
($23,841)0 cfm $0 $8,719
9 $0
$10,356
17$12,730 $12,730
$0 130% 12 $0
($50,000)
$0
$50,000
$100,000
$150,000
$200,000
Net
Cas
h Fl
ow (E
nd o
f Yea
r)
Years
Simple Payback Graph
Issued February 1, 2011 107 New Hotels Energy Analysis - Green Engage/Solutions
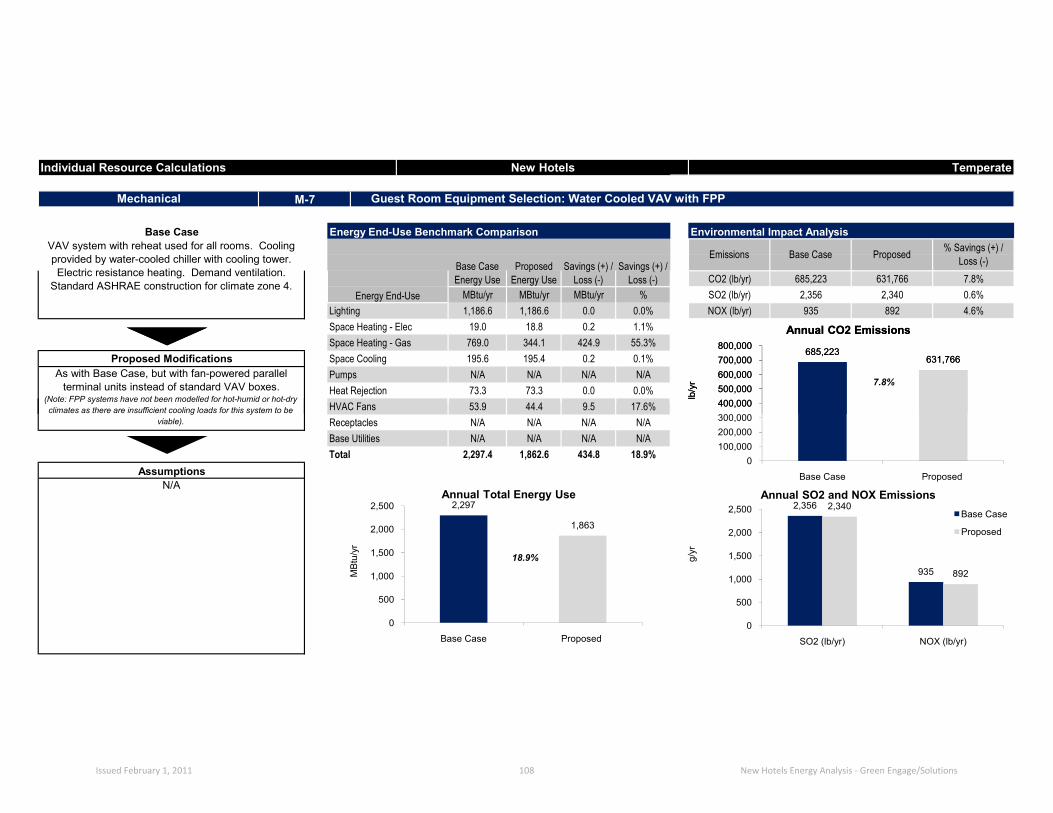
Energy End-Use Benchmark Comparison
Individual Resource Calculations New Hotels Temperate
Proposed ModificationsAs with Base Case, but with fan-powered parallel
terminal units instead of standard VAV boxes. (Note: FPP systems have not been modelled for hot-humid or hot-dry
73.3 73.3 0.0HVAC Fans 53 9 44 4 9 5 17 6%
Space Cooling 195.6 195.4 0.2
Space Heating - Elec 19.0 18.8 0.2 1.1%
N/A N/A N/A N/A7.8%
Space Heating - Gas 769.0 344.1 424.9 55.3%
SO2 (lb/yr) 2,356 2,340 0.6%
% Savings (+) / Loss (-)Emissions Base Case Proposed
935 892 4.6%NOX (lb/yr)
CO2 (lb/yr) 685,223 631,766 7.8%
VAV system with reheat used for all rooms. Cooling provided by water-cooled chiller with cooling tower. Electric resistance heating. Demand ventilation.
Standard ASHRAE construction for climate zone 4.
Lighting 1,186.6 1,186.6 0.0 0.0%
M-7 Guest Room Equipment Selection: Water Cooled VAV with FPP
Heat Rejection
Environmental Impact Analysis
Energy End-Use
Base Case Energy Use
Proposed Energy Use
Savings (+) / Loss (-)
Savings (+) / Loss (-)
MBtu/yr MBtu/yr MBtu/yr %
0.0%
0.1%Pumps
Mechanical
Base Case
685,223631,766
400,000500,000600,000700,000800,000
lb/y
r
Annual CO2 Emissions
( y yclimates as there are insufficient cooling loads for this system to be
viable).
Assumptions
18.9%
N/A
18.9%Total 2,297.4 1,862.6 434.8
HVAC Fans 53.9 44.4 9.5 17.6%Receptacles N/A N/A N/A N/ABase Utilities N/A N/A N/A N/A
685,223631,766
0100,000200,000300,000400,000500,000600,000700,000800,000
Base Case Proposed
lb/y
r
Annual CO2 Emissions
2,356
935
2,340
892
0
500
1,000
1,500
2,000
2,500
SO2 (lb/yr) NOX (lb/yr)
g/yr
Annual SO2 and NOX EmissionsBase Case
Proposed
2,297
1,863
0
500
1,000
1,500
2,000
2,500
Base Case Proposed
MBt
u/yr
Annual Total Energy Use
Issued February 1, 2011 108 New Hotels Energy Analysis - Green Engage/Solutions

Additional Capital CostHVAC Plant First Cost Reductions
Cooling Plant Savings ($450/ton)Heating Plant Savings ($7 55/MBh)
0 tons $0 5 $0 $8,129
Guest Room Equipment Selection: Water Cooled VAV with FPP
Water & sewer 0 Gals N/A $0
($24,000) 3 $0 $7,588 $7,5882 $0 $7,332 $7,332 IRR
1 $0 $7,084 $7,084Capital Costs Savings Summary
$8,12929.7%4
0
Cash FlowSavings (+) / Loss (-)
21 $159 6 $0 $8 413 $8 413MBh
($23,841)
$0 $7,854 $7,854 First Year Yield On Marginal Cost
$0 ($23,841) Simple Payback 3.3 yrs
33.0%
Initial Marginal Cost $23,841
$7,084
ResourceAnnual Resource Savings
(+) / Loss (-)
M-7
Initial Annual SavingskWh $0.1535 $445Unit Cost
Annual Savings (+) / Loss (-)
Mechanical
Natural gas 4,250 therms $1.5056 $6,399Electricity 2,901
Yr.Costs
(Marginal/Maint/Replace)
Annual Resource Cost Summary Financial Table
Individual Resource Calculations New Hotels Temperate
Financial Results Summary
Heating Plant Savings ($7.55/MBh)Airside Distribution Savings ($3.5/cfm)
Total Additional Capital Cost:
Estimated Useful Life (yrs)Percent replacedReplacement Cost
Base YearValuation TypeProject Analysis PeriodDiscount Rate for Defined ValuationEnergy Escalation Rate (Nominal)
$0 $8,708
9
0% 12 $0 $10,342 $10,342
19 $0 $13,158 $13,158
15 $0 $11,467 $11,467
3.50% 20 $0 $13,619 $13,6196.00%
Defined 17 $0 $12,283 $12,28320 18 $0 $12,713 $12,713
2008 16 $0 $11,868 $11,868Financial Analysis
$0 13 $0 $10,704 $10,70414 $0 $11,079 $11,079
Replacement Life and Cost Summary 10 $0 $9,655 $9,655
21 $159 6 $0
($23,841)0 cfm $0
$0 $9,328 $9,328
7
20 11 $0 $9,993 $9,993
$8,413 $8,413 NPV
8 $0 $9,013 $9,013
$78,975$8,708
MBh
($50,000)
$0
$50,000
$100,000
$150,000
$200,000
Net
Cas
h Fl
ow (E
nd o
f Yea
r)
Years
Simple Payback Graph
Issued February 1, 2011 109 New Hotels Energy Analysis - Green Engage/Solutions

Individual Resource Calculations New Hotels Temperate
MBtu/yr MBtu/yr MBtu/yr %
VAV system with reheat used for all rooms. Cooling provided by water-cooled chiller with cooling tower.
Gas-fired boilers provide heating. Demand ventilation. Standard ASHRAE construction for climate zone 4.
Mechanical
Base Case Energy End-Use Benchmark Comparison Environmental Impact Analysis
Energy End-Use
Base Case Energy Use
Proposed Energy Use
Savings (+) / Loss (-)
Savings (+) / Loss (-) 1.8%
% Savings (+) / Loss (-)
Lighting 1,186.6 1,186.6 0.0 0.0%
M-9 Variable Frequency Drives
Emissions Base Case Proposed
SO2 (lb/yr) 2,356 2,308 2.0%CO2 (lb/yr) 685,223 673,185
935 917 1.9%NOX (lb/yr)
Heat Rejection 73.3 73.3 0.0N/A N/A
1.8%
Space Heating - Gas 769.0 769.0 0.0 0.0%
0.0%
Space Cooling 195.6 195.6 0.0 0.0%Pumps N/A N/A
Space Heating - Elec 19.0 19.0 0.0 0.0%
57 3%HVAC Fans 53 9 23 0 30 9
Proposed ModificationsAs with Base Case, but with variable frequency drives
(VFDs) used in VAV system.
685,223 673,185
400,000500,000600,000700,000800,000
lb/y
r
Annual CO2 Emissions
57.3%Receptacles N/A N/A N/A N/A
Total 2,297.4 2,266.5 30.9
HVAC Fans 53.9 23.0 30.9
1.3%
Base Utilities N/A N/A N/A N/A1.3%
N/AAssumptions
685,223 673,185
0100,000200,000300,000400,000500,000600,000700,000800,000
Base Case Proposed
lb/y
r
Annual CO2 Emissions
2,356
935
2,308
917
0
500
1,000
1,500
2,000
2,500
SO2 (lb/yr) NOX (lb/yr)
g/yr
Annual SO2 and NOX EmissionsBase Case
Proposed
2,297 2,267
0
500
1,000
1,500
2,000
2,500
Base Case Proposed
MBt
u/yr
Annual Total Energy Use
Issued February 1, 2011 110 New Hotels Energy Analysis - Green Engage/Solutions

Additional Capital CostHVAC Plant First Cost Reductions
Cooling Plant Savings ($450/ton)Heating Plant Savings ($7 55/MBh)
$0Electricity 9,056 kWh $0.1535 $1,390
Yr.Costs
(Marginal/Maint/Replace)
Savings (+) / Loss (-)
Mechanical
Natural gas 0 therms $1.5056
M-9
Annual Resource Cost Summary
Cash FlowInitial Annual Savings
Initial Marginal Cost $4,945
$1,438
$0 ($4,945) Simple Payback 3.3 yrs
4 $0 $1,595 $1,595 First Year Yield On Marginal Cost
$1 708
IRR3 $0 $1,541 $1,5412 $0
0 MBh $0 6 $0 $1 708tons $0 5 $0 $1,651 $1,651
($4,945)32.4%$1,489 $1,489
Water & sewer 0 Gals N/A $0 0 ($4,945)
Individual Resource Calculations New Hotels Temperate
Variable Frequency Drives
Financial Results Summary
Unit CostAnnual Savings (+) /
Loss (-)
0
Capital Costs Savings Summary
29.1%
Financial Table
ResourceAnnual Resource Savings
(+) / Loss (-)
1 $0 $1,438 $1,438
Heating Plant Savings ($7.55/MBh)Airside Distribution Savings ($3.5/cfm)
Total Additional Capital Cost:
Estimated Useful Life (yrs)Percent replacedReplacement Cost
Base YearValuation TypeProject Analysis PeriodDiscount Rate for Defined ValuationEnergy Escalation Rate (Nominal)
7$1,708 NPV
8 $0 $1,830 $1,830
$15,9380 MBh $0 6 $0 $1,708$0 $1,768
$1,894 $1,894
20 11 $0 $2,029 $2,029Replacement Life and Cost Summary 10 $0 $1,960 $1,960
$0 $2,328 $2,32814 $0 $2,250 $2,250
3.50% 20 $0 $2,765 $2,7656.00% 19 $0 $2,672 $2,672
$2,100
Defined $0 $2,494 $2,49420 18 $0
$0 $2,174 $2,174
2008 16 $0 $2,410 $2,410Financial Analysis 15
($4,945)0 cfm $0 $1,768
9 $0
$2,100
17$2,581 $2,581
$0 130% 12 $0
($10,000)($5,000)
$0 $5,000
$10,000 $15,000 $20,000 $25,000 $30,000 $35,000 $40,000
0 5 10 15 20
Net
Cas
h Fl
ow (E
nd o
f Yea
r)
Years
Simple Payback Graph
Issued February 1, 2011 111 New Hotels Energy Analysis - Green Engage/Solutions

Energy End-Use Benchmark Comparison
Individual Resource Calculations New Hotels Temperate
Proposed ModificationsAs with Base Case, but with a water-cooled chiller and
cooling tower. 34.9 73.3 -38.4HVAC Fans 53 9 53 9 0 0 0 0%
Space Cooling 273.1 195.6 77.5
Space Heating - Elec 19.0 19.0 0.0 0.0%
N/A N/A N/A N/A2.2%
Space Heating - Gas 769.0 769.0 0.0 0.0%
SO2 (lb/yr) 2,416 2,356 2.5%
% Savings (+) / Loss (-)Emissions Base Case Proposed
957 935 2.3%NOX (lb/yr)
CO2 (lb/yr) 700,456 685,223 2.2%
VAV system with reheat used for all rooms. Cooling provided by air-cooled chiller. Gas-fired boilers provide
heating. Demand ventilation. Standard ASHRAE construction for climate zone 4.
Lighting 1,186.6 1,186.6 0.0 0.0%
M-12 Water Cooled Chiller
Heat Rejection
Environmental Impact Analysis
Energy End-Use
Base Case Energy Use
Proposed Energy Use
Savings (+) / Loss (-)
Savings (+) / Loss (-)
MBtu/yr MBtu/yr MBtu/yr %
-110.0%
28.4%Pumps
Mechanical
Base Case
700,456 685,223
400,000500,000600,000700,000800,000
lb/y
r
Annual CO2 Emissions
Assumptions
1.7%
N/A
1.7%Total 2,336.5 2,297.4 39.1
HVAC Fans 53.9 53.9 0.0 0.0%Receptacles N/A N/A N/A N/ABase Utilities N/A N/A N/A N/A
700,456 685,223
0100,000200,000300,000400,000500,000600,000700,000800,000
Base Case Proposed
lb/y
r
Annual CO2 Emissions
2,416
957
2,356
935
0
500
1,000
1,500
2,000
2,500
3,000
SO2 (lb/yr) NOX (lb/yr)
g/yr
Annual SO2 and NOX EmissionsBase Case
Proposed
2,337 2,297
0
500
1,000
1,500
2,000
2,500
Base Case Proposed
MBt
u/yr
Annual Total Energy Use
Issued February 1, 2011 112 New Hotels Energy Analysis - Green Engage/Solutions

Additional Capital CostHVAC Plant First Cost Reductions
Cooling Plant Savings ($450/ton)Heating Plant Savings ($7 55/MBh)
0 tons $0 5 $0 $2,089
Water Cooled Chiller
Water & sewer 0 Gals N/A $0
($10,000) 3 $0 $1,950 $1,9502 $0 $1,884 $1,884 IRR
1 $0 $1,820 $1,820Capital Costs Savings Summary
$2,08918.2%4
0
Cash FlowSavings (+) / Loss (-)
0 $0 6 $0 $2 162 $2 162MBh
($10,000)
$0 $2,018 $2,018 First Year Yield On Marginal Cost
$0 ($10,000) Simple Payback 5.2 yrs
20.9%
Initial Marginal Cost $10,000
$1,820
ResourceAnnual Resource Savings
(+) / Loss (-)
M-12
Initial Annual SavingskWh $0.1535 $1,759Unit Cost
Annual Savings (+) / Loss (-)
Mechanical
Natural gas 0 therms $1.5056 $0Electricity 11,459
Yr.Costs
(Marginal/Maint/Replace)
Annual Resource Cost Summary Financial Table
Individual Resource Calculations New Hotels Temperate
Financial Results Summary
Heating Plant Savings ($7.55/MBh)Airside Distribution Savings ($3.5/cfm)
Total Additional Capital Cost:
Estimated Useful Life (yrs)Percent replacedReplacement Cost
Base YearValuation TypeProject Analysis PeriodDiscount Rate for Defined ValuationEnergy Escalation Rate (Nominal)
$0 $2,237
9
0% 12 $0 $2,657 $2,657
19 $0 $3,381 $3,381
15 $0 $2,946 $2,946
3.50% 20 $0 $3,499 $3,4996.00%
Defined 17 $0 $3,156 $3,15620 18 $0 $3,266 $3,266
2008 16 $0 $3,049 $3,049Financial Analysis
$0 13 $0 $2,750 $2,75014 $0 $2,847 $2,847
Replacement Life and Cost Summary 10 $0 $2,481 $2,481
0 $0 6 $0
($10,000)0 cfm $0
$0 $2,397 $2,397
7
20 11 $0 $2,567 $2,567
$2,162 $2,162 NPV
8 $0 $2,316 $2,316
$16,636$2,237
MBh
($20,000)
($10,000)
$0
$10,000
$20,000
$30,000
$40,000
$50,000
0 5 10 15 20
Net
Cas
h Fl
ow (E
nd o
f Yea
r)
Years
Simple Payback Graph
Issued February 1, 2011 113 New Hotels Energy Analysis - Green Engage/Solutions

Energy End-Use Benchmark Comparison
Individual Resource Calculations New Hotels Temperate
Proposed ModificationsAs with Base Case, but with an evaporative cooling
system. 73.3 63.6 9.7HVAC Fans 53 9 53 5 0 4 0 7%
Space Cooling 195.6 166.6 29.0
Space Heating - Elec 19.0 19.0 0.0 0.0%
N/A N/A N/A N/A2.2%
Space Heating - Gas 769.0 769.0 0.0 0.0%
SO2 (lb/yr) 2,356 2,295 2.6%
% Savings (+) / Loss (-)Emissions Base Case Proposed
935 913 2.4%NOX (lb/yr)
CO2 (lb/yr) 685,223 669,990 2.2%
VAV system with reheat used for all rooms. Cooling provided by water-cooled chiller with cooling tower.
Gas-fired boilers provide heating. Demand ventilation. Standard ASHRAE construction for climate zone 4.
Lighting 1,186.6 1,186.6 0.0 0.0%
M-13 Evaporative Cooling
Heat Rejection
Environmental Impact Analysis
Energy End-Use
Base Case Energy Use
Proposed Energy Use
Savings (+) / Loss (-)
Savings (+) / Loss (-)
MBtu/yr MBtu/yr MBtu/yr %
13.2%
14.8%Pumps
Mechanical
Base Case
685,223 669,990
400,000500,000600,000700,000800,000
lb/y
r
Annual CO2 Emissions
Assumptions
1.7%
N/A
1.7%Total 2,297.4 2,258.3 39.1
HVAC Fans 53.9 53.5 0.4 0.7%Receptacles N/A N/A N/A N/ABase Utilities N/A N/A N/A N/A
685,223 669,990
0100,000200,000300,000400,000500,000600,000700,000800,000
Base Case Proposed
lb/y
r
Annual CO2 Emissions
2,356
935
2,295
913
0
500
1,000
1,500
2,000
2,500
SO2 (lb/yr) NOX (lb/yr)
g/yr
Annual SO2 and NOX EmissionsBase Case
Proposed
2,297 2,258
0
500
1,000
1,500
2,000
2,500
Base Case Proposed
MBt
u/yr
Annual Total Energy Use
Issued February 1, 2011 114 New Hotels Energy Analysis - Green Engage/Solutions

Additional Capital CostHVAC Plant First Cost Reductions
Cooling Plant Savings ($450/ton)Heating Plant Savings ($7 55/MBh)
0 tons $0 5 $0 $2,089
Evaporative Cooling
Water & sewer 0 Gals N/A $0
($24,200) 3 $0 $1,950 $1,9502 $0 $1,884 $1,884 IRR
1 $0 $1,820 $1,820Capital Costs Savings Summary
$2,0897.5%4
0
Cash FlowSavings (+) / Loss (-)
0 $0 6 $0 $2 162 $2 162MBh
($24,200)
$0 $2,018 $2,018 First Year Yield On Marginal Cost
$0 ($24,200) Simple Payback 12 yrs
7.5%
Initial Marginal Cost $24,200
$1,820
ResourceAnnual Resource Savings
(+) / Loss (-)
M-13
Initial Annual SavingskWh $0.1535 $1,759Unit Cost
Annual Savings (+) / Loss (-)
Mechanical
Natural gas 0 therms $1.5056 $0Electricity 11,459
Yr.Costs
(Marginal/Maint/Replace)
Annual Resource Cost Summary Financial Table
Individual Resource Calculations New Hotels Temperate
Financial Results Summary
Heating Plant Savings ($7.55/MBh)Airside Distribution Savings ($3.5/cfm)
Total Additional Capital Cost:
Estimated Useful Life (yrs)Percent replacedReplacement Cost
Base YearValuation TypeProject Analysis PeriodDiscount Rate for Defined ValuationEnergy Escalation Rate (Nominal)
$0 $2,237
9
0% 12 $0 $2,657 $2,657
19 $0 $3,381 $3,381
15 $0 $2,946 $2,946
3.50% 20 $0 $3,499 $3,4996.00%
Defined 17 $0 $3,156 $3,15620 18 $0 $3,266 $3,266
2008 16 $0 $3,049 $3,049Financial Analysis
$0 13 $0 $2,750 $2,75014 $0 $2,847 $2,847
Replacement Life and Cost Summary 10 $0 $2,481 $2,481
0 $0 6 $0
($24,200)0 cfm $0
$0 $2,397 $2,397
7
20 11 $0 $2,567 $2,567
$2,162 $2,162 NPV
8 $0 $2,316 $2,316
$3,240$2,237
MBh
($30,000)
($20,000)
($10,000)
$0
$10,000
$20,000
$30,000
0 5 10 15 20
Net
Cas
h Fl
ow (E
nd o
f Yea
r)
Years
Simple Payback Graph
Issued February 1, 2011 115 New Hotels Energy Analysis - Green Engage/Solutions

Proposed ModificationsAs with Base Case, but including a thermal storage
unit.
HVAC Fans 53 9 53 9 0 0 0 0%73.3 0.0 0.0%
0.0%PumpsSpace Cooling 195.6 195.6 0.0
Space Heating - Elec 19.0 19.0 0.0 0.0%
N/A N/A N/A N/A0.0%
Space Heating - Gas 769.0 769.0 0.0 0.0%
Emissions Base Case Proposed
935 935 0.0%NOX (lb/yr)
CO2 (lb/yr) 685,223 685,223 0.0%
Individual Resource Calculations New Hotels
SO2 (lb/yr) 2,356 2,356 0.0%
% Savings (+) / Loss (-)
Temperate
Mechanical
Base Case Energy End-Use Benchmark Comparison Environmental Impact Analysis
Energy End-Use
Base Case Energy Use
Proposed Energy Use
Savings (+) / Loss (-)
Savings (+) / Loss (-)
MBtu/yr MBtu/yr MBtu/yr %
VAV system with reheat used for all rooms. Cooling provided by water-cooled chiller with cooling tower.
Gas-fired boilers provide heating. Demand ventilation. Standard ASHRAE construction for climate zone 4.
Lighting 1,186.6 1,186.6 0.0 0.0%
M-13 Thermal Storage
Heat Rejection 73.3
685,223 685,223
400,000500,000600,000700,000800,000
lb/y
r
Annual CO2 Emissions
Assumptions
0.0%
N/A
0.0%Total 2,297.4 2,297.4 0.0
HVAC Fans 53.9 53.9 0.0 0.0%Receptacles N/A N/A N/A N/ABase Utilities N/A N/A N/A N/A
685,223 685,223
0100,000200,000300,000400,000500,000600,000700,000800,000
Base Case Proposed
lb/y
r
Annual CO2 Emissions
2,356
935
2,356
935
0
500
1,000
1,500
2,000
2,500
SO2 (lb/yr) NOX (lb/yr)
g/yr
Annual SO2 and NOX EmissionsBase Case
Proposed
2,297 2,297
0
500
1,000
1,500
2,000
2,500
Base Case Proposed
MBt
u/yr
Annual Total Energy Use
Issued February 1, 2011 116 New Hotels Energy Analysis - Green Engage/Solutions

Additional Capital CostHVAC Plant First Cost Reductions
Cooling Plant Savings ($450/ton)Heating Plant Savings ($7 55/MBh)
Thermal Storage
1 $0 $7,115 $7,115Capital Costs Savings Summary
30 tons $13,325 5 $0 $8,164
Water & sewer 0 Gals N/A $0
($50,000) 3 $0 $7,621 $7,6212 $0 $7,364 $7,364 IRR
$8,16419.4%4
0
Cash Flow
0 $0 6 $0 $8 450 $8 450MBh
($36,676)
$0 $7,888 $7,888 First Year Yield On Marginal Cost
$0 ($36,676) Simple Payback 4.9 yrs
22.2%
Initial Marginal Cost $36,676
$7,115
Financial Results Summary
ResourceAnnual Resource Savings
(+) / Loss (-)
M-13
Initial Annual SavingskWh $0.1535 $6,874Unit Cost
Annual Savings (+) / Loss (-)
Mechanical
Natural gas 0 therms $1.5056 $0Electricity 0
Yr.Costs
(Marginal/Maint/Replace)
Savings (+) / Loss (-)
Annual Resource Cost Summary Financial Table
Individual Resource Calculations New Hotels Temperate
Heating Plant Savings ($7.55/MBh)Airside Distribution Savings ($3.5/cfm)
Total Additional Capital Cost:
Estimated Useful Life (yrs)Percent replacedReplacement Cost
Base YearValuation TypeProject Analysis PeriodDiscount Rate for Defined ValuationEnergy Escalation Rate (Nominal)
$0 $8,746
9
0% 12 $0 $10,387 $10,387
19 $0 $13,215 $13,215
15 $0 $11,516 $11,516
3.50% 20 $0 $13,678 $13,6786.00%
Defined 17 $0 $12,337 $12,33720 18 $0 $12,768 $12,768
2008 16 $0 $11,919 $11,919Financial Analysis
$0 13 $0 $10,751 $10,75114 $0 $11,127 $11,127
Replacement Life and Cost Summary 10 $0 $9,696 $9,696
0 $0 6 $0
($36,676)0 cfm $0
$0 $9,369 $9,369
7
20 11 $0 $10,036 $10,036
$8,450 $8,450 NPV
8 $0 $9,052 $9,052
$67,307$8,746
MBh
($50,000)
$0
$50,000
$100,000
$150,000
$200,000
0 5 10 15 20
Net
Cas
h Fl
ow (E
nd o
f Yea
r)
Years
Simple Payback Graph
Issued February 1, 2011 117 New Hotels Energy Analysis - Green Engage/Solutions
Cold-Alpine
Issued February 1, 2011 118 New Hotels Energy Analysis - Green Engage/Solutions

Legend (Criteria Based On Simple Payback Only):Very Short or Immediate Payback (0 - 3 years)Intermediate Payback (3 - 7 years)Long or No Payback (>7 years)
$6,169M-13 Thermal Storage 11 yrs 0.0% 7.9% 7.8%M-13 Evaporative Cooling > 20 yrs 2.0% N/A 2.5% ($18,936)M-12 Water-Cooled Chiller 11 yrs 2.0% 8.7% 8.3% $2,480
$6,441M-9 Variable Frequency Drives 7.2 yrs 2.0% 14.4% 12.6% $5,404M-4 Economiser Modes 8.3 yrs 2.9% 12.0% 10.7%M-3 Heat Recovery 4.9 yrs 5.6% 21.9% 19.1% $53,572M-2 Demand Ventilation 4 yrs 13.6% 27.0% 23.9% $104,153
$50,991M-2 Dedicated outside air unit Never -0.4% N/A N/A ($9,415)
49.2% $149,713B-3 Optimise Building Insulation Immediate 2.9% N/A N/A
$156,071
Base Case: Best performing HVAC system: water cooled VAV systemB-1 Optimise Glazing 2 yrs 13.4% 52.6%
49.1% $156,179M-7 Water Cooled VAV with FPP 2.1 yrs 14.9% 52.5% 49.0%
$242,546
Base Case: Identical VAV system but without fan-powered parallel terminal units. Note: FPPs not modelled in hot climates.M-7 Air Cooled VAV with FPP 2.1 yrs 14.6% 52.5%
M-7 Water Cooled VAV 5.2 yrs 50.2% 20.8% 18.1%M-7 Air Cooled VAV 5 yrs 49.1% 21.6% 18.9% $240,067M-7 Fan Coil Units 11 yrs 33.2% 8.4% 8.1% $31,388
Base Case: PTAC units with air-cooled unitary cooling and electric resistance heating. M-7 Condenser Water Heat Pump 6.8 yrs 24.0% 15.3% 13.4% $140,870
NPV(Over 20 Years)
yrs % % % $
Energy Modelling Results Summary New Hotels Cold-AlpineThe table below summarises the overall energy and financial performance for the modeled new hotel in the cold-alpine climate zone against the baseline building. Energy savings for a specific building may vary based on that building's parameters and financial results may also vary based on local costs and financing structures. For details regarding each measure refer to the individual calculation pages immediately following this page. For detailed assumptions relating to the energy model, utilities, emission factors, financial inputs, cost of capital, etc refer to the assumptions section of this book.Note: CO2 reduction percentages closely match both source energy reductions and annual energy savings cost reductions. Due to different modeling methodologies existing hotel and new hotel CO2 reduction percentages cannot be compared against each other. The colour key contained below refers solely to simple payback periods.
Relevant Action Group Measure
Cold/AlpineFargo, ND
Simple Payback CO2 Reductions IRR First Year Yield On Marginal Cost
Issued February 1, 2011 119 New Hotels Energy Analysis - Green Engage/Solutions

HVAC Fans 70 6
1,090.9 1,000.1 47.8%22.9 7.3 24.2%
68 6 2 0
187.2 -24.5 -15.1%
SO2 (lb/yr) 2,327 2,348 -0.9%NOX (lb/yr)
CO2 (lb/yr)%
% Savings (+) / Loss (-)Emissions Base Case Proposed
960 7.7%
832,220 720,813 13.4%
As with Base Case, but with improved glazing properties. SHGC is unchanged, U-value is reduced to
0.3.
2,091.0
Building Envelope
Base Case Energy End-Use Benchmark Comparison Environmental Impact AnalysisVAV system with reheat used for all rooms. Cooling provided by water-cooled chiller with cooling tower.
Gas-fired boilers provide heating. Demand ventilation. Standard ASHRAE construction for climate zone 7.
1,040
N/A N/A N/A
Space Heating - Elec 30.2
Space Cooling 162.7Pumps
Space Heating - GasProposed Modifications
Lighting 1,186.6 1,186.6
2 8%
13.4%
Individual Resource Calculations New Hotels Cold-Alpine
N/AHeat Rejection 59.5 58.0 1.5 2.5%
Energy End-Use
Base Case Energy Use
Proposed Energy Use
Savings (+) / Loss (-)
Savings (+) / Loss (-)
B-1 Optimize Glazing
MBtu/yr MBtu/yr MBtu/yr0.0 0.0%
832,220720,813
400,000500,000600,000700,000800,000900,000
lb/y
r
Annual CO2 Emissions
N/A
Base Utilities N/A N/A N/A N/A
Assumptions
27.4%
27.4%Total 3,600.6 2,614.2 986.4
HVAC Fans 70.6 68.6 2.0N/A N/A N/A N/A
0.3. 2.8%Receptacles
832,220720,813
0100,000200,000300,000400,000500,000600,000700,000800,000900,000
Base Case Proposed
lb/y
r
Annual CO2 Emissions
2,327
1,040
2,348
960
0
500
1,000
1,500
2,000
2,500
SO2 (lb/yr) NOX (lb/yr)
g/yr
Annual SO2 and NOX EmissionsBase Case
Proposed
3,601
2,614
0500
1,0001,5002,0002,5003,0003,5004,000
Base Case Proposed
MBt
u/yr
Annual Total Energy Use
Issued February 1, 2011 120 New Hotels Energy Analysis - Green Engage/Solutions

Additional Capital CostHVAC Plant First Cost Reductions
Cooling Plant Savings ($450/ton)Heating Plant Savings ($7 55/MBh)
14 tons $6,309 5 $0 $13,850 $13,850
52.6%
2 yrs
$24,549
$12,069
MBh $1 102 6 $0 $14 334 $14 334146
Capital Costs Savings Summary($63,866)
4 $0 $13,3813 $0 $12,929 $12,9292 $0 $12,492 $12,492 IRR
$13,381 First Year Yield On Marginal Cost 49.2%
Cash Flow
1 $0 $12,069 $12,069Water & sewer 0 Gals N/A $0 0
Initial Annual Savings
($24,549) $0 ($24,549) Simple Payback
ResourceAnnual Resource Savings
(+) / Loss (-) Unit CostAnnual Savings (+) /
Loss (-)Yr.
Costs (Marginal/Maint/
Replace)
Savings (+) / Loss (-)
Initial Marginal Cost
Natural gas 10,004 therms $1.1906 $11,911Electricity -4,015 kWh $0.0622 ($250)
B-1 Optimize Glazing
Annual Resource Cost Summary
Building Envelope
Financial Table Financial Results Summary
Individual Resource Calculations New Hotels Cold-Alpine
Heating Plant Savings ($7.55/MBh)Airside Distribution Savings ($3.5/cfm)
Total Additional Capital Cost:
Estimated Useful Life (yrs)Percent replacedReplacement Cost
Base YearValuation TypeProject Analysis PeriodDiscount Rate for Defined ValuationEnergy Escalation Rate (Nominal)
7($24,549)
cfm $31,906 $0 $14,836
$0
Financial Analysis 15 $0
Defined 17 $0 $20,928 $20,92820 18 $0
0% 12 $0 $17,621 $17,621
$21,660 $21,660
$19,536 $19,536
6.00% 19 $0 $22,418 $22,4183.50% 20 $0 $23,203 $23,203
$0 13 $0 $18,237 $18,23714 $0 $18,876 $18,876
2008 16 $0 $20,220 $20,220
20 11 $0 $17,025 $17,025Replacement Life and Cost Summary 10 $0 $16,449 $16,449
9
MBh $1,102 6 $0 $14,334
$15,893 $15,893
9,1168 $0 $15,355 $15,355
$14,836$149,713$14,334 NPV146
($50,000)$0
$50,000 $100,000 $150,000 $200,000 $250,000 $300,000 $350,000
0 5 10 15 20Net
Cas
h Fl
ow (E
nd o
f Yea
r)
Years
Simple Payback Graph
Issued February 1, 2011 121 New Hotels Energy Analysis - Green Engage/Solutions

Proposed ModificationsAs with Base Case, but with the overall wall U-value
reduced to 0.06.N/A N/A
Heat Rejection 59.5 50.4 9.1 15.3%N/A
HVAC Fans 70 6 68 6 2 0 2 8%
Space Cooling 162.7 154.3 8.4 5.2%Pumps
Space Heating - Gas
2.9%N/A
2,091.0 1,957.5 133.5 6.4%Space Heating - Elec 30.2 28.1 2.1 7.0%
Savings (+) / Loss (-)
2.3%Lighting 1,186.6 1,186.6SO2 (lb/yr) 2,327 2,293 1.4%NOX (lb/yr)
CO2 (lb/yr) 832,220 808,221
Emissions Base Case ProposedSavings (+) /
Loss (-)
0.0 0.0%
Individual Resource Calculations New Hotels Cold-Alpine
Building Envelope
Base Case Energy End-Use Benchmark Comparison Environmental Impact AnalysisVAV system with reheat used for all rooms. Cooling provided by water-cooled chiller with cooling tower.
Gas-fired boilers provide heating. Demand ventilation. Standard ASHRAE construction for climate zone 7.
B-3 Optimize Building Insulation
1,040 1,016
2.9%
% Savings (+) / Loss (-)
MBtu/yr MBtu/yr MBtu/yr %Energy End-Use
Base Case Energy Use
Proposed Energy Use
832,220 808,221
400,000500,000600,000700,000800,000900,000
lb/y
r
Annual CO2 Emissions
N/AAssumptions
Total 3,600.6 3,445.5 155.1
Receptacles N/A N/A N/A
4.3%
N/A
4.3%Base Utilities N/A N/A N/A N/A
HVAC Fans 70.6 68.6 2.0 2.8%
832,220 808,221
0100,000200,000300,000400,000500,000600,000700,000800,000900,000
Base Case Proposed
lb/y
r
Annual CO2 Emissions
2,327
1,040
2,293
1,016
0
500
1,000
1,500
2,000
2,500
SO2 (lb/yr) NOX (lb/yr)
g/yr
Annual SO2 and NOX EmissionsBase Case
Proposed
3,601 3,446
0500
1,0001,5002,0002,5003,0003,5004,000
Base Case Proposed
MBt
u/yr
Annual Total Energy Use
Issued February 1, 2011 122 New Hotels Energy Analysis - Green Engage/Solutions

Additional Capital CostHVAC Plant First Cost Reductions
Cooling Plant Savings ($450/ton)Heating Plant Savings ($7 55/MBh)
($7,130)Capital Costs Savings Summary N/A
Annual Resource Cost Summary Financial Table
$2 438 $2 438123 MBh $929 6 $011 tons $4,950 5 $0 $2,356 $2,356
4 $0 $2,276 $2,276 First Year Yield On Marginal Cost N/A
IRR3 $0 $2,199 $2,1992 $0 $2,125 $2,125
Water & sewer 0 Gals N/A $0 0 $0 $22,881 Simple Payback$22,8811 $0 $2,053 $2,053
$0.0622 $394
B-3 Optimize Building Insulation
Immediate
Initial Annual Savings
Initial Marginal Cost ($22,881)
$2,053
Financial Results Summary
Savings (+) / Loss (-)Yr.
Costs (Marginal/Maint/
Replace)Cash Flow
Building Envelope
Natural gas 1,335 therms $1.1906 $1,590ElectricityResource
Annual Resource Savings (+) / Loss (-) Unit Cost
Annual Savings (+) / Loss (-)
6,330 kWh
Individual Resource Calculations New Hotels Cold-Alpine
Heating Plant Savings ($7.55/MBh)Airside Distribution Savings ($3.5/cfm)
Total Additional Capital Cost:
Estimated Useful Life (yrs)Percent replacedReplacement Cost
Base YearValuation TypeProject Analysis PeriodDiscount Rate for Defined ValuationEnergy Escalation Rate (Nominal)
$22,881cfm $24,133
Financial Analysis $3,323
$0 $3,102 $3,102
9 $0
$2,438 $2,438 NPV
$0 13
6.00% 19 $0 $3,813 $3,8133.50% 20 $0 $3,947 $3,947
0% 12 $0 $2,997 $2,997
15 $0
20 18 $0 $3,684 $3,684Defined
2008 16 $0 $3,439 $3,43917 $0 $3,560 $3,560
$3,32314 $0 $3,211 $3,211
$2,798 $2,798$2,703 $2,703
20 11 $0 $2,896 $2,896Replacement Life and Cost Summary 10 $0
6,8958 $0 $2,612 $2,612
$50,9917 $0 $2,524 $2,524
123 MBh $929 6 $0
$0 $10,000 $20,000 $30,000 $40,000 $50,000 $60,000 $70,000 $80,000 $90,000
0 5 10 15 20
Net
Cas
h Fl
ow (E
nd o
f Yea
r)
Years
Simple Payback Graph
Issued February 1, 2011 123 New Hotels Energy Analysis - Green Engage/Solutions

Mechanical
Base Case Energy End-Use Benchmark Comparison Environmental Impact AnalysisVAV system with reheat used for all rooms. Cooling provided by water-cooled chiller with cooling tower.
Gas-fired boilers provide heating. Demand ventilation. Standard ASHRAE construction for climate zone 7.
Savings (+) / Loss (-)
M-2
1,040 1,047 -0.7%Lighting 1,186.6 1,186.6 0.0 0.0%MBtu/yr MBtu/yr MBtu/yr %
% Savings (+) / Loss (-)
Energy End-Use
Base Case Energy Use
Proposed Energy Use
Space Heating - Gas 2,091.0 2,067.3 23.7 1.1%
SO2 (lb/yr) 2,327 2,351 -1.0%NOX (lb/yr)
CO2 (lb/yr) 832,220 835,609 -0.4%
Space Cooling 162.7 176.0 -13.3 -8.2%
72 6 2 0 2 8%
N/A N/A N/A
Dedicated Outside Air Unit
-0.4%59.5 60.1
Savings (+) / Loss (-)
-0.6
Space Heating - Elec 30.2 30.1 0.1 0.3%
Pumps
Individual Resource Calculations New Hotels Cold-Alpine
N/AHeat Rejection
Emissions Base Case Proposed
Proposed ModificationsAs with Base Case, but including a dedicated outside
air unit. -1.0%HVAC Fans 70 6
832,220 835,609
500,000
1,000,000
lb/y
r
Annual CO2 Emissions
Total 3,600.6 3,592.7 7.9N/A N/A N/A N/A
N/ABase Utilities
0.2%
72.6 -2.0 -2.8%
0.2%
N/AAssumptions
N/A N/A N/AReceptaclesHVAC Fans 70.6
832,220 835,609
0
500,000
1,000,000
Base Case Proposed
lb/y
r
Annual CO2 Emissions
2,327
1,040
2,351
1,047
0
2,000
4,000
SO2 (lb/yr) NOX (lb/yr)
g/yr
Annual SO2 and NOX EmissionsBase Case
Proposed
3,601 3,593
0500
1,0001,5002,0002,5003,0003,5004,000
Base Case Proposed
MBt
u/yr
Annual Total Energy Use
Issued February 1, 2011 124 New Hotels Energy Analysis - Green Engage/Solutions

Additional Capital CostHVAC Plant First Cost Reductions
Cooling Plant Savings ($450/ton)Heating Plant Savings ($7 55/MBh)
Financial Results Summary
ResourceAnnual Resource Savings
(+) / Loss (-) Unit CostAnnual Savings (+) /
Loss (-)Yr.
Costs (Marginal/Maint/
Replace)Electricity -4,631 kWh $0.0622 ($288) Initial Annual Savings
Savings (+) / Loss (-)
Mechanical
Water & sewer 0 Gals N/A $0 0 ($9,890)
($6)Natural gas 237 therms $1.1906 $282
Cash FlowInitial Marginal Cost $9,890
IRR
1 $0 ($6) ($6)$0
3 $0 ($6) ($6)2 $0 ($6) ($6)
4 $0 ($7) ($7) First Year Yield On Marginal Cost N/A($7)$0 ($7)($7)23 MBh $174 6 $0 ($7)
($9,695)
Annual Resource Cost Summary Financial Table
Capital Costs Savings Summary
-1 tons ($369) 5
N/A
($9,890) Simple Payback Never
M-2 Dedicated Outside Air Unit
Individual Resource Calculations New Hotels Cold-Alpine
Heating Plant Savings ($7.55/MBh)Airside Distribution Savings ($3.5/cfm)
Total Additional Capital Cost:
Estimated Useful Life (yrs)Percent replacedReplacement Cost
Base YearValuation TypeProject Analysis PeriodDiscount Rate for Defined ValuationEnergy Escalation Rate (Nominal)
($7)($7) NPV
20 11 $0 ($8) ($8)Replacement Life and Cost Summary
08 $0 ($7) ($7)
-$9,41523 MBh $174 6 $0 ($7)$0
$0 13 $0 ($9) ($9)14 $0 ($9) ($9)
2008 16 $0 ($10) ($10)Financial Analysis
($10) ($10)20 18 $0 ($11) ($11)
0% 12 $0 ($9) ($9)
3.50% 20 $0 ($11) ($11)6.00% 19 $0 ($11) ($11)
Defined 17
($8)
7 $0 ($7)
9 $0 ($8)
15 $0 ($9) ($9)
10 $0 ($8) ($8)
$0
($9,890)cfm
($10,100)
($10,050)
($10,000)
($9,950)
($9,900)
($9,850)
($9,800)0 5 10 15 20
Net
Cas
h Fl
ow (E
nd o
f Yea
r)
Years
Simple Payback Graph
Issued February 1, 2011 125 New Hotels Energy Analysis - Green Engage/Solutions

35 1%Heat Rejection
Space Heating - Elec 36.9 30.2 6.7 18.2%
41.4%HVAC Fans 108 7 70 6 38 1
Proposed ModificationsAs with Base Case, but with demand ventilation.
101.5 59.5 42.0
Space Cooling 246.1 162.7 83.4 33.9%Pumps
Space Heating - Gas
N/AN/A N/A N/A
2,644.5 2,091.0 553.5 20.9%
13.6%
Individual Resource Calculations New Hotels Cold-Alpine
Emissions Base Case Proposed
0.0%
Improved Ventilation Air Delivery: Demand VentilationM-2
1,186.6 1,186.6 0.0SO2 (lb/yr) 2,589 2,327 10.1%NOX (lb/yr)
Energy End-Use
Base Case Energy Use
Proposed Energy Use
Savings (+) / Loss (-)
Savings (+) / Loss (-)
Mechanical
Base Case Energy End-Use Benchmark Comparison Environmental Impact AnalysisVAV system with reheat used for all rooms. Cooling provided by water-cooled chiller with cooling tower.
Gas-fired boilers provide heating. No demand ventilation. Standard ASHRAE construction for climate
zone 7. 1,185 1,040 12.2%Lighting
CO2 (lb/yr) 963,141 832,220 13.6%
% Savings (+) / Loss (-)
MBtu/yr MBtu/yr MBtu/yr %
963,141832,220
600,000
800,000
1,000,000
1,200,000
lb/y
r
Annual CO2 Emissions
Total 4,324.3 3,600.6 723.7
N/ABase Utilities N/A N/A N/A N/AReceptacles
16.7%
N/A
35.1%
16.7%
HVAC Fans 108.7 70.6 38.1
Assumptions
N/A N/A N/A
963,141832,220
0
200,000
400,000
600,000
800,000
1,000,000
1,200,000
Base Case Proposed
lb/y
r
Annual CO2 Emissions
2,589
1,185
2,327
1,040
0
500
1,000
1,500
2,000
2,500
3,000
SO2 (lb/yr) NOX (lb/yr)
g/yr
Annual SO2 and NOX EmissionsBase Case
Proposed
4,324
3,601
0
1,000
2,000
3,000
4,000
5,000
Base Case Proposed
MBt
u/yr
Annual Total Energy Use
Issued February 1, 2011 126 New Hotels Energy Analysis - Green Engage/Solutions

Additional Capital CostHVAC Plant First Cost Reductions
Cooling Plant Savings ($450/ton)Heating Plant Savings ($7 55/MBh)
Annual Resource Cost Summary Financial Table
Capital Costs Savings Summary
0 MBh $0
($42,000)
$0 $11 916 $11 9160 tons $77 5 $0 $11,513 $11,513
4 $0 $11,123 $11,123 First Year Yield On Marginal Cost 23.9%
IRR
6
3 $0 $10,747 $10,7472 $0 $10,384 $10,384 27.0%
Water & sewer 0 Gals N/A $0 0 $0 ($41,924) Simple Payback($41,924)1 $0 $10,033 $10,033
Initial Marginal Cost $41,924
$10,033
4 yrs
Natural gas 5,537 therms $1.1906 $6,592Electricity 49,881 kWh
M-2 Improved Ventilation Air Delivery: Demand Ventilation
Individual Resource Calculations New Hotels Cold-Alpine
Cash Flow
Financial Results Summary
ResourceAnnual Resource Savings
(+) / Loss (-) Unit CostAnnual Savings (+) /
Loss (-)Yr.
Costs (Marginal/Maint/
Replace)
Savings (+) / Loss (-)$0.0622 $3,102 Initial Annual Savings
Mechanical
Heating Plant Savings ($7.55/MBh)Airside Distribution Savings ($3.5/cfm)
Total Additional Capital Cost:
Estimated Useful Life (yrs)Percent replacedReplacement Cost
Base YearValuation TypeProject Analysis PeriodDiscount Rate for Defined ValuationEnergy Escalation Rate (Nominal)
7 $0 $12,333
$14,647
$13,211 $13,2119 $0
0 MBh $0
($41,924)cfm $0
$0 13 $0 $15,160 $15,160
6.00% 19 $0 $18,636 $18,636
0% 12 $0 $14,647
3.50% 20 $0 $19,288 $19,288
20 18 $0 $18,005 $18,005Defined 17 $0 $17,397 $17,397
Financial Analysis 15 $0 $16,240 $16,2402008 16 $0 $16,808 $16,808
14 $0 $15,691 $15,691
20 11 $0 $14,152 $14,152Replacement Life and Cost Summary 10 $0 $13,673 $13,673
$12,333$12,764
$104,153$0 $11,916 $11,916 NPV0
8 $0 $12,764
6
($100,000)($50,000)
$0 $50,000
$100,000 $150,000 $200,000 $250,000 $300,000
0 5 10 15 20
Net
Cas
h Fl
ow (E
nd o
f Yea
r)
Years
Simple Payback Graph
Issued February 1, 2011 127 New Hotels Energy Analysis - Green Engage/Solutions

19 5%Heat Rejection
Space Heating - Elec 30.2 21.6 8.6 28.5%
-9.4%HVAC Fans 70 6 84 4 13 8
Proposed ModificationsAs with Base Case, but including a dedicated outside
air unit and a ventilation heat recovery unit. 59.5 65.1 -5.6
Space Cooling 162.7 185.4 -22.7 -14.0%Pumps
Space Heating - Gas
N/AN/A N/A N/A
2,091.0 1,576.6 514.4 24.6%
5.6%
Individual Resource Calculations New Hotels Cold-Alpine
Emissions Base Case Proposed
0.0%
Heat RecoveryM-3
1,186.6 1,186.6 0.0SO2 (lb/yr) 2,327 2,378 -2.2%NOX (lb/yr)
Energy End-Use
Base Case Energy Use
Proposed Energy Use
Savings (+) / Loss (-)
Savings (+) / Loss (-)
Mechanical
Base Case Energy End-Use Benchmark Comparison Environmental Impact AnalysisVAV system with reheat used for all rooms. Cooling provided by water-cooled chiller with cooling tower.
Gas-fired boilers provide heating. Demand ventilation. Standard ASHRAE construction for climate zone 7.
1,040 1,014 2.5%Lighting
CO2 (lb/yr) 832,220 785,224 5.6%
% Savings (+) / Loss (-)
MBtu/yr MBtu/yr MBtu/yr %
832,220 785,224
400,000500,000600,000700,000800,000900,000
lb/y
r
Annual CO2 Emissions
Total 3,600.6 3,119.7 480.9
N/ABase Utilities N/A N/A N/A N/AReceptacles
13.4%
N/A
-19.5%
13.4%
HVAC Fans 70.6 84.4 -13.8
Assumptions
N/A N/A N/A
832,220 785,224
0100,000200,000300,000400,000500,000600,000700,000800,000900,000
Base Case Proposed
lb/y
r
Annual CO2 Emissions
2,327
1,040
2,378
1,014
0
500
1,000
1,500
2,000
2,500
SO2 (lb/yr) NOX (lb/yr)
g/yr
Annual SO2 and NOX EmissionsBase Case
Proposed
3,6013,120
0500
1,0001,5002,0002,5003,0003,5004,000
Base Case Proposed
MBt
u/yr
Annual Total Energy Use
Issued February 1, 2011 128 New Hotels Energy Analysis - Green Engage/Solutions

Additional Capital CostHVAC Plant First Cost Reductions
Cooling Plant Savings ($450/ton)Heating Plant Savings ($7 55/MBh)
Annual Resource Cost Summary Financial Table
Capital Costs Savings Summary
185 MBh $1 397
($77,743)
$0 $6 780 $6 780-3 tons ($1,449) 5 $0 $6,551 $6,551
4 $0 $6,329 $6,329 First Year Yield On Marginal Cost 19.1%
IRR
6
3 $0 $6,115 $6,1152 $0 $5,909 $5,909 21.9%
Water & sewer 0 Gals N/A $0 0 $0 ($29,891) Simple Payback($29,891)1 $0 $5,709 $5,709
Initial Marginal Cost $29,891
$5,709
4.9 yrs
Natural gas 5,145 therms $1.1906 $6,126Electricity -9,818 kWh
M-3 Heat Recovery
Individual Resource Calculations New Hotels Cold-Alpine
Cash Flow
Financial Results Summary
ResourceAnnual Resource Savings
(+) / Loss (-) Unit CostAnnual Savings (+) /
Loss (-)Yr.
Costs (Marginal/Maint/
Replace)
Savings (+) / Loss (-)$0.0622 ($610) Initial Annual Savings
Mechanical
Heating Plant Savings ($7.55/MBh)Airside Distribution Savings ($3.5/cfm)
Total Additional Capital Cost:
Estimated Useful Life (yrs)Percent replacedReplacement Cost
Base YearValuation TypeProject Analysis PeriodDiscount Rate for Defined ValuationEnergy Escalation Rate (Nominal)
7 $0 $7,018
$8,335
$7,517 $7,5179 $0
185 MBh $1,397
($29,891)cfm $47,905
$0 13 $0 $8,626 $8,626
6.00% 19 $0 $10,604 $10,604
0% 12 $0 $8,335
3.50% 20 $0 $10,975 $10,975
20 18 $0 $10,245 $10,245Defined 17 $0 $9,899 $9,899
Financial Analysis 15 $0 $9,241 $9,2412008 16 $0 $9,564 $9,564
14 $0 $8,928 $8,928
20 11 $0 $8,053 $8,053Replacement Life and Cost Summary 10 $0 $7,781 $7,781
$7,018$7,263
$53,572$0 $6,780 $6,780 NPV13,687
8 $0 $7,263
6
($40,000)($20,000)
$0 $20,000 $40,000 $60,000 $80,000
$100,000 $120,000 $140,000
0 5 10 15 20
Net
Cas
h Fl
ow (E
nd o
f Yea
r)
Years
Simple Payback Graph
Issued February 1, 2011 129 New Hotels Energy Analysis - Green Engage/Solutions

0 3%Heat Rejection
Space Heating - Elec 30.2 30.2 0.0 0.0%
30.9%HVAC Fans 70 6 70 4 0 2
Proposed ModificationsAs with Base Case, but with an enthalpy economizer.
59.5 41.1 18.4
Space Cooling 162.7 119.5 43.2 26.6%Pumps
Space Heating - Gas
N/AN/A N/A N/A
2,091.0 2,090.5 0.5 0.0%
2.9%
Individual Resource Calculations New Hotels Cold-Alpine
Emissions Base Case Proposed
0.0%
Economizer ModesM-4
1,186.6 1,186.6 0.0SO2 (lb/yr) 2,327 2,231 4.1%NOX (lb/yr)
Energy End-Use
Base Case Energy Use
Proposed Energy Use
Savings (+) / Loss (-)
Savings (+) / Loss (-)
Mechanical
Base Case Energy End-Use Benchmark Comparison Environmental Impact AnalysisVAV system with reheat used for all rooms. Cooling provided by water-cooled chiller with cooling tower.
Gas-fired boilers provide heating. Demand ventilation. Standard ASHRAE construction for climate zone 7.
1,040 1,005 3.4%Lighting
CO2 (lb/yr) 832,220 808,085 2.9%
% Savings (+) / Loss (-)
MBtu/yr MBtu/yr MBtu/yr %
832,220 808,085
400,000500,000600,000700,000800,000900,000
lb/y
r
Annual CO2 Emissions
Total 3,600.6 3,538.3 62.3
N/ABase Utilities N/A N/A N/A N/AReceptacles
1.7%
N/A
0.3%
1.7%
HVAC Fans 70.6 70.4 0.2
Assumptions
N/A N/A N/A
832,220 808,085
0100,000200,000300,000400,000500,000600,000700,000800,000900,000
Base Case Proposed
lb/y
r
Annual CO2 Emissions
2,327
1,040
2,231
1,005
0
500
1,000
1,500
2,000
2,500
SO2 (lb/yr) NOX (lb/yr)
g/yr
Annual SO2 and NOX EmissionsBase Case
Proposed
3,601 3,538
0500
1,0001,5002,0002,5003,0003,5004,000
Base Case Proposed
MBt
u/yr
Annual Total Energy Use
Issued February 1, 2011 130 New Hotels Energy Analysis - Green Engage/Solutions

Additional Capital CostHVAC Plant First Cost Reductions
Cooling Plant Savings ($450/ton)Heating Plant Savings ($7 55/MBh)
Annual Resource Cost Summary Financial Table
Capital Costs Savings Summary
0 MBh $0
($10,963)
$0 $1 392 $1 3920 tons $0 5 $0 $1,345 $1,345
4 $0 $1,299 $1,299 First Year Yield On Marginal Cost 10.7%
IRR
6
3 $0 $1,255 $1,2552 $0 $1,213 $1,213 12.0%
Water & sewer 0 Gals N/A $0 0 $0 ($10,963) Simple Payback($10,963)1 $0 $1,172 $1,172
Initial Marginal Cost $10,963
$1,172
8.3 yrs
Natural gas 5 therms $1.1906 $6Electricity 18,112 kWh
M-4 Economizer Modes
Individual Resource Calculations New Hotels Cold-Alpine
Cash Flow
Financial Results Summary
ResourceAnnual Resource Savings
(+) / Loss (-) Unit CostAnnual Savings (+) /
Loss (-)Yr.
Costs (Marginal/Maint/
Replace)
Savings (+) / Loss (-)$0.0622 $1,126 Initial Annual Savings
Mechanical
Heating Plant Savings ($7.55/MBh)Airside Distribution Savings ($3.5/cfm)
Total Additional Capital Cost:
Estimated Useful Life (yrs)Percent replacedReplacement Cost
Base YearValuation TypeProject Analysis PeriodDiscount Rate for Defined ValuationEnergy Escalation Rate (Nominal)
7 $0 $1,440
$1,711
$1,543 $1,5439 $0
0 MBh $0
($10,963)cfm $0
$0 13 $0 $1,771 $1,771
6.00% 19 $0 $2,177 $2,177
0% 12 $0 $1,711
3.50% 20 $0 $2,253 $2,253
20 18 $0 $2,103 $2,103Defined 17 $0 $2,032 $2,032
Financial Analysis 15 $0 $1,897 $1,8972008 16 $0 $1,963 $1,963
14 $0 $1,833 $1,833
20 11 $0 $1,653 $1,653Replacement Life and Cost Summary 10 $0 $1,597 $1,597
$1,440$1,491
$6,441$0 $1,392 $1,392 NPV0
8 $0 $1,491
6
($15,000)($10,000)($5,000)
$0 $5,000
$10,000 $15,000 $20,000 $25,000
0 5 10 15 20
Net
Cas
h Fl
ow (E
nd o
f Yea
r)
Years
Simple Payback Graph
Issued February 1, 2011 131 New Hotels Energy Analysis - Green Engage/Solutions

88 5%Heat Rejection
Space Heating - Elec 1,913.9 1,712.5 201.4 10.5%
-57.1%HVAC Fans 859 1 98 4 760 7
Proposed ModificationsPTACs replaced by heat pumps. Condenser water
cooling. Electric resistance heating. Demand ventilation. Identical construction to Base Case.
39.6 62.2 -22.6
Space Cooling 286.3 196.6 89.7 31.3%Pumps
Space Heating - Gas
N/AN/A N/A N/A
0.0 0.0 0.0 0.0%
24.0%
Individual Resource Calculations New Hotels Cold-Alpine
Emissions Base Case Proposed
0.0%
Guest Room Equipment Selection: Condensor Water Heat PumpM-7
1,186.6 1,186.6 0.0SO2 (lb/yr) 6,605 5,019 24.0%NOX (lb/yr)
Energy End-Use
Base Case Energy Use
Proposed Energy Use
Savings (+) / Loss (-)
Savings (+) / Loss (-)
Mechanical
Base Case Energy End-Use Benchmark Comparison Environmental Impact AnalysisBaseline ASHRAE HVAC system: PTAC units used for
all rooms. Air-cooled unitary cooling. Electric resistance heating. Demand ventilation. Standard
ASHRAE construction for climate zone 7.
2,432 1,848 24.0%Lighting
CO2 (lb/yr) 1,669,605 1,268,635 24.0%
% Savings (+) / Loss (-)
MBtu/yr MBtu/yr MBtu/yr %
1,669,605
1,268,635
800,0001,000,0001,200,0001,400,0001,600,0001,800,000
lb/y
r
Annual CO2 Emissions
Total 4,285.5 3,256.3 1,029.2
N/ABase Utilities N/A N/A N/A N/AReceptacles
24.0%
N/A
88.5%
24.0%
HVAC Fans 859.1 98.4 760.7ventilation. Identical construction to Base Case.
Assumptions
N/A N/A N/A
1,669,605
1,268,635
0200,000400,000600,000800,000
1,000,0001,200,0001,400,0001,600,0001,800,000
Base Case Proposed
lb/y
r
Annual CO2 Emissions
6,605
2,432
5,019
1,848
0
1,000
2,000
3,000
4,000
5,000
6,000
7,000
SO2 (lb/yr) NOX (lb/yr)
g/yr
Annual SO2 and NOX EmissionsBase Case
Proposed
4,286
3,256
0500
1,0001,5002,0002,5003,0003,5004,0004,500
Base Case Proposed
MBt
u/yr
Annual Total Energy Use
Issued February 1, 2011 132 New Hotels Energy Analysis - Green Engage/Solutions

Additional Capital CostHVAC Plant First Cost Reductions
Cooling Plant Savings ($450/ton)Heating Plant Savings ($7 55/MBh)
Annual Resource Cost Summary Financial Table
Capital Costs Savings Summary
0 MBh $0
($145,400)
$0 $23 055 $23 0550 tons $0 5 $0 $22,275 $22,275
4 $0 $21,522 $21,522 First Year Yield On Marginal Cost 13.4%
IRR
6
3 $0 $20,794 $20,7942 $0 $20,091 $20,091 15.3%
Water & sewer 0 Gals N/A $0 0 $0 ($145,400) Simple Payback($145,400)1 $0 $19,411 $19,411
Initial Marginal Cost $145,400
$19,411
6.8 yrs
Natural gas 0 therms $1.1906 $0Electricity 301,629 kWh
M-7 Guest Room Equipment Selection: Condensor Water Heat Pump
Individual Resource Calculations New Hotels Cold-Alpine
Cash Flow
Financial Results Summary
ResourceAnnual Resource Savings
(+) / Loss (-) Unit CostAnnual Savings (+) /
Loss (-)Yr.
Costs (Marginal/Maint/
Replace)
Savings (+) / Loss (-)$0.0622 $18,755 Initial Annual Savings
Mechanical
Heating Plant Savings ($7.55/MBh)Airside Distribution Savings ($3.5/cfm)
Total Additional Capital Cost:
Estimated Useful Life (yrs)Percent replacedReplacement Cost
Base YearValuation TypeProject Analysis PeriodDiscount Rate for Defined ValuationEnergy Escalation Rate (Nominal)
7 $0 $23,862
$28,340
$25,561 $25,5619 $0
0 MBh $0
($145,400)cfm $0
$0 13 $0 $29,332 $29,332
6.00% 19 $0 $36,056 $36,056
0% 12 $0 $28,340
3.50% 20 $0 $37,318 $37,318
20 18 $0 $34,837 $34,837Defined 17 $0 $33,659 $33,659
Financial Analysis 15 $0 $31,421 $31,4212008 16 $0 $32,521 $32,521
14 $0 $30,359 $30,359
20 11 $0 $27,382 $27,382Replacement Life and Cost Summary 10 $0 $26,456 $26,456
$23,862$24,697
$140,870$0 $23,055 $23,055 NPV0
8 $0 $24,697
6
($200,000)
($100,000)
$0
$100,000
$200,000
$300,000
$400,000
$500,000
0 5 10 15 20
Net
Cas
h Fl
ow (E
nd o
f Yea
r)
Years
Simple Payback Graph
Issued February 1, 2011 133 New Hotels Energy Analysis - Green Engage/Solutions

14 3%Heat Rejection
Space Heating - Elec 1,913.9 31.8 1,882.1 98.3%
-81.1%HVAC Fans 859 1 736 3 122 8
Proposed ModificationsPTACs replaced by fan coil units. Water-cooled chiller cooling. Heating provided by gas-fired boiler. Demand
ventilation. Identical construction to Base Case.39.6 71.7 -32.1
Space Cooling 286.3 148.8 137.5 48.0%Pumps
Space Heating - Gas
N/AN/A N/A N/A
0.0 2,297.6 -2,297.6 0.0%
33.2%
Individual Resource Calculations New Hotels Cold-Alpine
Emissions Base Case Proposed
0.0%
Guest Room Equipment Selection: Fan Coil UnitsM-7
1,186.6 1,186.6 0.0SO2 (lb/yr) 6,605 3,352 49.2%NOX (lb/yr)
Energy End-Use
Base Case Energy Use
Proposed Energy Use
Savings (+) / Loss (-)
Savings (+) / Loss (-)
Mechanical
Base Case Energy End-Use Benchmark Comparison Environmental Impact AnalysisBaseline ASHRAE HVAC system: PTAC units used for
all rooms. Air-cooled unitary cooling. Electric resistance heating. Demand ventilation. Standard
ASHRAE construction for climate zone 7.
2,432 1,436 41.0%Lighting
CO2 (lb/yr) 1,669,605 1,115,651 33.2%
% Savings (+) / Loss (-)
MBtu/yr MBtu/yr MBtu/yr %
1,669,605
1,115,651
800,0001,000,0001,200,0001,400,0001,600,0001,800,000
lb/y
r
Annual CO2 Emissions
Total 4,285.5 4,472.8 -187.3
N/ABase Utilities N/A N/A N/A N/AReceptacles
-4.4%
N/A
14.3%
-4.4%
HVAC Fans 859.1 736.3 122.8ventilation. Identical construction to Base Case.
Assumptions
N/A N/A N/A
1,669,605
1,115,651
0200,000400,000600,000800,000
1,000,0001,200,0001,400,0001,600,0001,800,000
Base Case Proposed
lb/y
r
Annual CO2 Emissions
6,605
2,4323,352
1,436
0
1,000
2,000
3,000
4,000
5,000
6,000
7,000
SO2 (lb/yr) NOX (lb/yr)
g/yr
Annual SO2 and NOX EmissionsBase Case
Proposed
4,286 4,473
0
1,000
2,000
3,000
4,000
5,000
Base Case Proposed
MBt
u/yr
Annual Total Energy Use
Issued February 1, 2011 134 New Hotels Energy Analysis - Green Engage/Solutions

Additional Capital CostHVAC Plant First Cost Reductions
Cooling Plant Savings ($450/ton)Heating Plant Savings ($7 55/MBh)
Annual Resource Cost Summary Financial Table
Capital Costs Savings Summary
0 MBh $0
($141,041)
$0 $13 636 $13 6360 tons $0 5 $0 $13,174 $13,174
4 $0 $12,729 $12,729 First Year Yield On Marginal Cost 8.1%
IRR
6
3 $0 $12,298 $12,2982 $0 $11,883 $11,883 8.4%
Water & sewer 0 Gals N/A $0 0 $0 ($141,041) Simple Payback($141,041)1 $0 $11,481 $11,481
Initial Marginal Cost $141,041
$11,481
11 yrs
Natural gas -22,983 therms $1.1906 -$27,363Electricity 618,468 kWh
M-7 Guest Room Equipment Selection: Fan Coil Units
Individual Resource Calculations New Hotels Cold-Alpine
Cash Flow
Financial Results Summary
ResourceAnnual Resource Savings
(+) / Loss (-) Unit CostAnnual Savings (+) /
Loss (-)Yr.
Costs (Marginal/Maint/
Replace)
Savings (+) / Loss (-)$0.0622 $38,456 Initial Annual Savings
Mechanical
Heating Plant Savings ($7.55/MBh)Airside Distribution Savings ($3.5/cfm)
Total Additional Capital Cost:
Estimated Useful Life (yrs)Percent replacedReplacement Cost
Base YearValuation TypeProject Analysis PeriodDiscount Rate for Defined ValuationEnergy Escalation Rate (Nominal)
7 $0 $14,113
$16,762
$15,118 $15,1189 $0
0 MBh $0
($141,041)cfm $0
$0 13 $0 $17,348 $17,348
6.00% 19 $0 $21,325 $21,325
0% 12 $0 $16,762
3.50% 20 $0 $22,072 $22,072
20 18 $0 $20,604 $20,604Defined 17 $0 $19,908 $19,908
Financial Analysis 15 $0 $18,584 $18,5842008 16 $0 $19,234 $19,234
14 $0 $17,955 $17,955
20 11 $0 $16,195 $16,195Replacement Life and Cost Summary 10 $0 $15,647 $15,647
$14,113$14,607
$31,388$0 $13,636 $13,636 NPV0
8 $0 $14,607
6
($200,000)($150,000)($100,000)
($50,000)$0
$50,000 $100,000 $150,000 $200,000
0 5 10 15 20
Net
Cas
h Fl
ow (E
nd o
f Yea
r)
Years
Simple Payback Graph
Issued February 1, 2011 135 New Hotels Energy Analysis - Green Engage/Solutions

91 8%Heat Rejection
Space Heating - Elec 1,913.9 30.2 1,883.7 98.4%
24.7%HVAC Fans 859 1 70 6 788 5
Proposed ModificationsPTACs replaced by a VAV system. Air-cooled chiller
cooling. Heating provided by gas-fired boiler. Demand ventilation. Identical construction to Base Case.
39.6 29.8 9.8
Space Cooling 286.3 236.5 49.8 17.4%Pumps
Space Heating - Gas
N/AN/A N/A N/A
0.0 2,091.0 -2,091.0 0.0%
49.1%
Individual Resource Calculations New Hotels Cold-Alpine
Emissions Base Case Proposed
0.0%
Guest Room Equipment Selection: Air Cooled VAVM-7
1,186.6 1,186.6 0.0SO2 (lb/yr) 6,605 2,395 63.7%NOX (lb/yr)
Energy End-Use
Base Case Energy Use
Proposed Energy Use
Savings (+) / Loss (-)
Savings (+) / Loss (-)
Mechanical
Base Case Energy End-Use Benchmark Comparison Environmental Impact AnalysisBaseline ASHRAE HVAC system: Air-cooled PTAC units used for all rooms. Electric resistance heating.
Demand ventilation. Standard ASHRAE construction for climate zone 7.
2,432 1,065 56.2%Lighting
CO2 (lb/yr) 1,669,605 849,401 49.1%
% Savings (+) / Loss (-)
MBtu/yr MBtu/yr MBtu/yr %
1,669,605
849,4011,000,000
2,000,000
lb/y
r
Annual CO2 Emissions
Total 4,285.5 3,644.7 640.8
N/ABase Utilities N/A N/A N/A N/AReceptacles
15.0%
N/A
91.8%
15.0%
HVAC Fans 859.1 70.6 788.5ventilation. Identical construction to Base Case.
Assumptions
N/A N/A N/A
1,669,605
849,401
0
1,000,000
2,000,000
Base Case Proposed
lb/y
r
Annual CO2 Emissions
6,605
2,4322,3951,065
0
5,000
10,000
SO2 (lb/yr) NOX (lb/yr)
g/yr
Annual SO2 and NOX EmissionsBase Case
Proposed
4,286
3,645
0500
1,0001,5002,0002,5003,0003,5004,0004,500
Base Case Proposed
MBt
u/yr
Annual Total Energy Use
Issued February 1, 2011 136 New Hotels Energy Analysis - Green Engage/Solutions

Additional Capital CostHVAC Plant First Cost Reductions
Cooling Plant Savings ($450/ton)Heating Plant Savings ($7 55/MBh)
Annual Resource Cost Summary Financial Table
Capital Costs Savings Summary
476 MBh $3 594
($212,000)
$0 $30 582 $30 58218 tons $7,884 5 $0 $29,548 $29,548
4 $0 $28,549 $28,549 First Year Yield On Marginal Cost 18.9%
IRR
6
3 $0 $27,583 $27,5832 $0 $26,650 $26,650 21.6%
Water & sewer 0 Gals N/A $0 0 $0 ($136,479) Simple Payback($136,479)1 $0 $25,749 $25,749
Initial Marginal Cost $136,479
$25,749
5 yrs
Natural gas -20,916 therms $1.1906 -$24,903Electricity 800,611 kWh
M-7 Guest Room Equipment Selection: Air Cooled VAV
Individual Resource Calculations New Hotels Cold-Alpine
Cash Flow
Financial Results Summary
ResourceAnnual Resource Savings
(+) / Loss (-) Unit CostAnnual Savings (+) /
Loss (-)Yr.
Costs (Marginal/Maint/
Replace)
Savings (+) / Loss (-)$0.0622 $49,781 Initial Annual Savings
Mechanical
Heating Plant Savings ($7.55/MBh)Airside Distribution Savings ($3.5/cfm)
Total Additional Capital Cost:
Estimated Useful Life (yrs)Percent replacedReplacement Cost
Base YearValuation TypeProject Analysis PeriodDiscount Rate for Defined ValuationEnergy Escalation Rate (Nominal)
7 $0 $31,652
$37,593
$33,907 $33,9079 $0
476 MBh $3,594
($136,479)cfm $64,043
$0 13 $0 $38,909 $38,909
6.00% 19 $0 $47,829 $47,829
0% 12 $0 $37,593
3.50% 20 $0 $49,503 $49,503
20 18 $0 $46,212 $46,212Defined 17 $0 $44,649 $44,649
Financial Analysis 15 $0 $41,680 $41,6802008 16 $0 $43,139 $43,139
14 $0 $40,271 $40,271
20 11 $0 $36,322 $36,322Replacement Life and Cost Summary 10 $0 $35,094 $35,094
$31,652$32,760
$240,067$0 $30,582 $30,582 NPV18,298
8 $0 $32,760
6
($200,000)($100,000)
$0 $100,000 $200,000 $300,000 $400,000 $500,000 $600,000 $700,000
0 5 10 15 20
Net
Cas
h Fl
ow (E
nd o
f Yea
r)
Years
Simple Payback Graph
Issued February 1, 2011 137 New Hotels Energy Analysis - Green Engage/Solutions

91 8%Heat Rejection
Space Heating - Elec 1,913.9 30.2 1,883.7 98.4%
-50.3%HVAC Fans 859 1 70 6 788 5
Proposed ModificationsPTACs replaced by a VAV system. Water-cooled
chiller cooling. Heating provided by gas-fired boiler. Demand ventilation. Identical construction to Base
39.6 59.5 -19.9
Space Cooling 286.3 162.7 123.6 43.2%Pumps
Space Heating - Gas
N/AN/A N/A N/A
0.0 2,091.0 -2,091.0 0.0%
50.2%
Individual Resource Calculations New Hotels Cold-Alpine
Emissions Base Case Proposed
0.0%
Guest Room Equipment Selection: Water Cooled VAVM-7
1,186.6 1,186.6 0.0SO2 (lb/yr) 6,605 2,327 64.8%NOX (lb/yr)
Energy End-Use
Base Case Energy Use
Proposed Energy Use
Savings (+) / Loss (-)
Savings (+) / Loss (-)
Mechanical
Base Case Energy End-Use Benchmark Comparison Environmental Impact AnalysisBaseline ASHRAE HVAC system: PTAC units used for
all rooms. Air-cooled unitary cooling. Electric resistance heating. Demand ventilation. Standard
ASHRAE construction for climate zone 7.
2,432 1,040 57.2%Lighting
CO2 (lb/yr) 1,669,605 832,220 50.2%
% Savings (+) / Loss (-)
MBtu/yr MBtu/yr MBtu/yr %
1,669,605
832,220800,000
1,000,0001,200,0001,400,0001,600,0001,800,000
lb/y
r
Annual CO2 Emissions
Total 4,285.5 3,600.6 684.9
N/ABase Utilities N/A N/A N/A N/AReceptacles
16.0%
N/A
91.8%
16.0%
HVAC Fans 859.1 70.6 788.5Demand ventilation. Identical construction to Base Case.
Assumptions
N/A N/A N/A
1,669,605
832,220
0200,000400,000600,000800,000
1,000,0001,200,0001,400,0001,600,0001,800,000
Base Case Proposed
lb/y
r
Annual CO2 Emissions
6,605
2,4322,327
1,040
0
1,000
2,000
3,000
4,000
5,000
6,000
7,000
SO2 (lb/yr) NOX (lb/yr)
g/yr
Annual SO2 and NOX EmissionsBase Case
Proposed
4,286
3,601
0500
1,0001,5002,0002,5003,0003,5004,0004,500
Base Case Proposed
MBt
u/yr
Annual Total Energy Use
Issued February 1, 2011 138 New Hotels Energy Analysis - Green Engage/Solutions

Additional Capital CostHVAC Plant First Cost Reductions
Cooling Plant Savings ($450/ton)Heating Plant Savings ($7 55/MBh)
Annual Resource Cost Summary Financial Table
Capital Costs Savings Summary
476 MBh $3 594
($222,001)
$0 $31 570 $31 57018 tons $7,884 5 $0 $30,502 $30,502
4 $0 $29,471 $29,471 First Year Yield On Marginal Cost 18.1%
IRR
6
3 $0 $28,474 $28,4742 $0 $27,511 $27,511 20.8%
Water & sewer 0 Gals N/A $0 0 $0 ($146,480) Simple Payback($146,480)1 $0 $26,581 $26,581
Initial Marginal Cost $146,480
$26,581
5.2 yrs
Natural gas -20,916 therms $1.1906 -$24,903Electricity 813,536 kWh
M-7 Guest Room Equipment Selection: Water Cooled VAV
Individual Resource Calculations New Hotels Cold-Alpine
Cash Flow
Financial Results Summary
ResourceAnnual Resource Savings
(+) / Loss (-) Unit CostAnnual Savings (+) /
Loss (-)Yr.
Costs (Marginal/Maint/
Replace)
Savings (+) / Loss (-)$0.0622 $50,585 Initial Annual Savings
Mechanical
Heating Plant Savings ($7.55/MBh)Airside Distribution Savings ($3.5/cfm)
Total Additional Capital Cost:
Estimated Useful Life (yrs)Percent replacedReplacement Cost
Base YearValuation TypeProject Analysis PeriodDiscount Rate for Defined ValuationEnergy Escalation Rate (Nominal)
7 $0 $32,675
$38,807
$35,002 $35,0029 $0
476 MBh $3,594
($146,480)cfm $64,043
$0 13 $0 $40,166 $40,166
6.00% 19 $0 $49,374 $49,374
0% 12 $0 $38,807
3.50% 20 $0 $51,102 $51,102
20 18 $0 $47,704 $47,704Defined 17 $0 $46,091 $46,091
Financial Analysis 15 $0 $43,027 $43,0272008 16 $0 $44,532 $44,532
14 $0 $41,572 $41,572
20 11 $0 $37,495 $37,495Replacement Life and Cost Summary 10 $0 $36,227 $36,227
$32,675$33,818
$242,546$0 $31,570 $31,570 NPV18,298
8 $0 $33,818
6
($200,000)($100,000)
$0 $100,000 $200,000 $300,000 $400,000 $500,000 $600,000 $700,000
0 5 10 15 20
Net
Cas
h Fl
ow (E
nd o
f Yea
r)
Years
Simple Payback Graph
Issued February 1, 2011 139 New Hotels Energy Analysis - Green Engage/Solutions

35 8%Heat Rejection
Space Heating - Elec 30.2 31.9 -1.7 -5.6%
0.3%HVAC Fans 70 6 45 3 25 3
Proposed ModificationsAs with Base Case, but with fan-powered parallel
terminal units instead of standard VAV boxes. (Note: FPP systems have not been modelled for hot-humid or hot-dry
29.8 29.7 0.1
Space Cooling 236.5 235.9 0.6 0.3%Pumps
Space Heating - Gas
N/AN/A N/A N/A
2,091.0 1,106.4 984.6 47.1%
14.6%
Individual Resource Calculations New Hotels Cold-Alpine
Emissions Base Case Proposed
0.0%
Guest Room Equipment Selection: Air Cooled VAV with FPPM-7
1,186.6 1,186.6 0.0SO2 (lb/yr) 2,395 2,357 1.6%NOX (lb/yr)
Energy End-Use
Base Case Energy Use
Proposed Energy Use
Savings (+) / Loss (-)
Savings (+) / Loss (-)
Mechanical
Base Case Energy End-Use Benchmark Comparison Environmental Impact AnalysisVAV system with reheat used for all rooms. Cooling
provided by air-cooled chiller. Gas-fired boilers provide heating. Demand ventilation. Standard ASHRAE
construction for climate zone 7.
1,065 965 9.4%Lighting
CO2 (lb/yr) 849,401 724,999 14.6%
% Savings (+) / Loss (-)
MBtu/yr MBtu/yr MBtu/yr %
849,401
724,999
400,000500,000600,000700,000800,000900,000
lb/y
r
Annual CO2 Emissions
Total 3,644.7 2,635.8 1,008.9
N/ABase Utilities N/A N/A N/A N/AReceptacles
27.7%
N/A
35.8%
27.7%
HVAC Fans 70.6 45.3 25.3( y yclimates as there are insufficient cooling loads for this system to be
viable).
Assumptions
N/A N/A N/A
849,401
724,999
0100,000200,000300,000400,000500,000600,000700,000800,000900,000
Base Case Proposed
lb/y
r
Annual CO2 Emissions
2,395
1,065
2,357
965
0
500
1,000
1,500
2,000
2,500
3,000
SO2 (lb/yr) NOX (lb/yr)
g/yr
Annual SO2 and NOX EmissionsBase Case
Proposed
3,645
2,636
0500
1,0001,5002,0002,5003,0003,5004,000
Base Case Proposed
MBt
u/yr
Annual Total Energy Use
Issued February 1, 2011 140 New Hotels Energy Analysis - Green Engage/Solutions

Additional Capital CostHVAC Plant First Cost Reductions
Cooling Plant Savings ($450/ton)Heating Plant Savings ($7 55/MBh)
Annual Resource Cost Summary Financial Table
Capital Costs Savings Summary
222 MBh ($1 676)
($24,000)
$0 $14 959 $14 9590 tons $0 5 $0 $14,453 $14,453
4 $0 $13,964 $13,964 First Year Yield On Marginal Cost 49.1%
IRR
6
3 $0 $13,492 $13,4922 $0 $13,036 $13,036 52.5%
Water & sewer 0 Gals N/A $0 0 $0 ($25,676) Simple Payback($25,676)1 $0 $12,595 $12,595
Initial Marginal Cost $25,676
$12,595
2.1 yrs
Natural gas 9,849 therms $1.1906 $11,726Electricity 7,122 kWh
M-7 Guest Room Equipment Selection: Air Cooled VAV with FPP
Individual Resource Calculations New Hotels Cold-Alpine
Cash Flow
Financial Results Summary
ResourceAnnual Resource Savings
(+) / Loss (-) Unit CostAnnual Savings (+) /
Loss (-)Yr.
Costs (Marginal/Maint/
Replace)
Savings (+) / Loss (-)$0.0622 $443 Initial Annual Savings
Mechanical
Heating Plant Savings ($7.55/MBh)Airside Distribution Savings ($3.5/cfm)
Total Additional Capital Cost:
Estimated Useful Life (yrs)Percent replacedReplacement Cost
Base YearValuation TypeProject Analysis PeriodDiscount Rate for Defined ValuationEnergy Escalation Rate (Nominal)
7 $0 $15,482
$18,388
$16,585 $16,5859 $0
-222 MBh ($1,676)
($25,676)cfm $0
$0 13 $0 $19,032 $19,032
6.00% 19 $0 $23,395 $23,395
0% 12 $0 $18,388
3.50% 20 $0 $24,213 $24,213
20 18 $0 $22,603 $22,603Defined 17 $0 $21,839 $21,839
Financial Analysis 15 $0 $20,387 $20,3872008 16 $0 $21,101 $21,101
14 $0 $19,698 $19,698
20 11 $0 $17,766 $17,766Replacement Life and Cost Summary 10 $0 $17,165 $17,165
$15,482$16,024
$156,179$0 $14,959 $14,959 NPV0
8 $0 $16,024
6
($50,000)$0
$50,000 $100,000 $150,000 $200,000 $250,000 $300,000 $350,000
Net
Cas
h Fl
ow (E
nd o
f Yea
r)
Years
Simple Payback Graph
Issued February 1, 2011 141 New Hotels Energy Analysis - Green Engage/Solutions

Mechanical
Base Case Energy End-Use Benchmark Comparison Environmental Impact AnalysisVAV system with reheat used for all rooms. Cooling provided by water-cooled chiller with cooling tower. Electric resistance heating. Demand ventilation.
Standard ASHRAE construction for climate zone 7.
Savings (+) / Loss (-)
M-7
1,040 940 9.6%Lighting 1,186.6 1,186.6 0.0 0.0%MBtu/yr MBtu/yr MBtu/yr %
% Savings (+) / Loss (-)
Energy End-Use
Base Case Energy Use
Proposed Energy Use
Space Heating - Gas 2,091.0 1,106.4 984.6 47.1%
SO2 (lb/yr) 2,327 2,290 1.6%NOX (lb/yr)
CO2 (lb/yr) 832,220 707,973 14.9%
Space Cooling 162.7 162.4 0.3 0.2%
45 3 25 3 35 8%
N/A N/A N/A
Guest Room Equipment Selection: Water Cooled VAV with FPP
14.9%59.5 59.5
Savings (+) / Loss (-)
0.0
Space Heating - Elec 30.2 31.9 -1.7 -5.6%
Pumps
Individual Resource Calculations New Hotels Cold-Alpine
N/AHeat Rejection
Emissions Base Case Proposed
Proposed ModificationsAs with Base Case, but with fan-powered parallel
terminal units instead of standard VAV boxes. (Note: FPP systems have not been modelled for hot-humid or hot-dry
0.0%HVAC Fans 70 6
832,220
707,973
400,000500,000600,000700,000800,000900,000
lb/y
r
Annual CO2 Emissions
Total 3,600.6 2,592.1 1,008.5N/A N/A N/A N/A
N/ABase Utilities
28.0%
45.3 25.3 35.8%
28.0%
N/A
( y yclimates as there are insufficient cooling loads for this system to be
viable).
Assumptions
N/A N/A N/AReceptaclesHVAC Fans 70.6
832,220
707,973
0100,000200,000300,000400,000500,000600,000700,000800,000900,000
Base Case Proposed
lb/y
r
Annual CO2 Emissions
2,327
1,040
2,290
940
0
500
1,000
1,500
2,000
2,500
SO2 (lb/yr) NOX (lb/yr)
g/yr
Annual SO2 and NOX EmissionsBase Case
Proposed
3,601
2,592
0500
1,0001,5002,0002,5003,0003,5004,000
Base Case Proposed
MBt
u/yr
Annual Total Energy Use
Issued February 1, 2011 142 New Hotels Energy Analysis - Green Engage/Solutions

Additional Capital CostHVAC Plant First Cost Reductions
Cooling Plant Savings ($450/ton)Heating Plant Savings ($7 55/MBh)
Financial Results Summary
ResourceAnnual Resource Savings
(+) / Loss (-) Unit CostAnnual Savings (+) /
Loss (-)Yr.
Costs (Marginal/Maint/
Replace)Electricity 7,004 kWh $0.0622 $436 Initial Annual Savings
Savings (+) / Loss (-)
Mechanical
Water & sewer 0 Gals N/A $0 0 ($25,676)
$12,587Natural gas 9,849 therms $1.1906 $11,726
Cash FlowInitial Marginal Cost $25,676
IRR
1 $0 $12,587 $12,587$0
3 $0 $13,484 $13,4842 $0 $13,028 $13,028
4 $0 $13,956 $13,956 First Year Yield On Marginal Cost 49.0%$14,444$0 $14,444$14 950222 MBh ($1 676) 6 $0 $14 950
($24,000)
Annual Resource Cost Summary Financial Table
Capital Costs Savings Summary
0 tons $0 5
52.5%
($25,676) Simple Payback 2.1 yrs
M-7 Guest Room Equipment Selection: Water Cooled VAV with FPP
Individual Resource Calculations New Hotels Cold-Alpine
Heating Plant Savings ($7.55/MBh)Airside Distribution Savings ($3.5/cfm)
Total Additional Capital Cost:
Estimated Useful Life (yrs)Percent replacedReplacement Cost
Base YearValuation TypeProject Analysis PeriodDiscount Rate for Defined ValuationEnergy Escalation Rate (Nominal)
$15,473$14,950 NPV
20 11 $0 $17,755 $17,755Replacement Life and Cost Summary
08 $0 $16,014 $16,014
$156,071-222 MBh ($1,676) 6 $0 $14,950$0
$0 13 $0 $19,020 $19,02014 $0 $19,686 $19,686
2008 16 $0 $21,088 $21,088Financial Analysis
$21,826 $21,82620 18 $0 $22,590 $22,590
0% 12 $0 $18,377 $18,377
3.50% 20 $0 $24,199 $24,1996.00% 19 $0 $23,381 $23,381
Defined 17
$16,575
7 $0 $15,473
9 $0 $16,575
15 $0 $20,375 $20,375
10 $0 $17,155 $17,155
$0
($25,676)cfm
($50,000)$0
$50,000 $100,000 $150,000 $200,000 $250,000 $300,000 $350,000
Net
Cas
h Fl
ow (E
nd o
f Yea
r)
Years
Simple Payback Graph
Issued February 1, 2011 143 New Hotels Energy Analysis - Green Engage/Solutions

59 5%Heat Rejection
Space Heating - Elec 30.2 30.2 0.0 0.0%
0.0%HVAC Fans 70 6 28 6 42 0
Proposed ModificationsAs with Base Case, but with variable frequency drives
(VFDs) used in VAV system. 59.5 59.5 0.0
Space Cooling 162.7 162.7 0.0 0.0%Pumps
Space Heating - Gas
N/AN/A N/A N/A
2,091.0 2,091.0 0.0 0.0%
2.0%
Individual Resource Calculations New Hotels Cold-Alpine
Emissions Base Case Proposed
0.0%
Variable Frequency DrivesM-9
1,186.6 1,186.6 0.0SO2 (lb/yr) 2,327 2,262 2.8%NOX (lb/yr)
Energy End-Use
Base Case Energy Use
Proposed Energy Use
Savings (+) / Loss (-)
Savings (+) / Loss (-)
Mechanical
Base Case Energy End-Use Benchmark Comparison Environmental Impact AnalysisVAV system with reheat used for all rooms. Cooling provided by water-cooled chiller with cooling tower.
Gas-fired boilers provide heating. Demand ventilation. Standard ASHRAE construction for climate zone 7.
1,040 1,016 2.3%Lighting
CO2 (lb/yr) 832,220 815,857 2.0%
% Savings (+) / Loss (-)
MBtu/yr MBtu/yr MBtu/yr %
832,220 815,857
400,000500,000600,000700,000800,000900,000
lb/y
r
Annual CO2 Emissions
Total 3,600.6 3,558.6 42.0
N/ABase Utilities N/A N/A N/A N/AReceptacles
1.2%
N/A
59.5%
1.2%
HVAC Fans 70.6 28.6 42.0
Assumptions
N/A N/A N/A
832,220 815,857
0100,000200,000300,000400,000500,000600,000700,000800,000900,000
Base Case Proposed
lb/y
r
Annual CO2 Emissions
2,327
1,040
2,262
1,016
0
500
1,000
1,500
2,000
2,500
SO2 (lb/yr) NOX (lb/yr)
g/yr
Annual SO2 and NOX EmissionsBase Case
Proposed
3,601 3,559
0500
1,0001,5002,0002,5003,0003,5004,000
Base Case Proposed
MBt
u/yr
Annual Total Energy Use
Issued February 1, 2011 144 New Hotels Energy Analysis - Green Engage/Solutions

Additional Capital CostHVAC Plant First Cost Reductions
Cooling Plant Savings ($450/ton)Heating Plant Savings ($7 55/MBh)
Annual Resource Cost Summary Financial Table
Capital Costs Savings Summary
0 MBh $0
($6,299)
$0 $941 $9410 tons $0 5 $0 $909 $909
4 $0 $878 $878 First Year Yield On Marginal Cost 12.6%
IRR
6
3 $0 $849 $8492 $0 $820 $820 14.4%
Water & sewer 0 Gals N/A $0 0 $0 ($6,299) Simple Payback($6,299)1 $0 $792 $792
Initial Marginal Cost $6,299
$792
7.2 yrs
Natural gas 0 therms $1.1906 $0Electricity 12,309 kWh
M-9 Variable Frequency Drives
Individual Resource Calculations New Hotels Cold-Alpine
Cash Flow
Financial Results Summary
ResourceAnnual Resource Savings
(+) / Loss (-) Unit CostAnnual Savings (+) /
Loss (-)Yr.
Costs (Marginal/Maint/
Replace)
Savings (+) / Loss (-)$0.0622 $765 Initial Annual Savings
Mechanical
Heating Plant Savings ($7.55/MBh)Airside Distribution Savings ($3.5/cfm)
Total Additional Capital Cost:
Estimated Useful Life (yrs)Percent replacedReplacement Cost
Base YearValuation TypeProject Analysis PeriodDiscount Rate for Defined ValuationEnergy Escalation Rate (Nominal)
7 $0 $974
$1,157
$1,043 $1,0439 $0
0 MBh $0
($6,299)cfm $0
$0 13 $0 $1,197 $1,197
6.00% 19 $0 $1,471 $1,471
0% 12 $0 $1,157
3.50% 20 $0 $1,523 $1,523
20 18 $0 $1,422 $1,422Defined 17 $0 $1,374 $1,374
Financial Analysis 15 $0 $1,282 $1,2822008 16 $0 $1,327 $1,327
14 $0 $1,239 $1,239
20 11 $0 $1,117 $1,117Replacement Life and Cost Summary 10 $0 $1,080 $1,080
$974$1,008
$5,404$0 $941 $941 NPV0
8 $0 $1,008
6
($10,000)
($5,000)
$0
$5,000
$10,000
$15,000
$20,000
0 5 10 15 20
Net
Cas
h Fl
ow (E
nd o
f Yea
r)
Years
Simple Payback Graph
Issued February 1, 2011 145 New Hotels Energy Analysis - Green Engage/Solutions

Mechanical
Base Case Energy End-Use Benchmark Comparison Environmental Impact AnalysisVAV system with reheat used for all rooms. Cooling
provided by air-cooled chiller. Gas-fired boilers provide heating. Demand ventilation. Standard ASHRAE
construction for climate zone 7.
Savings (+) / Loss (-)
M-12
1,065 1,040 2.3%Lighting 1,186.6 1,186.6 0.0 0.0%MBtu/yr MBtu/yr MBtu/yr %
% Savings (+) / Loss (-)
Energy End-Use
Base Case Energy Use
Proposed Energy Use
Space Heating - Gas 2,091.0 2,091.0 0.0 0.0%
SO2 (lb/yr) 2,395 2,327 2.8%NOX (lb/yr)
CO2 (lb/yr) 849,401 832,220 2.0%
Space Cooling 236.5 162.7 73.8 31.2%
70 6 0 0 0 0%
N/A N/A N/A
Water Cooled Chiller
2.0%29.8 59.5
Savings (+) / Loss (-)
-29.7
Space Heating - Elec 30.2 30.2 0.0 0.0%
Pumps
Individual Resource Calculations New Hotels Cold-Alpine
N/AHeat Rejection
Emissions Base Case Proposed
Proposed ModificationsAs with Base Case, but with a water-cooled chiller and
cooling tower. -99.7%HVAC Fans 70 6
849,401 832,220
400,000500,000600,000700,000800,000900,000
lb/y
r
Annual CO2 Emissions
Total 3,644.7 3,600.6 44.1N/A N/A N/A N/A
N/ABase Utilities
1.2%
70.6 0.0 0.0%
1.2%
N/AAssumptions
N/A N/A N/AReceptaclesHVAC Fans 70.6
849,401 832,220
0100,000200,000300,000400,000500,000600,000700,000800,000900,000
Base Case Proposed
lb/y
r
Annual CO2 Emissions
2,395
1,065
2,327
1,040
0
500
1,000
1,500
2,000
2,500
3,000
SO2 (lb/yr) NOX (lb/yr)
g/yr
Annual SO2 and NOX EmissionsBase Case
Proposed
3,645 3,601
0500
1,0001,5002,0002,5003,0003,5004,000
Base Case Proposed
MBt
u/yr
Annual Total Energy Use
Issued February 1, 2011 146 New Hotels Energy Analysis - Green Engage/Solutions

Additional Capital CostHVAC Plant First Cost Reductions
Cooling Plant Savings ($450/ton)Heating Plant Savings ($7 55/MBh)
Financial Results Summary
ResourceAnnual Resource Savings
(+) / Loss (-) Unit CostAnnual Savings (+) /
Loss (-)Yr.
Costs (Marginal/Maint/
Replace)Electricity 12,924 kWh $0.0622 $804 Initial Annual Savings
Savings (+) / Loss (-)
Mechanical
Water & sewer 0 Gals N/A $0 0 ($10,000)
$832Natural gas 0 therms $1.1906 $0
Cash FlowInitial Marginal Cost $10,000
IRR
1 $0 $832 $832$0
3 $0 $891 $8912 $0 $861 $861
4 $0 $922 $922 First Year Yield On Marginal Cost 8.3%$954$0 $954$9880 MBh $0 6 $0 $988
($10,000)
Annual Resource Cost Summary Financial Table
Capital Costs Savings Summary
0 tons $0 5
8.7%
($10,000) Simple Payback 11 yrs
M-12 Water Cooled Chiller
Individual Resource Calculations New Hotels Cold-Alpine
Heating Plant Savings ($7.55/MBh)Airside Distribution Savings ($3.5/cfm)
Total Additional Capital Cost:
Estimated Useful Life (yrs)Percent replacedReplacement Cost
Base YearValuation TypeProject Analysis PeriodDiscount Rate for Defined ValuationEnergy Escalation Rate (Nominal)
$1,022$988 NPV
20 11 $0 $1,173 $1,173Replacement Life and Cost Summary
08 $0 $1,058 $1,058
$2,4800 MBh $0 6 $0 $988$0
$0 13 $0 $1,257 $1,25714 $0 $1,301 $1,301
2008 16 $0 $1,393 $1,393Financial Analysis
$1,442 $1,44220 18 $0 $1,493 $1,493
0% 12 $0 $1,214 $1,214
3.50% 20 $0 $1,599 $1,5996.00% 19 $0 $1,545 $1,545
Defined 17
$1,095
7 $0 $1,022
9 $0 $1,095
15 $0 $1,346 $1,346
10 $0 $1,134 $1,134
$0
($10,000)cfm
($15,000)
($10,000)
($5,000)
$0
$5,000
$10,000
$15,000
0 5 10 15 20
Net
Cas
h Fl
ow (E
nd o
f Yea
r)
Years
Simple Payback Graph
Issued February 1, 2011 147 New Hotels Energy Analysis - Green Engage/Solutions
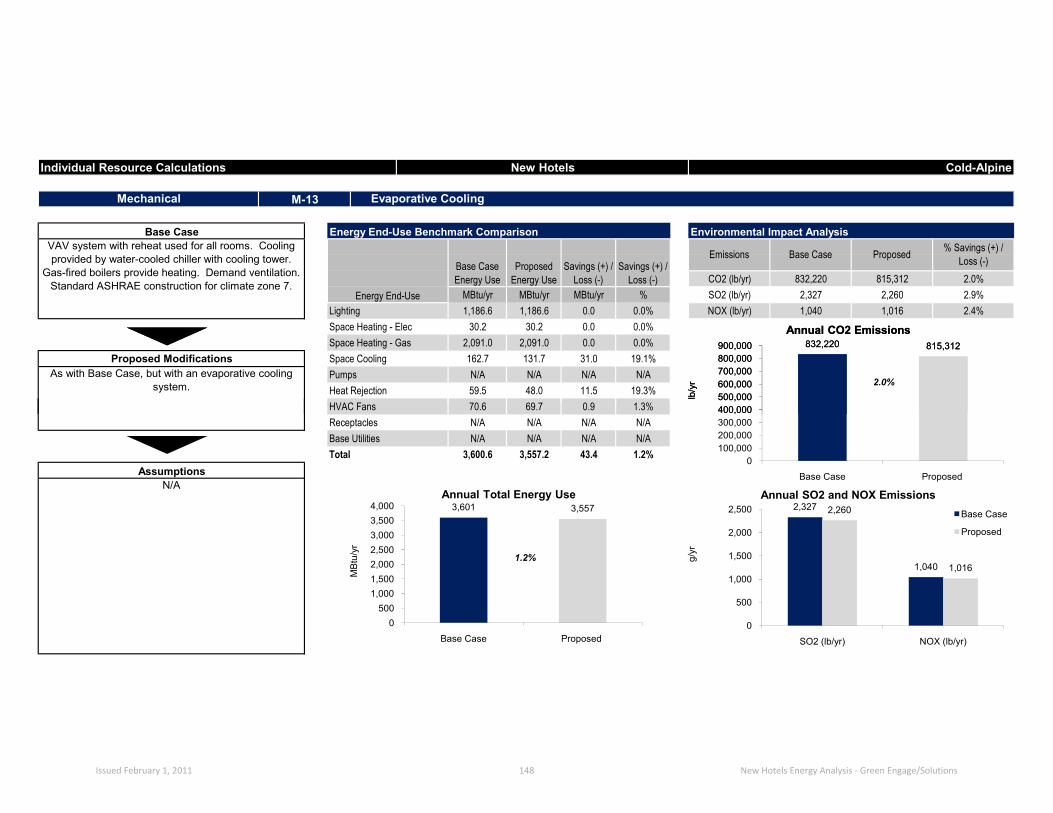
Mechanical
Base Case Energy End-Use Benchmark Comparison Environmental Impact AnalysisVAV system with reheat used for all rooms. Cooling provided by water-cooled chiller with cooling tower.
Gas-fired boilers provide heating. Demand ventilation. Standard ASHRAE construction for climate zone 7.
Savings (+) / Loss (-)
M-13
1,040 1,016 2.4%Lighting 1,186.6 1,186.6 0.0 0.0%MBtu/yr MBtu/yr MBtu/yr %
% Savings (+) / Loss (-)
Energy End-Use
Base Case Energy Use
Proposed Energy Use
Space Heating - Gas 2,091.0 2,091.0 0.0 0.0%
SO2 (lb/yr) 2,327 2,260 2.9%NOX (lb/yr)
CO2 (lb/yr) 832,220 815,312 2.0%
Space Cooling 162.7 131.7 31.0 19.1%
69 7 0 9 1 3%
N/A N/A N/A
Evaporative Cooling
2.0%59.5 48.0
Savings (+) / Loss (-)
11.5
Space Heating - Elec 30.2 30.2 0.0 0.0%
Pumps
Individual Resource Calculations New Hotels Cold-Alpine
N/AHeat Rejection
Emissions Base Case Proposed
Proposed ModificationsAs with Base Case, but with an evaporative cooling
system. 19.3%HVAC Fans 70 6
832,220 815,312
400,000500,000600,000700,000800,000900,000
lb/y
r
Annual CO2 Emissions
Total 3,600.6 3,557.2 43.4N/A N/A N/A N/A
N/ABase Utilities
1.2%
69.7 0.9 1.3%
1.2%
N/AAssumptions
N/A N/A N/AReceptaclesHVAC Fans 70.6
832,220 815,312
0100,000200,000300,000400,000500,000600,000700,000800,000900,000
Base Case Proposed
lb/y
r
Annual CO2 Emissions
2,327
1,040
2,260
1,016
0
500
1,000
1,500
2,000
2,500
SO2 (lb/yr) NOX (lb/yr)
g/yr
Annual SO2 and NOX EmissionsBase Case
Proposed
3,601 3,557
0500
1,0001,5002,0002,5003,0003,5004,000
Base Case Proposed
MBt
u/yr
Annual Total Energy Use
Issued February 1, 2011 148 New Hotels Energy Analysis - Green Engage/Solutions

Additional Capital CostHVAC Plant First Cost Reductions
Cooling Plant Savings ($450/ton)Heating Plant Savings ($7 55/MBh)
Financial Results Summary
ResourceAnnual Resource Savings
(+) / Loss (-) Unit CostAnnual Savings (+) /
Loss (-)Yr.
Costs (Marginal/Maint/
Replace)Electricity 12,719 kWh $0.0622 $791 Initial Annual Savings
Savings (+) / Loss (-)
Mechanical
Water & sewer 0 Gals N/A $0 0 ($32,500)
$819Natural gas 0 therms $1.1906 $0
Cash FlowInitial Marginal Cost $32,500
IRR
1 $0 $819 $819$0
3 $0 $877 $8772 $0 $847 $847
4 $0 $908 $908 First Year Yield On Marginal Cost 2.5%$939$0 $939$9720 MBh $0 6 $0 $972
($32,500)
Annual Resource Cost Summary Financial Table
Capital Costs Savings Summary
0 tons $0 5
N/A
($32,500) Simple Payback > 20 yrs
M-13 Evaporative Cooling
Individual Resource Calculations New Hotels Cold-Alpine
Heating Plant Savings ($7.55/MBh)Airside Distribution Savings ($3.5/cfm)
Total Additional Capital Cost:
Estimated Useful Life (yrs)Percent replacedReplacement Cost
Base YearValuation TypeProject Analysis PeriodDiscount Rate for Defined ValuationEnergy Escalation Rate (Nominal)
$1,006$972 NPV
20 11 $0 $1,155 $1,155Replacement Life and Cost Summary
08 $0 $1,041 $1,041
-$18,9360 MBh $0 6 $0 $972$0
$0 13 $0 $1,237 $1,23714 $0 $1,280 $1,280
2008 16 $0 $1,371 $1,371Financial Analysis
$1,419 $1,41920 18 $0 $1,469 $1,469
0% 12 $0 $1,195 $1,195
3.50% 20 $0 $1,574 $1,5746.00% 19 $0 $1,520 $1,520
Defined 17
$1,078
7 $0 $1,006
9 $0 $1,078
15 $0 $1,325 $1,325
10 $0 $1,116 $1,116
$0
($32,500)cfm
($35,000)
($30,000)
($25,000)
($20,000)
($15,000)
($10,000)
($5,000)
$0 0 5 10 15 20
Net
Cas
h Fl
ow (E
nd o
f Yea
r)
Years
Simple Payback Graph
Issued February 1, 2011 149 New Hotels Energy Analysis - Green Engage/Solutions

Mechanical
Base Case Energy End-Use Benchmark Comparison Environmental Impact AnalysisVAV system with reheat used for all rooms. Cooling provided by water-cooled chiller with cooling tower.
Gas-fired boilers provide heating. Demand ventilation. Standard ASHRAE construction for climate zone 7.
Savings (+) / Loss (-)
M-13
1,040 1,040 0.0%Lighting 1,186.6 1,186.6 0.0 0.0%MBtu/yr MBtu/yr MBtu/yr %
% Savings (+) / Loss (-)
Energy End-Use
Base Case Energy Use
Proposed Energy Use CO2 (lb/yr) 832,220 832,220 0.0%
Space Cooling 162.7 162.7 0.0 0.0%Pumps
Savings (+) / Loss (-)
Space Heating - Elec 30.2 30.2 0.0 0.0%Space Heating - Gas 2,091.0 2,091.0 0.0 0.0%
Emissions Base Case Proposed
SO2 (lb/yr) 2,327 2,327 0.0%NOX (lb/yr)
59.5 0.0
Thermal Storage
0.0%
Individual Resource Calculations New Hotels Cold-Alpine
Proposed ModificationsAs with Base Case, but including a thermal storage
unit.N/A
0.0%HVAC Fans 70 6 70 6 0 0 0 0%Heat Rejection
N/A N/A N/A59.5
832,220 832,220
400,000500,000600,000700,000800,000900,000
lb/y
r
Annual CO2 Emissions
Total 3,600.6 3,600.6 0.0N/AN/A
N/A
Base Utilities N/AReceptacles
0.0%
0.0%
N/A N/A
Assumptions
N/A N/A N/AHVAC Fans 70.6 70.6 0.0 0.0%
832,220 832,220
0100,000200,000300,000400,000500,000600,000700,000800,000900,000
Base Case Proposed
lb/y
r
Annual CO2 Emissions
2,327
1,040
2,327
1,040
0
500
1,000
1,500
2,000
2,500
SO2 (lb/yr) NOX (lb/yr)
g/yr
Annual SO2 and NOX EmissionsBase Case
Proposed
3,601 3,601
0500
1,0001,5002,0002,5003,0003,5004,000
Base Case Proposed
MBt
u/yr
Annual Total Energy Use
Issued February 1, 2011 150 New Hotels Energy Analysis - Green Engage/Solutions

Additional Capital CostHVAC Plant First Cost Reductions
Cooling Plant Savings ($450/ton)Heating Plant Savings ($7 55/MBh)
Financial Results Summary
Cash Flow
Mechanical
$0
Savings (+) / Loss (-)
Annual Savings (+) / Loss (-)
Yr.Costs
(Marginal/Maint/Replace)
4 $0 $3,158 $3,158 First Year Yield On Marginal Cost
0 $0 ($36,707) Simple Payback 11 yrs
0 MBh $0 6 $0
3 $0 $3,051 $3,0512 $0 $2,948 $2,948 IRR
7.8%
7.9%
$3 383 $3 38330
Electricity 0 kWh $0.0622 $2,752 Initial Annual Savings
Resource
tons $13,293 5 $0 $3,269 $3,269
($36,707)Water & sewer 0 Gals N/A $0
($50,000)
Annual Resource Cost Summary Financial Table
1 $0 $2,848 $2,848
Annual Resource Savings (+) / Loss (-) Unit Cost
Natural gas 0 therms $1.1906
Capital Costs Savings Summary
M-13 Thermal Storage
Initial Marginal Cost $36,707
$2,848
Individual Resource Calculations New Hotels Cold-Alpine
Heating Plant Savings ($7.55/MBh)Airside Distribution Savings ($3.5/cfm)
Total Additional Capital Cost:
Estimated Useful Life (yrs)Percent replacedReplacement Cost
Base YearValuation TypeProject Analysis PeriodDiscount Rate for Defined ValuationEnergy Escalation Rate (Nominal)
0 MBh $0 6 $0
20 11 $0 $4,018 $4,018
$3,383 $3,383 NPV
($36,707)$3,751 $3,751
8 $0 $3,624 $3,624$3,501
14 $0 $4,455 $4,455
2008 16 $0 $4,772 $4,772Financial Analysis
Defined 17 $0 $4,939 $4,93920 18 $0 $5,112 $5,112
3.50% 20 $0 $5,476 $5,4766.00%
$6,169
$4,158
7 $0
19 $0 $5,291 $5,291
15 $0 $4,611 $4,611
$0 13 $0 $4,3040% 12 $0 $4,158
10 $0 $3,882 $3,882
$4,304
Replacement Life and Cost Summary
cfm $00 $3,501
9 $0
($50,000)($40,000)($30,000)($20,000)($10,000)
$0 $10,000 $20,000 $30,000 $40,000 $50,000
0 5 10 15 20
Net
Cas
h Fl
ow (E
nd o
f Yea
r)
Years
Simple Payback Graph
Issued February 1, 2011 151 New Hotels Energy Analysis - Green Engage/Solutions

APPENDIX C: LEED Documentation

The IHG Green Engage/Solu ons program is LEEDPre-Cer ed. Many of the Prerequisites and CreditedAc ons in this program align with credits in LEED forExis ng Buildings (EB) 2009, meaning that a hotel thatachieves Green Engage/Solu ons Cer ca on hasalready cked o a number of LEED requirements and iswell on its way to achieving LEED cer ca on.
Running your hotel in a sustainable way is not enoughto achieve LEED cer ca on; you also have to proveit by maintaining policies, calcula ons, and otherdocumenta on.
To help with this process, there are a number of GreenEngage/Solu ons Level 1 and Level 2 PrerequisiteAc ons which require hotels to download, edit andadopt various sustainable policies, which are based onLEED credits and prerequisites. In many cases, thesepolicies come with calculators which are designed tohelp hotel managers track their progress and earnaddi onal credits.
The complete list of these policies and calculators isprovided to the right. These documents are available todownload in editable Word and Excel formats.
APPENDIX C: LEED Documentation
Document Green Engage/Solutions Action Group
Type ofAction Item LEED Credit
IHG Green Cleaning Policy O-04 Level 1 Prereq EQp3, EQc3.3& EQc3.4
Cleaning Products Purchasing Tool O-04 Level 1 Prereq EQc3.3Cleaning Equipment Purchases Tool O-04 Level 1 Prereq EQc3.4Cleaning Equipment Maintenance &Service Record O-04 Level 1 Prereq EQc3.4
IHG Energy BMPs Document E-01 Level 1 Prereq EAp1Sequence of Operations E-01 Level 1 Prereq EAp1Building Operating Plan E-01 Level 1 Prereq EAp1Systems Narrative E-01 Level 1 Prereq EAp1IHG Hotel Water Calculator W-02 Level 1 Prereq WEc1IHG Waste Audit Procedure G-01 Level 2 Prereq MRc6
IHG Solid Waste Management Policy G-02 Level 1 Prereq MRp1, MRc7,MRc8 & MRc9
Waste Tracking Matrix (OngoingConsumables) G-02 Level 1 Prereq MRc7
Waste Tracking Matrix (Durable Goods) G-02 Level 1 Prereq MRc8Waste Tracking Matrix (Additions andAlterations) G-02 Level 1 Prereq MRc9
IHG Sustainable Purchasing Policy P-01 Level 1 Prereq MRp1, MRc1& MRc2.1
Sustainable Purchasing Tracking Matrix(Ongoing Consumables) P-01 Level 1 Prereq MRc1
Sustainable Purchasing Tracking Matrix(Durable Goods) P-01 Level 1 Prereq MRc2.1
IHG Exterior and HardscapeManagement Plan S-01 Level 2 Prereq SSc2
IHG Integrated Pest Management,Erosion and Sedimentation andLandscape Plan
S-01 Level 2 Prereq SSc3
Issued February 1, 2011 1 LEED Documentation - Green Engage/Solutions

IHG ContactBroadwater ParkDenham, Buckinghamshire UB9 5HR
Laura Noctore: [email protected]
Green Engage/Solutions
Arup155 Avenue of the AmericasNew York, NY 10013
p: +1 212 229 2669f: +1 212 229 1056
www.arup.com
Karin Giefere: [email protected]
Issued on February 1, 2011