Embed Size (px)
Citation preview
Ignition Risk Analysis Cigarette Ignition of Upholstered Furniture K W A N - N A N Y E H University of Maryland
{Manuscript received November 1984, accepted February 1985)
A general analytical framework for ignition, which addresses the impact of fuels, ignition sources, and other human and mechanical factors, was developed with a "Fault Tree" technique. The developed framework was then used to analyze fire incidents involving cigarette ignition of upholstered furniture in the living room of single residen- tial homes (1 and 2 family dwellings} from 1975 to 1982.
The annual incident rate was calculated using the national estimates of the incident, based on the NFIRS data and the number of housing units. Analysis of previous test data from CPSC's full scale tests and the California Bureau of Home Furnishings' (BHF) mockup tests indicates that cigarette ignition of upholstered chairs is mainly dependent on the combination of materials used as the cover fabric and the stuffing material. Based on these test data, ignitability was estimated for eight types (combinations) of chairs. The average ignitability of chairs produced in a given year was then calculated from these ignitabilities and the distribution of the types of chair pro- duced in that year, estimated from the annual material consumption by the industry. Average ignitabilities of chairs by the year produced, were then used to estimate the average ignitability of chairs in use in a given year. A "Product Life Model" which assumes normal distribution and a mean life of 15 years, with a standard deviation of 7 years, was used to calculate the distribution of chair population in a given year, by the year produced.
Results of analysis showed that the annual incident rate, from 1975 to 1982, is closely correlated with the product of annual cigarette con- sumption rate and the average ignitability of the chairs in use, as
Reference: Kwan-nan Yeh, "Ignition Risk Analysis -- Cigarette Ignition of Upholstered Fur- niture," Fire Technology, Vol. 21, No. 2, May 1985, p. 105.
Key Words: Ignition, risk analysis, upholstered furniture, cigarette, ignitability, fire statistics, fault tree.
*This work was carried out at the Center for Fire Research, National Bureau of Standards, while on sabbatical leave from the University of Maryland, and was one of the papers presented at the NBS/CFR Annual Conference in October 1984.
105
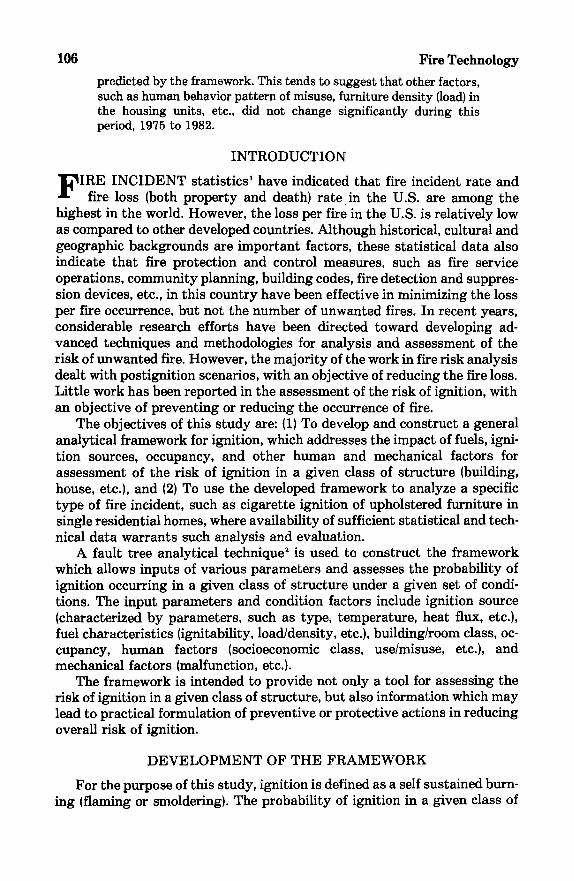
106 Fire Technology predicted by the framework. This tends to suggest that other factors, such as human behavior pattern of misuse, furniture density (loadl in the housing units, etc., did not change significantly during this period, 1975 to 1982.
INTRODUCTION
F IRE INCIDENT statistics ~ have indicated that fire incident rate and fire loss (both property and deathl rate in the U.S. are among the
highest in the world. However, the loss per fire in the U.S. is relatively low as compared to other developed countries. Although historical, cultural and geographic backgrounds are important factors, these statistical data also indicate that fire protection and control measures, such as fire service operations, community planning, building codes, fire detection and suppres- sion devices, etc., in this country have been effective in minimizing the loss per fire occurrence, but not the number of unwanted fires. In recent years, considerable research efforts have been directed toward developing ad- vanced techniques and methodologies for analysis and assessment of the risk of unwanted fire. However, the majority of the work in fire risk analysis dealt with postignition scenarios, with an objective of reducing the fire loss. Little work has been reported in the assessment of the risk of ignition, with an objective of preventing or reducing the occurrence of fire.
The objectives of this s tudy are: (1) To develop and construct a general analytical framework for ignition, which addresses the impact of fuels, igni- tion sources, occupancy, and other human and mechanical factors for assessment of the risk of ignition in a given class of structure (building, house, etc.), and {2) To use the developed framework to analyze a specific type of fire incident, such as cigarette ignition of upholstered furniture in single residential homes, where availability of sufficient statistical and tech- nical data warrants such analysis and evaluation.
A fault tree analytical technique 2 is used to construct the framework which allows inputs of various parameters and assesses the probability of ignition occurring in a given class of structure under a given set of condi- tions. The input parameters and condition factors include ignition source (characterized by parameters, such as type, temperature, heat flux, etc.), fuel characteristics (ignitability, load/density, etc.), building/room class, oc- cupancy, human factors (socioeconomic class, use/misuse, etc.), and mechanical factors (malfunction, etc.).
The framework is intended to provide not only a tool for assessing the risk of ignition in a given class of structure, but also information which may lead to practical formulation of preventive or protective actions in reducing overall risk of ignition.
DEVELOPMENT OF THE FRAMEWORK
For the purpose of this study, ignition is defined as a self sustained burn- ing (flaming or smoldering). The probability of ignition in a given class of
I g n i t i o n Analysis 107
structure, Pr, is the overall probability of ignition of any fuel item by any ig- nition source in that given class of structure, with a given set of condition factors. P~ can be taken as the sum of the probability of ignition (of any item by any ignition source) in each of m rooms, (P~)i, of that given structure;
m
PT = [: [PR], (1) i = 1
And PR is, in turn, taken as the sum of the probability of ignition for each of the n items (by any ignition source), (P,b, in a given room i:
n
[P~I, = z [P,L (2) j=l
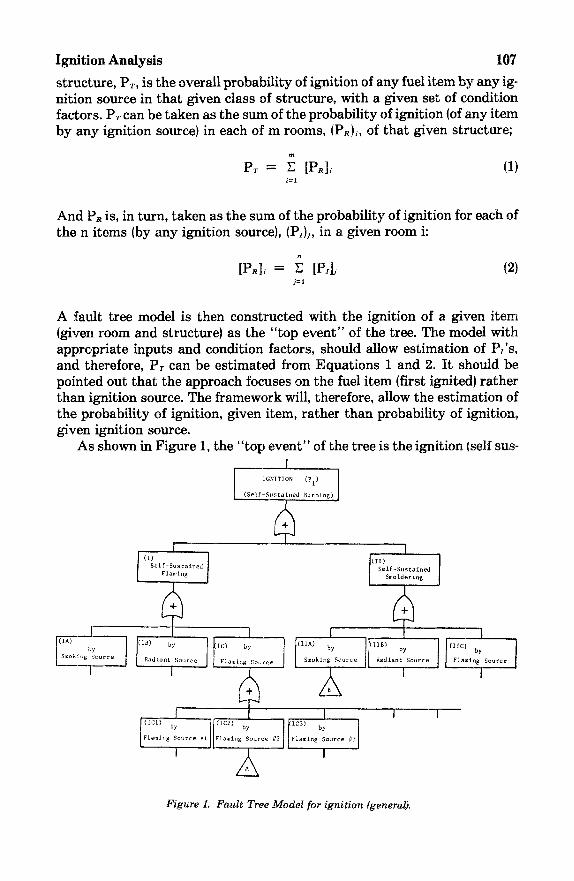
A fault tree model is then constructed with the ignition of a given item (given room and structure) as the "top event" of the tree. The model with appropriate inputs and condition factors, should allow estimation of P,'s, and therefore, PT can be estimated from Equations 1 and 2. It should be pointed out that the approach focuses on the fuel item (first ignited) rather than ignition source. The framework will, therefore, allow the estimation of the probability of ignition, given item, rather than probability of ignition, given ignition source.
As shown in Figure 1, the "top event" of the tree is the ignition tself sus-
I (IA) by
Smok l a g S o u r c e
T
I IGNITION (pl) I
(Self-Sustained Burning) ]
1 Flaming Saurce # Flaming Source #2 |Flaming Source /13
' '
!
1 . 1 , 1
s~o~,~s . . . . . L ~°~°"~ .. . . . I , /~ ... . ~ . . . . . . /
I I
Figure 1. Fault Tree Model for ignition (general}.
108 Fire Technology
tained burning) of a given item {P,) by all ignition sources. Since a self sus- tained burning can be either a self sustained flaming or a self sustained smoldering, the two events (self sustained flaming and smoldering) are, thus, identified as the subevents (with an OR gate). Although a self sus- tained flaming may develop into a self sustained smoldering or vice versa, the two events are considered to be mutually exclusive under this framework. Occurrence of a self sustained flaming or smoldering, in effect, achieves the top event {ignition). All subsequent developments are postigni- tion events and, therefore, are not considered in the framework. Events I and II (self sustained flaming and smoldering of a given item) can be achieved by different types of ignition sources. Therefore, subevents (with an OR gate) under either Event I or II can then be ignition by different types of ignition sources. Three general types of ignition sources are iden- tified as flaming, radiant, and smoking ignition sources. The subevents {with an OR gate) under each of these events will then be the ignition of the given item by a specific heat source of a given general type, for example, gas burner (flaming), space heater (radiant), cigarette (smoking), etc. The number of these specific heat sources under a given general type will be de- termined by condition factors, such as building class, room type, occu- pancy, etc. Each of the events on the third level of the tree would yield the probability of ignition {flaming or smoldering) of a given item by a given heat source. For example, Event (IC2) would allow calculation of the proba- bility of achieving "self sustained flaming" of the given item by flaming heat source No. 2 (i.e., gas burner) in a given room and structure, whereas,
, A Flaming Source
' i Lack of Lack of Separation
Separa£1on Separation
*d ~ I t ~ - S o u r c e Separation dew Cr i t i c a l SepaTatton
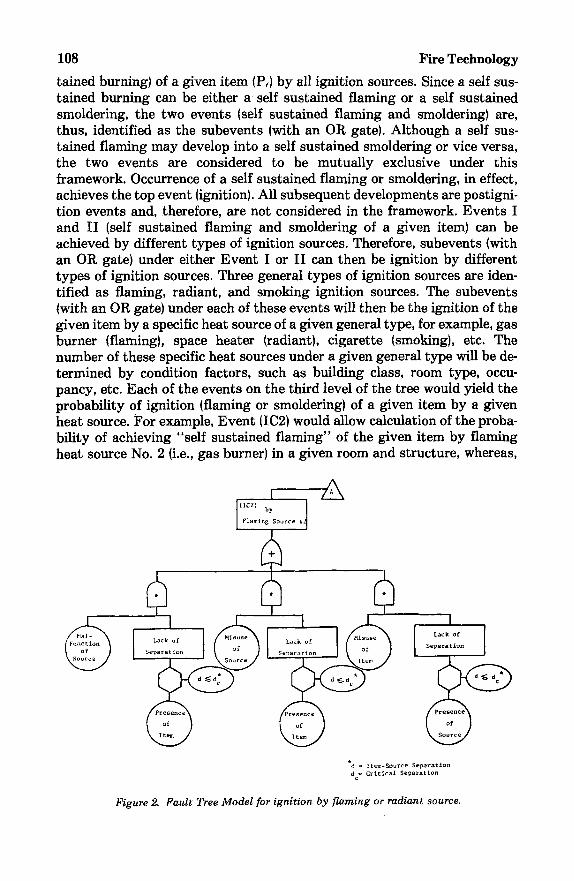
Figure 2. Fault Tree Model for ignition by flaming or radiant source.
Ignition Analys is 109
Event (IIB3) may yield the probability of achieving "self sustained smoldering" of the same item by radiant heat source No. 3 (i.e., space heater} in the same room and structure.
The occurrence of each of these events (ignition of the given item by a given heat source} may be achieved by one of the three subevents; malfunc- tion of the heat source, misuse of the heat source or misuse of the fuel item. For any given flaming or radiant source, the framework is further developed, as shown in Figure 2. The occurrence of each of these three subevents due to malfunction, misuse of source or misuse of item, depends on the occurrence of malfunction (or misuse} and the presence of item (or source) within a critical distance, de, from the malfunctioned (or misused) source (or item). The critical distance, de, for given item and source, is depen- dent on the characteristics of the source {heat flux, temperature, etc.) and those of the item (ignitability, etc.}.
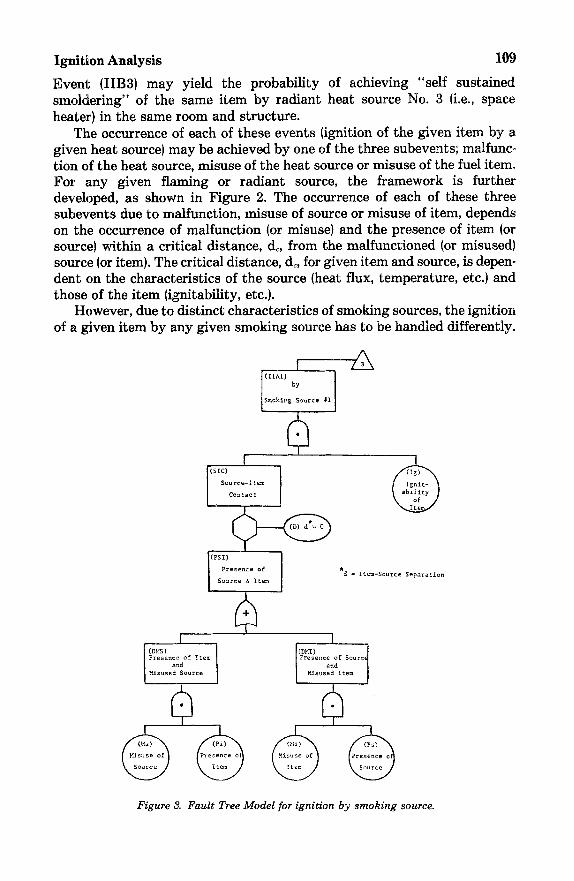
However, due to distinct characteristics of smoking sources, the ignition of a given item by any given smoking source has to be handled differently.
I [ (DgS) I Presence of Item
and Misused Source
t
SmoklnBbY$our ce #:
(sic)
F' I ~d = Ite~m-Source SepaFat~on
I
Misused Item
Figure 3. Fault Tree Model for ignition by smoking source.
110 Fire Technology
0
0
I: t
e , I
I:1
0
A
~ o o ~ + 1 ~
g g g g 4 ~ g d ~
~ ~ 4 9 4 M
H
II
g 0
~ , ~ o ~ o ~ o ~ ~ ~ ~ I~11
~ 0 ~ 0 0 ~ 0"~1
~ ~-~ oO ~ oO ~ ~ ~:~ o ~ 1
o
~ o o o ~ , ~ , ~ ~ ~ ~ +1o~ II
~ M M N M M ~ M M
~ , ~
° ~
r~
e.i r~
A
A 0
0 ~ ~ ~
o ~ - / ~ ~ ~ ~ ~.~ o ~ • ~ ~'~ " , ~ . . ~ ~ e ~ . ~ ~ ~ 4::~,-~,..~ ~ 0 • 0 ~ ,.~
~ 0 ~ 0 ~ 1 ~ ~ 0 ~
0
c~ It
c~ II
c~ II
F.=I c~ II
II 0 ,<
Ignition Analysis 111
Since there is no equipment involved in this type of ignition, malfunction of the source is essentially nonexistent. Furthermore, the mechanism of heat transfer from the source to the i tem is predominately via conduction which requires zero fuel source separation (d -- 0}. As shown in Figure 3, the igni- tion of a given item by any given smoking source can be achieved by misuse of the source or the item. For either case, the critical fuel source separation has to be zero. Since the ignition source (mainly cigarette} is relatively well defined, the occurrence of ignition depends mainly on the characteristics of the fuel i tem (ignitability). Therefore, ignition of a given item by any given smoking source can occur only by presence of i tem and source in direct con- tact (d -- 0), and presence of fuel characteristics favorable for ignition under the given conditions. Furthermore, the presence of i tem and source in direct contact can occur due to misuse of either the source or the item.
ANALYSIS OF FIRE INCIDENTS WITH THE FRAMEWORK
SELECTION OF A CANDIDATE SYSTEM
The framework developed is intended to be a general analytical framework for any combination of ignition source and fuel item, given con- dition factors (structure class, room type, etc.). However, due to the scope of the initial phase of this study, it is important to select a specific i tem source combination which is a significant ignition risk, based on historical fire statistics, for analysis with the framework. The structure class selected was the single residential house (1 and 2 family dwellings}, due to the high rate of fire occurrences in this s tructure class.
Identification of the candidate systems is based on the fire incident data base of the National Fire Incident Reporting System (NFIRS). Major scenarios of fire incidents occurred within the structure class (1 and 2 family dwellings} are identified by the combination of: (1) Area (room} of fire origin, (2) Form of material {fuel item} ignited, (3) Form of heat of ignition {ignition source), {4) Equipment involved in ignition and, (5) Ignition factor {malfunc- tion, misuse, etc.}, according to the NFIRS coding.
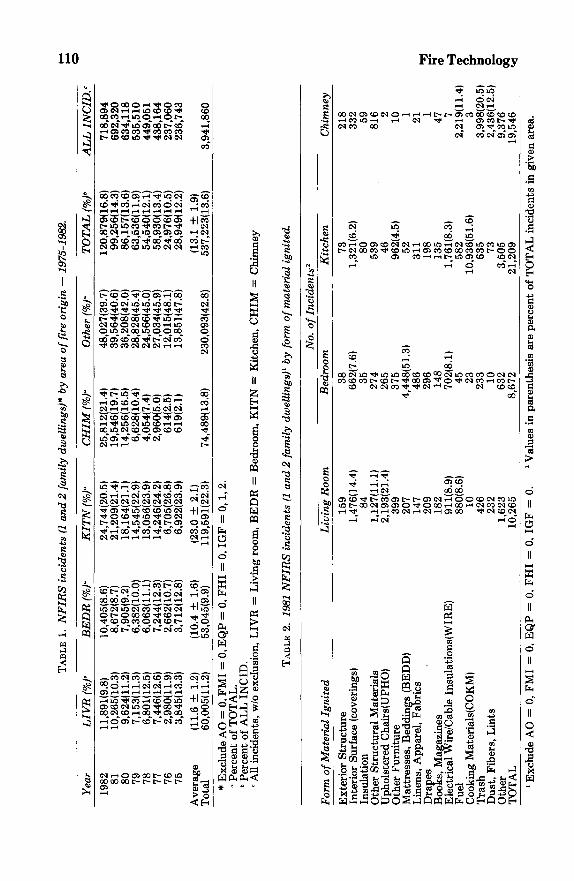
The major areas of fire origin are identified as the living room, bedroom, kitchen and chimney. As shown in Table 1, these four areas made up more than 55 percent of all fire incidents in 1 and 2 family dwellings, from 1975 to 1982. Fire incidents of incendiary and suspicious nature are excluded and will not be considered in the framework, since probability of ignition of a de- liberately set fire is expected to be one. Although the total number of fire in- cidents recorded varied from one year to another, due mainly to different number of states reporting incidents (15 states in 1975 to 43 states in 1982}, proportions of fires occurring in living room, bedroom and kitchen are es- sentially constant during the years from 1975 to 1982. They are 11.6 per- cent, 10.3 percent and 23.4 percent, respectively, for living room, bedroom and kitchen. There has been a significant increase in chimney fires, every year from 1976. The largest increase was observed between 1979 and 1980.
112 Fire Technology
This is probably due to the increasing number of new residential houses with fireplace, and increasing use of wood burning stoves in residential houses, in recent years. Due to the size of the data base, only the 1981 data were used for further identification of the major scenarios in these areas.
The major first ignited items (form of material ignited) are then iden- tified in each of these major areas. As shown in Table 2, the most frequent involved items in each of these areas are; upholstered chairs (21.4 percent) in living room, mattresses and beddings (51.3 percent) in bedroom, cooking materials (51.6 percent) in kitchen, and trash (20.5 percent) in chimney fires. Electrical wire/cable insulations are the second most frequent first ignited item in bedroom and kitchen incidents, and third in living room incidents. Although the number of incidents due to ignition of this item is only 8 to 9 percent in each of these areas, this type of incident occurs in every area of the structure. The total number of incidents involving this item is signifi- cant from the point of view of ignitions occurred in I and 2 family dwellings.
Of the three major items identified above, living room upholstered chair was selected as the item for analysis with the developed framework. The selection was based on the availability of sufficient test data and technical information on this particular item source combination, due to significant research efforts on upholstered furniture flammability by government agen- cies (CPSC, NBS, etc.) and furniture industry (UFAC) in recent years.
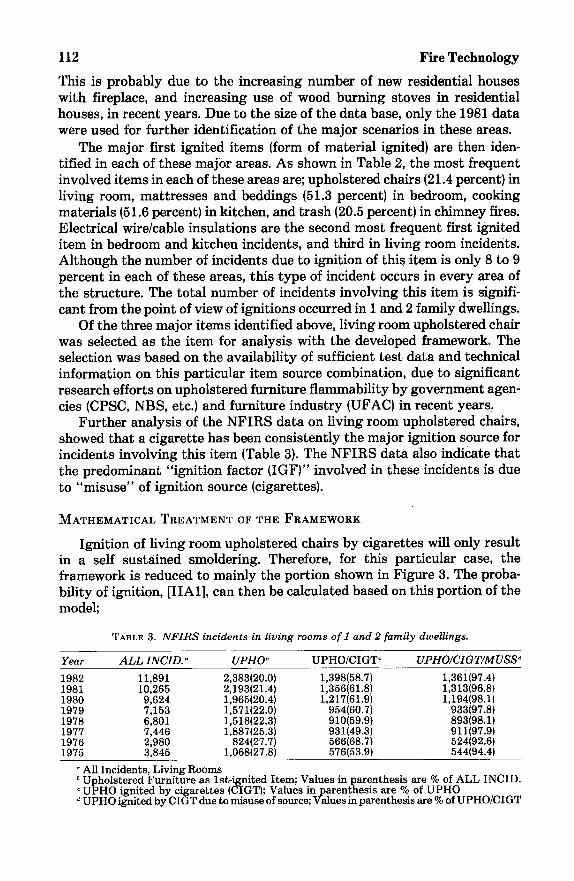
Further analysis of the NFIRS data on living room upholstered chairs, showed that a cigarette has been consistently the major ignition source for incidents involving this item (Table 3). The NFIRS data also indicate that the predominant "ignition factor (IGF)" involved in these incidents is due to "misuse" of ignition source (cigarettes).
MATHEMATICAL TREATMENT OF THE FRAMEWORK
Ignition of living room upholstered chairs by cigarettes will only result in a self sustained smoldering. Therefore, for this particular case, the framework is reduced to mainly the portion shown in Figure 3. The proba- bility of ignition, [IIA1], can then be calculated based on this portion of the model;
TABLE 3. N F I R S incidents in living rooms o f 1 and 2 family dwellings.
Year A L L INCID. ° U P H O b UPHO/CIGT ° U P H O / C I G T / M U S S ~
1982 11,891 2,383(20.0} 1,398(58.7) 1,361(97.4) 1981 10,265 2,193(21.4} 1,356(61.8} 1,313(96.8} 1980 9,624 1,965(20.4} 1,217(61.9) 1,194(98.1) 1979 7,153 1,571(22.0} 954(60.7) 933(97.8) 1978 6,801 1,518(22.3) 910(59.9} 893(98.1) 1977 7,446 1,887(25.3} 931(49.3) 911(97.9) 1976 2,980 824(27.7) 566(68.7) 524(92.6) 1975 3,845 1,068(27.8) 576(53.9) 544(94.4}
° All Incidents, Living Rooms b Uphols tered Furni ture as l s t - igni ted Item; Values in parenthesis are % of ALL INCID. ° U~HO ignited by cigaret tes (CIGT); Values in parenthes is are % of UPHO d UPHO ignited by CIGT due to misuse of source; Values in parenthesis are % of UPHO/CIGT
Ignition Analysis 113
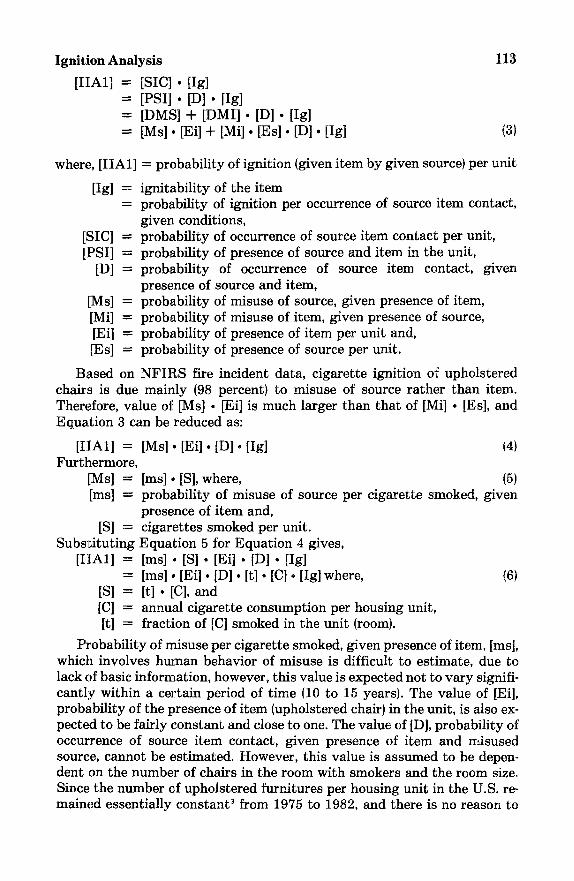
[IIA1] = [SIC] . [Ig] = [PSI] . [D]. [Ig] = [DMS] + [DMII • [DI • [Ig] = [Ms]. [El] + [Mi]. [Es] . [D]. [Ig] {3)
where, [IIA1]
Jig] =
[SICI = [PSII =
[D] = probabili ty presence of
[Ms] = probabili ty [Mi] = probabili ty [Ei] = probabili ty [Es] = probabili ty
Based on N F I R S fire
= probabili ty of ignition (given item by given source) per unit
ignitability of the item probability of ignition per occurrence of source item contact, given conditions, probabili ty of occurrence of source item contact per unit, probabili ty of presence of source and item in the unit,
of occurrence of source item contact, given source and item, of misuse of source, given presence of item, of misuse of item, given presence of source, of presence of item per unit and, of presence of source per unit.
incident data, cigarette ignition of upholstered chairs is due mainly (98 percent) to misuse of source rather than item. Therefore, value of [Ms] ° [El] is much larger than that of [Mi] • [Es], and Equat ion 3 can be reduced as:
[Ms]° [Ei]° [D]o [Ig] {4)
[msl , [S], where, (5) probabili ty of misuse of source per cigarette smoked, given presence of item and,
[S] = cigarettes smoked per unit. Subst i tut ing Equat ion 5 for Equat ion 4 gives,
[IIA1] = [ms] • [S]- [El] • [D] • Jig] = [ms], [Ei]° [D]o [t]. [C]. [Ig] where, {6)
[S] = It] ° [C], and [C] = annual cigarette consumption per housing unit, It] = fraction of [C] smoked in the unit (room).
Probabil i ty of misuse per cigarette smoked, given presence of item, [ms], which involves human behavior of misuse is difficult to estimate, due to lack of basic information, however, this value is expected not to vary signifi- cantly within a certain period of time (10 to 15 years). The value of [Ei], probabili ty of the presence of item {upholstered chair) in the unit, is also ex- pected to be fairly constant and close to one. The value of [D], probabili ty of occurrence of source item contact, given presence of item and misused source, cannot be estimated. However, this value is assumed to be depen- dent on the number of chairs in the room with smokers and the room size. Since the number of upholstered furnitures per housing unit in the U.S. re- mained essentially constant 3 from 1975 to 1982, and there is no reason to
[IIA1] = Furthermore,
[Ms] =
[msl =
114
<
I I ~ I I I ~ LO v LO ¢~
c~
~ . .
0
E
~0
0
E
.{ E
0
Fire Technology
O ~ 0 0
~0 L O ~ A O0 ODO0 0,1
~ 1 ~ ~ 1 ~ ¢,0 ~ C O c o
4~
z
0
b
0 0 ~ ~.~
Igntion Analysis 115
believe that housing units with smokers tend to have more upholstered fur- niture, it is assumed that the value of [D] is constant, on a national averaged base, during this period of time. The value of [t], fraction of annual cigarette consumption per housing unit smoked in the room, is also expected to be constant on an average annual base. Therefore, these four parameters can be grouped as a constant, [Y];
[V] = [ms]. [Ei]. [D]. [t] [7]
and Equation 6 can be shown as:
[IIA1] = IV]. [C]. [Ig]. [8]
From Equation 8, expected probability of ignition, [IIA1], can be calculated, if values of [Y], [C] and [Ig] are known. The calculated value of [IIA1] can then be compared to actual incident data from NFIRS. Since value of [Y] cannot be estimated in any reliable way, due to lack of sufficient information and data base on misuse behavior and other factors involved, value of [IIA1] cannot be calculated directly. However, if values of [Y] can be assumed to be constant within the time of interest, validity of the framework can still be verified by confirming the relative dependence of ig- nition probability, [IIA1], on the product of [C] and [Ig], within that period of time.
ESTIMATION OF FURNITURE IONITABILITY
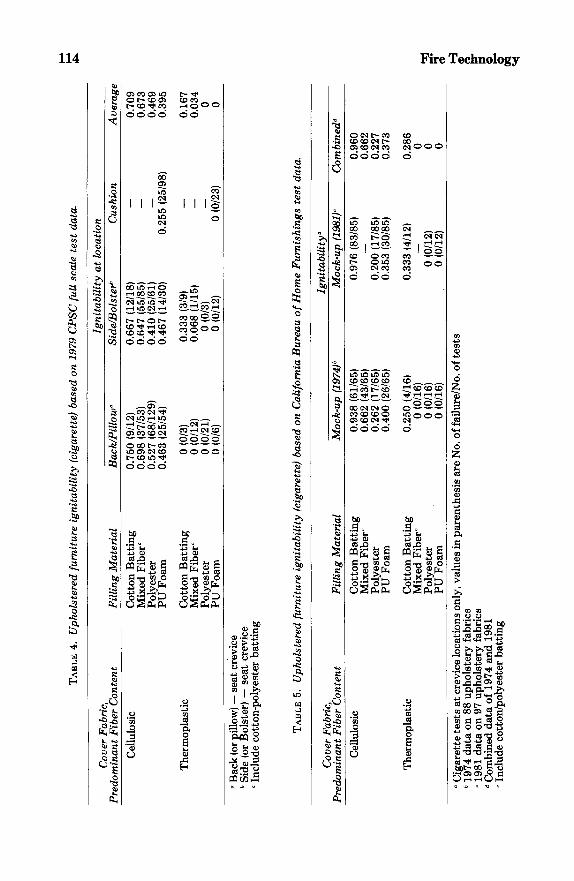
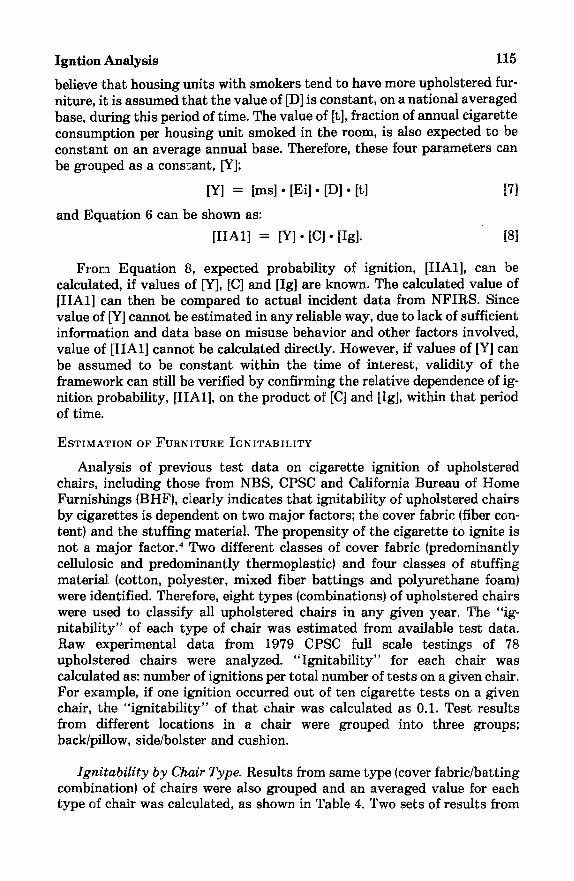
Analysis of previous test data on cigarette ignition of upholstered chairs, including those from NBS, CPSC and California Bureau of Home Furnishings {BHF}, clearly indicates that ignitability of upholstered chairs by cigarettes is dependent on two major factors; the cover fabric {fiber con- tent} and the stuffing material. The propensity of the cigarette to ignite is not a major factor2 Two different classes of cover fabric {predominantly cellulosic and predominantly thermoplastic} and four classes of stuffing material {cotton, polyester, mixed fiber battings and polyurethane foam} were identified. Therefore, eight types {combinations} of upholstered chairs were used to classify all upholstered chairs in any given year. The "ig- nitability" of each type of chair was estimated from available test data. Raw experimental data from 1979 CPSC full scale testings of 78 upholstered chairs were analyzed. "Ignitabili ty" for each chair was calculated as: number of ignitions per total number of tests on a given chair. For example, if one ignition occurred out of ten cigarette tests on a given chair, the "ignitability" of that chair was calculated as 0.1. Test results from different locations in a chair were grouped into three groups; back/pillow, side/bolster and cushion.
Ignitability by Chair Type. Results from same type {cover fabric/batting combination} of chairs were also grouped and an averaged value for each type of chair was calculated, as shown in Table 4. Two sets of results from
116 Fire Technology
laboratory mockup tests reported by the BHF 5~6 were analyzed in the same manner as shown in Table 5. Ignitability calculated from the CPSC and BHF data show significant differences. BHF tests were performed only at the crevice locations of the chairs, which may explain the much higher ig- nitability for the cellulosic/cotton batting combination.
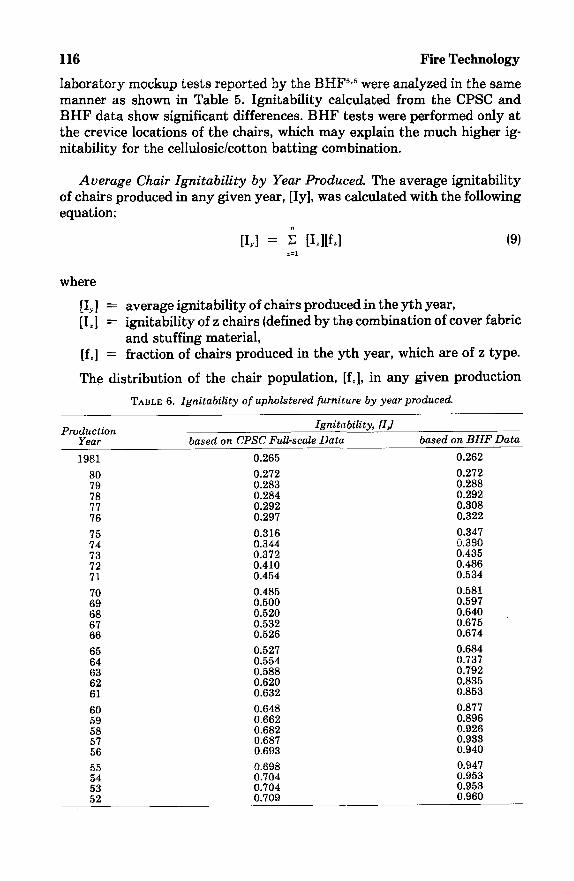
Average Chair Ignitability by Year Produced. The average ignitability of chairs produced in any given year, [Iy], was calculated with the following equation;
n
[Iy] = ~ [Izl[fzl (9) z = l
where
[Iy] = average ignitability of chairs produced in the y th year, [L] = ignitability of z chairs (defined by the combination of cover fabric
and stuffing material, [f~] = fraction of chairs produced in the y th year, which are of z type.
The distribution of the chair population, [fz], in any given production
TABLE 6. Ignitability of upholstered furniture by year produced.
Production Ignitability, [IJ Year based on CPSC Full-scale Data based on BHF Data
1981 0.265 0.262
80 0.272 0.272 79 0.283 0.288 78 0.284 0.292 77 0.292 0.308 76 0.297 0.322
75 0.316 0.347 74 0.344 0.390 73 0.372 0.435 72 0.410 0.486 71 0.454 0.534
70 0.485 0.581 69 0.500 0.597 68 0.520 0.640 67 0.532 0.675 66 0.526 0.674
65 0.527 0.684 64 0.554 0.737 63 0.588 0.792 62 0.620 0.835 61 0.632 0.853
60 0.648 0.877 59 0.662 0.896 58 0.682 0.926 57 0.687 0.933 56 0.693 0.940
55 0.698 0.947 54 0.704 0.953 53 0.704 0.953 52 0.709 0.960
Ignition Analysis 117
year, based on the types of chair, was est imated using the industry 's annual material consumption data obtained from both the Census and upholstered furniture industry sourcesY 's The distribution factor, [L] for each type of chair in each production year was calculated as the random combination of cover fabrics and stuffing materials consumed2 The average ignitability by year produced, [I~] for each production year from 1952 to 1981 was then calculated with Equation 9, using both the CPSC and the BHF data, as shown in Table 6.
Average Chair Ignitability by Year in Use. The average ignitability of chairs in use in a given year i, [I~], was calculated using the equation below:
n
[I~]i = E [I,][f~]i riO) y= l
where
[I~], = average ignitability of chairs existing in the ith year, [fy] = fraction of chairs existing in the ith years, which are produced in
the y th year.
The distribution factor [fy], was estimated, using a CPSC "Product Life Model, ''9 with assumptions of 15 years as the mean life of the chairs, a stan- dard deviation of 7 years, and a normal distribution in discarding of chairs. Annual production 7'8 (shipment) data from the Census of Manufacturers were used. The distribution factor, [f~], est imated with the "Product Life Model" for each given year, was used for calculations of average chair ig- nitabflity in use in each given year, 3 [Is], using Equation 10.
ANNUAL CIGARETTE CONSUMPTION RATE
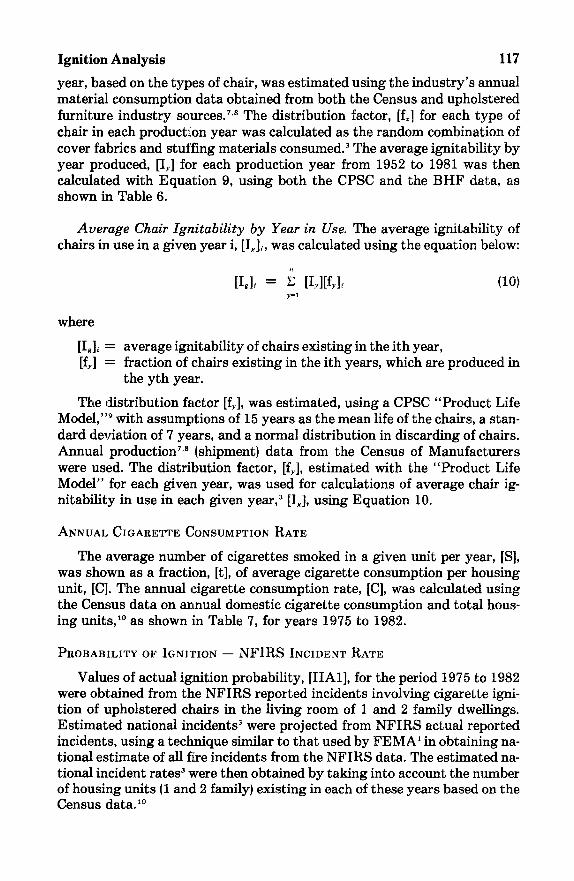
The average number of cigarettes smoked in a given unit per year, [S], was shown as a fraction, [t], of average cigarette consumption per housing unit, [C]. The annual cigarette consumption rate, [C], was calculated using the Census data on annual domestic cigarette consumption and total hous- ing units, 1° as shown in Table 7, for years 1975 to 1982.
PROBABILITY OF IGNITION -- N F I R S INCIDENT RATE
Values of actual ignition probability, [IIA1], for the period 1975 to 1982 were obtained from the NFIRS reported incidents involving cigarette igni- tion of upholstered chairs in the living room of 1 and 2 family dwellings. Es t imated national incidents 3 were projected from NFIRS actual reported incidents, using a technique similar to that used by FEMA' in obtaining na- tional est imate of all fire incidents from the NFIRS data. The est imated na- tional incident rates 3 were then obtained by taking into account the number of housing units (1 and 2 family) existing in each of these years based on the Census data. so
118
ff
~ g
N
e~
0
~t
°~
Fire Technology
O 0
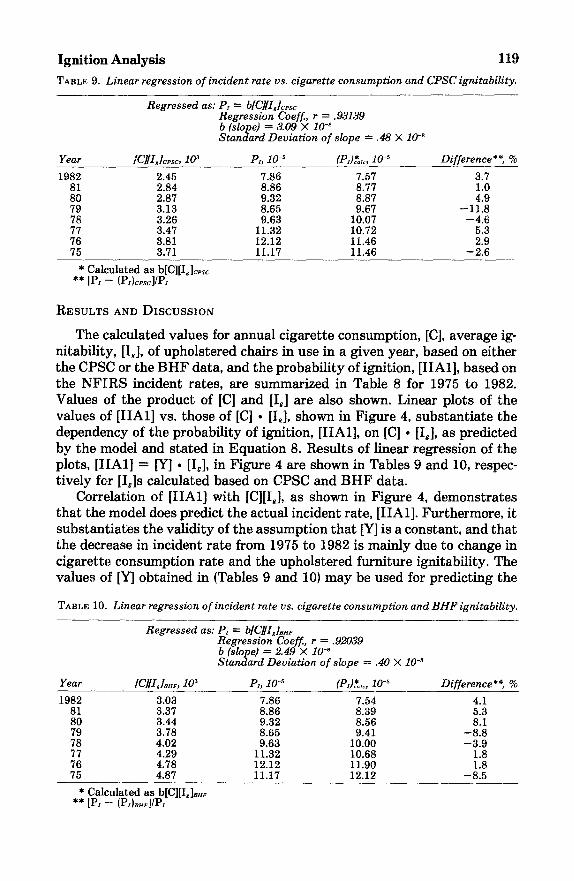
Ignition Analysis 119 TABLE 9. Linear regress ion o f inc iden t rate vs. c igare t te c o n s u m p t i o n and C P S C igni tabi l i ty .
Year
R e g r e s s e d as: P~ = blC][I,]c~c R e g r e s s i o n Coef f , r = .93139 b (slope) = 3.09 × 10 -~ S t a n d a r d D e v i a t i o n o f s lope = .48 × 10 -8
I C l l L l c , , c , l o 3 p , , 1 0 -5 (Pl)*o,~, 1 0 -5 Difference**, %
1982 2.45 7.86 7.57 3.7 81 2.84 8.86 8.77 1.0 80 2.87 9.32 8.87 4.9 79 3.13 8.65 9.67 - 1 1 . 8 78 3.26 9.63 10.07 - 4 . 6 77 3.47 11.32 10.72 5.3 76 3.81 12.12 11.46 2.9 75 3.71 11.17 11.46 - 2 . 6
* Calculated as b[C][I~] . . . . ** [P, - (P,)c~sc]/P,
RESULTS AND DISCUSSION
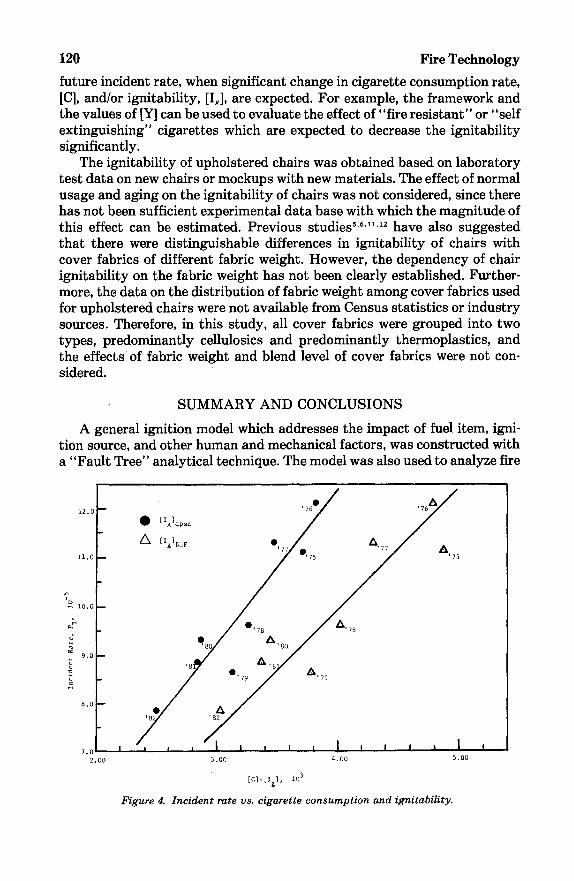
The calculated values for annual cigarette consumption, [C], average ig- nitability, [I,], of upholstered chairs in use in a given year, based on either the CPSC or the BHF data, and the probability of ignition, [IIA1], based on the NFIRS incident rates, are summarized in Table 8 for 1975 to 1982. Values of the product of [C] and [Is] are also shown. Linear plots of the values of [IIA1] vs. those of [C] • [Is], shown in Figure 4, substantiate the dependency of the probability of ignition, [IIA1], on [C] • [Is], as predicted by the model and stated in Equation 8. Results of linear regression of the plots, [IIA1] = [Y] • [Is], in Figure 4 are shown in Tables 9 and 10, respec- tively for [I~]s calculated based on CPSC and BHF data.
Correlation of [IIA1] with [C][I,], as shown in Figure 4, demonstrates that the model does predict the actual incident rate, [IIA1]. Furthermore, it substantiates the validity of the assumption that [Y] is a constant, and that the decrease in incident rate from 1975 to 1982 is mainly due to change in cigarette consumption rate and the upholstered furniture ignitability. The values of [Y] obtained in {Tables 9 and 10) may be used for predicting the
TABLE 10. Linear regress ion o f i nc iden t rate vs. c igare t te c o n s u m p t i o n and B H F ignitabil i ty .
Year
R e g r e s s e d as: PI = bIC][I,]BH~ R e g r e s s i o n Coeff., r = .92039 b (slope) = 2.49 × 10 -8 S t a n d a r d D e v i a t i o n o f s lope = .40 X 10 -s
IC] [ Id, . , , : , lO ~ P,, l O -~ (P,)*o,~, lO- , Difference**, %
1982 3.03 7.86 7.54 4.1 81 3.37 8.86 8.39 5.3 80 3.44 9.32 8.56 8.1 79 3.78 8.65 9.41 - 8 . 8 78 4.02 9.63 10.00 - 3 . 9 77 4.29 11.32 10.68 1.8 76 4.78 12.12 11.90 1.8 75 4.87 11.17 12.12 - 8 . 5
* Calculated as b[C][I~]B,~ ** [P, -- (P,)o~r]/P,
120 Fire Technology
future incident rate, when significant change in cigarette consumption rate, [C], and/or ignitability, [Is], are expected. For example, the framework and the values of [Y] can be used to evaluate the effect of "fire resistant" or "self extinguishing" cigarettes which are expected to decrease the ignitability significantly.
The ignitability of upholstered chairs was obtained based on laboratory test data on new chairs or mockups with new materials. The effect of normal usage and aging on the ignitability of chairs was not considered, since there has not been sufficient experimental data base with which the magnitude of this effect can be estimated. Previous studies 5'~''1'12 have also suggested that there were distinguishable differences in ignitability of chairs with cover fabrics of different fabric weight. However, the dependency of chair ignitability on the fabric weight has not been clearly established. Further- more, the data on the distribution of fabric weight among cover fabrics used for upholstered chairs were not available from Census statistics or industry sources. Therefore, in this study, all cover fabrics were grouped into two types, predominantly cellulosics and predominantly thermoplastics, and the effects of fabric weight and blend level of cover fabrics were not con- sidered.
SUMMARY AND CONCLUSIONS
A general ignition model which addresses the impact of fuel item, igni- tion source, and other human and mechanical factors, was constructed with a "Fault Tree" analytical technique. The model was also used to analyze fire
12.0 --
ii.0
? o i0.0
h 4
9 .o
8.(
7 .0 2.00
7J . /
e a ° ZX ao y
:7 y I I • I ! " " I , , I i i , I I I i ,i i
3.00 4.00 5.00
[c ] -LIg] , 1o 3
Figure 4. Incident rate vs. cigarette consumption and ignitability.
Ignition Analysis 121
incidents involving cigarette ignition of upholstered chairs in single residen- tial homes, from 1975 to 1982.
The results of analysis indicate that the model can predict actual inci- dent rates when sufficient input data are available. The results also showed that the decrease in incident rate from 1975 to 1982 is due mainly to change in cigarette consumption and furniture ignitability. And change in materials used for construction of chairs is chiefly responsible for the change in furniture ignitabflity. The results further indicate that human behavior factor and other factors, such as housing vacancy rate, furniture load in residential homes, etc., did not vary significantly during this period.
ACKNOWLEDGEMENTS: The author wishes to express his appreciation to Alan Gomberg of Firepro, Inc., who was instrumental in the initiation of this project and offered valuable sug- gestions~ to John Krasny and Wayne Stiefel of the Center for Fire Research, National Bureau of Standards, for many critical discussions and suggestions. The author is also indebted to Charles Smith of the U.So Consumer Product Safety Commission, for performing the "Prod- uct Life Model" calculations.
REFERENCES
1 Fire in the United States, ls t -4th Editions, Federal Emergency Management Agency/ U.S. Fire Administration°
2 Vesely, W. E., F. F. Goldberg, N. H. Roberts and D. F. Haasl, Fault Tree Handbook, U.S. Nuclear Regulatory Agency Report, NUREG-0492{1981}.
3 Yeh, K, NBS Technical Note No. 0O, National Bureau of Standards, 1984. 4 Krasny, J. F., P. J. Allen, A. Maldonado and N. Juarez, National Bureau of Standards
Internal Report, NBSIR 81-2362, t1981}. 5 Damant, G. H. and M. A. Young, Journal of Consumer Product Flammability., 4,
60(1977}. 6 Williams, S. S. and G. H. Damant, Journal of Consumer Product Flammability, 8,
89(1981). 7 Census of Manufacturers, 1944-81. 8 Upholstered Furniture Action Council IUFAC),private communication. 9 Smith, C., Bureau of Economic Analysis, U.S. Consumer Product Safety Commission,
private communication. 1o U.S. Statistical Abstracts, 1975-82. ,1 Damant, G. H., S. S. Williams and J. F. Krasny, Journal of Consumer Product Flam-
mability, 9, 31 119821. 12 Damant, G. H., S. S. Williams and J. A. McCormack, Journal of Fire Science, 1, 309
(1983).