Embed Size (px)
Citation preview
Maize Nutrient Accumulation and Partitioning in Response Planting
Density and Nitrogen Rate
Ignacio A. Ciampitti, Cropping Systems SpecialistK-State Research & Extension
[email protected], 785-410-9354@KSUCROPS (TWITTER)
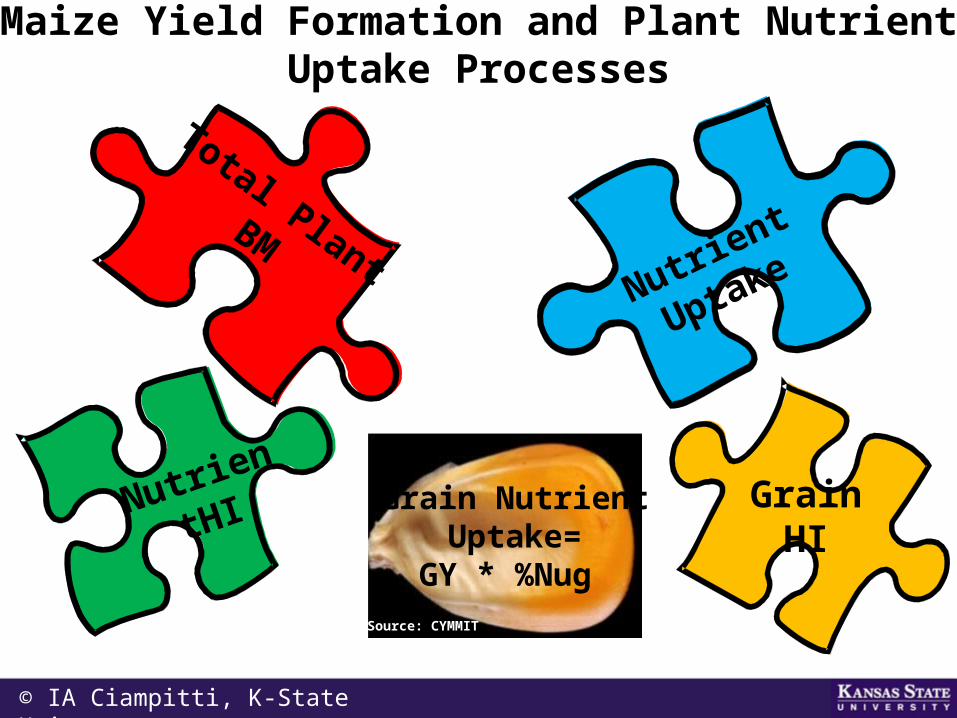
Unraveling the Physiological Puzzle of Maize Yield Formation and Plant Nutrient Uptake
Processes
Total PlantBM
Grain HI
Nutrien
tHI Grain Nutrient Uptake=
GY * %Nug Source: CYMMIT
Nutrient
Uptake
© IA Ciampitti, K-State Univ
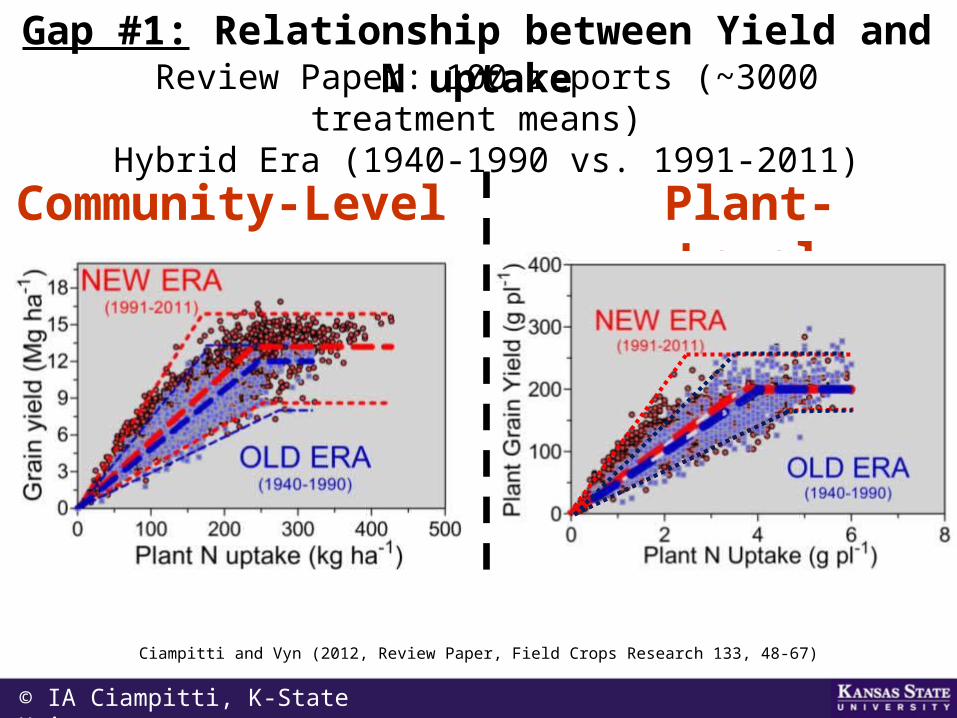
Gap #1: Relationship between Yield and N uptakeReview Paper: 100 reports (~3000 treatment
means) Hybrid Era (1940-1990 vs. 1991-2011)
Community-Level
Plant-Level
© IA Ciampitti, K-State Univ
Ciampitti and Vyn (2012, Review Paper, Field Crops Research 133, 48-67)
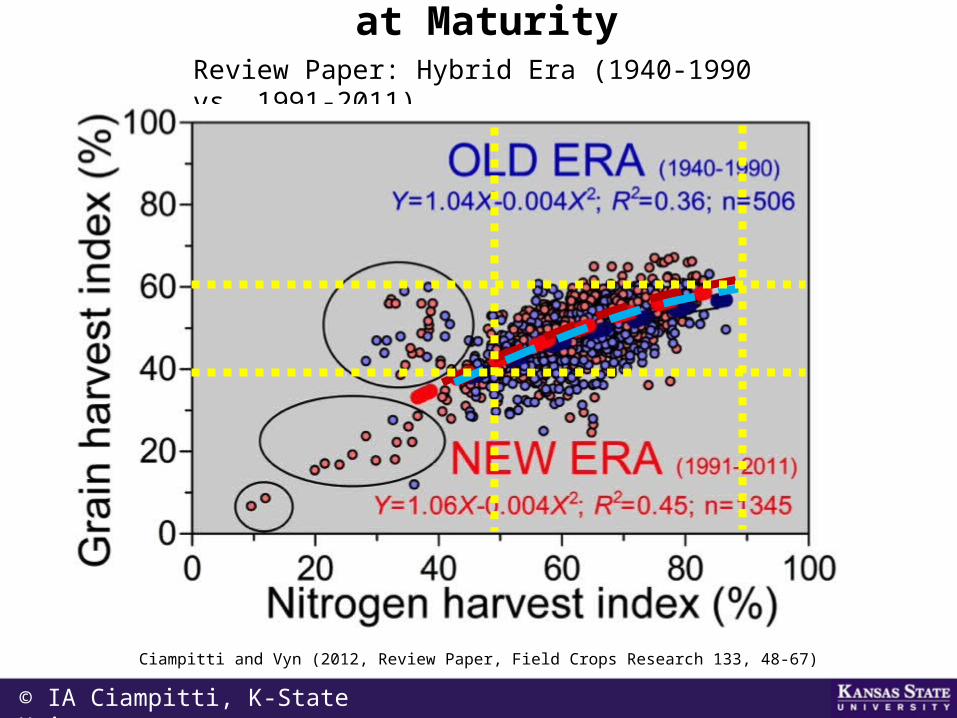
Gap #2: Dry Matter and N Partitioning
at MaturityReview Paper: Hybrid Era (1940-1990 vs. 1991-2011)
Ciampitti and Vyn (2012, Review Paper, Field Crops Research 133, 48-67)
© IA Ciampitti, K-State Univ
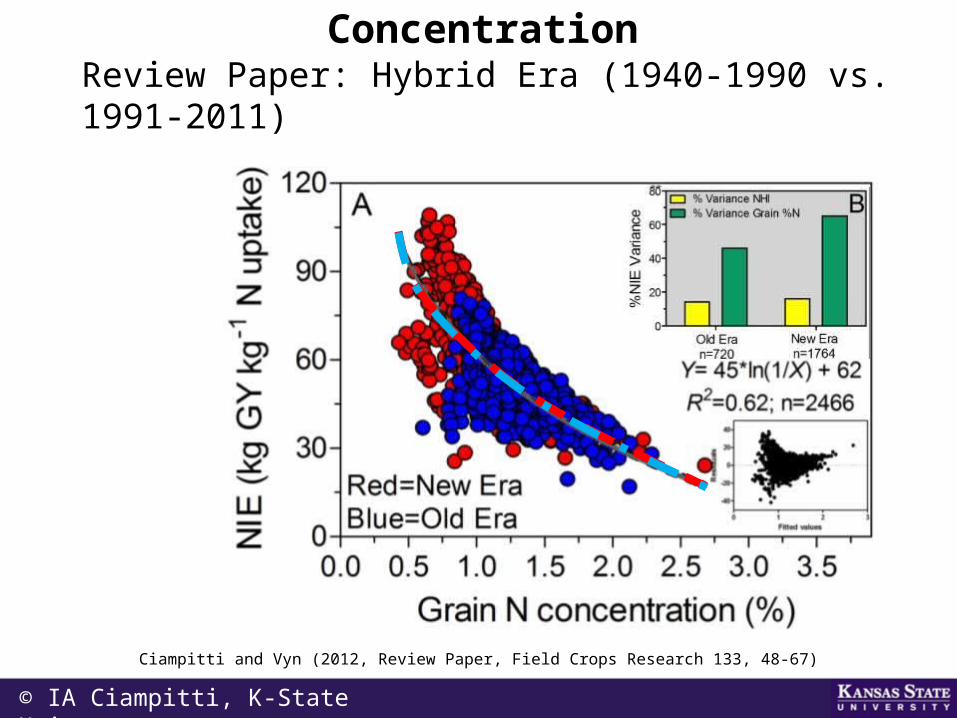
Gap #3: Effect on NIE and Grain N
ConcentrationReview Paper: Hybrid Era (1940-1990 vs. 1991-2011)
Ciampitti and Vyn (2012, Review Paper, Field Crops Research 133, 48-67)
© IA Ciampitti, K-State Univ
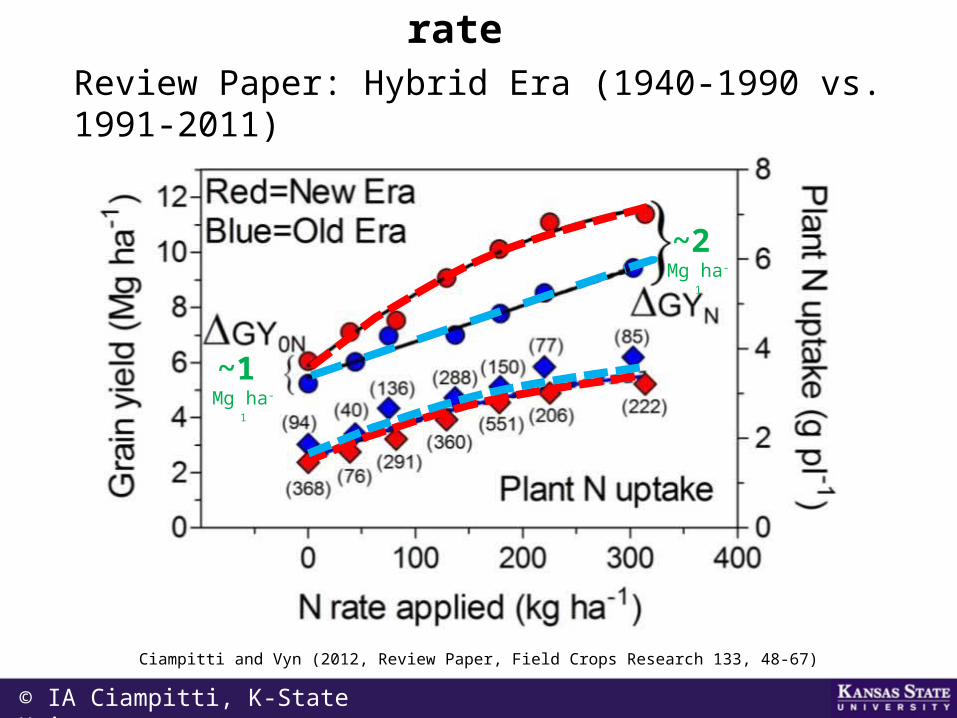
Gap #4: Yield and Plant N Uptake versus N
rate Review Paper: Hybrid Era (1940-1990 vs. 1991-2011)
~1 Mg ha-
1
~2 Mg ha-
1
© IA Ciampitti, K-State Univ
Ciampitti and Vyn (2012, Review Paper, Field Crops Research 133, 48-67)
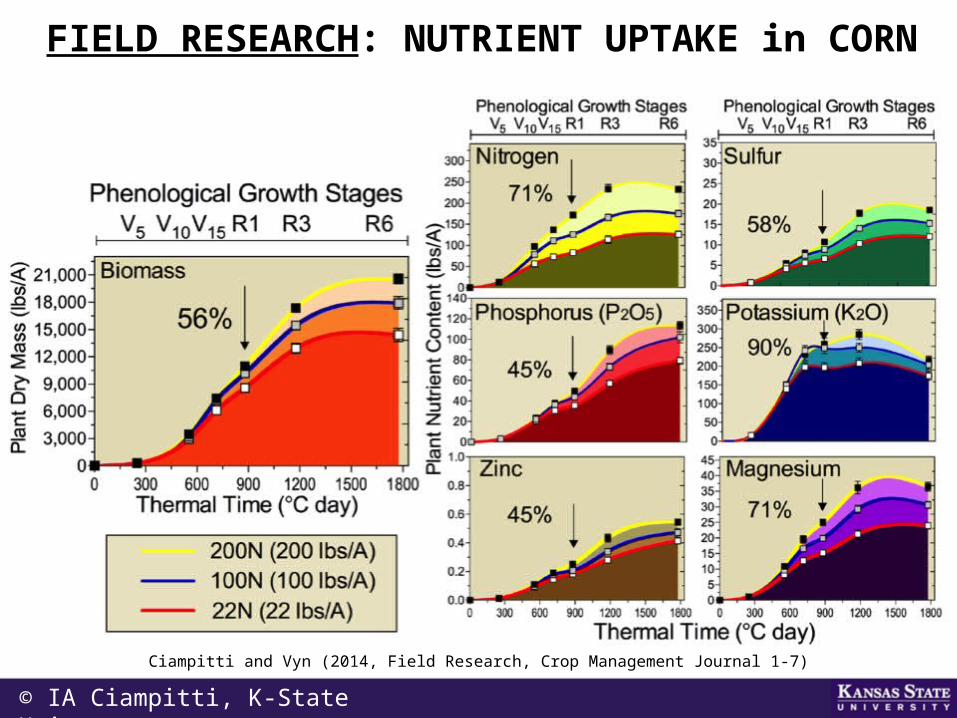
FIELD RESEARCH: NUTRIENT UPTAKE in
CORN
© IA Ciampitti, K-State Univ
Ciampitti and Vyn (2014, Field Research, Crop Management Journal 1-7)
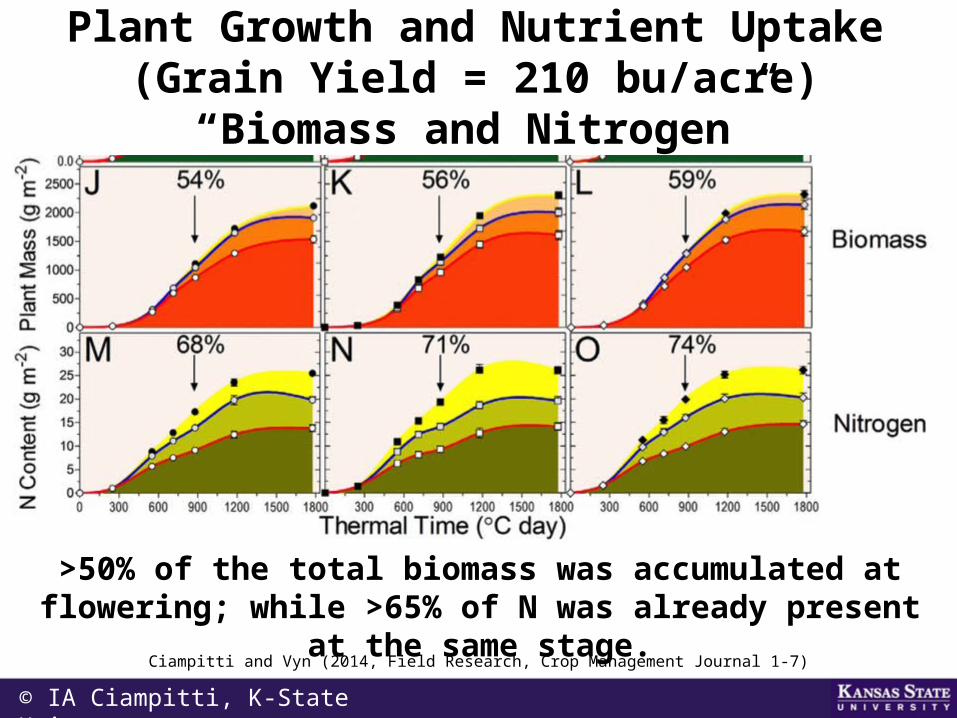
Plant Growth and Nutrient Uptake(Grain Yield = 210 bu/acre)
“Biomass and Nitrogen”
>50% of the total biomass was accumulated at flowering; while >65% of N was already present at
the same stage.
© IA Ciampitti, K-State Univ
Ciampitti and Vyn (2014, Field Research, Crop Management Journal 1-7)
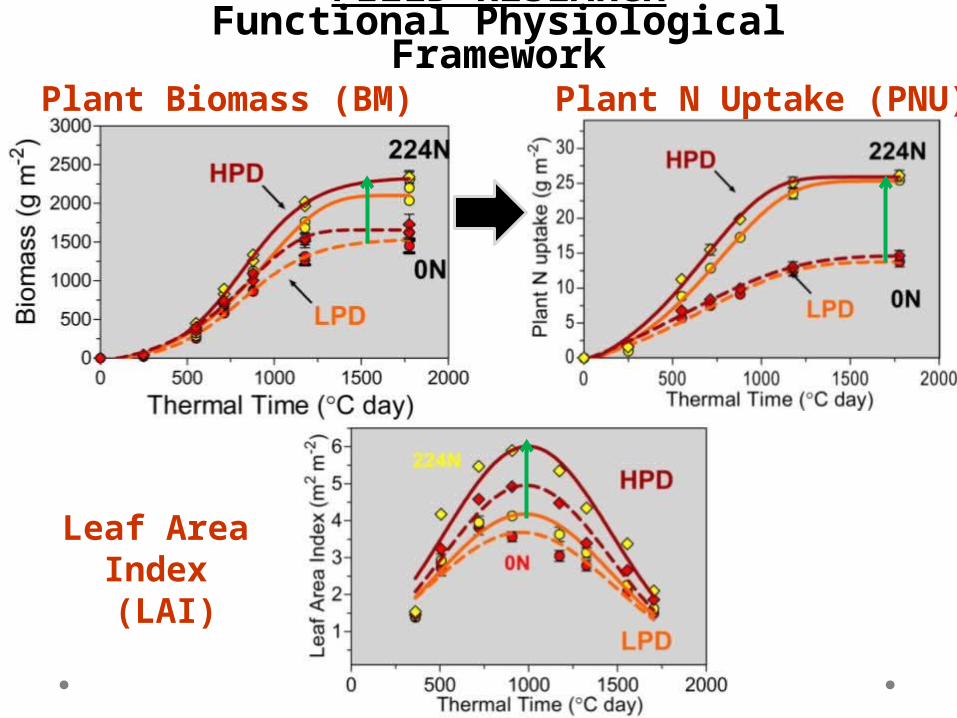
FIELD RESEARCHFunctional Physiological
FrameworkPlant Biomass (BM) Plant N Uptake (PNU)
Leaf Area Index (LAI)
Physiological N adaptations: Vegetative Period
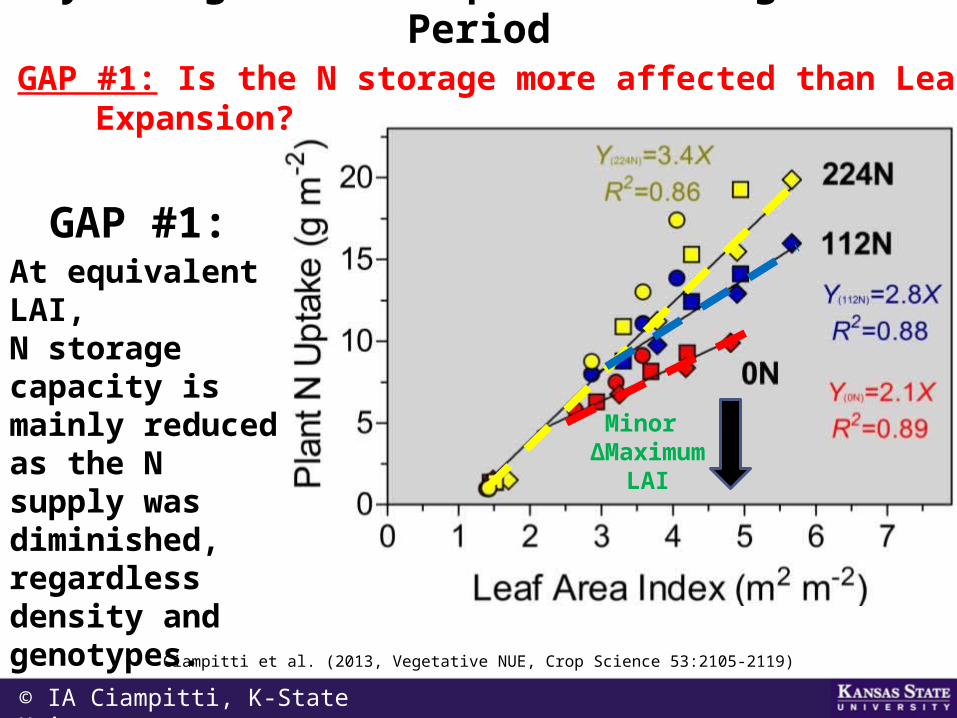
GAP #1:At equivalent
LAI,N storage capacity is mainly reduced as the N supply was diminished, regardless density and genotypes.
Minor ∆Maximu
m LAI
GAP #1: Is the N storage more affected than Leaf Expansion?
Ciampitti et al. (2013, Vegetative NUE, Crop Science 53:2105-2119)
© IA Ciampitti, K-State Univ
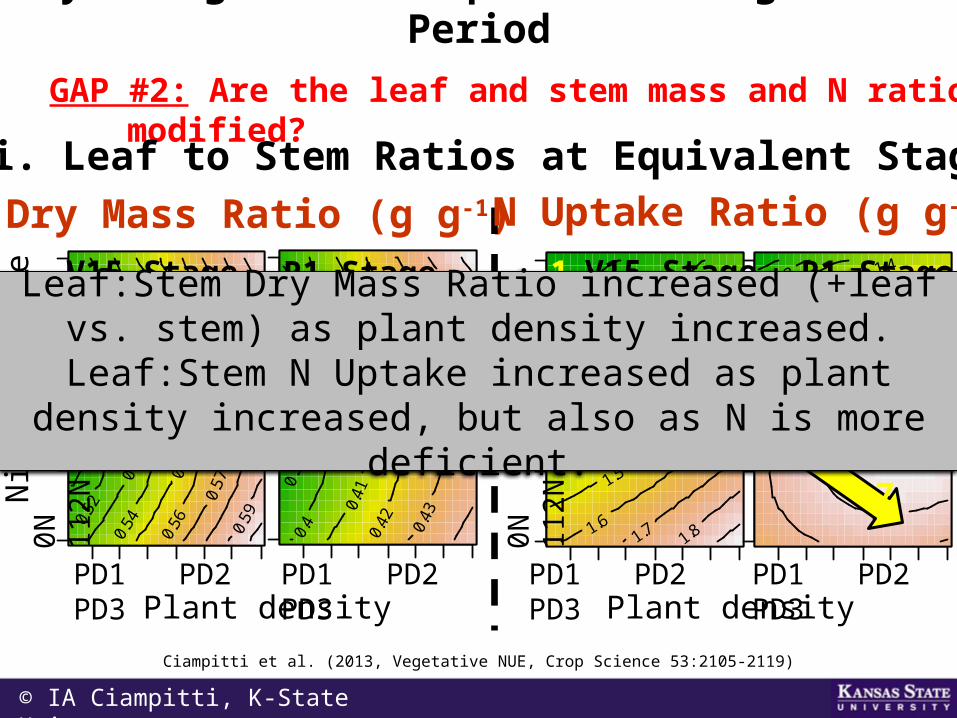
GAP #2: Are the leaf and stem mass and N ratios modified?
0.4 0.6 0.8 1.0
1.0
1.5
2.0
2.5
3.0
Plant DensitySlice at V1 = 2
0.5
0
.51
0.5
2
0.5
3
0.5
4
0.5
5
0.5
6
0.5
7
0.58
0.5
9
0.4 0.6 0.8 1.0
1.0
1.5
2.0
2.5
3.0
Plant DensitySlice at V1 = 2
0.3
9 0
.4 0
.41
0.4
2
0.4
3
0.44
0N
11
2N
2
24N
Nit
roge
n ra
te
Plant densityPD1 PD2 PD3 PD1 PD2 PD3
V15 Stage R1 Stage
Dry Mass Ratio (g g-1)i. Leaf to Stem Ratios at Equivalent Stage
N Uptake Ratio (g g-1)
0.4 0.6 0.8 1.0
1.0
1.5
2.0
2.5
3.0
Plant DensitySlice at V1 = 2
1.1
1.2
1.3
1.4
1.5
1.6
1.7 1.8
0.4 0.6 0.8 1.0
1.0
1.5
2.0
2.5
3.0
Plant DensitySlice at V1 = 2
1.3 1.4
1.45 1.5
1.55
1.6
1.65 0N
112N
224
N
Plant densityPD1 PD2 PD3 PD1 PD2 PD3
V15 Stage R1 Stage
0.50
0.44
1.0
1.7
Ciampitti et al. (2013, Vegetative NUE, Crop Science 53:2105-2119)
© IA Ciampitti, K-State Univ
Leaf:Stem Dry Mass Ratio increased (+leaf vs. stem) as plant density increased.
Leaf:Stem N Uptake increased as plant density increased, but also as N is more deficient.
Physiological N adaptations: Vegetative Period
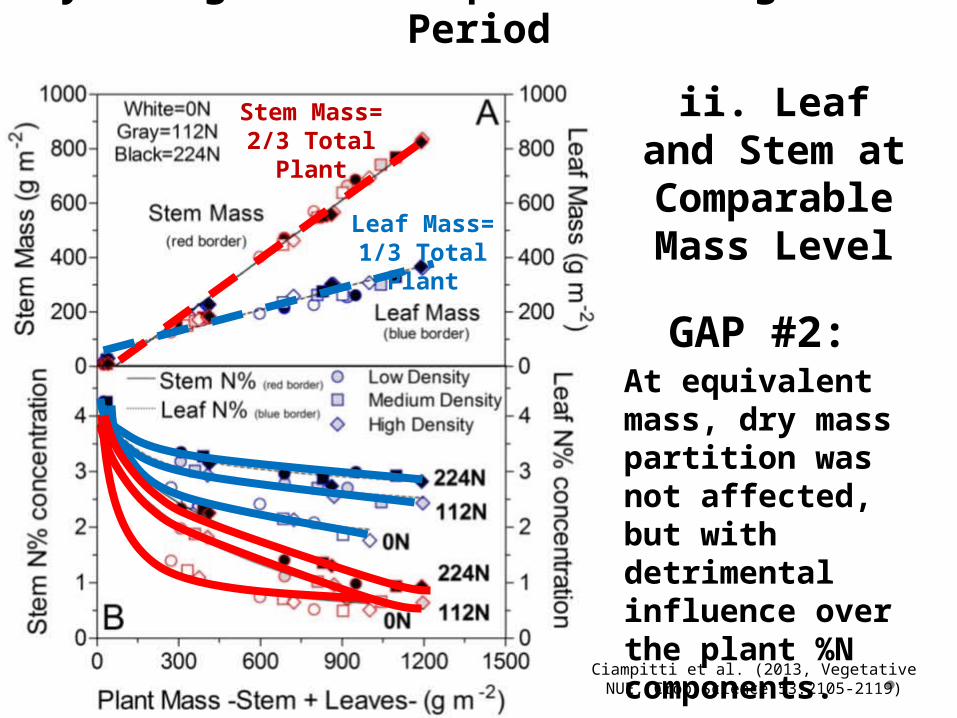
ii. Leaf and Stem at
Comparable Mass Level
GAP #2:At equivalent
mass, dry mass partition was not affected, but with detrimental influence over the plant %N components.
Stem Mass= 2/3 Total
Plant
Leaf Mass= 1/3 Total
Plant
Physiological N adaptations: Vegetative Period
Ciampitti et al. (2013, Vegetative NUE, Crop Science 53:2105-2119)
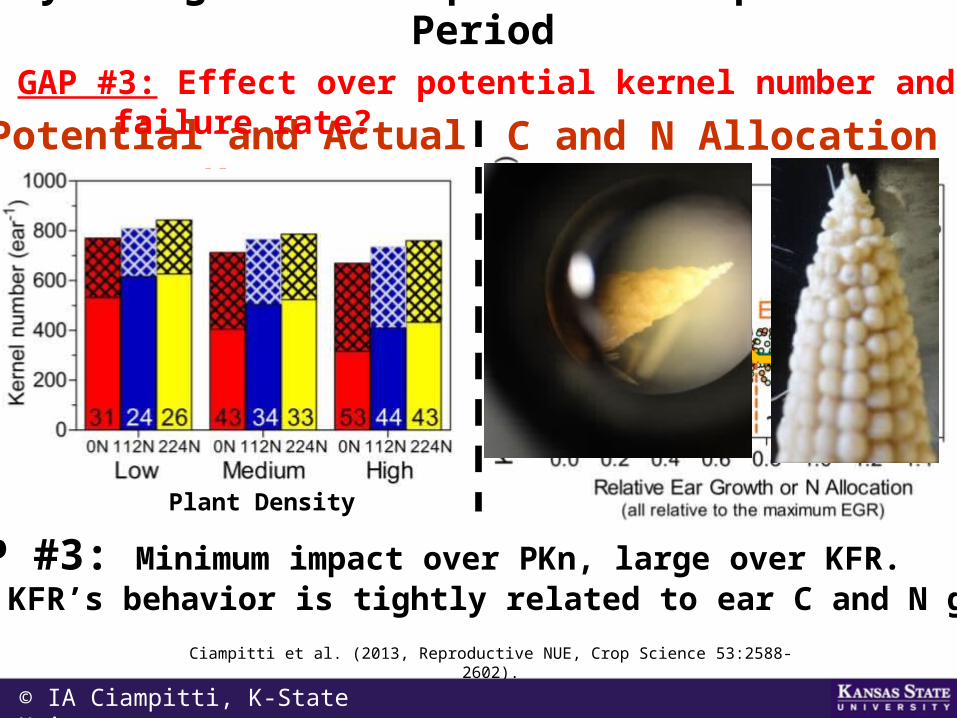
Potential and Actual Kn
GAP #3: Effect over potential kernel number and failure rate? C and N Allocation
Plant Density
Physiological N adaptations: Reproductive Period
GAP #3: Minimum impact over PKn, large over KFR.The KFR’s behavior is tightly related to ear C and N gains.
Ciampitti et al. (2013, Reproductive NUE, Crop Science 53:2588-2602).
© IA Ciampitti, K-State Univ
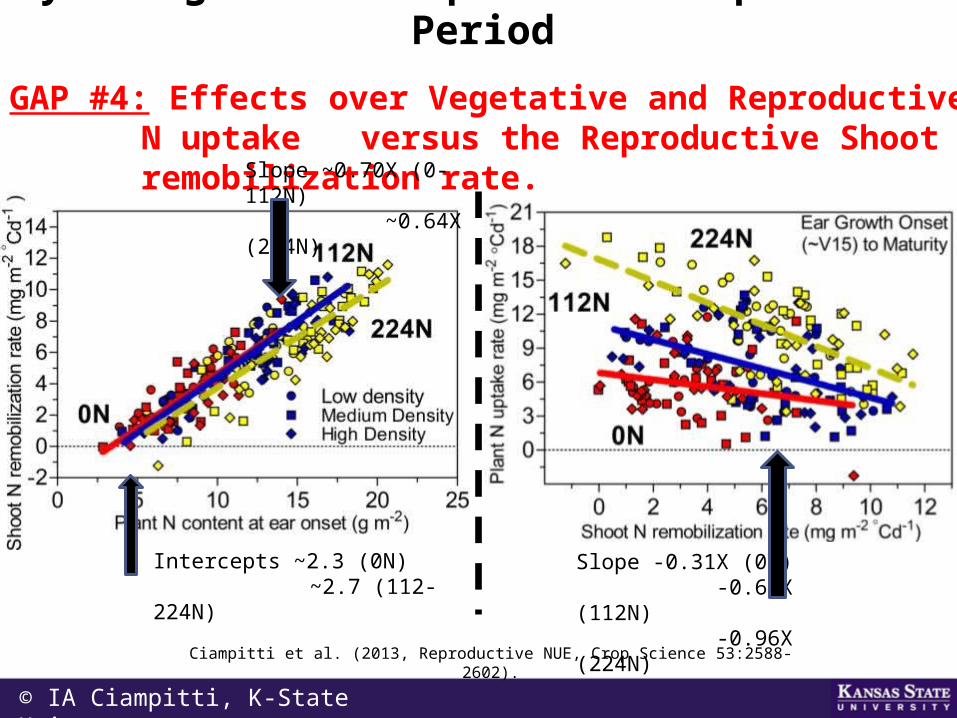
GAP #4: Effects over Vegetative and Reproductive N uptake versus the Reproductive Shoot N remobilization rate.Slope ~0.70X (0-
112N) ~0.64X (224N)
Intercepts ~2.3 (0N) ~2.7 (112-224N)
Slope -0.31X (0N) -0.64X (112N) -0.96X (224N)
© IA Ciampitti, K-State Univ
Ciampitti et al. (2013, Reproductive NUE, Crop Science 53:2588-2602).
Physiological N adaptations: Reproductive Period
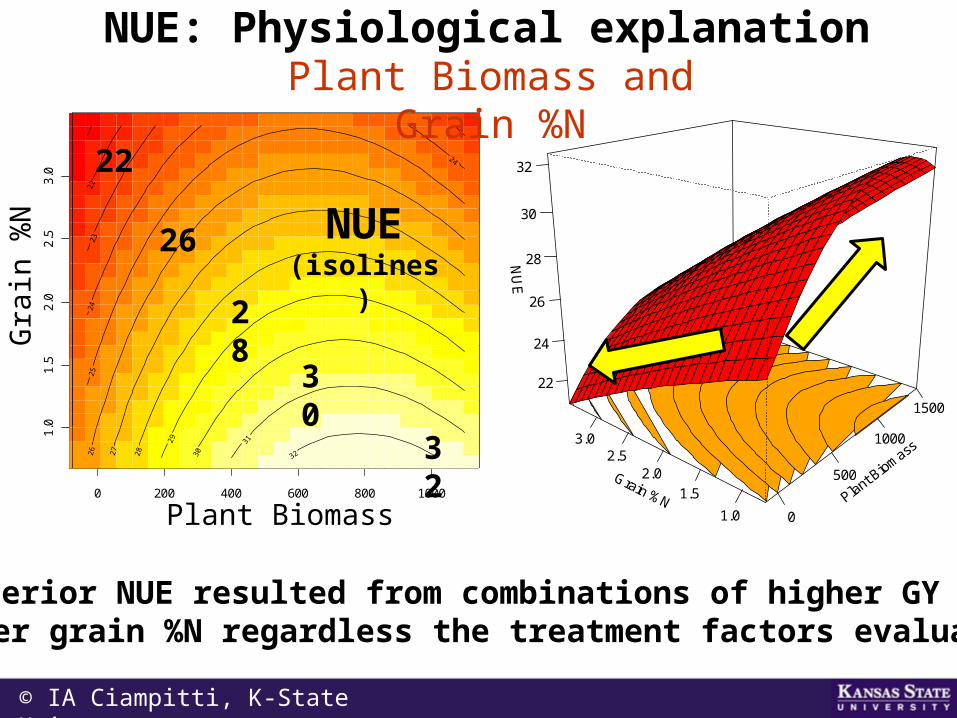
NUE: Physiological explanation
Plant Biomass
0
500
1000
1500
Grain %N1.0
1.5
2.02.5
3.0N
UE
22
24
26
28
30
32
0 200 400 600 800 1000
1.0
1.5
2.0
2.5
3.0
Plant.BM
Ng
Plant.BM
Ng
0 200 400 600 800 1000
1.0
1.5
2.0
2.5
3.0
3.5
NUE(isolines)
22
26
28
30
32
Plant Biomass
Gra
in %
N
Plant Biomass and Grain %N
Superior NUE resulted from combinations of higher GY and lower grain %N regardless the treatment factors evaluated.
© IA Ciampitti, K-State Univ
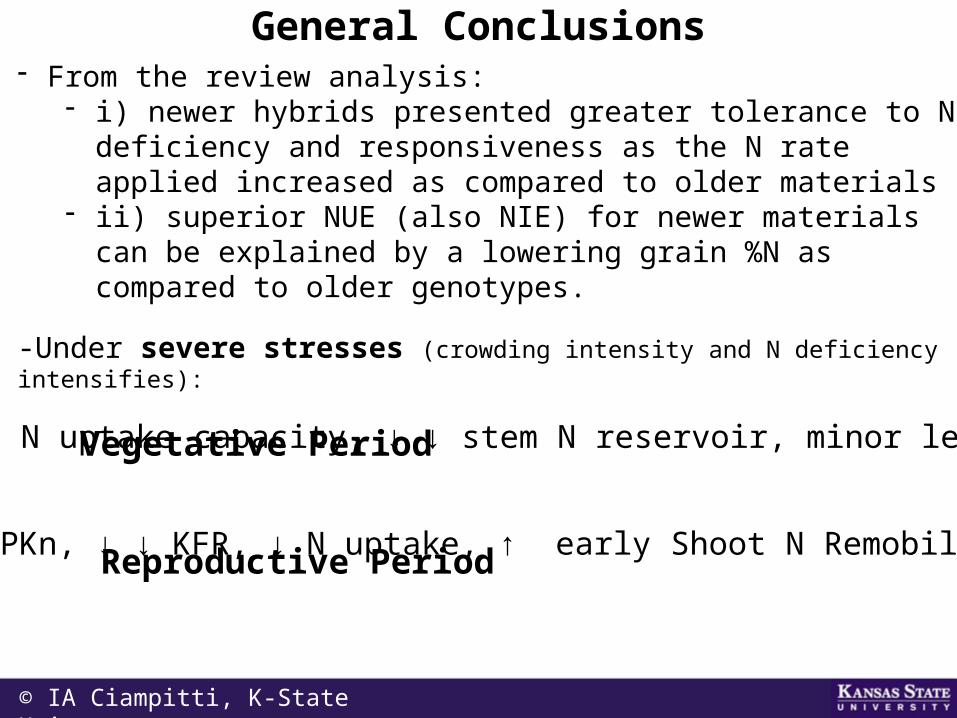
General Conclusions- From the review analysis:
- i) newer hybrids presented greater tolerance to N deficiency and responsiveness as the N rate applied increased as compared to older materials
- ii) superior NUE (also NIE) for newer materials can be explained by a lowering grain %N as compared to older genotypes.
-Under severe stresses (crowding intensity and N deficiency intensifies):
Vegetative Period
Reproductive Period
= LAI, ↓ N uptake capacity, ↓ ↓ stem N reservoir, minor leaf %N
minor PKn, ↓ ↓ KFR, ↓ N uptake, ↑ early Shoot N Remobilization
© IA Ciampitti, K-State Univ
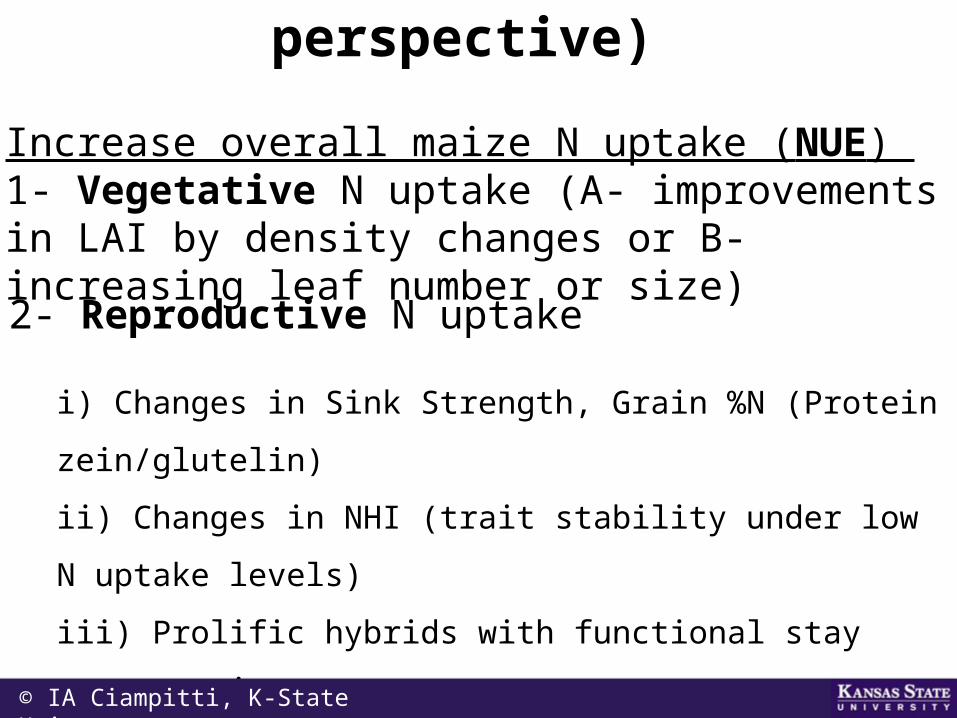
Future Paths (plant perspective)
Increase overall maize N uptake (NUE) 1- Vegetative N uptake (A- improvements in LAI by density changes or B- increasing leaf number or size)2- Reproductive N uptake
i) Changes in Sink Strength, Grain %N (Protein
zein/glutelin)
ii) Changes in NHI (trait stability under low N uptake
levels)
iii) Prolific hybrids with functional stay green trait
iv) Flexible traits: to overcome the reported N uptake
trade-off
v) Study using maize landraces for natural NHI
variability
© IA Ciampitti, K-State Univ
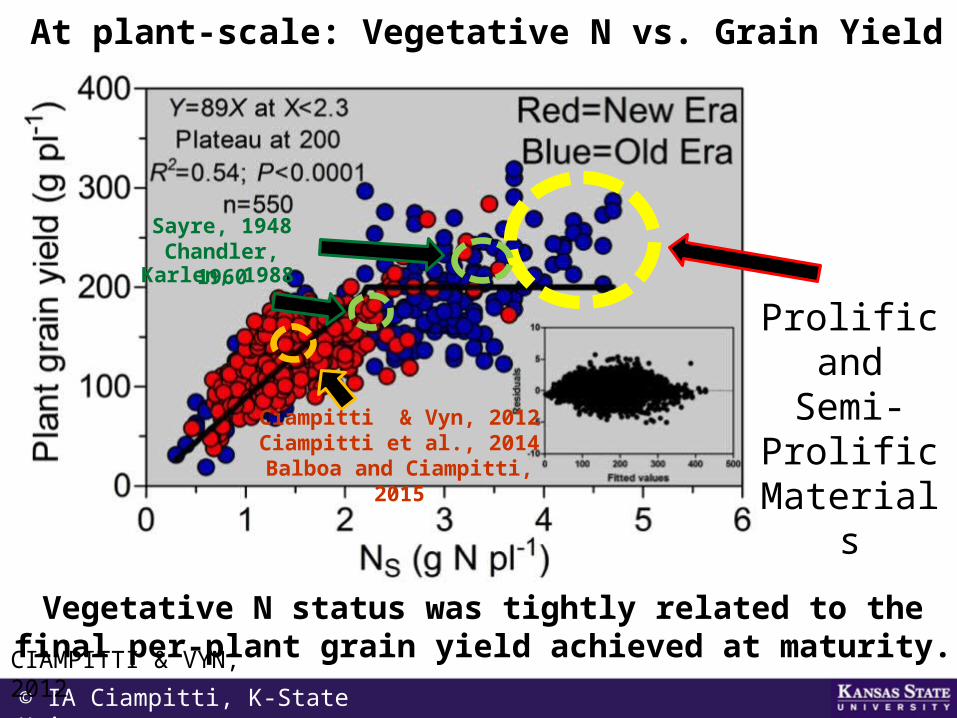
At plant-scale: Vegetative N vs. Grain Yield
Vegetative N status was tightly related to the final per-plant grain yield achieved at maturity.
Prolific and Semi-
Prolific Materials
Sayre, 1948Chandler,
1960Karlen, 1988
Ciampitti & Vyn, 2012Ciampitti et al., 2014Balboa and Ciampitti,
2015
© IA Ciampitti, K-State Univ
CIAMPITTI & VYN, 2012
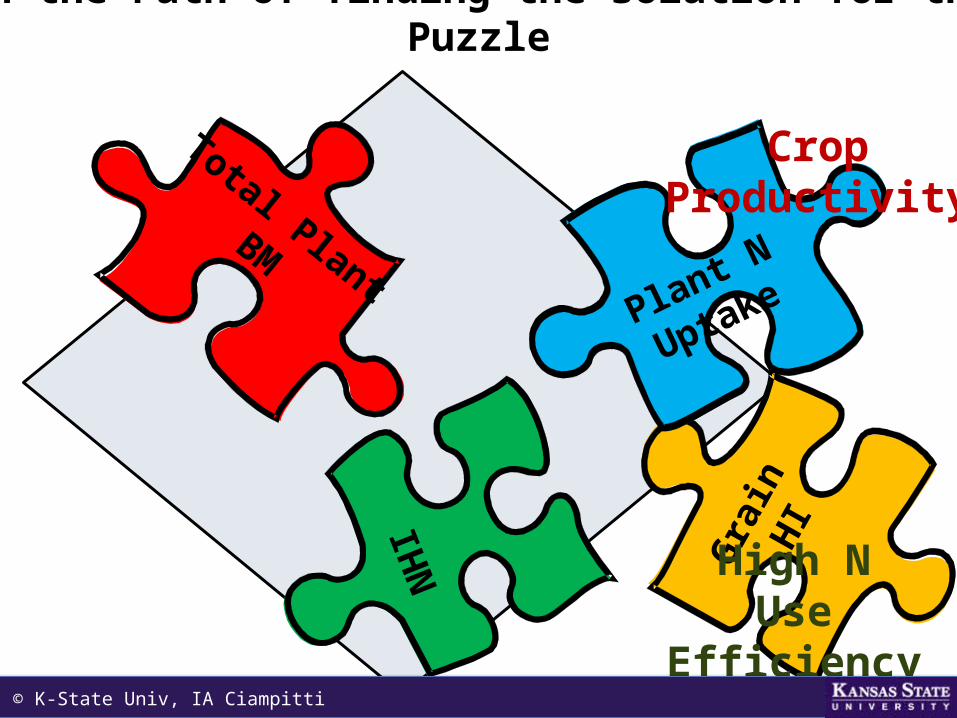
In the Path of finding the solution for the Puzzle
Gra
in
HI
NH
I
Plant N
Uptake
Total PlantBM
High NUse
Efficiency
CropProductivity
Dr. Ignacio Antonio Ciampitti • Assistant Professor Crop Production/ Cropping Systems • Agronomy Department • Kansas State University© K-State Univ, IA Ciampitti

QUESTIONSTHANKS!
Dr. Ignacio Antonio Ciampitti • Assistant Professor Crop Production/ Cropping Systems • Agronomy Department • Kansas State University
@KSUCROPS
/KSUCROPS
© K-State Univ, IA Ciampitti
Ignacio A. Ciampitti, K-State Univ
Crop Production Specialist
[email protected], 785-410-9354


![40under40 9354[1]](https://img.pdfslide.us/doc/110x75/55d4ef0abb61eb95438b468e/40under40-93541.jpg)