Embed Size (px)
Citation preview
1
Carmen Rubio IGENOMIX and Valencian Infertility Institute Foundation (FIVI)/INCLIVA Valencia, Spain
Declared no potential conflict of interest.
www.excemed.org
IMPROVING THE PATIENT’S LIFE THROUGH
MEDICAL EDUCATION
Preimplantation Genetic Screening
Improves clinical outcomes
24-25 September 2015
Madrid and Alicante, Spain
3
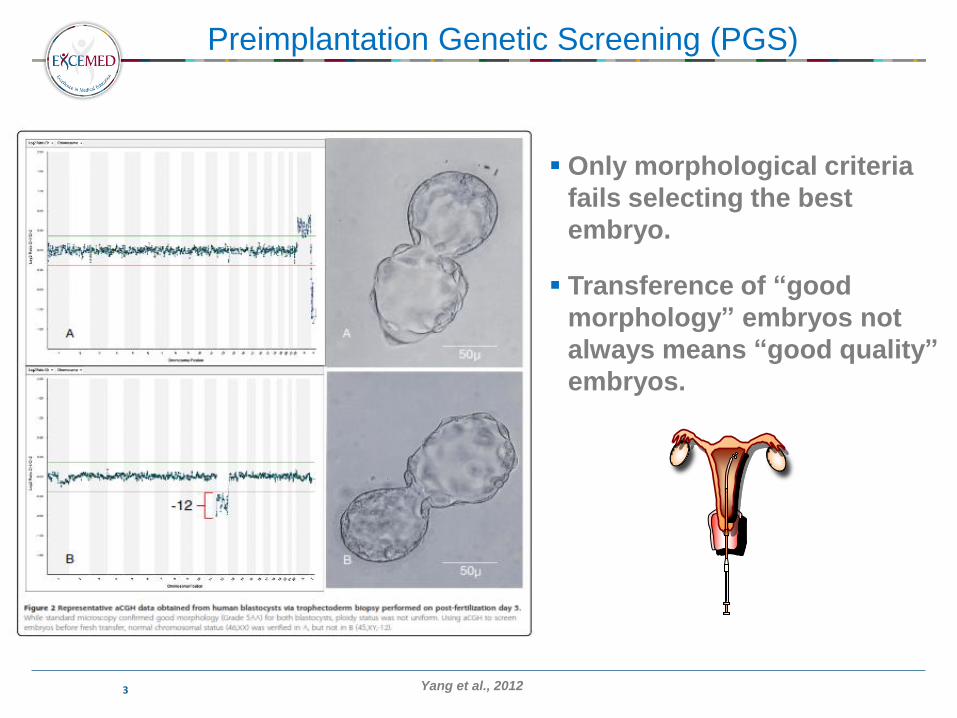
Only morphological criteria
fails selecting the best
embryo.
Transference of “good
morphology” embryos not
always means “good quality”
embryos.
Yang et al., 2012
Preimplantation Genetic Screening (PGS)
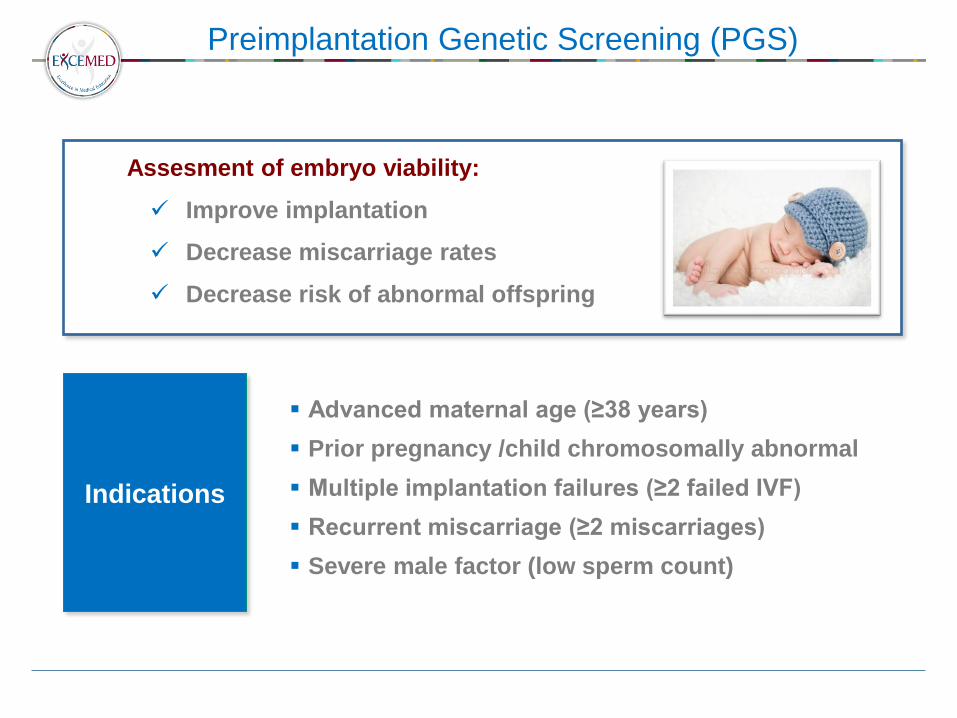
Indications
Advanced maternal age (≥38 years)
Prior pregnancy /child chromosomally abnormal
Multiple implantation failures (≥2 failed IVF)
Recurrent miscarriage (≥2 miscarriages)
Severe male factor (low sperm count)
Improve implantation
Decrease miscarriage rates
Decrease risk of abnormal offspring
Assesment of embryo viability:
Preimplantation Genetic Screening (PGS)
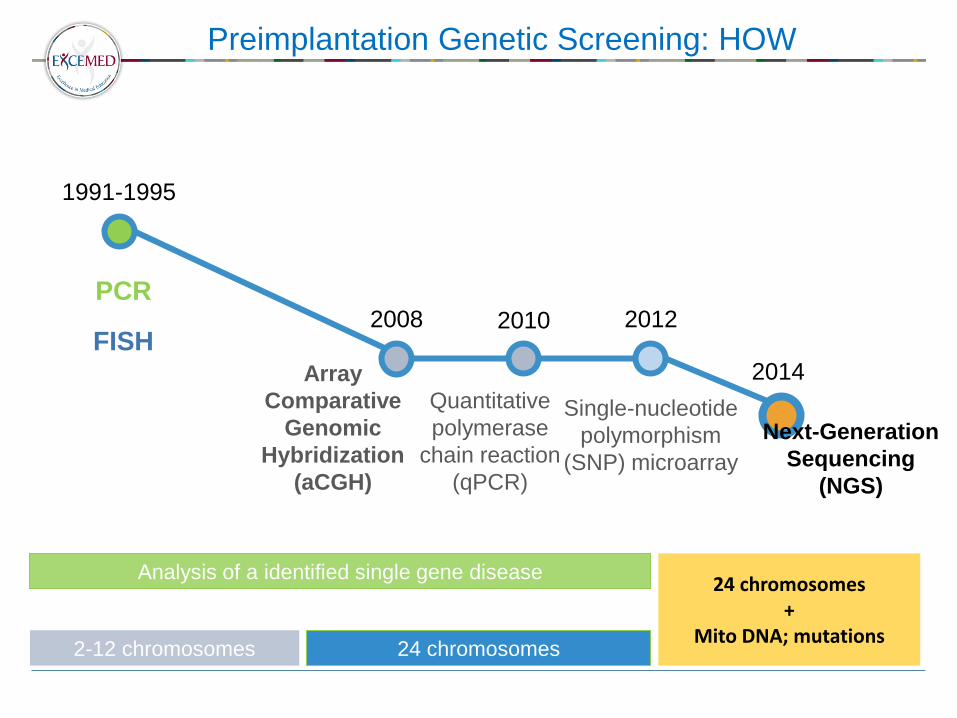
2014
2008 2010 2012
1991-1995
FISH Array
Comparative
Genomic
Hybridization
(aCGH)
Single-nucleotide
polymorphism
(SNP) microarray
Quantitative
polymerase
chain reaction
(qPCR)
Next-Generation
Sequencing
(NGS)
2-12 chromosomes 24 chromosomes
PCR
Analysis of a identified single gene disease 24 chromosomes
+ Mito DNA; mutations
Preimplantation Genetic Screening: HOW
Preimplantation Genetic Screening: HOW
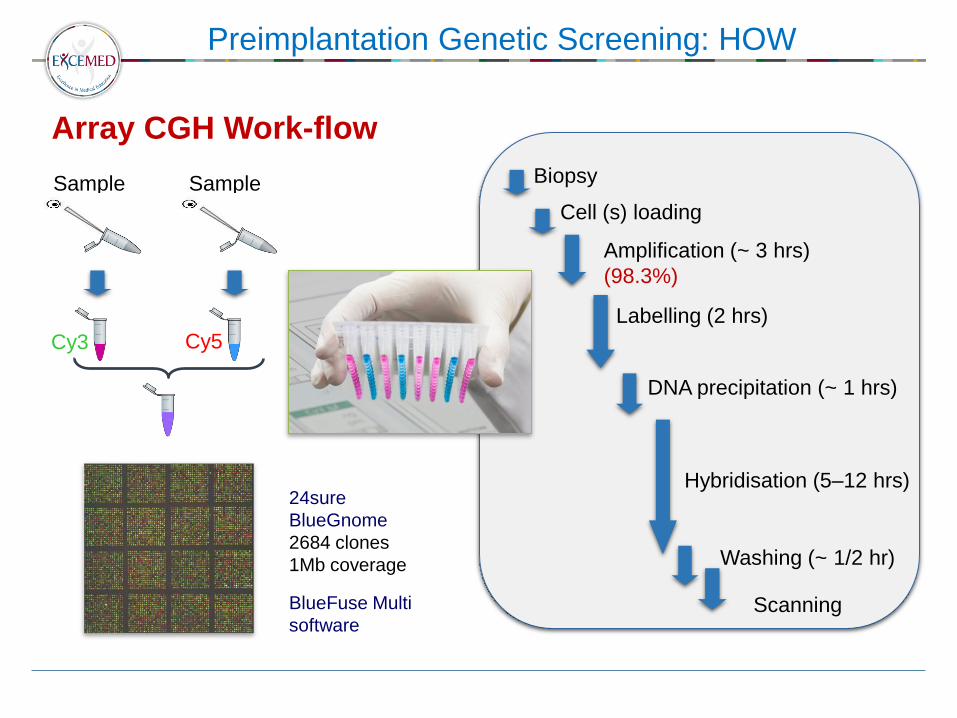
Cy3 Cy5
24sure
BlueGnome
2684 clones
1Mb coverage
BlueFuse Multi
software
Biopsy
Cell (s) loading
Amplification (~ 3 hrs)
(98.3%)
Labelling (2 hrs)
DNA precipitation (~ 1 hrs)
Hybridisation (5–12 hrs)
Washing (~ 1/2 hr)
Scanning
Sample
1
Sample
2
Array CGH Work-flow
Preimplantation Genetic Screening: HOW
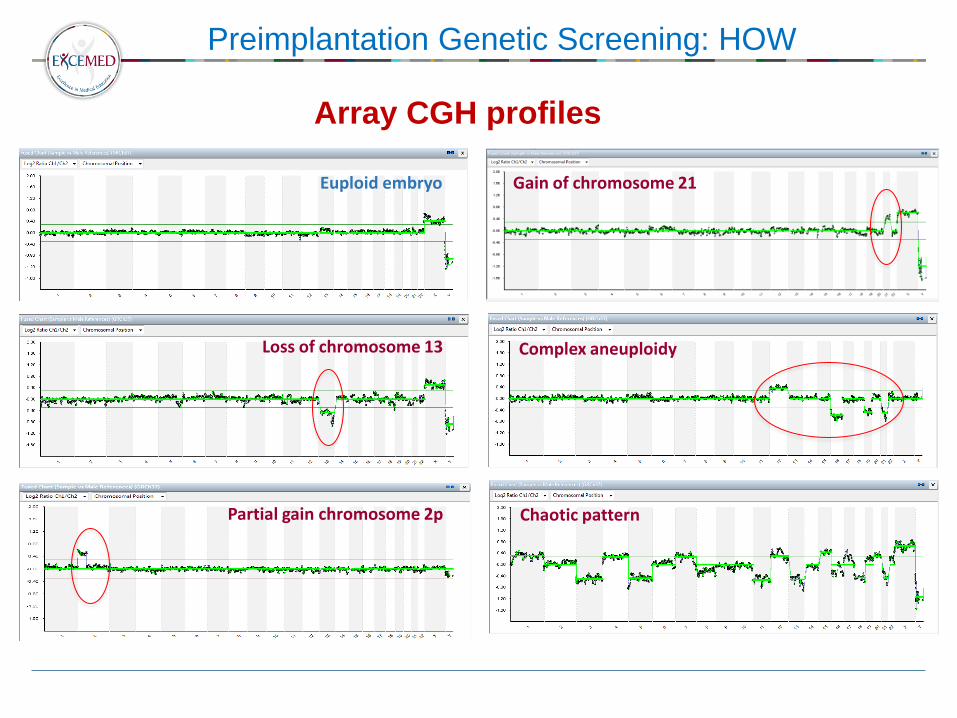
Partial gain chromosome 2p
Euploid embryo
Complex aneuploidy
Chaotic pattern
Loss of chromosome 13
Gain of chromosome 21
Array CGH profiles
Preimplantation Genetic Screening: HOW
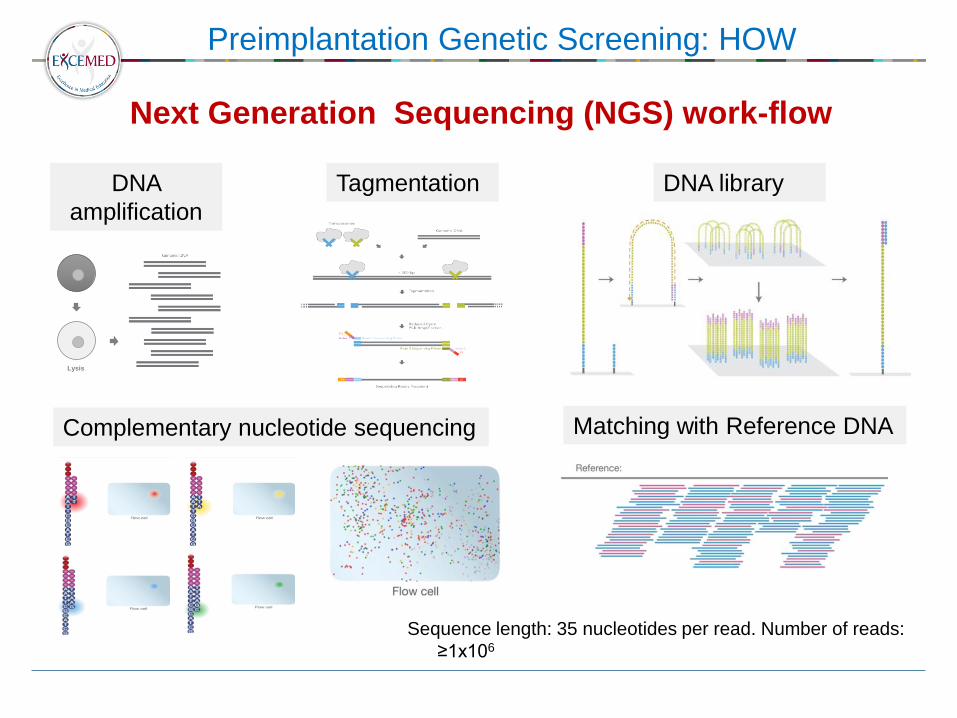
Next Generation Sequencing (NGS) work-flow
Tagmentation DNA library
Complementary nucleotide sequencing Matching with Reference DNA
DNA
amplification
Lysis
Sequence length: 35 nucleotides per read. Number of reads:
≥1x10⁶
Preimplantation Genetic Screening: HOW
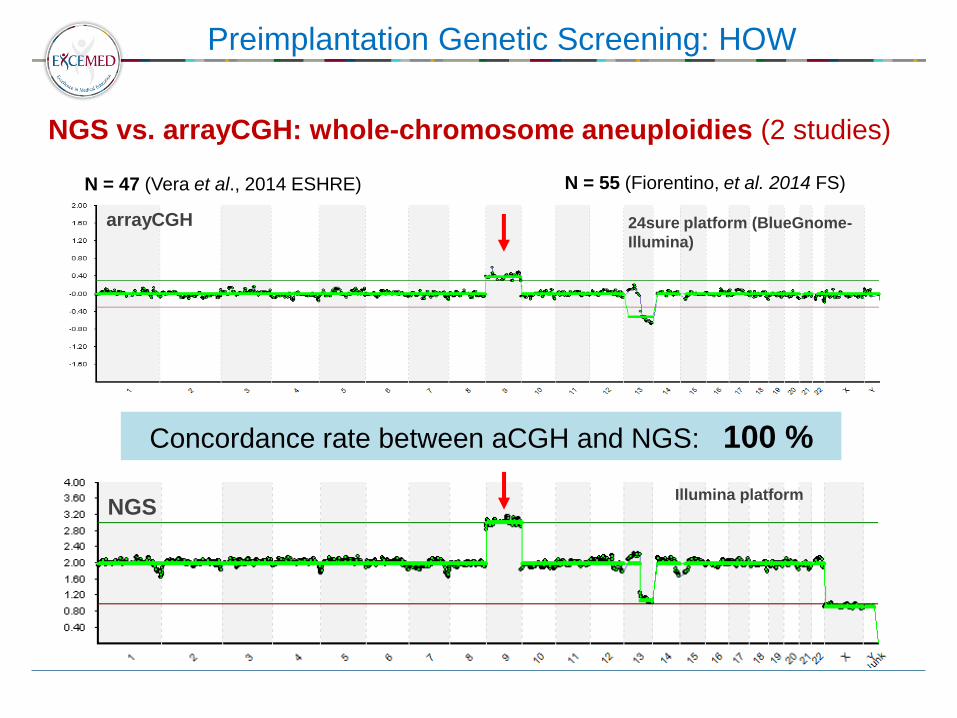
Concordance rate between aCGH and NGS: 100 %
arrayCGH
NGS
NGS vs. arrayCGH: whole-chromosome aneuploidies (2 studies)
N = 47 (Vera et al., 2014 ESHRE) N = 55 (Fiorentino, et al. 2014 FS)
Illumina platform
24sure platform (BlueGnome-
Illumina)
Preimplantation Genetic Screening: HOW
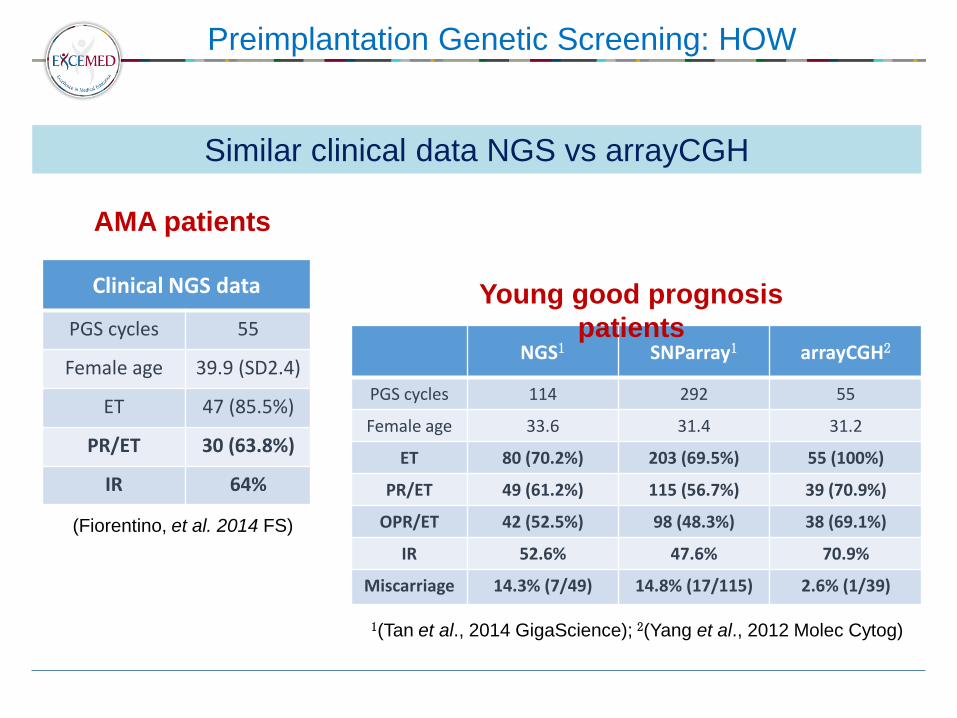
Clinical NGS data
PGS cycles 55
Female age 39.9 (SD2.4)
ET 47 (85.5%)
PR/ET 30 (63.8%)
IR 64%
Similar clinical data NGS vs arrayCGH
(Fiorentino, et al. 2014 FS)
AMA patients
NGS1 SNParray1 arrayCGH2
PGS cycles 114 292 55
Female age 33.6 31.4 31.2
ET 80 (70.2%) 203 (69.5%) 55 (100%)
PR/ET 49 (61.2%) 115 (56.7%) 39 (70.9%)
OPR/ET 42 (52.5%) 98 (48.3%) 38 (69.1%)
IR 52.6% 47.6% 70.9%
Miscarriage 14.3% (7/49) 14.8% (17/115) 2.6% (1/39)
1(Tan et al., 2014 GigaScience); 2(Yang et al., 2012 Molec Cytog)
Young good prognosis
patients
Preimplantation Genetic Screening: HOW
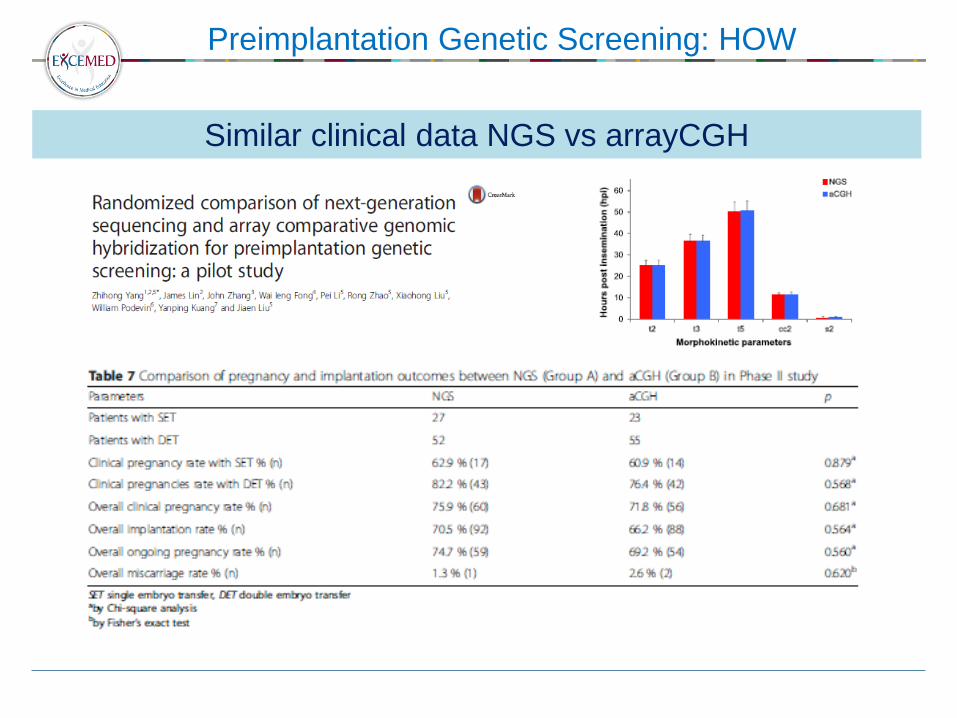
Similar clinical data NGS vs arrayCGH
Preimplantation Genetic Screening: HOW
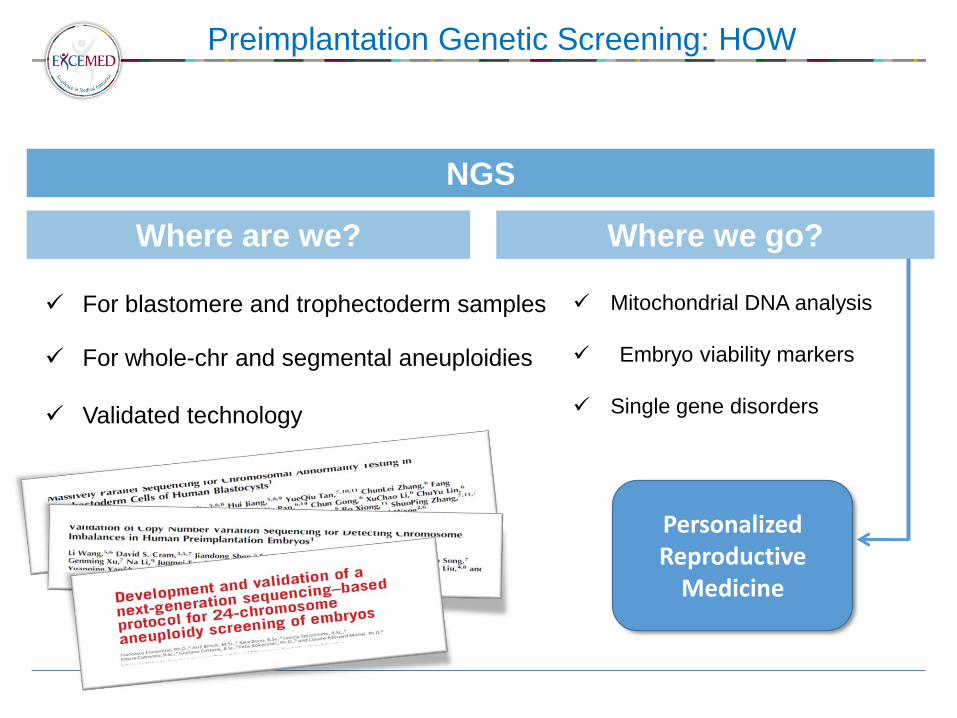
Where are we? Where we go?
For blastomere and trophectoderm samples
For whole-chr and segmental aneuploidies
Validated technology
Mitochondrial DNA analysis
Embryo viability markers
Single gene disorders
Personalized Reproductive
Medicine
NGS
Preimplantation Genetic Screening: HOW
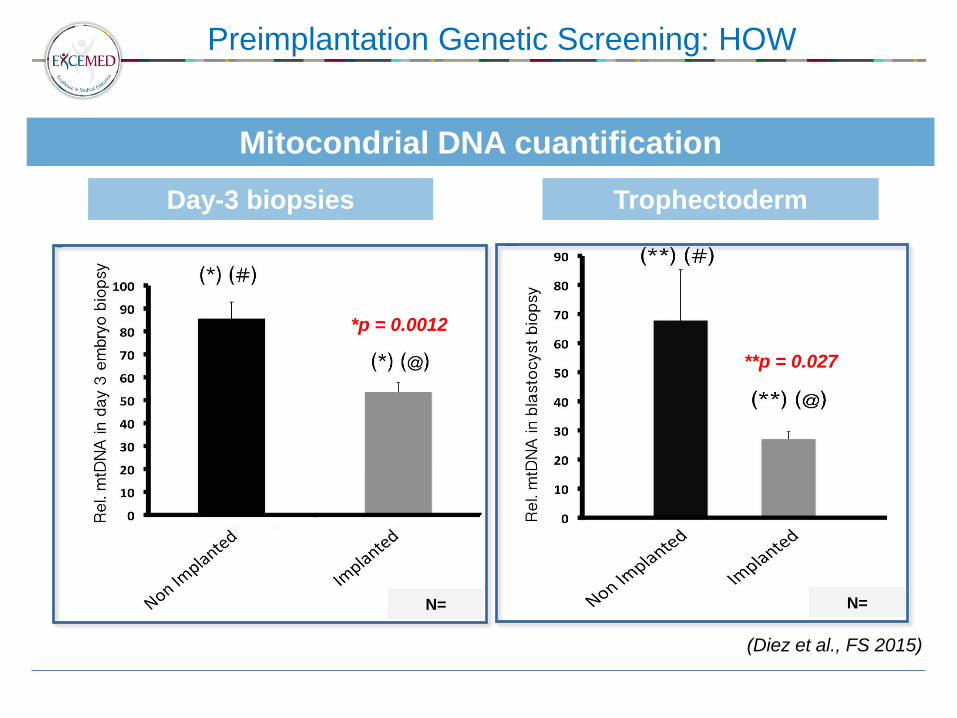
*p = 0.0012
**p = 0.027
Day-3 biopsies Trophectoderm
Mitocondrial DNA cuantification
(Diez et al., FS 2015)
N= N=
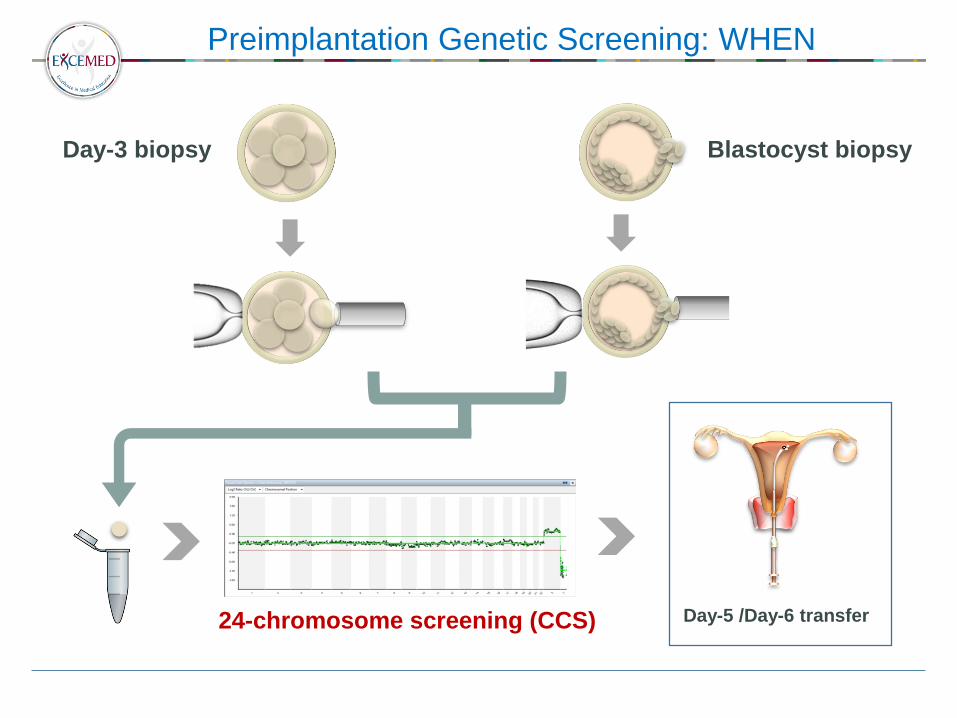
Preimplantation Genetic Screening: WHEN
24-chromosome screening (CCS)
Day-3 biopsy
Day-5 /Day-6 transfer
Blastocyst biopsy
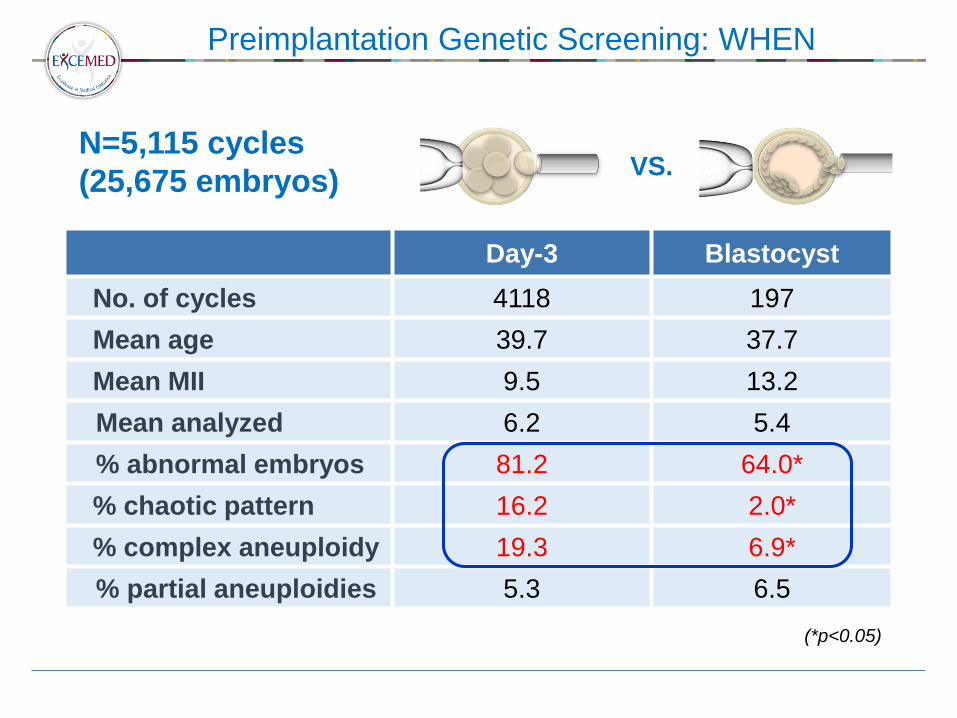
Preimplantation Genetic Screening: WHEN
VS.
Day-3 Blastocyst
No. of cycles 4118 197
Mean age 39.7 37.7
Mean MII 9.5 13.2
Mean analyzed 6.2 5.4
% abnormal embryos 81.2 64.0*
% chaotic pattern 16.2 2.0*
% complex aneuploidy 19.3 6.9*
% partial aneuploidies 5.3 6.5
N=5,115 cycles
(25,675 embryos)
(*p<0.05)
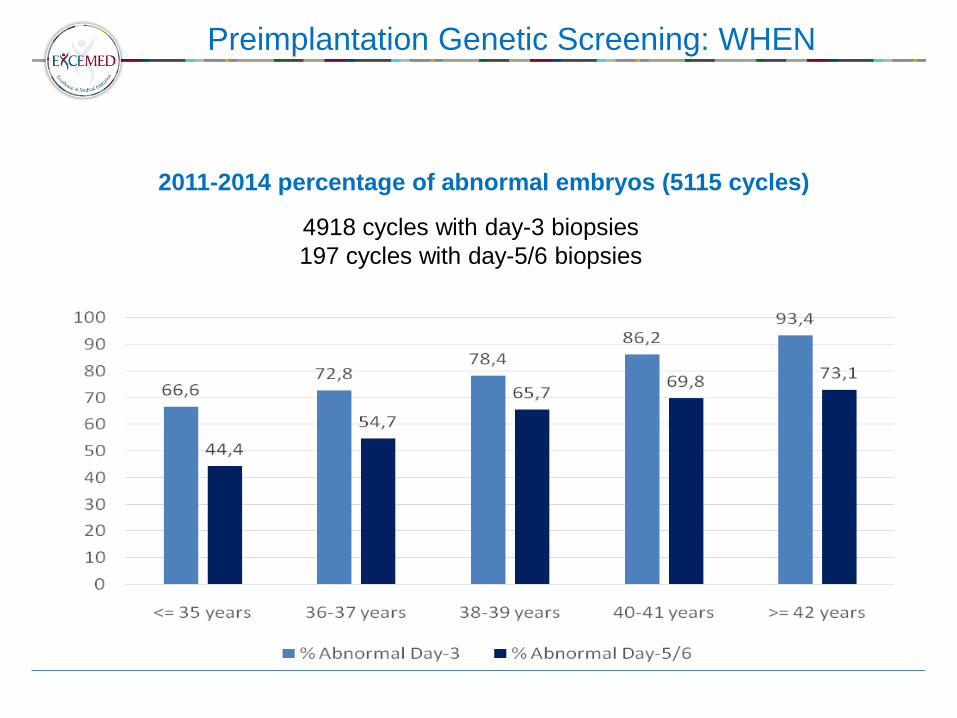
Preimplantation Genetic Screening: WHEN
4918 cycles with day-3 biopsies
197 cycles with day-5/6 biopsies
2011-2014 percentage of abnormal embryos (5115 cycles)
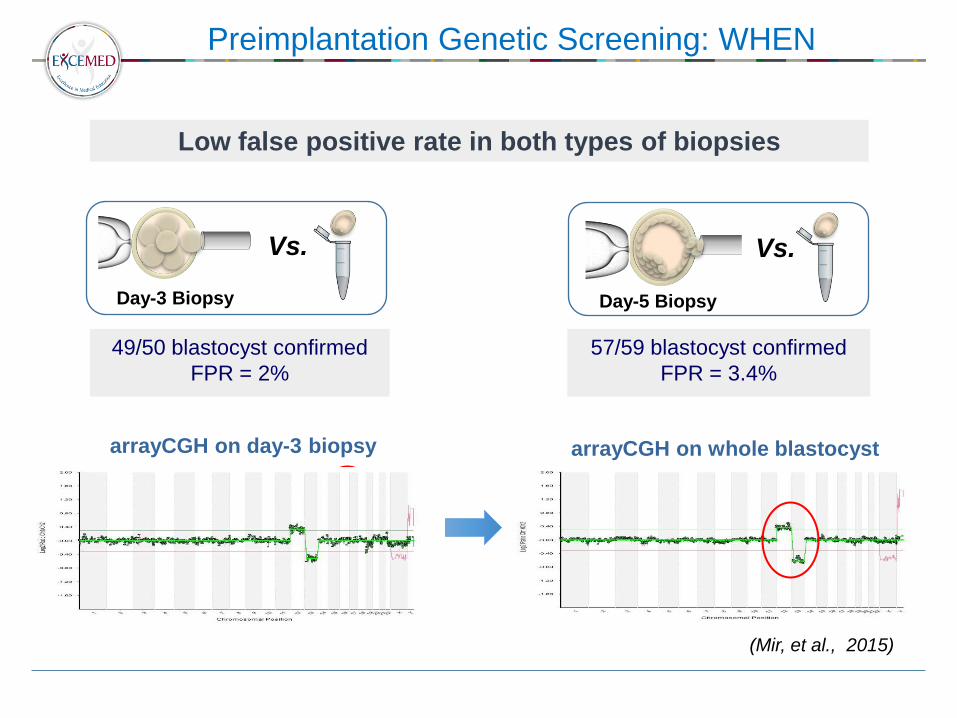
Preimplantation Genetic Screening: WHEN
arrayCGH on day-3 biopsy
49/50 blastocyst confirmed
FPR = 2%
Vs.
Day-3 Biopsy Day-5 Biopsy
Vs.
Low false positive rate in both types of biopsies
57/59 blastocyst confirmed
FPR = 3.4%
(Mir, et al., 2015)
arrayCGH on whole blastocyst
Preimplantation Genetic Screening: WHEN
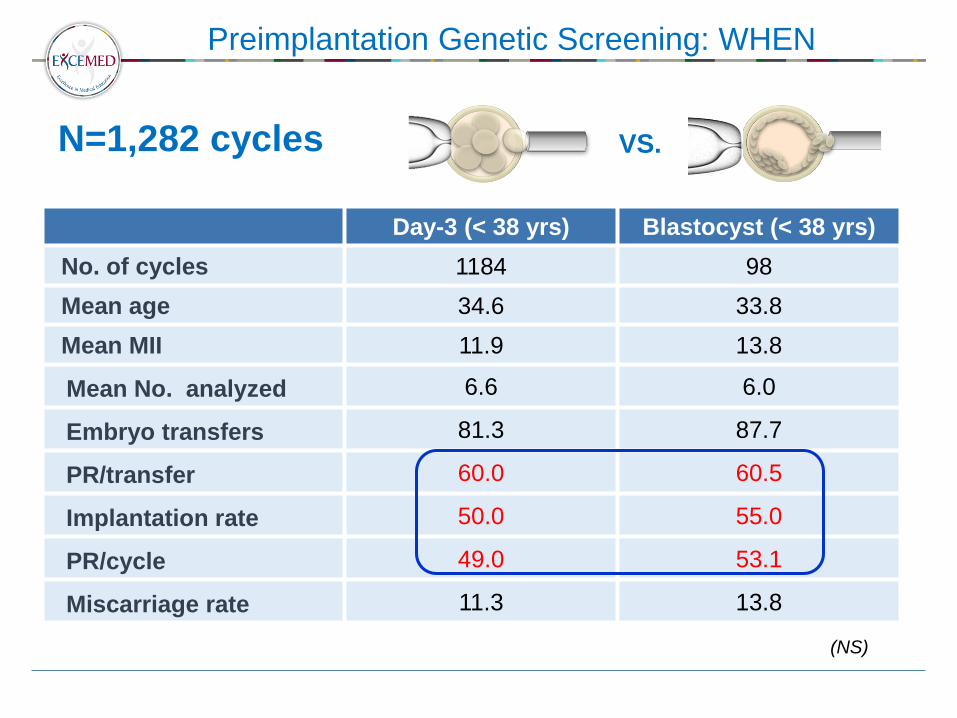
VS.
Day-3 (< 38 yrs) Blastocyst (< 38 yrs)
No. of cycles 1184 98
Mean age 34.6 33.8
Mean MII 11.9 13.8
Mean No. analyzed 6.6 6.0
Embryo transfers 81.3 87.7
PR/transfer 60.0 60.5
Implantation rate 50.0 55.0
PR/cycle 49.0 53.1
Miscarriage rate 11.3 13.8
N=1,282 cycles
(NS)
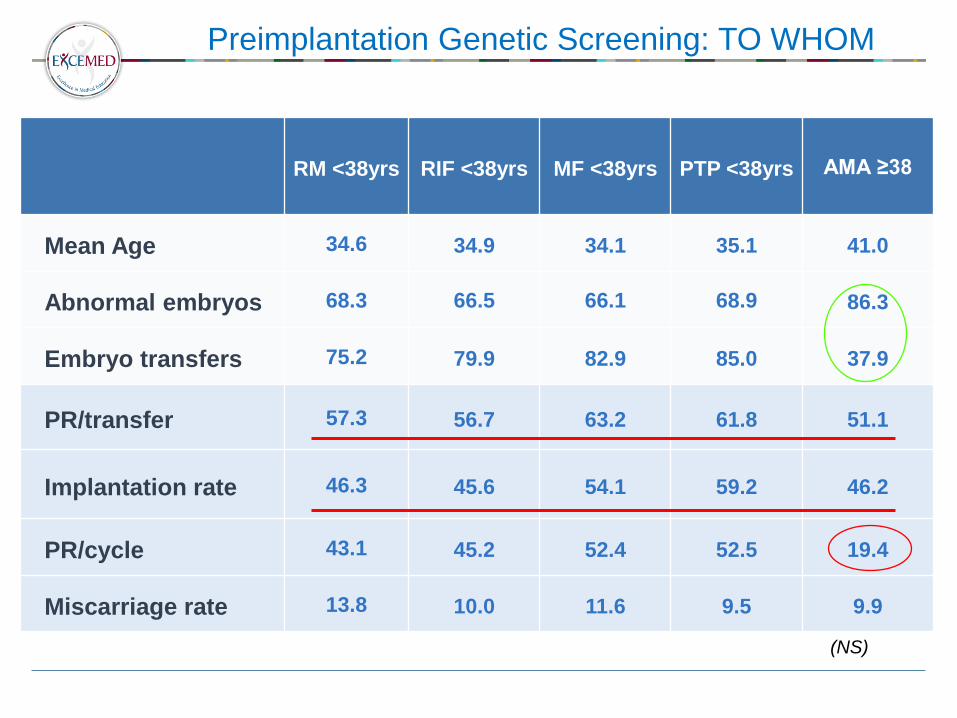
Preimplantation Genetic Screening: TO WHOM
(NS)
RM <38yrs RIF <38yrs MF <38yrs PTP <38yrs AMA ≥38
Mean Age 34.6 34.9 34.1 35.1 41.0
Abnormal embryos 68.3 66.5 66.1 68.9 86.3
Embryo transfers 75.2 79.9 82.9 85.0 37.9
PR/transfer 57.3 56.7 63.2 61.8 51.1
Implantation rate 46.3 45.6 54.1 59.2 46.2
PR/cycle 43.1 45.2 52.4 52.5 19.4
Miscarriage rate 13.8 10.0 11.6 9.5 9.9

Preimplantation Genetic Screening: TO WHOM
0
10
20
30
40
50
60
70
80
90
100
38 (n=267) 39 (n=378) 40 (n=634) 41 (n=732) 42 (n=489) 43 (n=303) 44 (n=171) 45-46 (n=131)
% Abnormal % Transfer PR/transfer IR PR/cycle
Results according to maternal age
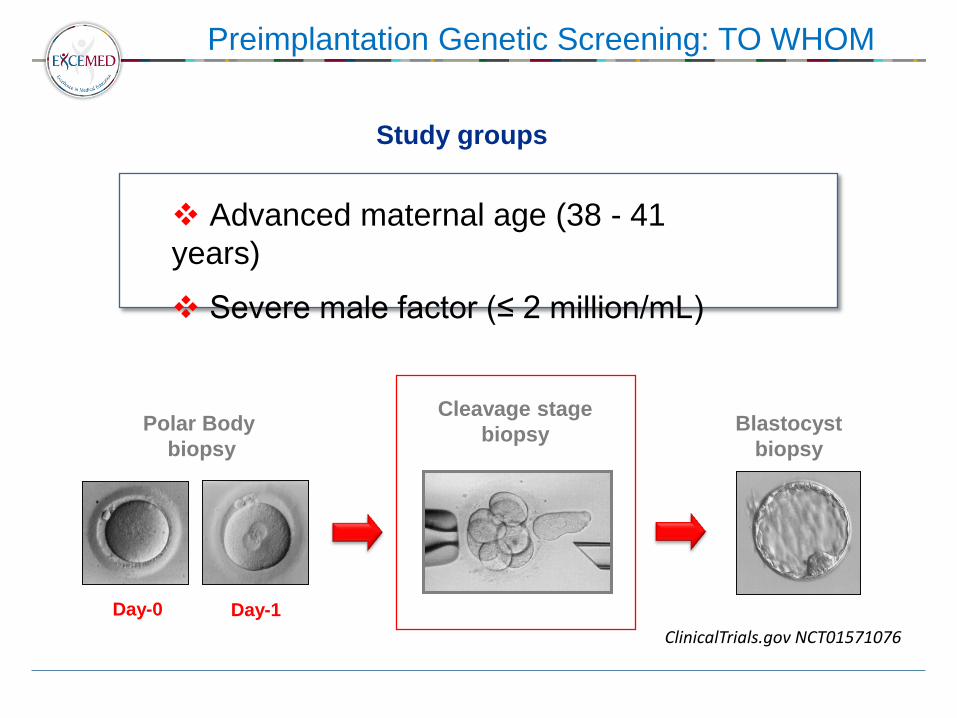
Preimplantation Genetic Screening: TO WHOM
Day-0 Day-1
Polar Body
biopsy
Blastocyst
biopsy
Cleavage stage
biopsy
Advanced maternal age (38 - 41
years)
Severe male factor (≤ 2 million/mL)
Study groups
ClinicalTrials.gov NCT01571076
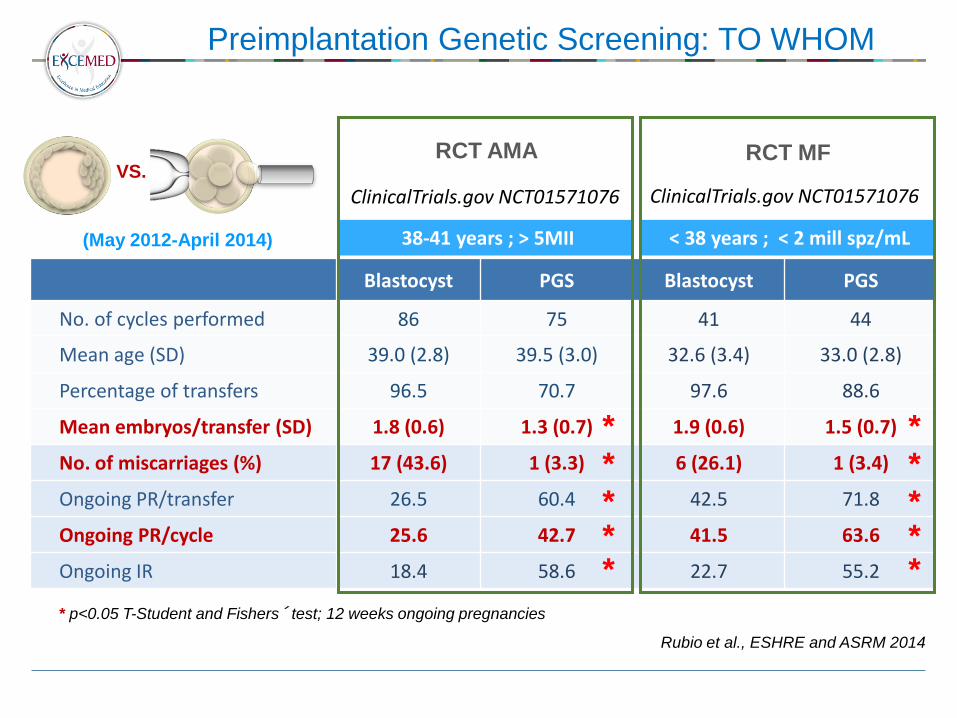
Preimplantation Genetic Screening: TO WHOM
* p<0.05 T-Student and Fishers´ test; 12 weeks ongoing pregnancies
VS. Blastocyst PGS Blastocyst PGS
No. of cycles performed 86 75 41 44
Mean age (SD) 39.0 (2.8) 39.5 (3.0) 32.6 (3.4) 33.0 (2.8)
Percentage of transfers 96.5 70.7 97.6 88.6
Mean embryos/transfer (SD) 1.8 (0.6) 1.3 (0.7) 1.9 (0.6) 1.5 (0.7)
No. of miscarriages (%) 17 (43.6) 1 (3.3) 6 (26.1) 1 (3.4)
Ongoing PR/transfer 26.5 60.4 42.5 71.8
Ongoing PR/cycle 25.6 42.7 41.5 63.6
Ongoing IR 18.4 58.6 22.7 55.2
*
*
* * *
*
*
* * *
< 38 years ; < 2 mill spz/mL 38-41 years ; > 5MII
ClinicalTrials.gov NCT01571076
RCT AMA
ClinicalTrials.gov NCT01571076
RCT MF VS.
(May 2012-April 2014)
Rubio et al., ESHRE and ASRM 2014
Preimplantation Genetic Screening: TO WHOM
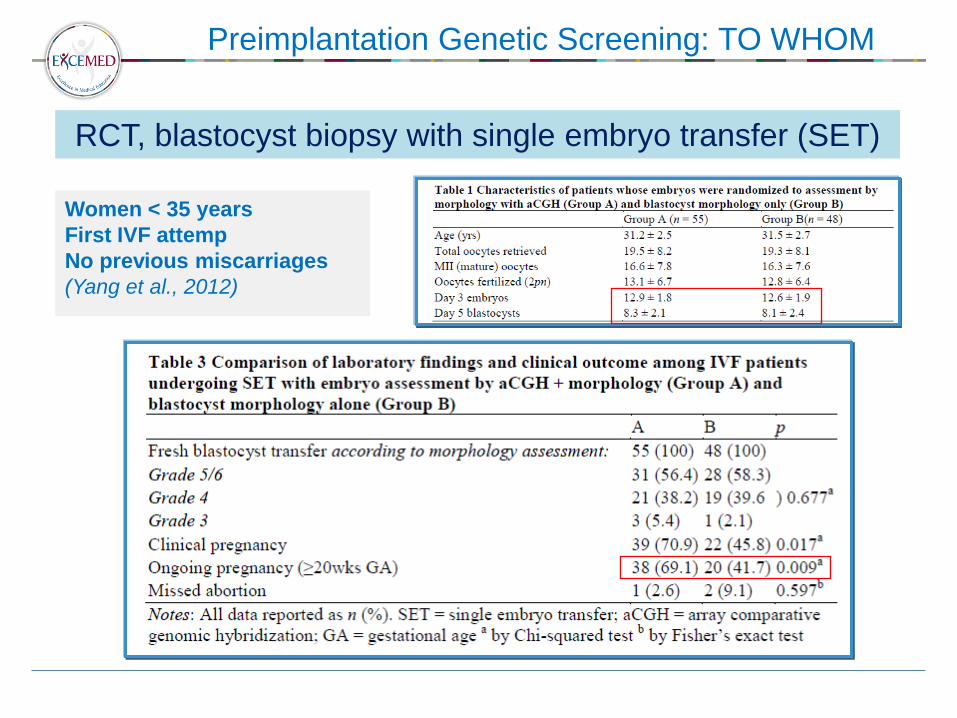
Women < 35 years
First IVF attemp
No previous miscarriages
(Yang et al., 2012)
RCT, blastocyst biopsy with single embryo transfer (SET)
Preimplantation Genetic Screening: TO WHOM
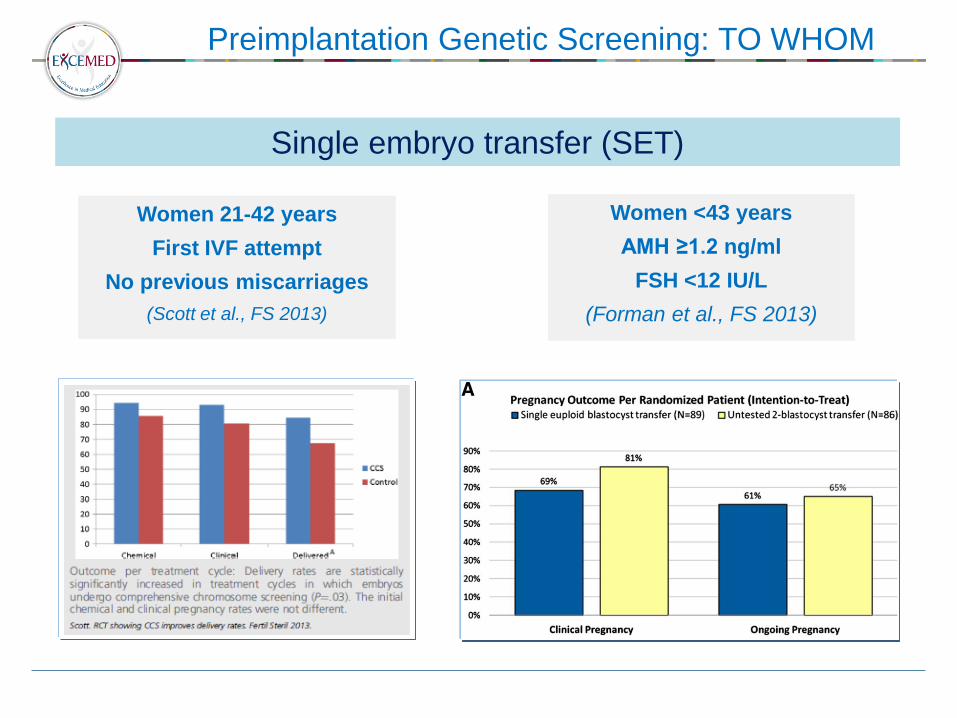
Women 21-42 years
First IVF attempt
No previous miscarriages
(Scott et al., FS 2013)
Women <43 years
AMH ≥1.2 ng/ml
FSH <12 IU/L
(Forman et al., FS 2013)
Single embryo transfer (SET)
Preimplantation Genetic Screening: TO WHOM
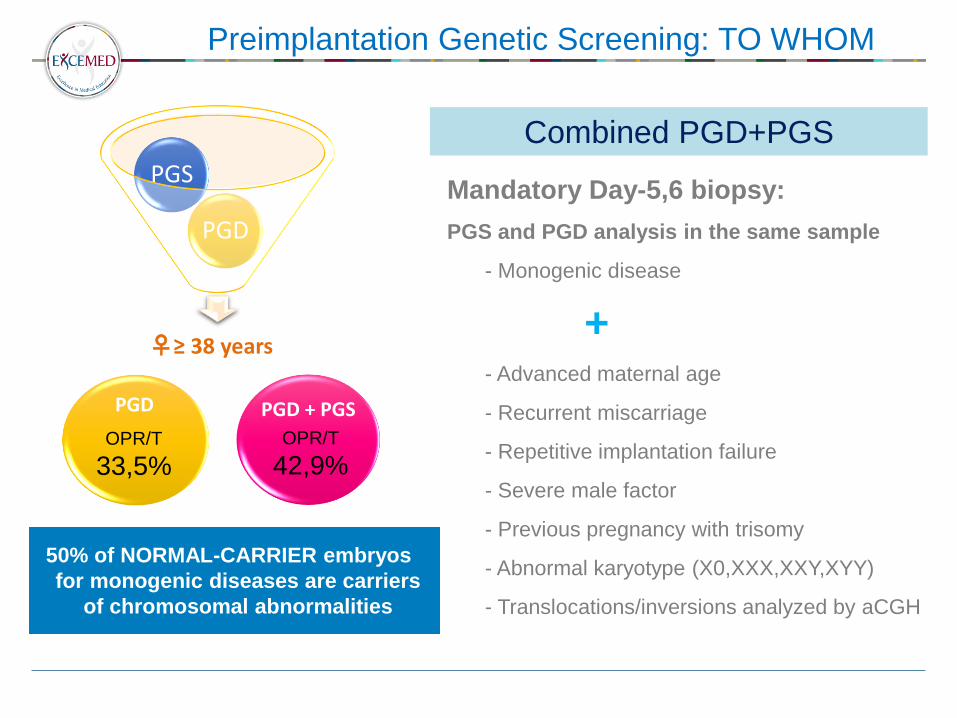
PGD
PGS
Mandatory Day-5,6 biopsy:
PGS and PGD analysis in the same sample
- Monogenic disease
+ - Advanced maternal age
- Recurrent miscarriage
- Repetitive implantation failure
- Severe male factor
- Previous pregnancy with trisomy
- Abnormal karyotype (X0,XXX,XXY,XYY)
- Translocations/inversions analyzed by aCGH
♀≥ 38 years
PGD PGD + PGS
OPR/T
42,9%
50% of NORMAL-CARRIER embryos
for monogenic diseases are carriers
of chromosomal abnormalities
OPR/T
33,5%
Combined PGD+PGS
26
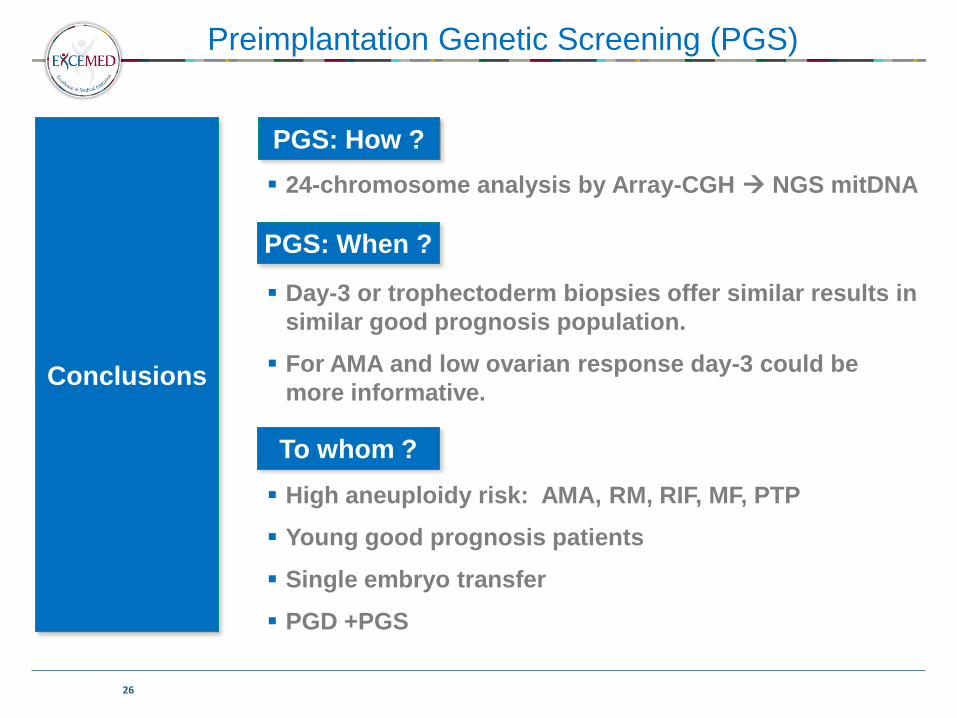
Preimplantation Genetic Screening (PGS)
Conclusions
24-chromosome analysis by Array-CGH NGS mitDNA
PGS: How ?
PGS: When ?
To whom ?
High aneuploidy risk: AMA, RM, RIF, MF, PTP
Young good prognosis patients
Single embryo transfer
PGD +PGS
Day-3 or trophectoderm biopsies offer similar results in
similar good prognosis population.
For AMA and low ovarian response day-3 could be
more informative.
27
Valencia-Spain
Miami-USA
Sao Paulo-Brasil
New Delhi-India
Dubai-UAE