Embed Size (px)
Citation preview

Aviva plc Annual report and accounts 2019 108
Strategic report Governance IFRS financial statements Other information
IFRS financial statements
In this section Independent auditors’ report to the members of Aviva plc 109 Accounting policies 117
Consolidated financial statements
Consolidated income statement 132 Consolidated statement of comprehensive income 133 Reconciliation of Group adjusted operating profit to profit for the year
134
Consolidated statement of changes in equity 136 Consolidated statement of financial position 137 Consolidated statement of cash flows 138
Notes to the consolidated financial statements
1 Changes to comparative amounts 139 2 Exchange rates 141 3 Subsidiaries, joint ventures and associates –
acquisitions 141
4 Subsidiaries, joint ventures and associates – disposals and held for sale
141
5 Segmental information 143 6 Details of income 148 7 Details of expenses 149 8 Finance costs 150 9 Life business investment variances and economic
assumption changes 151
10 Non-life business: short-term fluctuations in return on investments
153
11 Employee information 155 12 Directors 155 13 Auditors’ remuneration 156 14 Tax 157 15 Earnings per share 159 16 Dividends and appropriations 160 17 Goodwill 161 18 Acquired value of in-force business (AVIF) and
intangible assets 163
19 Interests in, and loans to, joint ventures 164 20 Interests in, and loans to, associates 166 21 Property and equipment 167 22 Investment property 168 23 Lease assets and liabilities 168 24 Fair value methodology 170 25 Loans 177 26 Securitised mortgages and related assets 178 27 Interest in structured entities 179 28 Financial investments 181 29 Receivables 184 30 Deferred acquisition costs 185
31 Pension surpluses, other assets, prepayments and accrued income
186
32 Assets held to cover linked liabilities 186 33 Ordinary share capital 187 34 Group’s share plans 188 35 Treasury shares 190 36 Preference share capital 190 37 Direct capital instrument and tier 1 notes 191 38 Merger reserve 192 39 Currency translation and other reserves 192 40 Retained earnings 193 41 Non-controlling interests 193 42 Contract liabilities and associated reinsurance 193 43 Insurance liabilities 195 44 Insurance liabilities methodology and assumptions 200 45 Liability for investment contracts 204 46 Financial guarantees and options 206 47 Reinsurance assets 208 48 Effect of changes in assumptions and estimates
during the year 210
49 Unallocated divisible surplus 211 50 Tax assets and liabilities 212 51 Pension deficits and other provisions 213 52 Pension obligations 214 53 Borrowings 220 54 Payables and other financial liabilities 223 55 Other liabilities 224 56 Contingent liabilities and other risk factors 224 57 Capital commitments 225 58 Group capital management 225 59 Statement of cash flows 227 60 Risk management 228 61 Derivative financial instruments and hedging 241 62 Financial assets and liabilities subject to offsetting,
enforceable master netting arrangements and similar agreements
243
63 Related party transactions 245 64 Organisational structure 246 65 Related undertakings 248 66 Subsequent events 263
Financial statements of the Company
Income statement 264 Statement of comprehensive income 264 Statement of changes in equity 265 Statement of financial position 266 Statement of cash flows 267 Notes to the Company’s financial statements 268

Independent auditors’ report to the members of Aviva plc
1 The maintenance and integrity of the Aviva plc website is the responsibility of the directors; the work carried out by the auditors does not involve consideration of these matters and, accordingly the auditors accept no responsibility for any changes that may have occurred to the full annual financial statements since they were initially presented on the website.
2 Legislation in the United Kingdom governing the preparation and dissemination of financial statements may differ from legislation in other jurisdictions.
Aviva plc Annual report and accounts 2019 109
Strategic report Governance IFRS financial statements Other information
Report on the audit of the financial statements Opinion In our opinion, Aviva plc’s Group financial statements and Company financial statements (the ‘financial statements’): • give a true and fair view of the state of the Group’s and of the Company’s affairs as at 31 December 2019 and of the Group’s and the
Company’s profit and cash flows for the year then ended; • have been properly prepared in accordance with International Financial Reporting Standards (‘IFRS’) as adopted by the European Union;
and • have been prepared in accordance with the requirements of the Companies Act 2006 and, as regards the Group financial statements, Article
4 of the IAS Regulation.
We have audited the financial statements, included within the Annual report and accounts (the “Annual Report”), which comprise: • the Consolidated and Company statements of financial position as at 31 December 2019; • the Consolidated and Company income statements and statements of comprehensive income for the year then ended; • the Reconciliation of Group adjusted operating profit to profit for the year then ended; • the Consolidated and Company statements of cash flows for the year then ended; • the Consolidated and Company statements of changes in equity for the year then ended; • the principal accounting policies adopted in the preparation of the financial statements; and • the notes to the financial statements, which include other explanatory information.
Our opinion is consistent with our reporting to the Audit Committee.
Basis for opinion We conducted our audit in accordance with International Standards on Auditing (UK) (‘ISAs (UK)’) and applicable law. Our responsibilities under ISAs (UK) are further described in the Auditors’ responsibilities for the audit of the financial statements section of our report. We believe that the audit evidence we have obtained is sufficient and appropriate to provide a basis for our opinion.
Independence We remained independent of the Group in accordance with the ethical requirements that are relevant to our audit of the financial statements in the UK, which includes the FRC’s Ethical Standard, as applicable to listed public interest entities, and we have fulfilled our other ethical responsibilities in accordance with these requirements.
To the best of our knowledge and belief, we declare that non-audit services prohibited by the FRC’s Ethical Standard were not provided to the Group or the Company.
Other than those disclosed in note 13 to the financial statements, we have provided no non-audit services to the Group or the Company in the period from 1 January 2019 to 31 December 2019.
Our audit approach Overview • Overall group materiality: £158.0 million (2018: £156 million), based on 5% of Group adjusted operating profit before tax attributable to
shareholders’ profits. • Overall Company materiality: £47.8 million (2018: £105.0 million), based on 5% of Profit for the year before tax. • Based on the output of our risk assessment, along with our understanding of the Aviva Group structure, we performed full scope audits
over the following components; UK Life, UK General Insurance, Canada and France Life. • We identified a further two components, Aviva Investors and Italy Life, where specific account balances were considered to be significant
in size in relation to the Group, and scoped our audit to include detailed testing of those account balances. • We completed review procedures over other components not subject to full scope audits. • We also performed audit procedures over the head office operations and the consolidation process, as well as over certain other group
activities, including specific account balances in the Aviva Employment Services, Aviva Central Services and Aviva Group Holdings components.
• Our risk assessment analysis identified the following as areas of focus for the audit of the financial statements: – Valuation of life insurance contract liabilities; – Valuation of non-life insurance contract liabilities; – Valuation of hard to value investments; and – Valuation of specific UK Life provisions.
• Significant changes in our approach: In our 2019 report the following changes to the key audit matters identified have been made, compared with our 2018 report: – The key audit matter regarding the valuation of a specific UK Life provision has been updated to include an additional provision
identified at UK Life during the period; and – We no longer consider the implementation of a new actuarial modelling system at UK Life to be a key audit matter as its implementation
was a one-off event in the prior year.
The scope of our audit As part of designing our audit, we determined materiality and assessed the risks of material misstatement in the financial statements. In particular, we looked at where the directors made subjective judgements, for example in respect of significant accounting estimates that involved making assumptions and considering future events that are inherently uncertain.

Independent auditors’ report to the members of Aviva plc Continued
Aviva plc Annual report and accounts 2019 110
Strategic report Governance IFRS financial statements Other information
Capability of the audit in detecting irregularities, including fraud Based on our understanding of the Group, Company and their industries, we identified that the principal risks of non-compliance with laws and regulations related to breaches of UK and European regulatory principles, such as those governed by the Prudential Regulation Authority and the Financial Conduct Authority, and we considered the extent to which non-compliance might have a material effect on the financial statements of the Group and Company. We also considered those laws and regulations that have a direct impact on the financial statements of the Group and Company such as the Companies Act 2006, the Listing Rules, the Prudential Regulation Authority’s regulations, the Pensions Regulator legislation, UK tax legislation and equivalent local laws and regulations applicable to in-scope components.
We have also evaluated management’s incentives and opportunities for fraudulent manipulation of the financial statements (including the risk of override of controls) and determined that the principal risks are related to management bias in accounting estimates and judgmental areas of the financial statements as shown in our “Key Audit Matters”.
Audit procedures performed by the engagement team included: • Discussions with the Board, management, internal audit, senior management involved in the Risk and Compliance functions and the Group
and Company’s legal function, including consideration of known or suspected instances of non-compliance with laws and regulation and fraud;
• Evaluation and testing of the operating effectiveness of management’s controls designed to prevent and detect irregularities; • Assessment of matters reported on the Group and Company’s whistleblowing helpline and fraud register and the results of management’s
investigation of such matters; • Reading key correspondence with the Prudential Regulation Authority and the Financial Conduct Authority, including those in relation to
compliance with laws and regulations; • Reviewing relevant meeting minutes including those of the Board of Directors and Audit Committee; • Making enquiries of the Group Investigations team who are responsible for independently investigating suspected or alleged fraudulent
activity across the group, utilising activities including, but not limited to, whistle blowing hotlines and data analytics; • Identifying and testing journal entries based on risk criteria; • Designing audit procedures to incorporate unpredictability around the nature, timing or extent of our testing; and • Testing transactions entered into outside of the normal course of the Group and Company’s business specifically in respect of acquisitions
and disposals.
There are inherent limitations in the audit procedures described above and, the further removed non-compliance with laws and regulations is from the events and transactions reflected in the financial statements, the less likely we would become aware of it. Also, the risk of not detecting a material misstatement due to fraud is higher than the risk of not detecting one resulting from error, as fraud may involve deliberate concealment by, for example, forgery or intentional misrepresentations, or through collusion.
Key audit matters Key audit matters are those matters that, in the auditors’ professional judgement, were of most significance in the audit of the financial statements of the current period and include the most significant assessed risks of material misstatement (whether or not due to fraud) identified by the auditors, including those which had the greatest effect on: the overall audit strategy; the allocation of resources in the audit; and directing the efforts of the engagement team. These matters, and any comments we make on the results of our procedures thereon, were addressed in the context of our audit of the financial statements as a whole, and in forming our opinion thereon, and we do not provide a separate opinion on these matters. This is not a complete list of all risks identified by our audit.
Key audit matter How our audit addressed the key audit matter
Valuation of life insurance contract liabilities (Group) Refer to the Audit Committee report, Accounting policy (L) Insurance and participating investment contract liabilities – Long-term business provisions and note 43 Insurance liabilities (b) Long-term business liabilities.
For UK Life insurance contract liabilities, the Directors’ valuation of the provisions for the settlement of future claims, involves complex and subjective judgements about future events, both internal and external to the business, for which small changes in assumptions can result in material impacts to the valuation of these liabilities.
The work to address the valuation of the life insurance contract liabilities included the following procedures: • We understood the governance process in place to determine the
insurance contract liabilities, including testing the associated financial reporting control framework;
• We tested the design and operating effectiveness of controls over the accuracy and completeness of the data used;
• Using our actuarial specialist team members, we applied our industry knowledge and experience and we compared the methodology, models and assumptions used against recognised actuarial practices;
• We tested the key judgements over the preparation of the liabilities, including manually calculated components. We focused on the consistency in treatment and methodology period-on-period and with reference to recognised actuarial practice;
• We tested key controls which support the calculation of the liabilities; • We used the results of an independent PwC annual benchmarking
survey of assumptions to further challenge the assumption setting process by comparing certain assumptions used relative to the Group’s industry peers; and
• We assessed the disclosures in the financial statements.
Independent auditors’ report to the members of Aviva plc Continued
Aviva plc Annual report and accounts 2019 111
Strategic report Governance IFRS financial statements Other information
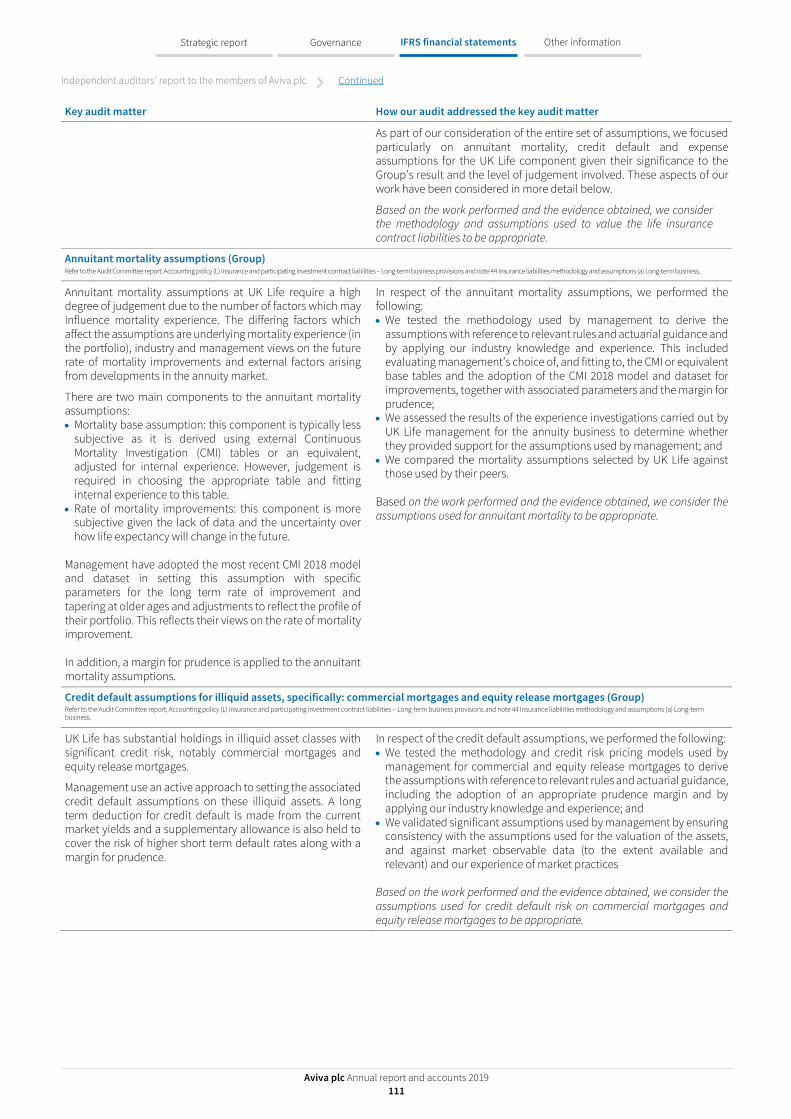
Key audit matter How our audit addressed the key audit matter
As part of our consideration of the entire set of assumptions, we focused particularly on annuitant mortality, credit default and expense assumptions for the UK Life component given their significance to the Group’s result and the level of judgement involved. These aspects of our work have been considered in more detail below.
Based on the work performed and the evidence obtained, we consider the methodology and assumptions used to value the life insurance contract liabilities to be appropriate.
Annuitant mortality assumptions (Group) Refer to the Audit Committee report, Accounting policy (L) Insurance and participating investment contract liabilities – Long-term business provisions and note 44 Insurance liabilities methodology and assumptions (a) Long-term business.
Annuitant mortality assumptions at UK Life require a high degree of judgement due to the number of factors which may influence mortality experience. The differing factors which affect the assumptions are underlying mortality experience (in the portfolio), industry and management views on the future rate of mortality improvements and external factors arising from developments in the annuity market.
There are two main components to the annuitant mortality assumptions: • Mortality base assumption: this component is typically less
subjective as it is derived using external Continuous Mortality Investigation (CMI) tables or an equivalent, adjusted for internal experience. However, judgement is required in choosing the appropriate table and fitting internal experience to this table.
• Rate of mortality improvements: this component is more subjective given the lack of data and the uncertainty over how life expectancy will change in the future.
Management have adopted the most recent CMI 2018 model and dataset in setting this assumption with specific parameters for the long term rate of improvement and tapering at older ages and adjustments to reflect the profile of their portfolio. This reflects their views on the rate of mortality improvement.
In addition, a margin for prudence is applied to the annuitant mortality assumptions.
In respect of the annuitant mortality assumptions, we performed the following: • We tested the methodology used by management to derive the
assumptions with reference to relevant rules and actuarial guidance and by applying our industry knowledge and experience. This included evaluating management’s choice of, and fitting to, the CMI or equivalent base tables and the adoption of the CMI 2018 model and dataset for improvements, together with associated parameters and the margin for prudence;
• We assessed the results of the experience investigations carried out by UK Life management for the annuity business to determine whether they provided support for the assumptions used by management; and
• We compared the mortality assumptions selected by UK Life against those used by their peers.
Based on the work performed and the evidence obtained, we consider the assumptions used for annuitant mortality to be appropriate.
Credit default assumptions for illiquid assets, specifically: commercial mortgages and equity release mortgages (Group) Refer to the Audit Committee report, Accounting policy (L) Insurance and participating investment contract liabilities – Long-term business provisions and note 44 Insurance liabilities methodology and assumptions (a) Long-term business.
UK Life has substantial holdings in illiquid asset classes with significant credit risk, notably commercial mortgages and equity release mortgages.
Management use an active approach to setting the associated credit default assumptions on these illiquid assets. A long term deduction for credit default is made from the current market yields and a supplementary allowance is also held to cover the risk of higher short term default rates along with a margin for prudence.
In respect of the credit default assumptions, we performed the following: • We tested the methodology and credit risk pricing models used by
management for commercial and equity release mortgages to derive the assumptions with reference to relevant rules and actuarial guidance, including the adoption of an appropriate prudence margin and by applying our industry knowledge and experience; and
• We validated significant assumptions used by management by ensuring consistency with the assumptions used for the valuation of the assets, and against market observable data (to the extent available and relevant) and our experience of market practices
Based on the work performed and the evidence obtained, we consider the assumptions used for credit default risk on commercial mortgages and equity release mortgages to be appropriate.

Independent auditors’ report to the members of Aviva plc Continued
Aviva plc Annual report and accounts 2019 112
Strategic report Governance IFRS financial statements Other information
Key audit matter How our audit addressed the key audit matter
Expense assumptions (Group) Refer to the Audit Committee report, Accounting policy (L) Insurance and participating investment contract liabilities – Long-term business provisions and note 44 Insurance liabilities methodology and assumptions (a) Long-term business.
Future maintenance expenses and expense inflation assumptions are used in the measurement of life insurance contract liabilities at UK Life. The assumptions reflect the expected future expenses that will be required to maintain the in-force policies at the balance sheet date, including an allowance for project costs and a margin for prudence. The assumptions used require significant judgement.
In respect of the expense assumptions, we performed the following: • We tested the methodology used by management to derive the
assumptions with reference to relevant rules and actuarial guidance and by applying our industry knowledge and experience. This included testing the split of expenses between acquisition and maintenance by agreeing a sample to supporting evidence;
• We validated significant assumptions used by management, including the margin for prudence and the rate of inflation against past experience, market observable data (to the extent available and relevant) and our experience of market practices; and
• We tested that the assumptions appropriately reflect the expected future expenses for maintaining policies in force at the balance sheet date, which includes consideration of the allowance for project costs.
Based on the work performed and the evidence obtained, we consider the expense assumptions to be appropriate.
Valuation of non-life insurance contract liabilities (Group) Refer to the Audit Committee report, Accounting policy (L) Insurance and participating investment contract liabilities – General insurance and health provisions and note 43 Insurance liabilities methodology and assumptions (c) General insurance and health.
The estimation of non-life insurance contract liabilities involves a significant degree of judgement. The liabilities are based on the estimated ultimate cost of all claims incurred but not settled at 31 December 2019, whether reported or not, together with the related claims handling costs.
A range of methods, including stochastic projections, may be used to determine these provisions. Underlying these methods are a number of explicit or implicit assumptions relating to the expected settlement amount and settlement patterns of claims. This includes assumptions relating to the settlement of personal injury lump sum compensation amounts.
Given their size in relation to the consolidated Group and the complexity of the judgements involved, our work focused on the actuarial liabilities in the UK General Insurance and Canada General Insurance components.
In the UK General Insurance and Canada components, we assessed the calculation of the non-life insurance liabilities by performing the following procedures: • We understood and tested the governance process in place to
determine the insurance contract liabilities, including testing the associated financial reporting control framework;
• We tested the underlying data to source documentation on a sample basis; • Using our actuarial specialist team members, we applied our industry
knowledge and experience and we compared the methodology, models and assumptions used against recognised actuarial practices;
• Using our actuarial specialist team members, we independently estimated the reserves on selected classes of business, particularly focusing on the largest and most uncertain reserves. For these classes we compared our estimated reserves to those booked by management, and sought to understand any significant differences;
• For the remaining classes we evaluated the methodology and assumptions applied, or performed a diagnostic check to identify and investigate any anomalies; and
• We assessed the disclosures in the financial statements.
Based on the work performed and evidence obtained, we consider the methodology and assumptions used to value the non-life insurance contract liabilities to be appropriate.
Valuation for hard to value investments (Group) Refer to Audit Committee report, Accounting policies (F) and (T) and note 24 Fair Value methodology, note 26 Securitised mortgages and related assets and note 28 Financial Investments.
The valuation of the investment portfolio involves judgement and continues to be an area of inherent risk. The risk is not uniform for all investment types and is greatest for the following, where the investments are hard to value because quoted prices are not readily available: • Commercial mortgage loans (UK Life); • Equity release and UK securitised mortgage loans (UK Life); • Collateralised loan obligations and non-recourse loans (UK
Life); and • Structured bond-type investments (France Life).
We assessed the Directors’ approach to valuation for these hard to value investments by performing the following procedures: • We agreed data inputs used in the valuation models to underlying
documentation on a sample basis; • We evaluated the methodology and assumptions used by management,
including yield curves, discounted cash flows, property growth rates, longevity and liquidity premiums as relevant to each asset class;
• We tested the operation of data integrity and change management controls for the valuation models, which we baseline every three years;
• Using our valuation experts, we performed independent valuations for a sample of collateralised loans, non-recourse loans and structured bonds; and
• We assessed the disclosures in the financial statements.
Based on the work performed and the evidence obtained, we consider the methodology and assumptions used by management to value hard to value assets to be appropriate.

Independent auditors’ report to the members of Aviva plc Continued
Aviva plc Annual report and accounts 2019 113
Strategic report Governance IFRS financial statements Other information
Key audit matter How our audit addressed the key audit matter
Valuation of specific UK Life provisions (Group) Refer to Audit Committee report, Accounting policies (AA) and note 51 Pension deficits and other provisions (b) Movements on restructuring and other provisions.
The valuation of product governance provisions involves significant judgement. Given the historic nature of these provisions, information to calculate redress amounts can be limited. There were two material provisions held at the year end at UK Life. The first provision relates to advised sales by Friends Provident. The valuation of this provision involves a high degree of judgement due to the time elapsed since the advice was given. The estimate of the provision could change substantially over time as specific case investigations continue and new information is obtained. The second provision relates to past communications to a specific sub-set of pension policyholders on a product sold between 1985 and 1989 by an entity acquired by the Group through the purchase of Friends Life. Specifically, these policyholders may not have been adequately informed of switching options into with-profit funds that were available to them. The valuation of the provision involves a high degree of judgement and estimation uncertainty due to the dependence on decisions made by customers.
We assessed management's approach to valuation for these provisions by performing the following procedures: • We understood management's approach to identifying product
governance provisions; • We assessed these product governance provisions against the IAS 37
recognition criteria; • We evaluated the methodology and key assumptions used by
management, including the populations of policies affected and the redress factor applied;
• We reviewed material assumptions, tested a sample of customer calculations used to determine the assumptions and agreed inputs in these calculations to supporting documentation; and
• We assessed the adequacy of the disclosure in the financial statements. In respect of the first provision, we also assessed management's approach to valuation of the provision by performing the following procedure: • We assessed the expertise and independence of management's experts.
In respect of the second provision, we also assessed management's approach to valuation of the provision by performing the following procedure: • We used auditors’ experts to assess certain key assumptions to confirm
whether they were based on regulatory expectations. Based on the work performed and the evidence obtained, we consider the valuation of the provisions to be appropriate.
We determined that there were no key audit matters applicable to the Company to communicate in our report.
How we tailored the audit scope We tailored the scope of our audit to ensure that we performed enough work to be able to give an opinion on the financial statements as a whole, taking into account the structure of the Group and the Company, the financial reporting process and controls, and the industries in which they operate.
Using the outputs of our risk assessment, along with our understanding of Aviva, we scoped our audit based on the significance of the results and financial position of individual components relative to the Group result and financial position. In doing so, we also considered qualitative factors and ensured we obtained sufficient coverage across all financial statement line items in the consolidated financial statements. Our scoping provided us with audit coverage of 86% for IFRS profit before tax (2018: 94%) and 79% of Group adjusted operating profit before tax attributable to shareholders’ profits (2018: 80%). We also obtained audit coverage of 83% for Gross Written Premiums (2018: 83%) and 83% for Total Assets (2018: 82%).
The Group’s primary reporting format aggregates individual operating segments into market reporting lines with supplementary information being given by business activity. The IFRS 8 operating segments or ‘markets’ of the Group are United Kingdom (Life and General Insurance), France, Poland, ‘Italy, Ireland, Spain and Other’, Canada, Asia, Aviva Investors and ‘Other group activities’. Individual components that are used in our risk assessment are a more granular subset of the Group’s operating segments. In establishing the overall approach to the Group audit, we determined the type of work that needed to be performed at each of the components by us, as the Group audit team, or auditors of the components within PwC UK or from other PwC network firms operating under our instruction.

Independent auditors’ report to the members of Aviva plc Continued
Aviva plc Annual report and accounts 2019 114
Strategic report Governance IFRS financial statements Other information
As the Group audit team, we determined the level of involvement required at those components to be able to conclude whether sufficient and appropriate audit evidence had been obtained as a basis for our opinion on the consolidated financial statements as a whole. In our role as Group auditors, we exercised oversight of the work performed by auditors of the components including performing the following procedures: • Maintained an active dialogue with reporting component audit teams throughout the year, including holding a workshop for those teams
in London during the planning phase of the audit; • Visited all in-scope components and undertook a detailed review of audit working papers; • Attended meetings with local management; and • Attended Audit Committee meetings for certain in-scope components.
Materiality The scope of our audit was influenced by our application of materiality. We set certain quantitative thresholds for materiality. These, together with qualitative considerations, helped us to determine the scope of our audit and the nature, timing and extent of our audit procedures on the individual financial statement line items and disclosures and in evaluating the effect of misstatements, both individually and in aggregate on the financial statements as a whole.
Based on our professional judgement, we determined materiality for the financial statements as a whole as follows:
Group financial statements Company financial statements
Overall materiality £158.0 million (2018: £156.0 million). £47.8 million (2018: £105.0 million).
How we determined it 5% of Group adjusted operating profit before tax attributable to shareholders’ profits.
5% of Profit for the year before tax.
Rationale for benchmark applied In determining our materiality, we considered financial metrics which we believed to be relevant, and concluded, consistent with the prior year that Group adjusted operating profit before tax attributable to shareholders’ profit was the most relevant benchmark. Group adjusted operating profit presents a longer-term assessment of the performance of the entity which is more in line with the operations and time horizons of an insurer where insurance contracts and customer relationships span over multiple years. We draw attention to Accounting policy (B), which describes amendments made to the definition of this metric during the period. The benchmark we have used has been updated for these amendments.
In determining our materiality, we considered financial metrics which we believed to be relevant, and concluded, consistent with the prior year that profit before tax was the most relevant benchmark as the Company is profit-orientated and users of the financial statements will be focused on this benchmark.
For each component in the scope of our Group audit, we allocated a materiality that is less than our overall Group materiality. The range of materiality allocated across components was between £20 million and £145 million. Certain components were audited to a local statutory audit materiality that was also less than our overall Group materiality.
We agreed with the Audit Committee that we would report to them misstatements identified during our audit above £7 million (Group audit) (2018: £7 million) and £2.4 million (Company audit) (2018: £5.2 million) as well as misstatements below those amounts that, in our view, warranted reporting for qualitative reasons.
Going concern In accordance with ISAs (UK) we report as follows:
Reporting obligation Outcome
We are required to report if we have anything material to add or draw attention to in respect of the directors’ statement in the financial statements about whether the directors considered it appropriate to adopt the going concern basis of accounting in preparing the financial statements and the directors’ identification of any material uncertainties to the Group’s and the Company’s ability to continue as a going concern over a period of at least twelve months from the date of approval of the financial statements.
We have nothing material to add or to draw attention to. However, because not all future events or conditions can be predicted, this statement is not a guarantee as to the Group’s and Company’s ability to continue as a going concern. For example, the terms of the United Kingdom’s withdrawal from the European Union are not clear, and it is difficult to evaluate all of the potential implications on the Group and Company’s business, customers, suppliers and the wider economy.
We are required to report if the directors’ statement relating to Going Concern in accordance with Listing Rule 9.8.6R(3) is materially inconsistent with our knowledge obtained in the audit.
We have nothing to report.

Independent auditors’ report to the members of Aviva plc Continued
Aviva plc Annual report and accounts 2019 115
Strategic report Governance IFRS financial statements Other information
Reporting on other information The other information comprises all of the information in the Annual Report other than the financial statements and our auditors’ report thereon. The directors are responsible for the other information. Our opinion on the financial statements does not cover the other information and, accordingly, we do not express an audit opinion or, except to the extent otherwise explicitly stated in this report, any form of assurance thereon.
In connection with our audit of the financial statements, our responsibility is to read the other information and, in doing so, consider whether the other information is materially inconsistent with the financial statements or our knowledge obtained in the audit, or otherwise appears to be materially misstated. If we identify an apparent material inconsistency or material misstatement, we are required to perform procedures to conclude whether there is a material misstatement of the financial statements or a material misstatement of the other information. If, based on the work we have performed, we conclude that there is a material misstatement of this other information, we are required to report that fact. We have nothing to report based on these responsibilities.
With respect to the Strategic Report and Directors’ and Corporate Governance Report, we also considered whether the disclosures required by the UK Companies Act 2006 have been included.
Based on the responsibilities described above and our work undertaken in the course of the audit, the Companies Act 2006, (CA06), ISAs (UK) and the Listing Rules of the Financial Conduct Authority (FCA) require us also to report certain opinions and matters as described below (required by ISAs (UK) unless otherwise stated).
Strategic report and Directors’ and corporate governance report In our opinion, based on the work undertaken in the course of the audit, the information given in the Strategic report and Directors’ and Corporate Governance Report for the year ended 31 December 2019 is consistent with the financial statements and has been prepared in accordance with applicable legal requirements. (CA06)
In light of the knowledge and understanding of the Group and Company and their environment obtained in the course of the audit, we did not identify any material misstatements in the Strategic report and Directors’ and Corporate Governance Report. (CA06)
The directors’ assessment of the prospects of the Group and of the principal risks that would threaten the solvency or liquidity of the Group We have nothing material to add or draw attention to regarding: • The directors’ confirmation on page 65 of the Annual Report that they have carried out a robust assessment of the principal risks facing the
Group, including those that would threaten its business model, future performance, solvency or liquidity; • The disclosures in the Annual Report that describe those risks and explain how they are being managed or mitigated; and • The directors’ explanation on page 81 of the Annual Report as to how they have assessed the prospects of the Group, over what period they
have done so and why they consider that period to be appropriate, and their statement as to whether they have a reasonable expectation that the Group will be able to continue in operation and meet its liabilities as they fall due over the period of their assessment, including any related disclosures drawing attention to any necessary qualifications or assumptions.
We have nothing to report having performed a review of the directors’ statement that they have carried out a robust assessment of the principal risks facing the Group and statement in relation to the longer-term viability of the Group. Our review was substantially less in scope than an audit and only consisted of making inquiries and considering the directors’ process supporting their statements; checking that the statements are in alignment with the relevant provisions of the UK Corporate Governance Code (the ‘Code’); and considering whether the statements are consistent with the knowledge and understanding of the Group and Company and their environment obtained in the course of the audit. (Listing Rules)
Other Code Provisions We have nothing to report in respect of our responsibility to report when: • The statement given by the directors, on page 82, that they consider the Annual report taken as a whole to be fair, balanced and
understandable, and provides the information necessary for the members to assess the Group’s and the Company’s position and performance, business model and strategy is materially inconsistent with our knowledge of the Group and the Company obtained in the course of performing our audit;
• The section of the Annual report on page 73 describing the work of the Audit Committee does not appropriately address matters communicated by us to the Audit Committee; and
• The directors’ statement relating to the Company’s compliance with the Code does not properly disclose a departure from a relevant provision of the Code specified, under the Listing Rules, for review by the auditors.
Directors’ Remuneration In our opinion, the part of the Directors’ Remuneration Report to be audited has been properly prepared in accordance with the Companies Act 2006. (CA06)
Responsibilities for the financial statements and the audit Responsibilities of the directors for the financial statements As explained more fully in the Directors’ Responsibilities Statement set out on page 82, the directors are responsible for the preparation of the financial statements in accordance with the applicable framework and for being satisfied that they give a true and fair view. The directors are also responsible for such internal control as they determine is necessary to enable the preparation of financial statements that are free from material misstatement, whether due to fraud or error.
In preparing the financial statements, the directors are responsible for assessing the Group’s and the Company’s ability to continue as a going concern, disclosing as applicable, matters related to going concern and using the going concern basis of accounting unless the directors either intend to liquidate the Group or the Company or to cease operations, or have no realistic alternative but to do so.

Independent auditors’ report to the members of Aviva plc Continued
Aviva plc Annual report and accounts 2019 116
Strategic report Governance IFRS financial statements Other information
Auditors’ responsibilities for the audit of the financial statements Our objectives are to obtain reasonable assurance about whether the financial statements as a whole are free from material misstatement, whether due to fraud or error, and to issue an auditors’ report that includes our opinion. Reasonable assurance is a high level of assurance, but is not a guarantee that an audit conducted in accordance with ISAs (UK) will always detect a material misstatement when it exists. Misstatements can arise from fraud or error and are considered material if, individually or in the aggregate, they could reasonably be expected to influence the economic decisions of users taken on the basis of these financial statements.
A further description of our responsibilities for the audit of the financial statements is located on the FRC’s website at: www.frc.org.uk/auditorsresponsibilities. This description forms part of our auditors’ report.
Use of this report This report, including the opinions, has been prepared for and only for the Company’s members as a body in accordance with Chapter 3 of Part 16 of the Companies Act 2006 and for no other purpose. We do not, in giving these opinions, accept or assume responsibility for any other purpose or to any other person to whom this report is shown or into whose hands it may come save where expressly agreed by our prior consent in writing.
Other required reporting Companies Act 2006 exception reporting Under the Companies Act 2006 we are required to report to you if, in our opinion: • we have not received all the information and explanations we require for our audit; or • adequate accounting records have not been kept by the Company, or returns adequate for our audit have not been received from branches
not visited by us; or • certain disclosures of directors’ remuneration specified by law are not made; or • the Company financial statements and the part of the Directors’ Remuneration Report to be audited are not in agreement with the
accounting records and returns.
We have no exceptions to report arising from this responsibility.
Appointment Following the recommendation of the audit committee, we were appointed by the members on 3 May 2012 to audit the financial statements for the year ended 31 December 2012 and subsequent financial periods. The period of total uninterrupted engagement is 8 years, covering the years ended 31 December 2012 to 31 December 2019.
Andrew Kail (Senior Statutory Auditor) for and on behalf of PricewaterhouseCoopers LLP Chartered Accountants and Statutory Auditors London 4 March 2020
1 The maintenance and integrity of the Aviva plc website is the responsibility of the directors; the work carried out by the auditors does not involve consideration of these matters and, accordingly the auditors accept no
responsibility for any changes that may have occurred to the full annual financial statements since they were initially presented on the website. 2 Legislation in the United Kingdom governing the preparation and dissemination of financial statements may differ from legislation in other jurisdictions.

Accounting policies
Aviva plc Annual report and accounts 2019 117
Strategic report Governance IFRS financial statements Other information
Aviva plc (the ‘Company’), a public limited company incorporated and domiciled in the United Kingdom (UK), together with its subsidiaries (collectively, the ‘Group’ or ‘Aviva’) transacts life assurance and long-term savings business, fund management and most classes of general insurance and health business through its subsidiaries, joint ventures, associates and branches in the UK, Ireland, continental Europe, Canada and Asia.
The principal accounting policies adopted in the preparation of these financial statements are set out below. These policies have been consistently applied to all years presented, unless otherwise stated.
(A) Basis of preparation The consolidated financial statements and those of the Company have been prepared and approved by the Directors in accordance with International Financial Reporting Standards (IFRS) as endorsed by the European Union (EU), and those parts of the Companies Act 2006 applicable to those reporting under IFRS. The consolidated financial statements have been prepared under the historical cost convention, as modified by the revaluation of land and buildings, investment property, available-for-sale financial assets, and financial assets and financial liabilities (including derivative instruments) at fair value through profit or loss.
In accordance with IFRS 4 Insurance Contracts, the Group has applied existing accounting practices for insurance and participating investment contracts, modified as appropriate to comply with the IFRS framework and applicable standards. Further details are given in accounting policy L.
Items included in the financial statements of each of the Group’s entities are measured in the currency of the primary economic environment in which that entity operates (the functional currency). The consolidated financial statements are stated in pounds sterling, which is the Company’s functional and presentational currency. Unless otherwise noted, the amounts shown in these financial statements are in millions of pounds sterling (£m). The separate financial statements of the Company are on pages 264 to 273.
Comparative figures have been restated for adjustments as detailed in note 1.
New standards, interpretations and amendments to published standards that have been adopted by the Group and/or the Company The Group and/or the Company has adopted the following amendments to standards which became effective for the annual reporting period beginning on 1 January 2019:
(i) IFRS 16, Leases In January 2016, the IASB published IFRS 16 Leases. This standard replaces IAS 17 Leases and applies to annual reporting periods beginning on or after 1 January 2019. The standard has been endorsed by the EU.
The adoption of IFRS 16 has resulted in an update to the Group’s stated accounting policy for leases. The standard has introduced a definition of a lease with a single lessee accounting model, eliminating the previous classification of either operating or finance leases. Lessees are required to recognise lease assets and liabilities on the statement of financial position for all leases, with the exception of short-term and low-value leases. Further information can be found in accounting policy Z.
The Group has chosen to adopt the modified retrospective approach on transition permitted by IFRS 16. This approach does not require prior period comparatives to be restated, and the impact of adoption of the standard on retained earnings is shown as an adjustment to opening retained earnings. On
transition, and where applicable, the Group has applied the following practical expedients: • Applied a single discount rate to a portfolio of leases with
reasonably similar characteristics; • Relied on existing assessments on whether leases are
onerous as an alternative to performing an impairment review. Where such leases existed, the onerous lease provision held at 31 December 2018 was offset against the initial right-of-use asset at the date of initial application as permitted by IFRS 16;
• Excluded initial direct costs for the measurement of the right-of-use asset at the date of initial application; and
• Used hindsight in determining the lease term where the contract contains options to extend or terminate the lease.
The Group has reviewed existing service and outsourcing contracts to determine whether they are either a lease or contain a lease at the date of initial application. This has not resulted in any additional contracts being recognised as leases in the statement of financial position.
Application of the modified retrospective approach on transition has resulted in a reduction of retained earnings of £110 million at 1 January 2019. This reflects the fact that the right-of-use assets and lease liabilities amortise to nil at different rates over the lease term. A higher initial amortisation of the right-of-use asset compared to the lease liability results in the asset value being lower than the lease liability during the lease term, with the difference between the two generally converging to nil as the lease term ends. There have been corresponding increases in the value of assets (£434 million) and liabilities (£544 million), representing the right-of-use assets and liabilities, net of any tax impacts, not previously recognised on the balance sheet in accordance with IAS 17. There has been no material impact on profit before tax.
The weighted average discount rate applied to the lease liabilities recognised at 1 January 2019 was 2.95%.
Future contractual aggregate minimum lease payments under non-cancellable operating leases, as disclosed in note 56 of the Group’s 2018 annual report and accounts, were £728 million at 31 December 2018. Lease liabilities in respect of operating leases brought on to the balance sheet at 1 January 2019 following the adoption of IFRS 16 were £544 million. The balance shown at 1 January 2019 represents a present value of lease payments, whereas the figure disclosed at 31 December 2018 is the aggregated undiscounted payments. Other differences between the commitments disclosed and the opening IFRS 16 lease liabilities recognised relate primarily to amounts paid under service contracts that were included as a commitment in prior periods, but do not meet the definition of a lease under IFRS 16.
Lessor accounting remains similar to the previous approach set out in IAS 17. The Group’s lessor accounting policies have not changed as a result of the introduction of IFRS 16.
Leased property classified as investment property is held at fair value and measured in accordance with IAS 40 Investment Property. This is consistent with the approach adopted under IAS 17.
The introduction of IFRS 16 has had no impact on the Company’s financial statements.
The following amendments to existing standards and IFRIC interpretations have been issued and endorsed by the EU, are effective from 1 January 2019 or earlier, and do not have an impact on the Group’s consolidated financial statements.

Accounting policies Continued
Aviva plc Annual report and accounts 2019 118
Strategic report Governance IFRS financial statements Other information
(ii) IFRIC 23, Uncertainty over Income Tax Treatments In June 2017, the IASB published IFRIC 23 Uncertainty over Income Tax Treatments. The standard is effective for annual reporting beginning on or after 1 January 2019.
(iii) Amendments to IAS 19 – Plan Amendment, Curtailment or Settlement In February 2018, the IASB published Plan Amendment, Curtailment or Settlement (Amendments to IAS 19). The amendments are effective for annual reporting beginning on or after 1 January 2019.
(iv) Amendments to IAS 28: Long-term Interests in Associates and Joint Ventures In October 2017, the IASB published Long-term Interests in Associates and Joint Ventures (Amendments to IAS 28). The amendments are effective for annual reporting beginning on or after 1 January 2019.
(v) Annual Improvements to IFRS Standards 2015-2017 Cycle These improvements consist of amendments to four IFRSs including IFRS 3 Business Combinations, IFRS 11 Joint Arrangements, IAS 12 Income taxes and IAS 23 Borrowing Costs. The amendments are effective for annual reporting beginning on or after 1 January 2019.
Standards, interpretations and amendments to published standards that are not yet effective and have not been adopted early by the Group The following new standards and amendments to existing standards have been issued, are not yet effective for the Group and have not been adopted early by the Group:
(i) IFRS 17, Insurance Contracts In May 2017, the IASB published IFRS 17 Insurance Contracts, a comprehensive new accounting standard for insurance contracts covering recognition and measurement, presentation and disclosure. Once effective, IFRS 17 will replace IFRS 4 that was issued in 2005. IFRS 17 applies to all types of insurance contracts as well as to certain financial instruments with discretionary participation features. In contrast to the requirements in IFRS 4, which are largely based on grandfathering of previous local accounting policies, IFRS 17 provides a comprehensive and consistent approach to insurance contracts. The core of IFRS 17 is the general model, supplemented by a specific adaption for contracts with direct participation features (the variable fee approach) and a simplified approach (the premium allocation approach) mainly for short-duration contracts.
The main features of the new accounting model for insurance contracts are, as follows: the measurement of the present value of future cash flows incorporating an explicit risk adjustment and remeasured at each reporting period (the fulfilment cash flows); a contractual service margin that is equal and opposite to any day one gain in the fulfilment cash flows of a group of contracts, representing the unearned profit of the insurance contracts to be recognised in profit or loss over the service period (coverage period); the presentation of insurance revenue and insurance service expenses in the statement of comprehensive income based on the concept of insurance services provided during the period; and extensive disclosures to provide information on the recognised amounts from insurance contracts and the nature and extent of risks arising from these contracts.
The impact of the adoption of IFRS 17 significantly impacts the measurement and presentation of the contracts in scope of the standard. Following the publication of an Exposure Draft of proposed amendments to IFRS 17 in June 2019, it is expected
that the standard will apply to annual reporting periods beginning on or after 1 January 2022 at the earliest. The final standard is due to be published mid-2020 and remains subject to endorsement by the EU and the UK. We note the UK’s endorsement procedure, following departure from the EU, remains under development through the transition period to the end of December 2020.
(ii) IFRS 9, Financial Instruments In September 2016, the IASB published amendments to IFRS 4 Insurance Contracts that addressed the accounting consequences of the application of IFRS 9 to insurers prior to implementing IFRS 17. The amendments introduced two options for insurers: the deferral approach and the overlay approach. The deferral approach provides an entity, if eligible, with a temporary exemption from applying IFRS 9. The overlay approach allows an entity to remove from profit or loss the effects of some of the accounting mismatches that may occur before the new insurance contracts standard is applied. The Group has met the eligibility requirements of the deferral approach as set out below and has opted to apply this deferral from 1 January 2018. The Group has however been required to apply the additional disclosure requirements of IFRS 9 which are set out in note 54 and note 60.
Eligibility for the deferral approach was based on an assessment of the Group’s liabilities as at 31 December 2015, in accordance with the date specified in the amendments to IFRS 4. At this date the Group’s liabilities connected with insurance exceeded 90% of the carrying amount of the Group’s total liabilities. The Group’s total liabilities were £369,642 million and liabilities connected with insurance in the statement of financial position at this date primarily included insurance and participating investment contracts within the scope of IFRS 4 (£218,604 million), non-participating investment contract liabilities (£103,125 million), unallocated divisible surplus (£8,811 million), borrowings (£8,770 million), and certain amounts within payables and other financial liabilities which arise in the course of writing insurance business (£10,285 million).
In November 2018 the IASB recommended an amendment to IFRS 17 to defer the effective date to 1 January 2022. At the same time, they recommended an extension to the fixed expiry date for the temporary exemption for insurers from applying IFRS 9 until 1 January 2022. These amendments are subject to IASB’s due process and were included in an exposure draft published in July 2019, with final amendments expected to be published in mid-2020.
The impact of the adoption of IFRS 9 on the Group’s consolidated financial statements will be dependent on the interaction with the new insurance contracts standard, IFRS 17. As such, it is not possible to fully assess the effect of the adoption of IFRS 9. IFRS 9 has been endorsed by the EU.
IFRS 9 incorporates new classification and measurement requirements for financial assets, the introduction of an expected credit loss impairment model which will replace the incurred loss model of IAS 39, and new hedge accounting requirements. Under IFRS 9, all financial assets will be measured at either amortised cost or fair value. The basis of classification will depend on the business model and the contractual cash flow characteristics of the financial assets. The standard retains most of IAS 39’s requirements for financial liabilities except for those designated at fair value through profit or loss whereby that part of the fair value changes attributable to own credit is to be recognised in other comprehensive income instead of the income statement. The hedge accounting requirements are more closely aligned with

Accounting policies Continued
Aviva plc Annual report and accounts 2019 119
Strategic report Governance IFRS financial statements Other information
risk management practices and follow a more principle based approach.
The Company is not eligible to apply the deferral approach and has adopted IFRS 9 from 1 January 2018. IFRS 9 information relating to entities within the Group which have applied IFRS from 1 January 2018 can be found in the entities’ publicly available individual financial statements.
The following new standards and amendments to existing standards have been issued, are not yet effective and are not expected to have a significant impact on the Group’s consolidated financial statements:
(iii) Amendments to References to the Conceptual Framework in IFRS Standards Published by the IASB in March 2018. The amendments are effective for annual reporting beginning on or after 1 January 2020 and were endorsed by the EU on 29 November 2019.
(iv) Amendment to IFRS 3 Business Combinations Published by the IASB in October 2018. The amendments are effective for annual reporting beginning on or after 1 January 2020 and have not yet been endorsed by the EU.
(v) Amendment to IAS 1 and IAS 8: Definition of material Published by the IASB in October 2018. The amendments are effective for annual reporting beginning on or after 1 January 2020 and were endorsed by the EU on 29 November 2019.
(vi) Interest Rate Benchmark Reform: Amendments to IFRS 9, IAS 39 and IFRS 7 Published by the IASB in October 2019. The amendments are effective for annual reporting beginning on or after 1 January 2020 and were endorsed by the EU on 15 January 2020.
(B) Group adjusted operating profit The long-term nature of much of the Group’s operations means that, for management’s decision-making and internal performance management of our operating segments, the Group focuses on Group adjusted operating profit, a non-GAAP alternative performance measure (APM) which is not bound by IFRS. The APM incorporates the expected return on investments which supports its long-term and non-long-term businesses.
Group adjusted operating profit for long-term business is based on expected investment returns on financial investments backing shareholder and policyholder funds over the reporting period, with allowance for the corresponding expected movements in liabilities. Variances between actual and expected investment returns, and the impact of changes in economic assumptions on liabilities, are disclosed separately outside Group adjusted operating profit. For non-long-term business, the total investment income, including realised and unrealised gains, is analysed between that calculated using a longer-term return and short-term fluctuations from that level. The exclusion of short-term realised and unrealised investment gains and losses from the Group adjusted operating profit APM reflects the long-term nature of much of our business and presents separately the operating profit APM which is used in managing the performance of our operating segments from the impact of economic factors. Further details of this analysis and the assumptions used are given in notes 9 and 10.
Group adjusted operating profit excludes impairment of goodwill, associates and joint ventures; amortisation and impairment of intangibles acquired in business combinations; amortisation and impairment of acquired value of in-force business; and the profit or loss on disposal and remeasurement of subsidiaries, joint ventures and associates. These items principally relate to mergers and acquisition activity which we view as strategic in nature, hence they are excluded from the operating profit APM as this is principally used to manage the performance of our operating segments when reporting to the Group’s chief operating decision maker. For 2019, the Group adjusted operating profit APM has been amended and now excludes only the amortisation and impairment of intangible assets acquired in business combinations. Group adjusted operating profit now includes amortisation and impairment of internally generated intangible assets to provide more relevant information by better reflecting their operational nature. These assets include advisor platforms, digital distribution channels and claims and policy administration systems which are used to support operational activities. The 2018 comparative figures have been restated (see note 1(b)).
In addition, integration and restructuring costs are now included in Group adjusted operating profit. There is no impact on 2018 comparative figures.
Group adjusted operating profit also excludes other items, which are those items that, in the Directors’ view, are required to be separately disclosed by virtue of their nature or incidence to enable a full understanding of the Group’s financial performance. Details of these items, including an explanation of the rationale for their exclusion, are provided in the Alternative Performance Measures section within ‘Other information’.
The Group adjusted operating profit APM should be viewed as complementary to IFRS GAAP measures. It is important to consider Group adjusted operating profit and profit before tax together to understand the performance of the business in the period.
(C) Critical accounting policies and the use of estimates Critical accounting policies The preparation of financial statements requires the Group to select accounting policies and make estimates and assumptions that affect items reported in the consolidated income statement, consolidated statement of financial position, other primary statements and notes to the consolidated financial statements.
The Audit Committee reviews the reasonableness of judgements and assumptions applied and the appropriateness of significant accounting policies. The significant issues considered by the Committee in the year are included within the Audit Committee Report on page 72.

Accounting policies Continued
Aviva plc Annual report and accounts 2019 120
Strategic report Governance IFRS financial statements Other information
The following accounting policies are those that have the most significant impact on the amounts recognised in the financial statements, with those judgements involving estimation summarised thereafter.
Item Critical accounting judgement Accounting policy
Consolidation Assessment of whether the Group controls the underlying entities including consideration of its decision making authority and rights to the variable returns from the entity. As part of this assessment Aviva applies a corridor approach to consolidation thresholds, where the Group’s percentage ownership in certain investment vehicles fluctuates daily.
D
Insurance and participating investment contract liabilities
Assessment of the significance of insurance risk transferred to the Group in determining whether a contract should be accounted for as insurance or investment contract. Insurance contracts are defined as those containing significant insurance risk if, and only if, an insured event could cause an insurer to make significant additional payments in any scenario, excluding scenarios that lack commercial substance, at the inception of the contract.
G
Financial investments
Classification of investments including the application of the fair value option. The Group classifies its investments as either FVTPL or AFS. The classification depends on the purpose for which the investments were acquired and is determined by local management at initial recognition.
T
All estimates are based on management’s knowledge of current facts and circumstances, assumptions based on that knowledge and their predictions of future events and actions. Actual results may differ from those estimates, possibly significantly.
The table below sets out those items considered particularly susceptible to changes in estimates and assumptions, that have a significant risk of resulting in a material adjustment to the carrying amounts of assets and liabilities within the next financial year, and the relevant accounting policy and note disclosures.
Item Critical accounting estimates Accounting
policy Note
Measurement of insurance and participating investment contract liabilities
Principal assumptions used in the calculation of life insurance and participating investment contract liabilities include those in respect of annuitant mortality, expenses, valuation interest rates and credit default allowances on corporate bonds and other non-sovereign credit assets. Principal assumptions used in the calculation of general insurance and health liabilities include the discount rates used in determining our latent claim and structured settlements liabilities, and the assumption that past claims experience can be used as a basis to project future claims (estimated using a range of standard actuarial claims projection techniques).
L 44(a)
44(b)
Fair value of financial instruments and
Where quoted market prices are not available, valuation techniques are used to value financial instruments and investment property. These
F,T,U 24(g)
Item Critical accounting estimates Accounting
policy Note
investment property
include broker quotes and models using both observable and unobservable market inputs. The valuation techniques involve judgement with regard to the valuation models used and the inputs to these models can lead to a range of plausible valuations for financial investments.
Valuation of two specific UK Life provisions
UK Life hold provisions relating to two historical product governance issues. The amount of the provision is determined based on the Group’s estimation of the expenditure required to settle the obligation at the statement of financial position date. The valuation of the provisions involves a high degree of judgement and estimation uncertainty due to either the time that has elapsed since the customer contracts were incepted or due to the dependence on decisions made by customers.
AA 51(b)
During the year management reassessed the critical estimates previously provided and, based on their assessment of qualitative and quantitative risk factors, resolved that amortisation and impairment of acquired value of in-force business (AVIF) and deferred acquisition costs (DAC) were no longer critical estimates in the context of the Group results.
(D) Consolidation principles Subsidiaries Subsidiaries are those entities over which the Group has control. The Group controls an investee, if and only if, the Group has all of the following: • power over the investee, • exposure, or rights, to variable returns from its involvement with
the investee, and • the ability to use its power over the investee to affect its returns.
The Group considers all relevant facts and circumstances in assessing whether it has power over an investee, including: the purpose and design of an investee, relevant activities, substantive and protective rights, and voting rights and potential voting rights.
The Group reassesses whether or not it controls an investee if facts and circumstances indicate that there are changes to one or more of the three elements of control.
Investment vehicles In several countries, the Group has invested in a number of specialised investment vehicles such as Open-ended Investment Companies (OEICs) and unit trusts. These invest mainly in equities, bonds, cash and cash equivalents, and properties, and distribute most of their income. In determining whether the Group controls such vehicles, primary considerations include whether the Group is acting as a principal or an agent (including an assessment of the substantive removal rights of third parties) and the variability in the returns associated with the Group’s aggregate economic interest in the fund (direct interest and expected management fees) relative to the total variability of returns.
Additionally, the Group’s percentage ownership in these vehicles can fluctuate on a daily basis according to the level of participation of the Group and third-parties. To avoid transitory or minor changes in fund holdings (which do not reflect the wider facts and circumstances of the Group’s involvement) resulting in binary changes in the consolidation conclusions, the Group takes into account the trend of

Accounting policies Continued
Aviva plc Annual report and accounts 2019 121
Strategic report Governance IFRS financial statements Other information
ownership over a period of time. This is performed in line with the following principles: • Where the entity is managed by a Group asset manager, and the
Group’s ownership holding in the entity exceeds 40 per cent, the Group is judged to have control over the entity;
• Where the entity is managed by a Group asset manager, and the Group’s ownership holding in the entity is between 30 per cent and 40 per cent, the facts and circumstances of the Group’s involvement in the entity are considered, in forming a judgement as to whether the Group has control over the entity. Considerations include the rights held by other parties, the Group’s rights to fees from the entity, the variability in the returns associated with the Group’s aggregate economic interest in the fund and the nature of the Group’s exposure to variability compared with that of other investors;
• Where the entity is managed by a Group asset manager, and the Group’s ownership holding in the entity is less than 30 per cent, the Group is judged to not have control over the entity.
Where the Group is deemed to control such vehicles, they are consolidated, with the interests of parties other than Aviva being classified as liabilities. These appear as ‘Net asset value attributable to unitholders’ in the consolidated statement of financial position.
Where the Group does not control such vehicles, and these investments are held by its insurance or investment funds, they are carried at fair value through profit or loss within financial investments in the consolidated statement of financial position, in accordance with IAS 39 Financial Instruments: Recognition and Measurement.
As part of their investment strategy, long-term business policyholder funds have invested in a number of property limited partnerships (PLPs), either directly or via property unit trusts (PUTs), through a mix of capital and loans. The PLPs are managed by general partners (GPs), in which the long-term business shareholder companies hold equity stakes and which themselves hold nominal stakes in the PLPs. The PUTs are managed by a Group subsidiary.
Accounting for the PUTs and PLPs as subsidiaries, joint ventures, associates or other financial investments depends on whether the Group is deemed to have control or joint control over the PUTs and PLPs’ shareholdings in the GPs and the terms of each partnership agreement are considered along with other factors that determine control, as outlined above. Where the Group exerts control over a PUT or a PLP, it has been treated as a subsidiary and its results, assets and liabilities have been consolidated. Where the partnership is managed by an agreement such that there is joint control between the parties, notwithstanding that the Group’s partnership share in the PLP (including its indirect stake via the relevant PUT and GP) may be lower or higher than 50%, such PUTs and PLPs have been classified as joint ventures (see below). Where the Group has significant influence over the PUT or PLP, as defined in the following section, the PUT or PLP is classified as an associate. Where the Group holds non-controlling interests in PLPs, with no significant influence or control over their associated GPs, the relevant investments are carried at fair value through profit or loss within financial investments.
Consolidation procedure Subsidiaries are consolidated from the date the Group obtains control and are excluded from consolidation from the date the Group loses control. All intercompany transactions, balances and unrealised surpluses and deficits on transactions between Group companies have been eliminated. Accounting policies of subsidiaries are aligned on acquisition to ensure consistency with Group policies.
The Group is required to use the acquisition method of accounting for business combinations. Under this method, the Group recognises identifiable assets, liabilities and contingent liabilities at fair value, and any non-controlling interest in the acquiree. For each business
combination, the Group has the option to measure the non-controlling interest in the acquiree either at fair value or at the proportionate share of the acquiree’s identifiable net assets. The excess of the consideration transferred over the fair value of the net assets of the subsidiary acquired is recorded as goodwill (see accounting policy O below). Acquisition-related costs are expensed as incurred.
Transactions with non-controlling interests that lead to changes in the ownership interests in a subsidiary but do not result in a loss of control are treated as equity transactions.
Merger accounting and the merger reserve Prior to 1 January 2004, the date of first time adoption of IFRS, certain significant business combinations were accounted for using the ‘pooling of interests method’ (or merger accounting), which treats the merged groups as if they had been combined throughout the current and comparative accounting periods. Merger accounting principles for these combinations gave rise to a merger reserve in the consolidated statement of financial position, being the difference between the nominal value of new shares issued by the Parent Company for the acquisition of the shares of the subsidiary and the subsidiary’s own share capital and share premium account. These transactions have not been restated, as permitted by the IFRS 1 transitional arrangements.
The merger reserve is also used where more than 90% of the shares in a subsidiary are acquired and the consideration includes the issue of new shares by the Company, thereby attracting merger relief under the Companies Act 1985 and, from 1 October 2009, the Companies Act 2006.
Associates and joint ventures Associates are entities over which the Group has significant influence. Significant influence is the power to participate in the financial and operating policy decisions of the investee, but is not control or joint control. Generally, it is presumed that the Group has significant influence if it has between 20% and 50% of voting rights. Joint ventures are joint arrangements whereby the Group and other parties that have joint control of the arrangement have rights to the net assets of the joint venture. Joint control is the contractually agreed sharing of control of an arrangement, which exists only when decisions about the relevant activities require unanimous consent of the parties sharing control. In a number of these, the Group’s share of the underlying assets and liabilities may be greater or less than 50% but the terms of the relevant agreements make it clear that control is not exercised. Such jointly controlled entities are referred to as joint ventures in these financial statements.
Gains on transactions between the Group and its associates and joint ventures are eliminated to the extent of the Group’s interest in the associates and joint ventures. Losses are also eliminated, unless the transaction provides evidence of an impairment of the asset transferred between entities.
Other than investments in investment vehicles which are carried at fair value through profit or loss, investments in associates and joint ventures are accounted for using the equity method of accounting. Under this method, the cost of the investment in a given associate or joint venture, together with the Group’s share of that entity’s post-acquisition changes to shareholders’ funds, is included as an asset in the consolidated statement of financial position. As explained in accounting policy O, the cost includes goodwill recognised on acquisition. The Group’s share of their post-acquisition profit or losses is recognised in the income statement and its share of post-acquisition movements in reserves is recognised in reserves. Equity accounting is discontinued when the Group no longer has significant influence or joint control over the investment.

Accounting policies Continued
Aviva plc Annual report and accounts 2019 122
Strategic report Governance IFRS financial statements Other information
If the Group’s share of losses in an associate or joint venture equals or exceeds its interest in the undertaking, the Group does not recognise further losses unless it has incurred obligations or made payments on behalf of the entity.
The Company’s investments In the Company’s statement of financial position, subsidiaries, associates and joint ventures are stated at cost less impairment. Investments are reviewed annually to test whether any indicators of impairment exist. Where there is objective evidence of such an asset being impaired the investment is impaired to its recoverable value and any unrealised loss is recorded in the income statement.
(E) Foreign currency translation Income statements and cash flows of foreign entities are translated into the Group’s presentation currency at average exchange rates for the year while their statements of financial position are translated at the year-end exchange rates. Exchange differences arising from the translation of the net investment in foreign subsidiaries, associates and joint ventures, and of borrowings and other currency instruments designated as hedges of such investments, are recognised in other comprehensive income and taken to the currency translation reserve within equity. On disposal of a foreign entity, such exchange differences are transferred out of this reserve and are recognised in the income statement as part of the gain or loss on sale. The cumulative translation differences were deemed to be zero at the transition date to IFRS.
Foreign currency transactions are accounted for at the exchange rates prevailing at the date of the transactions. Gains and losses resulting from the settlement of such transactions, and from the translation of monetary assets and liabilities denominated in foreign currencies, are recognised in the income statement.
Translation differences on debt securities and other monetary financial assets measured at fair value and designated as held at fair value through profit or loss (FVTPL) (see accounting policy T) are included in foreign exchange gains and losses in the income statement. For monetary financial assets designated as available for sale (AFS), translation differences are calculated as if they were carried at amortised cost and so are recognised in the income statement, while foreign exchange differences arising from fair value gains and losses are recognised in other comprehensive income and included in the investment valuation reserve within equity. Translation differences on non-monetary items, such as equities which are designated as FVTPL, are reported as part of the fair value gain or loss, whereas such differences on AFS equities are included in the investment valuation reserve.
(F) Fair value measurement Fair value is the price that would be received to sell an asset or paid to transfer a liability in an orderly transaction between market participants at the measurement date, regardless of whether that price is directly observable or estimated using another valuation technique. This presumes that the transaction takes place in the principal (or most advantageous) market under current market conditions. Fair value is a market-based measure and in the absence of observable market prices in an active market, it is measured using the assumptions that market participants would use when pricing the asset or liability.
The fair value of a non-financial asset is determined based on its highest and best use from a market participant’s perspective. When using this approach, the Group takes into account the asset’s use that is physically possible, legally permissible and financially feasible.
The best evidence of the fair value of a financial instrument at initial recognition is normally the transaction price i.e. the fair value of the
consideration given or received. In certain circumstances, the fair value at initial recognition may differ from the transaction price. If the fair value is evidenced by comparison with other observable current market transactions in the same instrument (i.e. without modification or repackaging), or is based on a valuation technique whose variables include only data from observable markets, then the difference between the fair value at initial recognition and the transaction price is recognised as a gain or loss in the income statement. When unobservable market data has a significant impact on the valuation of financial instruments, the difference between the fair value at initial recognition and the transaction price is not recognised immediately in the income statement, but deferred and recognised in the income statement on an appropriate basis over the life of the instrument but no later than when the valuation is supported wholly by observable market data or the transaction is closed out or otherwise matured.
If an asset or a liability measured at fair value has a bid price and an ask price, the price within the bid-ask spread that is most representative of fair value in the circumstances is used to measure fair value.
(G) Product classification Insurance contracts are defined as those containing significant insurance risk if, and only if, an insured event could cause an insurer to make significant additional payments in any scenario, excluding scenarios that lack commercial substance, at the inception of the contract. Such contracts remain insurance contracts until all rights and obligations are extinguished or expire. Contracts can be reclassified as insurance contracts after inception if insurance risk becomes significant. Any contracts not considered to be insurance contracts under IFRS are classified as investment contracts. Some insurance and investment contracts contain a discretionary participation feature, which is a contractual right to receive additional benefits as a supplement to guaranteed benefits. These are referred to as participating contracts.
As noted in accounting policy A, insurance contracts and participating investment contracts in general continue to be measured and accounted for under existing accounting practices at the later of the date of transition to IFRS (‘grandfathered’) or the date of the acquisition of the entity, in accordance with IFRS 4. IFRS accounting for insurance contracts in UK companies was grandfathered at the date of transition to IFRS and determined in accordance with the Statement of Recommended Practice issued by the Association of British Insurers (subsequently withdrawn by the ABI in 2015).
In certain businesses, the accounting policies or accounting estimates have been changed, as permitted by IFRS 4 and IAS 8 respectively, to remeasure designated insurance liabilities to reflect current market interest rates and changes to regulatory capital requirements. When accounting policies or accounting estimates have been changed, and adjustments to the measurement basis have occurred, the financial statements of that year will have disclosed the impacts accordingly. One such example is our adoption of Financial Reporting Standard 27 Life Assurance (FRS 27) which was issued by the UK’s Accounting Standards Board (ASB) in December 2004 (subsequently withdrawn by the ASB in 2015).
(H) Premiums earned Premiums on long-term insurance contracts and participating investment contracts are recognised as income when receivable, except for investment-linked premiums which are accounted for when the corresponding liabilities are recognised. For single premium business, this is the date from which the policy is effective. For regular premium contracts, receivables are recognised at the date when payments are due. Premiums are shown before deduction of commission and before any sales-based taxes or duties. Where

Accounting policies Continued
Aviva plc Annual report and accounts 2019 123
Strategic report Governance IFRS financial statements Other information
policies lapse due to non-receipt of premiums, then all the related premium income accrued but not received from the date they are deemed to have lapsed is offset against premiums.
General insurance and health premiums written reflect business incepted during the year, and exclude any sales-based taxes or duties. Unearned premiums are those proportions of the premiums written in a year that relate to periods of risk after the statement of financial position date. Unearned premiums are calculated on either a daily or monthly pro rata basis. Premiums collected by intermediaries, but not yet received, are assessed based on estimates from underwriting or past experience, and are included in premiums written.
Deposits collected under investment contracts without a discretionary participation feature (non-participating contracts) are not accounted for through the income statement, except for the fee income (covered in accounting policy I) and the investment income attributable to those contracts, but are accounted for directly through the statement of financial position as an adjustment to the investment contract liability.
(I) Other investment contract fee revenue Investment contract policyholders are charged fees for policy administration, investment management, surrenders or other contract services. The fees may be for fixed amounts or vary with the amounts being managed, and will generally be charged as an adjustment to the policyholder’s balance. Fees related to investment management services are recognised as revenue over time, as performance obligations are satisfied. In most cases this revenue is recognised in the same period in which the fees are charged to the policyholder. Fees that are related to services to be provided in future periods are deferred and recognised when the performance obligation is fulfilled. Variable consideration, such as performance fees and commission subject to clawback arrangements, is not recognised as revenue until it is reasonably certain that no significant reversal of amounts recognised would occur.
Initiation and other ‘front-end’ fees (fees that are assessed against the policyholder balance as consideration for origination of the contract) are charged on some non-participating investment and investment fund management contracts. Where the investment contract is recorded at amortised cost, these fees are deferred and recognised over the expected term of the policy by an adjustment to the effective yield. Where the investment contract is measured at fair value, the front-end fees that relate to the provision of investment management services are deferred and recognised as the services are provided. Origination fees are recognised immediately where the sale of fund interests represent a separate performance obligation.
(J) Other fee and commission income Other fee and commission income consists primarily of fund management fees, distribution fees from mutual funds, commissions on reinsurance ceded, commission revenue from the sale of mutual fund shares and transfer agent fees for shareholder record keeping. Reinsurance commissions receivable are deferred in the same way as acquisition costs, as described in accounting policy X. All other fee and commission income is recognised over time as the services are provided.
(K) Net investment income Investment income consists of dividends, interest and rents receivable for the year, movements in amortised cost on debt securities, realised gains and losses, and unrealised gains and losses on FVTPL investments (as defined in accounting policy T). Dividends on equity securities are recorded as revenue on the ex-dividend date. Interest income is recognised as it accrues, taking into account the effective yield on the investment. It includes the interest rate differential on forward foreign exchange contracts. Rental income is
recognised on an accruals basis, and is recognised on a straight line basis unless there is compelling evidence that benefits do not accrue evenly over the period of the lease.
A gain or loss on a financial investment is only realised on disposal or transfer, and is the difference between the proceeds received, net of transaction costs, and its original cost or amortised cost, as appropriate.
Unrealised gains and losses, arising on investments which have not been derecognised as a result of disposal or transfer, represent the difference between the carrying value at the year end and the carrying value at the previous year end or purchase value during the year, less the reversal of previously recognised unrealised gains and losses in respect of disposals made during the year. Realised gains or losses on investment property represent the difference between the net disposal proceeds and the carrying amount of the property.
(L) Insurance and participating investment contract liabilities Claims Long-term business claims reflect the cost of all claims arising during the year, including claims handling costs, as well as policyholder bonuses accrued in anticipation of bonus declarations.
General insurance and health claims incurred include all losses occurring during the year, whether reported or not, related handling costs, a reduction for the value of salvage and other recoveries, and any adjustments to claims outstanding from previous years.
Claims handling costs include internal and external costs incurred in connection with the negotiation and settlement of claims. Internal costs include all direct expenses of the claims department and any part of the general administrative costs directly attributable to the claims function.
Long-term business provisions Under current IFRS requirements, insurance and participating investment contract liabilities are measured using accounting policies consistent with those adopted previously under existing accounting practices, with the exception of liabilities remeasured to reflect current market interest rates to be consistent with the value of the backing assets, and those relating to UK with-profits and non-profit contracts.
The long-term business provisions are calculated separately for each life operation, based either on local regulatory requirements or existing local GAAP (at the later of the date of transition to IFRS or the date of the acquisition of the entity); and actuarial principles consistent with those applied in each local market. Each calculation represents a determination within a range of possible outcomes, where the assumptions used in the calculations depend on the circumstances prevailing in each life operation. The principal assumptions are disclosed in note 43(a). For the UK with-profits funds, FRS 27 required liabilities to be calculated on the realistic basis adjusted to remove the shareholders’ share of future bonuses. FRS 27 was grandfathered from UK regulatory requirements prior to the adoption of Solvency II. For UK non-profit insurance contracts, the liabilities are calculated using the gross premium valuation method. This method uses the amount of contractual premiums payable and includes explicit assumptions for interest and discount rates, mortality and morbidity, persistency and future expenses. These assumptions are set on a prudent basis and can vary by contract type and reflect current and expected future experience. These estimates depend upon the outcome of future events and may need to be revised as circumstances change. The liabilities are based on the UK regulatory requirements prior to the adoption of Solvency II, adjusted to remove certain regulatory reserves and margins in assumptions, notably for annuity business.

Accounting policies Continued
Aviva plc Annual report and accounts 2019 124
Strategic report Governance IFRS financial statements Other information
Unallocated divisible surplus In certain participating long-term insurance and investment business, the nature of the policy benefits is such that the division between shareholder reserves and policyholder liabilities is uncertain. Amounts whose allocation to either policyholders or shareholders has not been determined by the end of the financial year are held within liabilities as an unallocated divisible surplus.
If the aggregate carrying value of liabilities for a particular participating business fund is in excess of the aggregate carrying value of its assets, then the difference is held as a negative unallocated divisible surplus balance, subject to recoverability from margins in that fund’s participating business. Any excess of this difference over the recoverable amount is charged to net income in the reporting period.
Embedded derivatives Embedded derivatives that meet the definition of an insurance contract or correspond to options to surrender insurance contracts for a set amount (or based on a fixed amount and an interest rate) are not separately measured. All other embedded derivatives are separated and measured at fair value if they are not considered closely related to the host insurance contract or do not meet the definition of an insurance contract. Fair value reflects own credit risk to the extent the embedded derivative is not fully collateralised.
Liability adequacy At each reporting date, an assessment is made of whether the recognised long-term business provisions are adequate, using current estimates of future cash flows. If that assessment shows that the carrying amount of the liabilities (less related assets) is insufficient in light of the estimated future cash flows, the deficiency is recognised in the income statement by setting up an additional provision in the statement of financial position.
General insurance and health provisions Outstanding claims provisions General insurance and health outstanding claims provisions are based on the estimated ultimate cost of all claims incurred but not settled at the statement of financial position date, whether reported or not, together with related claims handling costs. Significant delays are experienced in the notification and settlement of certain types of general insurance claims, particularly in respect of liability business, including environmental and pollution exposures, the ultimate cost of which cannot be known with certainty at the statement of financial position date. As such, booked claim provisions for general insurance and health insurance are based on the best estimate of the cost of future claim payments plus an explicit allowance for risk and uncertainty. Any estimate represents a determination within a range of possible outcomes. Further details of estimation techniques are given in note 43(b).
Provisions for latent claims and claims that are settled on an annuity type basis such as structured settlements are discounted, in the relevant currency at the reporting date, having regard to the expected settlement dates of the claims and the nature of the liabilities. The discount rate is set at the start of the accounting period with any change in rates between the start and end of the accounting period being reflected below operating profit as an economic assumption change. The range of discount rates used is described in note 43(b). Outstanding claims provisions are valued net of an allowance for expected future recoveries. Recoveries include non-insurance assets that have been acquired by exercising rights to salvage and subrogation under the terms of insurance contracts. Where material, anticipated recoveries are disclosed under receivables and not deducted from outstanding claims provisions.
Provision for unearned premiums The proportion of written premiums, gross of commission payable to intermediaries, attributable to subsequent periods is deferred as a provision for unearned premiums. The change in this provision is taken to the income statement as recognition of revenue over the period of risk.
Liability adequacy At each reporting date, the Group reviews its unexpired risks and carries out a liability adequacy test for any overall excess of expected claims and deferred acquisition costs over unearned premiums, using the current estimates of future cash flows under its contracts after taking account of the investment return expected to arise on assets relating to the relevant general business provisions. If these estimates show that the carrying amount of its insurance liabilities (less related deferred acquisition costs) is insufficient in light of the estimated future cash flows, the deficiency is recognised in the income statement by setting up a provision in the statement of financial position.
Other assessments and levies The Group is subject to various periodic insurance-related assessments or guarantee fund levies. Related provisions are established where there is a present obligation (legal or constructive) as a result of a past event. Such amounts are not included in insurance liabilities but are included under ‘Pension deficits and other provisions’ in the statement of financial position.
(M) Non-participating investment contract liabilities Claims For non-participating investment contracts with an account balance, claims reflect the excess of amounts paid over the account balance released.
Contract liabilities Deposits collected under non-participating investment contracts are not accounted for through the income statement, except for the investment income attributable to those contracts, but are accounted for directly through the statement of financial position as an adjustment to the investment contract liability.
The majority of the Group’s contracts classified as non-participating investment contracts are unit-linked contracts and are measured at fair value. Certain liabilities for non-linked non-participating contracts are measured at amortised cost.
The liability’s fair value is determined using a valuation technique to provide a reliable estimate of the amount for which the liability could be transferred in an orderly transaction between market participants at the measurement date, subject to a minimum equal to the surrender value. For unit-linked contracts, the fair value liability is equal to the current unit fund value, including any unfunded units. In addition, if required, non-unit reserves are held based on a discounted cash flow analysis. For non-linked contracts, the fair value liability is based on a discounted cash flow analysis, with allowance for risk calibrated to match the market price for risk.
Amortised cost is calculated as the fair value of consideration received at the date of initial recognition, less the net effect of payments such as transaction costs and front-end fees, plus or minus the cumulative amortisation (using the effective interest rate method) of any difference between that initial amount and the maturity value, and less any write-down for surrender payments. The effective interest rate is the one that equates the discounted cash payments to the initial amount. At each reporting date, the amortised cost liability is determined as the value of future best estimate cash flows discounted at the effective interest rate.

Accounting policies Continued
Aviva plc Annual report and accounts 2019 125
Strategic report Governance IFRS financial statements Other information
(N) Reinsurance The Group assumes and cedes reinsurance in the normal course of business, with retention limits varying by line of business. Premiums on reinsurance assumed are recognised as revenue in the same manner as they would be if the reinsurance were considered direct business, taking into account the product classification of the reinsured business. The cost of reinsurance related to long-duration contracts is accounted for over the life of the underlying reinsured policies, using assumptions consistent with those used to account for these policies.
Where general insurance liabilities are discounted, any corresponding reinsurance assets are also discounted using consistent assumptions.
Gains or losses on buying retroactive reinsurance are recognised in the income statement immediately at the date of purchase and are not amortised. Premiums ceded and claims reimbursed are presented on a gross basis in the consolidated income statement and statement of financial position as appropriate.
Reinsurance assets primarily include balances due from both insurance and reinsurance companies for ceded insurance and investment contract liabilities. This includes balances in respect of investment contracts which are legally reinsurance contracts but do not meet the definition of a reinsurance contract under IFRS. Amounts recoverable from reinsurers are estimated in a manner consistent with the underlying contract liabilities, outstanding claims provisions or settled claims associated with the reinsured policies and in accordance with the relevant reinsurance contract.
Reinsurance of non-participating investment contracts and reinsurance contracts that principally transfer financial risk are accounted for directly through the statement of financial position. A deposit asset or liability is recognised, based on the consideration paid or received less any explicitly identified premiums or fees to be retained by the reinsured. These deposit assets or liabilities are shown within reinsurance assets in the consolidated statement of financial position.
If a reinsurance asset is impaired, the Group reduces the carrying amount accordingly and recognises that impairment loss in the income statement. A reinsurance asset is impaired if there is objective evidence, as a result of an event that occurred after initial recognition of the reinsurance asset, that the Group may not receive all amounts due to it under the terms of the contract, and the event has a reliably measurable impact on the amounts that the Group will receive from the reinsurer.
(O) Goodwill, AVIF and intangible assets Goodwill Goodwill represents the excess of the cost of an acquisition over the fair value of the Group’s share of the net assets of the acquired subsidiary, associate or joint venture at the date of acquisition. Goodwill arising on the Group’s investments in subsidiaries is shown as a separate asset, while that on associates and joint ventures is included within the carrying value of those investments.
Goodwill on acquisitions prior to 1 January 2004 (the date of transition to IFRS) is carried at its book value (original cost less cumulative amortisation) on that date, less any impairment subsequently incurred. Goodwill arising before 1 January 1998 was eliminated against reserves and has not been reinstated.
Where negative goodwill arises on an acquisition, this is recognised immediately in the consolidated income statement.
Acquired value of in-force business (AVIF) The present value of future profits on a portfolio of long-term insurance and investment contracts, acquired either directly or through the purchase of a subsidiary, is recognised as an asset.
If the AVIF results from the acquisition of an investment in a joint venture or an associate, it is held within the carrying amount of that investment. In all cases, the AVIF is amortised over the useful lifetime of the related contracts in the portfolio on a systematic basis. The rate of amortisation is chosen by considering the profile of the additional value of in-force business acquired and the expected depletion in its value.
Non-participating investment contract AVIF is reviewed for evidence of impairment, consistent with reviews conducted for other finite life intangible assets. Insurance and participating investment contract AVIF is reviewed for impairment at each reporting date as part of the liability adequacy requirements of IFRS 4 (see accounting policy L). AVIF is reviewed for evidence of impairment and impairment tested at product portfolio level by reference to a projection of future profits arising from the portfolio.
Intangible assets Intangible assets consist primarily of contractual relationships such as access to distribution networks, customer lists and software. The economic lives of these are determined by considering relevant factors such as usage of the asset, typical product life cycles, potential obsolescence, maintenance costs, the stability of the industry, competitive position and the period of control over the assets. Finite life intangibles are amortised over their useful lives, which range from three to 30 years, using the straight-line method.
The amortisation charge for the year is included in the income statement under ‘Other expenses’. For intangibles with finite lives, impairment charges will be recognised in the income statement where evidence of such impairment is observed. Intangibles with indefinite lives are subject to regular impairment testing, as described below.
Impairment testing For impairment testing, goodwill and intangible assets with indefinite useful lives have been allocated to cash-generating units. The carrying amount of goodwill and intangible assets with indefinite useful lives is reviewed at least annually or when circumstances or events indicate there may be uncertainty over this value. Goodwill and indefinite life intangibles are written down for impairment where the recoverable amount is insufficient to support its carrying value. Further details on goodwill allocation and impairment testing are given in note 17. Any impairments are charged as expenses in the income statement.
(P) Property and equipment Owner-occupied properties are carried at their revalued amounts, and movements are recognised in other comprehensive income and taken to a separate reserve within equity. When such properties are sold, the accumulated revaluation surpluses are transferred from this reserve to retained earnings. These properties are depreciated down to their estimated residual values over their useful lives.
This excludes owner-occupied properties held under lease arrangements, which are measured at amortised cost. Refer to accounting policy Z for further information.
All other items classed as property and equipment within the statement of financial position are carried at historical cost less accumulated depreciation.
Investment properties under construction are included within property and equipment until completion, and are stated at cost less any provision for impairment in their values until construction is completed or fair value becomes reliably measurable.

Accounting policies Continued
Aviva plc Annual report and accounts 2019 126
Strategic report Governance IFRS financial statements Other information
Depreciation is calculated on a straight-line basis to write down the cost of other assets to their residual values over their estimated useful lives as follows: • Properties under construction No depreciation • Owner-occupied properties, and
related mechanical and electrical equipment
25 years
• Motor vehicles Three years, or lease term (up to useful life) if longer
• Computer equipment Three to five years • Other assets Three to five years
The assets’ residual values, useful lives and method of depreciation are reviewed regularly, and at least at each financial year end, and adjusted if appropriate. Where the carrying amount of an asset is greater than its estimated recoverable amount, it is written down immediately to its recoverable amount. Gains and losses on disposal of property and equipment are determined by reference to their carrying amount.
Borrowing costs directly attributable to the acquisition and construction of property and equipment are capitalised. All repair and maintenance costs are charged to the income statement during the financial period in which they are incurred. The cost of major renovations is included in the carrying amount of the asset when it is probable that future economic benefits in excess of the most recently assessed standard of performance of the existing asset will flow to the Group and the renovation replaces an identifiable part of the asset. Major renovations are depreciated over the remaining useful life of the related asset.
(Q) Investment property Investment property is held for long-term rental yields and is not occupied by the Group. Completed investment property is stated at its fair value, as assessed by qualified external valuers or by qualified staff of the Group. Changes in fair values are recorded in the income statement in net investment income.
As described in accounting policy P above, investment properties under construction are included within property and equipment, and are stated at cost less any impairment in their values until construction is completed or fair value becomes reliably measurable.
(R) Impairment of non-financial assets Property and equipment and other non-financial assets are reviewed for impairment losses whenever events or changes in circumstances indicate that the carrying amount may not be recoverable. An impairment loss is recognised in the income statement for the amount by which the carrying amount of the asset exceeds its recoverable amount, which is the higher of an asset’s fair value less costs of disposal and value in use. For the purposes of assessing impairment, assets are grouped at the lowest level for which there are separately identifiable cash flows. Non-financial assets, except goodwill which have suffered an impairment, are reviewed annually for possible reversal of the impairment.
(S) Derecognition and offset of financial assets and financial liabilities A financial asset (or, where applicable, a part of a financial asset or part of a group of similar financial assets) is derecognised where: • The rights to receive cash flows from the asset have expired; • The Group retains the right to receive cash flows from the asset, but
has assumed an obligation to pay them in full without material delay to a third party under a ‘pass-through’ arrangement; or
• The Group has transferred its rights to receive cash flows from the asset and has either transferred substantially all the risks and rewards of the asset, or has neither transferred nor retained
substantially all the risks and rewards of the asset, but has transferred control of the asset.
A financial liability is derecognised when the obligation under the liability is discharged or cancelled or expires.
Financial assets and liabilities are offset and the net amount reported in the statement of financial position when there is a currently enforceable legal right to set off the recognised amounts and there is the ability and intention to settle on a net basis, or realise the asset and settle the liability simultaneously.
(T) Financial investments The Group classifies its investments as either FVTPL or AFS. The classification depends on the purpose for which the investments were acquired, and is determined by local management at initial recognition. The FVTPL category has two subcategories – those that meet the definition as being held for trading and those the Group chooses to designate as FVTPL (referred to in this accounting policy as ‘other than trading’) upon initial recognition.
In general, the other than trading category is used as, in most cases, the Group’s investment or risk management strategy is to manage its financial investments on a fair value basis. Debt securities and equity securities, which the Group acquires with the intention to resell in the short term, are classified as trading, as are non-hedge derivatives (see accounting policy U below). The AFS category is used where the relevant long-term business liability (including shareholders’ funds) is passively managed, as well as in certain fund management and non-insurance operations.
Purchases and sales of investments are recognised on the trade date, which is the date that the Group commits to purchase or sell the assets, at their fair values. Debt securities are initially recorded at their fair value, which is taken to be amortised cost, with amortisation credited or charged to the income statement. Investments classified as trading, other than trading and AFS, are subsequently carried at fair value. Changes in the fair value of trading and other than trading investments are included in the income statement in the period in which they arise.
Changes in the fair value of securities classified as AFS are recognised in other comprehensive income and recorded in a separate investment valuation reserve within equity. When securities classified as AFS are sold or impaired, the accumulated fair value adjustments are transferred out of the investment valuation reserve to the income statement with a corresponding movement through other comprehensive income.
Impairment The Group reviews the carrying value of its AFS investments on a regular basis. If the carrying value of an AFS investment is greater than the recoverable amount, the carrying value is reduced through a charge to the income statement in the period of impairment. The following policies are used to determine the level of any impairment, some of which involve considerable judgement.
AFS debt securities An AFS debt security is impaired if there is objective evidence that a loss event has occurred which has impaired the expected cash flows, i.e. where all amounts due according to the contractual terms of the security are not considered collectible. An impairment charge, measured as the difference between the security’s fair value and amortised cost, is recognised when the issuer is known to be either in default or in financial difficulty. Determining when an issuer is in financial difficulty requires the use of judgement, and we consider a number of factors including industry risk factors, financial condition, liquidity position and near-term prospects of the issuer, credit rating declines and a breach of contract. A decline in fair value below

Accounting policies Continued
Aviva plc Annual report and accounts 2019 127
Strategic report Governance IFRS financial statements Other information
amortised cost due to changes in risk-free interest rates does not necessarily represent objective evidence of a loss event.
For securities identified as being impaired, the cumulative unrealised loss previously recognised within the investment valuation reserve is transferred to realised losses for the year, with a corresponding movement through other comprehensive income. Any subsequent increase in fair value of these impaired securities is recognised in other comprehensive income and recorded in the investment valuation reserve unless this increase represents a decrease in the impairment loss that can be objectively related to an event occurring after the impairment loss was recognised in the income statement. In such an event, the reversal of the impairment loss is recognised as a gain in the income statement.
AFS equity securities An AFS equity security is considered impaired if there is objective evidence that the cost may not be recovered. In addition to qualitative impairment criteria, such evidence includes a significant or prolonged decline in fair value below cost. Unless there is evidence to the contrary, an equity security is considered impaired if the decline in fair value relative to cost has been either at least 20% for a continuous six-month period or more than 40% at the end of the reporting period, or been in an unrealised loss position for a continuous period of more than 12 months at the end of the reporting period. We also review our largest equity holdings for evidence of impairment, as well as individual equity holdings in industry sectors known to be in difficulty. Where there is objective evidence that impairment exists, the security is written down regardless of the size of the unrealised loss.
For securities identified as being impaired, the cumulative unrealised loss previously recognised within the investment valuation reserve is transferred to realised losses for the year with a corresponding movement through other comprehensive income. Any subsequent increase in fair value of these impaired securities is recognised in other comprehensive income and recorded in the investment valuation reserve.
Reversals of impairments on any of these assets are only recognised where the decrease in the impairment can be objectively related to an event occurring after the write-down (such as an improvement in the debtor’s credit rating), and are not recognised in respect of equity instruments.
(U) Derivative financial instruments and hedging Derivative financial instruments include foreign exchange contracts, interest rate futures, currency and interest rate swaps, currency and interest rate options (both written and purchased) and other financial instruments that derive their value mainly from underlying interest rates, foreign exchange rates, credit or equity indices, commodity values or equity instruments.
All derivatives are initially recognised in the statement of financial position at their fair value, which usually represents their cost. They are subsequently remeasured at their fair value, with the method of recognising movements in this value depending on whether they are designated as hedging instruments and, if so, the nature of the item being hedged. Fair values are obtained from quoted market prices or, if these are not available, by using valuation techniques such as discounted cash flow models or option pricing models. All derivatives are carried as assets when the fair values are positive and as liabilities when the fair values are negative. Premiums paid for derivatives are recorded as an asset on the statement of financial position at the date of purchase, representing their fair value at that date.
Derivative contracts may be traded on an exchange or over-the-counter (OTC). Exchange-traded derivatives are standardised and include certain futures and option contracts. OTC derivative
contracts are individually negotiated between contracting parties and include forwards, swaps, caps and floors. Derivatives are subject to various risks including market, liquidity and credit risk, similar to those related to the underlying financial instruments. Many OTC transactions are contracted and documented under International Swaps and Derivatives Association master agreements or their equivalent, which are designed to provide legally enforceable set-off in the event of default, reducing the Group’s exposure to credit risk.
The notional or contractual amounts associated with derivative financial instruments are not recorded as assets or liabilities on the statement of financial position as they do not represent the fair value of these transactions. These amounts are disclosed in note 60(b).
The Group has collateral agreements in place between the individual Group entities and relevant counterparties. Accounting policy W covers collateral, both received and pledged, in respect of these derivatives.
Interest rate and currency swaps Interest rate swaps are contractual agreements between two parties to exchange fixed rate and floating rate interest by means of periodic payments, calculated on a specified notional amount and defined interest rates. Most interest rate swap payments are netted against each other, with the difference between the fixed and floating rate interest payments paid by one party. Currency swaps, in their simplest form, are contractual agreements that involve the exchange of both periodic and final amounts in two different currencies. Both types of swap contracts may include the net exchange of principal. Exposure to gain or loss on these contracts will increase or decrease over their respective lives as a function of maturity dates, interest and foreign exchange rates, and the timing of payments.
Interest rate futures, forwards and options contracts Interest rate futures are exchange-traded instruments and represent commitments to purchase or sell a designated security or money market instrument at a specified future date and price. Interest rate forward agreements are OTC contracts in which two parties agree on an interest rate and other terms that will become a reference point in determining, in concert with an agreed notional principal amount, a net payment to be made by one party to the other, depending upon what rate prevails at a future point in time. Interest rate options, which consist primarily of caps and floors, are interest rate protection instruments that involve the potential obligation of the seller to pay the buyer an interest rate differential in exchange for a premium paid by the buyer. This differential represents the difference between current rate and an agreed rate applied to a notional amount. Exposure to gain or loss on all interest rate contracts will increase or decrease over their respective lives as interest rates fluctuate. Certain contracts, known as swaptions, contain features which can act as swaps or options.
Foreign exchange contracts Foreign exchange contracts, which include spot, forward and futures contracts, represent agreements to exchange the currency of one country for the currency of another country at an agreed price and settlement date. Foreign exchange option contracts are similar to interest rate option contracts, except that they are based on currencies, rather than interest rates.
Hedge accounting Hedge accounting is applied to certain transactions which meet the criteria set out in IAS 39, in order to mitigate the Group’s exposure to risk. At the inception of the transaction, the Group documents the relationship between the hedging instrument and the hedged item, as well as the risk management objective and the strategy for undertaking the hedge transaction. The Group also documents its assessment of whether the hedge is expected to be, and has been,

Accounting policies Continued
Aviva plc Annual report and accounts 2019 128
Strategic report Governance IFRS financial statements Other information
highly effective in offsetting the risk in the hedged item, both at inception and on an ongoing basis.
Changes in the fair value of hedging instruments that are designated and qualify as a hedge of a net investment in a foreign operation (net investment hedges) or a hedge of a future cash flow attributable to a recognised asset or liability, a highly probable forecast transaction or a firm commitment (cash flow hedges), and that prove to be highly effective in relation to the hedged risk, are recognised in other comprehensive income and a separate reserve within equity. Gains and losses accumulated in this reserve are included in the income statement on disposal of the relevant investment or occurrence of the cash flow as appropriate.
Changes in the fair value of hedging instruments that are designated and qualify as a hedge of the fair value of a recognised asset or liability (fair value hedges) are recognised in the income statement. The gain or loss on the hedged item that is attributable to the hedged risk is recognised in the income statement. This applies even if the hedged item is an available for sale financial asset or is measured at amortised cost. If a hedging relationship no longer meets the criteria for hedge accounting, the cumulative adjustment made to the carrying amount of the hedged item is amortised to the income statement, based on a recalculated effective interest rate over the residual period to maturity. In cases where the hedged item has been derecognised, the cumulative adjustment is released to the income statement immediately.
The Group does not currently apply the specific hedge accounting rules to its derivative transactions which are treated as derivatives held for trading. The fair value gains and losses on these derivatives are recognised immediately in net investment income.
(V) Loans Loans with fixed maturities, including policyholder loans, mortgage loans on investment property, securitised mortgages and collateral loans, are recognised when cash is advanced to borrowers. Certain loans are carried at their unpaid principal balances and adjusted for amortisation of premium or discount, non-refundable loan fees and related direct costs. These amounts are deferred and amortised over the life of the loan as an adjustment to loan yield using the effective interest rate method.
However, for the majority of mortgage loans, the Group has taken advantage of the fair value option under IAS 39 to present the mortgages, associated borrowings and derivative financial instruments at fair value, since they are managed as a portfolio on a fair value basis. This presentation provides more relevant information and eliminates any accounting mismatch that would otherwise arise from using different measurement bases for these three items. The fair values of these mortgages are estimated using discounted cash flow models, based on a risk-adjusted discount rate which reflects the risks associated with these products. They are revalued at each period end, with movements in their fair values being taken to the income statement.
At each reporting date, we review loans carried at amortised cost for objective evidence that they are impaired and uncollectable, either at the level of an individual security or collectively within a group of loans with similar credit risk characteristics. To the extent that a loan is uncollectable, it is written down as impaired to its recoverable amount, measured as the present value of expected future cash flows discounted at the original effective interest rate of the loan, taking into account the fair value of the underlying collateral through an impairment provision account. Subsequent recoveries in excess of the loan’s written-down carrying value are credited to the income statement.
The Company classifies and measures loans at either amortised cost, fair value through other comprehensive income, or fair value through
profit or loss based on the outcome of an assessment of the Company’s business model for managing financial assets and the extent to which the financial assets’ contractual cash flows are solely payment of principal and interest.
The Company calculates expected credit losses for all financial assets held at either amortised cost or fair value through other comprehensive income. Expected credit losses are calculated on either a 12-month or lifetime basis depending on the extent to which credit risk has increased significantly since initial recognition.
(W) Collateral The Group receives and pledges collateral in the form of cash or non-cash assets in respect of stock lending transactions, certain derivative contracts and loans, in order to reduce the credit risk of these transactions. Collateral is also pledged as security for bank letters of credit. The amount and type of collateral required depends on an assessment of the credit risk of the counterparty.
Collateral received in the form of cash, which is not legally segregated from the Group, is recognised as an asset in the statement of financial position with a corresponding liability for the repayment in financial liabilities (see note 61). However, where the Group has a currently enforceable legal right of set-off and the ability and intent to net settle, the collateral liability and associated derivative balances are shown net. Non-cash collateral received is not recognised in the statement of financial position unless the transfer of the collateral meets the derecognition criteria from the perspective of the transferor. Such collateral is typically recognised when the Group either (a) sells or repledges these assets in the absence of default, at which point the obligation to return this collateral is recognised as a liability; or (b) the counterparty to the arrangement defaults, at which point the collateral is seized and recognised as an asset.
Collateral pledged in the form of cash, which is legally segregated from the Group, is derecognised from the statement of financial position with a corresponding receivable recognised for its return. Non-cash collateral pledged is not derecognised from the statement of financial position unless the Group defaults on its obligations under the relevant agreement, and therefore continues to be recognised in the statement of financial position within the appropriate asset classification.
(X) Deferred acquisition costs and other assets Costs relating to the acquisition of new business for insurance and participating investment contracts are deferred in line with existing local accounting practices, to the extent that they are expected to be recovered out of future margins in revenues on these contracts. For participating contracts written in the UK, acquisition costs are generally not deferred as the liability for these contracts is calculated on a realistic basis which was grandfathered from UK regulatory requirements prior to the adoption of Solvency II (see accounting policy L). For non-participating investment and investment fund management contracts, incremental acquisition costs and sales enhancements that are directly attributable to securing an investment management service are also deferred.
Long-term business deferred acquisition costs are amortised systematically over a period no longer than that in which they are expected to be recoverable out of these future margins. Deferred acquisition costs for non-participating investment and investment fund management contracts are amortised over the period in which the service is provided. General insurance and health deferred acquisition costs are amortised over the period in which the related revenues are earned. The reinsurers’ share of deferred acquisition costs is amortised in the same manner as the underlying asset.

Accounting policies Continued
Aviva plc Annual report and accounts 2019 129
Strategic report Governance IFRS financial statements Other information
Deferred acquisition costs are reviewed by category of business at the end of each reporting period and are written-off where they are no longer considered to be recoverable.
Where such business is reinsured, an appropriate proportion of the deferred acquisition costs is attributed to the reinsurer. Recoverability is assessed net of reinsurance, and may result in deferred acquisition costs being written-off if any liability recognised for the reinsurer’s share is insufficient.
Other receivables and payables are initially recognised at cost, being fair value. Subsequent to initial measurement they are measured at amortised cost.
(Y) Statement of cash flows Cash and cash equivalents Cash and cash equivalents consist of cash at bank and in hand, deposits held at call with banks, treasury bills and other short-term highly liquid investments that are readily convertible to known amounts of cash and which are subject to an insignificant risk of change in value. Such investments are those with less than three months’ maturity from the date of acquisition, or which are redeemable on demand with only an insignificant change in their fair values.
For the purposes of the statement of cash flows, cash and cash equivalents also include bank overdrafts, which are included in payables and other financial liabilities on the statement of financial position.
Operating cash flows Purchases and sales of investment property, loans and financial investments are included within operating cash flows as the purchases are funded from cash flows associated with the origination of insurance and investment contracts, net of payments of related benefits and claims.
(Z) Leases Where the Group is the lessee, a lease liability equal to the present value of outstanding lease payments and a corresponding right-of-use asset equal to cost are initially recognised. The right-of-use asset is subsequently measured at amortised cost and depreciated on a straight-line basis over the length of the lease term. Depreciation on lease assets and interest on lease liabilities is recognised in the income statement.
The Group has made use of the election available under IFRS 16 to not recognise any amounts on the balance sheet associated with leases that are either deemed to be short term, or where the underlying asset is of low value. A short-term lease in this context is defined as any arrangement which has a lease term of 12 months or less. Lease payments associated with such arrangements are recognised in the income statement as an expense on a straight-line basis. The Group’s total short term and low value lease portfolio is not material.
Where the Group is the lessor, leases are classified as finance leases if the risks and rewards of ownership are substantially transferred to the lessee and operating leases if they are not substantially transferred. Lease income from operating leases is recognised in the income statement on a straight-line basis over the lease term. When assets are subject to finance leases, the present value of the lease payments, together with any unguaranteed residual value, is recognised as a receivable. The Group has not entered into any material finance lease arrangements as lessor.
Comparative figures Prior period comparatives have not been restated to reflect the adoption of IFRS 16. The accounting policy relating to leases applied to comparatives is set out below.
Leases, where a significant portion of the risks and rewards of ownership is retained by the lessor, are classified as operating leases. Where the Group is the lessee, payments made under operating leases (net of any incentives received from the lessor) are charged to the income statement on a straight-line basis over the term of the relevant leases.
Where the Group is the lessor, lease income from operating leases is recognised in the income statement on a straight-line basis over the lease term.
Where assets are subject to finance leases, the present value of the lease payments, together with any unguaranteed residual value, is recognised as a receivable. The Group has not entered into any material finance lease arrangements either as lessor or lessee.
(AA) Provisions and contingent liabilities Provisions are recognised when the Group has a present legal or constructive obligation as a result of past events, it is more probable than not that an outflow of resources embodying economic benefits will be required to settle the obligation, and a reliable estimate of the amount of the obligation can be made. Restructuring provisions include lease termination penalties and employee termination payments. They comprise only the direct expenditures arising from the restructuring, which are those that are necessarily entailed by the restructuring; and not associated with the ongoing activities of the entity. The amount recorded as a provision is the best estimate of the expenditure required to settle the present obligation at the balance sheet date. Where the effect of the time value of money is material, the provision is the present value of the expected expenditure. Provisions are not recognised for future operating losses.
Where the Group expects a provision to be reimbursed, for example under an insurance contract, the reimbursement is recognised as a separate asset but only when the reimbursement is virtually certain.
The Group recognises a provision for onerous contracts when the expected benefits to be derived from a contract are less than the unavoidable costs of meeting the obligations under the contract. Contingent liabilities are disclosed if there is a possible future obligation as a result of a past event, or if there is a present obligation as a result of a past event but either a payment is not probable or the amount cannot be reasonably estimated.
(AB) Employee benefits Pension obligations The Group operates a number of pension schemes, whose members receive benefits on either a defined benefit or defined contribution basis. Under a defined contribution plan, the Group’s legal or constructive obligation is limited to the amount it agrees to contribute to a fund and there is no obligation to pay further contributions if the fund does not hold sufficient assets to pay benefits. A defined benefit pension plan is a pension plan that is not a defined contribution plan and typically defines the amount of pension benefit that an employee will receive on retirement.
The defined benefit obligation is calculated by independent actuaries using the projected unit credit method. The pension obligation is measured as the present value of the estimated future cash outflows, using a discount rate based on market yields for high-quality corporate bonds that are denominated in the currency in which the benefits will be paid and that have terms to maturity approximating to the terms of the related pension liability. The resultant net surplus or deficit recognised as an asset or liability on the statement of financial position is the present value of the defined benefit obligation at the end of the reporting period less the fair value of plan assets.
Plan assets exclude unpaid contributions due from Group entities to the schemes, and any non-transferrable financial instruments issued by a Group entity and held by the schemes. If the fair value of plan

Accounting policies Continued
Aviva plc Annual report and accounts 2019 130
Strategic report Governance IFRS financial statements Other information
assets exceeds the present value of the defined benefit obligation, the resultant asset is limited to the asset ceiling defined as present value of economic benefits available in the form of future refunds from the plan or reductions in contributions to the plan. In order to calculate the present value of economic benefits, consideration is given to any minimum funding requirements that apply to any plan in the Group.
Remeasurements of defined benefit plans comprise actuarial gains and losses arising from experience adjustments and changes in actuarial assumptions, the return on plan assets (excluding net interest) and the effect of the asset ceiling (if any). The Group recognises remeasurements immediately in other comprehensive income and does not reclassify them to the income statement in subsequent periods.
Service costs comprising current service costs, past service costs, gains and losses on curtailments and net interest expense/income are charged or credited to the income statement.
Past service costs are recognised at the earlier of the date the plan amendment or curtailment occurs or when related restructuring costs are recognised.
The Group determines the net interest expense/income on the net defined benefit liability/asset for the period by applying the discount rate used to measure the defined benefit obligation at the beginning of the year to the net defined benefit liability/asset. Net interest expense is charged to finance costs, whereas, net interest income is credited to investment income.
For defined contribution plans, the Group pays contributions to publicly or privately administered pension plans. Once the contributions have been paid, the Group, as employer, has no further payment obligations. The Group’s contributions are charged to the income statement in the year to which they relate and are included in staff costs.
Equity compensation plans The Group offers share award and option plans over the Company’s ordinary shares for certain employees, including a Save As You Earn plan (SAYE plan), details of which are given in the Directors’ Remuneration Report and in note 33.
The Group accounts for options and awards under equity compensation plans, which were granted after 7 November 2002, until such time as they are fully vested, using the fair value based method of accounting (the ‘fair value method’). Under this method, the cost of providing equity compensation plans is based on the fair value of the share awards or option plans at date of grant, which is recognised in the income statement over the expected vesting period of the related employees and credited to the equity compensation reserve, part of shareholders’ funds. In certain jurisdictions, awards must be settled in cash instead of shares, and the credit is taken to liabilities rather than reserves. The fair value of these cash-settled awards is recalculated each year, with the income statement charge and liability being adjusted accordingly.
Shares purchased by employee share trusts to fund these awards are shown as deduction from shareholders’ equity at their weighted average cost.
When the options are exercised and new shares are issued, the proceeds received, net of any transaction costs, are credited to share capital (par value) and the balance to share premium. Where the shares are already held by employee trusts, the net proceeds are credited against the cost of these shares, with the difference between cost and proceeds being taken to retained earnings. In both cases, the relevant amount in the equity compensation reserve is then credited to retained earnings.
(AC) Income taxes The current tax expense is based on the taxable profits for the year, after any adjustments in respect of prior years. Tax, including tax relief for losses if applicable, is allocated over profits before taxation and amounts charged or credited to components of other comprehensive income and equity, as appropriate.
Provision is made for deferred tax liabilities, or credit taken for deferred tax assets, using the liability method, on all material temporary differences between the tax bases of assets and liabilities and their carrying amounts in the consolidated financial statements.
The rates enacted or substantively enacted at the statement of financial position date are used to value the deferred tax assets and liabilities.
Deferred tax assets are recognised to the extent that it is probable that future taxable profit will be available against which the temporary differences can be utilised. Where there is a history of tax losses, deferred tax assets are only recognised in excess of deferred tax liabilities if there is convincing evidence that future profits will be available.
Deferred tax is provided on any temporary differences arising from investments in subsidiaries, associates and joint ventures, except where the timing of the reversal of the temporary difference can be controlled and it is probable that the difference will not reverse in the foreseeable future.
Deferred taxes are not provided in respect of temporary differences arising from the initial recognition of goodwill, or from the initial recognition of an asset or liability in a transaction which is not a business combination and affects neither accounting profit nor taxable profit or loss at the time of the transaction.
Current and deferred tax relating to items recognised in other comprehensive income and directly in equity are similarly recognised in other comprehensive income and directly in equity respectively. Deferred tax related to fair value re-measurement of available for sale investments, pensions and other post-retirement obligations and other amounts charged or credited directly to other comprehensive income is recognised in the statement of financial position as a deferred tax asset or liability. Current tax on interest paid on the direct capital instrument and tier 1 notes is credited directly in equity.
Current and deferred tax includes amounts provided in respect of uncertain tax positions, where management expects it is more likely than not that an economic outflow will occur as a result of examination by a relevant tax authority. Provisions reflect management’s best estimate of the ultimate liability based on their interpretation of tax law, precedent and guidance, informed by external tax advice as necessary. The final amounts of tax due may ultimately differ from management’s best estimate at the balance sheet date. Changes in facts and circumstances underlying these provisions are reassessed at each balance sheet date, and the provisions are re-measured as required to reflect current information.
In addition to paying tax on shareholders’ profits (‘shareholder tax’), the Group’s life businesses in the UK, Ireland and Singapore pay tax on policyholders’ investment returns (‘policyholder tax’) on certain products at policyholder tax rates. The incremental tax borne by the Group represents income tax on policyholder’s investment return. In jurisdictions where policyholder tax is applicable, the total tax charge in the income statement is allocated between shareholder tax and policyholder tax. The shareholder tax is calculated by applying the corporate tax rate to the shareholder profit. The difference between the total tax charge and shareholder tax is allocated to policyholder tax. This calculation methodology is consistent with the legislation relating to the calculation of tax on shareholder profits. The Group has decided to show separately the amounts of policyholder tax to provide a meaningful measure of the tax the Group pays on its profit.

Accounting policies Continued
Aviva plc Annual report and accounts 2019 131
Strategic report Governance IFRS financial statements Other information
In the pro forma reconciliations, the Group adjusted operating profit has been calculated after charging policyholder tax.
(AD) Borrowings Borrowings are classified as being for either core structural or operational purposes. They are recognised initially at their issue proceeds less transaction costs incurred. Subsequently, most borrowings are stated at amortised cost, and any difference between net proceeds and the redemption value is recognised in the income statement over the period of the borrowings using the effective interest rate method. All borrowing costs are expensed as they are incurred except where they are directly attributable to the acquisition or construction of property and equipment as described in accounting policy P.
Where loan notes have been issued in connection with certain securitised mortgage loans, the Group has taken advantage of the fair value option under IAS 39 to present the mortgages, associated liabilities and derivative financial instruments at fair value, since they are managed as a portfolio on a fair value basis. This presentation provides more relevant information and eliminates any accounting mismatch which would otherwise arise from using different measurement bases for these three items.
(AE) Share capital and treasury shares Equity instruments An equity instrument is a contract that evidences a residual interest in the assets of an entity after deducting all its liabilities. Accordingly, a financial instrument is treated as equity if: (i) there is no contractual obligation to deliver cash or other
financial assets or to exchange financial assets or liabilities on terms that may be unfavourable; and
(ii) the instrument is a non-derivative that contains no contractual obligation to deliver a variable number of shares or is a derivative that will be settled only by the Group exchanging a fixed amount of cash or other assets for a fixed number of the Group’s own equity instruments.
Share issue costs Incremental external costs directly attributable to the issue of new shares are shown in equity as a deduction, net of tax, from the proceeds of the issue and disclosed where material.
Dividends Interim dividends on ordinary shares are recognised in equity in the period in which they are paid. Final dividends on these shares are recognised when they have been approved by shareholders. Dividends on preference shares are recognised in the period in which they are declared and appropriately approved.
Treasury shares Where the Company or its subsidiaries purchase the Company’s share capital or obtain rights to purchase its share capital, the consideration paid (including any attributable transaction costs net of income taxes) is shown as a deduction from total shareholders’ equity. Gains and losses on own shares are charged or credited to the treasury share account in equity.
(AF) Fiduciary activities Assets and income arising from fiduciary activities, together with related undertakings to return such assets to customers, are excluded from these financial statements where the Group has no contractual rights in the assets and acts in a fiduciary capacity such as nominee, trustee or agent.
(AG) Earnings per share Basic earnings per share is calculated by dividing net income available to ordinary shareholders by the weighted average number
of ordinary shares in issue during the year, excluding the weighted average number of treasury shares.
Earnings per share has also been calculated on Group adjusted operating profit attributable to ordinary shareholders, net of tax, non-controlling interests, preference dividends, the direct capital instrument (the DCI) and tier one notes as the directors believe this figure provides a better indication of operating performance. Details are given in note 15.
For the diluted earnings per share, the weighted average number of ordinary shares in issue is adjusted to assume conversion of all dilutive potential ordinary shares, such as convertible debt and share options granted to employees.
Potential or contingent share issuances are treated as dilutive when their conversion to shares would decrease net earnings per share.
(AH) Operations held for sale Assets and liabilities held for disposal as part of operations which are held for sale are shown separately in the consolidated statement of financial position. Operations held for sale are recorded at the lower of their carrying amount and their fair value less the estimated selling costs.

Consolidated financial statements
The accounting policies (identified alphabetically) on pages 117 to 131 and notes (identified numerically) on pages 139 to 263 are an integral part of the financial statements.
Aviva plc Annual report and accounts 2019 132
Strategic report Governance IFRS financial statements Other information
Consolidated income statement For the year ended 31 December 2019
Note 2019
£m
Restated1 2018
£m
Income 6 Gross written premiums 31,243 28,659 Premiums ceded to reinsurers (3,563) (2,326)
Premiums written net of reinsurance 27,680 26,333 Net change in provision for unearned premiums (209) (81)
Net earned premiums H 27,471 26,252 Fee and commission income I & J 2,141 2,178 Net investment income/(expense) K 40,577 (10,912) Share of profit after tax of joint ventures and associates 85 112 (Loss)/profit on the disposal and remeasurement of subsidiaries, joint ventures and associates 4(a) (22) 102
70,252 17,732
Expenses 7 Claims and benefits paid, net of recoveries from reinsurers (23,096) (23,142) Change in insurance liabilities, net of reinsurance 42(b) (5,702) 6,246 Change in investment contract provisions (24,095) 5,321 Change in unallocated divisible surplus 49 (3,985) 3,237 Fee and commission expense (5,536) (3,326) Other expenses (3,329) (3,843) Finance costs 8 (576) (573) (66,319) (16,080)
Profit before tax 3,933 1,652
Tax attributable to policyholders’ returns 14(d) (559) 477
Profit before tax attributable to shareholders’ profits 3,374 2,129 Tax (expense)/credit AC & 14 (1,270) 35 Less: tax attributable to policyholders’ returns 14(d) 559 (477) Tax attributable to shareholders’ profits 14(d) (711) (442)
Profit for the year 2,663 1,687 Attributable to: Equity holders of Aviva plc 2,548 1,568 Non-controlling interests 41 115 119
Profit for the year 2,663 1,687
Earnings per share AG & 15 Basic (pence per share) 63.8 38.2 Diluted (pence per share) 63.1 37.8 1 Following a review of the Group’s presentation of consolidated investment funds, comparative amounts have been restated from those previously reported. The restatement has had no impact on the profit for the year or equity.
See note 1(a) for further information.

Consolidated financial statements Continued
The accounting policies (identified alphabetically) on pages 117 to 131 and notes (identified numerically) on pages 139 to 263 are an integral part of the financial statements.
Aviva plc Annual report and accounts 2019 133
Strategic report Governance IFRS financial statements Other information
Consolidated statement of comprehensive income For the year ended 31 December 2019
Note 2019
£m 2018
£m
Profit for the year 2,663 1,687 Other comprehensive income: Items that may be reclassified subsequently to income statement Investments classified as available for sale
Fair value gains 39 39 57 Fair value gains transferred to profit on disposals 39 (19) (78)
Share of other comprehensive income/(loss) of joint ventures and associates 39 22 (10) Foreign exchange rate movements 39, 41 (219) 5 Aggregate tax effect – shareholder tax on items that may be reclassified subsequently to income statement 14(b) 6 8 Items that will not be reclassified to income statement
Owner-occupied properties – fair value gains 39 3 1 Remeasurements of pension schemes 40 (867) (279) Aggregate tax effect – shareholder tax on items that will not be reclassified subsequently to income statement 14(b) 103 43
Total other comprehensive income, net of tax (932) (253)
Total comprehensive income for the year 1,731 1,434
Attributable to: Equity holders of Aviva plc 1,655 1,310 Non-controlling interests 76 124
1,731 1,434

Consolidated financial statements Continued
The accounting policies (identified alphabetically) on pages 117 to 131 and notes (identified numerically) on pages 139 to 263 are an integral part of the financial statements.
Aviva plc Annual report and accounts 2019 134
Strategic report Governance IFRS financial statements Other information
Reconciliation of Group adjusted operating profit to profit for the year For the year ended 31 December 2019
Note 2019
£m
Restated1 2018
£m
Group adjusted operating profit before tax attributable to shareholders’ profits Life business 3,000 2,976 General insurance and health 644 651 Fund management 92 143 Other:
Other operations (114) (270) Corporate centre (183) (216) Group debt costs and other interest (255) (280)
Group adjusted operating profit before tax attributable to shareholders’ profits 3,184 3,004
Adjusted for the following: Life business: Investment variances and economic assumption changes 9 654 (197) Non-life business: Short-term fluctuation in return on investments 10(a) 167 (476) General insurance and health business: Economic assumption changes 10(a) (54) 1 Impairment of goodwill, joint ventures, associates and other amounts expensed 17(a), 20 (15) (13) Amortisation and impairment of intangibles acquired in business combinations 18 (87) (97) Amortisation and impairment of acquired value of in-force business 18 (406) (426) (Loss)/profit on the disposal and remeasurement of subsidiaries, joint ventures and associates 4(a) (22) 102 Other2 (47) 231
Adjusting items before tax 190 (875)
Profit before tax attributable to shareholders’ profits 3,374 2,129 Tax on group adjusted operating profit 15(a)(i) (668) (625) Tax on other activities 15(a)(i) (43) 183 (711) (442)
Profit for the year 2,663 1,687 1 During 2019 the Group adjusted operating profit APM has been revised and now includes the amortisation and impairment of internally generated intangible assets to better reflect the operational nature of these assets (see
note 1(b)). Group adjusted operating profit continues to exclude amortisation and impairment of intangible assets acquired in business combinations. Comparative amounts have been restated resulting in a reduction in the prior period Group adjusted operating profit of £112 million. There is no impact on profit before tax attributable to shareholders’ profit.
2 Other in 2019 relates to a charge of £45 million in relation to a change in the discount rate used for estimating lump sum payments in settlement of bodily injury claims (see note 44(b)) and a charge of £2 million relating to negative goodwill which arose on the acquisition of Friends First (see note 3). Other in 2018 includes a movement in the discount rate used for estimating lump sum payments in the settlement of bodily injury claims which resulted in a gain of £190 million, a provision release of £78 million relating to the sale of Aviva USA in 2013, a gain of £36 million relating to negative goodwill on the acquisition of Friends First, a charge of £63 million relating to the UK defined benefit pension scheme as a result of the requirements to equalise members’ benefits of the effects of Guaranteed Minimum Pension and a charge of £10 million relating to goodwill payments to preference shareholders, which was announced on 30 April 2018, and associated administration costs.

Consolidated financial statements Continued
The accounting policies (identified alphabetically) on pages 117 to 131 and notes (identified numerically) on pages 139 to 263 are an integral part of the financial statements.
Aviva plc Annual report and accounts 2019 135
Strategic report Governance IFRS financial statements Other information
Reconciliation of Group adjusted operating profit to profit for the year continued Group adjusted operating profit can be further analysed into the following segments (details of segments can be found in note 5):
For the year ended 31 December 2019
Long-term business
£m
General insurance and
health £m
Fund management
£m Other1
£m Total
£m
United Kingdom 1,820 285 — — 2,105 Canada — 191 — — 191 France 425 94 — (46) 473 Poland 171 20 — 3 194 Italy, Ireland and Other 258 69 — (13) 314 Asia 299 (8) (4) (12) 275 Aviva Investors — — 96 — 96 Other Group activities 27 (7) — (46) (26) 3,000 644 92 (114) 3,622 Corporate Centre (183) Group debt costs and other interest (255) Total 3,184
For the year ended 31 December 2018 restated2
Long-term business
£m
General insurance and
health £m
Fund management
£m Other1
£m Total
£m
United Kingdom 1,848 421 — — 2,269 Canada — 26 — 1 27 France 436 109 — (35) 510 Poland 170 20 — 8 198 Italy, Ireland, Spain and Other 225 90 — (15) 300 Asia 300 (16) (4) (19) 261 Aviva Investors 1 — 147 — 148 Other Group activities (4) 1 — (210) (213) 2,976 651 143 (270) 3,500
Corporate Centre (216) Group debt costs and other interest (280)
Total 3,004 1 Other Group activities within Other includes net expenses of £15 million (2018 restated: £180 million) in relation to the Group’s UK digital business. 2 During 2019 the Group adjusted operating profit APM has been revised and now includes the amortisation and impairment of internally generated intangible assets to better reflect the operational nature of these assets (see
note 1(b)). Group adjusted operating profit continues to exclude amortisation and impairment of intangible assets acquired in business combinations. Comparative amounts have been restated resulting in a reduction in the prior period Group adjusted operating profit of £112 million. There is no impact on profit before tax attributable to shareholders’ profit.
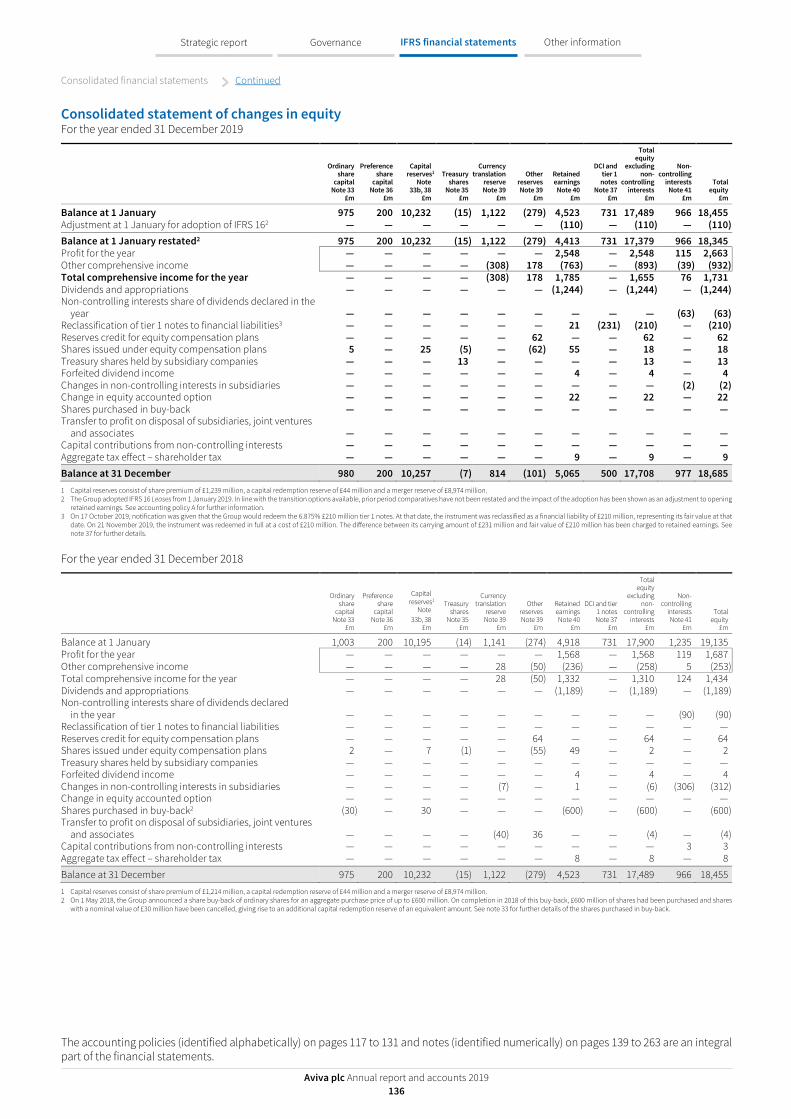
Consolidated financial statements Continued
The accounting policies (identified alphabetically) on pages 117 to 131 and notes (identified numerically) on pages 139 to 263 are an integral part of the financial statements.
Aviva plc Annual report and accounts 2019 136
Strategic report Governance IFRS financial statements Other information
Consolidated statement of changes in equity For the year ended 31 December 2019
Ordinary share
capital Note 33
£m
Preference share
capital Note 36
£m
Capital reserves1
Note 33b, 38
£m
Treasury shares
Note 35 £m
Currency translation
reserve Note 39
£m
Other reserves Note 39
£m
Retained earnings
Note 40 £m
DCI and tier 1
notes Note 37
£m
Total equity
excluding non-
controlling interests
£m
Non-controlling
interests Note 41
£m
Total equity
£m
Balance at 1 January 975 200 10,232 (15) 1,122 (279) 4,523 731 17,489 966 18,455 Adjustment at 1 January for adoption of IFRS 162 — — — — — — (110) — (110) — (110) Balance at 1 January restated2 975 200 10,232 (15) 1,122 (279) 4,413 731 17,379 966 18,345 Profit for the year — — — — — — 2,548 — 2,548 115 2,663 Other comprehensive income — — — — (308) 178 (763) — (893) (39) (932) Total comprehensive income for the year — — — — (308) 178 1,785 — 1,655 76 1,731 Dividends and appropriations — — — — — — (1,244) — (1,244) — (1,244) Non-controlling interests share of dividends declared in the
year — — — — — — — — — (63) (63) Reclassification of tier 1 notes to financial liabilities3 — — — — — — 21 (231) (210) — (210) Reserves credit for equity compensation plans — — — — — 62 — — 62 — 62 Shares issued under equity compensation plans 5 — 25 (5) — (62) 55 — 18 — 18 Treasury shares held by subsidiary companies — — — 13 — — — — 13 — 13 Forfeited dividend income — — — — — — 4 — 4 — 4 Changes in non-controlling interests in subsidiaries — — — — — — — — — (2) (2) Change in equity accounted option — — — — — — 22 — 22 — 22 Shares purchased in buy-back — — — — — — — — — — — Transfer to profit on disposal of subsidiaries, joint ventures
and associates — — — — — — — — — — — Capital contributions from non-controlling interests — — — — — — — — — — — Aggregate tax effect – shareholder tax — — — — — — 9 — 9 — 9 Balance at 31 December 980 200 10,257 (7) 814 (101) 5,065 500 17,708 977 18,685 1 Capital reserves consist of share premium of £1,239 million, a capital redemption reserve of £44 million and a merger reserve of £8,974 million. 2 The Group adopted IFRS 16 Leases from 1 January 2019. In line with the transition options available, prior period comparatives have not been restated and the impact of the adoption has been shown as an adjustment to opening
retained earnings. See accounting policy A for further information. 3 On 17 October 2019, notification was given that the Group would redeem the 6.875% £210 million tier 1 notes. At that date, the instrument was reclassified as a financial liability of £210 million, representing its fair value at that
date. On 21 November 2019, the instrument was redeemed in full at a cost of £210 million. The difference between its carrying amount of £231 million and fair value of £210 million has been charged to retained earnings. See note 37 for further details.
For the year ended 31 December 2018
Ordinary share
capital Note 33
£m
Preference share
capital Note 36
£m
Capital reserves1
Note 33b, 38
£m
Treasury shares
Note 35 £m
Currency translation
reserve Note 39
£m
Other reserves Note 39
£m
Retained earnings Note 40
£m
DCI and tier 1 notes Note 37
£m
Total equity
excluding non-
controlling interests
£m
Non-controlling
interests Note 41
£m
Total equity
£m
Balance at 1 January 1,003 200 10,195 (14) 1,141 (274) 4,918 731 17,900 1,235 19,135 Profit for the year — — — — — — 1,568 — 1,568 119 1,687 Other comprehensive income — — — — 28 (50) (236) — (258) 5 (253) Total comprehensive income for the year — — — — 28 (50) 1,332 — 1,310 124 1,434 Dividends and appropriations — — — — — — (1,189) — (1,189) — (1,189) Non-controlling interests share of dividends declared
in the year — — — — — — — — — (90) (90) Reclassification of tier 1 notes to financial liabilities — — — — — — — — — — — Reserves credit for equity compensation plans — — — — — 64 — — 64 — 64 Shares issued under equity compensation plans 2 — 7 (1) — (55) 49 — 2 — 2 Treasury shares held by subsidiary companies — — — — — — — — — — — Forfeited dividend income — — — — — — 4 — 4 — 4 Changes in non-controlling interests in subsidiaries — — — — (7) — 1 — (6) (306) (312) Change in equity accounted option — — — — — — — — — — — Shares purchased in buy-back2 (30) — 30 — — — (600) — (600) — (600) Transfer to profit on disposal of subsidiaries, joint ventures
and associates — — — — (40) 36 — — (4) — (4) Capital contributions from non-controlling interests — — — — — — — — — 3 3 Aggregate tax effect – shareholder tax — — — — — — 8 — 8 — 8
Balance at 31 December 975 200 10,232 (15) 1,122 (279) 4,523 731 17,489 966 18,455 1 Capital reserves consist of share premium of £1,214 million, a capital redemption reserve of £44 million and a merger reserve of £8,974 million. 2 On 1 May 2018, the Group announced a share buy-back of ordinary shares for an aggregate purchase price of up to £600 million. On completion in 2018 of this buy-back, £600 million of shares had been purchased and shares
with a nominal value of £30 million have been cancelled, giving rise to an additional capital redemption reserve of an equivalent amount. See note 33 for further details of the shares purchased in buy-back.

Consolidated financial statements Continued
The accounting policies (identified alphabetically) on pages 117 to 131 and notes (identified numerically) on pages 139 to 263 are an integral part of the financial statements.
Aviva plc Annual report and accounts 2019 137
Strategic report Governance IFRS financial statements Other information
Consolidated statement of financial position As at 31 December 2019
Note 2019
£m
Restated1 2018
£m
Restated1 1 January 2018
£m
Assets Goodwill O & 17 1,855 1,872 1,876 Acquired value of in-force business and intangible assets O & 18 2,800 3,201 3,455 Interests in, and loans to, joint ventures D & 19 1,227 1,214 1,221 Interests in, and loans to, associates D & 20 304 304 421 Property and equipment P & 21 889 548 509 Investment property Q & 22 11,203 11,482 10,797 Loans V & 25 38,579 36,184 37,227 Financial investments S, T, U & 28 343,418 319,825 331,690 Reinsurance assets N & 47 12,356 11,755 13,492 Deferred tax assets AC & 50 151 185 144 Current tax assets 132 76 94 Receivables 29 8,995 8,639 8,151 Deferred acquisition costs X & 30 3,156 2,965 2,906 Pension surpluses and other assets X & 31 2,799 3,341 3,468 Prepayments and accrued income X & 31(b) 3,143 3,149 3,117 Cash and cash equivalents Y & 59(d) 19,524 15,926 13,377 Assets of operations classified as held for sale AH & 4(b) 9,512 8,855 10,871
Total assets 460,043 429,521 442,816
Equity Capital AE
Ordinary share capital 33 980 975 1,003 Preference share capital 36 200 200 200
1,180 1,175 1,203 Capital reserves
Share premium 33(b) 1,239 1,214 1,207 Capital redemption reserve 33(b) 44 44 14 Merger reserve D & 38 8,974 8,974 8,974
10,257 10,232 10,195 Treasury shares 35 (7) (15) (14) Currency translation reserve 39 814 1,122 1,141 Other reserves 39 (101) (279) (274) Retained earnings 40 5,065 4,523 4,918 Equity attributable to shareholders of Aviva plc 17,208 16,758 17,169 Direct capital instrument and tier 1 notes 37 500 731 731
Equity excluding non-controlling interests 17,708 17,489 17,900 Non-controlling interests 41 977 966 1,235
Total equity 18,685 18,455 19,135 Liabilities Gross insurance liabilities L & 43 149,338 144,077 148,650 Gross liabilities for investment contracts M & 45 222,127 202,468 203,986 Unallocated divisible surplus L & 49 9,597 5,949 9,082 Net asset value attributable to unitholders D 16,610 16,338 18,176 Pension deficits and other provisions AA, AB & 51 1,565 1,399 1,429 Deferred tax liabilities AC & 50 2,155 1,885 2,377 Current tax liabilities 569 254 290 Borrowings AD & 53 9,039 9,420 10,286 Payables and other financial liabilities S & 54 18,138 17,681 16,676 Other liabilities 55 3,094 3,074 2,856 Liabilities of operations classified as held for sale AH & 4(b) 9,126 8,521 9,873
Total liabilities 441,358 411,066 423,681
Total equity and liabilities 460,043 429,521 442,816 1 Following a review of the Group’s presentation of consolidated investment funds, comparative amounts have been restated from those previously reported. The restatement has had no impact on the profit for the year or equity.
See note 1(a) for further information.
Approved by the Board on 4 March 2020
Jason Windsor Chief Financial Officer
Company number: 2468686

Consolidated financial statements Continued
The accounting policies (identified alphabetically) on pages 117 to 131 and notes (identified numerically) on pages 139 to 263 are an integral part of the financial statements.
Aviva plc Annual report and accounts 2019 138
Strategic report Governance IFRS financial statements Other information
Consolidated statement of cash flows For the year ended 31 December 2019
The cash flows presented in this statement cover all the Group’s activities and include flows from both policyholder and shareholder activities. All cash and cash equivalents are available for use by the Group.
Note 2019
£m
Restated1 2018
£m
Cash flows from operating activities2 Cash generated from operating activities 59(a) 6,517 5,848 Tax paid (549) (447)
Total net cash from operating activities 5,968 5,401 Cash flows from investing activities Acquisitions of, and additions to, subsidiaries, joint ventures and associates, net of cash acquired 59(b) (19) 192 Disposals of subsidiaries, joint ventures and associates, net of cash transferred 59(c) 12 381 Purchases of property and equipment 21 (84) (87) Proceeds on sale of property and equipment 4 15 Purchases of intangible assets (63) (64)
Total net cash (used in)/from investing activities (150) 437
Cash flows from financing activities Proceeds from issue of ordinary shares 27 8 Shares purchased in buy-back 33 — (600) Treasury shares purchased for employee trusts (9) (4) New borrowings drawn down, net of expenses 580 3,148 Repayment of borrowings3 (927) (4,181) Net repayment of borrowings 53(e) (347) (1,033) Interest paid on borrowings (553) (551) Preference dividends paid 16 (17) (17) Ordinary dividends paid 16 (1,184) (1,128) Forfeited dividend income 4 4 Coupon payments on direct capital instrument and tier 1 notes 16 (43) (44) Capital contributions from non-controlling interests of subsidiaries 41 — 3 Dividends paid to non-controlling interests of subsidiaries 41 (63) (90) Other4 (5) (13) Total net cash used in financing activities (2,190) (3,465)
Total net increase in cash and cash equivalents 3,628 2,373 Cash and cash equivalents at 1 January 16,051 13,617 Effect of exchange rate changes on cash and cash equivalents (245) 61 Cash and cash equivalents at 31 December 59(d) 19,434 16,051 1 Following a review of the Group’s presentation of consolidated investment funds, comparative amounts have been restated from those previously reported. The restatement has had no impact on the profit for the year or equity.
See note 1(a) for further information. 2 Cash flows from operating activities include interest received of £5,834 million (2018 restated: £5,758 million) and dividends received of £5,614 million (2018 restated: £4,880 million). 3 2019 includes the redemption of 6.875% £210 million tier 1 notes. 2018 includes the redemption of €500 million 6.875% subordinated notes and $575 million 7.875% undated subordinated notes in full at first call dates and the
maturity of €350 million 0.100% senior notes. 4 2019 includes a £5 million (2018: £3 million) donation of forfeited dividend income to a charitable foundation. 2018 also includes £10 million related to goodwill payments to preference shareholders, which was announced on 30
April 2018, and associated administration costs (see note 36).

Notes to the consolidated financial statements
Aviva plc Annual report and accounts 2019 139
Strategic report Governance IFRS financial statements Other information
1 – Changes to comparative amounts (a) Presentation of consolidated investment funds Following a review of the Group’s presentation of consolidated investment funds, corrections to previous reported values on the consolidated statement of financial position and consolidated income statement have been identified (with corresponding impacts on the consolidated statement of cash flows) and comparative amounts have been restated. There has been no impact on profit for the period or equity for any of the periods presented. The nature of the restatements are as follows: • Fixed maturity securities, loans, derivatives and receivables held indirectly through certain majority-owned fund investments in the UK and
France, which in 2018 were presented as cash and cash equivalents, are now presented as financial investments, loans, receivables and payables and other financial liabilities which reflect the classification of the underlying holdings;
• Corrections to the calculation of minority ownership of certain fund investments have resulted in a restatement of net asset value attributable to unitholders and an adjustment to de-consolidate two investment funds where the Group was incorrectly deemed to have been the controlling entity in 2018;
• Corrections to the calculation of minority ownership have resulted in a restatement of the investment income attributable to minority shareholders recorded in fee and commission expense, net investment expense and fee and commission income for the period ending 31 December 2018; and
• Accrued interest on certain fixed maturity securities held indirectly through certain majority-owned funds, which in 2018 was presented within financial investments, is now presented in prepayments and accrued income (consistent with accrued interest on the Group’s directly held fixed maturity securities).
The impact of the changes above on the following captions in the income statement for the prior period presented is shown below:
31 December 2018
As reported
£m
Effect of changes
£m Restated
£m
Fee and commission income 2,180 (2) 2,178 Net investment expense (10,847) (65) (10,912) Fee and commission expense (3,393) 67 (3,326)
The impact of the changes above on the statement of financial position for the prior periods presented is shown below: 31 December 2018 1 January 2018
As reported
£m
Effect of changes
£m Restated
£m As reported
£m
Effect of changes
£m Restated
£m
Assets Loans 28,785 7,399 36,184 27,857 9,370 37,227 Financial investments 297,585 22,240 319,825 311,082 20,608 331,690 Receivables 8,879 (240) 8,639 8,285 (134) 8,151 Prepayments and accrued income 2,947 202 3,149 2,860 257 3,117 Cash and cash equivalents 46,484 (30,558) 15,926 43,347 (29,970) 13,377 Other 45,798 — 45,798 49,254 — 49,254 Total assets 430,478 (957) 429,521 442,685 131 442,816 Liabilities Net asset value attributable to unit holders 18,125 (1,787) 16,338 18,327 (151) 18,176 Payables and other financial liabilities 16,882 799 17,681 16,459 217 16,676 Other liabilities 3,043 31 3,074 2,791 65 2,856 Other 373,973 — 373,973 385,973 — 385,973
Total liabilities 412,023 (957) 411,066 423,550 131 423,681 Total equity 18,455 — 18,455 19,135 — 19,135

Notes to the consolidated financial statements Continued
Aviva plc Annual report and accounts 2019 140
Strategic report Governance IFRS financial statements Other information
1 – Changes to comparative amounts continued (a) Presentation of consolidated investment funds continued The impact of the changes above on the following captions in the statement of cash flows for the prior period presented is shown below:
31 December 2018
As reported
£m
Effect of changes
£m Restated
£m
Cash generated from operating activities 6,405 (557) 5,848
Total net cash from operating activities 5,958 (557) 5,401 Total net increase in cash and cash equivalents 2,930 (557) 2,373 Cash and cash equivalents at 1 January1 43,587 (29,970) 13,617 Effect of exchange rate changes on cash and cash equivalents 92 (31) 61 Cash and cash equivalents at 31 December1 46,609 (30,558) 16,051 1 Cash and cash equivalents shown in the statement of cash flows above include cash and cash equivalents of operations classified as held for sale and bank overdrafts.
The above items have also resulted in a number of corresponding reclassifications in the Group’s fair value hierarchy level disclosures included in note 24. The primary changes reflect: • The inclusion of fixed maturity securities in level 2 and loans in amortised cost (the assets were previously classified as cash and cash
equivalents and therefore not included in the fair value hierarchy); and • A reduction in financial investments reflecting the de-consolidation of two investment funds where the Group was incorrectly deemed to
have been the controlling entity.
Additionally, following the review, £33,050 million of fixed maturity securities previously included within level 1 have been reclassified to level 2 at 31 December 2018.
(b) Amendment to Group adjusted operating profit For 2019, the Group adjusted operating profit APM has been amended and now includes amortisation and impairment of internally generated intangible assets to provide more relevant information by better reflecting their operational nature. These assets include advisor platforms, digital distribution channels and claims and policy administration systems which are used to support operational activities. Group adjusted operating profit continues to exclude amortisation and impairment of intangible assets acquired in business combinations as these items principally relate to merger and acquisition activity which we view as strategic in nature. The effect of this change is to move £112 million relating to amortisation of internally generated intangible assets into Group adjusted operating profit for 2018. The 2018 comparative figures have been restated in the Reconciliation of Group adjusted operating profit to profit for the year and the Segmental income statement (see note 5). The relevant EPS metrics (operating EPS and diluted operating EPS) for 2018 have also been restated (see note 15). There is no impact from this change on profit before tax attributable to shareholders’ profit.

Notes to the consolidated financial statements Continued
Aviva plc Annual report and accounts 2019 141
Strategic report Governance IFRS financial statements Other information
2 – Exchange rates The Group’s principal overseas operations during the year were located within the eurozone, Canada and Poland. The results and cash flows of these operations have been translated into sterling at the average rates for the year, and the assets and liabilities have been translated at the year end rates as follows:
2019 2018
Eurozone Average rate (€1 equals) £0.88 £0.88 Year end rate (€1 equals) £0.85 £0.90 Canada Average rate ($CAD1 equals) £0.59 £0.58 Year end rate ($CAD1 equals) £0.58 £0.57 Poland Average rate (PLN1 equals) £0.20 £0.21 Year end rate (PLN1 equals) £0.20 £0.21
3 – Subsidiaries, joint ventures and associates – acquisitions The Group completed minor acquisitions in Canada, the UK and France in 2019. The aggregate consideration paid in these transactions was £20 million. With the exception of the acquisition of an associate in Canada, the acquired entities are all consolidated subsidiaries. During 2019, an adjustment of £2 million was made to the acquisition balance sheet of Friends Life Assurance Company DAC (Friends First), which became a wholly owned subsidiary on 1 June 2018. This resulted in a corresponding decrease in the negative goodwill previously recognised.
4 – Subsidiaries, joint ventures and associates – disposals and held for sale This note provides details of the disposals of subsidiaries, joint ventures and associates that the Group has made during the year, together with details of businesses held for sale at the year end.
(a) Summary The profit on the disposal and remeasurement of subsidiaries, joint ventures and associates comprises:
2019
£m 2018
£m
Disposals 6 113 Held for sale remeasurements (28) (13) Remeasurements due to change in control status — 2
Total (loss)/profit on disposal and remeasurements (22) 102
The loss on the disposal and remeasurement of subsidiaries, joint ventures and associates during the year of £22 million (2018: £102 million gain) consists of £6 million of gains relating to small disposals and a £28 million remeasurement loss relating to Friends Provident International Limited (FPI), see note 4(b) for further details. In 2018, the profit on disposal of £113 million primarily related to the disposals of Avipop Assicurazioni S.p.A. (Italy Avipop) and three businesses in Spain and the remeasurement loss of £13 million was related to FPI.

Notes to the consolidated financial statements Continued
Aviva plc Annual report and accounts 2019 142
Strategic report Governance IFRS financial statements Other information
4 – Subsidiaries, joint ventures and associates – disposals and held for sale continued (b) Assets and liabilities of operations classified as held for sale The assets and liabilities of operations classified as held for sale as at 31 December 2019 are as follows:
2019
£m 2018
£m
Assets Acquired value of in-force business and intangible assets 526 660 Interests in, and loans to, joint ventures and associates 8 — Property and equipment 8 5 Loans 1 — Financial investments 7,824 7,251 Reinsurance assets 75 45 Other assets 290 206 Cash and cash equivalents 780 688 Total assets 9,512 8,855
Liabilities Gross insurance liabilities 687 121 Gross liabilities for investment contracts 8,324 8,341 External borrowings 28 — Other liabilities 87 59
Total liabilities 9,126 8,521
Net assets 386 334
Assets and liabilities of operations classified as held for sale as at 31 December 2019 relate primarily to the expected disposal of the international operations of FPI and also include Group’s operations in Hong Kong. See below for further details. Assets and liabilities of operations classified as held for sale during 2018 relate entirely to FPI.
(i) FPI On 19 July 2017, Aviva announced the sale of FPI to RL360 Holding Company Limited, a subsidiary of International Financial Group Limited, for a total consideration of £340 million, and FPI has been reported as held for sale by the Group since 31 December 2017. The conditions defined in IFRS 5 for a subsidiary to be classified as held for sale include the presumption that the sale will be completed within 12 months of the date of reclassification. However, if events or circumstances extend the period to complete the sale beyond 12 months, a held for sale classification continues to be appropriate if certain conditions are met.
The transaction remains subject to regulatory approvals. The delays to receiving these approvals have been beyond the control of the Group and both the Group and RL360 have continued to cooperate with the regulatory approval process throughout. The Group remains committed to completing the transaction and now expects it to complete in 2020. As such, the subsidiary continues to be classified as held for sale and has been remeasured at fair value less costs to sell of £334 million, based on the agreed price. This resulted in a total loss on remeasurement of £28 million in 2019 (2018: £13 million) (see note 18). The business remains a consolidated subsidiary of Aviva at the balance sheet date.
(ii) Hong Kong joint venture On 20 November 2019, Aviva announced the sale of its entire 40% shareholding in its Hong Kong joint venture (Blue) to Hillhouse AV Holdings Limited for 450 million HKD (approximately £44 million). In addition to the investment in the joint venture, Aviva retained control of certain activities under the previous sale agreement reached in 2018, which remain fully consolidated at the balance sheet date, and which form part of the sale agreement to Hillhouse AV Holding Limited. No remeasurement loss has been recognised on reclassification to held for sale.
(c) Significant restrictions In certain jurisdictions the ability of subsidiaries to transfer funds to the Group in the form of cash dividends or to repay loans and advances is subject to local corporate or insurance laws and regulations and solvency requirements. There are no protective rights of non-controlling interests which significantly restrict the Group’s ability to access or use the assets and settle the liabilities of the Group.
Notes to the consolidated financial statements Continued
Aviva plc Annual report and accounts 2019 143
Strategic report Governance IFRS financial statements Other information
5 – Segmental information The Group’s results can be segmented either by activity or by geography. Our primary reporting format is along market reporting lines, with supplementary information being given by business activity. This note provides segmental information on the consolidated income statement. In November 2019 the Group announced the creation of new divisions. From 2020 UK Life will focus on three product lines – annuities and equity release, protection and health and heritage. The Investments, Savings and Retirement division, will bring together Aviva Investors and the modern UK Savings and Retirement business that is currently reported in UK Life. The global General Insurance division will report the results of the UK, Canada and our European and Asian general insurance businesses. Europe Life and Asia Life will no longer include the results of the European and Asian general insurance businesses. The following segments represent how the business has been managed in 2019 and are consistent with the segments presented in 2018.
(a) Operating segments United Kingdom The United Kingdom comprises two operating segments – Life and General Insurance. The principal activities of our UK Life operations are life insurance, long-term health and accident insurance, savings, pensions and annuity business. UK General Insurance provides insurance cover to individuals and businesses, for risks associated mainly with motor vehicles, property and liability (such as employers’ liability and professional indemnity liability) and medical expenses.
Canada The principal activity of our operation in Canada is general insurance. In particular it provides personal and commercial lines insurance products principally distributed through insurance brokers.
France The principal activities of our operations in France are long-term business and general insurance. The long-term business offers a range of long-term insurance and savings products, primarily for individuals, with a focus on the unit-linked market. The general insurance business predominantly sells personal and small commercial lines insurance products through agents and a direct insurer.
Poland Activities in Poland comprise long-term business and general insurance and includes our long-term business in Lithuania.
Italy, Ireland and Other These countries are not individually significant at a Group level, so have been aggregated into a single reporting segment in line with IFRS 8 Operating Segments. The principal activities of our operations in Italy and Ireland are long-term business and general insurance. Our ‘Other’ operations include our life operations in Turkey. This segment also includes Friends First, which was acquired on 1 June 2018. The comparative results include our operations within Spain up to the date of disposal (Caja Murcia Vida and Caja Granada Vida on 11 July 2018 and Pelayo Vida on 1 October 2018), the principal activity of which was the sale of accident and health insurance and a selection of savings products. The comparative results also include Avipop, part of our operations in Italy, up to the date of disposal on 29 March 2018.
Asia Our activities in Asia principally comprise our long-term business operations in China, India, Singapore, Hong Kong (see note 4(b)), Vietnam, Indonesia, and FPI (see note 4(b)). This segment also includes general insurance and health operations in Singapore and health operations in Indonesia.
Aviva Investors Aviva Investors operates in most of the markets in which the Group operates, in particular the UK, France, North America and Asia Pacific. Aviva Investors manages policyholders’ and shareholders’ invested funds, provides investment management services for institutional pension fund mandates and manages a range of retail investment products. These include investment funds, unit trusts, open-ended investment companies and individual savings accounts.
Other Group activities Investment return on centrally held assets and head office expenses, such as Group treasury and finance functions, together with certain taxes and financing costs arising on central borrowings are included in ‘Other Group activities’. The results of our internal reinsurance operations and the Group’s interest in Wealthify are also included in this segment, as are the elimination entries for certain inter-segment transactions and group consolidation adjustments.

Notes to the consolidated financial statements Continued
Aviva plc Annual report and accounts 2019 144
Strategic report Governance IFRS financial statements Other information
5 – Segmental information continued Measurement basis The accounting policies of the segments are the same as those for the Group as a whole. Any transactions between the business segments are subject to normal commercial terms and market conditions. The Group evaluates performance of operating segments on the basis of: (i) profit or loss from operations before tax attributable to shareholders (ii) profit or loss from operations before tax attributable to shareholders, adjusted for items outside the segment management’s control,
including investment market performance and fiscal policy changes.
(a) (i) Segmental income statement for the year ended 31 December 2019
United Kingdom Europe
Life £m
GI £m
Canada £m
France £m
Poland £m
Italy, Ireland and
Other £m
Asia £m
Aviva Investors
£m
Other Group
activities2 £m
Total £m
Gross written premiums 8,596 4,624 3,204 6,883 643 5,761 1,532 — — 31,243 Premiums ceded to reinsurers (2,271) (406) (143) (86) (12) (264) (381) — — (3,563) Internal reinsurance revenue — — — — — — 1 — (1) — Premiums written net of reinsurance 6,325 4,218 3,061 6,797 631 5,497 1,152 — (1) 27,680 Net change in provision for unearned premiums (2) (57) (99) (28) 2 (9) (16) — — (209) Net earned premiums 6,323 4,161 2,962 6,769 633 5,488 1,136 — (1) 27,471 Fee and commission income 951 113 24 305 99 123 205 320 1 2,141 7,274 4,274 2,986 7,074 732 5,611 1,341 320 — 29,612 Net investment income 27,070 254 171 6,267 155 4,352 967 61 1,280 40,577 Inter-segment revenue — — — — — — — 247 — 247 Share of profit of joint ventures and associates 20 — — 48 — 12 33 — (28) 85 Profit/(loss) on the disposal and remeasurement of
subsidiaries, joint ventures and associates — — 6 — — — (28) — — (22) Segmental income1 34,364 4,528 3,163 13,389 887 9,975 2,313 628 1,252 70,499 Claims and benefits paid, net of recoveries from reinsurers (9,569) (2,614) (1,938) (4,751) (380) (2,820) (1,003) — (21) (23,096) Change in insurance liabilities, net of reinsurance (3,428) (53) (16) (1,112) (49) (1,062) (32) — 50 (5,702) Change in investment contract provisions (16,411) — — (4,041) 1 (3,365) (216) (63) — (24,095) Change in unallocated divisible surplus 162 — — (2,010) (4) (1,764) (369) — — (3,985) Fee and commission expense (669) (1,265) (823) (816) (156) (352) (257) (27) (1,171) (5,536) Other expenses (1,332) (298) (162) (246) (95) (230) (283) (447) (236) (3,329) Inter-segment expenses (218) (6) (6) (2) (5) (10) — — — (247) Finance costs (159) (4) (7) (1) (1) (6) (8) — (390) (576) Segmental expenses (31,624) (4,240) (2,952) (12,979) (689) (9,609) (2,168) (537) (1,768) (66,566) Profit/(loss) before tax 2,740 288 211 410 198 366 145 91 (516) 3,933 Tax attributable to policyholders’ returns (487) — — — — (14) (58) — — (559) Profit/(loss) before tax attributable to shareholders’
profits 2,253 288 211 410 198 352 87 91 (516) 3,374 Adjusting items: Reclassification of corporate costs and unallocated interest — (8) 33 46 — — — 5 (76) — Life business: Investment variances and economic
assumption changes (695) — — 84 (4) (42) 10 — (7) (654) Non-life business: Short-term fluctuation in return on
investments — (102) (64) (95) (5) (33) — — 132 (167) General insurance and health business: Economic
assumption changes — 27 2 24 — — — — 1 54 Impairment of goodwill, joint ventures, associates and other
amounts expensed — — 2 — — — 13 — — 15 Amortisation and impairment of intangibles acquired in
business combinations 54 — 13 2 5 2 11 — — 87 Amortisation and impairment of AVIF 243 — — 2 — 33 126 — 2 406 (Profit)/loss on the disposal and remeasurement of
subsidiaries, joint ventures and associates — — (6) — — — 28 — — 22 Other3 — 45 — — — 2 — — — 47 Group adjusted operating profit/(loss) before tax
attributable to shareholders’ profits 1,855 250 191 473 194 314 275 96 (464) 3,184 1 Total reported income, excluding inter-segment revenue, includes £39,041 million from the United Kingdom (Aviva plc’s country of domicile). Income is attributed on the basis of geographical origin which does not differ materially
from revenue by geographical destination, as most risks are located in the countries where the contracts were written. 2 Other Group activities include internal reinsurance and net expenses of £15 million in relation to the UK digital business. The reduction of £165 million from 2018 reflects the alignment of the UK digital business with the UK Life
and UK GI businesses during the year. 3 Other includes a charge of £45 million in relation to a change in the discount rate used for estimating lump sum payments in settlement of bodily injury claims (see note 44(b)) and a charge of £2 million relating to the negative
goodwill that arose on acquisition of Friends First (see note 3).

Notes to the consolidated financial statements Continued
Aviva plc Annual report and accounts 2019 145
Strategic report Governance IFRS financial statements Other information
5 – Segmental information continued (a) (ii) Segmental income statement for the year ended 31 December 2018 – restated1,2
United Kingdom Europe
Life £m
GI £m
Canada £m
France £m
Poland £m
Italy, Ireland,
Spain and Other
£m Asia £m
Aviva Investors4
£m
Other Group
activities5
£m Total
£m
Gross written premiums 7,302 4,504 3,047 5,584 616 6,504 1,102 — — 28,659 Premiums ceded to reinsurers (1,666) (317) (119) (77) (12) (113) (20) — (2) (2,326) Internal reinsurance revenue — 6 — — — (2) (7) — 3 — Premiums written net of reinsurance 5,636 4,193 2,928 5,507 604 6,389 1,075 — 1 26,333 Net change in provision for unearned premiums 14 (87) 27 (38) 7 9 (13) — — (81)
Net earned premiums 5,650 4,106 2,955 5,469 611 6,398 1,062 — 1 26,252 Fee and commission income 939 122 24 313 94 113 202 368 3 2,178 6,589 4,228 2,979 5,782 705 6,511 1,264 368 4 28,430 Net investment (expense)/income (6,771) 16 51 (2,302) (73) (1,111) (286) 37 (473) (10,912) Inter-segment revenue — — — — — — — 259 — 259 Share of profit of joint ventures and associates 144 — 1 9 — 10 14 — (66) 112 Profit/(loss) on the disposal and remeasurement of subsidiaries,
joint ventures and associates — — — — — 89 (5) 27 (9) 102
Segmental income3 (38) 4,244 3,031 3,489 632 5,499 987 691 (544) 17,991
Claims and benefits paid, net of recoveries from reinsurers (10,184) (2,731) (1,989) (4,659) (356) (2,595) (570) — (58) (23,142) Change in insurance liabilities, net of reinsurance 6,184 351 (133) 557 148 (872) (40) — 51 6,246 Change in investment contract provisions 7,540 — — 27 — (2,249) 42 (39) — 5,321 Change in unallocated divisible surplus 270 — — 1,754 12 1,063 138 — — 3,237 Fee and commission expense (738) (1,225) (791) (484) (146) (343) (199) (33) 633 (3,326) Other expenses (1,663) (220) (182) (256) (106) (188) (272) (449) (507) (3,843) Inter-segment expenses (232) (5) (6) (1) (6) (7) — — (2) (259) Finance costs (172) (1) (5) (1) — (5) (3) — (386) (573)
Segmental expenses 1,005 (3,831) (3,106) (3,063) (454) (5,196) (904) (521) (269) (16,339)
Profit/(loss) before tax 967 413 (75) 426 178 303 83 170 (813) 1,652 Tax attributable to policyholders’ returns 469 — — — — 1 7 — — 477 Profit/(loss) before tax attributable to shareholders’ profits 1,436 413 (75) 426 178 304 90 170 (813) 2,129
Adjusting items: Reclassification of corporate costs and unallocated interest — (16) 31 48 — (1) — 5 (67) — Life business: Investment variances and economic assumption
changes 115 — — (6) 10 57 21 — — 197 Non-life business: Short-term fluctuation in return on investments — 172 45 44 2 57 — — 156 476 General insurance and health business: Economic assumption
changes — 4 — (5) — — — — — (1) Impairment of goodwill, joint ventures, associates and other
amounts expensed — — — — 2 — 3 — 8 13 Amortisation and impairment of intangibles acquired in business
combinations 50 — 26 1 6 2 12 — — 97 Amortisation and impairment of AVIF 285 — — 2 — 6 130 — 3 426 (Profit)/loss on the disposal and remeasurement of subsidiaries,
joint ventures and associates — — — — — (89) 5 (27) 9 (102) Other6 — (190) — — — (36) — — (5) (231) Group adjusted operating profit/(loss) before tax attributable to
shareholders’ profits 1,886 383 27 510 198 300 261 148 (709) 3,004 1 Following a review of the Group’s presentation of consolidated investment funds, comparative amounts have been restated from those previously reported. The restatement has had no impact on the profit for the year or equity.
As a result of the review, there have been reclassifications between operating segments to ensure a consistent presentation of investment fund consolidation entries in the Other Group Activities segment. These consolidation adjustment reclassifications relate to UK property funds (£66 million reclassified to Other Group Activities, which predominately includes net investment expense (£78 million), other expenses (£24 million credit) and finance costs (£15 million)). This segmental restatement has had no impact on the consolidated income statement. See note 1(a) for further information.
2 During 2019 the Group adjusted operating profit APM has been revised and now includes the amortisation and impairment of internally generated intangible assets to better reflect the operational nature of these assets (see note 1(b)). Group adjusted operating profit continues to exclude amortisation and impairment of intangible assets acquired in business combinations. Comparative amounts have been restated resulting in a reduction in the prior period Group adjusted operating profit of £112 million. There is no impact on profit before tax attributable to shareholders’ profit.
3 Total reported income, excluding inter-segment revenue, includes £4,412 million from the United Kingdom (Aviva plc’s country of domicile). Income is attributed on the basis of geographical origin which does not differ materially from revenue by geographical destination, as most risks are located in the countries where the contracts were written.
4 Aviva Investors adjusted operating profit includes £1 million profit relating to the Aviva Investors Pensions Limited business. 5 Other Group activities include internal reinsurance and net expenses of £180 million (restated) in relation to the UK digital business. 6 Other includes a movement in the discount rate used for estimating lump sum payments in settlement of bodily injury claims which resulted in a gain of £190 million, a provision release of £78 million relating to the sale of Aviva
USA in 2013, a gain of £36 million relating to negative goodwill on the acquisition of Friends First, a charge of £63 million relating to the UK defined benefit pension scheme as a result of the requirement to equalise members’ benefits for the effects of Guaranteed Minimum Pension and a charge of £10 million relating to the goodwill payments to preference shareholders, which was announced on 30 April 2018, and associated administration costs.

Notes to the consolidated financial statements Continued
Aviva plc Annual report and accounts 2019 146
Strategic report Governance IFRS financial statements Other information
5 – Segmental information continued (b) Further analysis by products and services The Group’s results can be further analysed by products and services which comprise long-term business, general insurance and health, fund management and other activities.
Long-term business Our long-term business comprises life insurance, long-term health and accident insurance, savings, pensions and annuity business written by our life insurance subsidiaries, including managed pension fund business. Long-term business also includes our share of the other life and related business written in our associates and joint ventures, as well as lifetime mortgage business written in the UK.
General insurance and health Our general insurance and health business provides insurance cover to individuals and to small and medium-sized businesses, for risks associated mainly with motor vehicles, property and liability, such as employers’ liability and professional indemnity liability, and medical expenses.
Fund management Our fund management business invests policyholders’ and shareholders’ funds and provides investment management services for institutional pension fund mandates. It manages a range of retail investment products, including investment funds, unit trusts, open-ended investment companies and individual savings accounts. Clients include Aviva Group businesses and third-party financial institutions, pension funds, public sector organisations, investment professionals and private investors.
Other ‘Other’ includes service companies, head office expenses, such as Group treasury and finance functions, and certain financing costs and taxes not allocated to business segments and elimination entries for certain inter-segment transactions and group consolidation adjustments.
(b) (i) Segmental income statement – products and services for the year ended 31 December 2019
Long-term business
£m
General insurance and
health2 £m
Fund management
£m Other3
£m Total
£m
Gross written premiums1 20,335 10,908 — — 31,243 Premiums ceded to reinsurers (2,879) (684) — — (3,563) Premiums written net of reinsurance 17,456 10,224 — — 27,680 Net change in provision for unearned premiums — (209) — — (209) Net earned premiums 17,456 10,015 — — 27,471 Fee and commission income 1,490 126 319 206 2,141 18,946 10,141 319 206 29,612 Net investment income/(expense) 38,722 622 (1) 1,234 40,577 Inter-segment revenue — — 250 — 250 Share of profit of joint ventures and associates 113 — — (28) 85 (Loss)/profit on the disposal and remeasurement of subsidiaries, joint ventures and associates (28) 6 — — (22) Segmental income 57,753 10,769 568 1,412 70,502 Claims and benefits paid, net of recoveries from reinsurers (16,612) (6,484) — — (23,096) Change in insurance liabilities, net of reinsurance (5,566) (136) — — (5,702) Change in investment contract provisions (24,095) — — — (24,095) Change in unallocated divisible surplus (3,985) — — — (3,985) Fee and commission expense (1,546) (2,672) (27) (1,291) (5,536) Other expenses (1,850) (649) (453) (377) (3,329) Inter-segment expenses (237) (13) — — (250) Finance costs (170) (10) — (396) (576) Segmental expenses (54,061) (9,964) (480) (2,064) (66,569) Profit/(loss) before tax 3,692 805 88 (652) 3,933 Tax attributable to policyholders’ returns (559) — — — (559) Profit/(loss) before tax attributable to shareholders’ profits 3,133 805 88 (652) 3,374 Adjusting items (133) (161) 4 100 (190) Group adjusted operating profit/(loss) before tax attributable to shareholders’ profits 3,000 644 92 (552) 3,184 1 Gross written premiums include inward reinsurance premiums assumed from other companies amounting to £62 million, which all relates to property and liability insurance. 2 General insurance and health business segment includes gross written premiums of £944 million relating to health business. The remaining business relates to property and liability insurance. 3 Other includes net expenses of £15 million in relation to the UK digital business. The reduction of £165 million from 2018 reflects the alignment of the UK digital business with the UK long-term and general insurance businesses
during the year.

Notes to the consolidated financial statements Continued
Aviva plc Annual report and accounts 2019 147
Strategic report Governance IFRS financial statements Other information
5 – Segmental information continued (b) (ii) Segmental income statement – products and services for the year ended 31 December 2018 – restated1, 2
Long-term business
£m
General insurance and
health4
£m
Fund management
£m Other5
£m Total
£m
Gross written premiums3 18,140 10,519 — — 28,659 Premiums ceded to reinsurers (1,775) (551) — — (2,326) Premiums written net of reinsurance 16,365 9,968 — — 26,333 Net change in provision for unearned premiums — (81) — — (81)
Net earned premiums 16,365 9,887 — — 26,252 Fee and commission income 1,496 138 365 179 2,178 17,861 10,025 365 179 28,430 Net investment (expense)/income (10,453) 63 (1) (521) (10,912) Inter-segment revenue — — 263 — 263 Share of profit of joint ventures and associates 178 — — (66) 112 Profit/(loss) on the disposal and remeasurement of subsidiaries, joint ventures and associates 84 — 27 (9) 102 Segmental income 7,670 10,088 654 (417) 17,995
Claims and benefits paid, net of recoveries from reinsurers (16,540) (6,602) — — (23,142) Change in insurance liabilities, net of reinsurance 6,044 202 — — 6,246 Change in investment contract provisions 5,321 — — — 5,321 Change in unallocated divisible surplus 3,237 — — — 3,237 Fee and commission expense (1,245) (2,592) (31) 542 (3,326) Other expenses (2,128) (596) (461) (658) (3,843) Inter-segment expenses (249) (12) — (2) (263) Finance costs (179) (6) — (388) (573)
Segmental expenses (5,739) (9,606) (492) (506) (16,343)
Profit/(loss) before tax 1,931 482 162 (923) 1,652 Tax attributable to policyholders’ returns 477 — — — 477 Profit/(loss) before tax attributable to shareholders’ profits 2,408 482 162 (923) 2,129 Adjusting items 568 169 (19) 157 875
Group adjusted operating profit/(loss) before tax attributable to shareholders’ profits 2,976 651 143 (766) 3,004 1 Following a review of the Group’s presentation of consolidated investment funds, comparative amounts have been restated from those previously reported. The restatement has had no impact on the profit for the year or equity.
As a result of the review, there have been reclassifications between operating segments to ensure a consistent presentation of investment fund consolidation entries in the Other segment. These consolidation adjustment reclassifications relate to property funds (£66 million reclassified from Long-term business to Other, which predominately includes net investment expense (£78 million), other expenses (£24 million credit) and finance costs (£15 million)). This segmental restatement has had no impact on the consolidated income statement. See note 1(a) for further information.
2 During 2019 the Group adjusted operating profit APM has been revised and now includes the amortisation and impairment of internally generated intangible assets to better reflect the operational nature of these assets (see note 1(b)). Group adjusted operating profit continues to exclude amortisation and impairment of intangible assets acquired in business combinations. Comparative amounts have been restated resulting in a reduction in the prior period Group adjusted operating profit of £112 million. There is no impact on profit before tax attributable to shareholders’ profit.
3 Gross written premiums include inward reinsurance premiums assumed from other companies amounting to £56 million which all relates to property and liability insurance. 4 General insurance and health business segment includes gross written premiums of £879 million relating to health business. The remaining business relates to property and liability insurance. 5 Other includes net expenses of £180 million (restated) in relation to the UK digital business.
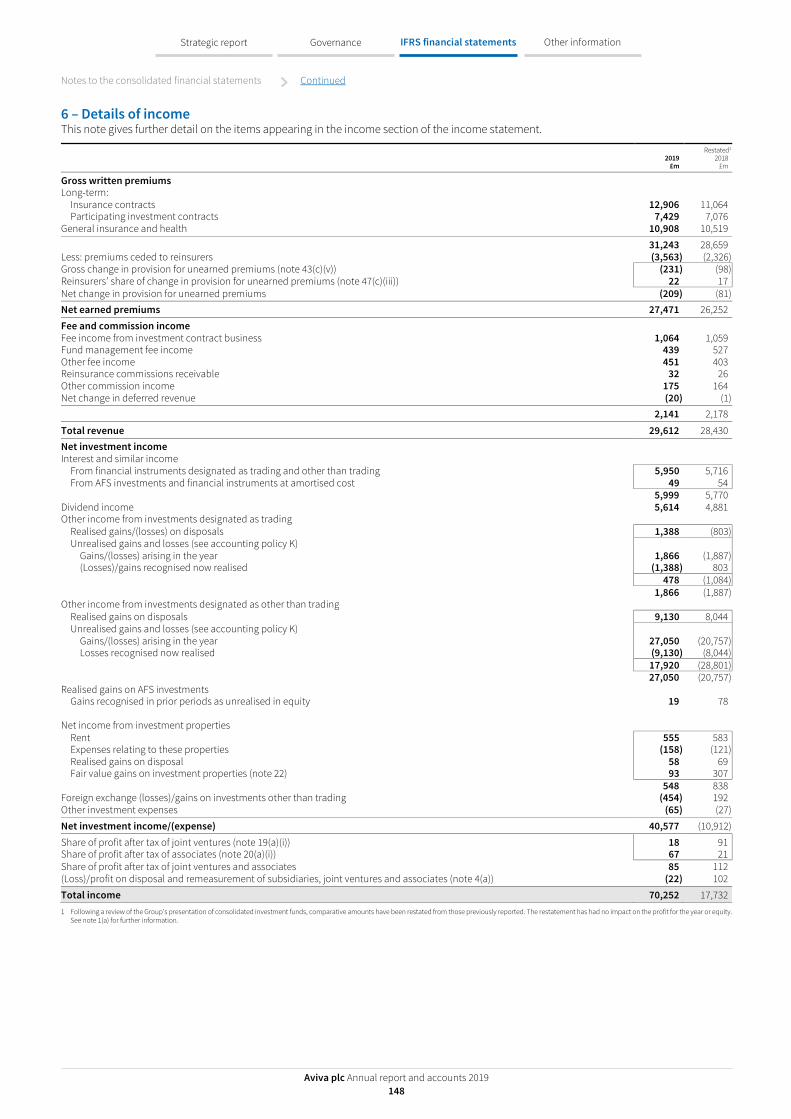
Notes to the consolidated financial statements Continued
Aviva plc Annual report and accounts 2019 148
Strategic report Governance IFRS financial statements Other information
6 – Details of income This note gives further detail on the items appearing in the income section of the income statement.
2019
£m
Restated1
2018 £m
Gross written premiums Long-term:
Insurance contracts 12,906 11,064 Participating investment contracts 7,429 7,076
General insurance and health 10,908 10,519
31,243 28,659 Less: premiums ceded to reinsurers (3,563) (2,326) Gross change in provision for unearned premiums (note 43(c)(v)) (231) (98) Reinsurers’ share of change in provision for unearned premiums (note 47(c)(iii)) 22 17 Net change in provision for unearned premiums (209) (81) Net earned premiums 27,471 26,252
Fee and commission income Fee income from investment contract business 1,064 1,059 Fund management fee income 439 527 Other fee income 451 403 Reinsurance commissions receivable 32 26 Other commission income 175 164 Net change in deferred revenue (20) (1) 2,141 2,178
Total revenue 29,612 28,430 Net investment income Interest and similar income
From financial instruments designated as trading and other than trading 5,950 5,716 From AFS investments and financial instruments at amortised cost 49 54
5,999 5,770 Dividend income 5,614 4,881 Other income from investments designated as trading
Realised gains/(losses) on disposals 1,388 (803) Unrealised gains and losses (see accounting policy K)
Gains/(losses) arising in the year 1,866 (1,887) (Losses)/gains recognised now realised (1,388) 803
478 (1,084) 1,866 (1,887) Other income from investments designated as other than trading
Realised gains on disposals 9,130 8,044 Unrealised gains and losses (see accounting policy K)
Gains/(losses) arising in the year 27,050 (20,757) Losses recognised now realised (9,130) (8,044)
17,920 (28,801) 27,050 (20,757) Realised gains on AFS investments
Gains recognised in prior periods as unrealised in equity 19 78 Net income from investment properties
Rent 555 583 Expenses relating to these properties (158) (121) Realised gains on disposal 58 69 Fair value gains on investment properties (note 22) 93 307
548 838 Foreign exchange (losses)/gains on investments other than trading (454) 192 Other investment expenses (65) (27)
Net investment income/(expense) 40,577 (10,912)
Share of profit after tax of joint ventures (note 19(a)(i)) 18 91 Share of profit after tax of associates (note 20(a)(i)) 67 21 Share of profit after tax of joint ventures and associates 85 112 (Loss)/profit on disposal and remeasurement of subsidiaries, joint ventures and associates (note 4(a)) (22) 102
Total income 70,252 17,732 1 Following a review of the Group’s presentation of consolidated investment funds, comparative amounts have been restated from those previously reported. The restatement has had no impact on the profit for the year or equity.
See note 1(a) for further information.

Notes to the consolidated financial statements Continued
Aviva plc Annual report and accounts 2019 149
Strategic report Governance IFRS financial statements Other information
7 – Details of expenses This note gives further detail on the items appearing in the expenses section of the income statement.
2019
£m
Restated1
2018 £m
Claims and benefits paid Claims and benefits paid to policyholders on long-term business
Insurance contracts 13,017 12,163 Participating investment contracts 5,333 6,117 Non-participating investment contracts 7 8
Claims and benefits paid to policyholders on general insurance and health business 6,765 6,913
25,122 25,201 Less: Claim recoveries from reinsurers
Insurance contracts (2,029) (1,984) Participating investment contracts 3 (75)
Claims and benefits paid, net of recoveries from reinsurers 23,096 23,142
Change in insurance liabilities Change in insurance liabilities (note 42(b)) 6,824 (6,415) Change in reinsurance asset for insurance provisions (note 42(b)) (1,122) 169
Change in insurance liabilities, net of reinsurance 5,702 (6,246)
Change in investment contract provisions Investment expense/(income) allocated to investment contracts 14,972 (6,128) Other changes in provisions
Participating investment contracts (note 45(c)(i)) 7,365 540 Non-participating investment contracts 1,767 272
Change in reinsurance asset for investment contract provisions (9) (5)
Change in investment contract provisions 24,095 (5,321)
Change in unallocated divisible surplus (note 49) 3,985 (3,237)
Fee and commission expense Acquisition costs
Commission expenses for insurance and participating investment contracts 2,829 2,678 Change in deferred acquisition costs for insurance and participating investment contracts (163) (183) Deferrable costs for non-participating investment contracts 39 32 Other acquisition costs 1,048 996 Change in deferred acquisition costs for non-participating investment contracts (83) 84
Investment expense/(income) attributable to unitholders 1,355 (771) Reinsurance commissions and other fee and commission expense 511 490
5,536 3,326
Other expenses Other operating expenses
Staff costs (note 11(b)) 1,161 1,172 Central costs and sharesave schemes 183 216 Depreciation 98 40 Impairment of goodwill on subsidiaries (note 17(a)) 6 13 Amortisation of acquired value of in-force business on insurance/investment contracts (note 18) 406 426 Amortisation of intangible assets (note 18) 212 209 Impairment of intangible assets (note 18) 13 — Other expenses (see below) 1,345 1,729
Impairments Net impairment on loans 4 1 Net impairment on receivables and other financial assets 10 9 Other net foreign exchange losses (109) 28
Other expenses 3,329 3,843
Finance costs (note 8) 576 573
Total expenses 66,319 16,080 1 Following a review of the Group’s presentation of consolidated investment funds, comparative amounts have been restated from those previously reported. The restatement has had no impact on the profit for the year or equity.
See note 1(a) for further information.
Other expenses were £1,345 million (2018: £1,729 million) which included costs relating to property, IT and a charge of £2 million relating to negative goodwill on the acquisition of Friends First. Other expenses in 2018 included a provision release of £78 million relating to the sale of Aviva USA in 2013, a gain of £36 million relating to negative goodwill on the acquisition of Friends First, a charge of £63 million relating to the UK defined benefit pension scheme as a result of the requirement to equalise members’ benefits for the effects of Guaranteed Minimum Pension (see note 52(b)) and a charge of £10 million relating to goodwill payments to preference shareholders, which was announced on 30 April 2018, and associated administration costs.
Change in insurance liabilities includes a charge of £45 million (2018: gain of £190 million) relating to the movement in the discount rate used for estimating lump sum payments in settlement of bodily injury claims (see note 44(b)).

Notes to the consolidated financial statements Continued
Aviva plc Annual report and accounts 2019 150
Strategic report Governance IFRS financial statements Other information
8 – Finance costs This note analyses the interest costs on our borrowings (which are described in note 53) and similar charges. Finance costs comprise:
2019
£m 2018
£m
Interest expense on core structural borrowings Subordinated debt 336 364 Long term senior debt 16 6 Commercial paper (1) (2)
351 368
Interest expense on operational borrowings Amounts owed to financial institutions 21 20 Securitised mortgage loan notes at fair value 77 95
98 115
Interest on collateral received 10 8 Net finance charge on pension schemes (note 52(b)(i)) 23 22 Interest on lease liabilities 14 — Other similar charges 80 60 Total finance costs 576 573
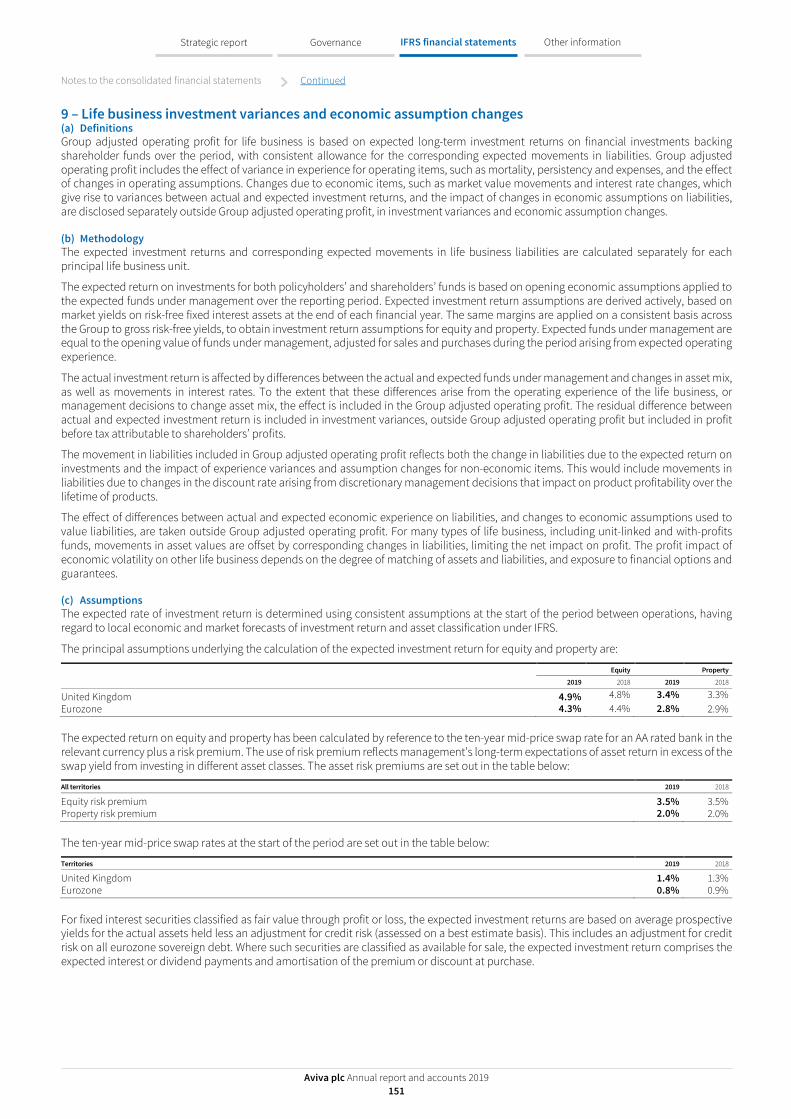
Notes to the consolidated financial statements Continued
Aviva plc Annual report and accounts 2019 151
Strategic report Governance IFRS financial statements Other information
9 – Life business investment variances and economic assumption changes (a) Definitions Group adjusted operating profit for life business is based on expected long-term investment returns on financial investments backing shareholder funds over the period, with consistent allowance for the corresponding expected movements in liabilities. Group adjusted operating profit includes the effect of variance in experience for operating items, such as mortality, persistency and expenses, and the effect of changes in operating assumptions. Changes due to economic items, such as market value movements and interest rate changes, which give rise to variances between actual and expected investment returns, and the impact of changes in economic assumptions on liabilities, are disclosed separately outside Group adjusted operating profit, in investment variances and economic assumption changes.
(b) Methodology The expected investment returns and corresponding expected movements in life business liabilities are calculated separately for each principal life business unit.
The expected return on investments for both policyholders’ and shareholders’ funds is based on opening economic assumptions applied to the expected funds under management over the reporting period. Expected investment return assumptions are derived actively, based on market yields on risk-free fixed interest assets at the end of each financial year. The same margins are applied on a consistent basis across the Group to gross risk-free yields, to obtain investment return assumptions for equity and property. Expected funds under management are equal to the opening value of funds under management, adjusted for sales and purchases during the period arising from expected operating experience.
The actual investment return is affected by differences between the actual and expected funds under management and changes in asset mix, as well as movements in interest rates. To the extent that these differences arise from the operating experience of the life business, or management decisions to change asset mix, the effect is included in the Group adjusted operating profit. The residual difference between actual and expected investment return is included in investment variances, outside Group adjusted operating profit but included in profit before tax attributable to shareholders’ profits.
The movement in liabilities included in Group adjusted operating profit reflects both the change in liabilities due to the expected return on investments and the impact of experience variances and assumption changes for non-economic items. This would include movements in liabilities due to changes in the discount rate arising from discretionary management decisions that impact on product profitability over the lifetime of products.
The effect of differences between actual and expected economic experience on liabilities, and changes to economic assumptions used to value liabilities, are taken outside Group adjusted operating profit. For many types of life business, including unit-linked and with-profits funds, movements in asset values are offset by corresponding changes in liabilities, limiting the net impact on profit. The profit impact of economic volatility on other life business depends on the degree of matching of assets and liabilities, and exposure to financial options and guarantees.
(c) Assumptions The expected rate of investment return is determined using consistent assumptions at the start of the period between operations, having regard to local economic and market forecasts of investment return and asset classification under IFRS.
The principal assumptions underlying the calculation of the expected investment return for equity and property are:
Equity Property
2019 2018 2019 2018
United Kingdom 4.9% 4.8% 3.4% 3.3% Eurozone 4.3% 4.4% 2.8% 2.9%
The expected return on equity and property has been calculated by reference to the ten-year mid-price swap rate for an AA rated bank in the relevant currency plus a risk premium. The use of risk premium reflects management’s long-term expectations of asset return in excess of the swap yield from investing in different asset classes. The asset risk premiums are set out in the table below:
All territories 2019 2018
Equity risk premium 3.5% 3.5% Property risk premium 2.0% 2.0%
The ten-year mid-price swap rates at the start of the period are set out in the table below:
Territories 2019 2018
United Kingdom 1.4% 1.3% Eurozone 0.8% 0.9%
For fixed interest securities classified as fair value through profit or loss, the expected investment returns are based on average prospective yields for the actual assets held less an adjustment for credit risk (assessed on a best estimate basis). This includes an adjustment for credit risk on all eurozone sovereign debt. Where such securities are classified as available for sale, the expected investment return comprises the expected interest or dividend payments and amortisation of the premium or discount at purchase.
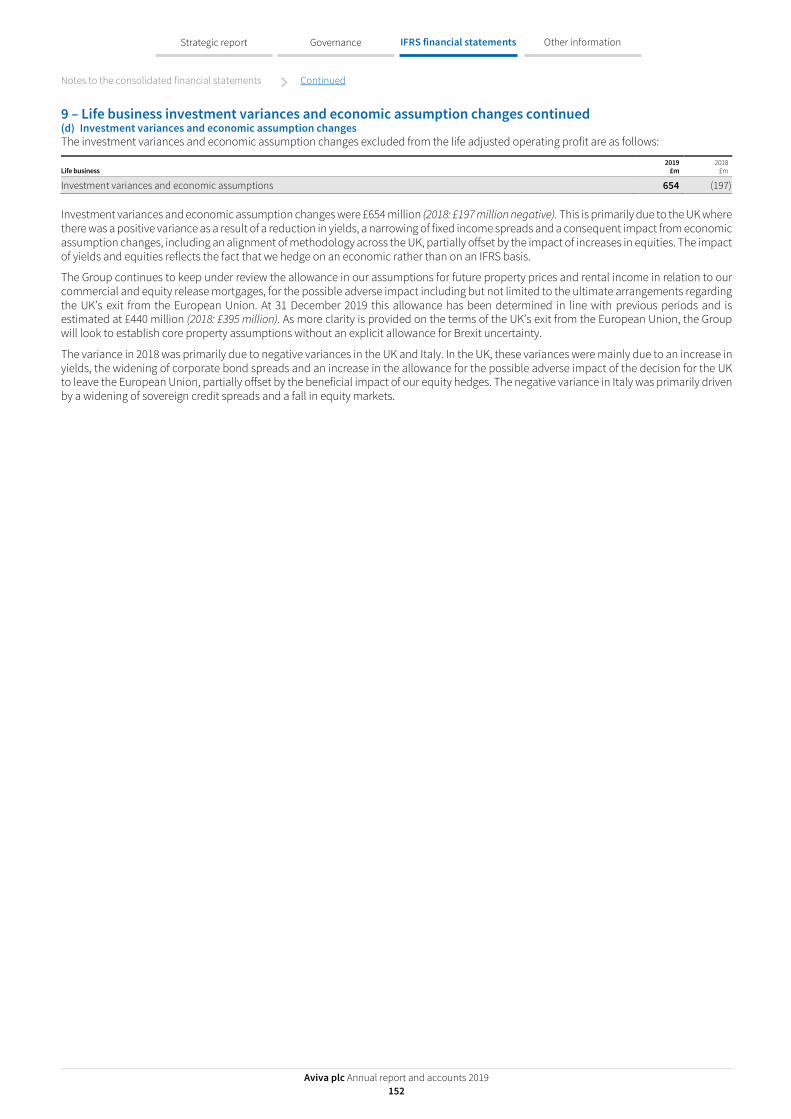
Notes to the consolidated financial statements Continued
Aviva plc Annual report and accounts 2019 152
Strategic report Governance IFRS financial statements Other information
9 – Life business investment variances and economic assumption changes continued (d) Investment variances and economic assumption changes The investment variances and economic assumption changes excluded from the life adjusted operating profit are as follows:
Life business 2019
£m 2018
£m
Investment variances and economic assumptions 654 (197)
Investment variances and economic assumption changes were £654 million (2018: £197 million negative). This is primarily due to the UK where there was a positive variance as a result of a reduction in yields, a narrowing of fixed income spreads and a consequent impact from economic assumption changes, including an alignment of methodology across the UK, partially offset by the impact of increases in equities. The impact of yields and equities reflects the fact that we hedge on an economic rather than on an IFRS basis.
The Group continues to keep under review the allowance in our assumptions for future property prices and rental income in relation to our commercial and equity release mortgages, for the possible adverse impact including but not limited to the ultimate arrangements regarding the UK’s exit from the European Union. At 31 December 2019 this allowance has been determined in line with previous periods and is estimated at £440 million (2018: £395 million). As more clarity is provided on the terms of the UK’s exit from the European Union, the Group will look to establish core property assumptions without an explicit allowance for Brexit uncertainty.
The variance in 2018 was primarily due to negative variances in the UK and Italy. In the UK, these variances were mainly due to an increase in yields, the widening of corporate bond spreads and an increase in the allowance for the possible adverse impact of the decision for the UK to leave the European Union, partially offset by the beneficial impact of our equity hedges. The negative variance in Italy was primarily driven by a widening of sovereign credit spreads and a fall in equity markets.

Notes to the consolidated financial statements Continued
Aviva plc Annual report and accounts 2019 153
Strategic report Governance IFRS financial statements Other information
10 – Non-life business: short-term fluctuations in return on investments (a) Definitions Group adjusted operating profit for non-life business is based on an expected long-term investment return over the period. Any variance between the total investment return (including realised and unrealised gains) and the expected return over the period is disclosed separately outside Group adjusted operating profit, in short-term fluctuations.
The short-term fluctuations in investment return and economic assumption changes attributable to the non-life business result and reported outside Group adjusted operating profit were as follows:
Non-life business 2019
£m 2018
£m
Short-term fluctuations in investment return (see (d) below) 167 (476) Economic assumption changes (see (e) below) (54) 1
113 (475)
(b) Methodology The long-term investment return is calculated separately for each principal non-life market. In respect of equities and investment properties, the return is calculated by multiplying the opening market value of the investments, adjusted for sales and purchases during the year, by the long-term rate of investment return.
The long-term rate of investment return is determined using consistent assumptions between operations, having regard to local economic and market forecasts of investment return. The allocated long-term return for other investments (including debt securities) is the actual income receivable for the year. Actual income and long-term investment return both contain the amortisation of the discounts/premium arising on the acquisition of fixed income securities. For other operations, the long-term return reflects assets backing non-life business held in Group centre investments.
Market value movements which give rise to variances between actual and long-term investment returns are disclosed separately in short-term fluctuations outside Group adjusted operating profit.
The impact of realised and unrealised gains and losses on Group centre investments, including the centre hedging programme which is designed to economically protect the total Group’s capital against adverse equity and foreign exchange movements, is included in short-term fluctuations on other operations.
(c) Assumptions The principal assumptions underlying the calculation of the long-term investment return are:
Long-term rates
of return Equities Long-term rates of return
Investment properties
2019
% 2018
% 2019
% 2018
%
United Kingdom 4.9 4.8 3.4 3.3 Eurozone 4.3 4.4 2.8 2.9 Canada 6.0 5.9 4.5 4.4
The long-term rates of return on equities and investment properties have been calculated by reference to the ten-year mid-price swap rate for an AA rated bank in the relevant currency plus a risk premium. The underlying reference rates and risk premiums for the United Kingdom and Eurozone are shown in note 9.

Notes to the consolidated financial statements Continued
Aviva plc Annual report and accounts 2019 154
Strategic report Governance IFRS financial statements Other information
10 – Non-life business: short-term fluctuations in return on investments continued (d) Analysis of investment return The total investment income on our non-life business, including short-term fluctuations, are as follows:
Non-life business 2019
£m 2018
£m
Analysis of investment income: Net investment income/(expenses) 511 (88) Foreign exchange gains/(losses) and other charges 55 (8)
566 (96)
Analysed between: Long-term investment return, reported within Group adjusted operating profit 399 380 Short-term fluctuation in investment return, reported outside Group adjusted operating profit General insurance and health 296 (315) Other operations1 (129) (161) 167 (476)
566 (96) 1 Other operations represents short-term fluctuations on assets backing non-life business in Group centre investments, including the centre hedging programme.
The short-term fluctuations during 2019 of £167 million favourable is primarily due to strong market conditions across all our major markets. This resulted in significant gains on equities plus gains on fixed income securities driven by interest rates falling and a narrowing of credit spreads. These gains are partly offset by losses on hedges held by the Group, including the Group centre hedging programme, and other adverse movements on centre holdings. The adverse short-term fluctuations during 2018 were mainly due to adverse market conditions across most of our major markets. This resulted in losses on fixed interest income securities driven by interest rate increases and widening credit spreads plus significant falls in equities and other adverse market movements on Group centre holdings.
(e) Economic assumption changes In the general insurance and health business, there is a negative impact of £54 million (2018: £1 million positive) primarily as a result of a decrease in interest rates used to discount claims reserves for both periodic payment orders and latent claims.
As explained in accounting policy L, provisions for latent claims are discounted, using rates based on the relevant swap curve, in the relevant currency at the reporting date, having regard to the duration of the expected settlement of the claims. The discount rate is set at the start of the accounting period, with any change in rates between the start and end of the accounting period being reflected below Group adjusted operating profit as an economic assumption change. The range of discount rates used is disclosed in note 44.

Notes to the consolidated financial statements Continued
Aviva plc Annual report and accounts 2019 155
Strategic report Governance IFRS financial statements Other information
11 – Employee information This note shows where our staff are employed throughout the world, excluding staff employed by our joint ventures and associates, and analyses the total staff costs.
(a) Employee numbers The number of persons employed by the Group, including directors under a service contract, was:
At 31 December Average for the year1
2019
Number 2018
Number 2019
Number 2018
Number
United Kingdom 15,335 15,746 15,863 15,414 Canada 4,264 4,334 4,338 4,330 France 3,911 3,928 3,925 3,911 Poland 1,648 1,708 1,696 1,716 Italy, Ireland, Spain and Other 1,969 1,950 1,933 1,864 Asia 1,876 1,832 1,842 1,817 Aviva Investors 1,495 1,471 1,485 1,460 Other Group activities 683 734 709 720
Total employee numbers 31,181 31,703 31,791 31,232 1 Average employee numbers have been calculated using a monthly average that takes into account recruitment, leavers, transfers, acquisitions and disposals of businesses during the year.
(b) Staff costs
2019
£m 2018
£m
Wages and salaries 1,321 1,260 Social security costs 239 233 Post-retirement obligations
Defined benefit schemes (note 52(d)) 22 23 Defined contribution schemes (note 52(d)) 164 163
Profit sharing and incentive plans 193 221 Equity compensation plans (note 34(d)) 62 64 Termination benefits 35 10
Total staff costs 2,036 1,974
Staff costs are charged within:
2019
£m 2018
£m
Acquisition costs 611 565 Claims handling expenses 197 161 Central costs and sharesave schemes 67 76 Other operating expenses (note 7) 1,161 1,172
Total staff costs 2,036 1,974
12 – Directors Information concerning individual directors’ emoluments, interests and transactions is given in the Directors’ Remuneration Report in the ‘Corporate governance’ section of this report. For the purposes of the disclosure required by Schedule 5 to the Companies Act 2006, the total aggregate emoluments of the directors in respect of 2019 was £7 million (2018: £10 million). Employer contributions to pensions for executive directors for qualifying periods were £18,813 (2018: £165,373). The aggregate net value of share awards granted to the directors in the period was £8.0 million (2018: £11.1 million). The net value has been calculated by reference to the closing middle market price of an ordinary share at the date of grant. During the year, no share options were exercised by directors (2018: no share options).

Notes to the consolidated financial statements Continued
Aviva plc Annual report and accounts 2019 156
Strategic report Governance IFRS financial statements Other information
13 – Auditors’ remuneration This note shows the total remuneration payable by the Group, excluding VAT and any overseas equivalent thereof, to our auditors.
2019 £m
2018 £m
Fees payable to PwC LLP and its associates for the statutory audit of the Aviva Group and Company financial statements 1.8 1.9 Fees payable to PwC LLP and its associates for other services
Audit of Group subsidiaries 13.7 13.4 Additional fees related to the prior year audit of Group subsidiaries 0.8 0.4
Total audit fees 16.3 15.7 Audit related assurance 4.9 4.7 Other assurance services 0.7 0.9
Total audit and assurance fees 21.9 21.3
Tax compliance services — — Tax advisory services — — Services relating to corporate finance transactions — — Other non-audit services not covered above 0.1 1.0 Fees payable to PwC LLP and its associates for services to Group companies 22.0 22.3
Fees payable to BDO LLP and its associates for the statutory audit of Group subsidiaries in Poland 0.4 0.2
Fees payable to Mazars LLP and its associates for the statutory audit of Group subsidiaries in Italy 0.3 —
Fees payable to PwC LLP, BDO LLP, Mazars LLP and their associates for services to Group companies 22.7 22.5
Fees payable to PwC LLP and its associates for Group occupational pensions scheme audits 0.3 0.3
Fees payable for the audit of the Group’s subsidiaries include fees for the statutory audit of the subsidiaries, both inside and outside the UK, and for the work performed by the principal auditors in respect of the subsidiaries for the purpose of the consolidated financial statements of the Group.
Audit related assurance comprises services in relation to statutory and regulatory filings. These include fees for the audit of the Group’s Solvency II regulatory returns for 2019, services for the audit of other regulatory returns of the Group’s subsidiaries and review of interim financial information under the Listing Rules of the UK Listing Authority. Total audit fees (excluding additional fees relating to the prior year audits of Group subsidiaries) and audit-related assurance fees were £20.4 million (2018: £20.0 million).
Other assurance services in 2019 of £0.7 million (2018: £0.9 million) mainly include fees relating to providing an annual Audit and Assurance Faculty (AAF) report for Aviva Investors to give internal and external clients and their auditors comfort over the operating effectiveness of internal controls and review of the information security business protection standard and associated controls.
Details of the Group’s process for safeguarding and supporting the independence and objectivity of the external auditors are given in the Audit Committee report.

Notes to the consolidated financial statements Continued
Aviva plc Annual report and accounts 2019 157
Strategic report Governance IFRS financial statements Other information
14 – Tax This note analyses the tax charge for the year and explains the factors that affect it.
(a) Tax charged/(credited) to the income statement (i) The total tax charge/(credit) comprises:
2019
£m 2018
£m
Current tax For the period 1,062 559 Prior period adjustments (179) (49) Total current tax 883 510
Deferred tax Origination and reversal of temporary differences 402 (531) Changes in tax rates or tax laws (6) (13) Write back of deferred tax assets (9) (1)
Total deferred tax 387 (545)
Total tax charged/(credited) to income statement 1,270 (35)
(ii) The Group, as a proxy for policyholders in the UK, Ireland and Singapore, is required to record taxes on investment income and gains each year. Accordingly, the tax benefit or expense attributable to UK, Ireland and Singapore life insurance policyholder returns is included in the tax charge. The tax charge attributable to policyholder returns included in the charge above is £559 million (2018: credit of £477 million).
(iii) The tax charge/(credit) above, comprising current and deferred tax, can be analysed as follows:
2019
£m 2018
£m
UK tax 851 (236) Overseas tax 419 201
1,270 (35)
(iv) Unrecognised tax losses and temporary differences of previous years were used to reduce the current tax expense and deferred tax charge by £nil and £11 million (2018: £nil and £nil), respectively.
(v) Deferred tax charged/(credited) to the income statement represents movements on the following items:
2019
£m 2018
£m
Long-term business technical provisions and other insurance items (1,185) 907 Deferred acquisition costs 4 3 Unrealised gains/(losses) on investments 1,554 (1,453) Pensions and other post-retirement obligations 21 2 Unused losses and tax credits 4 7 Subsidiaries, associates and joint ventures 4 (7) Intangibles and additional value of in-force long-term business (63) (64) Provisions and other temporary differences 48 60
Total deferred tax charged/(credited) to income statement 387 (545)
(b) Tax credited to other comprehensive income (i) The total tax credit comprises:
2019
£m 2018
£m
Current tax In respect of pensions and other post-retirement obligations (49) (59) In respect of foreign exchange movements (10) (1)
(59) (60)
Deferred tax In respect of pensions and other post-retirement obligations (56) 16 In respect of fair value gains on owner-occupied properties 1 — In respect of unrealised gains/(losses) on investments 5 (7)
(50) 9
Total tax credited to other comprehensive income (109) (51)
(ii) There is no tax charge/(credit) attributable to policyholders’ return included above in either 2019 or 2018.

Notes to the consolidated financial statements Continued
Aviva plc Annual report and accounts 2019 158
Strategic report Governance IFRS financial statements Other information
14 – Tax continued (c) Tax credited to equity Tax credited directly to equity in the year in respect of coupon payments on the direct capital instrument and tier 1 notes amounted to £9 million (2018: £8 million).
(d) Tax reconciliation The tax on the Group’s profit before tax differs from the theoretical amount that would arise using the tax rate of the home country of the Company as follows:
Shareholder
£m Policyholder
£m 2019
£m Shareholder
£m Policyholder
£m 2018
£m
Total profit before tax 3,374 559 3,933 2,129 (477) 1,652
Tax calculated at standard UK corporation tax rate of 19.00% (2018: 19.00%) 641 106 747 405 (91) 314 Reconciling items
Different basis of tax – policyholders — 454 454 — (385) (385) Adjustment to tax charge in respect of prior periods 5 — 5 (16) — (16) Non-assessable income and items not taxed at the full statutory rate (51) — (51) (4) — (4) Non-taxable profit on sale of subsidiaries and associates (1) — (1) (59) — (59) Disallowable expenses 41 — 41 50 — 50 Different local basis of tax on overseas profits 98 (1) 97 71 (1) 70 Change in future local statutory tax rates (6) — (6) — — — Movement in deferred tax not recognised (4) — (4) (3) — (3) Tax effect of profit from joint ventures and associates (8) — (8) (6) — (6) Other (4) — (4) 4 — 4
Total tax charged/(credited) to income statement 711 559 1,270 442 (477) (35)
The tax charge/(credit) attributable to policyholder returns is removed from the Group’s total profit before tax in arriving at the Group’s profit before tax attributable to shareholders’ profits. As the net of tax profits attributable to with-profits and unit-linked policyholders is zero, the Group’s pre-tax profit attributable to policyholders is an amount equal and opposite to the tax charge/(credit) attributable to policyholders included in the total tax charge.
Finance Act 2016 introduced legislation reducing the UK corporation tax rate from 1 April 2020 to 17%. In addition, in France the rate of corporation tax was reduced from 34.43% to 32.02% from 1 January 2019, to 27.37% from 1 January 2021 and 25.83% from 1 January 2022. These reduced rates were used in the calculation of the Group’s deferred tax assets and liabilities as at 31 December 2018.
During 2019 changes were made in France to alter the reduction in corporation tax rates, delaying the reduction to 32.02% to 1 January 2020 and amending the rate to take effect from 1 January 2021 to 28.41%. These revised rates have been used in the calculation of France’s deferred tax assets and liabilities as at 31 December 2019.
During 2019, the UK Government indicated that it would reverse the reduction in corporation tax rate to 17% due from 1 April 2020. As of the 31 December 2019, this measure had not been substantively enacted and therefore no impact is reflected in the calculation of the UK’s deferred tax assets and liabilities as at 31 December 2019. Were this measure to be introduced, it would increase the Group’s deferred tax liability by approximately £73 million.

Notes to the consolidated financial statements Continued
Aviva plc Annual report and accounts 2019 159
Strategic report Governance IFRS financial statements Other information
15 – Earnings per share This note shows how to calculate earnings per share on profit attributable to ordinary shareholders, based both on the present shares in issue (the basic earnings per share) and the potential future shares in issue, including conversion of share options granted to employees (the diluted earnings per share). We have also shown the same calculations based on our Group adjusted operating profit as we believe this gives an important indication of operating performance. Consideration of both these measures gives a full picture of the performance of the business in the period.
(a) Basic earnings per share (i) The profit attributable to ordinary shareholders is:
2019
£m
Restated1
2018 £m
Group adjusted
operating profit
£m
Adjusting items
£m Total
£m
Group adjusted
operating profit
£m
Adjusting items
£m Total
£m
Profit before tax attributable to shareholders’ profits 3,184 190 3,374 3,004 (875) 2,129 Tax attributable to shareholders’ profit (668) (43) (711) (625) 183 (442) Profit for the year 2,516 147 2,663 2,379 (692) 1,687 Amount attributable to non-controlling interests (98) (17) (115) (100) (19) (119) Cumulative preference dividends for the year (17) — (17) (17) — (17) Coupon payments in respect of the direct capital instrument (DCI) and tier 1 notes
(net of tax) (34) — (34) (36) — (36) Profit attributable to ordinary shareholders 2,367 130 2,497 2,226 (711) 1,515 1 During 2019 the Group adjusted operating profit APM has been revised and now includes the amortisation and impairment of internally generated intangible assets to better reflect the operational nature of these assets (see
note 1(b)). Group adjusted operating profit continues to exclude amortisation and impairment of intangible assets acquired in business combinations. Comparative amounts have been restated resulting in a reduction in the prior period Group adjusted operating profit of £112 million. There is no impact on profit before tax attributable to shareholders’ profit.
(ii) Basic earnings per share is calculated as follows:
2019
£m
Restated2
2018 £m
Before tax
£m
Net of tax, NCI, preference
dividends and DCI1 £m
Per share p
Before tax £m
Net of tax, NCI, preference
dividends and DCI1 £m
Per share p
Group adjusted operating profit attributable to ordinary shareholders 3,184 2,367 60.5 3,004 2,226 56.2 Adjusting items:
Life business: Investment variances and economic assumption changes 654 535 13.7 (197) (198) (5.0) Non-life business: Short-term fluctuation in return on investments 167 129 3.3 (476) (378) (9.6) General insurance and health business: Economic assumption changes (54) (33) (0.8) 1 (1) — Impairment of goodwill, joint ventures, associates and other amounts expensed (15) (15) (0.4) (13) (13) (0.3) Amortisation and impairment of intangibles acquired in business combinations2 (87) (61) (1.6) (97) (82) (2.1) Amortisation and impairment of acquired value of in-force business (406) (356) (9.1) (426) (371) (9.4) Profit on disposal and remeasurement of subsidiaries, joint ventures and associates (22) (23) (0.6) 102 102 2.6 Other3 (47) (46) (1.2) 231 230 5.8
Profit attributable to ordinary shareholders 3,374 2,497 63.8 2,129 1,515 38.2 1 DCI includes the direct capital instrument and tier 1 notes. 2 During 2019 the Group adjusted operating profit APM has been revised and now includes the amortisation and impairment of internally generated intangible assets to better reflect the operational nature of these assets (see
note 1(b)). Group adjusted operating profit continues to exclude amortisation and impairment of intangible assets acquired in business combinations. Comparative amounts have been restated resulting in a reduction in the prior period Group adjusted operating profit of £112 million. There is no impact on profit before tax attributable to shareholders’ profit. Following the change in the definition of Group adjusted operating profit, comparative amounts for operating earnings per share have also been restated resulting in a reduction in the prior period of 2.2 pence.
3 Other in 2019 relates to a charge of £45 million in relation to a change in the discount rate used for estimating lump sum payments in settlement of bodily injury claims (see note 44(b)) and a charge of £2m relating to negative goodwill which arose on the acquisition of Friends First (see note 3). Other in 2018 includes a movement in the discount rate used for estimating lump sum payments in the settlement of bodily injury claims which resulted in a gain of £190 million, a provision release of £78 million relating to the sale of Aviva USA in 2013, a gain of £36 million relating to negative goodwill on the acquisition of Friends First, a charge of £63 million relating to the UK defined benefit pension scheme as a result of the requirements to equalise members’ benefits of the effects of Guaranteed Minimum Pension and a charge of £10 million relating to goodwill payments to preference shareholders, which was announced on 30 April 2018, and associated administration costs.
(iii) The calculation of basic earnings per share uses a weighted average of 3,911 million (2018: 3,963 million) ordinary shares in issue, after deducting treasury shares. The actual number of shares in issue at 31 December 2019 was 3,921 million (2018: 3,902 million) and 3,919 million (2018: 3,899 million) excluding treasury shares.
(iv) On 1 May 2018 the Group announced a share buy-back of ordinary shares for an aggregate purchase price of up to £600 million, which was carried out in full during the period from 1 May 2018 to 17 September 2018. The number of shares in issue reduced by 119 million as at 31 December 2018 in respect of shares acquired and cancelled under the buy-back programme.

Notes to the consolidated financial statements Continued
Aviva plc Annual report and accounts 2019 160
Strategic report Governance IFRS financial statements Other information
15 – Earnings per share continued (b) Diluted earnings per share (i) Diluted earnings per share is calculated as follows:
2019
£m 2018
£m
Total
£m
Weighted average
number of shares million
Per share p
Total £m
Weighted average
number of shares million
Per share p
Profit attributable to ordinary shareholders 2,497 3,911 63.8 1,515 3,963 38.2 Dilutive effect of share awards and options — 45 (0.7) — 47 (0.4)
Diluted earnings per share 2,497 3,956 63.1 1,515 4,010 37.8
(ii) Diluted earnings per share on Group adjusted operating profit attributable to ordinary shareholders is calculated as follows:
2019
£m
Restated1
2018 £m
Total
£m
Weighted average
number of shares million
Per share p
Total £m
Weighted average
number of shares million
Per share p
Group adjusted operating profit attributable to ordinary shareholders 2,367 3,911 60.5 2,226 3,963 56.2 Dilutive effect of share awards and options — 45 (0.7) — 47 (0.7)
Diluted group adjusted operating profit per share 2,367 3,956 59.8 2,226 4,010 55.5 1 During 2019 the Group adjusted operating profit APM has been revised and now includes the amortisation and impairment of internally generated intangible assets to better reflect the operational nature of these assets (see
note 1(b)). Group adjusted operating profit continues to exclude amortisation and impairment of intangible assets acquired in business combinations. Comparative amounts have been restated resulting in a reduction in the prior period Group adjusted operating profit of £112 million. There is no impact on profit before tax attributable to shareholders’ profit. Following the change in the definition of Group adjusted operating profit, comparative amounts for diluted earnings per share have also been restated resulting in a reduction in prior period diluted group adjusted operating profit per share of 2.2 pence.
16 – Dividends and appropriations This note analyses the total dividends and other appropriations paid during the year. The table below does not include the final dividend proposed after the year end because it is not accrued in these financial statements.
2019
£m 2018
£m
Ordinary dividends declared and charged to equity in the period Final 2018 – 20.75 pence per share, paid on 30 May 2019 812 — Final 2017 – 19.00 pence per share, paid on 17 May 2018 — 764 Interim 2019 – 9.50 pence per share, paid on 26 September 2019 372 — Interim 2018 – 9.25 pence per share, paid on 24 September 2018 — 364
1,184 1,128 Preference dividends declared and charged to equity in the period 17 17 Coupon payments on DCI and tier 1 notes 43 44
1,244 1,189
Subsequent to 31 December 2019, the directors proposed a final dividend for 2019 of 21.40 pence per ordinary share (2018: 20.75 pence), amounting to £839 million (2018: £812 million) in total. Subject to approval by shareholders at the AGM, the dividend will be paid on 2 June 2020 and will be accounted for as an appropriation of retained earnings in the year ending 31 December 2020.
Interest on the direct capital instrument and tier 1 notes is treated as an appropriation of retained profits and, accordingly, is accounted for when paid. This year’s tax relief is obtained at a rate of 19% (2018: 19%).

Notes to the consolidated financial statements Continued
Aviva plc Annual report and accounts 2019 161
Strategic report Governance IFRS financial statements Other information
17 – Goodwill This note analyses the changes to the carrying amount of goodwill during the year and details the results of our impairment testing on both goodwill and intangible assets with indefinite lives.
(a) Carrying amount
2019
£m 2018
£m
Gross amount At 1 January 1,991 2,080 Acquisitions and additions 4 8 Disposals (5) (99) Foreign exchange rate movements (22) 2 At 31 December 1,968 1,991
Accumulated impairment At 1 January (119) (168) Impairment charges (6) (13) Disposals — 63 Foreign exchange rate movements 12 (1) At 31 December (113) (119)
Carrying amount at 1 January1 1,872 1,912
Carrying amount at 31 December 1,855 1,872
Less: Assets classified as held for sale — —
Carrying amount at 31 December 1,855 1,872 1 The balance on 1 January 2018 includes goodwill of £36 million which was part of operations classified as held for sale.
Goodwill from acquisitions and additions in 2019 arose from small acquisitions in Canada and the UK (see note 3). Goodwill from acquisitions and additions in 2018 arose on the acquisition of Wealthify. In 2018, negative goodwill of £36 million arose on the purchase of Friends First, this was recognised immediately in the income statement.
Disposals in 2019 relate to a small disposal in Canada. Disposals in 2018 include those related to the disposal of the Italy Avipop business as well as the remainder of the business in Spain.
The total impairment of goodwill in 2019 is a charge of £6 million comprised of impairments of goodwill relating to businesses in Asia and Canada. The total impairment of goodwill in 2018 was a charge of £13 million relating to businesses in the UK, Asia and Poland. Impairment tests on goodwill were conducted as described in note 17(b) below.
(b) Goodwill allocation and impairment testing A summary of the goodwill and intangibles with indefinite useful lives allocated to groups of cash generating units (CGUs) is presented below.
Carrying amount of
goodwill
Carrying amount of
intangibles with indefinite
useful lives (detailed in
note 18) Total
2019
£m 2018
£m 2019
£m 2018
£m 2019
£m 2018
£m
United Kingdom – long-term business 663 663 — — 663 663 United Kingdom – general insurance and health 927 924 1 — 928 924 Canada 77 82 — — 77 82 France – long-term business — — 52 56 52 56 Poland 25 27 7 7 32 34 Italy – general insurance and health 24 26 — — 24 26 Ireland – general insurance and health 94 99 — — 94 99 Asia 45 51 1 — 46 51
1,855 1,872 61 63 1,916 1,935
Goodwill in all business units is tested for impairment by comparing the carrying value of the cash generating unit to which the goodwill relates, to the recoverable value of that cash generating unit. The recoverable amount is the value in use of the cash generating unit unless otherwise stated.
Long-term business Value in use has been calculated based on a shareholder value of the business calculated in accordance with Solvency II principles, adjusted where Solvency II does not represent a best estimate of shareholders’ interests. The principal adjustments relate to the exclusion of the benefit of transitional measures on technical provisions and the volatility adjustment under Solvency II, modification of the Solvency II risk margin to an economic view and removal of restrictions on contract boundaries or business scope.

Notes to the consolidated financial statements Continued
Aviva plc Annual report and accounts 2019 162
Strategic report Governance IFRS financial statements Other information
17 – Goodwill continued The present value of expected profits arising from future new business may be included within the shareholder value and is calculated on an adjusted Solvency II basis, using profit projections based on the most recent three-year business plans approved by management. These plans reflect management’s best estimate of future profits based on both historical experience and expected growth rates for the relevant cash generating unit. The underlying assumptions of these projections include market share, customer numbers, mortality, morbidity and persistency.
Future new business profits beyond the initial three years are extrapolated using a steady growth rate. Growth rates and expected future profits are set with regards to management estimates, past experience and relevant available market statistics.
Expected profits from future new business are discounted using a risk adjusted discount rate. The discount rate is a combination of a risk-free rate and a risk margin to make prudent allowance for the risk that experience in future years for new business may differ from that assumed.
Key assumptions The Solvency II non-economic assumptions in relation to mortality, morbidity, persistency and expenses and other items are based on management’s best estimate assumptions. Economic assumptions are based on market data as at the end of each reporting period. The basic risk-free rate curves used to value the technical provisions reflect the curves, credit risk adjustment and fundamental spread for the matching adjustment published by the European Insurance and Occupational Pensions Authority (EIOPA) on their website. For the purposes of calculating value in use, the Solvency II risk margin has been modified to an economic view, with a cost of capital rate of 2%.
General insurance, health, fund management and other businesses Value in use is calculated as the discounted value of expected future profits of each business. The calculation uses cash flow projections based on business plans approved by management covering a three-year period. These plans reflect management’s best estimate of future profits based on both historical experience and expected growth rates for the relevant cash generating unit. The underlying assumptions of these projections include market share, customer numbers, premium rate and fee income changes, claims inflation and commission rates.
Cash flows beyond that three-year period are extrapolated using a steady growth rate. Growth rates and expected future profits are set with regards to past experience and relevant available market statistics.
Future profits are discounted using a risk adjusted discount rate which is based on the Capital Asset Pricing Model (CAPM). The inputs include the risk-free rate of interest appropriate to the geographic location of the cash flows related to each CGU being tested, market risk premium, beta and other adjustments to factor local market risks and risks specific to each CGU.
Key assumptions
Extrapolated future profits growth rate
Future profits discount rate
2019
% 2018
%
2019 (Pre-tax)
%
2018 (Pre-tax)
%
United Kingdom general insurance and health 1 1 6.8 6.3 Ireland general insurance and health Nil Nil 6.8 6.9 Italy general insurance and health Nil Nil 10.3 12.5 Canada general insurance 4 4 8.0 7.8
Indefinite life intangible asset France The recoverable amount of the indefinite life intangible asset has been assessed based on the fair value less costs to sell of the cash generating unit to which it relates. The fair value less costs to sell was determined based on the quoted market value of Aviva’s share of the subsidiary to which it relates.
Results of impairment testing Management’s impairment review of the Group’s cash generating units identified the need to impair goodwill by a total amount of £6 million (£4 million of which relates to one of the cash generating units within the Asia operating segment, and £2 million to one of the cash generating units within the Canada operating segment). This impairment is due to current and forecast performance of the related cash generating units being below the original financial plan. Impairment in 2018 totalling £13 million related to one of the cash generating units in the UK within the Other Group Activities operating segment, one of the cash generating units within the Asia operating segment and one of the cash generating units within the Poland operating segment.

Notes to the consolidated financial statements Continued
Aviva plc Annual report and accounts 2019 163
Strategic report Governance IFRS financial statements Other information
18 – Acquired value of in-force business (AVIF) and intangible assets This note shows the movements in cost, amortisation and impairment of the acquired value of in-force business and intangible assets during the year.
AVIF on insurance
contracts1 (a) £m
AVIF on investment
contracts2 (a) £m
Other intangible
assets with finite useful
lives (b) £m
Intangible assets with
indefinite useful lives (c)
£m Total
£m
Gross amount At 1 January 2018 2,620 2,697 1,966 380 7,663 Additions and transfers 67 30 153 (57) 193 Disposals — — (488) (189) (677) Foreign exchange rate movements 5 (1) (8) — (4)
At 31 December 2018 2,692 2,726 1,623 134 7,175 Additions and transfers — — 136 2 138 Disposals — — (36) (1) (37) Foreign exchange rate movements (21) (1) (6) (7) (35) At 31 December 2019 2,671 2,725 1,717 128 7,241 Accumulated amortisation At 1 January 2018 (1,060) (838) (544) (57) (2,499) Amortisation for the year (183) (243) (209) — (635) Disposals and transfers — — 48 57 105 Foreign exchange rate movements (4) — 2 — (2) At 31 December 2018 (1,247) (1,081) (703) — (3,031) Amortisation for the year3 (180) (226) (212) — (618) Disposals and transfers — — 28 — 28 Foreign exchange rate movements 18 1 — — 19 At 31 December 2019 (1,409) (1,306) (887) — (3,602) Accumulated Impairment At 1 January 2018 (27) (134) (46) (71) (278) Impairment charges — (13) — — (13) Disposals — — 8 — 8 Foreign exchange rate movements — — — — —
At 31 December 2018 (27) (147) (38) (71) (283) Impairment charges4 — (28) (13) — (41) Disposals — — 6 — 6 Foreign exchange rate movements — — 1 4 5 At 31 December 2019 (27) (175) (44) (67) (313) Carrying amount At 1 January 2018 1,533 1,725 1,376 252 4,886 At 31 December 2018 1,418 1,498 882 63 3,861
At 31 December 2019 1,235 1,244 786 61 3,326 Less: Assets classified as held for sale (29) (496) (1) — (526) 1,206 748 785 61 2,800 1 On insurance and participating investment contracts. 2 On non-participating investment contracts. 3 Amortisation of other intangible assets with finite useful lives includes £87 million (2018: £97 million) of amortisation in respect of intangible assets acquired in business combinations. 4 Impairment charges comprise £28 million (2018: £13 million) of AVIF impairment in respect of FPI recognised within profit/(loss) on the disposal and remeasurement of subsidiaries, joint ventures and associates due to FPI’s
classification as held for sale (see note 4).
(a) Acquired value of in-force business AVIF on insurance and investment contracts is generally recoverable in more than one year. Of the total of £2,479 million, £2,380 million (2018: £2,904 million) is expected to be recoverable more than one year after the statement of financial position date.
Non-participating investment AVIF is reviewed for evidence of impairment, consistent with reviews conducted for other finite life intangible assets. Insurance and participating investment contract AVIF is reviewed for impairment at each reporting date as part of the liability adequacy requirements in IFRS 4. AVIF is reviewed for evidence of impairment and impairment tested at product portfolio level by reference to the value of future profits in accordance with Solvency II principles, adjusted where Solvency II does not represent a best estimate of shareholders’ interests, consistent with the impairment test for goodwill for long term business (see note 17(b)).
In 2019, an impairment charge of £28 million (2018: £13 million) was recognised in relation to the AVIF on non-participating investment contracts relating to FPI, to write down the AVIF balance to its recoverable amount measured at the estimated fair value less costs to sell.

Notes to the consolidated financial statements Continued
Aviva plc Annual report and accounts 2019 164
Strategic report Governance IFRS financial statements Other information
18 – Acquired value of in-force business (AVIF) and intangible assets continued (b) Other intangible assets with finite useful lives Other intangible assets with finite useful lives consist mainly of the value of bancassurance and other distribution agreements and capitalised software. Additions of intangible assets with finite lives in 2019 and 2018 relate to capitalisation of software costs in relation to the Group’s digital initiatives.
(c) Intangible assets with indefinite useful lives Intangible assets with indefinite useful lives primarily comprise the value of distribution channel Union Financière de France Banque in France where the existing life of the asset supports this classification. Impairment testing of these intangible assets is covered in note 17(b). No impairment has been recognised in 2019 (2018: £nil).
19 – Interests in, and loans to, joint ventures In several businesses, Group companies and other parties jointly control certain entities. This note analyses these interests and describes the principal joint ventures in which we are involved.
(a) Carrying amount and details of joint ventures (i) The movements in the carrying amount comprised:
2019 2018
Goodwill and intangibles
£m
Equity interests
£m Total
£m
Goodwill and intangibles
£m
Equity interests
£m Total
£m
At 1 January 46 1,168 1,214 57 1,164 1,221 Share of results before tax — 27 27 — 99 99 Share of tax — (4) (4) — (3) (3)
Share of results after tax — 23 23 — 96 96 Amortisation of intangibles1 (5) — (5) (5) — (5) Share of (loss)/profit after tax (5) 23 18 (5) 96 91 Reclassification from subsidiary — — — — 5 5 Additions — 131 131 — 33 33 Disposals — (96) (96) — (79) (79) Share of gains/(losses) taken to other comprehensive income — 22 22 — (10) (10) Dividends received from joint ventures — (27) (27) — (35) (35) Foreign exchange rate movements (3) (24) (27) (6) (6) (12) At 31 December 38 1,197 1,235 46 1,168 1,214
Less: Joint venture classified as held for sale — (8) (8) — — —
At 31 December 38 1,189 1,227 46 1,168 1,214 1 Comprises other intangibles of £5 million (2018: £5 million).
Additions and disposals during 2019 relate mainly to the Group’s holdings in property management undertakings.
On 20 November 2019, Aviva announced the sale of its entire 40% shareholding in its Hong Kong joint venture (Blue) to Hillhouse AV Holdings Limited for 450 million HKD (approximately £44 million). In addition to the investment in the joint venture, Aviva retained control of certain activities under the previous sale agreement reached in 2018, which remain fully consolidated at the balance sheet date, and which form part of the sale agreement to Hillhouse AV Holding Limited. No remeasurement loss has been recognised on reclassification to held for sale, as detailed in note 4(b).
The Group’s share of total comprehensive income related to joint venture entities is £40 million (2018: £81 million).

Notes to the consolidated financial statements Continued
Aviva plc Annual report and accounts 2019 165
Strategic report Governance IFRS financial statements Other information
19 – Interests in, and loans to, joint ventures continued (ii) The carrying amount at 31 December comprised:
2019 2018
Goodwill and intangibles
£m
Equity interests
£m Total
£m
Goodwill and intangibles
£m
Equity interests
£m Total
£m
Property management undertakings — 792 792 — 797 797 Long-term business undertakings 38 397 435 46 363 409 General insurance and health undertakings — 8 8 — 8 8
Total 38 1,197 1,235 46 1,168 1,214
The property management undertakings perform property ownership and management activities, and are incorporated and operate in the UK. All such investments are held by subsidiary entities.
The long-term business undertakings perform life insurance activities. All investments in such undertakings are unlisted with the exception of AvivaSA Emeklilik ve Hayat A.S which has issued publicly a minority portion of shares. All investments in such undertakings are held by subsidiaries, except for the shares in the Chinese joint venture, Aviva-COFCO Life Insurance Company Ltd., which are held by Aviva plc. The Group’s share of net assets of that company is £320 million (2018: £294 million) and it has a carrying value at cost of £123 million (2018: £123 million).
The investment in general insurance and health undertakings relates to the health insurance operations in our Indonesian joint venture.
(iii) No joint ventures are considered to be material from a Group perspective (2018: none). The Group’s principal joint ventures are as follows:
Proportion of
ownership interest
Name Nature of activities Principal place of business 2019 2018
Ascot Real Estate Investments LP Property management UK 50.00% 50.00% 2-10 Mortimer Street Limited Partnership Property management UK 50.00% 50.00% Aviva-COFCO Life Insurance Company Limited Life insurance China 50.00% 50.00% PT Astra Aviva Life Life and Health insurance Indonesia 50.00% 50.00% Aviva Life Insurance Company Limited Life insurance Hong Kong 40.00% 40.00% AvivaSA Emeklilik ve Hayat A.S Life insurance Turkey 40.00% 40.00%
The Group has no joint ventures whose non-controlling interest (NCI) is material on the basis of their share of profit/(loss).
(iv) From time to time group joint ventures may receive liability claims or become involved in actual or threatened related litigation. At 31 December 2019 this includes a contingent liability in respect of a dispute where the Group’s maximum exposure is approximately £95 million. In the opinion of the directors it is unlikely that the Group will suffer financial loss arising from this dispute. The joint ventures have no other contingent liabilities to which the Group has significant exposure. The Group has commitments to provide funding to property management joint ventures of £13 million (2018: £13 million).
In certain jurisdictions the ability of joint ventures to transfer funds in the form of cash dividends or to repay loans and advances made by the Group is subject to local corporate or insurance laws and regulations and solvency requirements.
(b) Impairment testing Interests in joint ventures are tested for impairment of goodwill and intangibles when there is an indicator of impairment. They are tested for impairment by comparing the carrying value of the cash generating unit to which the goodwill or intangible relates to the recoverable value of that cash generating unit. Recoverable amount for long-term and general insurance businesses is calculated on a consistent basis with that used for impairment testing of goodwill, as set out in note 17(b). The recoverable amount of property management undertakings is the fair value less costs to sell of the joint venture, measured in accordance with the Group’s accounting policy for investment property (see accounting policy Q).

Notes to the consolidated financial statements Continued
Aviva plc Annual report and accounts 2019 166
Strategic report Governance IFRS financial statements Other information
20 – Interests in, and loans to, associates This note analyses our interests in entities which we do not control but where we have significant influence.
(a) Carrying amount and details of associates (i) The movements in the carrying amount comprised:
2019 2018
Equity interests
£m
Equity interests
£m
At 1 January 304 421 Share of results before tax 80 22 Share of tax (4) (1)
Share of results after tax 76 21 Impairment (9) — Share of profit after tax 67 21 Acquisitions 1 — Additions 1 2 Reduction in Group interest (1) (78) Reclassification to investment — (54) Dividends received from associates (54) (8) Foreign exchange rate movements (14) — Movements in carrying amount — (117)
At 31 December 304 304
The Group’s share of total comprehensive income related to associates is £67 million (2018: £21 million).
(ii) No associates are considered to be material from a Group perspective (2018: none). All investments in principal associates are held by subsidiaries. The Group’s principal associates are as follows:
Proportion of
ownership interest
Name Nature of activities Principal place of business 2019 2018
Aviva Life Insurance Company India Limited Life insurance India 49.00% 49.00% SCPI Logipierre 1 Property Management France 44.46% 44.46% Lend Lease JEM Partners Fund Limited Investment holding Singapore 22.50% 22.50% SCPI Ufifrance Immobilier Property Management France 20.40% 20.40% AI UK Commercial Real Estate Debt Fund1 Property Management UK 17.53% 17.16% 1 The Group has significant influence over AI UK Commercial Real Estate Debt Fund so it is therefore accounted for as an associate.
(iii) The associates have no contingent liabilities to which the Group has significant exposure. The Group has commitments to provide funding to property management associates of £6 million (2018: £5 million).
In certain jurisdictions the ability of associates to transfer funds in the form of cash dividends or to repay loans and advances made by the Group is subject to local corporate or insurance laws and regulations and solvency requirements.
(b) Impairment testing The recoverable amount of property management undertakings is the fair value less costs to sell of the associate, measured in accordance with the Group’s accounting policy for investment property (see accounting policy Q).
An impairment charge of £9 million (2018: £nil) was recognised within the income statement as a component of share of profit after tax of joint ventures and associates following management’s annual impairment review of the Group’s associate in India, Aviva Life Insurance Company India Limited (Aviva India).

Notes to the consolidated financial statements Continued
Aviva plc Annual report and accounts 2019 167
Strategic report Governance IFRS financial statements Other information
21 – Property and equipment This note analyses our property and equipment, which are primarily properties occupied by Group companies.
Properties under
construction £m
Owner-occupied
properties £m
Motor vehicles £m
Computer equipment
£m Other assets
£m Total
£m
Cost or valuation At 1 January 2018 1 340 3 155 265 764 Additions 1 21 1 24 40 87 Disposals (2) (8) — (7) (6) (23) Fair value gains — 3 — — — 3 Foreign exchange rate movements — 3 — 3 7 13
At 31 December 2018 — 359 4 175 306 844 Adjustment at 1 January for adoption of IFRS 161 — 1,149 — — — 1,149 At 1 January 2019 restated — 1,508 4 175 306 1,993 Additions — 53 — 19 12 84 Disposals — (6) — (16) (16) (38) Fair value losses — (3) — — — (3) Foreign exchange rate movements — (18) — (3) (6) (27) At 31 December 2019 — 1,534 4 175 296 2,009 Depreciation and impairment At 1 January 2018 — (3) (2) (125) (120) (250) Depreciation charge for the year — — (1) (14) (25) (40) Disposals — — — 6 2 8 Impairment charge — — — — — — Foreign exchange rate movements — — — (4) (5) (9)
At 31 December 2018 — (3) (3) (137) (148) (291) Adjustment at 1 January for adoption of IFRS 161 — (739) — — — (739) At 1 January 2019 restated — (742) (3) (137) (148) (1,030) Depreciation charge for the year — (62) — (16) (20) (98) Disposals — 1 — 16 15 32 Impairment charge — (22) — — — (22) Foreign exchange rate movements — — — 2 4 6 At 31 December 2019 — (825) (3) (135) (149) (1,112) Carrying amount At 31 December 2018 — 356 1 38 158 553
At 31 December 2019 — 709 1 40 147 897 Less: Assets classified as held for sale — (7) — — (1) (8) At 31 December 2019 — 702 1 40 146 889 1 The Group has adopted IFRS 16 Leases from 1 January 2019. In line with the transition options available, prior period comparatives have not been restated and the impact of the adoption has been shown as an adjustment to
opening property and equipment.
Owner-occupied properties, excluding £385 million held under lease arrangements, are stated at their revalued amounts, as assessed by qualified external valuers. These values are assessed in accordance with the relevant parts of the current Royal Institute of Chartered Surveyors Appraisal and Valuation Standards in the UK, and with current local valuation practices in other countries. This assessment is in accordance with UK Valuations Standards ‘Red book’, and is the estimated amount for which a property should exchange on the date of valuation between a willing buyer and a willing seller in an arm’s-length transaction, after proper marketing wherein the parties had acted knowledgeably and without compulsion, on the basis of the highest and best use of asset that is physically possible, legally permissible and financially feasible. The valuation assessment adopts market-based evidence and is in line with guidance from the International Valuation Standards Committee and the requirements of IAS 16 Property, Plant and Equipment.
Similar considerations apply to properties under construction, where an estimate is made of valuation when complete, adjusted for anticipated costs to completion, profit and risk, reflecting market conditions at the valuation date.
Owner-occupied properties held under lease arrangements are stated at amortised cost and are amortised on a straight-line basis over the lease term. For further information on the Group’s lease arrangements see note 23.
If owner-occupied properties were stated on a historical cost basis, the carrying amount would be £431 million (2018: £364 million).

Notes to the consolidated financial statements Continued
Aviva plc Annual report and accounts 2019 168
Strategic report Governance IFRS financial statements Other information
22 – Investment property This note gives details of the properties we hold for long-term rental yields or capital appreciation.
2019 2018
Freehold
£m Leasehold
£m Total
£m Freehold
£m Leasehold
£m Total
£m
Carrying value At 1 January 9,601 1,881 11,482 9,147 1,650 10,797 Acquisitions — — — 218 208 426 Additions 731 189 920 543 97 640 Capitalised expenditure on existing properties 143 68 211 136 15 151 Fair value gains/(losses) 183 (90) 93 307 — 307 Disposals (1,036) (200) (1,236) (713) (177) (890) Reclassification — — — (82) 82 — Foreign exchange rate movements (243) (24) (267) 45 6 51
At 31 December 9,379 1,824 11,203 9,601 1,881 11,482
See note 24 for further information on the fair value measurement and valuation techniques of investment property.
The fair value of investment properties leased to third parties under operating leases at 31 December 2019 was £10,931 million (2018: £11,172 million). Future contractual aggregate minimum lease rentals receivable under the non-cancellable portion of these leases are given in note 23.
23 – Lease assets and liabilities From 1 January 2019 the Group has adopted IFRS 16 Leases, the standard which replaces IAS 17 Leases. Adoption of the standard has resulted in assets previously held under operating leases (and their corresponding lease liabilities) being recognised on the statement of financial position for the first time. Adoption of the standard resulted in the following assets and liabilities being included within the statement of financial position for the first time at 1 January 2019: • £410 million owner-occupied property assets, included within Property and equipment (see note 21); • £24 million deferred tax assets; and • £544 million lease liabilities, included within Payables and other financial liabilities (see note 54).
The Group’s leased assets primarily consist of properties occupied by Group companies carried at amortised cost (see note 21) and leasehold investment properties carried at fair value (see note 22) which are sublet to third parties. Leasehold investment properties are measured in accordance with IAS 40 Investment Property (see accounting policy Q) and there have been no changes to their classification or measurement arising from the adoption of IFRS 16.
Although the Group is exposed to changes in the residual value at the end of the current leases to third parties on investment property, the Group typically enters into new operating leases and therefore is not expected to immediately realise any reduction in residual value at the end of these leases. Expectations about the future residual values are reflected in the fair value of the properties.
(i) The following amounts in respect of leased assets have been recognised in the Group’s consolidated income statement.
2019
£m
Interest expense on lease liabilities 14 Total lease expenses recognised in the income statement 14
Total cash outflows recognized in the period in relation to leases were £70 million. Expenses recognised in the Group consolidated income statement in relation to short-term and low-value leases were £nil. Variable lease payments not included in the measurement of lease liabilities were £nil.
(ii) The following table analyses the right-of-use assets relating to leased properties occupied by Group companies.
2019 Total
£m
Balance at 1 January 410 Additions 42 Disposals (1) Foreign exchange rate movements (4) Depreciation (62) Balance at 31 December 385
There were no gains arising from sale and leaseback transactions during the year. Included within the income statement is £2 million of income in respect of sublets of right-of-use assets.

Notes to the consolidated financial statements Continued
Aviva plc Annual report and accounts 2019 169
Strategic report Governance IFRS financial statements Other information
23 – Lease assets and liabilities continued (iii) Lease liabilities included within note 54 total £572 million. Future contractual aggregate minimum lease payments are as follows:
2019
£m
Within 1 year 89 Later than 1 year and not later than 5 years 296 Later than 5 years 237 622
The Group is exposed to potential future increases in variable lease payments based on an index or rate, which are not included in the lease liability until they take effect. When adjustments to lease payments based on an index or rate take effect, the lease liability is reassessed and adjusted against the right-of-use asset.
The lease agreements do no impose any covenants other than the security interest in the leased assets that are held by the lessor.
(iv) Future contractual aggregate minimum lease rentals receivable under non-cancellable operating leases are as follows:
2019
£m
Within 1 year 265 Between 1 and 2 years 205 Between 2 and 3 years 183 Between 3 and 4 years 161 Between 4 and 5 years 208 Later than 5 years 1,599 2,621

Notes to the consolidated financial statements Continued
Aviva plc Annual report and accounts 2019 170
Strategic report Governance IFRS financial statements Other information
24 – Fair value methodology This note explains the methodology for valuing our assets and liabilities measured at fair value, and for fair value disclosures. It also provides an analysis of these according to a ‘fair value hierarchy’, determined by the market observability of valuation inputs.
(a) Basis for determining fair value hierarchy All assets and liabilities for which fair value is measured or disclosed in the financial statements are categorised within the ‘fair value hierarchy’ described as follows, based on the lowest level input that is significant to the fair value measurement as a whole:
Level 1 Inputs to Level 1 fair values are quoted prices (unadjusted) in active markets for identical assets and liabilities that the entity can access at the measurement date.
Level 2 Inputs to Level 2 fair values are inputs other than quoted prices included within Level 1 that are observable for the asset or liability, either directly or indirectly. If the asset or liability has a specified (contractual) term, a Level 2 input must be observable for substantially the full term of the instrument. Level 2 inputs include the following: • Quoted prices for similar assets and liabilities in active markets. • Quoted prices for identical or similar assets and liabilities in markets that are not active, the prices are not current, or price quotations vary
substantially either over time or among market makers, or in which little information is released publicly. • Inputs other than quoted prices that are observable for the asset or liability (for example, interest rates and yield curves observable at
commonly quoted intervals, implied volatilities, and credit spreads). • Market-corroborated inputs.
Where we use broker quotes and no information as to the observability of inputs is provided by the broker, the investments are classified as follows: • Where the broker price is validated by using internal models with market observable inputs and the values are similar, we classify the
investment as Level 2. • In circumstances where internal models are not used to validate broker prices, or the observability of inputs used by brokers is unavailable,
the investment is classified as Level 3.
Level 3 Inputs to Level 3 fair values are unobservable inputs for the asset or liability. Unobservable inputs may have been used to measure fair value to the extent that observable inputs are not available, thereby allowing for situations in which there is little, if any, market activity for the asset or liability at the measurement date. However, the fair value measurement objective remains the same, i.e. an exit price at the measurement date from the perspective of a market participant that holds the asset or owes the liability. Unobservable inputs reflect the assumptions the business unit considers that market participants would use in pricing the asset or liability. Examples are investment properties and commercial and equity release mortgage loans.

Notes to the consolidated financial statements Continued
Aviva plc Annual report and accounts 2019 171
Strategic report Governance IFRS financial statements Other information
24 – Fair value methodology continued The majority of the Group’s assets and liabilities measured at fair value are based on quoted market information or observable market data. Of the total assets and liabilities measured at fair value 16.8% (2018: 16.6%) of assets and 3.1% (2018: 3.4%) of liabilities are based on estimates and recorded as Level 3. Where estimates are used, these are based on a combination of independent third-party evidence and internally developed models, calibrated to market observable data where possible. Third-party valuations using significant unobservable inputs validated against Level 2 internally modelled valuations are classified as Level 3, where there is a significant difference between the third-party price and the internally modelled value. Where the difference is insignificant, the instrument would be classified as Level 2.
(b) Changes to valuation techniques There were no changes in the valuation techniques during the year compared to those described in the 2018 annual consolidated financial statements.
(c) Comparison of the carrying amount and fair values of financial instruments Set out below is a comparison of the carrying amounts and fair values of financial assets and liabilities, excluding those classified as held for sale. These amounts may differ where the assets or liabilities are carried on a measurement basis other than fair value, e.g. amortised cost.
2019 Restated1
2018
Fair value
£m
Carrying amount
£m Fair value
£m
Carrying amount
£m
Financial assets Loans (note 25(a)) 38,559 38,579 36,130 36,184 Financial investments (note 28(a)) 343,418 343,418 319,825 319,825
Fixed maturity securities2 198,832 198,832 191,675 191,675 Equity securities 99,570 99,570 88,227 88,227 Other investments (including derivatives)2 45,016 45,016 39,923 39,923
Financial liabilities Non-participating investment contracts (note 45(a)) 129,365 129,365 112,013 112,013 Net asset value attributable to unitholders 16,610 16,610 16,338 16,338 Borrowings (note 53(a))3 10,268 9,039 9,826 9,420 Derivative liabilities (note 61(b)) 6,517 6,517 6,478 6,478 1 Following a review of the Group’s presentation of consolidated investment funds, comparative amounts have been restated from those previously reported. The review identified amounts presented within cash and cash
equivalents and other investments that are now presented as loans, fixed maturity securities and equity securities in the table above. The restatement has had no impact on the profit for the year or equity. See note 1a for further information.
2 Following a review of the classification of financial assets, comparative amounts have been amended from those previously reported. The effect of this change is to reclassify £2,201 million of assets from fixed maturity securities to other investments.
3 Within the fair value total, the estimated fair value has been provided for the portion of borrowings that are carried at amortised cost as disclosed in note 24 (h).
Fair value of the following assets and liabilities approximate to their carrying amounts: • Receivables • Cash and cash equivalents • Loans at amortised cost • Payables and other financial liabilities
As set out in accounting policy A, the Group has chosen to defer application of IFRS 9 due to its activities being predominantly connected with insurance. To facilitate comparison with entities applying IFRS 9 in full, the table below splits the Group’s financial instruments as at the reporting date between those which are considered to have contractual terms which are solely payments of principal and interest (SPPI) on the principal amount outstanding (excluding instruments held for trading or managed and evaluated on a fair value basis), and all other instruments not falling into this category.
2019 Restated1 2018
SPPI – Fair value
£m
Non-SPPI – fair value2
£m
SPPI – Fair value
£m
Non-SPPI – fair value2
£m
Fixed maturity securities — 199,481 273 191,799 Equity securities — 99,826 — 88,437 Loans 9,580 28,980 9,859 26,271 Receivables 5,799 3,265 5,609 3,041 Cash and cash equivalents 15,344 4,960 11,249 5,365 Accrued income and Interest 272 1,924 193 2,505 Other financial assets 5 51,930 10 46,557
Total 31,000 390,366 27,193 363,975 1 Following a review of the Group’s presentation of consolidated investment funds, comparative amounts have been restated from those previously reported. The review identified amounts presented within cash and cash
equivalents and other investments that are now presented as loans, fixed maturity securities and equity securities in the table above. The restatement has had no impact on the profit for the year or equity. See note 1a for further information.
2 Instruments within this category include financial assets that meet the definition of held for trading, financial assets that are managed and evaluated on a fair value basis, and instruments with contractual terms that do not give rise on specified dates to cash flows that are solely payments of principal and interest on the principal amount outstanding.
There has been a £24 million increase (2018: £7 million decrease) in the fair value of SPPI instruments, and a £20,090 million increase (2018: £23,645 million decrease) in the fair value of non-SPPI instruments during the reporting period.

Notes to the consolidated financial statements Continued
Aviva plc Annual report and accounts 2019 172
Strategic report Governance IFRS financial statements Other information
24 – Fair value methodology continued (d) Fair value hierarchy analysis An analysis of assets and liabilities measured at amortised cost and fair value categorised by fair value hierarchy is given below.
Fair value hierarchy Sub-total Fair value
£m
Amortised cost
£m
Total carrying value
£m 2019 Level 1
£m Level 2
£m Level 3
£m
Recurring fair value measurements Investment property (note 22) — — 11,203 11,203 — 11,203 Loans (note 25(a)) — — 28,319 28,319 10,260 38,579 Financial investments measured at fair value (note 28(a))
Fixed maturity securities 67,638 113,599 17,595 198,832 — 198,832 Equity securities 98,850 — 720 99,570 — 99,570 Other investments (including derivatives) 32,465 6,878 5,673 45,016 — 45,016
Financial assets classified as held for sale 5,788 50 1,986 7,824 1 7,825 Total 204,741 120,527 65,496 390,764 10,261 401,025 Financial liabilities measured at fair value
Non-participating investment contracts1 (note 45(a)) 129,323 42 — 129,365 — 129,365 Net asset value attributable to unit holders 16,498 — 112 16,610 — 16,610 Borrowings (note 53(a)) — — 1,233 1,233 7,806 9,039 Derivative liabilities (note 61(b)) 418 5,444 655 6,517 — 6,517
Financial liabilities classified as held for sale 5,259 20 3,045 8,324 28 8,352 Total 151,498 5,506 5,045 162,049 7,834 169,883 1 In addition to the balances in this table, included within reinsurance assets in the statement of financial position and note 47 are £4,006 million of non-participating investment contracts, which are legally reinsurance but do not
meet the definition of a reinsurance contract under IFRS. These assets are financial instruments measured at fair value through profit and loss and are classified as Level 1 assets.
Fair value hierarchy Total fair value
£m 2019 Level 1
£m Level 2
£m Level 3
£m
Non-recurring fair value measurement Properties occupied by Group companies — — 320 320 Total — — 320 320
IFRS 13, Fair Value Measurement, permits assets and liabilities to be measured at fair value on either a recurring or non-recurring basis. Recurring fair value measurements are those that other IFRSs require or permit in the statement of financial position at the end of each reporting period, whereas non-recurring fair value measurements of assets or liabilities are those that other IFRSs require or permit in the statement of financial position in particular circumstances. The value of owner-occupied properties measured on a non-recurring basis at 31 December 2019 was £320 million (2018: £352 million), stated at their revalued amounts in line with the requirements of IAS 16 Property, Plant and Equipment.
The disclosure above relates to those owner-occupied properties which have been measured at fair value. Owner-occupied properties held under lease arrangements are stated at amortised cost and are amortised on a straight-line basis over the lease term. For further information on the Group’s lease arrangements see note 23.
Fair value hierarchy Sub-total Fair value
£m
Amortised cost
£m
Total carrying value
£m Restated1 2018 Level 1
£m Level 2
£m Level 3
£m
Recurring fair value measurements Investment property (note 22) — — 11,482 11,482 — 11,482 Loans (note 25(a)) — 518 25,008 25,526 10,658 36,184 Financial investments measured at fair value (note 28(a))
Fixed maturity securities2 65,996 109,176 16,503 191,675 — 191,675 Equity securities 87,813 — 414 88,227 — 88,227 Other investments (including derivatives)2 29,971 4,770 5,182 39,923 — 39,923
Financial assets classified as held for sale 5,240 19 1,992 7,251 — 7,251
Total 189,020 114,483 60,581 364,084 10,658 374,742
Financial liabilities measured at fair value Non-participating investment contracts3 (note 45(a)) 111,966 47 — 112,013 — 112,013 Net asset value attributable to unit holders 16,313 — 25 16,338 — 16,338 Borrowings (note 53(a)) — — 1,225 1,225 8,195 9,420 Derivative liabilities (note 61(b)) 466 5,478 534 6,478 — 6,478
Financial liabilities classified as held for sale 5,241 — 3,100 8,341 — 8,341 Total 133,986 5,525 4,884 144,395 8,195 152,590 1 Following a review of the Group’s presentation of consolidated investment funds, comparative amounts have been restated from those previously reported. The review identified amounts presented within cash and cash
equivalents and other investments that are now presented as loans, fixed maturity securities and equity securities in the table above. The restatement has had no impact on the profit for the year or equity. See note 1a for further information.
2 Following a review of the classification of financial assets, comparative amounts have been restated from those previously reported. The effect of this change is to reclassify £2,201 million of assets from fixed maturity securities to other investments and £3,734 million of assets from fair value hierarchy level 2 to level 1.
3 In addition to the balances in this table, included within reinsurance assets in the statement of financial position and note 47 are £4,009 million of non-participating investment contracts, which are legally reinsurance but do not meet the definition of a reinsurance contract under IFRS. These assets are financial instruments measured at fair value through profit and loss and are classified as Level 1 assets

Notes to the consolidated financial statements Continued
Aviva plc Annual report and accounts 2019 173
Strategic report Governance IFRS financial statements Other information
24 – Fair value methodology continued Fair value hierarchy Total
fair value £m 2018
Level 1 £m
Level 2 £m
Level 3 £m
Non-recurring fair value measurement Properties occupied by Group companies — — 352 352
Total — — 352 352
(e) Valuation approach for fair value assets and liabilities classified as Level 2 Please see note 24(a) for a description of typical Level 2 inputs.
Debt securities, in line with market practice, are generally valued using an independent pricing service. These valuations are determined using independent external quotations from multiple sources and are subject to a number of monitoring controls, such as monthly price variances, stale price reviews and variance analysis. Pricing services, where available, are used to obtain the third-party broker quotes. Where pricing services providers are used, a single valuation is obtained and applied. When prices are not available from pricing services, quotes are sourced from brokers.
Over-the-counter derivatives are valued using broker quotes or models such as option pricing models, simulation models or a combination of models. The inputs for these models include a range of factors which are deemed to be observable, including current market and contractual prices for underlying instruments, period to maturity, correlations, yield curves and volatility of the underlying instruments.
Unit Trusts and other investment funds included under the other investments category are valued using net asset values which are not subject to a significant adjustment for restrictions on redemption or for limited trading activity.
(f) Transfers between levels of the fair value hierarchy For financial instruments that are recognised at fair value on a recurring basis, the Group determines whether transfers have occurred between levels of the fair value hierarchy by re-assessing categorisation (based on the lowest level input that is significant to the fair value measurement as a whole) at the end of the reporting period.
Transfers between Level 1 and Level 2 There were no significant transfers between Level 1 and 2 during the year.
Transfers to/from Level 3 £1.5 billion of assets transferred into Level 3 and £1.2 billion of assets transferred out of Level 3 relate principally to debt securities held by our businesses in the UK and France. These are transferred between Levels 2 and 3 depending on the availability of observable inputs and whether the counterparty and broker quotes are corroborated using valuation models with observable inputs.
There were no significant transfers of liabilities into and out of Level 3 during the year.
(g) Further information on Level 3 assets and liabilities The table below shows movement in the Level 3 assets and liabilities measured at fair value.
Assets Liabilities
2019
Investment Property
£m Loans
£m
Fixed maturity
securities £m
Equity securities
£m
Other investments
(including derivatives)
£m
Financial assets
classified as held for sale
£m
Non participating
investment contracts
£m
Net asset value
attributable to
unitholders £m
Derivative liabilities
£m Borrowings
£m
Financial liabilities
classified as held for sale
£m
Opening balance at 1 January 2019 11,482 25,008 16,503 414 5,182 1,992 — (25) (534) (1,225) (3,100) Total net gains/(losses) recognised in
the income statement1 151 844 505 (66) 6 134 — — (86) (52) (134) Purchases 1,131 3,461 2,090 427 1,350 185 (100) (56) (128) — (134) Issuances — 190 12 — — — — — — — — Disposals (1,294) (1,170) (1,454) (39) (532) (262) 100 (31) 88 44 261 Settlements — — (50) — — — — — — — — Transfers into Level 3 — — 1,449 1 — 49 — — — — (49) Transfers out of Level 3 — — (919) — (142) (112) — — — — 111 Foreign exchange rate movements (267) (14) (541) (17) (191) — — — 5 — — Balance at 31 December 2019 11,203 28,319 17,595 720 5,673 1,986 — (112) (655) (1,233) (3,045) 1 Total net gains/(losses) recognised in the income statement includes realised gains/(losses) on disposals.

Notes to the consolidated financial statements Continued
Aviva plc Annual report and accounts 2019 174
Strategic report Governance IFRS financial statements Other information
24 – Fair value methodology continued Assets Liabilities
2018
Investment Property
£m Loans
£m
Fixed maturity securities
£m
Equity securities
£m
Other investments
(including derivatives)
£m
Financial assets
classified as held for sale
£m
Non participating
investment contracts
£m
Net asset value
attributable to unitholders
£m
Derivative liabilities
£m Borrowings
£m
Financial liabilities
classified as held for sale
£m
Opening balance at 1 January 2018 10,797 23,949 14,100 776 3,900 2,093 — (13) (358) (1,180) (3,306) Total net gains/(losses) recognised in
the income statement1 376 (530) (363) (102) (69) (73) — — (136) (81) 74 Purchases 1,185 3,451 3,137 189 1,799 201 (108) — (59) — (95) Issuances — 200 — — — — — — — — — Disposals (927) (2,065) (1,221) (544) (554) (191) 108 (12) 20 36 189 Settlements2 — — — — — — — — — — — Transfers into Level 3 — — 1,242 95 77 20 — — — — (20) Transfers out of Level 3 — — (503) (2) — (58) — — — — 58 Foreign exchange rate movements 51 3 111 2 29 — — — (1) — —
Balance at 31 December 2018 11,482 25,008 16,503 414 5,182 1,992 — (25) (534) (1,225) (3,100) 1 Total net gains/(losses) recognised in the income statement includes realised gains/(losses) on disposals. 2 Following a review of the classification of financial assets, comparative amounts have been restated from those previously reported. The effect of the change is to classify £2,201 million of assetsfrom fixed maturity securities to
other investments.
Total net gains recognised in the income statement in the year ended 31 December 2019 in respect of Level 3 assets measured at fair value amounted to £1,574 million (2018: net losses of £761 million) with net losses in respect of liabilities of £272 million (2018: net losses of £143 million). Net gains of £1,427 million (2018: net losses of £529 million) attributable to assets and net losses of £271 million (2018: net losses of £178 million) attributable to liabilities relate to those still held at the end of the year.
The principal assets classified as Level 3, and the valuation techniques applied to them, are described below.
(i) Investment property • Investment property is valued in the UK at least annually by external chartered surveyors in accordance with guidance issued by The Royal
Institution of Chartered Surveyors and using estimates during the intervening period. Outside the UK, valuations are produced by external qualified professional appraisers in the countries concerned. Investment properties are valued on an income approach that is based on current rental income plus anticipated uplifts at the next rent review, lease expiry, or break options taking into consideration lease incentives and assuming no further growth in the estimated rental value of the property. The uplift and discount rates are derived from rates implied by recent market transactions on similar properties. These inputs are deemed unobservable.
(ii) Loans • Commercial mortgage loans and Primary Healthcare loans held by our UK Life business are valued using a Portfolio Credit Risk Model. This
model calculates a Credit Risk Adjusted Value for each loan. The risk adjusted cash flows are discounted using a yield curve, taking into account the term dependent gilt yield curve and global assumptions for the liquidity premium. Loans valued using this model have been classified as Level 3 as the liquidity premium is deemed to be non-market observable. The liquidity premium used in the discount rate ranges between 65 bps to 80 bps (2018: 65 bps to 195 bps).
• Equity release mortgage loans held by our UK Life business are valued using an internal model, with fair value initially being equal to the transaction price. The value of these loans is dependent on the expected term of the mortgage and the forecast property value at the end of the term, and is calculated by adjusting future cash flows for credit risk and discounting using a yield curve plus an allowance for illiquidity. At 31 December 2019 the illiquidity premium used in the discount rate was 160 bps (2018: 210 bps).
• The mortgages have a no negative equity guarantee (‘NNEG’) such that the cost of any potential shortfall between the value of the loan and the realised value of the property, at the end of the term, is recognised by a deduction to the value of the loan. Property valuations at the reporting date are obtained by taking the most recent valuation for the property and indexing using market observable regional house price indices. NNEG is calculated using base property growth rates reduced for the cost of potential dilapidations, using a stochastic model. In addition, a cost of capital charge is applied to reflect the variability in these cashflows. The base property growth rate assumption is RPI +0.75% which equates to a long-term average growth rate of 4.0% pa at 31 December 2019 (2018: 4.3%). After applying the cost of capital charge, dilapidations and the stochastic distribution, the effective net long-term growth rate equates to 0.5% pa (2018: 0.6%).
• Mortgage loan assumptions for future property prices and rental income also include an allowance for the possible adverse impact of the decision for the UK to leave the European Union (see note 9).
• Infrastructure and Private Finance Initiative (PFI) loans held by our UK Life business are valued using a discounted cash flow model. This adds spreads for credit and illiquidity to a risk-free discount rate. Credit spreads used in the discount rate are calculated using an internally developed methodology which depends on the credit rating of each loan, credit spreads on publicly traded bonds and an estimated recovery rate in event of default and are deemed to be unobservable.
(iii) Fixed maturity securities • Structured bond-type and non-standard debt products held by our business in France have no active market. These debt securities are valued
either using counterparty or broker quotes and validated against internal or third-party models. These bonds have been classified as Level 3 because either (i) the third-party models include a significant unobservable liquidity adjustment, or (ii) differences between the valuation provided by the counterparty and broker quotes and the validation model are sufficiently significant to result in a Level 3 classification.
• Non-standard debt products and privately placed bonds held by our businesses in the UK do not trade in an active market. These debt securities are valued using discounted cash flow models, designed to appropriately reflect the credit and illiquidity risk of the instrument. These bonds have been classified as Level 3 because the valuation approach includes significant unobservable inputs and an element of subjectivity in determining appropriate credit and illiquidity spreads.
• Debt securities held by our French and Asian businesses which are not traded in an active market have been valued using third party or counterparty valuations. These prices are considered to be unobservable due to infrequent market transactions.

Notes to the consolidated financial statements Continued
Aviva plc Annual report and accounts 2019 175
Strategic report Governance IFRS financial statements Other information
24 – Fair value methodology continued (iv) Equity securities • Equity securities which primarily comprise private equity holdings held in the UK are valued by a number of third party specialists. These
are valued using a range of techniques, including earnings multiples, forecast cash flows and price/earnings ratios which are deemed to be unobservable.
(v) Property Funds • Property funds are valued based on external valuation reports received from fund managers.
(vi) Financial assets of operations classified as held for sale • Financial assets of operations classified as held for sale are held by our Asia business and consist primarily of discretionary managed funds
of £1,404 million (2018: £1,398 million) and debt securities which are not traded in an active market and have been valued using third party or counterparty valuations of £401 million (2018: £360 million). These assets are included within the relevant asset category within the sensitivity table below.
(vii) Liabilities The principal liabilities classified as Level 3, and the valuation techniques applied to them, are: • £3,045 million (2018: £3,100 million) of non-participating investment contract liabilities which are included within financial liabilities of
operations classified as held for sale. These are classified as Level 3, either because the underlying unit funds are classified as Level 3 or because the liability relates to unfunded units or other non-unit adjustments which are based on a discounted cash flow analysis using unobservable market data and assumptions. These liabilities are included within the relevant asset category within the sensitivity table below.
• Securitised mortgage loan notes, presented within Borrowings, are valued using a similar technique to the related Level 3 securitised mortgage assets.
Where these valuations are at a date other than the balance sheet date, as in the case of some private equity funds, adjustments are made to reflect items such as subsequent drawdowns and distributions and the fund manager’s carried interest.
Sensitivities Where possible, the Group tests the sensitivity of the fair values of Level 3 assets and liabilities to changes in unobservable inputs to reasonable alternatives. Level 3 valuations are sourced from independent third parties when available and, where appropriate, validated against internally-modelled valuations, third-party models or broker quotes. Where third-party pricing sources are unwilling to provide a sensitivity analysis for their valuations, the Group undertakes, where feasible, sensitivity analysis on the following basis: • For third-party valuations validated against internally-modelled valuations using significant unobservable inputs, the sensitivity of the
internally-modelled valuation to changes in unobservable inputs to a reasonable alternative is determined. • For third-party valuations either not validated or validated against a third-party model or broker quote, the third-party valuation in its
entirety is considered an unobservable input. Sensitivities are determined by flexing inputs of internal models to a reasonable alternative, including the yield, NAV multiple or other suitable valuation multiples of the financial instrument implied by the third-party valuation. For example, for a fixed income security the implied yield would be the rate of return which discounts the security’s contractual cash flows to equal the third-party valuation.
The tables below show the sensitivity of the fair value of Level 3 assets and liabilities to changes in unobservable inputs to a reasonable alternative:
Sensitivities
2019 Fair value
£bn Most significant unobservable input Reasonable alternative
Positive Impact
£bn
Negative Impact
£bn
Investment property 11.2 Equivalent rental yields +/- 5-10% 0.9 (0.9) Loans Commercial mortgage loans and Primary Healthcare loans 12.9 Illiquidity premium +/- 20 bps 0.2 (0.2) Equity release mortgage loans 11.0 Base property growth rate +/- 10% 0.3 (0.4) Current property market values +/- 10% 0.2 (0.2) Infrastructure and Private Finance Initiative (PFI) loans 4.0 Illiquidity premium +/- 25 bps1 0.2 (0.2) Other 0.4 Illiquidity premium +/- 25 bps1 — — Fixed maturity securities Structured bond-type and non-standard debt products 6.4 Market spread (credit, liquidity and other) +/- 25 bps 0.1 (0.1) Privately placed notes 1.7 Credit spreads +/- 25 bps1 0.1 (0.1) Other debt securities 9.9 Credit and liquidity spreads +/- 20-25 bps 0.5 (0.5) Equity securities 0.8 Market spread (credit, liquidity and other) +/- 25 bps — (0.1) Other investments Property Funds 0.8 Market multiples applied to net asset values +/- 15-20% 0.1 (0.1) Other investments (including derivatives) 6.4 Market multiples applied to net asset values +/- 10-40%2 0.8 (0.6) Liabilities Non-participating investment contract liabilities (3.0) Fair value of the underlying unit funds +/- 20-25% 0.4 (0.4) Borrowings (1.2) Illiquidity premium +/- 50 bps — — Other liabilities (including derivatives) (0.8) Independent valuation vs counterparty N/A — — Total Level 3 investments 60.5 3.8 (3.8) 1 On discount spreads. 2 Dependent on investment category.

Notes to the consolidated financial statements Continued
Aviva plc Annual report and accounts 2019 176
Strategic report Governance IFRS financial statements Other information
24 – Fair value methodology continued Sensitivities
2018 Fair value
£bn Most significant unobservable input Reasonable alternative
Positive Impact
£bn
Negative Impact
£bn
Investment property 11.6 Equivalent rental yields +/- 5-10% 0.9 (0.9)
Loans Commercial mortgage loans and Primary Healthcare loans 11.5 Illiquidity premium +/- 20 bps 0.2 (0.2) Equity release mortgage loans 9.7 Base property growth rate3 +/- 10% 0.3 (0.3) Current property market values +/- 10% 0.3 (0.4) Infrastructure and Private Finance Initiative (PFI) loans 3.4 Illiquidity premium +/- 25 bps1 0.1 (0.1) Other 0.4 Illiquidity premium +/- 25 bps1 — — Fixed maturity securities Structured bond-type and non-standard debt products 6.6 Market spread (credit, liquidity and other) +/- 25 bps 0.1 (0.1) Privately placed notes 1.6 Credit spreads +/- 25 bps1 0.1 — Other debt securities4 8.7 Credit and liquidity spreads +/- 20-25 bps 0.4 (0.4)
Equity securities 0.3 Market spread (credit, liquidity and other) +/- 25 bps — —
Other investments Property Funds 0.8 Market multiples applied to net asset values +/- 15-20% 0.1 (0.1) Other investments (including derivatives)4 6.0 Market multiples applied to net asset values +/- 10-40%2 0.7 (0.6)
Liabilities Non-participating investment contract liabilities (3.1) Fair value of the underlying unit funds +/- 20-25% 0.4 (0.4) Borrowings (1.2) Illiquidity premium +/- 50 bps — — Other liabilities (including derivatives) (0.6) Independent valuation vs counterparty N/A — —
Total Level 3 investments 55.7 3.6 (3.5) 1 On discount spreads. 2 Dependent on investment category. 3 Following a review of the sensitivities of equity release mortgage loans to base property growth rates, the 2018 comparative amounts have been restated from those previously reported. 4 Following a review of the Group’s presentation of consolidated investment funds, comparative amounts have been restated from those previously reported. The restatement has had no impact on the profit for the year or equity.
See note 1(a) for further information.
The above tables demonstrate the effect of a change in one unobservable input while other assumptions remain unchanged. In reality, there may be a correlation between the unobservable inputs and other factors. It should also be noted that some of these sensitivities are non-linear, and larger or smaller impacts should not be interpolated or extrapolated from these results.
(h) Liabilities not carried at fair value for which fair value is disclosed The table below shows the fair value and fair value hierarchy for those liabilities not carried at fair value.
Fair value hierarchy
2019 Notes
As recognised in the
consolidated statement of
financial position line
item £m
Level 1 £m
Level 2 £m
Level 3 £m
Total fair value
£m
Liabilities not carried at fair value Borrowings 53(a) 7,834 8,583 235 217 9,035
Fair value hierarchy
2018 Notes
As recognised in the
consolidated statement of
financial position line
item £m
Level 1 £m
Level 2 £m
Level 3 £m
Total fair value £m
Liabilities not carried at fair value Borrowings 53(a) 8,195 7,979 213 409 8,601
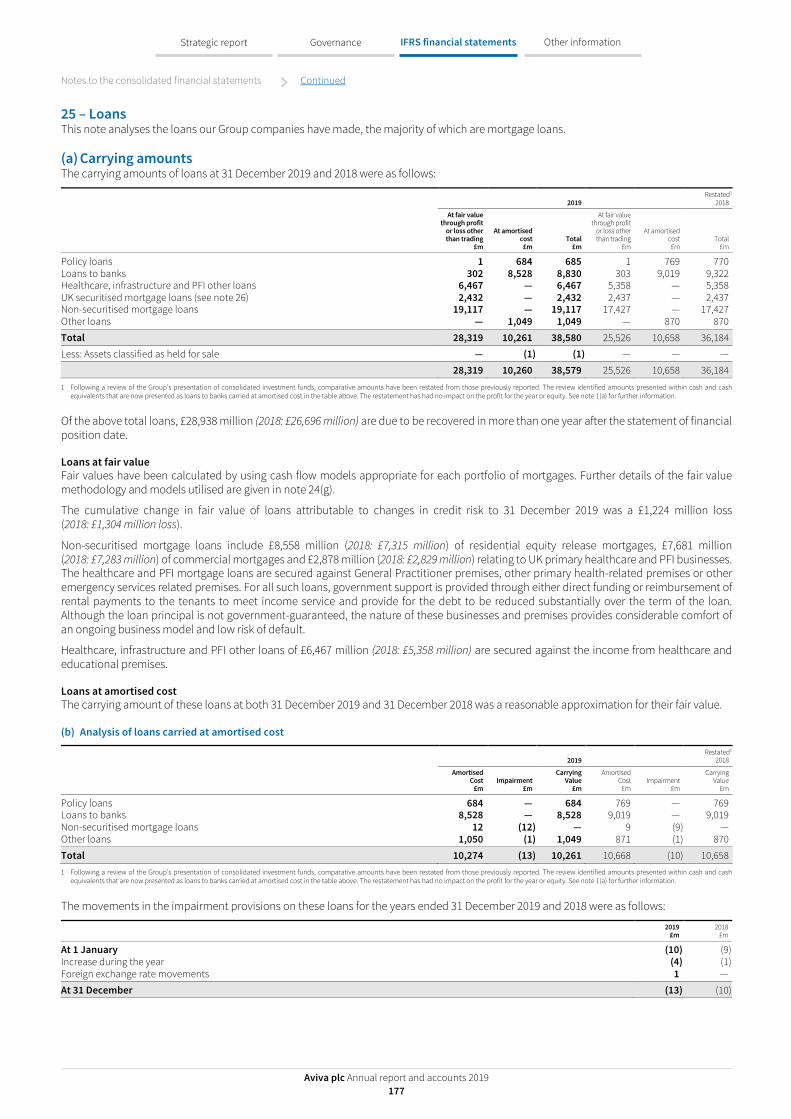
Notes to the consolidated financial statements Continued
Aviva plc Annual report and accounts 2019 177
Strategic report Governance IFRS financial statements Other information
25 – Loans This note analyses the loans our Group companies have made, the majority of which are mortgage loans.
(a) Carrying amounts The carrying amounts of loans at 31 December 2019 and 2018 were as follows:
2019 Restated1
2018
At fair value through profit
or loss other than trading
£m
At amortised cost
£m Total
£m
At fair value through profit
or loss other than trading
£m
At amortised cost £m
Total £m
Policy loans 1 684 685 1 769 770 Loans to banks 302 8,528 8,830 303 9,019 9,322 Healthcare, infrastructure and PFI other loans 6,467 — 6,467 5,358 — 5,358 UK securitised mortgage loans (see note 26) 2,432 — 2,432 2,437 — 2,437 Non-securitised mortgage loans 19,117 — 19,117 17,427 — 17,427 Other loans — 1,049 1,049 — 870 870
Total 28,319 10,261 38,580 25,526 10,658 36,184
Less: Assets classified as held for sale — (1) (1) — — —
28,319 10,260 38,579 25,526 10,658 36,184 1 Following a review of the Group’s presentation of consolidated investment funds, comparative amounts have been restated from those previously reported. The review identified amounts presented within cash and cash
equivalents that are now presented as loans to banks carried at amortised cost in the table above. The restatement has had no impact on the profit for the year or equity. See note 1(a) for further information.
Of the above total loans, £28,938 million (2018: £26,696 million) are due to be recovered in more than one year after the statement of financial position date.
Loans at fair value Fair values have been calculated by using cash flow models appropriate for each portfolio of mortgages. Further details of the fair value methodology and models utilised are given in note 24(g).
The cumulative change in fair value of loans attributable to changes in credit risk to 31 December 2019 was a £1,224 million loss (2018: £1,304 million loss).
Non-securitised mortgage loans include £8,558 million (2018: £7,315 million) of residential equity release mortgages, £7,681 million (2018: £7,283 million) of commercial mortgages and £2,878 million (2018: £2,829 million) relating to UK primary healthcare and PFI businesses. The healthcare and PFI mortgage loans are secured against General Practitioner premises, other primary health-related premises or other emergency services related premises. For all such loans, government support is provided through either direct funding or reimbursement of rental payments to the tenants to meet income service and provide for the debt to be reduced substantially over the term of the loan. Although the loan principal is not government-guaranteed, the nature of these businesses and premises provides considerable comfort of an ongoing business model and low risk of default.
Healthcare, infrastructure and PFI other loans of £6,467 million (2018: £5,358 million) are secured against the income from healthcare and educational premises.
Loans at amortised cost The carrying amount of these loans at both 31 December 2019 and 31 December 2018 was a reasonable approximation for their fair value.
(b) Analysis of loans carried at amortised cost
2019 Restated1
2018
Amortised Cost
£m Impairment
£m
Carrying Value
£m
Amortised Cost
£m Impairment
£m
Carrying Value
£m
Policy loans 684 — 684 769 — 769 Loans to banks 8,528 — 8,528 9,019 — 9,019 Non-securitised mortgage loans 12 (12) — 9 (9) — Other loans 1,050 (1) 1,049 871 (1) 870
Total 10,274 (13) 10,261 10,668 (10) 10,658 1 Following a review of the Group’s presentation of consolidated investment funds, comparative amounts have been restated from those previously reported. The review identified amounts presented within cash and cash
equivalents that are now presented as loans to banks carried at amortised cost in the table above. The restatement has had no impact on the profit for the year or equity. See note 1(a) for further information.
The movements in the impairment provisions on these loans for the years ended 31 December 2019 and 2018 were as follows:
2019
£m 2018
£m
At 1 January (10) (9) Increase during the year (4) (1) Foreign exchange rate movements 1 —
At 31 December (13) (10)

Notes to the consolidated financial statements Continued
Aviva plc Annual report and accounts 2019 178
Strategic report Governance IFRS financial statements Other information
25 – Loans continued (c) Collateral Loans to banks include cash collateral received under stock lending arrangements (see note 62 for further discussion regarding these collateral positions). The obligation to repay this collateral is included in payables and other financial liabilities (see note 54).
The Group holds collateral in respect of loans where it is considered appropriate in order to reduce the risk of non-recovery. This collateral generally takes the form of liens or charges over properties and, in the case of policy loans, the underlying policy for the majority of the loan balances above. In all other situations, the collateral must be in a readily realisable form, such as listed securities, and is held in segregated accounts.
26 – Securitised mortgages and related assets The Group, in its UK Life business, has loans receivable, secured by mortgages, which have then been securitised through non-recourse borrowings. This note gives details of the relevant transactions.
(a) Description of current arrangements In a UK long-term business subsidiary, Aviva Equity Release UK Limited (AER), the beneficial interest in certain portfolios of lifetime mortgages has been transferred to five special purpose securitisation companies (the ERF companies), in return for initial consideration and, at later dates, deferred consideration. The deferred consideration represents receipts accrued within the ERF companies after meeting all their obligations to the note holders, loan providers and other third parties in the priority of payments. The purchases of the mortgages were funded by the issue of fixed and floating rate notes by the ERF companies.
All the shares in the ERF companies are held by independent companies, whose shares are held on trust. Although AER does not own, directly or indirectly, any of the share capital of the ERF companies or their parent companies, it has control of the securitisation companies, and they have therefore been treated as subsidiaries in the consolidated financial statements. AER has no right to repurchase the benefit of any of the securitised mortgage loans, other than in certain circumstances where AER is in breach of warranty or loans are substituted in order to effect a further advance.
AER has purchased subordinated notes and granted subordinated loans to some of the ERF companies. In addition, Group companies have invested £224 million (2018: £239 million) in loan notes issued by the ERF companies. These have been eliminated on consolidation through offset against the borrowings of the ERF companies in the statement of financial position.
In all of the above transactions, the Company and its subsidiaries are not obliged to support any losses that may be suffered by the note holders and do not intend to provide such support. Additionally, the notes were issued on the basis that note holders are only entitled to obtain payment, of both principal and interest, to the extent that the available resources of the respective special purpose securitisation companies, including funds due from customers in respect of the securitised loans, are sufficient and that note holders have no recourse whatsoever to other companies in the Aviva Group.
(b) Carrying values The following table summarises the securitisation arrangements:
2019 2018
Securitised assets
£m
Securitised liabilities
£m
Securitised assets
£m
Securitised liabilities
£m
Securitised mortgage loans (note 25) and loan notes issued 2,432 (1,457) 2,437 (1,464) Other securitisation assets/(liabilities) 282 (1,257) 266 (1,239) 2,714 (2,714) 2,703 (2,703)
Loan notes held by third parties are as follows:
2019
£m 2018
£m
Total loan notes issued, as above 1,457 1,464 Less: Loan notes held by Group companies (224) (239)
Loan notes held by third parties (note 53(c)(i)) 1,233 1,225

Notes to the consolidated financial statements Continued
Aviva plc Annual report and accounts 2019 179
Strategic report Governance IFRS financial statements Other information
27 – Interests in structured entities A structured entity is defined as an entity that has been designed so that voting or similar rights are not the dominant factor in deciding who controls the entity, such as when any voting rights relate to administrative tasks only, or when the relevant activities are directed by means of contractual arrangements. The Group has interests in both consolidated and unconsolidated structured entities as described below.
The Group holds redeemable shares or units in investment vehicles, which consist of: • Debt securities comprising securitisation vehicles that Aviva does not originate. These investments are comprised of a variety of debt
instruments, including asset-backed securities and other structured securities. • Investment funds which include: hedge funds, liquidity funds, private equity funds, unit trusts, mutual funds and Private Finance Initiatives
(PFIs). • Specialised investment vehicles include Open Ended Investment Companies (OEICs), Property Limited Partnerships (PLPs), Sociétés
d’Investissement a Capital Variable (SICAVs), Tax Transparent Funds (TTFs) and other investment vehicles.
The Group’s holdings in investment vehicles are subject to the terms and conditions of the respective investment vehicle’s offering documentation and are susceptible to market price risk arising from uncertainties about future values of those investment vehicles. The investment manager makes investment decisions after extensive due diligence of the underlying investment vehicle including consideration of its strategy and the overall quality of the underlying investment vehicle’s manager.
All of the investment vehicles in the investment portfolio are managed by portfolio managers who are compensated by the respective investment vehicles for their services. Such compensation generally consists of an asset-based fee and a performance-based incentive fee, and is reflected in the valuation of the investment vehicles.
(a) Interests in consolidated structured entities The Group has determined that where it has control over investment vehicles, these investments are consolidated structured entities. As at 31 December 2019 the Group has granted loans to consolidated PLPs for a total of £64 million (2018: £84 million). The purpose of these loans is to assist the consolidated PLPs to purchase or construct properties. The Group has also provided support, without having a contractual obligation to do so, to certain consolidated PLPs via letters of support amounting to £57 million (2018: £51 million). The Group has no commitments to provide funding to consolidated structured entities (2018: £nil).
The Group has also given support to five special purpose securitisation companies (the ERF companies) that are consolidated structured entities. As set out in note 26, at the inception of the securitisation vehicles, the UK subsidiary, Aviva Equity Release UK Limited (AER), has granted subordinated loan facilities to some of the ERF companies. AER receives various fees in return for the services provided to the entities. AER receives cash management fees based on the outstanding loan balance at the start of each quarter for the administration of the loan note liabilities. AER receives portfolio administration fees as compensation for managing the mortgage assets. Refer to note 26 for details of securitised mortgages and related assets as at 31 December 2019.
As at the reporting date, the Group has no intentions to provide financial or other support in relation to any other investment vehicles.
(b) Interests in unconsolidated structured entities As part of its investment activities, the Group invests in unconsolidated structured entities. As at 31 December 2019, the Group’s total interest in unconsolidated structured entities was £58,519 million (2018 restated: £53,617 million) on the Group’s statement of financial position. The Group’s total interest in unconsolidated structured entities is classified as ‘Interests in and loans to joint ventures and associates’ and ‘financial investments held at fair value through profit or loss’. The Group does not sponsor any of the unconsolidated structured entities.
As at 31 December 2019, a summary of the Group’s interest in unconsolidated structured entities is as follows:
2019
£m
Restated1 2018
£m
Interest in, and loans
to, joint ventures
Interest in, and
loans to, associates
Financial investments Loans
Total assets
Interest in, and loans
to, joint ventures
Interest in, and
loans to, associates
Financial investments Loans
Total assets
Structured debt securities2 — — 4,746 — 4,746 — — 4,662 — 4,662 Other investments and equity securities 792 209 44,669 — 45,670 797 217 41,055 — 42,069
Analysed as: Unit trust and other investment vehicles — — 41,836 — 41,836 — — 38,604 — 38,604 PLPs and property funds 792 209 2,395 — 3,396 797 217 1,975 — 2,989 Other (Including other funds and equity securities) — — 438 — 438 — — 476 — 476
Loans3 — — — 8,103 8,103 — — — 6,886 6,886 Total 792 209 49,415 8,103 58,519 797 217 45,717 6,886 53,617 1 Following a review of the Group’s presentation of consolidated investment funds, comparative amounts have been restated from those previously reported. The review identified amounts presented as unit trusts and other
investment vehicles that are either now presented as structured debt securities or which are no longer presented as unconsolidated structured entities in the table above. The restatement has had no impact on the profit for the year or equity. See note 1(a) for further information.
2 Primarily reported within ‘other debt securities’ in note 28(a). 3 Loans include Healthcare, infrastructure & PFI other loans along with certain non-securitised mortgage loans.
The Group’s maximum exposure to loss related to the interests in unconsolidated structured entities is £58,519 million (2018 restated: £53,617 million).
The majority of debt securities above are investment grade securities held by the UK business. In some cases, the Group may be required to absorb losses from an unconsolidated structured entity before other parties when and if Aviva’s interest is more subordinated with respect to other owners of the same security.
For commitments to property management joint ventures and associates, please refer to notes 19 and 20, respectively. The Group has not provided any other financial or other support in addition to that described above as at the reporting date, and there are no intentions to provide support in relation to any other unconsolidated structured entities in the foreseeable future.

Notes to the consolidated financial statements Continued
Aviva plc Annual report and accounts 2019 180
Strategic report Governance IFRS financial statements Other information
27 – Interests in structured entities continued In relation to risk management, disclosures on debt securities and investment vehicles are given in note 60(b)(ii) ‘Risk management’. In relation to other guarantees and commitments that the Group provides in the course of its business, please see note 56(f) ‘Contingent liabilities and other risk factors’.
Aviva’s interest in unconsolidated structured entities that it also manages at 31 December 2019 is £1,919 million (2018: £2,146 million) and the total funds under management relating to these investments at 31 December 2019 is £15,454 million (2018: £16,794 million).
(c) Other interests in unconsolidated structured entities The Group receives management fees and other fees in respect of its asset management businesses. The Group does not sponsor any of the funds or investment vehicles from which it receives fees. Management fees received for investments that the Group manages, but does not have a holding in, also represent an interest in unconsolidated structured entities. As these investments are not held by the Group, the investment risk is borne by the external investors and therefore the Group’s maximum exposure to loss relates to future management fees. The table below shows the assets under management of entities that the Group manages but does not have a holding in and the fees earned from those entities.
2019 2018
Assets Under Management
£m
Investment Management
Fees £m
Assets Under Management
£m
Investment Management
Fees £m
Investment funds1 6,885 32 7,473 38
Specialised investment vehicles: 3,108 10 3,541 6 Analysed as: OEICs 33 — 944 1 PLPs 3,075 10 2,597 5 Total 9,993 42 11,014 44 1 Investment funds relate primarily to the Group’s Polish pension funds.

Notes to the consolidated financial statements Continued
Aviva plc Annual report and accounts 2019 181
Strategic report Governance IFRS financial statements Other information
28 – Financial investments This note analyses our financial investments by type and shows their cost and fair value. These will change from one period to the next as a result of new business written, claims paid and market movements.
(a) Carrying amount Financial investments comprise:
2019 Restated1
2018
At fair value through
profit or loss At fair value through
profit or loss
Trading
£m
Other than trading
£m
Available for sale
£m Total
£m Trading
£m
Other than trading
£m
Available for sale
£m Total
£m
Fixed maturity securities2 Debt securities UK government — 27,044 — 27,044 — 29,203 — 29,203 UK local authorities — 202 — 202 — 191 — 191 Non-UK government (note 28(d)) — 60,569 1,133 61,702 — 55,168 1,287 56,455 Corporate bonds
Public utilities — 10,252 14 10,266 — 10,573 17 10,590 Other corporate — 77,999 308 78,307 — 74,110 291 74,401
Convertibles and bonds with warrants attached — 35 6 41 — 270 — 270 Other — 7,378 — 7,378 — 6,710 — 6,710 — 183,479 1,461 184,940 — 176,225 1,595 177,820 Certificates of deposit — 14,541 — 14,541 — 14,167 85 14,252
— 198,020 1,461 199,481 — 190,392 1,680 192,072
Equity securities Ordinary shares Public utilities — 2,883 — 2,883 — 2,369 — 2,369 Banks, trusts and insurance companies — 20,635 1 20,636 — 19,742 1 19,743 Industrial miscellaneous and all other — 76,082 14 76,096 — 66,129 — 66,129 — 99,600 15 99,615 — 88,240 1 88,241 Non-redeemable preference shares — 211 — 211 — 196 — 196
— 99,811 15 99,826 — 88,436 1 88,437
Other investments2 Unit trusts and other investment vehicles — 41,835 1 41,836 — 38,603 1 38,604 Derivative financial instruments (note 61) 7,097 — — 7,097 5,357 — — 5,357 Deposits with credit institutions — 169 — 169 — 155 — 155 Minority holdings in property management undertakings — 2,395 — 2,395 — 1,975 — 1,975 Other investments – long-term — 437 — 437 — 475 — 475 Other investments – short-term — — 1 1 — 1 — 1
7,097 44,836 2 51,935 5,357 41,209 1 46,567
Total financial investments 7,097 342,667 1,478 351,242 5,357 320,037 1,682 327,076 Less: Assets classified as held for sale
Fixed maturity securities — (649) — (649) — (397) — (397) Equity securities — (256) — (256) — (210) — (210) Other investments — (6,919) — (6,919) — (6,644) — (6,644)
— (7,824) — (7,824) — (7,251) — (7,251)
7,097 334,843 1,478 343,418 5,357 312,786 1,682 319,825 1 Following a review of the Group’s presentation of consolidated investment funds, comparative amounts have been restated from those previously reported. The review identified amounts presented within cash and cash
equivalents and other investments that are now presented as fixed maturity securities and equity securities in the table above. The restatement has had no impact on the profit for the year or equity. See note 1(a) for further information.
2 Following a review of the classification of financial assets, comparative amounts have been amended from those previously reported. The effect of this change is to reclassify £2,201 million of assets from fixed maturity securities to other investments.
Of the above total, £172,649 million (2018 restated: £154,746 million) is due to be recovered in more than one year after the statement of financial position date.
Other debt securities of £7,378 million (2018 restated: £6,710 million) include residential and commercial mortgage-backed securities, as well as other structured credit securities.

Notes to the consolidated financial statements Continued
Aviva plc Annual report and accounts 2019 182
Strategic report Governance IFRS financial statements Other information
28 – Financial investments continued (b) Cost, unrealised gains and fair value The following is a summary of the cost/amortised cost, gross unrealised gains and losses and fair value of financial investments:
2019 Restated1
2018
Cost/ amortised cost
£m
Unrealised gains
£m
Unrealised losses and
impairments £m
Fair value £m
Cost/ amortised cost
£m
Unrealised gains
£m
Unrealised losses and
impairments £m
Fair value £m
Fixed maturity securities2 186,753 20,040 (7,312) 199,481 184,934 15,733 (8,595) 192,072 Equity securities 87,436 16,835 (4,445) 99,826 87,007 9,339 (7,909) 88,437 Other investments2
Unit trusts and other investment vehicles 34,872 7,648 (684) 41,836 33,093 10,203 (4,692) 38,604 Derivative financial instruments 3,413 4,517 (833) 7,097 1,547 4,942 (1,132) 5,357 Deposits with credit institutions 169 — — 169 155 — — 155 Minority holdings in property management undertakings 2,226 259 (90) 2,395 1,784 241 (50) 1,975 Other investments – long-term 404 63 (30) 437 473 33 (31) 475 Other investments – short-term 1 — — 1 1 — — 1
315,274 49,362 (13,394) 351,242 308,994 40,491 (22,409) 327,076
These are further analysed as follows: At fair value through profit or loss 313,893 49,264 (13,393) 349,764 307,392 40,406 (22,404) 325,394 Available for sale 1,381 98 (1) 1,478 1,602 85 (5) 1,682
315,274 49,362 (13,394) 351,242 308,994 40,491 (22,409) 327,076 1 Following a review of the Group’s presentation of consolidated investment funds, comparative amounts have been restated from those previously reported. The review identified amounts presented within cash and cash
equivalents and other investments that are now presented as fixed maturity securities and equity securities in the table above. The restatement has had no impact on the profit for the year or equity. See note 1(a) for further information.
2 Following a review of the classification of financial assets, comparative amounts have been amended from those previously reported. The effect of this change is to reclassify £2,201 million of assets from fixed maturity securities to other investments.
All unrealised gains and losses and impairments on financial investments classified as fair value through profit or loss have been recognised in the income statement.
Unrealised gains and losses on financial investments classified as at fair value through profit or loss, recognised in the income statement in the year, were a net gain of £18,398 million (2018 restated: £29,885 million net loss). Of this net gain, £17,920 million net gain (2018 restated: £28,801 million net loss) related to investments designated as other than trading and £478 million net gain (2018 restated: £1,084 million net loss) related to financial investments designated as trading.
The movement in the unrealised gain/loss position reported in the statement of financial position during the year, shown in the table above, includes foreign exchange movements on the translation of unrealised gains and losses on financial investments held by foreign subsidiaries, which are recognised in other comprehensive income, as well as transfers due to the realisation of gains and losses on disposal and the recognition of impairment losses.
(c) Financial investment arrangements (i) Stock lending arrangements The Group has entered into stock lending arrangements in the UK and overseas in accordance with established market conventions. The majority of the Group’s stock lending transactions occur in the UK, where investments are lent to EEA-regulated, locally domiciled counterparties and governed by agreements written under English law.
The Group receives collateral in order to reduce the credit risk of these arrangements, either in the form of securities or cash. See note 62 for further discussion regarding collateral positions held by the Group.
(ii) Other arrangements In carrying on its bulk purchase annuity business, the Group’s UK Life operation is required to place certain investments in trust on behalf of the policyholders. Amounts become payable from the trust funds to the trustees if the Group were to be in breach of its payment obligations in respect of policyholder benefits. At 31 December 2019, £2,472 million (2018: £2,313 million) of financial investments were restricted in this way.
Certain financial investments are also required to be deposited under local laws in various overseas countries as security for the holders of policies issued in those countries. Other investments are pledged as security collateral for bank letters of credit.
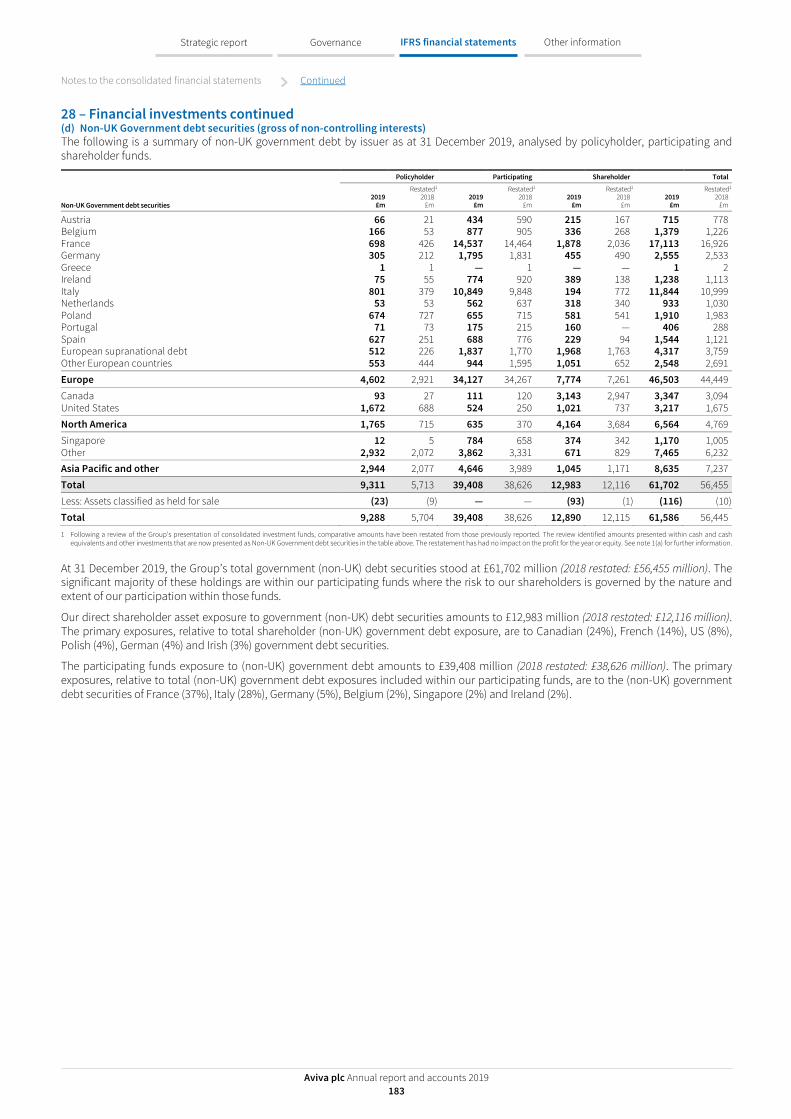
Notes to the consolidated financial statements Continued
Aviva plc Annual report and accounts 2019 183
Strategic report Governance IFRS financial statements Other information
28 – Financial investments continued (d) Non-UK Government debt securities (gross of non-controlling interests) The following is a summary of non-UK government debt by issuer as at 31 December 2019, analysed by policyholder, participating and shareholder funds.
Policyholder Participating Shareholder Total
Non-UK Government debt securities 2019
£m
Restated1 2018
£m 2019
£m
Restated1 2018
£m 2019
£m
Restated1 2018
£m 2019
£m
Restated1 2018
£m
Austria 66 21 434 590 215 167 715 778 Belgium 166 53 877 905 336 268 1,379 1,226 France 698 426 14,537 14,464 1,878 2,036 17,113 16,926 Germany 305 212 1,795 1,831 455 490 2,555 2,533 Greece 1 1 — 1 — — 1 2 Ireland 75 55 774 920 389 138 1,238 1,113 Italy 801 379 10,849 9,848 194 772 11,844 10,999 Netherlands 53 53 562 637 318 340 933 1,030 Poland 674 727 655 715 581 541 1,910 1,983 Portugal 71 73 175 215 160 — 406 288 Spain 627 251 688 776 229 94 1,544 1,121 European supranational debt 512 226 1,837 1,770 1,968 1,763 4,317 3,759 Other European countries 553 444 944 1,595 1,051 652 2,548 2,691
Europe 4,602 2,921 34,127 34,267 7,774 7,261 46,503 44,449
Canada 93 27 111 120 3,143 2,947 3,347 3,094 United States 1,672 688 524 250 1,021 737 3,217 1,675
North America 1,765 715 635 370 4,164 3,684 6,564 4,769
Singapore 12 5 784 658 374 342 1,170 1,005 Other 2,932 2,072 3,862 3,331 671 829 7,465 6,232 Asia Pacific and other 2,944 2,077 4,646 3,989 1,045 1,171 8,635 7,237
Total 9,311 5,713 39,408 38,626 12,983 12,116 61,702 56,455
Less: Assets classified as held for sale (23) (9) — — (93) (1) (116) (10)
Total 9,288 5,704 39,408 38,626 12,890 12,115 61,586 56,445 1 Following a review of the Group’s presentation of consolidated investment funds, comparative amounts have been restated from those previously reported. The review identified amounts presented within cash and cash
equivalents and other investments that are now presented as Non-UK Government debt securities in the table above. The restatement has had no impact on the profit for the year or equity. See note 1(a) for further information.
At 31 December 2019, the Group’s total government (non-UK) debt securities stood at £61,702 million (2018 restated: £56,455 million). The significant majority of these holdings are within our participating funds where the risk to our shareholders is governed by the nature and extent of our participation within those funds.
Our direct shareholder asset exposure to government (non-UK) debt securities amounts to £12,983 million (2018 restated: £12,116 million). The primary exposures, relative to total shareholder (non-UK) government debt exposure, are to Canadian (24%), French (14%), US (8%), Polish (4%), German (4%) and Irish (3%) government debt securities.
The participating funds exposure to (non-UK) government debt amounts to £39,408 million (2018 restated: £38,626 million). The primary exposures, relative to total (non-UK) government debt exposures included within our participating funds, are to the (non-UK) government debt securities of France (37%), Italy (28%), Germany (5%), Belgium (2%), Singapore (2%) and Ireland (2%).
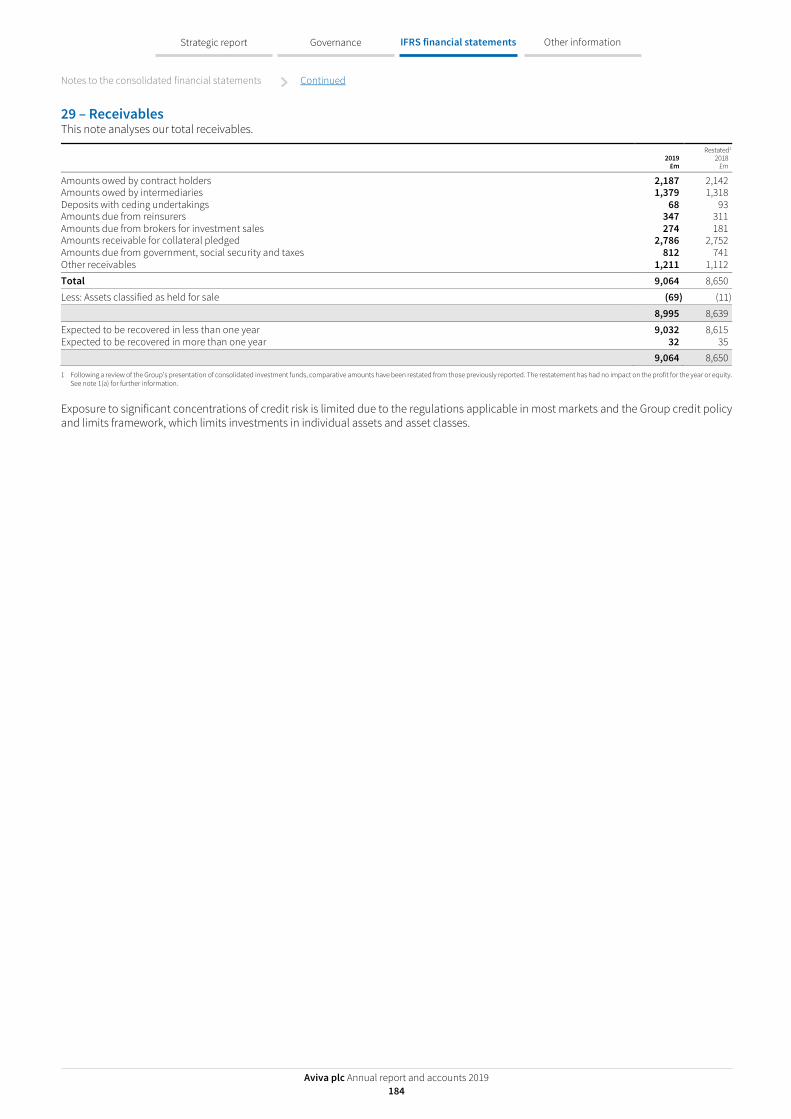
Notes to the consolidated financial statements Continued
Aviva plc Annual report and accounts 2019 184
Strategic report Governance IFRS financial statements Other information
29 – Receivables This note analyses our total receivables.
2019
£m
Restated1
2018 £m
Amounts owed by contract holders 2,187 2,142 Amounts owed by intermediaries 1,379 1,318 Deposits with ceding undertakings 68 93 Amounts due from reinsurers 347 311 Amounts due from brokers for investment sales 274 181 Amounts receivable for collateral pledged 2,786 2,752 Amounts due from government, social security and taxes 812 741 Other receivables 1,211 1,112
Total 9,064 8,650
Less: Assets classified as held for sale (69) (11)
8,995 8,639
Expected to be recovered in less than one year 9,032 8,615 Expected to be recovered in more than one year 32 35 9,064 8,650 1 Following a review of the Group’s presentation of consolidated investment funds, comparative amounts have been restated from those previously reported. The restatement has had no impact on the profit for the year or equity.
See note 1(a) for further information.
Exposure to significant concentrations of credit risk is limited due to the regulations applicable in most markets and the Group credit policy and limits framework, which limits investments in individual assets and asset classes.

Notes to the consolidated financial statements Continued
Aviva plc Annual report and accounts 2019 185
Strategic report Governance IFRS financial statements Other information
30 – Deferred acquisition costs (a) Deferred acquisition costs – carrying amount The carrying amount of deferred acquisition costs was as follows:
2019
£m 2018
£m
Deferred acquisition costs in respect of: Insurance contracts – Long-term business 993 931 Insurance contracts – General insurance and health business 1,141 1,088 Participating investment contracts – Long-term business 116 101 Non-participating investment contracts – Long-term business 1,108 1,036
Total 3,358 3,156
Less: Classified as held for sale (202) (191)
3,156 2,965
Deferred acquisition costs (DAC) on long-term business are generally recoverable in more than one year whereas such costs on general insurance and health business are generally recoverable within one year. Of the above total, £1,751 million (2018: £1,879 million) is expected to be recovered in more than one year after the statement of financial position date. For long-term business where amortisation of the DAC balance depends on projected profits, the amount expected to be recovered is estimated and actual experience will differ.
(b) Deferred acquisition costs – movements in the year The movements in deferred acquisition costs during the year were:
Long-term business
2019
Insurance contracts
£m
Participating investment
contracts £m
Non-participating
investment contracts
£m
General insurance and
health business
£m
Retail fund management
business £m
Total £m
Carrying amount at 1 January 931 101 1,036 1,088 — 3,156 Acquisition costs deferred during the year 248 13 174 2,543 — 2,978 Amortisation (149) 2 (90) (2,482) — (2,719) Impact of assumption changes (16) 4 — — — (12) Effect of portfolio transfers, acquisitions and disposals — — — — — — Foreign exchange rate movements (20) (4) (9) (8) — (41) Other movements (1) — (3) — — (4) Carrying amount at 31 December 993 116 1,108 1,141 — 3,358 Less: Classified as held for sale — — (202) — — (202) 993 116 906 1,141 — 3,156
Long-term business
2018
Insurance contracts
£m
Participating investment
contracts £m
Non-participating
investment contracts
£m
General insurance and
health business £m
Retail fund management
business £m
Total £m
Carrying amount at 1 January 858 33 1,071 1,110 2 3,074 Acquisition costs deferred during the year 265 13 87 2,279 — 2,644 Amortisation (141) (9) (140) (2,282) (2) (2,574) Impact of assumption changes 14 1 16 — — 31 Effect of portfolio transfers, acquisitions and disposals (5) — — (10) — (15) Foreign exchange rate movements 2 1 2 (9) — (4) Other movements1 (62) 62 — — — — Carrying amount at 31 December 931 101 1,036 1,088 — 3,156
Less: Classified as held for sale — — (191) — — (191)
931 101 845 1,088 — 2,965
1 Following the adoption of IFRS 15, the categorisation of DAC balances was analysed resulting in a transfer of £62 million from insurance contracts to participating investment contracts.
DAC for long-term business increased over 2019 mainly due to new business sales across the UK and European markets. DAC for general insurance and health business increased over 2019 mainly due to business growth in the UK and Canada.
Where amortisation of the DAC balance depends on projected profits, changes to economic conditions may lead to a movement in the DAC balance and a corresponding impact on profit. It is estimated that the movement in the DAC balance would reduce profit by £29 million (2018: £40 million) if market yields on fixed income investments were to increase by 1% and increase profit by £36 million (2018: £39 million) if yields were to reduce by 1%.
At both 31 December 2019 and 31 December 2018 the DAC balance has been restricted by the value of projected future profits.

Notes to the consolidated financial statements Continued
Aviva plc Annual report and accounts 2019 186
Strategic report Governance IFRS financial statements Other information
31 – Pension surpluses, other assets, prepayments and accrued income (a) Pension surpluses and other assets – carrying amount The carrying amount comprises:
2019
£m 2018
£m
Surpluses in the staff pension schemes (note 52(a)) 2,746 3,256 Other assets 53 85 Total 2,799 3,341
Surpluses in the staff pension schemes and £1 million (2018: £1 million) of other assets are recoverable more than one year after the statement of financial position date.
(b) Prepayments and accrued income Prepayments and accrued income of £3,151 million (2018 restated: £3,153 million) include assets classified as held for sale of £8 million (2018: £4 million) and £30 million (2018: £9 million) that is expected to be recovered more than one year after the statement of financial position date.
32 – Assets held to cover linked liabilities The assets which back unit-linked liabilities are included within the relevant balances in the statement of financial position, while the liabilities are included within insurance and investment contract provisions. This note analyses the carrying values of assets backing these liabilities.
2019
£m
Restated1
2018 £m
Loans 2,111 2,008 Fixed maturity securities2 42,350 37,181 Equity securities 83,035 73,229 Reinsurance assets 4,003 4,099 Cash and cash equivalents 8,353 7,571 Units trusts and other investment vehicles2 37,822 32,392 Other 8,508 8,378
Total 186,182 164,858
Less: Assets classified as held for sale (8,170) (7,784)
178,012 157,074 1 Following a review of the Group’s presentation of consolidated investment funds, comparative amounts have been restated from those previously reported. The review identified amounts presented within cash and cash
equivalents and other investments that are now presented as loans, fixed maturity securities and equity securities in the table above. The restatement has had no impact on the profit for the year or equity. See note 1(a) for further information.
2 Following a review of the classification of financial assets, comparative amounts have been amended from those previously reported. The effect of this change is to reclassify £1,444 million of assets from other investments to fixed maturity securities.
The reinsurance assets balance in the table above includes £4,006 million (2018: £4,009 million) of non-participating investment contracts, which are legally reinsurance but do not meet the definition of a reinsurance contract under IFRS. These assets are financial instruments measured at fair value through profit and loss and are classified as Level 1 assets.

Notes to the consolidated financial statements Continued
Aviva plc Annual report and accounts 2019 187
Strategic report Governance IFRS financial statements Other information
33 – Ordinary share capital This note gives details of Aviva plc’s ordinary share capital and shows the movements during the year.
(a) Details of the Company’s ordinary share capital are as follows:
2019
£m 2018
£m
The allotted, called up and fully paid share capital of the Company at 31 December 2019 was: 3,921,129,145 (2018: 3,902,352,211) ordinary shares of 25 pence each 980 975
At the 2019 Annual General Meeting, the Company was authorised to allot up to a further maximum nominal amount of: • £652,537,894 of which £326,268,947 can be in connection with an offer by way of a rights issue • £100 million of new ordinary shares in relation to any issue of Solvency II compliant capital instruments
(b) During 2019, a total of 18,776,934 were allotted and issued by the Company as follows:
2019 2018
Number of shares
Share capital
£m
Capital redemption
reserve £m
Share premium
£m Number of shares
Share capital
£m
Capital redemption
reserve £m
Share premium
£m
At 1 January 3,902,352,211 975 44 1,214 4,012,682,691 1,003 14 1,207 Shares issued under the Group’s Employee and
Executive Share Option Schemes 18,776,934 5 — 25 9,160,708 2 — 7 Shares cancelled through buy-back — — — — (119,491,188) (30) 30 —
At 31 December 3,921,129,145 980 44 1,239 3,902,352,211 975 44 1,214
Ordinary shares in issue in the Company rank pari passu with any new ordinary shares issued in the Company. All the ordinary shares in issue carry the same right to receive all dividends and other distributions declared, made or paid by the Company.
On 18 September 2018, the Company announced that it had successfully completed the share buy-back programme (the 2018 programme) which was notified to the market on 1 May 2018. As a result of the 2018 programme, Aviva acquired 119,491,188 shares at an average price of £5.0213 per share. These shares with a nominal value of £30 million were bought back and subsequently cancelled during the year, giving rise to a capital redemption reserve of an equivalent amount as required by the Companies Act 2006. The aggregate consideration paid was £600 million which is reflected in retained earnings (see note 40).

Notes to the consolidated financial statements Continued
Aviva plc Annual report and accounts 2019 188
Strategic report Governance IFRS financial statements Other information
34 – Group’s share plans This note describes various equity compensation plans operated by the Group, and shows how the Group values the options and awards of shares in the Company.
(a) Description of the plans The Group maintains a number of active share option and award plans and schemes (the Group’s share plans). These are as follows:
(i) Savings-related options These are options granted under the tax-advantaged Save As You Earn (SAYE) share option scheme in the UK and Irish revenue-approved SAYE share option scheme in Ireland. The SAYE allows eligible employees to acquire options over the Company’s shares at a discount of up to 20% of their market value at the date of grant.
Options are normally exercisable during the six month period following either the third or fifth anniversary of the start of the relevant savings contract. Seven year contracts were offered prior to 2012. Savings contracts are subject to the statutory savings limits of £500 per month in the UK and €500 per month in Ireland. A limit of £250 per month was applied to contracts in the UK prior to 2016.
(ii) Aviva long-term incentive plan awards These awards have been made under the Aviva Long-Term Incentive Plan 2011 (LTIP), and are described in section (b) below and in the directors’ remuneration report.
(iii) Aviva annual bonus plan awards These awards have been made under the Aviva Annual Bonus Plan 2011 (ABP), and are described in section (b) below and in the directors’ remuneration report.
(iv) Aviva recruitment and retention share plan awards These are conditional awards granted under the Aviva Recruitment and Retention Share Award plan (RRSAP) in relation to the recruitment or retention of senior managers excluding executive directors. The awards vest in tranches on various dates and vesting is conditional upon the participant being employed by the Group on the vesting date and not having served notice of resignation. Some awards can be subject to performance conditions. If a participant’s employment is terminated due to resignation or dismissal, any tranche of the award which has vested within the 12 months prior to the termination date will be subject to clawback and any unvested tranches of the award will lapse in full.
(v) Aviva Investors deferred share award plan awards These awards have been made under the Aviva Investors Deferred Share Award Plan (AI DSAP), where employees can choose to have the deferred element of their bonus deferred into awards over Aviva shares. The awards vest in three equal tranches on the second, third and fourth year following the year of grant.
(vi) Aviva Investors long-term incentive plan awards These awards have been made under the Aviva Investors Long-Term Incentive Plan 2015 (AI LTIP)
(vii) Various all employee share plans The Company maintains a number of active stock option and share award voluntary schemes: a) The global matching share plan b) Aviva Group employee share ownership scheme c) Aviva France employee profit sharing scheme.
No new Aviva plc ordinary shares will be issued to satisfy awards made under plans iv, v, vi, vii b) or vii c).
(b) Outstanding options The following table summarises information about options outstanding at 31 December 2019:
Range of exercise prices
Outstanding options
Number
Weighted average remaining
contractual life Years
Weighted average exercise price
p
£2.66 – £3.16 26,589,056 3 284.00 £3.17 – £3.67 5,066,836 1 351.00 £3.68 – £4.19 7,634,402 1 395.52
The comparative figures as at 31 December 2018 were:
Range of exercise prices
Outstanding options
Number
Weighted average remaining
contractual life Years
Weighted average exercise price
p
£2.66 – £3.16 420,791 1 296.80 £3.17 – £3.67 10,944,996 2 351.00 £3.68 – £4.19 17,292,239 2 392.43

Notes to the consolidated financial statements Continued
Aviva plc Annual report and accounts 2019 189
Strategic report Governance IFRS financial statements Other information
34 – Group’s share plans continued (c) Movements in the year A summary of the status of the option and share plans as at 31 December 2018 and 2019, and changes during the years ended on those dates, is shown below.
2019 2018
Number of options
Weighted average exercise price
p Number of awards Number of options
Weighted average exercise price
p Number of awards
Outstanding at 1 January 28,658,026 375.13 40,574,481 25,096,578 370.81 39,524,150 Granted during the year 26,798,392 284.00 17,713,898 8,139,367 387.00 16,213,056 Exercised/ released during the year (7,340,420) 359.44 (12,308,712) (2,111,514) 361.96 (7,653,460) Forfeited during the year (8,112,308) 382.94 (10,557,632) (1,855,638) 385.00 (7,509,266) Cancelled during the year (240,979) 372.02 — (495,646) 364.93 — Expired during the year (472,417) 379.66 — (115,121) 381.97 —
Outstanding at 31 December 39,290,294 314.31 35,442,035 28,658,026 375.20 40,574,481
Exercisable at 31 December 7,100,956 370.06 — 3,457,732 369.88 —
(d) Expense charged to the income statement The total expense recognised for the year arising from equity compensation plans was as follows:
2019
£m 2018
£m
Equity-settled expense 62 64
Total (note 11(b)) 62 64
(e) Fair value of options and awards granted after 7 November 2002 The weighted average fair values of options and awards granted during the year, estimated by using the Binomial option pricing model and Monte Carlo Simulation model, were £0.50 and £3.86 (2018: £0.78 and £4.84) respectively.
(i) Share options The fair value of the options was estimated on the date of grant, based on the following weighted average assumptions:
Weighted average assumption 2019 2018
Share price 394p 480p Exercise price 284p 387p Expected volatility 20.22% 24.85% Expected life 3.80 years 3.67 years Expected dividend yield 7.68% 5.88% Risk-free interest rate 0.23% 1.05%
The expected volatility used was based on the historical volatility of the share price over a period equivalent to the expected life of the option prior to its date of grant. The risk-free interest rate was based on the yields available on UK government bonds as at the date of grant. The bonds chosen were those with a similar remaining term to the expected life of the options. 7,340,420 options granted after 7 November 2002 were exercised during the year (2018: 2,111,514).
(ii) Share awards The fair value of the awards was estimated on the date of grant based on the following weighted average assumptions:
Weighted average assumption 2019 2018
Share price 405p 500p Expected volatility1 23% 25% Expected volatility of comparator companies’ share price1 23% 25% Correlation between Aviva and comparator competitors’ share price1 53% 64% Expected life1 2.77 years 2.64 years Expected dividend yield 0.00% 0.00% Risk-free interest rate1 0.63% 0.80% 1 For awards with market-based performance conditions only.
The expected volatility used was based on the historical volatility of the share price over a period equivalent to the expected life of the share award prior to its date of grant. The risk-free interest rate was based on the yields available on UK government bonds as at the date of grant. The bonds chosen were those with a similar remaining term to the expected life of the share awards.

Notes to the consolidated financial statements Continued
Aviva plc Annual report and accounts 2019 190
Strategic report Governance IFRS financial statements Other information
35 – Treasury shares The following table summarises information about treasury shares at 31 December 2019:
2019 2018
Number £m Number £m
Shares held by employee trusts 1,714,288 7 455,986 2 Shares held by subsidiary companies — — 2,435,983 13 1,714,288 7 2,891,969 15
(a) Shares held by employee trusts Prior to 2014, we satisfied awards and options granted under the Group’s share plans primarily through shares purchased in the market and held by employee share trusts. From 2014 we primarily issue new shares except where it is necessary to use shares held by an employee share trust. This note gives details of the shares held in these trusts. Movements in the carrying value of shares held by employee trusts comprise:
2019 2018
Number £m Number £m
Cost debited to ‘shareholders’ funds At 1 January 455,986 2 295,906 1 Acquired in the year 2,165,032 9 765,582 4 Distributed in the year (906,730) (4) (605,502) (3)
Balance at 31 December 1,714,288 7 455,986 2
The shares are owned by employee share trusts with an undertaking to satisfy awards of shares in the Company under the Company’s share plans and schemes. Details of the features of the plans can be found in the directors’ remuneration report and/or in note 34.
These shares were either purchased in the market or, in 2015, new shares were issued to the trust and are carried at weighted average cost. At 31 December 2019, they had an aggregate nominal value of £428,572 (2018: £113,997) and a market value of £7,177,724 (2018: £1,712,227). The trustees have waived their rights to dividends on the shares held in the trusts.
(b) Shares held by subsidiary companies At 31 December 2019, the balance of shares held by subsidiary companies of nil (2018: 2,435,983 shares) had an aggregate nominal value of £nil (2018: £608,996) and a market value of £nil (2018: £9,148,336).
36 – Preference share capital This note gives details of Aviva plc’s preference share capital.
The preference share capital of the Company at 31 December was:
2019
£m 2018
£m
Issued and paid up 100,000,000 8.375% cumulative irredeemable preference shares of £1 each 100 100 100,000,000 8.75% cumulative irredeemable preference shares of £1 each 100 100
200 200
The issued preference shares are non-voting except where their dividends are in arrears, on a winding up or where their rights are altered.
On a winding up, they carry a preferential right of return of capital ahead of the ordinary shares. Holders are entitled to receive dividends out of the profits available for distribution and resolved to be distributed in priority to the payment of dividends to holders of ordinary shares. The Company does not have a contractual obligation to deliver cash or other financial assets to the preference shareholders and therefore the directors may make dividend payments at their discretion.
At the end of 2019, the fair value of Aviva plc’s preference share capital was £299 million (2018: £264 million).
Following our statement at the full year 2017 results that we “have the ability to cancel our preference shares”, Aviva listened to the views of investors, who expressed concerns, and as a result Aviva subsequently announced on 23 March 2018 that it had decided to take “no action to cancel its preference shares”. Under current regulation the preference shares will no longer count as regulatory capital in 2026. Aviva will work towards obtaining regulatory approval for the preference shares, or a suitable substitute, to qualify as capital from 2026 onwards. If as we approach 2026 Aviva needs to reconsider this position, it will do so after taking into account the fair market value of the preference shares at that time.
On 30 April 2018 Aviva announced a charge of £14 million relating to a provision for the goodwill payment scheme to those preference shareholders who sold preference shares in the period from 8 and 22 March (inclusive) at a share price that was lower than the price that the preference shares returned to following the announcement on 23 March 2018. The total cost of the goodwill payment scheme was £10 million relating to the goodwill payments to preference shareholders, and associated administration costs, against our initial estimate of £14 million. The nature of these costs and the restricted time-period that defines eligibility to receive a payment demonstrates that they were non-recurrent and were not reflective of the Group’s ongoing financial performance.
At the 2015 Annual General Meeting, the Company was authorised to allot sterling new preference shares, as defined in the Company’s articles of association, up to a maximum nominal value of £500 million.

Notes to the consolidated financial statements Continued
Aviva plc Annual report and accounts 2019 191
Strategic report Governance IFRS financial statements Other information
37 – Direct capital instrument and tier 1 notes
Notional amount 2019
£m 2018
£m
5.9021% £500 million direct capital instrument – Issued November 2004 500 500 6.875% £210 million STICS – Issued November 2003 — 231
Total 500 731
The direct capital instrument (the DCI) was issued on 25 November 2004. The DCI has no fixed redemption date but the Company may, at its sole option, redeem all (but not part) of the principal amount on 27 July 2020, at which date the interest rate changes to a variable rate, or on any respective coupon payment date thereafter. The variable rate will be the six month sterling deposit rate plus margin.
The Step-up Tier one Insurance Capital Securities (‘STICS’) were issued on 21 November 2003 by Friends Life Holdings plc, substituted as issuer by Aviva plc on 1 October 2015. These had no fixed redemption date, however, on 17 October 2019 notification was given that the Group would redeem the tier one notes at the first call date on 21 November 2019. On the notification date the instruments were reclassified as a financial liability of £210 million, representing the fair value and redemption cost at that date. The resulting difference of £21 million between the carrying amount of £231 million and fair value of £210 million has been charged to retained earnings. The instruments were cancelled on 25 November 2019.
The Company has the option to defer coupon payments on the DCI on any relevant payment date. Deferred coupons shall only be satisfied should the Company exercise its sole option to redeem the instruments.
No interest will accrue on any deferred coupon on the DCI. Deferred coupons on the DCI will be satisfied by the issue and sale of ordinary shares in the Company at their prevailing market value, to a sum as near as practicable to (and at least equal to) the relevant deferred coupons. In the event of any coupon deferral, the Company will not declare or pay any dividend on its ordinary or preference share capital. These instruments have been treated as equity. Please refer to accounting policy AE.
At the end of 2019 the fair value of the DCI was £514 million (2018 DCI: £506 million, STICS: £216 million).

Notes to the consolidated financial statements Continued
Aviva plc Annual report and accounts 2019 192
Strategic report Governance IFRS financial statements Other information
38 – Merger reserve Prior to 1 January 2004, certain significant business combinations were accounted for using the ‘pooling of interests method’ (or merger accounting), which treats the merged groups as if they had been combined throughout the current and comparative accounting periods. Merger accounting principles for these combinations gave rise to a merger reserve in the consolidated statement of financial position, being the difference between the nominal value of new shares issued by the Parent Company for the acquisition of the shares of the subsidiary and the subsidiary’s own share capital and share premium account.
The merger reserve is also used where more than 90% of the shares in a subsidiary are acquired and the consideration includes the issue of new shares by the Company, thereby attracting merger relief under the Companies Act 1985 and, from 1 October 2009, the Companies Act 2006.
The balance of the merger reserve at 31 December 2019 is £8,974 million (2018: £8,974 million).
39 – Currency translation and other reserves This note gives details of the currency translation and other reserves forming part of the Group’s consolidated equity and shows the movements during the year net of non-controlling interests:
Other reserves
Currency translation
reserve (see accounting
policy E) £m
Owner occupied
properties reserve (see accounting
policy P) £m
Investment valuation
reserve (see accounting
policy T) £m
Hedging instruments reserve (see accounting
policy U) £m
Equity compensation
reserve (see accounting
policy AB) £m
Total £m
Balance at 1 January 2018 1,141 26 65 (476) 111 (274) Arising in the year through other comprehensive income: Fair value gains — 1 57 — — 58 Fair value gains transferred to profit on disposals — — (78) — — (78) Share of other comprehensive income of joint ventures and associates — — (10) — — (10) Foreign exchange rate movements1 27 — — (27) — (27) Aggregate tax effect – shareholders’ tax 1 — 7 — — 7
Total other comprehensive income for the year 28 1 (24) (27) — (50) Fair value gains transferred to retained earnings on disposals — — — — — — Transfer to profit on disposal of subsidiaries, joint ventures and associates (40) — (1) 37 — 36 Changes in non-controlling interests in subsidiaries (7) — — — — — Reserves credit for equity compensation plans — — — — 64 64 Shares issued under equity compensation plans — — — — (55) (55) Balance at 31 December 2018 1,122 27 40 (466) 120 (279) Arising in the year through other comprehensive income: Fair value gains — 3 39 — — 42 Fair value gains transferred to profit on disposals — — (19) — — (19) Share of other comprehensive income of joint ventures and associates — — 22 — — 22 Foreign exchange rate movements1 (318) — — 138 — 138 Aggregate tax effect – shareholders’ tax 10 (1) (4) — — (5) Total other comprehensive income for the year (308) 2 38 138 — 178 Fair value gains transferred to retained earnings on disposals — — — — — — Transfer to profit on disposal of subsidiaries, joint ventures and associates — — — — — — Transfers to non-controlling interests — — — — — — Changes in non-controlling interests in subsidiaries — — — — — — Reserves credit for equity compensation plans — — — — 62 62 Shares issued under equity compensation plans — — — — (62) (62) Balance at 31 December 2019 814 29 78 (328) 120 (101) 1 Foreign exchange rate movements recorded in the consolidated statement of comprehensive income of £(219) million (2018: £5 million) relate to the currency translation reserve of £(318) million (2018: £27 million), the hedging
instrument reserve of £138 million (2018: £(27) million) and non-controlling interests (see note 41) of £(39) million (2018: £5 million).

Notes to the consolidated financial statements Continued
Aviva plc Annual report and accounts 2019 193
Strategic report Governance IFRS financial statements Other information
40 – Retained earnings This note analyses the movements in the consolidated retained earnings during the year.
2019
£m 2018
£m
Balance at 1 January 4,523 4,918 Adjustment at 1 January for adoption of IFRS 16 (110) —
Balance at 1 January restated 4,413 4,918 Profit for the year attributable to equity shareholders 2,548 1,568 Remeasurements of pension schemes1 (note 52) (867) (279) Dividends and appropriations (note 16) (1,244) (1,189) Shares purchased in buy-back (note 33) — (600) Net shares issued under equity compensation plans 55 49 Effect of changes in non-controlling interests in existing subsidiaries — 1 Forfeited dividend income2 4 4 Change in equity accounted option 22 — Reclassification of tier 1 notes to financial liabilities3 (note 37) 21 — Aggregate tax effect 113 51
Balance at 31 December 5,065 4,523 1 Net remeasurements of pension schemes recorded in the consolidated statement of comprehensive income of £867 million loss (2018: £279 million loss) includes £867 million of remeasurement losses (2018: £280 million losses)
on the main pension schemes (see note 52) with a small amount of gains in relation to other schemes. 2 The Group has commenced a shareholder forfeiture programme, where the shares of shareholders with whom Aviva has lost contact over the last 12 years will be forfeited and sold on. Any associated unclaimed dividends will
be reclaimed by the Group. After covering administration costs, the majority of the money will be put into a charitable foundation. 3 On 17 October 2019, notification was given that the Group would redeem the 6.875% £210 million tier 1 notes. At that date, the instrument was reclassified as a financial liability of £210 million, representing its fair value at that
date. On 21 November 2019 the instrument was redeemed in full at a cost of £210 million. The difference of £21 million between its carrying amount of £231 million and fair value of £210 million has been charged to retained earnings. See note 37 for further details.
The Group’s regulated subsidiaries are required to hold sufficient capital to meet acceptable solvency levels based on applicable local regulations. Their ability to transfer retained earnings to the UK parent companies is therefore restricted to the extent these earnings form part of local regulatory capital.
41 – Non-controlling interests This note gives details of the Group’s non-controlling interests and shows the movements during the year.
Non-controlling interests at 31 December comprised:
2019
£m 2018
£m
Equity shares in subsidiaries 273 288 Share of earnings 441 415 Share of other reserves 13 13
727 716
Preference shares in General Accident plc 250 250
977 966
Movements in the year comprised:
2019
£m 2018
£m
Balance at 1 January 966 1,235 Profit for the year attributable to non-controlling interests 115 119 Foreign exchange rate movements (39) 5 Total comprehensive income attributable to non-controlling interests 76 124 Capital contributions from non-controlling interests — 3 Non-controlling interests’ share of dividends declared in the year (63) (90) Changes in non-controlling interests in subsidiaries1 (2) (306)
Balance at 31 December 977 966 1 Changes in non-controlling interests in 2018 primarily relate to the sale of the Group’s shareholdings in Avipop (Italy), the sale of the life insurance and pension joint ventures Caja Murcia Vida and Caja Granada Vida (Spain) and
the change in control status of Hong Kong.
The Group has no subsidiaries whose non-controlling interest is material on the basis of their share of profit or loss.
42 – Contract liabilities and associated reinsurance The Group’s liabilities for insurance and investment contracts it has sold, and the associated reinsurance, is covered in the following notes: • Note 43 covers insurance liabilities; • Note 44 covers the methodology and assumptions used in calculating the insurance liabilities; • Note 45 covers liabilities for investment contracts; • Note 46 details the financial guarantees and options on certain contracts; • Note 47 details the associated reinsurance assets on these liabilities; and • Note 48 shows the effects of changes in the assumptions on the liabilities.

Notes to the consolidated financial statements Continued
Aviva plc Annual report and accounts 2019 194
Strategic report Governance IFRS financial statements Other information
42 – Contract liabilities and associated reinsurance continued (a) Carrying amount The following is a summary of the contract liabilities and related reinsurance assets as at 31 December.
2019
£m 2018
£m
Gross provisions
£m
Reinsurance assets
£m Net £m
Gross provisions
£m
Reinsurance assets
£m Net £m
Long-term business Insurance liabilities (131,182) 6,369 (124,813) (125,829) 5,836 (119,993) Liabilities for participating investment contracts (92,762) 1 (92,761) (90,455) 1 (90,454) Liabilities for non-participating investment contracts (137,689) 4,006 (133,683) (120,354) 4,009 (116,345)
(361,633) 10,376 (351,257) (336,638) 9,846 (326,792) Outstanding claims provisions (2,187) 93 (2,094) (2,001) 89 (1,912) (363,820) 10,469 (353,351) (338,639) 9,935 (328,704)
General insurance and health Outstanding claims provisions (8,831) 683 (8,148) (9,046) 789 (8,257) Provisions for claims incurred but not reported (2,672) 1,004 (1,668) (2,360) 822 (1,538) (11,503) 1,687 (9,816) (11,406) 1,611 (9,795) Provision for unearned premiums (5,138) 275 (4,863) (4,946) 254 (4,692) Provision arising from liability adequacy tests1 (15) — (15) (16) — (16)
(16,656) 1,962 (14,694) (16,368) 1,865 (14,503)
Total (380,476) 12,431 (368,045) (355,007) 11,800 (343,207)
Less: Liabilities classified as held for sale 9,011 (75) 8,936 8,462 (45) 8,417
(371,465) 12,356 (359,109) (346,545) 11,755 (334,790) 1 Provision arising from liability adequacy tests relates to general insurance business only. Liability adequacy test provisions for life operations, where applicable, are included in other line items. At 31 December 2019 this provision
is £nil (2018: £nil) for the life operations.
(b) Change in contract liabilities, net of reinsurance, recognised as an expense The purpose of the following table is to reconcile the change in insurance liabilities, net of reinsurance, shown on the income statement (note 7), to the change in insurance liabilities recognised as an expense in the relevant movement tables in the following notes. The components of the reconciliation are the change in provision for outstanding claims on long-term business (which is not included in a separate movement table), and the unwind of discounting on general insurance reserves (which is included within finance costs in the income statement). For general insurance and health, the change in the provision for unearned premiums is not included in the reconciliation as, within the income statement, this is included within earned premiums.
2019 Gross
£m Reinsurance
£m Net £m
Long-term business Change in insurance liabilities (note 43(b)(iii)) 6,600 (1,030) 5,570 Change in provision for outstanding claims 4 (8) (4) 6,604 (1,038) 5,566 General insurance and health Change in insurance liabilities (note 43(c)(iv) and 47(c)(ii))1 234 (94) 140 Less: Unwind of discount (14) 10 (4) 220 (84) 136 Total change in insurance liabilities (note 7) 6,824 (1,122) 5,702 1 Includes £45 million in the UK General Insurance and Health business relating to a change in the discount rate used for estimating lump sum payments of bodily injury claims from 0.00% to -0.25%.
2018 Gross
£m Reinsurance
£m Net £m
Long-term business Change in insurance liabilities(note 43(b)(iii)) (6,284) 61 (6,223) Change in provision for outstanding claims 190 (11) 179
(6,094) 50 (6,044)
General insurance and health Change in insurance liabilities (note 43(c)(iv) and 47(c)(ii))1 (313) 111 (202) Less: Unwind of discount (8) 8 —
(321) 119 (202)
Total change in insurance liabilities (note 7) (6,415) 169 (6,246) 1 Includes £(190) million in the UK General Insurance and Health business relating to a change in the discount rate used for estimating lump sum payments of bodily injury claims from -0.75% to 0.00%.
For non-participating investment contracts, deposits collected and amounts withdrawn are not shown on the income statement, but are accounted for directly through the statement of financial position as an adjustment to the gross liabilities for investment contracts. The associated change in investment contract provisions shown on the income statement consists of the attributed investment return. For participating investment contracts, the change in investment contract provisions on the income statement primarily consists of the movement in participating investment contract liabilities (net of reinsurance) over the reporting period.

Notes to the consolidated financial statements Continued
Aviva plc Annual report and accounts 2019 195
Strategic report Governance IFRS financial statements Other information
43 – Insurance liabilities This note analyses the Group’s gross insurance contract liabilities for the long-term and general insurance and health business, describes how the Group calculates these liabilities and presents the movement in these liabilities during the year.
(a) Carrying amount Insurance liabilities (gross of reinsurance) at 31 December comprised:
2019
£m
Restated1 2018
£m
Long-term business Participating insurance liabilities1 47,344 46,768 Unit-linked non-participating insurance liabilities 14,707 14,480 Other non-participating insurance liabilities1 69,131 64,581 131,182 125,829 Outstanding claims provisions 2,187 2,001
133,369 127,830
General insurance and health Outstanding claims provisions 8,831 9,046 Provision for claims incurred but not reported 2,672 2,360
11,503 11,406 Provision for unearned premiums 5,138 4,946 Provision arising from liability adequacy tests2 15 16
16,656 16,368
Total 150,025 144,198
Less: Liabilities classified as held for sale (687) (121)
149,338 144,077 1 Comparative amounts at full year 2018 have been revised. In the UK, £5,928 million has been reclassified from other non-participating insurance liabilities to participating insurance liabilities. 2 Provision arising from liability adequacy tests relates to general insurance business only. Liability adequacy test provisions for life operations, where applicable, are included in other line items. At 31 December 2019 this provision
is £nil (2018: £nil) for the life operations.
(b) Long-term business liabilities (i) Business description The Group underwrites long-term business in a number of countries as follows: • In the UK, long-term business is mainly written in the ‘Non-Profit’ fund and in a number of ‘With-Profits’ sub-funds. In the ‘Non-Profit’ fund
shareholders are entitled to 100% of the distributed profits. In the ‘With-Profits’ sub-funds the with-profits policyholders are entitled to between 40% and 100% of distributed profits, depending on the fund rules. There is also the Reattributed Inherited Estate External Support Account (RIEESA), which does not itself underwrite any business, but provides capital support to one of the with-profits sub-funds and receives any surplus or deficit emerging from it. In the RIEESA, shareholders are entitled to 100% of the distributed profits, but these cannot be distributed until the ‘lock-in’ criteria set by the Reattribution Scheme have been met;
• In France, the majority of policyholders’ benefits are determined by investment performance, subject to certain guarantees, and shareholders’ profits are derived largely from management fees. In addition, a substantial number of policies participate in investment returns, with the balance being attributable to shareholders; and
• In other operations in Europe and Asia, a range of long-term insurance and savings products are written.
(ii) Group practice The long-term business liabilities are calculated separately for each of the Group’s life operations. The provisions for overseas subsidiaries have generally been included on the basis of local regulatory requirements, modified where necessary to reflect the requirements of the Companies Act 2006.
Material judgement is required in calculating the liabilities and is exercised particularly through the choice of assumptions where discretion is permitted. In turn, the assumptions used depend on the circumstances prevailing in each of the life operations. Provisions are most sensitive to assumptions regarding discount rates, mortality and morbidity rates. Where discount rate assumptions are based on current market yields on fixed interest securities, allowance is made for default risk implicit in the yields on the underlying assets.
Bonuses paid during the year are reflected in claims paid, whereas those allocated as part of the bonus declaration are included in the movements in the long-term business liabilities.
A description of the main methodology and most material valuation assumptions has been provided (see note 44).

Notes to the consolidated financial statements Continued
Aviva plc Annual report and accounts 2019 196
Strategic report Governance IFRS financial statements Other information
43 – Insurance liabilities continued (iii) Movements in long-term business liabilities The following movements have occurred in the gross long-term business liabilities during the year:
2019
£m 2018
£m
Carrying amount at 1 January 125,829 130,972 Liabilities in respect of new business 6,988 6,190 Expected change in existing business (6,452) (7,952) Variance between actual and expected experience 3,212 (1,844) Impact of operating assumption changes (961) (1,456) Impact of economic assumption changes 3,766 (959) Other movements recognised as an expense1 47 (263) Change in liability recognised as an expense (note 42(b)) 6,600 (6,284) Effect of portfolio transfers, acquisitions and disposals2 — 788 Foreign exchange rate movements (1,775) 413 Other movements3 528 (60)
Carrying amount at 31 December 131,182 125,829 1 Other movements recognised as an expense during 2019 relate primarily to: a special bonus distribution to with-profits policyholders and model changes in UK Life; the reclassification of health liabilities in Singapore; and
methodology changes in Ireland. The movement in 2018 relates to a special bonus distribution to with-profits policyholders in UK Life. 2 The movement during 2018 includes the acquisition of Friends First in Ireland offset by the disposal of Spain and Avipop in Italy. 3 Other movements during 2019 mainly relate to the reclassification in UK from participating investment contracts to insurance contracts (£972 million) and following a review of the presentation of negative reinsurance assets in
the UK, £(427) million of negative reinsurance assets have been reclassified from insurance liabilities to reinsurance assets. 2018 includes the reclassification in France from insurance to participating investment contracts (£(56) million).
For many types of long-term business, including unit-linked and participating insurance liabilities, movements in asset values are offset by corresponding changes in liabilities, limiting the net impact on profit. The gross long-term business liabilities increased by £5.4 billion during 2019 (2018: £5.1 billion decrease) mainly driven by: • Variance between actual and expected experience of £3.2 billion, which was mainly due to higher than expected equity returns in the UK
and France; • Impact of non-economic assumption changes of £(1.0) billion mainly due to updates to longevity assumptions (with the impact on profit
partially offset by a corresponding reduction in reinsurance assets) in the UK; and • Economic assumption changes of £3.8 billion, which reflects a reduction in valuation interest rates in response to decreasing interest rates
and narrowing of credit spreads, primarily in respect of annuity contracts in the UK.
For participating insurance liabilities, a movement in liabilities is generally offset by a corresponding adjustment to the unallocated divisible surplus and does not impact profit. Where assumption changes impact profit, these are included in the effect of changes in assumptions and estimates during the year (see note 48), together with the impact of movements in related non-financial assets.
(c) General insurance and health liabilities (i) Business description The Group underwrites general insurance and health business in a number of countries as follows: • In the UK, providing individual and corporate customers with a wide range of insurance products; • In Canada, providing a range of personal and commercial lines products; and • In Europe and Asia, providing a range of general insurance and health products.
(ii) Group practice Delays occur in the notification and settlement of claims and a substantial measure of experience and judgement is involved in assessing outstanding liabilities, the ultimate cost of which cannot be known with certainty at the statement of financial position date. The liabilities for general insurance and health business are based on information currently available. However, it is inherent in the nature of the business written that the ultimate liabilities may vary as a result of subsequent developments.
Provisions for outstanding claims are established to cover the outstanding expected ultimate liability for losses and loss adjustment expenses (LAE) in respect of all claims that have already occurred. The provisions established cover reported claims and associated LAE, as well as claims incurred but not yet reported and associated LAE.
The Group only establishes reserves for losses that have already occurred. The Group therefore does not establish catastrophe equalisation reserves that defer a share of income in respect of certain lines of business from years in which a catastrophe does not occur to future periods in which catastrophes may occur. When calculating reserves, the Group takes into account estimated future recoveries from salvage and subrogation, and a separate asset is recorded for expected future recoveries from reinsurers after considering their collectability.
(iii) Provisions for Outstanding Claims The table below shows the total general insurance and health liabilities split by outstanding claim provisions and provision for claims incurred but not reported (IBNR provisions), gross of reinsurance, by major line of business.
As at 31 December 2019 As at 31 December 2018
Outstanding claim
provisions £m
IBNR provisions
£m
Total claim provisions
£m
Outstanding claim
provisions £m
IBNR provisions
£m
Total claim provisions
£m
Motor 4,836 1,115 5,951 5,019 963 5,982 Property 1,823 155 1,978 1,833 104 1,937 Liability 1,864 1,277 3,141 1,856 1,164 3,020 Creditor 5 6 11 4 7 11 Other 303 119 422 334 122 456
8,831 2,672 11,503 9,046 2,360 11,406
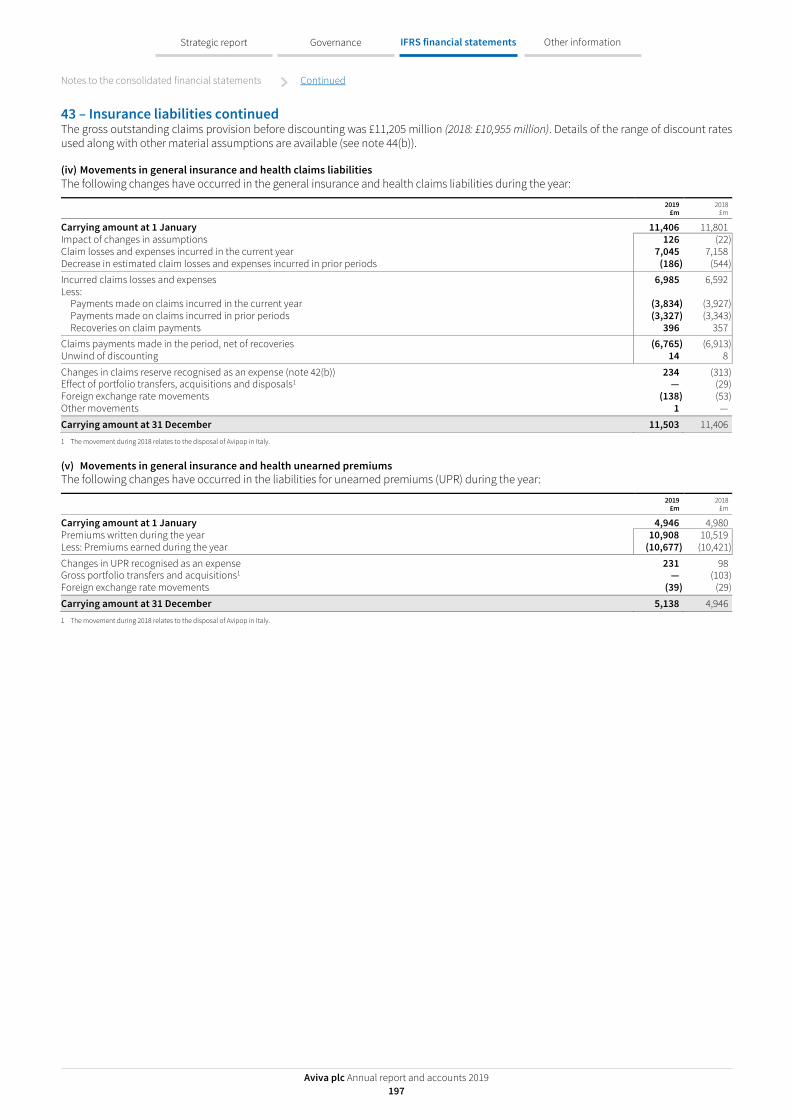
Notes to the consolidated financial statements Continued
Aviva plc Annual report and accounts 2019 197
Strategic report Governance IFRS financial statements Other information
43 – Insurance liabilities continued The gross outstanding claims provision before discounting was £11,205 million (2018: £10,955 million). Details of the range of discount rates used along with other material assumptions are available (see note 44(b)).
(iv) Movements in general insurance and health claims liabilities The following changes have occurred in the general insurance and health claims liabilities during the year:
2019
£m 2018
£m
Carrying amount at 1 January 11,406 11,801 Impact of changes in assumptions 126 (22) Claim losses and expenses incurred in the current year 7,045 7,158 Decrease in estimated claim losses and expenses incurred in prior periods (186) (544) Incurred claims losses and expenses 6,985 6,592 Less:
Payments made on claims incurred in the current year (3,834) (3,927) Payments made on claims incurred in prior periods (3,327) (3,343) Recoveries on claim payments 396 357
Claims payments made in the period, net of recoveries (6,765) (6,913) Unwind of discounting 14 8
Changes in claims reserve recognised as an expense (note 42(b)) 234 (313) Effect of portfolio transfers, acquisitions and disposals1 — (29) Foreign exchange rate movements (138) (53) Other movements 1 —
Carrying amount at 31 December 11,503 11,406 1 The movement during 2018 relates to the disposal of Avipop in Italy.
(v) Movements in general insurance and health unearned premiums The following changes have occurred in the liabilities for unearned premiums (UPR) during the year:
2019
£m 2018
£m
Carrying amount at 1 January 4,946 4,980 Premiums written during the year 10,908 10,519 Less: Premiums earned during the year (10,677) (10,421)
Changes in UPR recognised as an expense 231 98 Gross portfolio transfers and acquisitions1 — (103) Foreign exchange rate movements (39) (29)
Carrying amount at 31 December 5,138 4,946 1 The movement during 2018 relates to the disposal of Avipop in Italy.

Notes to the consolidated financial statements Continued
Aviva plc Annual report and accounts 2019 198
Strategic report Governance IFRS financial statements Other information
43 – Insurance liabilities continued (vi) Analysis of general insurance and health claims development The tables that follow present the development of claims payments and the estimated ultimate cost of claims for the accident years 2010 to 2019. The upper half of the tables shows the cumulative amounts paid during successive years related to each accident year, while the lower section of the tables shows the original estimated ultimate cost of claims and how these original estimates have increased or decreased, as more information becomes known about the individual claims and overall claim frequency and severity.
Key elements of the development of prior accident year general insurance and health net provisions during 2019 were: • £134 million release from the UK due to favourable claims experience in personal and commercial motor partly offset by a strengthening
in commercial property and a change in the discount rate used for estimating lump sum payments in settlement of bodily injury claims (for further details see note 44);
• £58 million release from Canada primarily due to favourable claims experience on personal and commercial motor and large reinsurance recoverable on two catastrophe events from August 2018 in personal and commercial property lines; and
• £83 million release from Europe mainly due to favourable claims development in France.
Key elements of the development of prior accident year general insurance and health net provisions during 2018 were: • £372 million release from the UK due to a change in the discount rate used for estimating lump sum payments in settlement of bodily injury
claims (for further details see note 44) and favourable claims experience in personal and commercial motor; • £78 million release from Canada primarily due to favourable claims experience on personal motor and aligning RBC claims practices with
that of the Aviva book; and • £127 million release from Europe mainly due to continued favourable development in France.
Gross of reinsurance Before the effect of reinsurance, the loss development table is:
Accident year All prior years
£m 2010
£m 2011
£m 2012
£m 2013
£m 2014
£m 2015
£m 2016
£m 2017
£m 2018
£m 2019
£m Total
£m
Gross cumulative claim payments At end of accident year (3,502) (3,420) (3,055) (3,068) (3,102) (2,991) (3,534) (3,517) (3,769) (3,617) One year later (5,466) (4,765) (4,373) (4,476) (4,295) (4,285) (4,972) (4,952) (5,239) Two years later (5,875) (5,150) (4,812) (4,916) (4,681) (4,710) (5,435) (5,388) Three years later (6,163) (5,457) (5,118) (5,221) (4,974) (4,997) (5,781) Four years later (6,405) (5,712) (5,376) (5,467) (5,244) (5,198) Five years later (6,564) (5,864) (5,556) (5,645) (5,406) Six years later (6,649) (5,978) (5,635) (5,739) Seven years later (6,690) (6,032) (5,718) Eight years later (6,718) (6,078) Nine years later (6,740)
Estimate of gross ultimate claims At end of accident year 6,911 6,428 6,201 6,122 5,896 5,851 6,947 6,894 7,185 6,979 One year later 7,006 6,330 6,028 6,039 5,833 5,930 6,931 6,796 7,175 Two years later 6,950 6,315 6,002 6,029 5,865 5,912 6,864 6,756 Three years later 6,914 6,292 5,952 6,067 5,842 5,814 6,817 Four years later 6,912 6,262 6,002 6,034 5,772 5,785 Five years later 6,906 6,265 5,979 5,996 5,756 Six years later 6,926 6,265 5,910 5,956 Seven years later 6,913 6,223 5,902 Eight years later 6,877 6,205 Nine years later 6,861
Estimate of gross ultimate claims 6,861 6,205 5,902 5,956 5,756 5,785 6,817 6,756 7,175 6,979 Cumulative payments (6,740) (6,078) (5,718) (5,739) (5,406) (5,198) (5,781) (5,388) (5,239) (3,617)
2,341 121 127 184 217 350 587 1,036 1,368 1,936 3,362 11,629 Effect of discounting (280) (18) (1) — 1 — — — — — — (298) Present value 2,061 103 126 184 218 350 587 1,036 1,368 1,936 3,362 11,331 Cumulative effect of foreign exchange
movements — (3) (2) 1 4 19 71 (16) (23) (19) — 32 Effect of acquisitions 8 1 7 9 12 23 42 38 — — — 140 Present value recognised in the
statement of financial position 2,069 101 131 194 234 392 700 1,058 1,345 1,917 3,362 11,503

Notes to the consolidated financial statements Continued
Aviva plc Annual report and accounts 2019 199
Strategic report Governance IFRS financial statements Other information
43 – Insurance liabilities continued Net of reinsurance After the effect of reinsurance, the loss development table is:
Accident year All prior years
£m 2010
£m 2011
£m 2012
£m 2013
£m 2014
£m 2015
£m 2016
£m 2017
£m 2018
£m 2019
£m Total
£m
Net cumulative claim payments At end of accident year (3,386) (3,300) (2,925) (2,905) (2,972) (2,867) (3,309) (3,483) (3,718) (3,565) One year later (5,242) (4,578) (4,166) (4,240) (4,079) (4,061) (4,591) (4,843) (5,117) Two years later (5,637) (4,963) (4,575) (4,649) (4,432) (4,452) (5,012) (5,255) Three years later (5,905) (5,263) (4,870) (4,918) (4,720) (4,725) (5,329) Four years later (6,137) (5,485) (5,110) (5,159) (4,973) (4,919) Five years later (6,278) (5,626) (5,289) (5,324) (5,132) Six years later (6,361) (5,740) (5,371) (5,417) Seven years later (6,411) (5,798) (5,439) Eight years later (6,440) (5,842) Nine years later (6,458)
Estimate of net ultimate claims At end of accident year 6,650 6,202 5,941 5,838 5,613 5,548 6,489 6,714 6,997 6,774 One year later 6,751 6,103 5,765 5,745 5,575 5,635 6,458 6,591 6,944 Two years later 6,685 6,095 5,728 5,752 5,591 5,608 6,377 6,569 Three years later 6,644 6,077 5,683 5,733 5,559 5,517 6,334 Four years later 6,634 6,034 5,717 5,689 5,490 5,495 Five years later 6,614 6,005 5,680 5,653 5,472 Six years later 6,624 6,003 5,631 5,612 Seven years later 6,615 5,967 5,600 Eight years later 6,590 5,952 Nine years later 6,569
Estimate of net ultimate claims 6,569 5,952 5,600 5,612 5,472 5,495 6,334 6,569 6,944 6,774 Cumulative payments (6,458) (5,842) (5,439) (5,417) (5,132) (4,919) (5,329) (5,255) (5,117) (3,565) 922 111 110 161 195 340 576 1,005 1,314 1,827 3,209 9,770 Effect of discounting (121) (15) 3 (1) 5 — — — — — — (129) Present value 801 96 113 160 200 340 576 1,005 1,314 1,827 3,209 9,641 Cumulative effect of foreign exchange
movements — (3) (2) 1 4 18 70 (15) (23) (17) — 33 Effect of acquisitions 10 1 7 9 12 23 42 38 — — — 142 Present value recognised in the
statement of financial position 811 94 118 170 216 381 688 1,028 1,291 1,810 3,209 9,816
In the loss development tables shown above, the cumulative claim payments and estimates of cumulative claims for each accident year are translated into sterling at the exchange rates that applied at the end of that accident year. The impact of using varying exchange rates is shown at the bottom of each table. Disposals are dealt with by treating all outstanding and IBNR claims of the disposed entity as ‘paid’ at the date of disposal.
The loss development tables above include information on asbestos and environmental pollution claims provisions from business written more than 10 years ago. The undiscounted claim provisions, net of reinsurance, in respect of this business at 31 December 2019 were £88 million (2018: £94 million). The movement in the year reflects a reduction of £7 million due to favourable claims development, claim payments net of reinsurance recoveries and foreign exchange movements.

Notes to the consolidated financial statements Continued
Aviva plc Annual report and accounts 2019 200
Strategic report Governance IFRS financial statements Other information
44 – Insurance liabilities methodology and assumptions (a) Long-term business The main method used for the actuarial valuation of long-term insurance liabilities is the gross premium method which involves the discounting of projected future cash flows. The cash flows are calculated using the contractual premiums payable together with explicit assumptions for investment returns, discount rates, inflation, mortality, morbidity, persistency and future expenses. These assumptions can vary by contract type and reflect current and expected future experience with an allowance for prudence.
The methodology and assumptions described below relate to the UK and France insurance businesses only.
(i) UK Non-profit business The valuation of non-profit business is based on grandfathered regulatory requirements under IFRS 4 prior to the adoption of Solvency II, adjusted to remove certain regulatory reserves and margins in assumptions, notably for annuity business. Conventional non-profit contracts, including those written in the with-profits funds, are valued using the gross premium method. For non-profit business in the ex. Friends Life with-profits funds, the liabilities are measured on a realistic basis with implicit recognition of the present value of future profits.
For unit-linked and some unitised with-profits business, the provisions are valued by adding a prospective non-unit reserve to the bid value of units. The prospective non-unit reserve is calculated by projecting the future non-unit cash flows using prudent assumptions and on the assumption that future premiums cease, unless it is more onerous to assume that they continue.
Discount rates Valuation discount rate assumptions are set with regard to yields on the supporting assets and the general level of long-term interest rates as measured by gilt yields. An explicit allowance for risk is included by making a deduction from the yields on corporate bonds, mortgages and deposits, based on historical default experience of each asset class. For equity release assets, the risk allowances are consistent with those used in the fair value asset methodology (see note 24). A further margin for risk is then deducted for all asset classes.
Valuation discount rates for business in the non-profit funds are as follows:
Valuation discount rates (Gross of investment expenses) 2019 2018
Assurances Life conventional non-profit 0.5% to 2.1% 0.9% to 2.6% Pensions conventional non-profit 0.6% to 1.6% 1.1% to 2.1%
Annuities Conventional immediate and deferred annuities 0.9% to 2.3% 1.2% to 3.0%
Non-unit reserves on unit-linked business Life 0.9% 0.9% to 1.3% Pensions 1.1% 0.9% to 1.6%
Income Protection Active lives 0.6% to 2.1% 1.1% to 2.6% Claims in payment (level and index linked) 1.1% 1.3% to 1.6%
The valuation discount rates are after a reduction for risk, but before allowance for investment expenses. For conventional immediate annuity business, the allowance for risk comprises long-term assumptions on a prudent basis for defaults or, in the case of equity release assets, expected losses arising from the No-Negative-Equity Guarantee. These allowances vary by asset category and for some asset classes by rating.
The risk allowances made for corporate bonds (including overseas government bonds and structured finance assets), mortgages (including healthcare mortgages, commercial mortgages and infrastructure assets), and equity release equated to 45-47 bps, 31-35 bps, and 124 bps respectively at 31 December 2019 (2018: 50 bps, 39-41 bps, and 112 bps respectively).
The total valuation allowance in respect of corporate bonds and mortgages, including healthcare mortgages but excluding equity release, was £1.8 billion (2018: £1.9 billion) over the remaining term of the portfolio at 31 December 2019. The total valuation allowance in respect of equity release assets was £1.5 billion at 31 December 2019 (2018: £1.3 billion). Total liabilities for the annuity business were £57.6 billion at 31 December 2019 (2018: £53.7 billion).
Expenses Maintenance expense assumptions for non-profit business are generally expressed as a per policy charge set with regards to an allocation of current year expense levels by broad category of business and using the policy counts for in-force business. The assumptions also include an allowance for prudence and increase by future expense inflation over the lifetime of each contract. Expense inflation is assumed to be in line with RPI, and in line with external agreements for business administered externally. An additional liability is held if projected per-policy expenses in future years are expected to exceed current assumptions. Further, explicit project expense liabilities are held for non-discretionary project costs that typically relate to mandatory requirements. Expense-related liabilities are only held where expenses are not covered by anticipated future profits in the liability methodology, notably for unit-linked contracts. Investment expense assumptions are generally expressed as a proportion of the assets backing the liabilities.
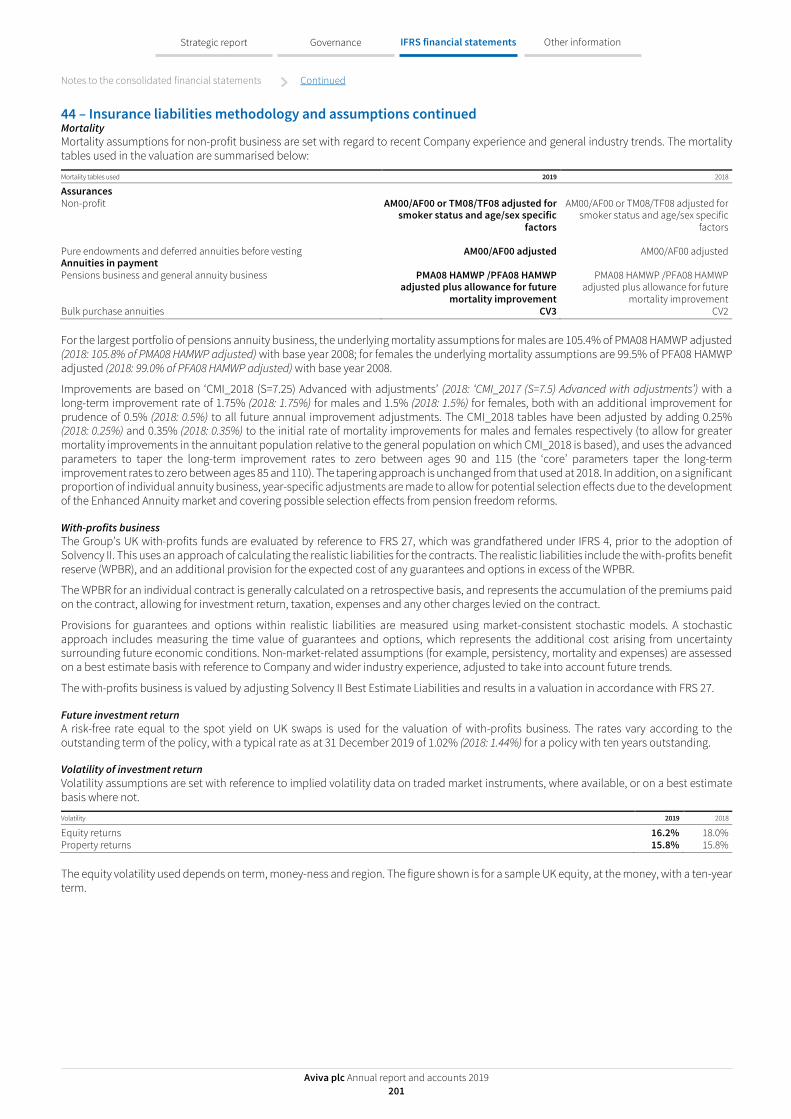
Notes to the consolidated financial statements Continued
Aviva plc Annual report and accounts 2019 201
Strategic report Governance IFRS financial statements Other information
44 – Insurance liabilities methodology and assumptions continued Mortality Mortality assumptions for non-profit business are set with regard to recent Company experience and general industry trends. The mortality tables used in the valuation are summarised below:
Mortality tables used 2019 2018
Assurances Non-profit AM00/AF00 or TM08/TF08 adjusted for
smoker status and age/sex specific factors
AM00/AF00 or TM08/TF08 adjusted for smoker status and age/sex specific
factors Pure endowments and deferred annuities before vesting AM00/AF00 adjusted AM00/AF00 adjusted Annuities in payment Pensions business and general annuity business PMA08 HAMWP /PFA08 HAMWP
adjusted plus allowance for future mortality improvement
PMA08 HAMWP /PFA08 HAMWP adjusted plus allowance for future
mortality improvement Bulk purchase annuities CV3 CV2
For the largest portfolio of pensions annuity business, the underlying mortality assumptions for males are 105.4% of PMA08 HAMWP adjusted (2018: 105.8% of PMA08 HAMWP adjusted) with base year 2008; for females the underlying mortality assumptions are 99.5% of PFA08 HAMWP adjusted (2018: 99.0% of PFA08 HAMWP adjusted) with base year 2008.
Improvements are based on ‘CMI_2018 (S=7.25) Advanced with adjustments’ (2018: ‘CMI_2017 (S=7.5) Advanced with adjustments’) with a long-term improvement rate of 1.75% (2018: 1.75%) for males and 1.5% (2018: 1.5%) for females, both with an additional improvement for prudence of 0.5% (2018: 0.5%) to all future annual improvement adjustments. The CMI_2018 tables have been adjusted by adding 0.25% (2018: 0.25%) and 0.35% (2018: 0.35%) to the initial rate of mortality improvements for males and females respectively (to allow for greater mortality improvements in the annuitant population relative to the general population on which CMI_2018 is based), and uses the advanced parameters to taper the long-term improvement rates to zero between ages 90 and 115 (the ‘core’ parameters taper the long-term improvement rates to zero between ages 85 and 110). The tapering approach is unchanged from that used at 2018. In addition, on a significant proportion of individual annuity business, year-specific adjustments are made to allow for potential selection effects due to the development of the Enhanced Annuity market and covering possible selection effects from pension freedom reforms.
With-profits business The Group’s UK with-profits funds are evaluated by reference to FRS 27, which was grandfathered under IFRS 4, prior to the adoption of Solvency II. This uses an approach of calculating the realistic liabilities for the contracts. The realistic liabilities include the with-profits benefit reserve (WPBR), and an additional provision for the expected cost of any guarantees and options in excess of the WPBR.
The WPBR for an individual contract is generally calculated on a retrospective basis, and represents the accumulation of the premiums paid on the contract, allowing for investment return, taxation, expenses and any other charges levied on the contract.
Provisions for guarantees and options within realistic liabilities are measured using market-consistent stochastic models. A stochastic approach includes measuring the time value of guarantees and options, which represents the additional cost arising from uncertainty surrounding future economic conditions. Non-market-related assumptions (for example, persistency, mortality and expenses) are assessed on a best estimate basis with reference to Company and wider industry experience, adjusted to take into account future trends.
The with-profits business is valued by adjusting Solvency II Best Estimate Liabilities and results in a valuation in accordance with FRS 27.
Future investment return A risk-free rate equal to the spot yield on UK swaps is used for the valuation of with-profits business. The rates vary according to the outstanding term of the policy, with a typical rate as at 31 December 2019 of 1.02% (2018: 1.44%) for a policy with ten years outstanding.
Volatility of investment return Volatility assumptions are set with reference to implied volatility data on traded market instruments, where available, or on a best estimate basis where not.
Volatility 2019 2018
Equity returns 16.2% 18.0% Property returns 15.8% 15.8%
The equity volatility used depends on term, money-ness and region. The figure shown is for a sample UK equity, at the money, with a ten-year term.

Notes to the consolidated financial statements Continued
Aviva plc Annual report and accounts 2019 202
Strategic report Governance IFRS financial statements Other information
44 – Insurance liabilities methodology and assumptions continued Future regular bonuses Annual bonus assumptions for 2020 have been set consistently with the year-end 2019 declaration. Future annual bonus rates reflect the principles and practices of each fund. In particular, the level is set with regard to the projected margin for final bonus and the change from one year to the next is limited to a level consistent with past practice.
Mortality Mortality assumptions for with-profits business are set with regard to recent Company experience and general industry trends. The mortality tables used in the valuation are summarised below:
Mortality table used 2019 2018
Assurances, pure endowments and deferred annuities before vesting Nil or Axx00 adjusted Nil or Axx00 adjusted
Pensions business after vesting and pensions annuities in payment
PMA08 HAMWP/PFA08 HAMWP adjusted plus allowance for future
mortality improvement
PMA08 HAMWP/PFA08 HAMWP adjusted plus allowance for future
mortality improvement
Allowance for future mortality improvement is in line with the rates for non-profit business.
Expenses Maintenance fee assumptions for with-profits business are generally expressed as a fixed per policy charge in line with a memorandum of understanding between the with-profits funds and the non-profit fund within the company. The memorandum of understanding specifies the charges for a five-year period ending in 2023, and specifies a level of charge inflation during that period of CPI+2% or CPI+3% depending on the product type. After the end of the period covered by the memorandum of understanding we assume that the charges will remain unchanged, and a level of charge inflation of RPI+1% for all products will apply. Any excess of expenses charged by Aviva Life Services UK Limited (UKLS) to Aviva Life & Pensions UK Limited (AVLAP) over the charges specified by the memorandum of understanding is borne by the non-profit fund.
As at 31 December 2018 maintenance expense assumptions for with-profits business were generally expressed as a fixed per policy charge in line with agreements between UKLS and AVLAP. The assumptions increased by a future inflation charge over the lifetime of each contract, which was 50% RPI, 100% RPI or 100% RPI + 1% depending on product type. Any excess of expenses charged by UKLS to AVLAP over the charges specified by the agreements was borne by the non-profit business.
Guarantees and options The provisions held in respect of guaranteed annuity options for the with-profits and the non-profit business are a prudent assessment of the additional liability incurred under the option on a basis and method consistent with that used to value basic policy liabilities, and includes a prudent assessment of the proportion of policyholders who will choose to exercise the option. For further details see note 46.
(ii) France The majority of reserves arise from single premium savings products and are based on the accumulated fund values, adjusted to maintain consistency with the value of the assets backing the policyholder liabilities. For traditional business, the net premium method is used for prospective valuations, in accordance with local regulation, where the valuation assumptions depend on the date of issue of the contract. The valuation discount rate also depends on the original duration of the contract and mortality rates are based on industry tables.
Valuation discount rates Mortality tables used
2019 2018 2019 and 2018
TD73-77,TD88-90,TH00-02 TF00-02,
H_AVDBS,F_AVDBS Life assurances 0% to 4.5% 0% to 4.5% H_SSDBS, F_SSDBS Annuities 0% to 1.5% 0% to 2% TGF05/TGH05
(b) General insurance and health Outstanding claims provisions are estimated based on known facts at the date of estimation. Case estimates are set by skilled claims technicians and established case setting procedures. Claims above certain limits are referred to senior claims handlers for estimate authorisation.
No adjustments are made to the claims technicians’ case estimates included in booked claim provisions, except for rare occasions when the estimated ultimate cost of individual large or unusual claims may be adjusted, subject to internal reserve committee approval, to allow for uncertainty regarding, for example, the outcome of a court case. The ultimate cost of outstanding claims is then estimated by using a range of standard actuarial claims projection techniques, such as the Chain Ladder and Bornhuetter-Ferguson methods. Historical claims development is mainly analysed by accident period, although underwriting or notification period is also used where this is considered appropriate.
The assumptions used in most non-life actuarial projection techniques, including future rates of claims inflation or loss ratio assumptions, are implicit in the historical claims development data on which the projections are based. Additional qualitative judgement is used to assess the extent to which past trends may not apply in the future in order to arrive at a point estimate for the ultimate cost of claims that represents the likely outcome, from a range of possible outcomes, taking account of all the uncertainties involved. The range of possible outcomes does not, however, result in the quantification of a reserve range.
The following explicit assumptions are made which could materially impact the level of booked net reserves:

Notes to the consolidated financial statements Continued
Aviva plc Annual report and accounts 2019 203
Strategic report Governance IFRS financial statements Other information
44 – Insurance liabilities methodology and assumptions continued Discounting Outstanding claims provisions are based on undiscounted estimates of future claim payments, except for the following classes of business for which discounted provisions are held:
Discount rate Mean term of liabilities
Class 2019 2018 2019 2018
Reinsured London Market business 0.8% to 2.2% 1.0% to 2.9% 9 years 10 years Latent claims 0.8% to 2.2% 1.0% to 2.6% 10 to 12 years 11 to 18 years Structured settlements -0.2% to 2.7% 1.0% to 3.0% 11 to 35 years 9 to 37 years
The period of time which will elapse before the liabilities are settled has been estimated by modelling the settlement patterns of the underlying claims.
The discount rate that has been applied to latent claims reserves, structured settlements and reinsured London Market business is based on the swap curve in the relevant currency at the reporting date, having regard to the duration of the expected settlement dates of the claims. The range of discount rates used depends on the duration of the claims and is given in the table above. The duration of the claims span over 35 years, with the average duration being between 9 and 12 years depending on the geographical region.
At 31 December 2019, it is estimated that a 1% fall in the discount rates used would increase net claim reserves by approximately £120 million (2018: £100 million), excluding the offsetting effect on asset values as assets are not hypothecated across classes of business.
UK mesothelioma claims The level of uncertainty associated with latent claims is considerable due to the relatively small number of claims and the long-tail nature of the liabilities. UK mesothelioma claims account for a large proportion of the Group’s latent claims. The key assumptions underlying the estimation of these claims include claim numbers, the base average cost per claim, future inflation in the average cost of claims and legal fees.
The best estimate of the liabilities reflects the latest available market information and studies. Many different scenarios can be derived by flexing these key assumptions and applying different combinations of these assumptions. An upper and lower scenario can be derived by making reasonably likely changes to these assumptions, resulting in an estimate of £25 million (2018: £20 million) greater than the best estimate, or £35 million (2018: £30 million) lower than the best estimate. These scenarios do not, however, constitute an upper or lower bound on these liabilities.
Allowance for risk and uncertainty The uncertainties involved in estimating loss reserves are allowed for in the reserving process and by the estimation of explicit reserve uncertainty distributions. The reserve estimation basis requires all non-life businesses to calculate booked claim provisions as the best estimate of the cost of future claim payments, plus an explicit allowance for risk and uncertainty. The allowance for risk and uncertainty is calculated by each business unit in accordance with the requirements of the Group non-life reserving policy, taking into account the risks and uncertainties specific to each line of business and type of claim in that territory. The requirements of the Group non-life reserving policy also seek to ensure that the allowance for risk and uncertainty is set consistently across both business units and reporting periods.
Lump sum payments in settlement of bodily injury claims that are decided by the UK courts are calculated in accordance with the Ogden Tables and discount rate. The Ogden discount rate is set by the Lord Chancellor and is applied when calculating the present value of future care costs and loss of earnings for claims settlement purposes. Following the announcement by the Lord Chancellor on 15 July 2019 to increase the Ogden discount rate from the -0.75% set in 2017 to -0.25% (rate retained at -0.75% in Scotland), balance sheet reserves in the UK have been calculated using a discount rate of -0.25% at 31 December 2019. This has resulted in a strengthening of claims reserves in the UK of £45 million. At December 2018, balance sheet reserves were calculated using a rate of 0.00%. The Ogden discount rate is expected to be reviewed by the Lord Chancellor within five years.

Notes to the consolidated financial statements Continued
Aviva plc Annual report and accounts 2019 204
Strategic report Governance IFRS financial statements Other information
45 – Liabilities for investment contracts This note analyses our gross liabilities for investment contracts by type of product and describes the calculation of these liabilities.
(a) Carrying amount The liabilities for investment contracts (gross of reinsurance) at 31 December comprised:
2019
£m 2018
£m
Long-term business Liabilities for participating investment contracts 92,762 90,455 Liabilities for non-participating investment contracts 137,689 120,354 Total 230,451 210,809
Less: Liabilities classified as held for sale (8,324) (8,341)
222,127 202,468
(b) Group practice Investment contracts are those that do not transfer significant insurance risk from the contract holder to the issuer, and are therefore treated as financial instruments under IFRS.
Many investment contracts contain a discretionary participation feature in which the contract holder has a contractual right to receive additional benefits as a supplement to guaranteed benefits. These are referred to as participating contracts and are measured according to the methodology for long-term business liabilities (see note 44). They are not measured at fair value as there is currently no agreed definition of fair valuation for discretionary participation features under IFRS. In the absence of such a definition, it is not possible to provide a range of estimates within which a fair value is likely to fall. The IASB deferred consideration of participating contracts to the IFRS 17 insurance standard, which is expected to apply to annual reporting periods beginning on or after 1 January 2022.
For participating business, the discretionary participation feature is recognised separately from the guaranteed element and is classified as a liability, referred to as unallocated divisible surplus, except for the with-profits sub-fund supported by the RIEESA. Guarantees on long-term investment products are discussed in note 46.
Investment contracts that do not contain a discretionary participation feature are referred to as non-participating contracts and the liability is measured at either fair value or amortised cost. We currently have no non-participating investment contracts measured at amortised cost.
Of the non-participating investment contracts measured at fair value, £137,040 million at 31 December 2019 (2018: £119,402 million) are unit-linked in structure and the fair value liability is equal to the current unit fund value, including any unfunded units, plus if required, additional non-unit reserves based on a discounted cash flow analysis. These contracts are generally classified as Level 1 in the fair value hierarchy, as the unit reserve is calculated as the publicly quoted unit price multiplied by the number of units in issue, and any non-unit reserve is insignificant.
For unit-linked business, a deferred acquisition cost asset and deferred income reserve liability are recognised in respect of transaction costs and front-end fees respectively, that relate to the provision of investment management services, and which are amortised on a systematic basis over the contract term. The amount of the related deferred acquisition cost asset is shown in note 30 and the deferred income liability is shown in note 55.
For non-participating investment contracts acquired in a business combination, an acquired value of in-force business asset is recognised in respect of the fair value of the investment management services component of the contracts, which is amortised on a systematic basis over the useful lifetime of the related contracts. The amount of the acquired value of in-force business asset is shown in note 18, which relates primarily to the acquisition of Friends Life in 2015 and Friends First in 2018.
(c) Movements in the year The following movements have occurred in the gross provisions for investment contracts in the year:
(i) Participating investment contracts
2019
£m 2018
£m
Carrying amount at 1 January 90,455 87,654 Liabilities in respect of new business 6,991 6,301 Expected change in existing business (4,857) (4,491) Variance between actual and expected experience 4,751 (1,441) Impact of operating assumption changes 173 59 Impact of economic assumption changes 204 (40) Other movements recognised as an expense1 103 152 Change in liability recognised as an expense2 7,365 540 Effect of portfolio transfers, acquisitions and disposals3 — 427 Foreign exchange rate movements (4,054) 774 Other movements4 (1,004) 1,060
Carrying amount at 31 December 92,762 90,455 1 Other movements recognised as an expense during 2019 relate primarily to a special bonus distribution to with-profits policyholders and the recognition of unitised with-profits annual management charges in UK Life.
The movement in 2018 primarily relates to a special bonus distribution to with-profits policyholders in UK Life. 2 Total interest expense for participating investment contracts recognised in profit or loss is £5,269 million (2018: £(419) million). 3 The movement during 2018 relates to the acquisition of Friends First in Ireland. 4 Other movements during 2019 include the reclassification in UK from participating investment to insurance contracts (£(972) million) and from participating investment to outstanding claims reserves (£(32) million).
The movement during 2018 relates to the reclassification in France from non-participating investment contracts to participating investment contracts (£151 million) and from insurance to participating investment contracts (£56 million) and to a reclassification from non-participating investment contracts to participating investment contracts in the UK (£853 million).

Notes to the consolidated financial statements Continued
Aviva plc Annual report and accounts 2019 205
Strategic report Governance IFRS financial statements Other information
45 – Liabilities for investment contracts continued For many types of long-term business, including unit-linked and participating funds, movements in asset values are offset by corresponding changes in liabilities, limiting the net impact on profit.
The variance between actual and expected experience in 2019 of £4.8 billion is primarily the result of the impact of strong global equity performance.
The impact of assumption changes in the analysis shows the resulting movement in the carrying value of participating investment contract liabilities. For participating business, a movement in liabilities is generally offset by a corresponding adjustment to the unallocated divisible surplus and does not impact profit. Where assumption changes do impact profit, these are included in the effect of changes in assumptions and estimates during the year shown in note 48, together with the impact of movements in related non-financial assets.
(ii) Non-participating investment contracts
2019
£m 2018
£m
Carrying amount at 1 January 120,354 124,995 Liabilities in respect of new business 5,520 4,869 Expected change in existing business (3,742) (5,509) Variance between actual and expected experience 16,345 (5,539) Impact of operating assumption changes (22) (10) Impact of economic assumption changes (1) (81) Other movements recognised as an expense 2 6 Change in liability 18,102 (6,264) Effect of portfolio transfers, acquisitions and disposals1 — 2,494 Foreign exchange rate movements (575) 133 Other movements2 (192) (1,004)
Carrying amount at 31 December 137,689 120,354 1 The movement during 2018 relates to the acquisition of Friends First in Ireland. 2 Other movements during 2019 mainly relate to the reclassification in UK from non-participating investment to outstanding claims reserves (£(180) million). Other movements during 2018 relates to the reclassification in
France from non-participating investment contracts to participating investment contracts (£(151) million) and to a reclassification from non-participating investment contracts to participating investment contracts in the UK (£(853) million).
For unit-linked investment contracts, movements in asset values are offset by corresponding changes in liabilities, limiting the net impact on profit. The variance between actual and expected experience in 2019 of £16.3 billion is primarily the result of the impact of strong global equity performance.
The impact of assumption changes in the above analysis shows the resulting movement in the carrying value of non-participating investment contract liabilities. The impacts of assumption changes on profit are included in the effect of changes in assumptions and estimates during the year shown in note 48, which combines participating and non-participating investment contracts together with the impact of movements in related non-financial assets.

Notes to the consolidated financial statements Continued
Aviva plc Annual report and accounts 2019 206
Strategic report Governance IFRS financial statements Other information
46 – Financial guarantees and options This note details the financial guarantees and options inherent in some of our insurance and investment contracts.
As a part of their operating activities, various Group companies have provided guarantees and options, including investment return guarantees, on certain long-term insurance and fund management products.
(a) UK non-profit business The Group’s UK non-profit funds are evaluated by reference to statutory reserving rules, which are based on the UK regulatory requirements (grandfathered under IFRS 4), prior to the adoption of Solvency II, adjusted to remove certain regulatory reserves and margins in assumptions, notably for annuity business.
(i) Guaranteed annuity options The Group’s UK non-profit funds have written contracts which contain guaranteed annuity rate options (GAOs), where the policyholder has the option to take the benefits from a policy in the form of an annuity based on guaranteed conversion rates. Provision for these guarantees do not materially differ from a provision based on a market-consistent stochastic model, and amounts to £82 million at 31 December 2019 (2018: £87 million).
(ii) Guaranteed unit price on certain products Certain pension products linked to long-term life insurance funds provide policyholders with guaranteed benefits at retirement or death. No additional provision is made for this guarantee as the investment management strategy for these funds is designed to ensure that the guarantee can be met from the fund, mitigating the impact of large falls in investment values and interest rates.
(iii) Return of premium guarantees German pension products sold in Friends Life between 2006 and 2014 are subject to a return of premium guarantee whereby the product guarantees to return the maximum of the unit fund value or total premiums paid (before deductions). Provisions for this guarantee are calculated using a market-consistent stochastic model and amount to £178 million at 31 December 2019 (2018: £153 million).
(b) UK with-profits business The Group’s UK with-profits liabilities are evaluated by reference to FRS 27, which was grandfathered under IFRS 4, prior to the adoption of Solvency II. Under the PRA’s rules, provisions for guarantees and options within realistic liabilities are measured using market-consistent stochastic models. A stochastic approach includes measuring the time value of guarantees and options, which represents the additional cost arising from uncertainty surrounding future economic conditions.
The material guarantees and options relating to this provision are:
(i) Maturity value and death benefit guarantees Significant conventional and unitised with-profits business have minimum maturity (and in some cases death benefit) values reflecting the sum assured plus declared annual bonus. For some unitised with-profits life contracts the amount paid after the fifth policy anniversary is guaranteed to be at least as high as the premium paid increased in line with the rise in retail price index (RPI) or consumer price index (CPI).
(ii) No market valuation reduction (MVR) guarantees For unitised business, there are circumstances where a ‘no MVR’ guarantee is applied, for example on certain policy anniversaries, guaranteeing that no market value reduction will be applied to reflect the difference between the accumulated value of units and the market value of the underlying assets.
(iii) Guaranteed annuity options The Group’s UK with-profits funds have written individual and group pension contracts which contain GAOs, where the policyholder has the option to take the benefits from a policy in the form of an annuity based on guaranteed conversion rates. The Group also has exposure to GAOs and similar options on deferred annuities.
Realistic liabilities for GAOs in the UK with-profits funds were £1,628 million at 31 December 2019 (2018: £1,644 million). With the exception of the with-profits sub-fund supported by the RIEESA, movements in the realistic liabilities in the with-profits funds are offset by a corresponding movement in the unallocated divisible surplus, with no net impact on IFRS profit. Realistic liabilities for GAOs in the with-profits sub-fund supported by the RIEESA were £129 million at 31 December 2019 (2018: £155 million).
(iv) Guaranteed minimum pension The Group’s UK with-profits funds also have certain policies that contain a guaranteed minimum level of pension as part of the condition of the original transfer from state benefits to the policy.
(v) Guaranteed minimum maturity payments on mortgage endowments The with-profits funds made promises to certain policyholders in relation to their with-profits mortgage endowments. Top-up payments will be made on these policies at maturity to meet the mortgage value up to a maximum of the 31 December 1999 illustrated shortfall.

Notes to the consolidated financial statements Continued
Aviva plc Annual report and accounts 2019 207
Strategic report Governance IFRS financial statements Other information
46 – Financial guarantees and options continued (c) Overseas life businesses In addition to guarantees written in the Group’s UK businesses, our overseas businesses have also written contracts containing guarantees and options. Details of the significant guarantees and options provided by overseas life businesses are set out below.
(i) France Guaranteed surrender value guaranteed minimum bonuses and options Aviva France has written a number of contracts with a guaranteed surrender value and guaranteed minimum bonuses. The guaranteed surrender value is the accumulated value of the contract including accrued bonuses. Bonuses are based on accounting income from amortised bond portfolios, where the duration of bond portfolios is set in relation to the expected duration of the policies, plus income and releases from realised gains on equity-type investments. Policy reserves are equal to guaranteed surrender values. Local statutory accounting envisages the establishment of a reserve, ‘Provision pour Aléas Financiers’ (PAF), when accounting income is less than 125% of guaranteed minimum credited returns. No PAF was established at full year 2019 (2018: no PAF was established).
The most significant of these contracts is the AFER Eurofund which has total liabilities of £37 billion at 31 December 2019 (2018: £39 billion). The guaranteed minimum bonus is agreed between Aviva France and the AFER association at the end of each year, in respect of the following year. The bonus was 1.85% for 2019 (2018: 2.25%) compared with an accounting income from the fund of 2.34% (2018: 2.74%).
Non-AFER contracts with guaranteed surrender values had liabilities of £11 billion at 31 December 2019 (2018: £11 billion) and all guaranteed annual bonus rates are between 0% and 4.5% (2018: 0% to 4.5%). For non-AFER business the accounting income return exceeded guaranteed bonus rates in 2019 (2018: the accounting income return exceeded guaranteed bonus rates).
In addition, there are a small proportion of contracts with a switch-loss option. Consistent with previous years, the risks associated with switch-loss options are allowed for in the liabilities in accordance with local regulations and IFRS 4.
Guaranteed death and maturity benefits The Group has also sold a small proportion of unit-linked policies where the death and/or maturity benefit is guaranteed to be at least equal to the premiums paid. The reserve held in the Group’s consolidated statement of financial position is calculated on a prudent basis and is in excess of the economic liability.
(ii) Italy Guaranteed investment returns and guaranteed surrender values The Group has written contracts containing guaranteed investment returns and guaranteed surrender values in Italy. Liabilities are generally taken as the face value of the contract plus, if required, an explicit provision for guarantees calculated in accordance with local regulations and IFRS 4.
(iii) Ireland Guaranteed annuity options and guaranteed maturity values As in the UK, the Group’s with-profits liabilities in Ireland are measured on a realistic basis, including realistic liabilities for guarantees and options. Guarantees and options in Ireland include GAOs, minimum maturity values on conventional with-profits business, guaranteed minimum bonus rates on unitised with profits business, and a ‘no MVR’ guarantee that may apply at certain policy anniversaries.

Notes to the consolidated financial statements Continued
Aviva plc Annual report and accounts 2019 208
Strategic report Governance IFRS financial statements Other information
47 – Reinsurance assets This note details the reinsurance assets on our insurance and investment contract liabilities.
(a) Carrying amount The reinsurance assets at 31 December comprised:
2019
£m 2018
£m
Long-term business Insurance contracts 6,369 5,836 Participating investment contracts 1 1 Non-participating investment contracts1 4,006 4,009
10,376 9,846 Outstanding claims provisions 93 89 10,469 9,935
General insurance and health Outstanding claims provisions 683 789 Provisions for claims incurred but not reported 1,004 822 1,687 1,611 Provisions for unearned premiums 275 254
1,962 1,865
12,431 11,800 Less: Assets classified as held for sale (75) (45)
Total 12,356 11,755 1 Balances in respect of all reinsurance treaties are included under reinsurance assets, regardless of whether they transfer significant insurance risk. The reinsurance assets classified as non-participating investment contracts are
financial instruments measured at fair value through profit or loss.
Of the above total, £10,943 million (2018: £10,800 million) is expected to be recovered more than one year after this statement of financial position.
(b) Assumptions The assumptions, including discount rates, used for reinsurance contracts follow those used for insurance liabilities. Reinsurance assets are valued net of an allowance for recoverability.
(c) Movements The following movements have occurred in the reinsurance assets during the year:
(i) Long-term business liabilities
2019
£m 2018
£m
Carrying amount at 1 January 9,846 11,565 Assets in respect of new business 954 1,766 Expected change in existing business assets (185) (22) Variance between actual and expected experience 274 431 Impact of non-economic assumption changes (175) (460) Impact of economic assumption changes 193 21 Other movements recognised as an expense1 (37) (3,877) Change in assets2 1,024 (2,141) Effect of portfolio transfers, acquisitions and disposals3 — 399 Foreign exchange rate movements (73) 23 Other movements4 (421) —
Carrying amount at 31 December 10,376 9,846 1 Other movements recognised as an expense during 2019 primarily relate to the ceding of reinsurance for annuity business offset by basis methodology changes in Ireland, the reclassification of health reinsurance assets in
Singapore and collective investments in unit-linked funds in the UK following a restructure of a reinsurance treaty. The latter part is a continuation of activity undertaken in 2018. 2 Change in assets does not reconcile with values in note 42(b) due to the inclusion of reinsurance assets classified as non-participating investment contracts where, for such contracts, deposit accounting is applied on the income
statement. 3 The movement during 2018 primarily relates to the acquisition of Friends First in Ireland. 4 Following a review of the presentation of negative reinsurance assets in the UK, £(427) million of negative reinsurance assets have been reclassified from insurance liabilities to reinsurance assets.
The impact of assumption changes in the above analysis shows the resulting movement in the carrying value of reinsurance assets, with corresponding movements in gross insurance contract liabilities. For participating businesses, a movement in reinsurance assets is generally offset by a corresponding adjustment to the unallocated divisible surplus and does not impact profit. Where assumption changes impact profit, these are included in the effect of changes in assumptions and estimates during the year (see note 48), together with the impact of movements in related liabilities and other non-financial assets.

Notes to the consolidated financial statements Continued
Aviva plc Annual report and accounts 2019 209
Strategic report Governance IFRS financial statements Other information
47 – Reinsurance assets continued (ii) General insurance and health claims liabilities
2019
£m 2018
£m
Carrying amount at 1 January 1,611 1,729 Impact of changes in assumptions 73 (22) Reinsurers’ share of claim losses and expenses
Incurred in current year 195 176 Incurred in prior years 96 40
Reinsurers’ share of incurred claim losses and expenses 291 216 Less: Reinsurance recoveries received on claims
Incurred in current year (53) (54) Incurred in prior years (227) (259)
Reinsurance recoveries received in the year (280) (313) Unwind of discounting 10 8
Change in reinsurance asset recognised as income (note 42(b)) 94 (111) Effect of portfolio transfers, acquisitions and disposals1 — (9) Foreign exchange rate movements (15) 2 Other movements (3) —
Carrying amount at 31 December 1,687 1,611 1 The movement during 2018 relates to the proportion of reinsurance assets held by Avipop which was sold by Italy in 2018.
(iii) General insurance and health unearned premiums
2019
£m 2018
£m
Carrying amount at 1 January 254 257 Premiums ceded to reinsurers in the year 683 392 Less: Reinsurers’ share of premiums earned during the year (661) (375) Changes in reinsurance asset recognised as income 22 17 Reinsurers’ share of portfolio transfers and acquisitions1 — (21) Foreign exchange rate movements (1) 1
Carrying amount at 31 December 275 254 1 The movement during 2018 relates to the proportion of Avipop sold by Italy in 2018 that was ceded to reinsurers.

Notes to the consolidated financial statements Continued
Aviva plc Annual report and accounts 2019 210
Strategic report Governance IFRS financial statements Other information
48 – Effect of changes in assumptions and estimates during the year This note analyses the impact of changes in estimates and assumptions from 2018 to 2019, on liabilities for insurance and investment contracts, and related assets and liabilities, such as unallocated divisible surplus, reinsurance, deferred acquisition costs and acquired value of in-force business and does not allow for offsetting movements in the value of backing financial assets.
Effect on profit 2019
£m
Effect on profit 2018
£m
Assumptions Long-term insurance business Interest rates (2,978) 1,061 Expenses (47) 9 Persistency rates (124) 23 Mortality and morbidity for assurance contracts (38) 24 Mortality for annuity contracts 830 780 Tax and other assumptions 9 18 Long-term investment business Expenses — (1) General insurance and health business Change in discount rate assumptions (54) 1
Total (2,402) 1,915
The impact of interest rates on long-term business relates primarily to annuities in the UK (including any change in credit default and reinvestment risk provisions), where a reduction in the discount rate, in response to decreasing interest rates and narrowing credit spreads, has increased liabilities.
The impact of expenses on long-term business relates primarily to the UK and Ireland, where reserves have increased by £55 million following a review of recent experience including the margin for prudence. This has been offset slightly by £8 million due to favourable expense experience in Singapore.
The impact of persistency on long-term business relates primarily to the UK. Reserves have increased by £127 million following a review of recent experience, driven by the introduction of age-dependent retirement rates for pension business and unfavourable lapse experience.
The impact of mortality for annuitant contracts on long-term business relates primarily to the UK. In 2019, there has been a reduction in reserves due to longevity assumptions and modelling which include: • Updates to base mortality to reflect recent experience for individual annuities of £81 million; • Updates to the rate of mortality improvements for individual annuities, including CMI 2018 and a change in smoothing parameter, of
£410 million; • Refinements to modelling of bulk purchase annuities together with a change to base mortality, improvements and a change in smoothing
parameter, of £231 million; • Refinements to modelling of enhanced annuities of £58 million; and • Other less significant movements of £19 million.
In Ireland there was a slight reduction in the reserves of £31 million following a review of recent experience.
In 2018 the impact of mortality for annuitant contracts on long-term business relates primarily to the UK. This resulted in a reduction in reserves due to longevity assumptions and modelling which included: • Updates to base mortality to reflect recent experience including the 2008 series tables for individual annuities of £345 million; • Updates to the rate of mortality improvements including CMI 2017 of £251 million; • Refinements to modelling of bulk purchase annuities together with a change to base mortality and improvements of £132 million; and • Other less significant movements of £24 million.
In Ireland and Singapore there was a slight reduction in the reserves of £28 million following a review of recent experience.
In the general insurance and health business, a negative impact of £(54) million (2018: £1 million positive) has arisen primarily as a result of a decrease in the interest rates used to discount claim reserve for both periodic payment orders and latent claims.

Notes to the consolidated financial statements Continued
Aviva plc Annual report and accounts 2019 211
Strategic report Governance IFRS financial statements Other information
49 – Unallocated divisible surplus An unallocated divisible surplus (UDS) is established where the nature of policy benefits is such that the division between shareholder reserves and policyholder liabilities is uncertain at the reporting date. Therefore, the expected duration for settlement of the UDS is undefined.
This note shows the movements in the UDS during the year.
2019
£m 2018
£m
Carrying amount at 1 January 5,949 9,101 Change in participating fund assets 9,411 (4,139) Change in participating fund liabilities (5,426) 902 Change in liability recognised as an expense 3,985 (3,237) Effect of portfolio transfers, acquisition and disposals1 — 48 Foreign exchange rate movements (337) 37
Carrying amount at 31 December 9,597 5,949 1 The movement during 2018 relates to the acquisition of Friends First (£66 million), and the disposal of the remainder of the Spanish business (£18 million).
The amount of UDS at 31 December 2019 has increased to £9.6 billion (2018: £5.9 billion). The increase is mainly due to market movements in Europe as a result of decreasing interest rates, narrowing credit spreads and increasing equity returns.
Where the aggregate amount of participating assets is less than the participating liabilities within a fund then the shortfall may be held as negative UDS, subject to recoverability testing as part of the liability adequacy requirements of IFRS 4. There are no material negative UDS balances at the participating fund-level within each life entity in the current period (2018: £355 million negative UDS within five funds in Italy).

Notes to the consolidated financial statements Continued
Aviva plc Annual report and accounts 2019 212
Strategic report Governance IFRS financial statements Other information
50 – Tax assets and liabilities This note analyses the tax assets and liabilities that appear in the statement of financial position and explains the movements in these balances in the year.
(a) Current tax Current tax assets recoverable and liabilities payable in more than one year are £104 million and £9 million (2018: £24 million and £9 million), respectively.
The Group is party to the CFC & Dividend Group Litigation Order, which challenged the tax treatment of dividends received from non-UK entities before 2009. The Group is attempting to recover claims from HMRC covered by this judgement. The uncertainty in respect of the claims resulted in no recoverable amounts being recognised at 31 December 2018. As a result of recent progress made with the claims a recoverable balance of £99 million is included within current tax assets at 31 December 2019.
(b) Deferred tax (i) The balances at 31 December comprise:
2019
£m 2018
£m
Deferred tax assets 162 185 Deferred tax liabilities (2,155) (1,885) Net deferred tax liability (1,993) (1,700)
Less: Classified as held for sale (11) —
(2,004) (1,700)
Amounts classified as held for sale include £11 million of deferred tax assets. (2018: £nil).
(ii) The net deferred tax liability arises on the following items:
2019
£m 2018
£m
Long-term business technical provisions and other insurance items 1,752 663 Deferred acquisition costs (198) (199) Unrealised gains on investments (2,875) (1,430) Pensions and other post-retirement obligations (425) (499) Unused losses and tax credits 103 147 Subsidiaries, associates and joint ventures (13) (9) Intangibles and additional value of in-force long-term business (413) (475) Provisions and other temporary differences 76 102
Net deferred tax liability (1,993) (1,700)
Less: Classified as held for sale (11) —
(2,004) (1,700)
(iii) The movement in the net deferred tax liability was as follows:
2019
£m 2018
£m
Net liability at 1 January (1,700) (2,416) Adjustment at 1 January for adoption of IFRS 16 24 — Net liability at 1 January restated (1,676) (2,416) Acquisition and disposal of subsidiaries1 — 184 Amounts (charged)/credited to income statement (note 14(a)) (387) 545 Amounts credited/(charged) to other comprehensive income (note 14(b)) 50 (9) Foreign exchange rate movements 23 (10) Other movements (3) 6
Net liability at 31 December (1,993) (1,700) 1 The movement during 2018 relates mainly to the disposal of Avipop Assicurazioni SpA and Avipop Vita SpA.
Deferred tax assets are recognised to the extent that it is probable that future taxable profits will be available against which the temporary differences can be utilised. In entities where there is a history of tax losses, deferred tax assets are only recognised in excess of deferred tax liabilities if there is convincing evidence that future taxable profits will be available. Where this is the case, the directors have relied on business plans supporting future profits.
The Group has unrecognised gross tax losses (excluding capital losses) and other temporary differences of £1,270 million (2018: £798 million) to carry forward against future taxable income of the necessary category in the companies concerned. Of these, trading losses of £38 million will expire within the next 20 years. The remaining losses have no expiry date.
In addition, the Group has unrecognised gross capital losses of £612 million (restated 2018: £604 million). These have no expiry date.
There are no temporary differences in respect of unremitted overseas retained earnings for which deferred tax liabilities have not been recognised at 31 December 2019 (2018: £nil).

Notes to the consolidated financial statements Continued
Aviva plc Annual report and accounts 2019 213
Strategic report Governance IFRS financial statements Other information
51 – Pension deficits and other provisions This note details the non-insurance provisions that the Group holds, and shows the movements in these during the year.
(a) Carrying amounts
2019
£m 2018
£m
Total IAS 19 obligations to main staff pension schemes (note 52(a)) 770 693 Deficits in other staff pension schemes 66 65
Total IAS 19 obligations to staff pension schemes 836 758 Restructuring provisions 29 64 Other provisions 700 577
Total provisions 1,565 1,399
Other provisions primarily include amounts set aside throughout the Group relating to product governance rectification and staff entitlements.
(b) Movements on restructuring and other provisions
2019 2018
Restructuring provisions
£m
Other provisions
£m Total
£m
Restructuring provisions
£m
Other provisions
£m Total
£m
At 1 January 64 577 641 92 515 607 Additional provisions 2 302 304 1 269 270 Provisions released during the period — (57) (57) — (128) (128)
Charge to income statement 2 245 247 1 141 142 Utilised during the year (37) (118) (155) (29) (89) (118) Acquisition of subsidiaries — — — — 5 5 Foreign exchange rate movements — (4) (4) — 5 5
At 31 December 29 700 729 64 577 641
Of the total restructuring and other provisions, £569 million (2018: £402 million) is expected to be settled more than one year after the statement of financial position date.
Other provisions include a £229 million provision (2018: £250 million) in respect of a product governance issue in our UK Life business. This provision relates to a historical issue with over 90% of cases identified being pre-2002 and is limited to advised sales by Friends Provident, where a number of external defined benefit pension arrangements transferred into Friends Provident pension arrangements. We have completed a thorough and detailed review of the suitability of the advice given, and we will ensure that no affected customers are financially disadvantaged. There has been no significant change to the provision estimate or estimation methodology since 31 December 2018. The most significant assumption in relation to the calculation of the provision is the estimated average redress per customer. Each 10% reduction/increase in the average redress per customer would reduce/increase the estimate of the provision by £23 million. The valuation of this provision involves a high degree of judgement due to the time that has elapsed since the advice was given (in particular the assumptions used to calculate how external defined benefit pension arrangements specific to each impacted policyholder would have performed over time), and therefore the possible range of outcomes is significant. The reduction in the value of the provision during 2019 of £21 million is due to utilisation in the period. The issue does not affect any other part of our business. The Group has notified its professional indemnity insurers and intends to make a claim on its insurance to mitigate the financial impact.
Other provisions have increased during the year mainly due to the recognition of a new product governance provision in our UK Life business of £175 million. This provision relates to past communications to a specific sub-set of pension policyholders, that may not have adequately informed them of switching options into with-profit funds that were available to them. This issue is restricted to a product originally sold between 1985 and 1989 and acquired by Aviva through the purchase of Friends Life. It does not affect any other part of our business. We are completing a review to identify and contact affected customers to ensure they are not disadvantaged. The most significant assumption in relation to the calculation of the provision is the estimated rates of customer switching. Each 10% reduction/increase in the rates of switching would reduce/increase the estimate of the provision by £40 million. The valuation of the provision involves a high degree of judgement and estimation uncertainty due to the dependence on decisions made by customers, and therefore the possible range of outcomes is significant.
The remainder of the increase in other provisions of £127 million largely relates to a number of relatively small new provisions including provisions relating to product governance rectification, warranty claims and litigation. This increase is offset by utilisation in the year of £118 million.

Notes to the consolidated financial statements Continued
Aviva plc Annual report and accounts 2019 214
Strategic report Governance IFRS financial statements Other information
52 – Pension obligations (a) Introduction The Group operates a number of defined benefit and defined contribution pension schemes. The material defined benefit schemes are in the UK, Ireland and Canada. The assets and liabilities of these defined benefit schemes as at 31 December 2019 are shown below.
2019 2018
UK £m
Ireland £m
Canada £m
Total £m
UK £m
Ireland £m
Canada £m
Total £m
Total fair value of scheme assets (see b(ii) below) 17,671 833 264 18,768 17,059 775 249 18,083 Present value of defined benefit obligation (15,416) (1,035) (341) (16,792) (14,246) (950) (324) (15,520)
Net IAS 19 surpluses/(deficits) in the schemes 2,255 (202) (77) 1,976 2,813 (175) (75) 2,563 Surpluses included in other assets (note 31) 2,746 — — 2,746 3,256 — — 3,256 Deficits included in provisions (note 51) (491) (202) (77) (770) (443) (175) (75) (693)
Net IAS 19 surpluses/(deficits) in the schemes 2,255 (202) (77) 1,976 2,813 (175) (75) 2,563
This note relates to the defined benefit pension schemes included in the table above. There are a number of smaller schemes that are also measured under IAS 19. These are included as a total within Deficits in other staff pension schemes (see note 51). Similarly, while the charges to the income statement for the main schemes are shown in section (b)(i) below, the total charges for all pension schemes are disclosed in section (d) below.
Under the IAS 19 valuation basis, the Group applies the principles of IFRIC 14, ‘IAS 19 – The Limit on a Defined Benefit Asset, Minimum Funding Requirements and their Interaction’, whereby a surplus is only recognised to the extent that the Company is able to access the surplus either through an unconditional right of refund to the surplus or through reduced future contributions relating to ongoing service, which have been substantively enacted or contractually agreed. The Group has determined that it can derive economic benefit from the surplus in the ASPS via a reduction to future employer contributions for DC members, which could theoretically be paid from the surplus funds in the ASPS. In the RAC and FPPS, the Group has determined that the rules set out in the schemes’ governing documentation provide for an unconditional right to a refund from any future surplus funds in the schemes.
The assets of the UK, Irish and Canadian schemes are held in separate trustee-administered funds to meet long-term pension liabilities to past and present employees. In all schemes, the appointment of trustees of the funds is determined by their trust documentation and they are required to act in the best interests of the schemes’ beneficiaries. The long-term investment objectives of the trustees and the employers are to limit the risk of the assets failing to meet the liabilities of the schemes over the long term, and to maximise returns consistent with an acceptable level of risk so as to control the long-term costs of these schemes.
A funding actuarial valuation of each of the defined benefit schemes is carried out at least every three years for the benefit of scheme trustees and members. Actuarial reports have been submitted for each scheme within this period, using appropriate methods for the respective countries on local funding bases.
The number of scheme members was as follows:
United Kingdom Ireland Canada
2019
Number 2018
Number 2019
Number 2018
Number 2019
Number 2018
Number
Deferred members 45,748 47,977 2,479 2,544 467 519 Pensioners 39,038 38,433 895 897 1,313 1,318
Total members 84,786 86,410 3,374 3,441 1,780 1,837
All schemes are closed to future accrual. Closure of the schemes has removed the volatility associated with additional future accrual for active members.
(i) UK schemes In the UK, the Group operates three main pension schemes, the Aviva Staff Pension Scheme (ASPS), the RAC (2003) Pension Scheme, which was retained after the sale of RAC Limited in September 2011, and the Friends Provident Pension Scheme (FPPS), which was acquired as part of the Friends Life acquisition in 2015. As the defined benefit sections of the UK schemes are now closed to both new members and future accrual, existing deferred members in active service and new entrants participate in the defined contribution section of the ASPS. The UK schemes operate within the UK pensions’ regulatory framework.
(ii) Other schemes In Ireland, the Group operates two main pension schemes, the Aviva Ireland Staff Pension Fund (AISPF) and the Friends First Group Retirement and Death Benefits Scheme (FFPS) which was acquired as part of the Friends First acquisition in June 2018. Future accruals for the AISPF and FFPS schemes ceased with effect from 30 April 2013 and 1 April 2014 respectively. The Irish schemes are regulated by the Pensions Authority in Ireland.
The Canadian defined benefit schemes ceased accruals with effect from 31 December 2011. The main Canadian plan is a Registered Pension Plan in Canada and as such is registered with the Canada Revenue Agency and Financial Services Regulatory Authority of Ontario and is required to comply with the Income Tax Act of Canada and the various provincial Pension Acts within Canada.

Notes to the consolidated financial statements Continued
Aviva plc Annual report and accounts 2019 215
Strategic report Governance IFRS financial statements Other information
52 – Pension obligations continued (b) IAS 19 disclosures Disclosures under IAS 19 for the material defined benefit schemes in the UK, Ireland and Canada are given below. Where schemes provide both defined benefit and defined contribution pensions, the assets and liabilities shown exclude those relating to defined contribution pensions.
(i) Movements in the scheme surpluses and deficits Movements in the pension schemes’ surpluses and deficits comprise:
2019
Fair Value of scheme assets
£m
Present Value of defined
benefit obligation
£m
IAS 19 Pensions net
surplus/ (deficits)
£m
Net IAS 19 surplus in the schemes at 1 January 18,083 (15,520) 2,563 Administrative expenses1 — (19) (19) Total pension cost charged to net operating expenses — (19) (19) Net interest credited/(charged) to investment income/(finance costs)2 479 (406) 73 Total recognised in income 479 (425) 54 Remeasurements: Actual return on these assets 1,141 — 1,141 Less: Interest income on scheme assets (479) — (479) Return on scheme assets excluding amounts in interest income 662 — 662 Losses from change in financial assumptions — (1,824) (1,824) Gains from change in demographic assumptions — 165 165 Experience gains — 130 130 Total recognised in other comprehensive income 662 (1,529) (867) Employer contributions 215 — 215 Plan participant contributions 4 (4) — Benefits paid (612) 612 — Administrative expenses paid from scheme assets1 (19) 19 — Foreign exchange rate movements (44) 55 11 Net IAS 19 surplus in the schemes at 31 December 18,768 (16,792) 1,976 1 Administrative expenses are expensed as incurred. 2 Net interest income of £96 million has been credited to investment income and net interest expense of £23 million has been charged to finance costs (see note 8).
The present value of unfunded post-retirement benefit obligations included in the table above is £118 million at 31 December 2019 (2018: £115 million). During the period the ASPS completed a bulk annuity buy-in transaction with Aviva Life & Pensions UK Limited, a Group Company. Due to different measurement bases applying for accounting purposes, the premium paid by the scheme exceeded the valuation of the plan asset recognised. This is the primary reason for the reduction in the scheme surplus over the year and has been recognised as an actuarial loss in the actual return on assets within other comprehensive income. The plan asset recognised is transferable and so has not been subject to consolidation within the Group’s financial statements.
2018
Fair Value of scheme assets
£m
Present Value of defined
benefit obligation
£m
IAS 19 Pensions net surplus/
(deficits) £m
Net IAS 19 surplus in the schemes at 1 January 18,678 (16,043) 2,635 Past service costs – amendments1 — (63) (63) Administrative expenses2 — (19) (19)
Total pension cost charged to net operating expenses — (82) (82) Net interest credited/(charged) to investment income/(finance costs)3 442 (375) 67 Total recognised in income 442 (457) (15)
Remeasurements: Actual return on these assets (182) — (182) Less: Interest income on scheme assets (442) — (442)
Return on scheme assets excluding amounts in interest income (624) — (624) Gains from change in financial assumptions — 622 622 Losses from change in demographic assumptions — (185) (185) Experience losses — (93) (93) Total recognised in other comprehensive income (624) 344 (280)
Acquisitions 87 (96) (9) Employer contributions 236 — 236 Plan participant contributions 9 (9) — Benefits paid (724) 724 — Administrative expenses paid from scheme assets2 (23) 19 (4) Foreign exchange rate movements 2 (2) —
Net IAS 19 surplus in the schemes at 31 December 18,083 (15,520) 2,563 1 Past service costs include a charge of £63 million relating to the estimated additional liability arising in the UK defined benefit schemes as a result of the requirement to equalise members’ benefits for the effects of Guaranteed
Minimum Pension (GMP). This additional liability has arisen following the High Court judgement in October 2018 in the case involving Lloyds Banking Group. 2 Administrative expenses are expensed as incurred. 3 Net interest income of £89 million has been credited to investment income and net interest expense of £22 million has been charged to finance costs (see note 8).

Notes to the consolidated financial statements Continued
Aviva plc Annual report and accounts 2019 216
Strategic report Governance IFRS financial statements Other information
52 – Pension obligations continued (ii) Scheme assets Scheme assets are stated at their fair values at 31 December 2019.
Total scheme assets are comprised by country as follows:
2019 2018
UK
£m Ireland
£m Canada
£m Total
£m UK
£m Ireland
£m Canada
£m Total
£m
Bonds
Fixed interest 6,745 439 141 7,325 6,121 493 148 6,762 Index-linked 10,598 284 — 10,882 10,409 293 — 10,702
Property 392 — — 392 353 — — 353 Pooled investment vehicles 4,497 283 122 4,902 4,738 555 100 5,393 Derivatives 60 4 — 64 (65) 4 — (61) Insurance Policies 1,977 — — 1,977 776 — — 776 Cash and other1 (5,952) (177) 1 (6,128) (4,653) (570) 1 (5,222)
Total fair value of scheme assets 18,317 833 264 19,414 17,679 775 249 18,703 Less: consolidation elimination for non-transferable Group
insurance policy2 (646) — — (646) (620) — — (620)
Total IAS 19 fair value of scheme assets 17,671 833 264 18,768 17,059 775 249 18,083 1 Cash and other assets comprise cash at bank, receivables, payables and repurchase agreements. At 31 December 2019, cash and other assets primarily consist of repurchase agreements of £3,078 million (2018: £3,741 million). 2 As at 31 December 2019, the FPPS asset includes an insurance policy of £646 million (2018: £620 million) issued by a Group company that is not transferable under IAS 19 and is consequently eliminated from the Group’s IAS 19
scheme assets. Insurance policies issued by other Group companies of £1,331 million as at 31 December 2019 (2018: £156 million) included in the ASPS asset are transferable and so are not subject to consolidation.
IAS 19 plan assets include investments in Group-managed funds in the consolidated statement of financial position of £2,575 million (2018: £2,730 million) and transferable insurance policies with other Group companies of £1,331 million (2018: £156 million) in the ASPS. Where the investments are in segregated funds with specific asset allocations, they are included in the appropriate line in the table above, otherwise they appear in ‘Cash and other’. There are no significant judgements involved in the valuation of the scheme assets. Insurance policies are valued on the same basis as the pension scheme liabilities, as required by IAS19.
(iii) Assumptions on scheme liabilities The valuations used for accounting under IAS 19 have been based on the most recent funding actuarial valuations, updated to take account of the standard’s requirements in order to assess the liabilities of the material schemes at 31 December 2019.
The projected unit credit method The inherent uncertainties affecting the measurement of scheme liabilities require these to be measured on an actuarial basis. This involves discounting the best estimate of future cash flows to be paid out by the scheme using the projected unit credit method. This is an accrued benefits valuation method which calculates the past service liability to members and makes allowance for their projected future earnings. It is based on a number of actuarial assumptions, which vary according to the economic conditions of the countries in which the relevant businesses are situated, and changes in these assumptions can materially affect the measurement of the pension obligations.

Notes to the consolidated financial statements Continued
Aviva plc Annual report and accounts 2019 217
Strategic report Governance IFRS financial statements Other information
52 – Pension obligations continued Financial assumptions The main financial assumptions used to calculate scheme liabilities under IAS 19 are:
UK Ireland Canada
2019 2018 2019 2018 2019 2018
Inflation rate1 3.0%/2.2% 3.3%/2.2% 1.5% 1.6% 2.0% 2.0% General salary increases2 4.8% 5.1% 3.0% 3.1% 2.5% 2.5% Pension increases3 3.0%/2.2% 3.3%/2.2% 0.35% 0.4% 1.25% 1.25% Deferred pension increases3 3.0%/2.2% 3.3%/2.2% 1.5% 1.6% — — Discount rate4, 5 1.9% (non-insured members)
1.9% (insured members – ASPS) 1.8% (insured members – FPPS)
2.7%/ 2.6%(pensioners)/
2.7%(deferred)
1.1%/1.2% 1.8%/1.9% 3.00% 3.75%
Basis of discount rate AA-rated corporate bonds AA-rated corporate bonds AA-rated corporate bonds
1 For the UK schemes, assumptions are provided for RPI/CPI. In the UK, relevant RPI/CPI swap curves are used, which are equivalent to the single rates shown. In 2019, CPI is now derived as RPI less 100bps pre 2030 and RPI less 60bps post 2030 (2018: RPI less 110bps at all terms).
2 In the UK, the only remaining linkage between pension benefits and general salary increases is in respect of a small amount of Guaranteed Minimum Pension benefits, in line with National Average Earnings. 3 For the UK schemes, assumptions are provided for RPI/CPI. In the UK, relevant RPI/CPI swap curves are used, which are equivalent to the single rates shown. The assumptions are also adjusted to reflect the relevant caps/floors
and the inflation volatility. 4 To calculate scheme liabilities in the UK, a single discount rate is used in the RAC scheme, whereas for ASPS and FPPS, separate discount rates are used for the defined benefit obligation for members included / not included in
annuity policies held by the scheme. 5 For the Irish schemes, a discount rate of 1.1% and 1.2% is used for AISPF and FFPS respectively, reflecting the differences in the duration of the liabilities between the two schemes.
The discount rate and pension increase rate are the two assumptions that have the largest impact on the value of the liabilities, with the difference between them being known as the net discount rate. For each country, the discount rate is based on current average yields of high-quality debt instruments taking account of the maturities of the defined benefit obligations.
Mortality assumptions Mortality assumptions are material in measuring the Group’s obligations under its defined benefit schemes. The assumptions used are summarised in the table below and have been selected to reflect the characteristics and experience of the membership of these schemes.
The mortality tables, average life expectancy and pension duration used at 31 December 2019 for scheme members are as follows:
Life expectancy/(pension
duration) at NRA of a male Life expectancy/(pension
duration) at NRA of a female
Mortality table
Normal retirement age
(NRA) Currently aged
NRA
20 years younger than
NRA Currently aged
NRA
20 years younger than
NRA
UK – ASPS
SAPS tables as a proxy for Club Vita pooled experience, including an allowance for future improvements 60 88.2 90.0 89.6 91.9
(28.2) (30.0) (29.6) (31.9) – RAC SAPS, including allowances for future improvement 65 86.9 88.9 89.5 91.4 (21.9) (23.9) (24.5) (26.4) – FPPS SAPS, including allowances for future improvement 60 87.6 90.0 90.1 92.2 (27.6) (30.0) (30.1) (32.2)
Ireland – AISPF 73%/81% PNA00 with allowance for future improvements 61 89.7 92.7 91.4 94.3 (28.7) (31.7) (30.4) (33.3)
– FFPS 88%/91% ILT15 with allowance for future improvements 65 86.6 89.0 89.0 91.1 (21.6) (24.0) (24.0) (26.1)
Canada Canadian Pensioners’ Mortality 2014 Private Table, including allowance for future improvements 65 87.0 88.5 89.5 90.9
(22.0) (23.5) (24.5) (25.9)
The assumptions above are based on commonly used mortality tables. The tables make allowance for observed variations in such factors as age, gender, pension amount, salary and postcode-based lifestyle group, and have been adjusted to reflect recent research into mortality experience. However, the extent of future improvements in longevity is subject to considerable uncertainty and judgement is required in setting this assumption. For the ASPS, which is the most material scheme to the Group, the allowance for mortality improvement is per the actuarial profession’s ‘CMI_2018 (S=7.25) Advanced with adjustments’ model (2018: ‘CMI_2017 (S=7.5) Advanced with adjustments’), with a long-term improvement rate of 1.75% per annum (2018: 1.75% per annum) for males and 1.5% per annum (2018: 1.5% per annum) for females. The CMI_2018 tables have been adjusted by adding 0.25% per annum (2018: 0.25% per annum) and 0.35% per annum (2018: 0.35% per annum) to the initial rate of mortality improvements for males and females respectively (to allow for greater mortality improvements in the pension scheme membership relative to the general population on which CMI_2018 is based), and uses the advanced parameters to taper the long-term improvement rates to zero between ages 90 and 115 (2018: long-term improvement rates taper to zero between ages 90 and 115) (the ‘core’ parameters taper the long-term improvement rates to zero between ages 85 and 110).

Notes to the consolidated financial statements Continued
Aviva plc Annual report and accounts 2019 218
Strategic report Governance IFRS financial statements Other information
52 – Pension obligations continued Sensitivity analysis Significant actuarial assumptions for the determination of the defined benefit obligation are discount rate, inflation rate and mortality. The sensitivity analysis below has been determined by changing the respective assumptions while holding all other assumptions constant. The following table summarises how the defined benefit obligation would have increased/(decreased) as a result of the change in the respective assumptions:
Impact on present value of defined benefit obligation
Increase in discount rate
+1% £m
Decrease in discount rate
-1% £m
Increase in inflation rate
+1% £m
Decrease in inflation rate
-1% £m
1 year younger1
£m
Impact on present value of defined benefit obligation at 31 December 2019 (2,786) 3,713 2,627 (2,037) 613 Impact on present value of defined benefit obligation at 31 December 2018 (2,502) 3,317 2,275 (1,788) 536 1 The effect of assuming all members in the schemes were one year younger.
It is unlikely that the changes in assumptions would occur in isolation of one another as some of the assumptions may be correlated. Furthermore, the present value of the defined benefit obligation has been calculated using the projected unit credit method, which is the same as that applied in calculating the defined benefit obligation recognised within the consolidated statement of financial position. In addition, the sensitivities shown are for liabilities only and ignore the impact on assets, which would significantly mitigate the net interest rate and inflation sensitivity impact on the net surplus, as well as the longevity sensitivity impact due to the insurance policy and longevity swap assets held by the UK schemes.
Maturity profile of the defined benefit obligation The discounted scheme liabilities have an average duration of 19 years in ASPS, 21 years in FPPS, 19 years in the RAC scheme, 19 years in AISPF, 28 years in FFPS and 11 years in the Canadian scheme. The expected undiscounted benefits payable from the main UK defined benefit scheme, ASPS, is shown in the chart below:
Undiscounted benefit payments (£m)
(iv) Risk management and asset allocation strategy As noted above, the investment objectives of the trustees and the employers are to limit the risk of the assets failing to meet the liabilities of the schemes over the long-term, and to maximise returns consistent with an acceptable level of risk so as to control the long-term costs of these schemes. To meet these objectives, the schemes’ assets are invested in a portfolio, consisting primarily of debt securities as detailed in section (b)(ii). The investment strategy will continue to evolve over time and is expected to match the liability profile increasingly closely with swap overlays to improve interest rate and inflation matching. The schemes are generally matched to interest rate risk relative to the funding bases.
Main UK scheme The Company works closely with the trustee, who is required to consult with the Company on the investment strategy.
Interest rate and inflation rate risks are managed using a combination of liability-matching assets and swaps. Exposure to equity risk has been reducing over time and credit risk is managed within risk appetite. Currency risk is relatively small and is largely hedged. The other principal risk is longevity risk. This risk has reduced due to the ASPS entering into a longevity swap in 2014 covering approximately £5 billion of pensioner in payment scheme liabilities.
In October 2019 the ASPS completed a bulk annuity buy-in transaction with Aviva Life & Pensions UK Limited, a Group Company. This covered approximately £1.1 billion of liabilities related to deferred pensioners and current pensioners, removing the investment and longevity risk for these members from the scheme.
Other schemes The other schemes are considerably less material but their risks are managed in a similar way to those in the main UK scheme. In 2015, the RAC pension scheme entered into a longevity swap covering approximately £0.6 billion of pensioner in payment scheme liabilities.
2020 2048 2078 2118
Deferred member cash flows Pensioner cash flows
400
500
0
100
200
300

Notes to the consolidated financial statements Continued
Aviva plc Annual report and accounts 2019 219
Strategic report Governance IFRS financial statements Other information
52 – Pension obligations continued (v) Funding Formal actuarial valuations normally take place every three years and where there is a deficit, the Group and the trustees would agree a deficit recovery plan. The assumptions adopted for triennial actuarial valuations are determined by the trustees and agreed with the Group and are normally more prudent than the assumptions adopted for IAS19 purposes, which are best estimate.
For the ASPS, following the latest formal actuarial valuation (with an effective date of 31 March 2018) a schedule of contributions was agreed with the trustees, even though the ASPS was fully funded on its technical provisions basis consistent with the requirements of the UK pension regulations.
Total employer contributions for all defined benefit schemes in 2020 are currently expected to be £0.2 billion.
(c) Defined contribution (money purchase) section of the ASPS The trustees have responsibility for selecting a range of suitable funds in which the members can choose to invest and for monitoring the performance of the available investment funds. Members are responsible for reviewing the level of contributions they pay and the choice of investment fund to ensure these are appropriate to their risk appetite and their retirement plans. Members of this section contribute at least 2% of their pensionable salaries, and depending on the percentage chosen, the Group contributes up to a maximum 14%, together with the cost of the death-in-service benefits. These contribution rates remained unchanged until June 2017. From 1 July 2017, for every 1% additional employee contribution, the Group will contribute an additional 0.1% employer contribution. The amount recognised as an expense for defined contribution schemes is shown in section (d) below.
(d) Charge to staff costs in the income statement The total pension charge to staff costs for all of the Group’s defined benefit and defined contribution schemes were:
2019
£m 2018
£m
Continuing operations UK defined benefit schemes 21 22 Overseas defined benefit schemes 1 1
Total defined benefit schemes (note 11(b)) 22 23 UK defined contribution schemes 143 143 Overseas defined contribution schemes 21 20
Total defined contribution schemes (note 11(b)) 164 163
Total charge for pension schemes 186 186
There were no significant contributions payable or prepaid in the consolidated statement of financial position as at either 31 December 2019 or 2018.

Notes to the consolidated financial statements Continued
Aviva plc Annual report and accounts 2019 220
Strategic report Governance IFRS financial statements Other information
53 – Borrowings Our borrowings are classified as either core structural borrowings, which are included within the Group’s capital employed, or operational borrowings drawn by operating subsidiaries. This note shows the carrying values and contractual maturity amounts of each type, and explains their main features and movements during the year.
(a) Analysis of total borrowings Total borrowings comprise:
2019
£m 2018
£m
Core structural borrowings, at amortised cost 7,496 7,699 Operational borrowings, at amortised cost 338 496 Operational borrowings, at fair value 1,233 1,225 1,571 1,721 9,067 9,420 Less: Liabilities classified as held for sale (28) —
9,039 9,420
(b) Core structural borrowings (i) The carrying amounts of these borrowings are:
2019
£m 2018
£m
Subordinated debt 6.125% £700 million subordinated notes 2036 695 694 6.125% £800 million undated subordinated notes 797 797 6.875% £600 million subordinated notes 2058 594 594 12.000% £162 million subordinated notes 2021 179 191 8.250% £500 million subordinated notes 2022 545 563 6.625% £450 million subordinated notes 2041 449 449 6.125% €650 million subordinated notes 2043 549 582 3.875% €700 million subordinated notes 2044 591 625 5.125% £400 million subordinated notes 2050 395 395 3.375% €900 million subordinated notes 2045 756 799 4.500% C$450 million subordinated notes 2021 261 257 4.375% £400 million subordinated notes 2049 395 394
6,206 6,340 Senior notes 0.625% €500 million senior notes 2023 422 446 1.875% €750 million senior notes 2027 630 667
1,052 1,113
Commercial paper 238 251
7,496 7,704
Less: Amount held by Group companies — (5)
Total 7,496 7,699

Notes to the consolidated financial statements Continued
Aviva plc Annual report and accounts 2019 221
Strategic report Governance IFRS financial statements Other information
53 – Borrowings continued (ii) The contractual maturity dates of undiscounted cash flows for these borrowings are:
2019
£m 2018
£m
Principal
£m Interest
£m Total
£m Principal
£m Interest
£m Total
£m
Within one year 238 372 610 251 376 627 1 to 5 years 1,347 1,255 2,602 1,370 1,353 2,723 5 to 10 years 636 1,451 2,087 673 1,490 2,163 10 to 15 years — 1,417 1,417 — 1,441 1,441 Over 15 years 5,257 2,636 7,893 5,365 2,923 8,288
Total contractual undiscounted cash flows 7,478 7,131 14,609 7,659 7,583 15,242
Borrowings are considered current if the contractual maturity dates are within a year. Where subordinated debt is undated or loan notes are perpetual, the interest payments have not been included beyond 15 years. Annual interest payments in future years for these borrowings are £49 million (2018: £49 million).
Contractual undiscounted interest payments are calculated based on underlying fixed interest rates or prevailing market floating rates as applicable. Year-end exchange rates have been used for interest projections on loans in foreign currencies.
(c) Operational borrowings (i) The carrying amounts of these borrowings are:
2019
£m 2018
£m
Amounts owed to financial institutions Loans 338 496
Securitised mortgage loan notes UK lifetime mortgage business (note 26(b)) 1,233 1,225
Total 1,571 1,721
All the above borrowings are stated at amortised cost, except for the loan notes issued in connection with the UK lifetime mortgage business of £1,233 million (2018: £1,225 million). These loan notes are carried at fair value, their values are modelled on risk-adjusted cash flows for defaults discounted at a risk-free rate plus a market-determined liquidity premium, and are therefore classified as ‘Level 3’ in the fair value hierarchy. The risk allowances are consistent with those used in the fair value asset methodology, as described in note 24. These have been designated at fair value through profit and loss in order to present the relevant mortgages, borrowings and derivative financial instruments at fair value, since they are managed as a portfolio on a fair value basis. This presentation provides more relevant information and eliminates any accounting mismatch.
The securitised mortgage loan notes are at various fixed, floating and index-linked rates. Further details about these notes are given in note 26.
(ii) The contractual maturity dates of undiscounted cash flows for these borrowings are:
2019
£m 2018
£m
Principal
£m Interest
£m Total
£m Principal
£m Interest
£m Total
£m
Within one year 294 46 340 257 49 306 1 to 5 years 392 173 565 535 185 720 5 to 10 years 559 148 707 555 163 718 10 to 15 years 59 116 175 180 142 322 Over 15 years 212 109 321 136 154 290
Total contractual undiscounted cash flows 1,516 592 2,108 1,663 693 2,356
Contractual undiscounted interest payments are calculated based on underlying fixed interest rates or prevailing market floating rates as applicable. Year-end exchange rates have been used for interest projections on loans in foreign currencies.

Notes to the consolidated financial statements Continued
Aviva plc Annual report and accounts 2019 222
Strategic report Governance IFRS financial statements Other information
53 – Borrowings continued (d) Description and features (i) Subordinated debt A description of each of the subordinated notes is set out in the table below:
Notional amount Issue date Redemption date Callable at par at option of the
Company from In the event the Company does not call the notes, the
coupon will reset at each applicable reset date to
£700 million 14 Nov 2001 14 Nov 2036 16 Nov 2026 5 year Benchmark Gilt + 2.85% £800 million 29 Sep 2003 Undated 29 Sep 2022 5 year Benchmark Gilt + 2.40% £600 million 20 May 2008 20 May 2058 20 May 2038 3 month LIBOR + 3.26% £162 million 21 May 2009 21 May 2021 N/A N/A £500 million 21 April 2011 21 April 2022 N/A N/A £450 million 26 May 2011 3 June 2041 3 June 2021 6 Month LIBOR + 4.136% €650 million 5 July 2013 5 July 2043 5 July 2023 5 year EUR mid-swaps + 5.13% €700 million 3 July 2014 3 July 2044 3 July 2024 5 year EUR mid-swaps + 3.48% £400 million 4 June 2015 4 June 2050 4 December 2030 3 month LIBOR + 4.022% €900 million 4 June 2015 4 December 2045 4 December 2025 3 month Euribor + 3.55% C$450 million 9 May 2016 10 May 2021 N/A N/A £400 million 12 September 2016 12 September 2049 12 September 2029 3 month LIBOR + 4.721%
Subordinated notes issued by the Company rank below its senior obligations and ahead of its preference shares and ordinary share capital. The dated subordinated notes rank ahead of the undated subordinated notes. The fair value of notes at 31 December 2019 was £7,211 million (2018: £6,610 million), calculated with reference to quoted prices.
(ii) Senior notes All senior notes are at fixed rates and their total fair value at 31 December 2019 was £1,134 million (2018: £1,113 million).
(iii) Commercial paper The commercial paper consists of £238 million issued by the Company (2018: £251 million) and is considered core structural funding. The fair value of the commercial paper is considered to be the same as its carrying value and all issuances are repayable within one year.
(iv) Loans Loans owed to financial institutions comprise:
2019
£m 2018
£m
Non-recourse Loans to property partnerships 64 61 UK Life reassurance — 177 Other non-recourse loans 52 52
116 290 Other loans 222 206
338 496
As explained in accounting policy D, the UK long-term business policyholder funds have invested in a number of property funds and structures (the ‘Property Funds’), some of which have raised external debt, secured on the relevant Property Fund’s property portfolio. The lenders are only entitled to obtain payment of interest and principal to the extent there are sufficient resources in the relevant Property Fund and they have no recourse whatsoever to the policyholder or shareholders’ funds of any companies in the Group. Loans of £64 million (2018: £61 million) included in the table above relate to Property Funds.
At 31 December 2019 the obligations to repay third parties arising out of financial reinsurance operations were nil (2018: £177 million).
Other non-recourse loans primarily include external debt raised by special purpose vehicles in the UK long-term business. The lenders have no recourse whatsoever to the shareholders’ funds of any companies in the Group. The outstanding balance of these loans at 31 December 2019 was £52 million (2018: £52 million).
Other loans of £222 million (2018: £206 million) include external debt raised by overseas long-term businesses to fund operations.
(v) Securitised mortgage loan notes Loan notes have been issued by special purpose securitisation companies in the UK. Details are given in note 26.

Notes to the consolidated financial statements Continued
Aviva plc Annual report and accounts 2019 223
Strategic report Governance IFRS financial statements Other information
53 – Borrowings continued (e) Movements during the year Movements in borrowings during the year were:
2019
£m 2018
£m
Core Structural
£m Operational
£m Total
£m Core Structural
£m Operational
£m Total
£m
New borrowings drawn down, excluding commercial paper, net of expenses — 75 75 649 126 775 Repayment of borrowings, excluding commercial paper1 (210) (231) (441) (1,178) (211) (1,389) Movement in commercial paper2 19 — 19 (419) — (419) Net cash outflow (191) (156) (347) (948) (85) (1,033) Foreign exchange rate movements (204) (28) (232) 42 6 48 Borrowings reclassified/(loans repaid) for non-cash consideration1 210 (4) 206 — 65 65 Fair value movements — 38 38 — 89 89 Amortisation of discounts and other non-cash items (23) — (23) (35) — (35) Movements in debt held by Group companies3 5 — 5 — — —
Movements in the year (203) (150) (353) (941) 75 (866) Balance at 1 January 7,699 1,721 9,420 8,640 1,646 10,286 Balance at 31 December 7,496 1,571 9,067 7,699 1,721 9,420 1 On 17 October 2019, notification was given that the Group would redeem the 6.875% £210 million tier 1 notes. At that date, the instruments were reclassified as a financial liability of £210 million, representing the fair value at
that date. On 21 November 2019 the instruments were redeemed in full at a cost of £210 million. The difference of £21 million between the carrying amount of £231 million and fair value of £210 million has been charged to retained earnings. See note 37 for further details.
2 Gross issuances of commercial paper were £505 million in 2019 (2018: £2,372 million), offset by repayments of £486 million (2018: £2,791 million). 3 Certain subsidiary companies have purchased subordinated notes and securitised loan notes issued by Group companies as part of their investment portfolios. In the consolidated statement of financial position, borrowings
are shown net of these holdings but movements in such holdings over the year are reflected in the tables above.
All movements in fair value in 2018 and 2019 on securitised mortgage loan notes designated as fair value through profit or loss were attributable to changes in market conditions.
(f) Undrawn borrowings The Group has the following undrawn committed central borrowing facilities available to them, which are used to support the commercial paper programme:
2019
£m 2018
£m
Expiring within one year — — Expiring beyond one year 1,650 1,650
1,650 1,650
54 – Payables and other financial liabilities This note analyses our payables and other financial liabilities at the end of the year.
2019
£m
Restated1
2018 £m
Payables arising out of direct insurance 1,503 1,374 Payables arising out of reinsurance operations 348 464 Deposits and advances received from reinsurers 78 129 Bank overdrafts (see below) 870 563 Derivative liabilities (note 61) 6,517 6,478 Amounts due to brokers for investment purchases 314 240 Obligations for repayment of cash collateral received 6,329 6,714 Lease liabilities (note 23(iii)) 572 — Other financial liabilities 1,634 1,745
Total 18,165 17,707
Less: Liabilities classified as held for sale (27) (26)
18,138 17,681
Expected to be settled within one year 13,856 11,599 Expected to be settled in more than one year 4,309 6,108
18,165 17,707 1 Following a review of the Group’s presentation of consolidated investment funds, comparative amounts have been restated from those previously reported. The restatement has had no impact on the profit for the year or equity.
See note 1(a) for further information.
Bank overdrafts amount to £536 million (2018: £153 million) in life business operations and £334 million (2018: £410 million) in general insurance business and other operations.
All payables and other financial liabilities are carried at cost, which approximates to fair value, except for derivative liabilities which are carried at their fair values and lease liabilities which are carried at the present value of the outstanding lease payments.

Notes to the consolidated financial statements Continued
Aviva plc Annual report and accounts 2019 224
Strategic report Governance IFRS financial statements Other information
55 – Other liabilities This note analyses our other liabilities at the end of the year.
2019
£m
Restated1
2018 £m
Deferred income 135 138 Reinsurers’ share of deferred acquisition costs 23 19 Accruals 1,197 1,265 Other liabilities 1,799 1,685
Total 3,154 3,107
Less: Liabilities as held for sale (60) (33)
3,094 3,074
Expected to be settled within one year 2,399 2,482 Expected to be settled in more than one year 755 625 3,154 3,107 1 Following a review of the Group’s presentation of consolidated investment funds, comparative amounts have been restated from those previously reported. The restatement has had no impact on the profit for the year or equity.
See note 1(a) for further information.
56 – Contingent liabilities and other risk factors This note sets out the main areas of uncertainty over the calculation of our liabilities.
(a) Uncertainty over claims provisions Note 44 gives details of the estimation techniques used by the Group to determine the general insurance business outstanding claims provisions and of the methodology and assumptions used in determining the long-term business provisions. These approaches are designed to allow for the appropriate cost of policy-related liabilities, with a degree of prudence, to give a result within the normal range of outcomes. However, the actual cost of settling these liabilities may differ, for example because experience may be worse than that assumed, or future general insurance business claims inflation may differ from that expected, and hence there is uncertainty in respect of these liabilities.
(b) Asbestos, pollution and social environmental hazards In the course of conducting insurance business, various companies within the Group receive general insurance liability claims, and become involved in actual or threatened related litigation arising therefrom, including claims in respect of pollution and other environmental hazards. Amongst these are claims in respect of asbestos production and handling in various jurisdictions, including Europe, Canada and Australia. Given the significant delays that are experienced in the notification of these claims, the potential number of incidents they cover and the uncertainties associated with establishing liability, the ultimate cost cannot be determined with certainty. However, on the basis of current information having regard to the level of provisions made for general insurance claims and substantial reinsurance cover now in place, the directors consider that any additional costs arising are not likely to have a material impact on the financial position of the Group.
(c) Guarantees on long-term savings products As a normal part of their operating activities, various Group companies have given guarantees and options, including interest rate guarantees, in respect of certain long-term insurance and investment products. Note 46 gives details of these guarantees and options. In providing these guarantees and options, the Group’s capital position is sensitive to fluctuations in financial variables including foreign currency exchange rates, interest rates, property values and equity prices. Interest rate guaranteed returns, such as those available on guaranteed annuity options, are sensitive to interest rates falling below the guaranteed level. Other guarantees, such as maturity value guarantees and guarantees in relation to minimum rates of return, are sensitive to fluctuations in the investment return below the level assumed when the guarantee was made. The directors continue to believe that the existing provisions for such guarantees and options are sufficient.
(d) Regulatory compliance The Group’s insurance and investment business is subject to local regulation in each of the countries in which it operates. A number of the Group’s UK subsidiaries are dual regulated (directly authorised by both the PRA (for prudential regulation) and the FCA (for conduct regulation)) while others are solo regulated (regulated solely by the FCA for both prudential and conduct regulation). Between them, the PRA and FCA have broad powers including the authority to grant, vary the terms of, or cancel a regulated firm’s authorisation; to investigate marketing and sales practices; and to require the maintenance of adequate financial resources. The Group’s regulators outside the UK typically have similar powers, but in some cases they also operate a system of ‘prior product approval’.
The Group’s regulated businesses have compliance resources to respond to regulatory enquiries in a constructive way, and take corrective action when warranted. However, all regulated financial services companies face the risk that their regulator could find that they have failed to comply with applicable regulations or have not undertaken corrective action as required.
The impact of any such finding (whether in the UK or overseas) could have a negative impact on the Group’s reported results or on its relations with current and potential customers. Regulatory action against a member of the Group could result in adverse publicity for, or negative perceptions regarding, the Group, or could have a material adverse effect on the business of the Group, its results, operations and/or financial condition and divert management’s attention from the day-to-day management of the business.

Notes to the consolidated financial statements Continued
Aviva plc Annual report and accounts 2019 225
Strategic report Governance IFRS financial statements Other information
56 – Contingent liabilities and other risk factors continued (e) Structured settlements The Group has purchased annuities from licensed Canadian life insurers to provide for fixed and recurring payments to claimants. As a result of these arrangements, the Group is exposed to credit risk to the extent that any of the life insurers fail to fulfill their obligations. The Group’s maximum exposure to credit risk for these types of arrangements is approximately £707 million as at 31 December 2019 (2018: £710 million). Credit risk is managed by acquiring annuities from a diverse portfolio of life insurers with proven financial stability. This risk is reduced to the extent of coverage provided by Assuris, the Canadian life insurance industry compensation plan. As at 31 December 2019, no information has come to the Group’s attention that would suggest any weakness or failure in life insurers from which it has purchased annuities and consequently no provision for credit risk is required.
(f) Other In the course of conducting insurance and investment business, various Group companies receive liability claims, and become involved in actual or threatened related litigation. In the opinion of the directors, adequate provisions have been established for such claims and no material loss will arise in this respect.
In addition, in line with standard business practice, various Group companies have given guarantees, indemnities and warranties in connection with disposals in recent years of subsidiaries and associates to parties outside the Aviva Group. In the opinion of the directors, no material unprovisioned loss will arise in respect of these guarantees, indemnities and warranties.
There are a number of charges registered over the assets of Group companies in favour of other Group companies or third parties. In addition, certain of the Company’s assets are charged in favour of certain of its subsidiaries as security for intra-Group loans.
57 – Capital commitments This note gives details of our commitments to capital expenditure. See note 23 for further information on lease commitments.
Contractual commitments for acquisitions or capital expenditures of infrastructure loans, equity funds, investment property and property and equipment, which have not been recognised in the financial statements, are as follows:
2019
£m 2018
£m
Infrastructure loan advances 853 898 Investment property 115 42 Property and equipment 62 77 Other investment vehicles1 241 266
1,271 1,283 1 Represents commitments for further investment in certain private equity vehicles. Such commitments do not expose the Group to the risk of future losses in excess of its investment.
Notes 19 and 20 set out the commitments the Group has to its joint ventures and associates.
58 – Group capital management (a) Group capital The Group is required to measure and monitor its capital resources on a regulatory basis and to comply with the minimum capital requirements of regulators in each territory in which it operates. At a Group level, we have to comply with the requirements established by the Solvency II Framework Directive, as adopted by the PRA at the balance sheet date.
The Group Solvency II capital requirements are calculated using a Partial Internal Model (PIM) which assesses the risks the Group is exposed to on an Internal Model basis approved by the PRA. The Solvency II capital regime requires insurers to calculate regulatory capital adequacy at both individual regulated subsidiaries and an aggregate Group level. Non-EEA entities have been included in Group solvency in line with Solvency II requirements. Other financial sector entities (including fund management) are included at their proportional share of the capital requirement according to the relevant sectoral values. In addition, non-EEA businesses including Canada, Hong Kong and Singapore, are subject to the locally applicable capital requirements in the jurisdictions in which they operate.
At our Capital Markets Day in November 2019, we announced robust financial targets focussed on economic value. However, Group capital continues to be represented by Solvency II own funds. The Solvency II position disclosed is based on a ‘shareholder view’. The shareholder view is considered by management to be more representative of the shareholders’ risk exposure and the Group’s ability to cover the solvency capital requirement (SCR) with eligible own funds and aligns with management’s approach to dynamically manage its capital position.

Notes to the consolidated financial statements Continued
Aviva plc Annual report and accounts 2019 226
Strategic report Governance IFRS financial statements Other information
58 – Group capital management continued In arriving at the shareholder position, the following adjustments are typically made to the regulatory Solvency II own funds: • The contribution to the Group’s SCR and own funds of the most material fully ring fenced with-profits funds of £2,501 million at 31 December
2019 (2018: £2,634 million) and staff pension schemes in surplus of £1,181 million at 31 December 2019 (2018: £1,142 million) are excluded. These exclusions have no impact on Solvency II surplus as these funds are self-supporting on a Solvency II capital basis with any surplus capital above SCR not recognised.
• A notional reset of the transitional measure on technical provisions (TMTP), calculated using the same method as used for formal TMTP resets. This presentation avoids step changes to the Solvency II position that arise only when the formal TMTP reset points are triggered. The 31 December 2019 position is based on a formal reset of the TMTP, in line with the requirement to reset the TMTP at least every two years and hence no adjustment is required. The 31 December 2018 Solvency II position includes a notional reset (£127 million reduction in own funds). The TMTP is amortised on a straight-line basis over 16 years from 1 January 2016 in line with the Solvency II rules.
• The 31 December 2019 Solvency II position includes three pro forma adjustments. These relate to the disposal of FPI (£111 million reduction in own funds), the disposal of Hong Kong (£6 million reduction in own funds) and the potential impact of an expected change to Solvency II regulations on the treatment of equity release mortgages (£nil impact on own funds). The 31 December 2018 Solvency II position includes the pro forma impact of the disposals of FPI (£113 million reduction in own funds) and the potential impact of an expected change to Solvency II regulations on the treatment of equity release mortgages (£nil impact on own funds).
Own funds 2019
£m
Own funds 2018
£m
Estimated Solvency II regulatory own funds as at 31 December1 28,347 27,567 Adjustments for: Fully ring-fenced with-profits funds (2,501) (2,634) Staff pension schemes in surplus (1,181) (1,142) Notional reset of TMTP — (127) Pro forma adjustments (117) (113) Estimated Solvency II shareholder own funds at 31 December 24,548 23,551 1 Regulation was introduced in France that allows French insurers to place the Provision pour Participation aux Excedents (PPE) into Solvency II own funds. The PPE has been included in the France local regulatory own funds in
2019 but it is not included in the Group regulatory own funds.
Solvency II own funds are comprised of a combination of shareholders’ funds, preference share capital, direct capital instruments, tier 1 notes, subordinated debt, and deferred tax assets measured on a Solvency II basis. During the year, the Group redeemed its £210 million 6.875% Step-Up Tier I Insurance Capital Securities subordinated debt instruments in full.
Solvency II surplus at the Group level represents the excess of eligible Solvency II own funds over the Group’s solvency capital requirements calculated in accordance with Solvency II requirements. The Group maintained capital in excess of the SCR at all times during 2019. All regulated subsidiaries complied with their capital requirements throughout the year.
Further information on the Group’s Solvency II position (shareholder view), including a reconciliation between IFRS equity and own funds can be found in the Other information section. This information is estimated and is therefore subject to change. It is also unaudited.
(b) Risks and capital management objectives The primary objective of capital management is to maintain an efficient capital structure, in a manner consistent with our risk profile and the regulatory and market requirements of our business. Capital is a primary consideration across a wide range of business activities, including product development, pricing, business planning, merger and acquisition transactions and asset and liability management. A Capital Management Standard, applicable Group-wide, sets out minimum standards and guidelines over responsibility for capital management including considerations for capital management decisions and requirements for management information, capital monitoring, reporting, forecasting, planning and overall governance.
The Group manages capital in conjunction with solvency capital requirements, and seeks to, on a consistent basis: • Match the profile of our assets and liabilities, taking into account the risks inherent in each business; • Maintain sufficient, but not excessive, financial strength in accordance with risk appetite, to support new business growth and satisfy the
requirements of our regulators and other stakeholders giving both our customers and shareholders assurance of our financial strength. See note 60 for more information about the Group’s risk management approach;
• Retain financial flexibility by maintaining strong liquidity, access to a range of capital markets and significant unutilised committed credit lines;
• Allocate capital rigorously to support value adding growth and repatriate excess capital where appropriate; and • Declare dividends with reference to factors including growth in cash flow and earnings.

Notes to the consolidated financial statements Continued
Aviva plc Annual report and accounts 2019 227
Strategic report Governance IFRS financial statements Other information
59 – Statement of cash flows This note gives further detail behind the figures in the statement of cash flows.
(a) The reconciliation of profit before tax to the net cash inflow from operating activities is:
2019
£m
Restated1 2018
£m
Profit before tax 3,933 1,652 Adjustments for: Share of profits of joint ventures and associates (85) (112) Dividends received from joint ventures and associates 81 43 (Profit)/loss on sale of:
Investment property (58) (69) Property and equipment 2 1 Subsidiaries, joint ventures and associates 22 (102) Investments (10,537) (7,319)
(10,571) (7,489) Fair value (gains)/losses on:
Investment property (93) (307) Investments (18,428) 29,792 Borrowings 38 89
(18,483) 29,574 Depreciation of property and equipment 98 40 Equity compensation plans, equity settled expense 62 64 Impairment and expensing of:
Goodwill on subsidiaries 6 13 Financial investments, loans and other assets 14 10 Acquired value of in-force business and intangibles 13 — Non-financial assets 22 —
55 23 Amortisation of:
Premium/discount on debt securities 109 587 Premium/discount on borrowings (23) (35) Premium/discount on non-participating investment contracts 226 243 Financial instruments 23 16 Acquired value of in-force business and intangibles 392 392
727 1,203 Change in unallocated divisible surplus 3,985 (3,237) Interest expense on borrowings 553 551 Net finance income on pension schemes (73) (67) Foreign currency exchange losses/(gains) 345 (164) Changes in working capital (Increase)/decrease in reinsurance assets (1,141) 2,191 Increase in deferred acquisition costs (244) (98) Increase/(decrease) in insurance liabilities and investment contracts2 32,535 (12,031) Increase in other assets2 (435) (2,884) 30,715 (12,822) Net purchases of operating assets Net purchases of investment property (1,131) (791) Net proceeds on sale of investment property 1,294 959 Net purchases of financial investments (4,988) (3,579) (4,825) (3,411)
Total cash generated from operating activities 6,517 5,848 1 Following a review of the Group’s presentation of consolidated investment funds, comparative amounts have been restated from those previously reported. The review identified amounts presented within cash and cash
equivalents that are now presented as loans and financial investments. The restatement has had no impact on the profit for the year or equity. See note 1(a) for further information. 2 Comparative amounts have been reclassified from those previously reported to disclose the impact of the change in the Ogden discount rate from Increase in other assets to Increase/(decrease) in insurance liabilities and
investment contracts.
The cash flows presented in this statement cover all the Group’s activities and include flows from both policyholder and shareholder activities. Operating cash flows reflect the movement in both policyholder and shareholder controlled cash and cash equivalent balances.
During the year the net operating cash inflow reflects a number of factors, including the level of premium income, payments of claims, creditors and surrenders and purchases and sales of operating assets including financial investments. It also includes changes in the size and value of consolidated cash investment funds and changes in the Group participation in these funds.
(b) Cash flows in respect of the acquisition of, and additions to, subsidiaries, joint ventures and associates comprised:
2019
£m 2018
£m
Cash consideration for subsidiaries, joint ventures and associates acquired and additions (20) (165) Less: Cash and cash equivalents acquired with subsidiaries 1 357 Total cash flow on acquisitions and additions (19) 192

Notes to the consolidated financial statements Continued
Aviva plc Annual report and accounts 2019 228
Strategic report Governance IFRS financial statements Other information
59 – Statement of cash flows continued (c) Cash flows in respect of the disposal of subsidiaries, joint ventures and associates comprised:
2019
£m 2018
£m
Cash proceeds from disposal of subsidiaries, joint ventures and associates 12 441 Less: Net cash and cash equivalents divested with subsidiaries — (60)
Total cash flow on disposals 12 381
The above figures form part of cash flows from investing activities.
(d) Cash and cash equivalents in the statement of cash flows at 31 December comprised:
2019
£m
Restated1
2018 £m
Cash at bank and in hand 6,722 5,620 Cash equivalents 13,582 10,994 20,304 16,614 Bank overdrafts (870) (563)
19,434 16,051 1 Following a review of the Group’s presentation of consolidated investment funds, comparative amounts have been restated from those previously reported. The restatement has had no impact on the profit for the year or equity.
See note 1(a) for further information.
Cash and cash equivalents reconciles to the statement of financial position as follows:
2019
£m
Restated1 2018
£m
Cash and cash equivalents (excluding bank overdrafts) 20,304 16,614 Less: Assets classified as held for sale (780) (688)
19,524 15,926 1 Following a review of the Group’s presentation of consolidated investment funds, comparative amounts have been restated from those previously reported. The restatement has had no impact on the profit for the year or equity.
See note 1(a) for further information.
60 – Risk management This note sets out the major risks our businesses and our shareholders face and describes the Group’s approach to managing these. It also gives sensitivity analysis around the major economic and non-economic assumptions that can cause volatility in the Group’s earnings and capital position.
(a) Risk management framework The risk management framework in Aviva forms an integral part of the management and Board processes and decision-making framework across the Group. The key elements of our risk management framework comprise risk appetite; risk governance, including risk policies and business standards, risk oversight committees and roles and responsibilities; and the processes we use to identify, measure, manage, monitor and report risks, including the use of our risk models and stress and scenario testing.
For the purposes of risk identification and measurement, and aligned to Aviva’s risk policies, risks are usually grouped by risk type: credit, market, liquidity, life insurance (including long-term health), general insurance (including short-term health), asset management and operational risk. Risks falling within these types may affect a number of metrics including those relating to balance sheet strength, liquidity and profit. They may also affect the performance of the products we deliver to our customers and the service to our customers and distributors, which can be categorised as risks to our brand and reputation or as conduct risk.
To promote a consistent and rigorous approach to risk management across all businesses we have a set of risk policies and business standards which set out the risk strategy, appetite, framework and minimum requirements for the Group’s worldwide operations. The business chief executive officers make an annual declaration supported by an opinion from the business chief risk officers that the system of governance and internal controls was effective and fit for purpose for their business throughout the year.
A regular top-down key risk identification and assessment process is carried out by the risk function. This includes the consideration of emerging risks and is supported by deeper thematic reviews. This process is replicated at the business unit level. The risk assessment processes are used to generate risk reports which are shared with the relevant risk committees.
Risk models are an important tool in our measurement of risks and are used to support the monitoring and reporting of the risk profile and in the consideration of the risk management actions available. We carry out a range of stress (where one risk factor, such as equity returns, is assumed to vary) and scenario (where combinations of risk factors are assumed to vary) tests to evaluate their impact on the business and the management actions available to respond to the conditions envisaged. For those risk types managed through the holding of capital, being our principal risk types except for liquidity risk, we measure and monitor our risk profile on the basis of the SCR.

Notes to the consolidated financial statements Continued
Aviva plc Annual report and accounts 2019 229
Strategic report Governance IFRS financial statements Other information
60 – Risk management continued Roles and responsibilities for risk management in Aviva are based around the ‘three lines of defence model’ where ownership for risk is taken at all levels in the Group. Line management in the business is accountable for risk management, including the implementation of the risk management framework and embedding of the risk culture. The risk function is accountable for quantitative and qualitative oversight and challenge of the risk identification, measurement, monitoring, management and reporting processes and for developing the risk management framework. Internal Audit provides an independent assessment of the risk framework and internal control processes.
Board oversight of risk and risk management across the Group is maintained on a regular basis through its Risk Committee and Customer, Conduct and Reputation Committee. The Board has overall responsibility for determining risk appetite, which is an expression of the risk the business is willing to take. Risk appetites are set relative to capital and liquidity at Group and in the business units.
Risk appetites, requiring management action if breached, are also set for interest rate and foreign exchange risk (calculated on the basis of the SCR), and liquidity risk (based on stressing forecast central liquid assets and cash inflows and outflows over a specified time horizon). For other risk types the Group sets Solvency II capital tolerances. The Group’s position against risk appetite and capital tolerances is monitored and reported to the Board on a regular basis. Long-term sustainability depends upon the protection of franchise value and good customer relationships. As such, Aviva has a risk preference that we will not accept risks that materially impair the reputation of the Group and requires that customers are always treated with integrity. The oversight of risk and risk management at the Group level is supported by the Asset Liability Committee, which focuses on business and financial risks, and the Operational Risk Committee which focuses on operational and reputational risks. Similar committee structures with equivalent terms of reference exist in the business units.
The risk management framework of a small number of our joint ventures and strategic equity holdings differs from the Aviva framework outlined in this note. We work with these entities to understand how their risks are managed and to align them, where possible, with Aviva’s framework.
Further information on the types and management of specific risk types is given in sections (b) to (h) below.
(b) Credit risk Credit risk is the risk of financial loss as a result of the default or failure of third parties to meet their payment obligations to Aviva, or variations in market values as a result of changes in expectations related to these risks. Credit risk is taken so that we can provide the returns required to satisfy policyholder liabilities and to generate returns for our shareholders. In general we prefer to take credit risk over equity and property risks, due to the better expected risk adjusted return, our credit risk analysis capability and the structural investment advantages conferred to insurers with long-dated, relatively illiquid liabilities.
Our approach to managing credit risk recognises that there is a risk of adverse financial impact resulting from fluctuations in credit quality of third parties including default, rating transition and credit spread movements. Our credit risks arise principally through exposures to debt security investments, structured asset investments, bank deposits, derivative counterparties, mortgage lending and reinsurance counterparties.
The Group manages its credit risk at business unit and Group level. All business units are required to implement credit risk management processes (including limits frameworks), operate specific risk management committees, and ensure detailed reporting and monitoring of their exposures against pre-established risk criteria. At Group level, we manage and monitor all exposures across our business units on a consolidated basis, and operate a Group limit framework that must be adhered to by all.
A detailed breakdown of the Group’s current credit exposure by credit quality is shown below.
(i) Financial exposures by credit ratings Financial assets are graded according to current external credit ratings issued. AAA is the highest possible rating. Investment grade financial assets are classified within the range of AAA to BBB ratings. Financial assets which fall outside this range are classified as sub-investment grade. The following table provides information regarding the aggregated credit risk exposure of the Group for financial assets with external credit ratings. ‘Not rated’ assets capture assets not rated by external ratings agencies.
As at 31 December 2019 AAA AA A BBB Below BBB Not rated
Carrying value including held
for sale £m
Less: Assets classified as held for sale
£m Carrying value
£m
Fixed maturity securities 10.7% 34.1% 19.7% 23.0% 8.0% 4.5% 199,481 (649) 198,832 Reinsurance assets 3.3% 75.8% 9.2% 7.8% — 3.9% 12,431 (75) 12,356 Other investments 0.2% — 0.3% 0.1% — 99.4% 51,935 (6,919) 45,016 Loans 18.3% 3.8% 0.1% — — 77.8% 38,580 (1) 38,579 Total 302,427 (7,644) 294,783
Restated1 as at 31 December 2018 AAA AA A BBB Below BBB Not rated
Carrying value including held
for sale £m
Less: Assets classified as held for sale
£m Carrying value
£m
Fixed maturity securities2 10.0% 36.6% 18.1% 23.9% 5.9% 5.5% 192,072 (397) 191,675 Reinsurance assets — 83.1% 10.0% 2.7% — 4.2% 11,800 (45) 11,755 Other investments2 0.2% 0.1% 0.4% 0.1% — 99.2% 46,567 (6,644) 39,923 Loans 17.4% 7.5% — — — 75.1% 36,184 — 36,184 Total 286,623 (7,086) 279,537 1 Following a review of the Group’s presentation of consolidated investment funds, comparative amounts have been restated from those previously reported. The review identified amounts presented within cash and cash
equivalents and other investments that are now presented as loans and fixed maturity securities in the table above. The restatement has had no impact on the profit for the period or equity. See note 1(a) for further information. 2 Following a review of the classification of financial assets, comparative amounts have been amended from those previously reported. The effect of this change is to reclassify £2,201 million of assets from fixed maturity securities
to other investments.

Notes to the consolidated financial statements Continued
Aviva plc Annual report and accounts 2019 230
Strategic report Governance IFRS financial statements Other information
60 – Risk management continued The majority of non-rated debt securities within shareholder assets are held by our businesses in the UK. Of these securities most are allocated an internal rating using a methodology largely consistent with that adopted by an external rating agency, and are considered to be of investment grade credit quality; these include £4,095 million (2018: £3,640 million) of debt securities held in our UK Life business, predominantly made up of private placements and other corporate bonds, which have been internally rated as investment grade.
The following table provides information on the Group’s exposure by credit ratings to financial assets that meet the definition of ‘solely payment of principal and interest’ (SPPI).
As at 31 December 2019 AAA £m
AA £m
A £m
BBB £m
Below BBB £m
Not rated £m
Loans 7,065 1,443 — — — 1,071 Receivables — 144 338 259 4 5,044 Accrued income and interest — — — — — 265 Other financial assets — — 5 — — — Total 7,065 1,587 343 259 4 6,380
Restated1 as at 31 December 2018 AAA £m
AA £m
A £m
BBB £m
Below BBB £m
Not rated £m
Loans 6,299 2,720 — — — 894 Receivables 6 213 294 214 — 4,882 Accrued income and interest — — 18 — — 175 Other financial assets — — 10 — — —
Total 6,305 2,933 322 214 — 5,951 1 Following a review of the Group’s presentation of consolidated investment funds, comparative amounts have been restated from those previously reported. The review identified amounts presented within cash and cash
equivalents that are now presented as loans in the table above. The restatement has had no impact on the profit for the period or equity. See note 1(a) for further information.
At the period end, the Group held cash and cash equivalents of £15,344 million (2018 restated: £11,249 million) that met the SPPI criteria, of which £15,322 million (2018 restated: £11,234 million) is placed with financial institutions with issuer ratings within the range of AAA to BBB. Further information on the extent to which unrated receivables, including those that meet the SPPI criteria, are past due may be found in section (ix) of this note. The Group continues to hold a series of macro credit hedges to reduce the overall credit risk exposure. The Group’s maximum exposure to credit risk of financial assets, without taking collateral or these hedges into account, is represented by the carrying value of the financial instruments in the statement of financial position. These comprise debt securities, reinsurance assets, derivative assets, loans and receivables. The carrying values of these assets are disclosed in the relevant notes: financial investments (note 28), reinsurance assets (note 47), loans (note 25) and receivables (note 29). The collateral in place for these credit exposures is disclosed in note 62 Financial assets and liabilities subject to offsetting, enforceable master netting agreements and similar agreements.
(ii) Other investments Other investments (including assets of operations classified as held for sale) include unit trusts and other investment vehicles; derivative financial instruments, representing positions to mitigate the impact of adverse market movements; and other assets, including deposits with credit institutions and minority holdings in property management undertakings.
The credit quality of the underlying debt securities within investment vehicles is managed by the safeguards built into the investment mandates for these funds which determine the funds’ risk profiles. At the Group level, we also monitor the asset quality of unit trusts and other investment vehicles against Group set limits.
A proportion of the assets underlying these investments are represented by equities and so credit ratings are not generally applicable. Equity exposures are managed against agreed benchmarks that are set with reference to overall appetite for market risk.
(iii) Loans The Group loan portfolio principally comprises: • Policy loans which are generally collateralised by a lien or charge over the underlying policy; • Loans and advances to banks which primarily relate to loans of cash collateral received in stock lending transactions. These loans are fully
collateralised by other securities; • Healthcare, infrastructure and PFI loans secured against healthcare, education, social housing and emergency services related premises;
and • Mortgage loans collateralised by property assets. We use loan to value, interest and debt service cover, and diversity and quality of the tenant base metrics to internally monitor our exposures to mortgage loans. We use credit quality, based on dynamic market measures, and collateralisation rules to manage our stock lending activities. Policy loans are loans and advances made to policyholders, and are collateralised by the underlying policies.
(iv) Credit concentration risk The long-term and general insurance businesses are generally not individually exposed to significant concentrations of credit risk due to the regulations applicable in most markets and the Group credit policy and limits framework, which limit investments in individual assets and asset classes. Credit concentrations are monitored as part of the regular credit monitoring process and are reported to the Group Asset Liability Committee (ALCO). With the exception of government bonds the largest aggregated counterparty exposure within shareholder assets is to the Swiss Reinsurance Company Ltd (including subsidiaries), representing approximately 2.4% of the total shareholder assets.

Notes to the consolidated financial statements Continued
Aviva plc Annual report and accounts 2019 231
Strategic report Governance IFRS financial statements Other information
60 – Risk management continued (v) Reinsurance credit exposures The Group is exposed to concentrations of risk with individual reinsurers due to the nature of the reinsurance market and the restricted range of reinsurers that have acceptable credit ratings. The Group operates a policy to manage its reinsurance counterparty exposures, by limiting the reinsurers that may be used and applying strict limits to each reinsurer. Reinsurance exposures are aggregated with other exposures to ensure that the overall risk is within appetite. The Group Capital and Group Risk teams have an active monitoring role with escalation to the Chief Financial Officer (CFO), Chief Risk Officer (CRO), Group ALCO and the Board Risk Committee as appropriate.
The Group’s largest reinsurance counterparty is Swiss Reinsurance Company Ltd (including subsidiaries). At 31 December 2019, the reinsurance asset recoverable, including debtor balances, from Swiss Reinsurance Company Ltd was £3,097 million (2018: £2,835 million).
(vi) Securities finance The Group has significant securities financing operations within the UK and smaller operations in some other businesses. The risks within this activity are mitigated by collateralisation and minimum counterparty credit quality requirements.
(vii) Derivative credit exposures The Group is exposed to counterparty credit risk through derivative trades. This risk is generally mitigated through holding collateral for most trades. Residual exposures are captured within the Group’s credit management framework.
(viii) Unit-linked business In unit-linked business the policyholder bears the direct market risk and credit risk on investment assets in the unit funds and the shareholders’ exposure to credit risk is limited to the extent of the income arising from asset management charges based on the value of assets in the fund.
(ix) Impairment of financial assets In assessing whether financial assets carried at amortised cost or classified as available for sale are impaired, due consideration is given to the factors outlined in accounting policies (T) and (V). The following table provides information regarding the carrying value of financial assets subject to impairment testing that have been impaired and the ageing of those assets that are past due but not impaired. The table excludes assets carried at fair value through profit or loss and held for sale.
Financial assets that are past due but not impaired
As at 31 December 2019
Neither past due nor
impaired £m
0–3 months £m
3–6 months £m
6 months– 1 year
£m
Greater than 1 year
£m
Financial assets that have been
impaired £m
Carrying value
£m
Fixed maturity securities 1,455 — — 6 — — 1,461 Reinsurance assets 8,361 — — — — — 8,361 Other investments 2 — — — — — 2 Loans 10,260 — — — — — 10,260 Receivables and other financial assets 8,911 51 14 10 9 — 8,995
Financial assets that are past due but not impaired
Restated1 as at 31 December 2018
Neither past due nor
impaired £m
0–3 months £m
3–6 months £m
6 months– 1 year
£m
Greater than 1 year
£m
Financial assets that have been
impaired £m
Carrying value
£m
Fixed maturity securities 1,675 — — 5 — — 1,680 Reinsurance assets 7,791 — — — — — 7,791 Other investments 1 — — — — — 1 Loans 10,658 — — — — — 10,658 Receivables and other financial assets 8,536 74 16 11 2 — 8,639 1 Following a review of the Group’s presentation of consolidated investment funds, comparative amounts have been restated from those previously reported. The review identified amounts presented within cash and cash
equivalents that are now presented as loans in the table above. The restatement has had no impact on the profit for the period or equity. See note 1(a) for further information.
Excluded from the tables above are financial and reinsurance assets carried at fair value through profit or loss that are not subject to impairment testing, as follows: £198,020 million of debt securities (2018 restated: £190,392 million), £44,836 million of other investments (2018 restated: £41,209 million), £28,319 million of loans (2018: £25,526 million) and £4,006 million of reinsurance assets (2018: £4,006 million).
Where assets have been classed as ‘past due and impaired’, an analysis is made of the risk of default and a decision is made whether to seek to mitigate the risk. There were no material financial assets that would have been past due or impaired had the terms not been renegotiated.

Notes to the consolidated financial statements Continued
Aviva plc Annual report and accounts 2019 232
Strategic report Governance IFRS financial statements Other information
60 – Risk management continued (c) Market risk Market risk is the risk of adverse financial impact resulting, directly or indirectly from fluctuations in interest rates, inflation, foreign currency exchange rates, equity and property prices. Market risk arises in business units due to fluctuations in both the value of liabilities and the value of investments held. At Group level, it also arises in relation to the overall portfolio of international businesses and in the value of investment assets owned directly by the shareholders. We actively seek some market risks as part of our investment and product strategy. However, we have limited appetite for interest rate risk as we do not believe it is adequately rewarded.
The management of market risk is undertaken at business unit and at Group level. Businesses manage market risks locally using the Group market risk framework and within local regulatory constraints. Group Capital is responsible for monitoring and managing market risk at Group level and has established criteria for matching assets and liabilities to limit the impact of mismatches due to market movements.
In addition, where the Group’s long-term savings businesses have written insurance and investment products where the majority of investment risks are borne by its policyholders, these risks are managed in line with local regulations and marketing literature, in order to satisfy the policyholders’ risk and reward objectives. The Group writes unit-linked business in a number of its operations. The shareholders’ exposure to market risk on this business is limited to the extent that income arising from asset management charges is based on the value of assets in the fund.
The most material types of market risk that the Group is exposed to are described below.
(i) Equity price risk The Group is subject to direct equity price risk arising from changes in the market values of its equity securities portfolio. Our most material indirect equity price risk exposures are to policyholder unit-linked funds, which are exposed to a fall in the value of the fund thereby reducing the fees we earn on those funds, and participating contracts, which are exposed to a fall in the value of the funds thereby increasing our costs for policyholder guarantees. We also have some equity exposure in shareholder funds through equities held to match inflation-linked liabilities.
We continue to limit our direct equity exposure in line with our risk preferences. At a business unit level, investment limits and local investment regulations require that business units hold diversified portfolios of assets thereby reducing exposure to individual equities. The Group does not have material holdings of unquoted equity securities.
Equity risk is also managed using a variety of derivative instruments, including futures and options. Businesses actively model the performance of equities through the use of risk models, in particular to understand the impact of equity performance on guarantees, options and bonus rates. An equity hedging strategy remains in place to help control the Group’s overall direct and indirect exposure to equities. At 31 December 2019 the Group continues to hold a series of macro equity hedges to reduce the overall shareholder equity risk exposure.
Sensitivity to changes in equity prices is given in section (i) Risk and capital management, below.
(ii) Property price risk The Group is subject to property price risk directly due to holdings of investment properties in a variety of locations worldwide and indirectly through investments in mortgages and mortgage backed securities. Investment in property is managed at business unit level, and is subject to local regulations on investments, liquidity requirements and the expectations of policyholders.
As at 31 December 2019, no material derivative contracts had been entered into to mitigate the effects of changes in property prices. Exposure to property risk on equity release mortgages from sustained underperformance in the UK House Price Index (HPI) is mitigated by capping loan to value on origination at low levels and regularly monitoring the performance of the mortgage portfolio.
Sensitivity to changes in property prices is given in section (i) Risk and capital management, below.
(iii) Interest rate risk Interest rate risk arises primarily from the Group’s investments in long-term debt and fixed income securities and their movement relative to the value placed on the insurance liabilities. A number of policyholder product features have an influence on the Group’s interest rate risk. The major features include guaranteed surrender values, guaranteed annuity options, and minimum surrender and maturity values. Details of material guarantees and options are given in note 46.
Exposure to interest rate risk is monitored through several measures that include duration, capital modelling, sensitivity testing and stress and scenario testing. The impact of exposure to sustained low interest rates is considered within our scenario testing.
The Group typically manages interest rate risk by investing in fixed interest securities which closely match the interest rate sensitivity of the liabilities where such investments are available. In particular, a key objective is to at least match the duration of our annuity liabilities with assets of the same duration, and in some cases where appropriate cash flow matching has been used. These assets include corporate bonds, residential mortgages and commercial mortgages. Should they default before maturity, it is assumed that the Group can reinvest in assets of a similar risk and return profile, which is subject to market conditions. Interest rate risk is also managed in some business units using a variety of derivative instruments, including futures, options, swaps, caps and floors.
Some of the Group’s products, principally participating contracts, expose us to the risk that changes in interest rates will impact on profits through a change in the interest spread (the difference between the amounts that we are required to pay under the contracts and the investment income we are able to earn on the investments supporting our obligations under those contracts). Markets where Aviva is primarily exposed to this risk are the UK, France, Italy and some other Asian business units.

Notes to the consolidated financial statements Continued
Aviva plc Annual report and accounts 2019 233
Strategic report Governance IFRS financial statements Other information
60 – Risk management continued The low interest rate environment in a number of markets around the world has resulted in our current investment yields being lower than the overall current portfolio yield, primarily in our investments in fixed income securities. We anticipate that interest rates may remain below historical averages for an extended period of time and that financial markets may continue to have periods of high volatility. Investing activity will continue to decrease the portfolio yield as long as market yields remain below the current portfolio level. We expect the decline in portfolio yield will result in lower net investment income in future periods.
Other product lines of the Group, such as protection, are not significantly sensitive to interest rate or market movements. For unit-linked business, the shareholder margins emerging are typically a mixture of annual management fees and risk/expense charges. Risk and expense margins will be largely unaffected by low interest rates. Annual management fees may increase in the short term as the move towards low interest rates increases the value of unit funds. However, in the medium term, unit funds will grow at a lower rate which will reduce fund charges. For the UK annuities business interest rate exposure is mitigated by closely matching the duration of liabilities with assets of the same duration.
The UK participating business includes contracts with features such as guaranteed surrender values, guaranteed annuity options, and minimum surrender and maturity values. These liabilities are managed through duration matching of assets and liabilities and the use of derivatives, including swaptions. As a result, the Group’s exposure to sustained low interest rates on this portfolio is not material. The Group’s key exposure to low interest rates arises through its other participating contracts, principally in Italy and France. Some of these contracts also include features such as guaranteed minimum bonuses, guaranteed investment returns and guaranteed surrender values. In a low interest rate environment there is a risk that the yield on assets might not be sufficient to cover these obligations. For certain of its participating contracts the Group is able to amend guaranteed crediting rates. Our ability to lower crediting rates may be limited by competition, bonus mechanisms and contractual arrangements.
Details of material guarantees and options are given in note 46. In addition, the following table summarises the weighted average minimum guaranteed crediting rates and weighted average book value yields on assets as at 31 December 2019 for our Italian and French participating contracts, where the Group’s key exposure to sustained low interest rates arises.
Weighted average
minimum guaranteed
crediting rate
Weighted average book value yield on
assets
Participating contract
liabilities £m
France 0.67% 2.47% 69,057 Italy 0.29% 3.50% 20,660 Other1 N/A N/A 50,389
Total N/A N/A 140,106 1 ‘Other’ includes UK participating business
Profit before tax on General Insurance and Health Insurance business is generally a mixture of insurance, expense and investment returns. The asset portfolio is invested primarily in fixed income securities. The portfolio investment yield and average total invested assets in our general insurance and health business are set out in the table below.
Portfolio investment
yield1
Average assets
£m
2017 2.07% 14,770 2018 2.28% 14,651 2019 2.21% 14,350 1 Before realised and unrealised gains and losses and investment expenses
The nature of the business means that prices in certain circumstances can be increased to maintain overall profitability. This is subject to the competitive environment in each market. To the extent that there are further falls in interest rates the investment yield would be expected to decrease further in future periods.
Sensitivity to changes in interest rates is given in section (i) Risk and capital management, below.
(iv) Inflation risk Inflation risk arises primarily from the Group’s exposure to general insurance claims inflation, to inflation linked benefits within the defined benefit staff pension schemes and within the UK annuity portfolio and to expense inflation. Increases in long-term inflation expectations are closely linked to long-term interest rates and so are frequently considered with interest rate risk. Exposure to inflation risk is monitored through capital modelling, sensitivity testing and stress and scenario testing. The Group typically manages inflation risk through its investment strategy and, in particular, by investing in inflation linked securities and through a variety of derivative instruments, including inflation linked swaps.
(v) Currency risk The Group has minimal exposure to currency risk from financial instruments held by business units in currencies other than their functional currencies, as nearly all such holdings are backing either unit-linked or with-profits contract liabilities or are hedged. As a result the foreign exchange gains and losses on investments are largely offset by changes in unit-linked and with-profits liabilities and fair value changes in derivatives attributable to changes in foreign exchange rates recognised in the income statement.

Notes to the consolidated financial statements Continued
Aviva plc Annual report and accounts 2019 234
Strategic report Governance IFRS financial statements Other information
60 – Risk management continued The Group operates internationally and as a result is exposed to foreign currency exchange risk arising from fluctuations in exchange rates of various currencies. Approximately 58% of the Group’s premium income arises in currencies other than sterling and the Group’s net assets are denominated in a variety of currencies, of which the largest are sterling, euro and Canadian dollars (CAD$). The Group does not hedge foreign currency revenues as these are substantially retained locally to support the growth of the Group’s business and meet local regulatory and market requirements. However, the Group does use foreign currency forward contracts to hedge planned dividends from its subsidiaries.
Businesses aim to maintain sufficient assets in local currency to meet local currency liabilities, however movements may impact the value of the Group’s consolidated shareholders’ equity which is expressed in sterling. This aspect of foreign exchange risk is monitored and managed centrally, against pre-determined limits. These exposures are managed by aligning the deployment of regulatory capital by currency with the Group’s regulatory capital requirements by currency. Currency borrowings and derivatives are used to manage exposures within the limits that have been set. Except where the Group has applied net investment hedge accounting (see note 61(a)), foreign exchange gains and losses on foreign currency borrowings are recognised in the income statement, whereas foreign exchange gains and losses arising on consolidation from the translation of assets and liabilities of foreign subsidiaries are recognised in other comprehensive income. At 31 December 2019 and 2018, the Group’s total equity deployment by currency including assets ‘held for sale’ was:
Sterling
£m Euro
£m CAD$
£m Other
£m Total
£m
Capital 31 December 2019 16,036 819 397 1,433 18,685 Capital 31 December 2018 15,720 611 311 1,813 18,455
A 10% change in sterling to euro/CAD$ period-end foreign exchange rates would have had the following impact on total equity.
10% increase in sterling /
euro rate £m
10% decrease in sterling /
euro rate £m
10% increase in sterling /
CAD$ rate £m
10% decrease in sterling /
CAD$ rate £m
Net assets at 31 December 2019 (82) 82 (40) 40 Net assets at 31 December 2018 (61) 77 (31) 31
A 10% change in sterling to euro/CAD$ average foreign exchange rates applied to translate foreign currency profits would have had the following impact on profit before tax, including resulting gains and losses on foreign exchange hedges.
10% increase in sterling/
euro rate £m
10% decrease in sterling/
euro rate £m
10% increase in sterling/ CAD$ rate
£m
10% decrease in sterling/ CAD$ rate
£m
Impact on profit before tax 31 December 2019 (67) 82 (18) 22 Impact on profit before tax 31 December 2018 (60) 85 8 (9)
The balance sheet changes arise from retranslation of business unit statements of financial position from their functional currencies into sterling, with above movements being taken through the currency translation reserve. These balance sheet movements in exchange rates therefore have no impact on profit. Net asset and profit before tax figures are stated after taking account of the effect of currency hedging activities.
(vi) Derivatives risk Derivatives are used by a number of the businesses. Derivatives are primarily used for efficient investment management, risk hedging purposes, or to structure specific retail savings products. Activity is overseen by the Group Capital and Group Risk teams, which monitor exposure levels and approve large or complex transactions.
The Group applies strict requirements to the administration and valuation processes it uses, and has a control framework that is consistent with market and industry practice for the activity that is undertaken.
(vii) Correlation risk The Group recognises that lapse behaviour and potential increases in consumer expectations are sensitive to and interdependent with market movements and interest rates. These interdependencies are taken into consideration in the internal capital model and in scenario analysis.
(d) Liquidity risk Liquidity risk is the risk of not being able to make payments as they become due because there are insufficient assets in cash form. The relatively illiquid nature of insurance liabilities is a potential source of additional investment return by allowing us to invest in higher yielding, but less liquid assets such as commercial mortgages and infrastructure loans. The Group seeks to ensure that it maintains sufficient financial resources to meet its obligations as they fall due through the application of a Group liquidity risk policy and business standard and through the development of its liquidity risk management plan. At Group and business unit level, there is a liquidity risk appetite which requires that sufficient liquid resources be maintained to cover net outflows in a stress scenario. In addition to the existing liquid resources and expected inflows, the Group maintains significant undrawn committed borrowing facilities (£1,650 million) from a range of leading international banks to further mitigate this risk.
Maturity analyses The following tables show the maturities of our insurance and investment contract liabilities, and of the financial and reinsurance assets held to meet them. A maturity analysis of the contractual amounts payable for borrowings and non-hedge derivatives is given in notes 53 and 61, respectively. Contractual obligations under leases and capital commitments are given in note 23 and note 57.

Notes to the consolidated financial statements Continued
Aviva plc Annual report and accounts 2019 235
Strategic report Governance IFRS financial statements Other information
60 – Risk management continued (i) Analysis of maturity of insurance and investment contract liabilities For non-linked insurance business, the following table shows the gross liability at 31 December 2019 and 2018 analysed by remaining duration. The total liability is split by remaining duration in proportion to the cash-flows expected to arise during that period, as permitted under IFRS 4, Insurance Contracts.
Almost all linked business and non-linked investment contracts may be surrendered or transferred on demand. For such contracts, the earliest contractual maturity date is therefore the current statement of financial position date, for a surrender amount approximately equal to the current statement of financial position liability. However, we expect surrenders, transfers and maturities to occur over many years, and therefore the tables below reflect the expected cash flows for these contracts, rather than their contractual maturity date. This table includes amounts held for sale.
As at 31 December 2019 Total
£m
On demand or within 1 year
£m 1-5 years
£m 5-15 years
£m Over 15 years
£m
Long-term business Insurance contracts – non-linked 111,731 8,811 27,184 41,728 34,008 Investment contracts – non-linked 74,641 5,978 19,532 28,313 20,818 Linked business 177,448 16,226 26,002 58,601 76,619 General insurance and health 16,656 7,136 6,665 2,258 597 Total contract liabilities 380,476 38,151 79,383 130,900 132,042
As at 31 December 2018 Total
£m
On demand or within 1 year
£m 1-5 years
£m 5-15 years
£m Over 15 years
£m
Long-term business Insurance contracts – non-linked 106,622 8,421 25,940 40,548 31,713 Investment contracts – non-linked 75,158 5,547 19,199 28,572 21,840 Linked business 156,859 15,559 23,901 52,656 64,743 General insurance and health 16,368 6,859 6,758 2,217 534
Total contract liabilities 355,007 36,386 75,798 123,993 118,830
(ii) Analysis of maturity of financial assets The following table provides an analysis, by maturity date of the principal, of the carrying value of financial assets which are available to fund the repayment of liabilities as they crystallise. This table excludes assets held for sale.
As at 31 December 2019 Total
£m
On demand or within 1 year
£m 1-5 years
£m Over 5 years
£m
No fixed term (perpetual)
£m
Fixed maturity securities 198,832 42,644 47,983 106,981 1,224 Equity securities 99,570 — — — 99,570 Other investments 45,016 38,817 25 5,365 809 Loans 38,579 9,641 4,643 24,293 2 Cash and cash equivalents 19,524 19,524 — — — Total 401,521 110,626 52,651 136,639 101,605
Restated1 as at 31 December 2018 Total
£m
On demand or within 1 year
£m 1-5 years
£m Over 5 years
£m
No fixed term (perpetual)
£m
Fixed maturity securities2 191,675 42,764 47,936 99,670 1,305 Equity securities 88,227 — — — 88,227 Other investments2 39,923 34,782 77 4,301 763 Loans 36,184 9,488 4,236 22,457 3 Cash and cash equivalents 15,926 15,926 — — —
Total 371,935 102,960 52,249 126,428 90,298 1 Following a review of the Group’s presentation of consolidated investment funds, comparative amounts have been restated from those previously reported. The review identified amounts presented within cash and cash
equivalents and other investments that are now presented as loans, fixed maturity securities and equity securities in the table above. The restatement has had no impact on the profit for the period or equity. See note 1(a) for further information.
2 Following a review of the classification of financial assets, comparative amounts have been amended from those previously reported. The effect of this change is to reclassify £2,201 million of assets from fixed maturity securities to other investments.
The assets above are analysed in accordance with the earliest possible redemption date of the instrument at the initiation of the Group. Where an instrument is transferable back to the issuer on demand, such as most unit trusts or similar types of investment vehicle, it is included in the ‘On demand or within 1 year’ column. Debt securities with no fixed contractual maturity date are generally callable at the option of the issuer at the date the coupon rate is reset under the contractual terms of the instrument. The terms for resetting the coupon are such that we expect the securities to be redeemed at this date, as it would be uneconomic for the issuer not to do so, and for liquidity management purposes we manage these securities on this basis. The first repricing and call date is normally ten years or more after the date of issuance. Most of the Group’s investments in equity securities and fixed maturity securities are market traded and therefore, if required, can be liquidated for cash at short notice.

Notes to the consolidated financial statements Continued
Aviva plc Annual report and accounts 2019 236
Strategic report Governance IFRS financial statements Other information
60 – Risk management continued (e) Life and health insurance risk Life insurance risk in the Group arises through its exposure to mortality risk and exposure to worse than anticipated operating experience on factors such as persistency levels, exercising of policyholder options and management and administration expenses. The Group’s health insurance business (including private health insurance, critical illness cover, income protection and personal accident insurance, as well as a range of corporate healthcare products) exposes the Group to morbidity risk (the proportion of our customers falling sick) and medical expense inflation. The Group chooses to take measured amounts of life and health insurance risk provided that the relevant business has the appropriate core skills to assess and price the risk and adequate returns are available. The Group’s underwriting strategy and appetite is communicated via specific policy statements, related business standards and guidelines. Life insurance risk is managed primarily at business unit level with oversight at the Group level.
The underlying risk profile of our life and health insurance risks, primarily persistency, longevity, mortality and expense risk, has remained stable during 2019. We are also exposed to longevity risk through the Aviva Staff Pension Scheme, to which our economic exposure has been reduced since 2014 by entering into a longevity swap covering approximately £5 billion of pensioner in payment scheme liabilities. Longevity risk remains the Group’s most significant life insurance risk, while persistency risk remains significant and continues to have a volatile outlook with underlying performance linked to some degree to economic conditions. We purchased reinsurance for longevity risk for our annuity business, including the bulk annuity buy-in transaction with the Aviva Staff Pension scheme (see note 52). Group has continued to write considerable volumes of life protection business, and to utilise reinsurance to reduce exposure to potential losses. More generally, life insurance risks are believed to provide a significant diversification against other risks in the portfolio. Life insurance risks are modelled within the internal capital model and subject to sensitivity and stress and scenario testing.
The assumption and management of life and health insurance risks is governed by the Group-wide business standards covering underwriting, pricing, product design and management, in-force management, claims handling, and reinsurance. The individual life and health insurance risks are managed as follows: • Mortality and morbidity risks are mitigated by use of reinsurance. The Group allows businesses to select reinsurers, from those approved
by the Group, based on local factors, but retains oversight of the overall exposures and monitors that the aggregation of risk ceded is within credit risk appetite.
• Longevity risk and internal experience analysis are monitored against the latest external industry data and emerging trends. While individual businesses are responsible for reserving and pricing for annuity business, the Group monitors the exposure to this risk and any associated capital implications. The Group has used reinsurance solutions to reduce the risks from longevity and continually monitors and evaluates emerging market solutions to mitigate this risk further.
• Persistency risk is managed at a business unit level through frequent monitoring of company experience, and benchmarked against local market information. Generally, persistency risk arises from customers lapsing their policies earlier than has been assumed. Where possible the financial impact of lapses is reduced through appropriate product design. Businesses also implement specific initiatives to improve the retention of policies which may otherwise lapse. The Group has developed guidelines on persistency management.
• Expense risk is primarily managed by the business units through the assessment of business unit profitability and frequent monitoring of expense levels.
Embedded derivatives The Group is exposed to the risk of changes in policyholder behaviour due to the exercise of options, guarantees and other product features embedded in its long-term savings products. These product features offer policyholders varying degrees of guaranteed benefits at maturity or on early surrender, along with options to convert their benefits into different products on pre-agreed terms. The extent of the impact of these embedded derivatives differs considerably between business units and exposes Aviva to changes in policyholder behaviour in the exercise of options as well as market risk.
Examples of each type of embedded derivative affecting the Group are: • Options: call, put, surrender and maturity options, guaranteed annuity options, options to cease premium payment, options for
withdrawals free of market value adjustment, annuity options, and guaranteed insurability options. • Guarantees: embedded floor (guaranteed return), maturity guarantee, guaranteed death benefit, and guaranteed minimum rate of annuity
payment;and • Other: indexed interest or principal payments, maturity value, loyalty bonus.
The impact of these is reflected in the capital model and managed as part of the asset liability framework. Further disclosure on financial guarantees and options embedded in contracts and their inclusion in insurance and investment contract liabilities is provided in note 45.
(f) General insurance risk Types of risk General insurance risk in the Group arises from: • Fluctuations in the timing, frequency and severity of claims and claim settlements relative to expectations; • Unexpected claims arising from a single source or cause; • Inaccurate pricing of risks or inappropriate underwriting of risks when underwritten; and • Inadequate reinsurance protection or other risk transfer techniques.
The majority of the general insurance business underwritten by the Group continues to be short tail in nature such as motor, household and commercial property insurances. The Group’s underwriting strategy and appetite is communicated via specific policy statements, related business standards and guidelines. General insurance risk is managed primarily at business unit level with oversight at the Group level. Claims reserving is undertaken by local actuaries in the various general insurance businesses and is also subject to periodic external reviews. Reserving processes are further detailed in note 43.
The vast majority of the Group’s general insurance business is managed and priced in the same country as the domicile of the customer.

Notes to the consolidated financial statements Continued
Aviva plc Annual report and accounts 2019 237
Strategic report Governance IFRS financial statements Other information
60 – Risk management continued Management of general insurance risks Significant insurance risks will be reported under the risk management framework. Additionally, the capital model is used to assess the risks that each general insurance business unit, and the Group as a whole, is exposed to, quantifying their impact and calculating appropriate capital requirements.
Business units have developed mechanisms that identify, quantify and manage accumulated exposures to contain them within the limits of the appetite of the Group. The business units are assisted by the General Insurance Council which provides technical input for major decisions which fall outside individual delegated limits or escalations outside group risk preferences, group risk accumulation, concentration and profitability limits.
Reinsurance strategy Significant reinsurance purchases are reviewed annually at both business unit and Group level to verify that the levels of protection being bought reflect any developments in exposure and the risk appetite of the Group. The basis of these purchases is underpinned by analysis of capital, earnings and capital volatility, cash flow and liquidity and the Group’s franchise value.
Detailed actuarial analysis is used to calculate the Group’s extreme risk profile and then design cost and capital efficient reinsurance programmes to mitigate these risks to within agreed appetites. For businesses writing general insurance we analyse the natural catastrophe exposure using our own internal probabilistic catastrophe model which is benchmarked against external catastrophe models widely used by the rest of the (re)insurance industry.
The Group cedes much of its worldwide catastrophe risk to third-party reinsurers through excess of loss and aggregate excess of loss structures. The Group purchases a Group-wide catastrophe reinsurance programme to protect against catastrophe losses exceeding a 1 in 200 year return period. The total Group potential retained loss from its most concentrated catastrophe exposure peril (Northern Europe Windstorm) is approximately £150 million on a per occurrence basis and £175 million on an annual aggregate basis. Any losses above these levels are covered by the group-wide catastrophe reinsurance programme to a level in excess of a 1 in 200 year return period. In addition the Group purchases a number of GI business line specific reinsurance programmes with various retention levels to protect both capital and earnings, and has reinsured 100% of its latent exposures to its historic UK employers’ liability and public liability business written prior to 31 December 2000.
(g) Asset management risk Aviva is directly exposed to the risks associated with operating an asset management business through its ownership of Aviva Investors. The underlying risk profile of our asset management risk is derived from investment performance, specialist investment professionals and leadership, product development capabilities, fund liquidity, margin, client retention, regulatory developments, fiduciary and contractual responsibilities. Funds invested in illiquid assets such as commercial property are particularly exposed to liquidity risk. The risk profile is regularly monitored.
A client relationship team is in place to manage client retention risk, while all new asset management products undergo a review and approval process at each stage of the product development process, including approvals from legal, compliance and risk functions. Investment performance against client objectives relative to agreed benchmarks is monitored as part of our investment performance and risk management process, and subject to further independent oversight and challenge by a specialist risk team, reporting directly to the Aviva Investors’ Chief Risk Officer.
(h) Operational risk Operational risk is the risk of direct or indirect loss, arising from inadequate or failed internal processes, people and systems, or external events including changes in the regulatory environment. We have limited appetite for operational risk and aim to reduce these risks as far as is commercially sensible.
Our business units are primarily responsible for identifying and managing operational risks within their businesses, within the Group-wide operational risk framework including the risk and control self-assessment process. Businesses must be satisfied that all material risks falling outside our risk tolerances are being mitigated, monitored and reported to an appropriate level. Any risks with a high potential impact are monitored centrally on a regular basis. Businesses use key indicator data to help monitor the status of the risk and control environment. They also identify and capture loss events, taking appropriate action to address actual control breakdowns and promote internal learning.
The importance of digital interaction with our customers and advanced data analytics, the conduct, data protection and financial crime agenda of the European institutions, the FCA and other regulators, as well as the increasing cyber security threat, as evidenced by continuing instances of high profile cyber security breaches for other corporates in the UK and elsewhere, mean the Group has inherent risk exposure to data theft, conduct regulatory breaches (including financial crime) and customer service interruption due to IT systems failure. During 2019 we have continued to take action to reduce our residual exposure to these risks and improve our operational resilience through our conduct risk management framework, financial crime risk mitigation programme and significant investment in upgrading our IT infrastructure and security.
We are exposed to the risk that litigation, employee misconduct, operational failures, the outcome of regulatory investigations, media speculation and negative publicity, disclosure of confidential client information, inadequate services, whether or not founded, could impact our brands or reputation. Any of our brands or our reputation could also be affected if products or services recommended by us (or any of our intermediaries) do not perform as expected (whether or not the expectations are founded) or customers’ expectations for the product change. We seek to reduce this risk to as low a level as commercially sensible.

Notes to the consolidated financial statements Continued
Aviva plc Annual report and accounts 2019 238
Strategic report Governance IFRS financial statements Other information
60 – Risk management continued The FCA regularly considers whether we are meeting the requirement to treat our customers fairly and we make use of various metrics to assess our own performance, including customer advocacy, retention and complaints. Failure to meet these requirements could also impact our brands or reputation.
If we do not manage the perception of our brands and reputation successfully, it could cause existing customers or agents to withdraw from our business and potential customers or agents to choose not to do business with us.
(i) Risk and capital management (i) Sensitivity test analysis The Group uses a number of sensitivity tests to understand the volatility of earnings, the volatility of its capital requirements, and to manage its capital more efficiently. Sensitivities to economic and operating experience are regularly produced on the Group’s key financial performance metrics to inform the Group’s decision making and planning processes, and as part of the framework for identifying and quantifying the risks to which each of its business units, and the Group as a whole, are exposed.
(ii) Life insurance and investment contracts The nature of long-term business is such that a number of assumptions are made in compiling these financial statements. Assumptions are made about investment returns, expenses, mortality rates and persistency in connection with the in-force policies for each business unit. Assumptions are best estimates based on historic and expected experience of the business. A number of the key assumptions for the Group’s central scenario are disclosed elsewhere in these statements.
(iii) General insurance and health business General insurance and health claim liabilities are estimated by using standard actuarial claims projection techniques. These methods extrapolate the claims development for each accident year based on the observed development of earlier years. In most cases, no explicit assumptions are made as projections are based on assumptions implicit in the historic claims.
(iv) Sensitivity test results Illustrative results of sensitivity testing for long-term business, general insurance and health business and the fund management and non-insurance business are set out below. For each sensitivity test the impact of a reasonably possible change in a single factor is shown, with other assumptions left unchanged. Each test allows for any consequential impact on the asset and liability valuations.
Sensitivity factor Description of sensitivity factor applied
Interest rate and investment return The impact of a change in market interest rates by a 1% increase or decrease. The test allows consistently for similar changes to investment returns and movements in the market value of backing fixed interest securities.
Credit spreads The impact of a 0.5% increase in credit spreads over risk-free interest rates on corporate bonds and other non-sovereign credit assets.
Equity/property market values The impact of a change in equity/property market values by ± 10%. Expenses The impact of an increase in maintenance expenses by 10%. Assurance mortality/morbidity (life insurance only) The impact of an increase in mortality/morbidity rates for assurance contracts by 5%. Annuitant mortality (long-term insurance only) The impact of a reduction in mortality rates for annuity contracts by 5%. Gross loss ratios (non-long-term insurance only) The impact of an increase in gross loss ratios for general insurance and health business by 5%.
Long-term business Sensitivities as at 31 December 2019
31 December 2019 Impact on profit before tax £m Interest rates
+1% Interest rates
-1% Credit spreads
+0.5%
Equity/ property
+10%
Equity/ property
-10% Expenses
+10%
Assurance mortality
+5%
Annuitant mortality
-5%
Insurance participating — 5 (10) (65) 60 (50) 10 (5) Insurance non-participating (985) 1,265 (800) (120) 105 (240) (145) (955) Investment participating (85) 55 (5) (5) 5 (25) — — Investment non-participating — 5 — 5 (5) (5) — — Assets backing life shareholders’ funds (150) 170 (35) (35) 30 — — — Total (1,220) 1,500 (850) (220) 195 (320) (135) (960)
31 December 2019 Impact on shareholders’ equity before tax £m Interest rates
+1% Interest rates
-1% Credit spreads
+0.5%
Equity/ property
+10%
Equity/ property
-10% Expenses
+10%
Assurance mortality
+5%
Annuitant mortality
-5%
Insurance participating — 5 (10) (65) 60 (50) 10 (5) Insurance non-participating (985) 1,265 (800) (120) 105 (240) (145) (955) Investment participating (85) 55 (5) (5) 5 (25) — — Investment non-participating — 5 — 5 (5) (5) — — Assets backing life shareholders’ funds (190) 205 (30) (30) 30 — — — Total (1,260) 1,535 (845) (215) 195 (320) (135) (960)

Notes to the consolidated financial statements Continued
Aviva plc Annual report and accounts 2019 239
Strategic report Governance IFRS financial statements Other information
60 – Risk management continued Sensitivities as at 31 December 2018
31 December 2018 Impact on profit before tax £m Interest rates
+1% Interest rates
-1% Credit spreads
+0.5%
Equity/ property
+10%
Equity/ property
-10% Expenses
+10%
Assurance mortality
+5%
Annuitant mortality
-5%
Insurance participating (75) 35 (15) (105) 70 (20) (5) (5) Insurance non-participating (975) 1,130 (695) (125) 105 (210) (115) (865) Investment participating (40) 40 (10) (15) (15) (15) — — Investment non-participating — — — 10 (25) (20) — — Assets backing life shareholders’ funds (95) 105 (25) 20 (20) — — —
Total (1,185) 1,310 (745) (215) 115 (265) (120) (870)
31 December 2018 Impact on shareholders’ equity before tax £m Interest rates
+1% Interest rates
-1% Credit spreads
+0.5%
Equity/ property
+10%
Equity/ property
-10% Expenses
+10%
Assurance mortality
+5%
Annuitant mortality
-5%
Insurance participating (75) 35 (15) (105) 70 (20) (5) (5) Insurance non-participating (975) 1,130 (695) (125) 105 (210) (115) (865) Investment participating (40) 40 (10) (15) (15) (15) — — Investment non-participating — — — 10 (25) (20) — — Assets backing life shareholders’ funds (145) 150 (25) 25 (25) — — — Total (1,235) 1,355 (745) (210) 110 (265) (120) (870)
Changes in sensitivities between 2019 and 2018 reflect underlying movements in the value of assets and liabilities, the relative duration of assets and liabilities and asset liability management actions. The sensitivities to economic and demographic movements relate mainly to business in the UK.
General insurance and health business sensitivities as at 31 December 2019
31 December 2019 Impact on profit before tax £m Interest rates
+1% Interest rates
-1% Credit spreads
+0.5%
Equity/ property
+10%
Equity/ property
-10% Expenses
+10%
Gross loss ratios
+5%
Gross of reinsurance (210) 165 (115) 185 (175) (140) (315) Net of reinsurance (270) 215 (115) 185 (175) (140) (300)
31 December 2019 Impact on shareholders’ equity before tax £m Interest rates
+1% Interest rates
-1% Credit spreads
+0.5%
Equity/ property
+10%
Equity/ property
-10% Expenses
+10%
Gross loss ratios
+5%
Gross of reinsurance (210) 165 (115) 185 (175) (25) (315) Net of reinsurance (270) 215 (115) 185 (175) (25) (300)
Sensitivities as at 31 December 2018
31 December 2018 Impact on profit before tax £m Interest rates
+1% Interest rates
-1% Credit spreads
+0.5%
Equity/ property
+10%
Equity/ property
-10% Expenses
+10%
Gross loss ratios
+5%
Gross of reinsurance (240) 235 (115) 165 (165) (120) (325) Net of reinsurance (305) 295 (115) 165 (165) (120) (315)
31 December 2018 Impact on shareholders’ equity before tax £m Interest rates
+1% Interest rates
-1% Credit spreads
+0.5%
Equity/ property
+10%
Equity/ property
-10% Expenses
+10%
Gross loss ratios
+5%
Gross of reinsurance (240) 235 (115) 170 (170) (25) (325) Net of reinsurance (305) 295 (115) 170 (170) (25) (315)
For general insurance and health, the impact of the expense sensitivity on profit also includes the increase in ongoing administration expenses, in addition to the increase in the claims handling expense provision.

Notes to the consolidated financial statements Continued
Aviva plc Annual report and accounts 2019 240
Strategic report Governance IFRS financial statements Other information
60 – Risk management continued Fund management and non-insurance business sensitivities as at 31 December 2019
31 December 2019 Impact on profit before tax £m Interest rates
+1% Interest rates
-1% Credit spreads
+0.5%
Equity/ property
+10%
Equity/ property
-10%
Total (20) 15 40 (10) 15
31 December 2019 Impact on shareholders’ equity before tax £m Interest rates
+1% Interest rates
-1% Credit spreads
+0.5%
Equity/ property
+10%
Equity/ property
-10%
Total (15) 15 40 (10) 15
Sensitivities as at 31 December 2018
31 December 2018 Impact on profit before tax £m Interest rates
+1% Interest rates
-1% Credit spreads
+0.5%
Equity/ property
+10%
Equity/ property
-10%
Total (25) 20 30 (20) 35
31 December 2018 Impact on shareholders’ equity before tax £m Interest rates
+1% Interest rates
-1% Credit spreads
+0.5%
Equity/ property
+10%
Equity/ property
-10%
Total (20) 15 30 (20) 30
Limitations of sensitivity analysis The above tables demonstrate the effect of a change in a key assumption while other assumptions remain unchanged. In reality, there is a correlation between the assumptions and other factors. It should also be noted that these sensitivities are non-linear, and larger or smaller impacts should not be interpolated or extrapolated from these results.
The sensitivity analyses do not take into consideration that the Group’s assets and liabilities are actively managed. Additionally, the financial position of the Group may vary at the time that any actual market movement occurs. For example, the Group’s financial risk management strategy aims to manage the exposure to market fluctuations.
As investment markets move past various trigger levels, management actions could include selling investments, changing investment portfolio allocation, adjusting bonuses credited to policyholders, and taking other protective action.
A number of the business units use passive assumptions to calculate their long-term business liabilities. Consequently, a change in the underlying assumptions may not have any impact on the liabilities, whereas assets held at market value in the statement of financial position will be affected. In these circumstances, the different measurement bases for liabilities and assets may lead to volatility in shareholder equity. Similarly, for general insurance liabilities, the interest rate sensitivities only affect profit and equity where explicit assumptions are made regarding interest (discount) rates or future inflation.
Other limitations in the above sensitivity analyses include the use of hypothetical market movements to demonstrate potential risk that only represent the Group’s view of possible near-term market changes that cannot be predicted with any certainty, and the assumption that all interest rates move in an identical fashion.

Notes to the consolidated financial statements Continued
Aviva plc Annual report and accounts 2019 241
Strategic report Governance IFRS financial statements Other information
61 – Derivative financial instruments and hedging This note gives details of the various financial instruments the Group uses to mitigate risk.
The Group uses a variety of derivative financial instruments, including both exchange traded and over-the-counter instruments, in line with the Group’s overall risk management strategy. The objectives include managing exposure to market, foreign currency and/or interest rate risk on existing assets or liabilities, as well as planned or anticipated investment purchases.
In the narrative and tables below, figures are given for both the notional amounts and fair values of these instruments. The notional amounts reflect the aggregate of individual derivative positions on a gross basis and so give an indication of the overall scale of the derivative transaction. The fair values represent the gross carrying values at the year end for each class of derivative contract held (or issued) by the Group.
The fair values do not provide an indication of credit risk, as many over-the-counter transactions are contracted and documented under ISDA (International Swaps and Derivatives Association, Inc.) master agreements or their equivalent. Such agreements are designed to provide a legally enforceable set-off in the event of default, which reduces credit exposure. In addition, the Group has collateral agreements in place between the individual Group entities and relevant counterparties. See note 62 for further information on collateral and net credit risk of derivative instruments.
(a) Instruments qualifying for hedge accounting The Group has formally assessed and documented the hedge effectiveness for financial instruments designated as hedge instruments in accordance with IAS 39, Financial Instruments: Recognition and Measurement.
Net investment hedges To reduce its exposure to foreign currency risk, the Group has designated a portion of its euro denominated debt as hedge instruments to hedge a net investment in its European subsidiaries. No material disposals are expected prior to the maturity of the euro denominated debt and the hedge effectiveness is prospectively expected to remain between 80% and 125%. The carrying value of the debt at 31 December 2019 was £2,331 million (2018: £2,468 million) and its fair value at that date was £2,604 million (2018: £2,515 million).
Foreign exchange gains of £137 million (2018: losses of £27 million) on translation of the debt to sterling at the statement of financial position date in respect of the effective portion have been recognised in the hedging instruments reserve in shareholders’ equity. The hedge has been fully effective during the year. A gain of £4 million was recognised in the income statement in the prior year due to the termination of a net investment hedge.

Notes to the consolidated financial statements Continued
Aviva plc Annual report and accounts 2019 242
Strategic report Governance IFRS financial statements Other information
61 – Derivative financial instruments and hedging continued (b) Derivatives not qualifying for hedge accounting Certain derivatives either do not qualify for hedge accounting under IAS 39 or the option to designate them as hedge instruments has not been taken. These are referred to below as non-hedge derivatives.
(i) The Group’s non-hedge derivatives at 31 December 2019 and 2018 were as follows:
2019 Restated1
2018
Contract/ notional amount
£m
Fair value asset
£m
Fair value liability
£m
Contract/ notional amount
£m
Fair value asset
£m
Fair value liability
£m
Foreign exchange contracts OTC
Forwards 54,269 1,094 (438) 43,247 148 (256) Interest rate and currency swaps 6,937 141 (316) 7,908 29 (708) Options — — — 1,256 10 —
Total 61,206 1,235 (754) 52,411 187 (964)
Interest rate contracts OTC
Forwards 688 63 (35) 283 34 (23) Swaps 50,549 4,685 (2,727) 64,323 3,756 (2,266) Options 213 2 (8) 203 19 (20) Swaptions 944 151 (2) 18,853 419 (64)
Exchange traded Futures 11,438 52 (85) 6,007 56 (39)
Total 63,832 4,953 (2,857) 89,669 4,284 (2,412)
Equity/Index contracts OTC
Options 13,712 74 (30) 18,050 63 (36) Exchange traded
Futures 8,583 74 (73) 12,067 8 (594) Options 2,427 225 (4) 3,490 441 (14)
Total 24,722 373 (107) 33,607 512 (644) Credit contracts 10,088 18 (324) 11,055 22 (288) Other 14,136 518 (2,475) 17,543 352 (2,170)
Total at 31 December 173,984 7,097 (6,517) 204,285 5,357 (6,478) 1 Following a review of the Group’s presentation of consolidated investment funds, comparative amounts have been restated from those previously reported. The restatement has had no impact on the profit for the year or equity.
See note 1(a) for further information.
Fair value assets of £7,097 million (2018 restated: £5,357 million) are recognised as ‘Derivative financial instruments’ in note 28(a), while fair value liabilities of £6,517 million (2018 restated: £6,478 million) are recognised as ‘Derivative liabilities’ in note 54.
The Group’s derivative risk management policies are outlined in note 60.
(ii) The contractual undiscounted cash flows in relation to non-hedge derivative liabilities have the following maturities:
2019
£m
Restated1
2018 £m
Within 1 year 1,098 2,132 Between 1 and 2 years 593 512 Between 2 and 3 years 448 445 Between 3 and 4 years 434 384 Between 4 and 5 years 358 301 After 5 years 3,996 3,359 6,927 7,133 1 Following a review of the Group’s presentation of consolidated investment funds, comparative amounts have been restated from those previously reported. The restatement has had no impact on the profit for the year or equity.
See note 1(a) for further information.
(c) Collateral Certain derivative contracts, primarily interest rate and currency swaps, involve the receipt or pledging of cash and non-cash collateral. The amounts of cash collateral receivable or repayable are included in notes 29 and 54 respectively. Collateral received and pledged by the Group is detailed in note 62.

Notes to the consolidated financial statements Continued
Aviva plc Annual report and accounts 2019 243
Strategic report Governance IFRS financial statements Other information
62 – Financial assets and liabilities subject to offsetting, enforceable master netting agreements and similar arrangements (a) Offsetting arrangements Financial assets and liabilities are offset in the statement of financial position when the Group has a legally enforceable right to offset and has the intention to settle the asset and liability on a net basis, or to realise the asset and settle the liability simultaneously.
Aviva mitigates credit risk in derivative contracts by entering into collateral agreements, where practical, and into ISDA master netting agreements for each of the legal entities to facilitate its right to offset credit risk exposure. The credit support agreement will normally dictate the threshold over which collateral needs to be pledged by Aviva or its counterparty.
Derivative transactions requiring Aviva or its counterparty to post collateral are typically the result of over-the-counter derivative trades, comprised mostly of interest rate swaps, currency swaps and credit default swaps. These transactions are conducted under terms that are usual and customary to standard long-term borrowing, derivative, securities lending and securities borrowing activities. The derivative assets and liabilities in the table below are made up of the contracts described in detail in note 61.
Aviva participates in a number of stock lending and repurchase arrangements. In some of these arrangements cash is exchanged by Aviva for securities and a related receivable is recognised within ‘Loans to banks’ in note 25. These arrangements are reflected in the tables below. In instances where the collateral is recognised on the statement of financial position, the obligation for its return is included within ‘Payables and other financial liabilities’ in note 54.
In other arrangements, securities are exchanged for other securities. The collateral received must be in a readily realisable form such as listed securities and is held in segregated accounts. Transfer of title always occurs for the collateral received. In many instances, however, no market risk or economic benefit is exchanged and these transactions are not recognised on the statement of financial position in accordance with our accounting policies, and accordingly not included in the tables below.
Amounts subject to enforceable netting arrangements
Offset under IAS 32 Amounts under a master netting agreement
but not offset under IAS 32
31 December 2019
Gross amounts
£m
Amounts offset
£m
Net amounts reported in the
statement of financial position
£m
Financial instruments
£m
Cash collateral
£m
Securities collateral received /
pledged £m
Net amount
£m
Financial assets Derivative financial assets 6,570 — 6,570 (4,646) (999) (164) 761 Loans to banks and repurchase arrangements 8,830 — 8,830 — (300) (2,980) 5,550 Total financial assets 15,400 — 15,400 (4,646) (1,299) (3,144) 6,311 Financial liabilities Derivative financial liabilities (5,682) — (5,682) 3,961 40 1,130 (551) Other financial liabilities (2,671) — (2,671) — — 2,671 — Total financial liabilities (8,353) — (8,353) 3,961 40 3,801 (551)

Notes to the consolidated financial statements Continued
Aviva plc Annual report and accounts 2019 244
Strategic report Governance IFRS financial statements Other information
62 – Financial assets and liabilities subject to offsetting, enforceable master netting agreements and similar arrangements continued Amounts subject to enforceable netting arrangements
Offset under IAS 32 Amounts under a master netting agreement
but not offset under IAS 32
Restated1 31 December 2018
Gross amounts
£m
Amounts offset
£m
Net amounts reported in the
statement of financial position
£m
Financial instruments
£m
Cash collateral
£m
Securities collateral received /
pledged £m
Net amount
£m
Financial assets Derivative financial assets 4,447 — 4,447 (2,934) (1,023) (186) 304 Loans to banks and repurchase arrangements 9,322 — 9,322 — (300) (1,614) 7,408
Total financial assets 13,769 — 13,769 (2,934) (1,323) (1,800) 7,712
Financial liabilities Derivative financial liabilities (5,609) — (5,609) 3,435 376 1,288 (510) Other financial liabilities (3,314) — (3,314) — — 3,314 — Total financial liabilities (8,923) — (8,923) 3,435 376 4,602 (510) 1 Following a review of the Group’s presentation of consolidated investment funds, comparative amounts have been restated from those previously reported. The review identified amounts presented within cash and cash
equivalents that are now presented as loans to banks and repurchase arrangements in the table above. The restatement has had no impact on the profit for the year or equity. See note 1(a) for further information.
Derivative assets are recognised as ‘Derivative financial instruments’ in note 28(a), while fair value liabilities are recognised as ‘Derivative liabilities’ in note 54. £527 million (2018 restated: £910 million) of derivative assets and £835 million (2018 restated: £869 million) of derivative liabilities are not subject to master netting agreements and are therefore excluded from the table above.
Amounts receivable related to securities lending and reverse-repurchase arrangements totalling £8,830 million (2018 restated: £9,322 million) are recognised within ‘Loans to banks’ in note 25.
Other financial liabilities presented above represent liabilities related to repurchase arrangements recognised within ‘Obligations for repayment of cash collateral received’ in note 54.
(b) Collateral In the tables above, the amounts of assets or liabilities presented in the consolidated statement of financial position are offset first by financial instruments that have the right of offset under master netting or similar arrangements with any remaining amount reduced by the amount of cash and securities collateral. The actual amount of collateral may be greater than amounts presented in the tables above in the case of over collateralisation.
The total amount of collateral received which the Group is permitted to sell or repledge in the absence of default, excluding collateral related to balances recognised within ‘Loans to banks’ disclosed in note 25, was £20,984 million (2018 restated: £19,870 million), all of which other than £7,567 million (2018 restated: £5,650 million) is related to securities lending arrangements. Collateral of £1,547 million (2018: £1,914 million) has been received related to balances recognised within ‘Loans to banks’ in note 25. The value of collateral that was actually sold or repledged in the absence of default was £nil (2018: £nil).
The level of collateral held is monitored regularly, with further collateral obtained where this is considered necessary to manage the Group’s risk exposure.

Notes to the consolidated financial statements Continued
Aviva plc Annual report and accounts 2019 245
Strategic report Governance IFRS financial statements Other information
63 – Related party transactions This note gives details of the transactions between Group companies and related parties which comprise our joint ventures, associates and staff pension schemes.
The Group undertakes transactions with related parties in the normal course of business. Loans to related parties are made on normal arm’s-length commercial terms.
Services provided to, and by related parties
2019 2018
Income earned
in the year £m
Expenses incurred
in the year £m
Payable at year end
£m
Receivable at year end
£m
Income earned in the year
£m
Expenses incurred
in the year £m
Payable at year end
£m
Receivable at year end
£m
Associates 1 — — 4 1 — — 2 Joint ventures 54 — — 4 49 — (1) 2 Employee pension schemes 9 — — 6 10 — — 7
64 — — 14 60 — (1) 11
Transactions with joint ventures in the UK relate to the property management undertakings, the most material of which are listed in note 19(a)(iii). The Group has equity interests in these joint ventures, together with the provision of administration services and financial management to many of them. Our fund management companies also charge fees to these joint ventures for administration services and for arranging external finance.
Key management personnel of the Company may from time to time purchase insurance, savings, asset management or annuity products marketed by group companies on equivalent terms to those available to all employees of the Group. In 2019, other transactions with key management personnel were not deemed to be significant either by size or in the context of their individual financial positions.
Our UK fund management companies manage most of the assets held by the Group’s main UK staff pension scheme, for which they charge fees based on the level of funds under management. The main UK scheme holds investments in Group-managed funds and insurance policies with other group companies, as explained in note 52(b)(ii). As at 31 December 2019, the Friends Provident Pension Scheme (‘FPPS’), acquired in 2015 as part of the acquisition of the Friends Life business, held an insurance policy of £646 million (2018: £620 million) issued by a group company, which eliminates on consolidation.
The related parties’ receivables are not secured and no guarantees were received in respect thereof. The receivables will be settled in accordance with normal credit terms.
During the period, the ASPS completed a bulk annuity buy-in transaction with Aviva Life & Pensions UK Limited (AVLAP), a Group company. At inception, the buy-in insured approximately 4,300 deferred and 1,500 current pensioner liabilities. A premium of £1,665 million was paid by the scheme to AVLAP, with AVLAP recognising gross insurance liabilities of £1,334 million. The difference between the premium and the gross liabilities implies a profit of £331 million, which does not include costs incurred by the Group associated with the transaction, and is driven primarily by differences between the measurement bases used to calculate the premium and the accounting value of the associated gross liabilities. The ASPS recognised a plan asset of £1,126 million, with the difference between the plan asset recognised and the premium paid being recognised as an actuarial loss through Other Comprehensive Income. As at 31 December 2019, AVLAP recognised technical provisions of £1,243 million in relation to the buy-in which have been included within the Group’s gross insurance liabilities, and the ASPS held a transferable plan asset of £1,144 million which does not eliminate on consolidation.
Key management compensation The total compensation to those employees classified as key management, being those having authority and responsibility for planning, directing and controlling the activities of the Group, including the executive and non-executive directors is as follows:
2019
£m 2018
£m
Salary and other short-term benefits 12.3 7.9 Other long-term benefits 3.2 8.6 Post-employment benefits 1.3 1.5 Equity compensation plans 12.7 10.5 Termination benefits 1.0 —
Total 30.5 28.5
Information concerning individual directors’ emoluments, interests and transactions is given in the Directors’ Remuneration Report.

Notes to the consolidated financial statements Continued
Aviva plc Annual report and accounts 2019 246
Strategic report Governance IFRS financial statements Other information
64 – Organisational structure The following chart shows, in simplified form, the organisational structure of the Group as at 31 December 2019. Aviva plc is the holding company of the Group.
Parent company Aviva plc
Subsidiaries The principal subsidiaries of the Company at 31 December 2019 are listed below by country of incorporation.
A complete list of the Group’s related undertakings comprising of subsidiaries, joint ventures, associates and other significant holdings is contained within note 65.
* Incorporated in England and Wales ** Incorporated in People’s Republic of China. *** Incorporated in Scotland
United Kingdom Aviva Central Services UK Limited Aviva Employment Services Limited Aviva Equity Release UK Limited Aviva Health UK Limited Aviva Insurance Limited Aviva International Insurance Limited Aviva Investors Global Services Limited Aviva Investors Pensions Limited Aviva Investors UK Fund Services Limited Aviva Life & Pensions UK Limited Aviva Life Services UK Limited Aviva Pension Trustees UK Limited Aviva UK Digital Limited Aviva Wrap UK Limited Gresham Insurance Company Limited The Ocean Marine Insurance Company Limited Aviva Management Services UK Limited Aviva Administration Limited Friends Provident International Limited1
Barbados Victoria Reinsurance Company Ltd
Bermuda Aviva Re Limited
Canada Aviva Canada Inc. and its principal subsidiaries: Aviva Insurance Company of Canada Aviva General Insurance Company Elite Insurance Company Pilot Insurance Company Scottish & York Insurance Co. Limited S&Y Insurance Company Traders General Insurance Company
France Aviva France SA (99.99%) and its principal subsidiaries: Aviva Assurances SA (99.9%) Aviva Investors France SA (99.9%) Aviva Investors Real Estate France SA (99.9%) Aviva Solutions (99.9%) Aviva Vie SA (99.9%) Locamat SAS (99.9%) NEWCO (99.9%)
Ireland Aviva Life and Pensions Ireland Designated Activity Company Aviva Insurance Ireland Designated Activity Company
1 See note 4(b) for further details in respect of operations classified as held for sale
Aviva plc*
Aviva LifeHoldings UKLimited*
Aviva InvestorsHoldingsLimited*
Aviva CentralServices UKLimited*
Aviva InsuranceLimited***
AvivaInternationalInsurance Limited*
Overseasand otherSubsidiaries
AvivaInternationalHoldings Limited*
UK LifeSubsidiaries
InvestmentManagementSubsidiaries
Overseasand otherSubsidiaries
UK & Ireland GeneralInsurance Subsidiaries
Canada GeneralInsuranceSubsidaries
AvivaEmploymentServices Limited*
Aviva – COFCO LifeInsurance CompanyLimited**
GeneralAccident plc***
Aviva GroupHoldings Limited*
Friends Life Holdings plc*
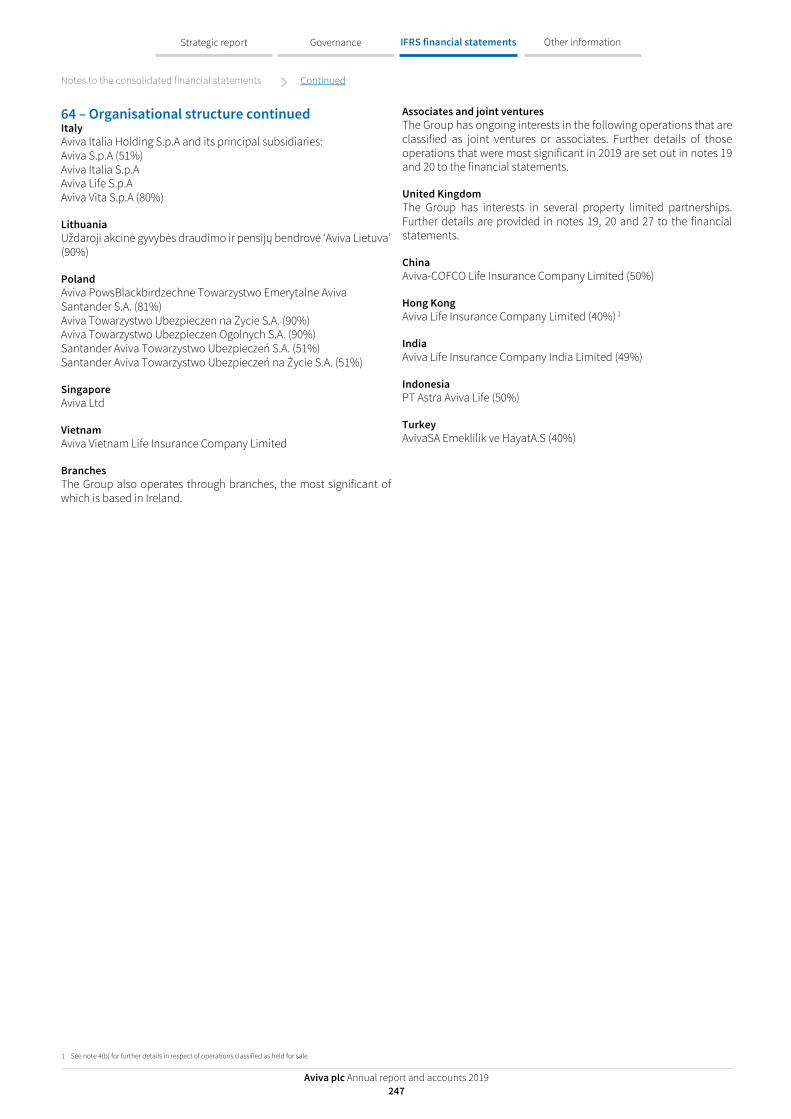
Notes to the consolidated financial statements Continued
Aviva plc Annual report and accounts 2019 247
Strategic report Governance IFRS financial statements Other information
64 – Organisational structure continued Italy Aviva Italia Holding S.p.A and its principal subsidiaries: Aviva S.p.A (51%) Aviva Italia S.p.A Aviva Life S.p.A Aviva Vita S.p.A (80%)
Lithuania Uždaroji akcinė gyvybės draudimo ir pensijų bendrovė ‘Aviva Lietuva’ (90%)
Poland Aviva PowsBlackbirdzechne Towarzystwo Emerytalne Aviva Santander S.A. (81%) Aviva Towarzystwo Ubezpieczen na Zycie S.A. (90%) Aviva Towarzystwo Ubezpieczen Ogolnych S.A. (90%) Santander Aviva Towarzystwo Ubezpieczeń S.A. (51%) Santander Aviva Towarzystwo Ubezpieczeń na Życie S.A. (51%)
Singapore Aviva Ltd
Vietnam Aviva Vietnam Life Insurance Company Limited
Branches The Group also operates through branches, the most significant of which is based in Ireland.
Associates and joint ventures The Group has ongoing interests in the following operations that are classified as joint ventures or associates. Further details of those operations that were most significant in 2019 are set out in notes 19 and 20 to the financial statements.
United Kingdom The Group has interests in several property limited partnerships. Further details are provided in notes 19, 20 and 27 to the financial statements.
China Aviva-COFCO Life Insurance Company Limited (50%)
Hong Kong Aviva Life Insurance Company Limited (40%) 1
India Aviva Life Insurance Company India Limited (49%)
Indonesia PT Astra Aviva Life (50%)
Turkey AvivaSA Emeklilik ve HayatA.S (40%)
1 See note 4(b) for further details in respect of operations classified as held for sale

Notes to the consolidated financial statements Continued
Aviva plc Annual report and accounts 2019 248
Strategic report Governance IFRS financial statements Other information
65 – Related Undertakings The Companies Act 2006 requires disclosure of certain information about the Group’s related undertakings which is set out in this note. Related undertakings comprise subsidiaries, joint ventures, associates and other significant holdings. Significant holdings are where the Group either has a shareholding greater than or equal to 20% of the nominal value of any share class, or a book value greater than 20% of the Group’s assets.
The definition of a subsidiary undertaking in accordance with the Companies Act 2006 is different from the definition under IFRS. As a result, the related undertakings included within the list below may not be the same as the undertakings consolidated in the Group IFRS financial statements. See accounting policies (D) Consolidation principles for further detail on principles of consolidation and definition of joint ventures.
The Group’s related undertakings along with the country of incorporation, the registered address, the classes of shares held and the effective percentage of equity owned at 31 December 2019 are disclosed below.
The direct related undertakings of the Company as at 31 December 2019 are listed below:
Name of undertaking Country of incorporation Registered address Share class1 % held
Aviva-COFCO Life Insurance Company Ltd2 China 12/F, Block A, Landgent Centre, 20 East Third Ring Middle Road, Beijing, 100022
Ordinary shares 50
General Accident plc United Kingdom Pitheavlis, Perth, Perthshire, PH2 0NH Ordinary shares 100
Aviva Group Holdings Limited United Kingdom St Helen’s, 1 Undershaft, London, EC3P 3DQ Ordinary shares 100
The indirect related undertakings of the Company as at 31 December 2019 are listed below:
Company name Share Class1 % held
Australia
c/o TMF Corporate Services (Aust) Pty Ltd, 201 Elizabeth Street, Australia 2000
Aviva Investors Pacific Pty Ltd Ordinary 100
Barbados
c/o USA Risk Group (Barbados) Ltd., 6th Floor, CGI Tower, Warrens, St. Michael, BB22026
Victoria Reinsurance Company Ltd.
Common Shares 100
Belgium
Avenue Louise 326, Boîte 30, 1050 Ixelles
Parnasse Square Invest Ordinary Shares 99
Bermuda
Cumberland House, 7th Floor 1 Victoria Street, Bermuda
Aviva Re Limited Ordinary 100 The Vallis Building, No 58 Par-la-Ville Road, Hamilton HM11 Bermuda
Lend Lease JEM Partners Fund Limited
Ordinary 22
Canada 10 Aviva Way, Suite 100, Markham On L6G 0G1
9543864 Canada Inc. Common 100 Aviva Canada Inc. Voting Interest 100 Aviva General Insurance Company
Common 100
Aviva Insurance Company of Canada
Common 100
Aviva Warranty Services Inc. Common 100 Bay-Mill Specialty Insurance Adjusters Inc.
Common 100
Elite Insurance Company Common 100 Insurance Agent Service Inc. Common 100 National Home Warranty Group Inc.
Common 100
Nautimax Ltd Ordinary 100 OIS Ontario Insurance Service Limited
Common 100
Company name Share Class1 % held
Pilot Insurance Company Common 100 S&Y Insurance Company Common 100 Scottish & York Insurance Co. Limited
Common Preference 100
Traders General Insurance Company
Common 100
Wayfarer Insurance Brokers Limited
Common 100
100 King Street West, Suite 4900, Toronto On M5X 2A2
Aviva Investors Canada Inc. Common 100 480 University Avenue, Suite 800, Toronto On M5G 1V2
Prolink Limited Common A 34 555 Chabanel Ouest, Bureau 900, Montreal QC H2N 2H8
Aviva Agency Services Inc. Common A 100
Cayman Islands
Victory Arcadia Fund OEIC 46
China
Units 1805-1807, 18th Floor, Block H Office Building, Phoenix Land Plaza, No. A5 Yard, Shuguangxili, Chaoyang District, Beijing
Aviva-Cofco Yi Li Asset Management Co Ltd2
Ordinary Shares 21
12F, 15F Block A, 27F Block B Landgent Centre, 20 East Third Ring Middle Road, Beijing, China
Aviva-Cofco Life Insurance Co. Ltd
Ordinary 50
Czech Republic
5/482 Ve Svahu, Prague 4, 14700, Czech Republic
AIEREF Renewable Energy s.r.o
France
3 Boulevard Saint Martin Aviva Impact Investing France Ordinary 100 128 Boulevard Raspail, 75006, Paris
UFF Oblicontext 2021-A (UFFo21A)
FCP 98
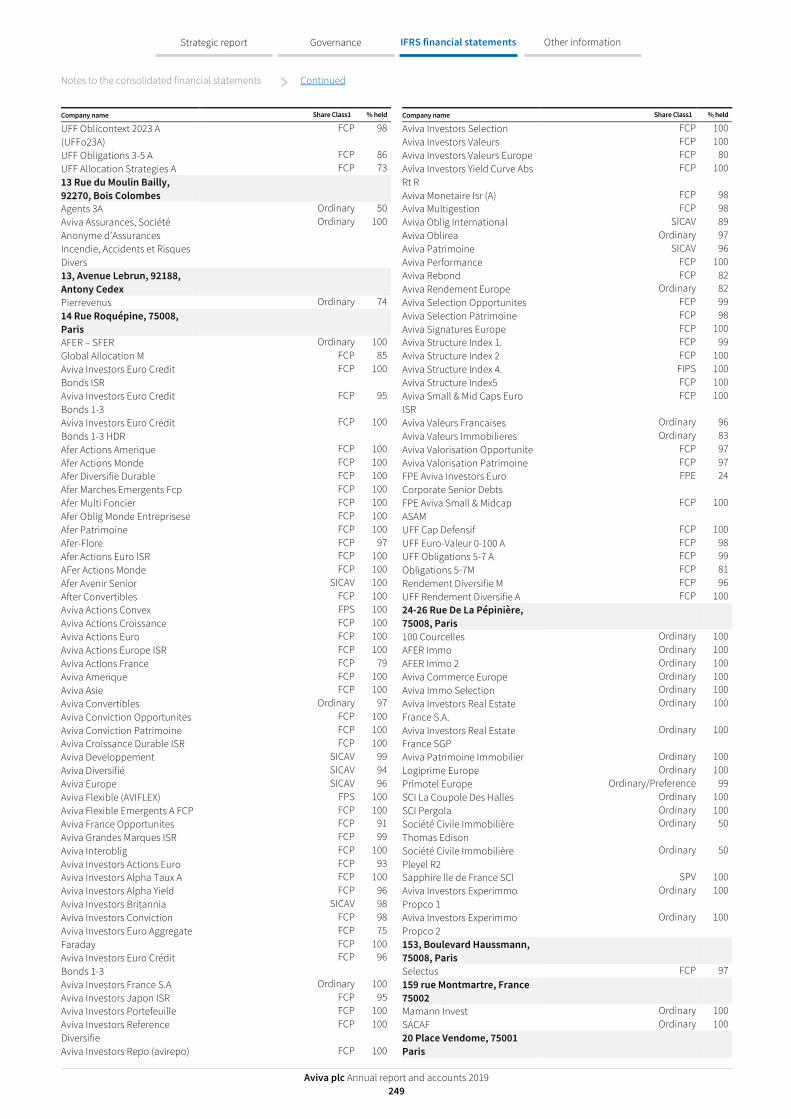
Notes to the consolidated financial statements Continued
Aviva plc Annual report and accounts 2019 249
Strategic report Governance IFRS financial statements Other information
Company name Share Class1 % held
UFF Oblicontext 2023 A (UFFo23A)
FCP 98
UFF Obligations 3-5 A FCP 86 UFF Allocation Strategies A FCP 73 13 Rue du Moulin Bailly, 92270, Bois Colombes
Agents 3A Ordinary 50 Aviva Assurances, Société Anonyme d’Assurances Incendie, Accidents et Risques Divers
Ordinary 100
13, Avenue Lebrun, 92188, Antony Cedex
Pierrevenus Ordinary 74 14 Rue Roquépine, 75008, Paris
AFER – SFER Ordinary 100 Global Allocation M FCP 85 Aviva Investors Euro Credit Bonds ISR
FCP 100
Aviva Investors Euro Credit Bonds 1-3
FCP 95
Aviva Investors Euro Crédit Bonds 1-3 HDR
FCP 100
Afer Actions Amerique FCP 100 Afer Actions Monde FCP 100 Afer Diversifie Durable FCP 100 Afer Marches Emergents Fcp FCP 100 Afer Multi Foncier FCP 100 Afer Oblig Monde Entreprisese FCP 100 Afer Patrimoine FCP 100 Afer-Flore FCP 97 Afer Actions Euro ISR FCP 100 AFer Actions Monde FCP 100 Afer Avenir Senior SICAV 100 After Convertibles FCP 100 Aviva Actions Convex FPS 100 Aviva Actions Croissance FCP 100 Aviva Actions Euro FCP 100 Aviva Actions Europe ISR FCP 100 Aviva Actions France FCP 79 Aviva Amerique FCP 100 Aviva Asie FCP 100 Aviva Convertibles Ordinary 97 Aviva Conviction Opportunites FCP 100 Aviva Conviction Patrimoine FCP 100 Aviva Croissance Durable ISR FCP 100 Aviva Developpement SICAV 99 Aviva Diversifié SICAV 94 Aviva Europe SICAV 96 Aviva Flexible (AVIFLEX) FPS 100 Aviva Flexible Emergents A FCP FCP 100 Aviva France Opportunites FCP 91 Aviva Grandes Marques ISR FCP 99 Aviva Interoblig FCP 100 Aviva Investors Actions Euro FCP 93 Aviva Investors Alpha Taux A FCP 100 Aviva Investors Alpha Yield FCP 96 Aviva Investors Britannia SICAV 98 Aviva Investors Conviction FCP 98 Aviva Investors Euro Aggregate FCP 75 Faraday FCP 100 Aviva Investors Euro Crédit Bonds 1-3
FCP 96
Aviva Investors France S.A Ordinary 100 Aviva Investors Japon ISR FCP 95 Aviva Investors Portefeuille FCP 100 Aviva Investors Reference Diversifie
FCP 100
Aviva Investors Repo (avirepo) FCP 100
Company name Share Class1 % held
Aviva Investors Selection FCP 100 Aviva Investors Valeurs FCP 100 Aviva Investors Valeurs Europe FCP 80 Aviva Investors Yield Curve Abs Rt R
FCP 100
Aviva Monetaire Isr (A) FCP 98 Aviva Multigestion FCP 98 Aviva Oblig International SICAV 89 Aviva Oblirea Ordinary 97 Aviva Patrimoine SICAV 96 Aviva Performance FCP 100 Aviva Rebond FCP 82 Aviva Rendement Europe Ordinary 82 Aviva Selection Opportunites FCP 99 Aviva Selection Patrimoine FCP 98 Aviva Signatures Europe FCP 100 Aviva Structure Index 1. FCP 99 Aviva Structure Index 2 FCP 100 Aviva Structure Index 4. FIPS 100 Aviva Structure Index5 FCP 100 Aviva Small & Mid Caps Euro ISR
FCP 100
Aviva Valeurs Francaises Ordinary 96 Aviva Valeurs Immobilieres Ordinary 83 Aviva Valorisation Opportunite FCP 97 Aviva Valorisation Patrimoine FCP 97 FPE Aviva Investors Euro Corporate Senior Debts
FPE 24
FPE Aviva Small & Midcap ASAM
FCP 100
UFF Cap Defensif FCP 100 UFF Euro-Valeur 0-100 A FCP 98 UFF Obligations 5-7 A FCP 99 Obligations 5-7M FCP 81 Rendement Diversifie M FCP 96 UFF Rendement Diversifie A FCP 100 24-26 Rue De La Pépinière, 75008, Paris
100 Courcelles Ordinary 100 AFER Immo Ordinary 100 AFER Immo 2 Ordinary 100 Aviva Commerce Europe Ordinary 100 Aviva Immo Selection Ordinary 100 Aviva Investors Real Estate France S.A.
Ordinary 100
Aviva Investors Real Estate France SGP
Ordinary 100
Aviva Patrimoine Immobilier Ordinary 100 Logiprime Europe Ordinary 100 Primotel Europe Ordinary/Preference 99 SCI La Coupole Des Halles Ordinary 100 SCI Pergola Ordinary 100 Société Civile Immobilière Thomas Edison
Ordinary 50
Société Civile Immobilière Pleyel R2
Ordinary 50
Sapphire lle de France SCI SPV 100 Aviva Investors Experimmo Propco 1
Ordinary 100
Aviva Investors Experimmo Propco 2
Ordinary 100
153, Boulevard Haussmann, 75008, Paris
Selectus FCP 97 159 rue Montmartre, France 75002
Mamann Invest Ordinary 100 SACAF Ordinary 100 20 Place Vendome, 75001 Paris
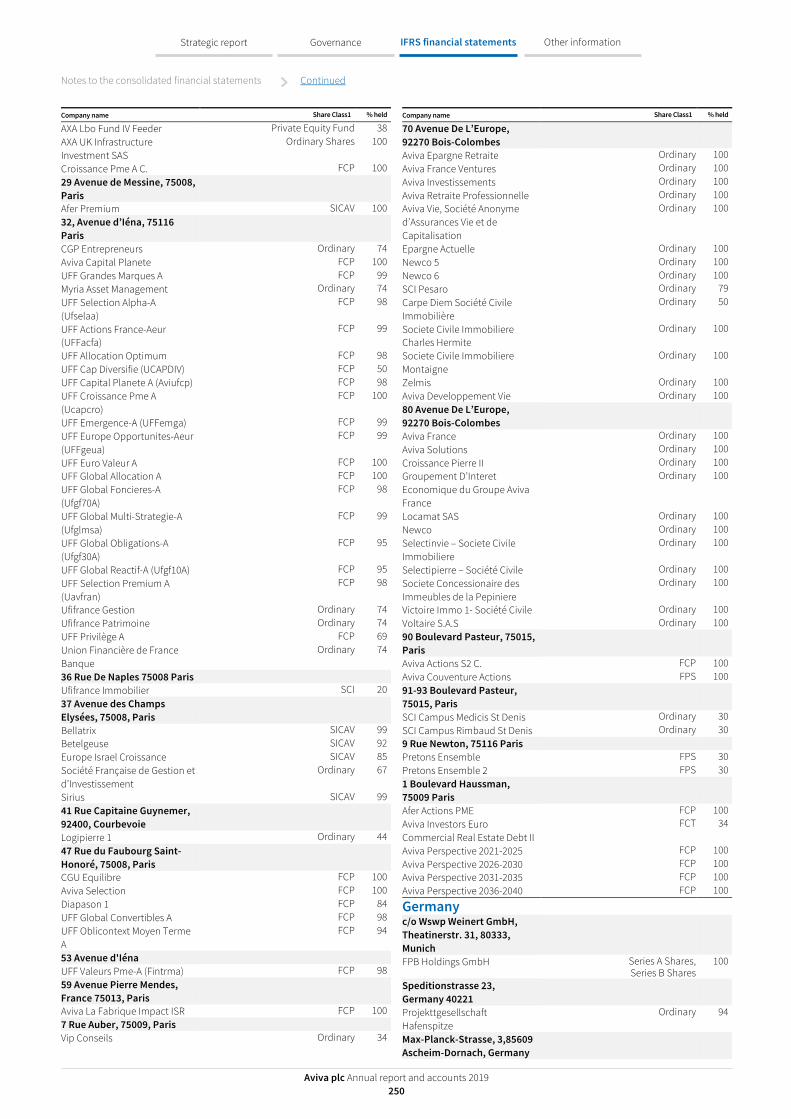
Notes to the consolidated financial statements Continued
Aviva plc Annual report and accounts 2019 250
Strategic report Governance IFRS financial statements Other information
Company name Share Class1 % held
AXA Lbo Fund IV Feeder Private Equity Fund 38 AXA UK Infrastructure Investment SAS
Ordinary Shares 100
Croissance Pme A C. FCP 100 29 Avenue de Messine, 75008, Paris
Afer Premium SICAV 100 32, Avenue d’Iéna, 75116 Paris
CGP Entrepreneurs Ordinary 74 Aviva Capital Planete FCP 100 UFF Grandes Marques A FCP 99 Myria Asset Management Ordinary 74 UFF Selection Alpha-A (Ufselaa)
FCP 98
UFF Actions France-Aeur (UFFacfa)
FCP 99
UFF Allocation Optimum FCP 98 UFF Cap Diversifie (UCAPDIV) FCP 50 UFF Capital Planete A (Aviufcp) FCP 98 UFF Croissance Pme A (Ucapcro)
FCP 100
UFF Emergence-A (UFFemga) FCP 99 UFF Europe Opportunites-Aeur (UFFgeua)
FCP 99
UFF Euro Valeur A FCP 100 UFF Global Allocation A FCP 100 UFF Global Foncieres-A (Ufgf70A)
FCP 98
UFF Global Multi-Strategie-A (Ufglmsa)
FCP 99
UFF Global Obligations-A (Ufgf30A)
FCP 95
UFF Global Reactif-A (Ufgf10A) FCP 95 UFF Selection Premium A (Uavfran)
FCP 98
Ufifrance Gestion Ordinary 74 Ufifrance Patrimoine Ordinary 74 UFF Privilège A FCP 69 Union Financière de France Banque
Ordinary 74
36 Rue De Naples 75008 Paris Ufifrance Immobilier SCI 20 37 Avenue des Champs Elysées, 75008, Paris
Bellatrix SICAV 99 Betelgeuse SICAV 92 Europe Israel Croissance SICAV 85 Société Française de Gestion et d’Investissement
Ordinary 67
Sirius SICAV 99 41 Rue Capitaine Guynemer, 92400, Courbevoie
Logipierre 1 Ordinary 44 47 Rue du Faubourg Saint-Honoré, 75008, Paris
CGU Equilibre FCP 100 Aviva Selection FCP 100 Diapason 1 FCP 84 UFF Global Convertibles A FCP 98 UFF Oblicontext Moyen Terme A
FCP 94
53 Avenue d'Iéna UFF Valeurs Pme-A (Fintrma) FCP 98 59 Avenue Pierre Mendes, France 75013, Paris
Aviva La Fabrique Impact ISR FCP 100 7 Rue Auber, 75009, Paris
Vip Conseils Ordinary 34
Company name Share Class1 % held
70 Avenue De L’Europe, 92270 Bois-Colombes
Aviva Epargne Retraite Ordinary 100 Aviva France Ventures Ordinary 100 Aviva Investissements Ordinary 100 Aviva Retraite Professionnelle Ordinary 100 Aviva Vie, Société Anonyme d’Assurances Vie et de Capitalisation
Ordinary 100
Epargne Actuelle Ordinary 100 Newco 5 Ordinary 100 Newco 6 Ordinary 100 SCI Pesaro Ordinary 79 Carpe Diem Société Civile Immobilière
Ordinary 50
Societe Civile Immobiliere Charles Hermite
Ordinary 100
Societe Civile Immobiliere Montaigne
Ordinary 100
Zelmis Ordinary 100 Aviva Developpement Vie Ordinary 100 80 Avenue De L’Europe, 92270 Bois-Colombes
Aviva France Ordinary 100 Aviva Solutions Ordinary 100 Croissance Pierre II Ordinary 100 Groupement D’Interet Economique du Groupe Aviva France
Ordinary 100
Locamat SAS Ordinary 100 Newco Ordinary 100 Selectinvie – Societe Civile Immobiliere
Ordinary 100
Selectipierre – Société Civile Ordinary 100 Societe Concessionaire des Immeubles de la Pepiniere
Ordinary 100
Victoire Immo 1- Société Civile Ordinary 100 Voltaire S.A.S Ordinary 100 90 Boulevard Pasteur, 75015, Paris
Aviva Actions S2 C. FCP 100 Aviva Couventure Actions FPS 100 91-93 Boulevard Pasteur, 75015, Paris
SCI Campus Medicis St Denis Ordinary 30 SCI Campus Rimbaud St Denis Ordinary 30 9 Rue Newton, 75116 Paris
Pretons Ensemble FPS 30 Pretons Ensemble 2 FPS 30 1 Boulevard Haussman, 75009 Paris
Afer Actions PME FCP 100 Aviva Investors Euro Commercial Real Estate Debt II
FCT 34
Aviva Perspective 2021-2025 FCP 100 Aviva Perspective 2026-2030 FCP 100 Aviva Perspective 2031-2035 FCP 100 Aviva Perspective 2036-2040 FCP 100
Germany
c/o Wswp Weinert GmbH, Theatinerstr. 31, 80333, Munich
FPB Holdings GmbH Series A Shares, Series B Shares
100
Speditionstrasse 23, Germany 40221
Projekttgesellschaft Hafenspitze
Ordinary 94
Max-Planck-Strasse, 3,85609 Ascheim-Dornach, Germany

Notes to the consolidated financial statements Continued
Aviva plc Annual report and accounts 2019 251
Strategic report Governance IFRS financial statements Other information
Company name Share Class1 % held
ASF German Retail GmbH & Co KG
Ordinary 98
German Retail I GmbH Ordinary 98 German Retail II GmbH Ordinary 98 German Retail III GmbH Ordinary 98 German Retail Investment Properties Sarl
Ordinary 98
German Retail IV GmbH Ordinary 98 German Retail IX GmbH Ordinary 98 German Retail V GmbH Ordinary 98 German Retail VII GmbH Ordinary 98 German Retail VIII GmbH Ordinary 98 Sachsenfonds GmbH Ordinary 98 Eschenheimer Anlage 1, 60315 Frankfurt
Reschop Carre Hattingen GmbH
Ordinary 95
Reschop Carre Marketing GmbH
Ordinary 100
Guernsey
PO Box 255, Trafalgar Court, Les Banques, St. Peter Port, GY1 3QL
AXA Property Trust Ltd Ordinary 28 BMO Commercial Property Trust Ltd
Ordinary 47
PO Box 34, St Martin’s House, Le Bordage, Guernsey CY1 4AU
Paragon Insurance Company Guernsey Limited
Ordinary 46
Marlborough International Management Limited, First Floor, Tudor House, Le Bordage, St Peter Port, Guernsey, Channel Islands GY1 1 DB
Marlborough International Fund PCC Limited re: Marlborough Balanced Cell
OEIC 27
PO Box 287, 4th Floor, West Wing, Trafalgar Court, Admiral Park
WSF Asian Pacific Fund OEIC 33 Hong Kong 21st Floor, Chater House, 8 Connaught Road Central
JPMorgan Indonesia Fund Unit Trust 37 30/F, One Kowloon, 1 Wang Yuen Street, Kowloon Bay, Hong Kong
Aviva Life Insurance Company Limited
Ordinary 40
India
2nd Floor, Prakash Deep Building 7, Tolstoy Marg, New Delhi, Delhi, 110001
Aviva Life Insurance Company India Limited2
Ordinary 49
A-47 (L.G.F), Hauz Khas, New Delhi, Delhi
Sesame Group India Private Limited
Ordinary 100
Pune Office Addresses 103/P3, Pentagon, Magarpatta City, Hadapsar, Pune – 411013
A.G.S. Customer Services (India) Private Limited
Ordinary 100
Company name Share Class1 % held
Indonesia
Pondok Indah Office Tower 3, 1st Floor, Jl. Sultan Iskandar Muda Kav. V-TA, Pondok Indah, Jakarta Selatan, Jakarta, 12310
PT Astra Aviva Life2 Ordinary 50
Ireland
25/28 North Wall Quay, Dublin
Aviva Investors Euro Liquidity Fund
Liquidity Fund 95
Aviva Investors Sterling Government Liquidity Fund
Liquidity Fund 94
Aviva Investors Sterling Liquidity Fund Aviva Investors Sterling Liquidity Plus Fund
Liquidity Fund Liquidity Fund
77 78
Georges Court, 54-62 Townsend Street, Dublin 2
FPPE Fund Public Limited Company
Shares Of No Par Value Shares, 1 Subscriber Euro €1 Shares
100
EM LC Gov Bond Index Fund (B14)
OEIC 23
GAM Fund Management Limited, “George Court, 54-62 Townsend Street
OEIC 23
Guild House, Guild Street, IFRS, Dublin 1
Aviva Irl Merrion Exempt Trust - Managed Fund
Unit Trust 60
Aviva Irl Merrion Multi Asset 30 Unit Trust 100 Aviva Irl Merrion Multi Asset 50 Unit Trust 100 One Park Place, Hatch Street, Dublin 2
Area Life International Assurance dac
A Shares, B Shares 100
Aviva DB Trustee Company Ireland Designated Activity Company
Ordinary 100
Aviva DC Trustee Company Ireland Designated Activity Company
Ordinary 100
Aviva Direct Ireland Limited Ordinary 100 Aviva Driving School Ireland Limited
Ordinary 100
Aviva Group Services Ireland Limited
Ordinary 100
Aviva Insurance Ireland Designated Activity Company
Ordinary 100
Aviva Life & Pensions Ireland Designated Activity Company
Ordinary 100
Aviva Life Services Ireland Limited
Ordinary 100
Peak Re Designated Activity Company
Ordinary 100
Charlotte House, Charlemount Street
Mercer Diversified Retirement Fund
OEIC 26
Mercer Multi Asset Defensive Fund
OEIC 37
Mercer Multi Asset Growth Fund
OEIC 33
Mercer Multi High Growth Fund OEIC 24 Mercer Multi Asset Moderate Growth Fund
OEIC 46
3rd Floor, 2 Harbourmaster Place, IFSC

Notes to the consolidated financial statements Continued
Aviva plc Annual report and accounts 2019 252
Strategic report Governance IFRS financial statements Other information
Company name Share Class1 % held
KBI Institutional Fund ICAV – KBI Institutional Eurozone Equity Fund
OEIC 37
Behan House 10 Mount Street Lower Dublin 2, Ireland
CALM Eurozone Equity Sub Fund
OEIC 99
AG10 Currency Fund OEIC 95 78 Sir John Rogersons Quay Dublin 2 Ireland
State Street IUT Balanced Fund S30
Unit Trust 31
Russell Investment Company Plc – Acadian Multi-Asset Absolute Return UCITS
OEIC 28
SSgA GRU Euro Index Equity Fund
Unit Trust 46
One Coleman Street, London EC2R 5AA
Legal & General ICAV – L&G World Equity Index Fund
OEIC 64
Legal & General ICAV – L&G Multi-Index EUR V Fund
OEIC 100
Legal & General ICAV – L&G Multi-Index EUR IV Fund
OEIC 100
Legal & General ICAV – L&G Multi-Index EUR III Fund
OEIC 100
Friends First House Cherrywood Science & Technology Park Loughlinstown Co. Dublin Ireland
Ashtown Management Company Limited
Ordinary 50
Friends First US Property Company Limited
Ordinary 100
1211 Avenue of the Americas (Proxy)
Annaly Credit Opportunities Ireland ICAV
Alternative Investment 100
2nd Floor, IFSC House, Int’l Financial Services Centre, Custom House Docks
Barings International Umbrella Fund – Barings International Bond Fund
Unit Trust 26
1 Custom House Plaza, IFSC Blackrock Emerging markets Bond Hard Currency Fam Fund
OEIC 23
Eurizon Flexible Equity Strategy FAM Fd
OEIC 26
JP Morgan European Equity FAM Fund
OEIC 28
Nordea Stable Performance FAM Fd
OEIC 21
Vontobel Global Equity FAM Fd OEIC 22 JP Morgan House, International Financial Services Centre
BlackRock Index Selection Fund Market Advantage Strategy
Unit Trust 27
Trafalgar Court, Admiral Park CGWM Affinity Fund OEIC 36 CGWM Diversity Fund OEIC 25 CGWM Opportunity Fund OEIC 45 13-18 City Quay, Ireland
Company name Share Class1 % held
Friends First Managed Pensions Funds Designated Activity Company
Ordinary 100
25 Cabot Square, Canary Wharf
FundLogic Alternatives plc OEIC 30 MDO Management Company SA, 19 rue de Bitbourg
Kensington Diversified Balanced Fund
OEIC 20
Kensington Diversified Growth Fund
OEIC 27
One Iron Street SPDR FTSE EPRA Europe ex UK Real Estate UCITS ETF
OIEC 24
3rd Floor, 2 Harbourmaster, IFSC
KBI Institutional Fund ICAV – KBI Institutional Eurozone Equity Fund
OEIC 36
Isle of Man
Royal Court, Castletown, IM9 1RA
Friends Provident International Limited
Ordinary B Shares, Ordinary Shares 100
Friends Provident International Services Limited
Ordinary Shares 100
Italy
Piazzetta Guastalla 1, 20122, Milan
Banca Network Investimenti SPA
Ordinary 25
Via Scarsellini 14, 20161, Milan
Aviva Italia Holding S.p.A Ordinary 100 Aviva Italia S.p.A Ordinary 100 Aviva Italia Servizi Scarl Ordinary 92 Aviva Life SPA Ordinary 100 Aviva SPA Ordinary 51 Aviva Vita Spa Ordinary 80 Milano, Piazza Lina Bo Bardi n. 3
Aviva Immobiliare Real Estate Fund 100
Jersey
19-21 Broad Street, St Helier, JE1 3PB
11-12 Hanover Square UT2 Unit Trust 50 130 Fenchurch Street UT2 Unit Trust 50 30-31 Golden Square UT2 Unit Trust 50 Barratt House UT2 Unit Trust 50 Chancery House Unit Trust Unit Trust 50 Irongate House UT Unit Trust 50 New Broad Street House UT Unit Trust 50 Pegasus House and Nuffield House UT2
Unit Trust 50
W Nine Unit Trust Unit Trust 50 3rd Floor Walker House, 28-34 Hill Street, St Helier, JE4 8PN
1 Fitzroy Place Jersey Unit Trust2
Unit Trust 50
2 Fitzroy Place Jersey Unit Trust2
Unit Trust 50
Lime Grove House , Green Street, St Helier, JE1 2ST
20 Gracechurch Unit Trust Unit Trust 100 Designer Retail Outlet Centres Unit Trust
Unit Trust 97
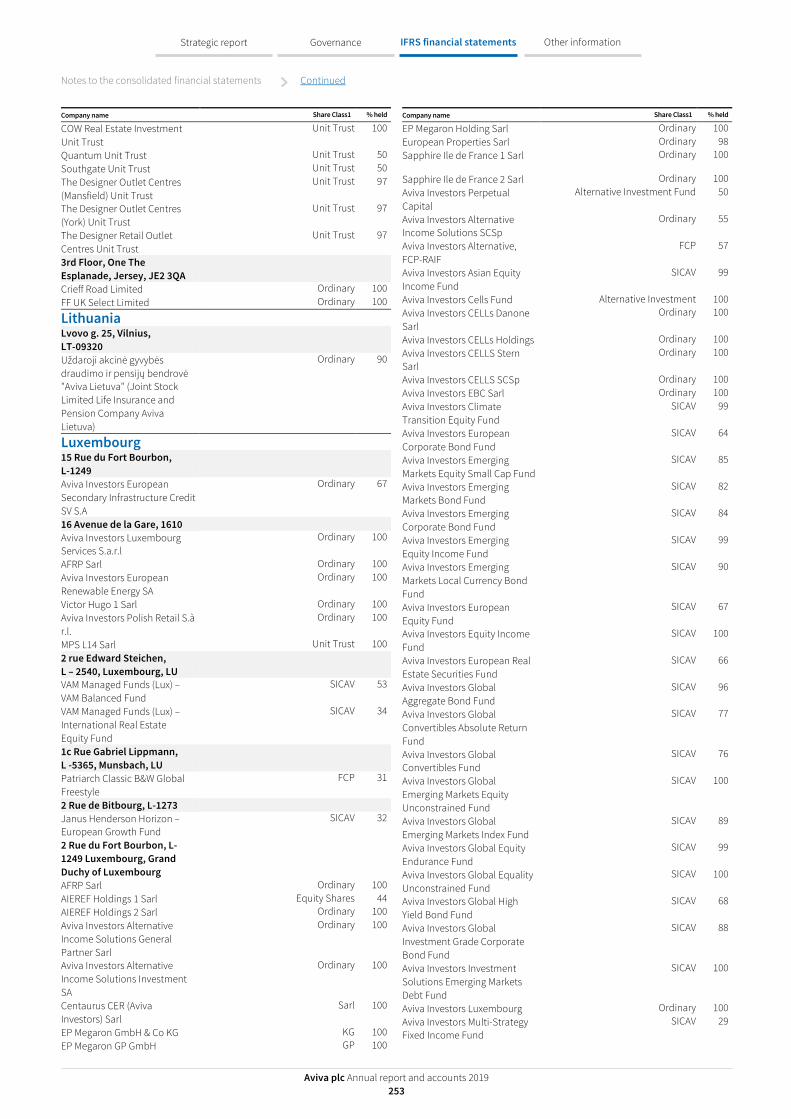
Notes to the consolidated financial statements Continued
Aviva plc Annual report and accounts 2019 253
Strategic report Governance IFRS financial statements Other information
Company name Share Class1 % held
COW Real Estate Investment Unit Trust
Unit Trust 100
Quantum Unit Trust Unit Trust 50 Southgate Unit Trust Unit Trust 50 The Designer Outlet Centres (Mansfield) Unit Trust
Unit Trust 97
The Designer Outlet Centres (York) Unit Trust
Unit Trust 97
The Designer Retail Outlet Centres Unit Trust
Unit Trust 97
3rd Floor, One The Esplanade, Jersey, JE2 3QA
Crieff Road Limited Ordinary 100 FF UK Select Limited Ordinary 100
Lithuania
Lvovo g. 25, Vilnius, LT-09320
Uždaroji akcinė gyvybės draudimo ir pensijų bendrovė "Aviva Lietuva" (Joint Stock Limited Life Insurance and Pension Company Aviva Lietuva)
Ordinary 90
Luxembourg
15 Rue du Fort Bourbon, L-1249
Aviva Investors European Secondary Infrastructure Credit SV S.A
Ordinary 67
16 Avenue de la Gare, 1610 Aviva Investors Luxembourg Services S.a.r.l
Ordinary 100
AFRP Sarl Ordinary 100 Aviva Investors European Renewable Energy SA
Ordinary 100
Victor Hugo 1 Sarl Ordinary 100 Aviva Investors Polish Retail S.à r.l.
Ordinary 100
MPS L14 Sarl Unit Trust 100 2 rue Edward Steichen, L – 2540, Luxembourg, LU
VAM Managed Funds (Lux) – VAM Balanced Fund
SICAV 53
VAM Managed Funds (Lux) –International Real Estate Equity Fund
SICAV 34
1c Rue Gabriel Lippmann, L -5365, Munsbach, LU
Patriarch Classic B&W Global Freestyle
FCP 31
2 Rue de Bitbourg, L-1273
Janus Henderson Horizon – European Growth Fund
SICAV 32
2 Rue du Fort Bourbon, L-1249 Luxembourg, Grand Duchy of Luxembourg
AFRP Sarl Ordinary 100 AIEREF Holdings 1 Sarl Equity Shares 44 AIEREF Holdings 2 Sarl Ordinary 100 Aviva Investors Alternative Income Solutions General Partner Sarl
Ordinary 100
Aviva Investors Alternative Income Solutions Investment SA
Ordinary 100
Centaurus CER (Aviva Investors) Sarl
Sarl 100
EP Megaron GmbH & Co KG KG 100 EP Megaron GP GmbH GP 100
Company name Share Class1 % held
EP Megaron Holding Sarl Ordinary 100 European Properties Sarl Ordinary 98 Sapphire Ile de France 1 Sarl Ordinary 100
Sapphire Ile de France 2 Sarl Ordinary 100 Aviva Investors Perpetual Capital
Alternative Investment Fund 50
Aviva Investors Alternative Income Solutions SCSp
Ordinary 55
Aviva Investors Alternative, FCP-RAIF
FCP 57
Aviva Investors Asian Equity Income Fund
SICAV 99
Aviva Investors Cells Fund Alternative Investment 100 Aviva Investors CELLs Danone Sarl
Ordinary 100
Aviva Investors CELLs Holdings Ordinary 100 Aviva Investors CELLS Stern Sarl
Ordinary 100
Aviva Investors CELLS SCSp Ordinary 100 Aviva Investors EBC Sarl Ordinary 100 Aviva Investors Climate Transition Equity Fund
SICAV 99
Aviva Investors European Corporate Bond Fund
SICAV 64
Aviva Investors Emerging Markets Equity Small Cap Fund
SICAV 85
Aviva Investors Emerging Markets Bond Fund
SICAV 82
Aviva Investors Emerging Corporate Bond Fund
SICAV 84
Aviva Investors Emerging Equity Income Fund
SICAV 99
Aviva Investors Emerging Markets Local Currency Bond Fund
SICAV 90
Aviva Investors European Equity Fund
SICAV 67
Aviva Investors Equity Income Fund
SICAV 100
Aviva Investors European Real Estate Securities Fund
SICAV 66
Aviva Investors Global Aggregate Bond Fund
SICAV 96
Aviva Investors Global Convertibles Absolute Return Fund
SICAV 77
Aviva Investors Global Convertibles Fund
SICAV 76
Aviva Investors Global Emerging Markets Equity Unconstrained Fund
SICAV 100
Aviva Investors Global Emerging Markets Index Fund
SICAV 89
Aviva Investors Global Equity Endurance Fund
SICAV 99
Aviva Investors Global Equality Unconstrained Fund
SICAV 100
Aviva Investors Global High Yield Bond Fund
SICAV 68
Aviva Investors Global Investment Grade Corporate Bond Fund
SICAV 88
Aviva Investors Investment Solutions Emerging Markets Debt Fund
SICAV 100
Aviva Investors Luxembourg Ordinary 100 Aviva Investors Multi-Strategy Fixed Income Fund
SICAV 29

Notes to the consolidated financial statements Continued
Aviva plc Annual report and accounts 2019 254
Strategic report Governance IFRS financial statements Other information
Company name Share Class1 % held
Aviva Investors Multi-strategy Target Income Fund
SICAV 75
Aviva Investors Multi-strategy Target Return Fund
SICAV 48
Aviva Investors Short Duration Global High Yield Bond Fund
SICAV 41
Aviva Investors Sustainable Income & Growth Fund
SICAV 98
Aviva Investors UK Equity Focus Fund
SICAV 94
Aviva Investors US Equity Income Fund
SICAV 68
German Retail Investment Property Fund
FCP 98
Hexagone.S.a.r.l SICAV 100 3 Rue des Labours, L-1912 Haspa Trendkonzept FCP 55 42 Rue de la Vallée, L-2661, Luxembourg LU
World Investment Opportunities Funds – China Performance Fund
SICAV 35
World Investment Funds – India Performance Fund
SICAV 34
46a Avenue John F Kennedy, L-1855, Luxembourg, Grand Duchy of Luxembourg
Centaurus CER (Aviva Investors) Sarl
Ordinary 100
EPI NU Sarl Ordinary 100 47 Avenue John F Kennedy, L-1855 Luxembourg
Goodman European Business Park Fund (Lux) S.àr.l.
Ordinary 50
49 Avenue J-F Kennedy, L-1855, Luxembourg LU
BMO European Growth & Income Fund
SICAV 100
BMO Diversified Growth Fund SICAV 90 BMO Global Total Return Bond Fund
SICAV 63
2 Boulevard Konrad Adenauer, L-1115, Luxembourg
Aviva Infrastructure Debt Europe SA
Fund 100
DWS Global Aribusiness FCP 20 Xtrackers II Eurozone Government Bond 15-30 UCITS ETF
SICAV 27
5, Allée Scheffer, L-2520 Pramerica Pan-European Real Estate Fund
Alternative Investment Fund 59
Pramerica Pan-European Estate Fund II
Alternative Investment Fund 25
Tikehau Italy Retail Fund II Scsp-Area12
Alternative Investment Fund 20
Tikehau Senior Loans III Alternative Investment Fund 20 5 rue Heienhaff, L-1736 Senningerberg, Grand Duchy of Luxembourg
The Jupiter Global Fund - Jupiter Financial Innovation
SICAV 26
2C rue Albert Borschette, L-1246, Luxembourg
AQR Systematic Total Return Fund II
SICAV 62
4 Rue Albert Borschette, 1246 Luxembourg
Company name Share Class1 % held
Negentrophy – Debt Select Fund
Alternative Investment Funde 32
14 Porte de France
Aviva Investors Cells Fund Alternative Investment Fund 64 15 rue du Bourbon, L-1249 Luxembourg, Grand Duchy of Luxembourg
Aviva Investors European Secondary Infrastructure Credit SV S.A
Fund 68
2-4 Rue, Eugene Ruppert – 2453, Luxembourg LU
Invesco Funds – Invesco Emerging Markets Equity Fund
SICAV 28
Invesco Funds – Invesco Global Care Fund
SICAV 35
Invesco Funds – Invesco Global Opportunities Fund
SICAV 30
Invesco Funds – Invesco UK Equity Fund
SICAV 36
Invesco Funds – Invesco US Fund
SICAV 42
562 rue de Neudorf, L – 2220 Luxembourg LU
Nordea 1 – Swedish Bond Fund SICAV 32 Nordea 1 – Swedish Short-Term Bond Fund
SICAV 32
11 rue Aldringen, L1118, Luxwmbourg LU
KMG Sicav – SIF Devere Global Frontier Markets Fund
SICAV 22
KMG Sicav – SIF Devere Medical Opportunities Fund
SICAV 20
6 H route de Treves, L – 2633, Senningerberg, LUK
Momentum Global Funds Harmony Portfolios Asian Growth Fund
SICAV 20
Momentum Global Funds Harmony Portfolios Euro Diversifed Fund
SICAV 24
6 Route de Treves, L – 2633, Senningerberg, LU
JPMorgan Funds – USD Money Market VNAV Fund
SICAV 24
Malta
Central North Business Centre, Level 1, Sqaq il-Fawwara, Sliema (Proxy)
Herakles Alternative Investment Fund 47 Herakles II Alternative Investment Fund 100
Mauritius
4th Floor, Raffles Tower, 19 Cybercity, Ebene
Reliance Emergent India Fund OEIC 88
Norway
Tollbugate 27,0157 Oslo Norway
Aviva Investors CELLs Norway AS
Cells Fund 100
Aviva CELLS Norway Holding AS
Cells Fund 100
Kongsgard Alle 20 AS Cells Fund 100
Poland
Inflancka 4b, 00-189 Warszawa
AdRate Sp z.o.o Ordinary 90

Notes to the consolidated financial statements Continued
Aviva plc Annual report and accounts 2019 255
Strategic report Governance IFRS financial statements Other information
Company name Share Class1 % held
Aviva Investors FIO Aktywnej Alokacji
UCITS 23
Aviva Investors Fio Depozyt Plus
UCITS 42
Aviva Investors Fio Malych Spolek
UCITS 68
Aviva Investors Fio Nowoczesnych Technologii
UCITS 79
Aviva Investors Fio Obligacji UCITS 79 Aviva Investors Fio Polskich Akcji
UCITS 57
Aviva Investors Sfio Akcyjny Non UCITS 100 Aviva Investors Sfio Aviva Lokacyjny
Non UCITS 71
Aviva Investors Sfio Dluzny Non UCITS 100 Aviva Investors Sfio Dluzny Spotek
Non UCITS 100
Aviva Investors Sfio Pap Nieskarbowych
Non UCITS 99
Aviva Investors Sfio Pieniezny Non UCITS 100 Aviva Investors Sfio Spolek Dywidend
Non UCITS 100
Aviva Services Spolka z organisczona odpowiedzialnoscia
Non UCITS 90
Expander Advisors Sp z.o.o Ordinary 90 Life Plus Sp z.o.o Ordinary 90 Aviva Poland Towarzystwo Funduszy Investycyjnych SA
Ordinary 95
Aviva Powszenchne Towarzystwo Emerytaine Aviva Santander SA
Ordinary 81
Aviva Towarzystwo Ubezpieczen NA Zycie SA
Ordinary 90
Aviva Towarzystwo Ubezpieczen Ogolnych SA
Ordinary 95
Santander Aviva Towarzystwo Ubezpieczen na Zycie Spolka Akcyjna
Ordinary 51
Santander Aviva Towarzystwo Ubezpieczen Spolka Akcyjna
Ordinary 51
Porowneo pl Sp z.o.o Ordinary 90 Aviva Sfio Subfundusz Aviva Oszczednosciowy
Non UCITS (AIF) 100
Aviva Spolka z ograniczona odpowiedzialnoscia
Ordinary 90
Prosta 69 Poland 00-383 Proowneo.pl Sp zoo Ordinary 90 AI Jana Powla Wroclaw BC Sp Zoo Ordinary 100
Saudi Arabia
Riyad Capital, 6775 Takhassusi Street – Olaya, Riyadh 12331 – 3712
Riyad AI Jarei Fund (SAR) Mutual Fund 28 Riyad AI Jarei Sharia Fund (SAR)
Mutual Fund 67
Riyad AI Mutahafedh Sharia Fund (SAR)
Mutual Fund 89
Riyad AI Mutawazen Sharia Fund (SAR)
Mutual Fund 80
Riyad AI Shujia’a Fund (SAR Mutual Fund 22 Riyad AI Shujia’a Sharia Fund Mutual Fund 90
Singapore
12 Marina View, #18-02 Asia Square Tower 2, 018961
Nikko AM Shenton Asia Pacific Fund
Unit Trust 66
Company name Share Class1 % held
Nikko AM Shenton Income Fund
Unit Trust 53
Nikko AM Shenton Global Green Bond Fund
Unit Trust 45
4 Shenton Way, #01-01 SGX Centre 2, Singapore, 068807
Aviva Ltd Ordinary 100 Navigator Investment Services Limited
Ordinary 100
6 Shenton Way, #09-08, OUE Downtown, 068809
Professional Advisory Holdings Ltd.
Ordinary A 92
Professional Investment Advisory Services Pte Ltd
Ordinary A 92
1 Raffles Quay #27-13 South Tower 4, Singapore 048583
Aviva Investors Asia Pte Limited Ordinary 100 6 Temasek Boulevard, #29-00, Suntec Tower 4, 038986
Aviva Asia Digital Pte. Ltd. Ordinary 100 Aviva Asia Pte Ltd Ordinary 100 Aviva Financial Advisers Pte. Ltd
Ordinary 100
Aviva Global Services (Management Services) Private Ltd.
Ordinary 100
Spain
Avda Andalucia, 10-12, Malaga
Ahorro Andaluz, S.A Ordinary 50 Avda de Bruselas – Numero 13, Edificio, America, Piso 1, Puerto d, Alcobendas 28-Madrid
Eolica Almatret SL Ordinary 45 Nanclares de Oca, numero 1-B Spain 28022
San Ramon Hoteles Todo Real Est Investments
Ordinary Ordinary
100 100
Switzerland
Stockerstrasse, 38 8002 , Zurich
Aviva Investors Schweiz GmbH Interest 100
Turkey
Saray Mah., Adnan Büyüjdeniz Cad. No:12 34768 Umraniye, Istanbul
AvivaSA Emeklilik ve Hayat Ordinary 40
United Kingdom
No 1 Dorset Street, Southampton, Hampshire SO15 2DP
Mill NU Properties Limited Ordinary A 100 Building a Future (Newham Schools) Limited
Ordinary 100
NU Local Care Centres (Bradford) Limited
Ordinary 100
NU Local Care Centres (Chichester No.1) Limited
Ordinary 100
NU Local Care Centres (Chichester No.2) Limited
Ordinary 100
NU Local Care Centres (Chichester No.3) Limited
Ordinary 100
NU Local Care Centres (Chichester No.4) Limited
Ordinary 100

Notes to the consolidated financial statements Continued
Aviva plc Annual report and accounts 2019 256
Strategic report Governance IFRS financial statements Other information
Company name Share Class1 % held
NU Local Care Centres (Chichester No.5) Limited
Ordinary 100
NU Local Care Centres (Chichester No.6) Limited
Ordinary 100
Argyll House, All Saints Passage, London SW18
Freetricity Southeast Limited Ordinary 100 Centrium 1, Griffiths Way St Albans, United Kingdom, AL1 2RD
Opal (UK) Holdings Limited Ordinary 28 Opal Information Systems Limited
Ordinary 28
Outsourced Professional Administration Limited
Ordinary 28
Synergy Financial Products Limited
Ordinary 28
29 Queen Anne’s Gate, London SW1H 9BU
LF Bentley Global Growth OEIC 58 LF Bentley Sterling Balanced Fund
OEIC 33
30 Finsbury Square, London, EC2P 2YU
The Designer Retail Outlet Centres (General Partners) Limited
GP 50
42 Dingwall Road, Croydon, Surrey, CR0 2NE
Health & Case Management Limited
Ordinary Preference 25
Ballard Investment Company Limited
Ordinary 25
4th Floor, New London House, 6 London Street, London, EC3R 7LP
Polaris U.K. Limited Ordinary 39 The Green Easter Park, Benyon Road, Reading RG7 2PQ
Homesun 2 Limited Ordinary 100 Homesun 3 Limited Ordinary 100 Homesun 4 Limited Ordinary 100 Homesun 5 Limited Ordinary 100 Homesun Limited Ordinary 100 Anesco Mid Devon Limited Ordinary 100 Anesco South West Limited Ordinary 100 Free Solar (Stage 1) Limited Ordinary 100 New Energy Residential Solar Limited
Ordinary 100
Norton Energy SLS Limited Ordinary 100 TGHC Limited Ordinary 100 5 Lister Hill, Horsforth, Leeds, LS18 5AZ
Aspire Financial Management Limited
Ordinary 47
Living in Retirement Limited Ordinary 47 Tenet Business Solutions Limited
Ordinary 47
Tenet Client Services Limited Tenet Financial Services Limited
Ordinary A Ordinary
Redeemable Ordinary
47 37
Tenet Group Limited Ordinary B 47 Tenet Limited Ordinary 47 Tenet Platform Services Limited
Ordinary A 47
TenetConnect Limited Ordinary 47 TenetConnect Services Limited Ordinary 47 TenetFinancial Solutions Limited
Ordinary 47
Company name Share Class1 % held
TenetLime Limited Ordinary 47 TenetSelect Limited Ordinary 47 5 Old Broad Street, London EC2N 1A
Architas Multi-Manager Diversified Protector 70
OEIC 50
Architas Multi-Manager Diversified Protector 80
OEIC 37
50 Stratton Street, London, W1J 8LL
Lazard Multicap UK Income Fund
OEIC 50
7 Lochside View, Edinburgh, EH12 9DH
Origo Services Limited Ordinary 22 7 Newgate Street, EC1A 7NX AXA Ethical Distribution Fund OEIC 32 AXA Rosenberg American Fund OEIC 89 AXA Rosenberg Asia Pacific Ex Japan Fund
OEIC 97
AXA Rosenberg Global Fund OEIC 88 AXA Rosenberg Japan Fund OEIC 95 8 Surrey Street, Norwich, Norfolk, NR1 3NG
Aviva Central Services UK Limited
Ordinary 100
Aviva Consumer Products UK Limited
Ordinary 100
Aviva Health UK Limited Ordinary 100 Aviva Insurance UK Limited Ordinary 100 Aviva UKGI Investments Limited
Ordinary 100
Gresham Insurance Company Limited
Ordinary 100
Healthcare Purchasing Alliance Limited2
Ordinary A 50
London and Edinburgh Insurance Company Limited
Ordinary 100
RAC Pension Trustees Limited Ordinary 100 Solus (London) Limited Ordinary 100 Synergy Sunrise (Broadlands) Limited
Ordinary 100
East Farmhouse, Cams Hall Estate, Fareham, PO16 8UT
IQUO Limited Ordinary A Shares 67 Exchange House, Primrose Street, EC2A 2HS
BMO Emerging Markets Equity Fund
OEIC 35
BMO MM Navigator Balanced Fund
OEIC 20
BMO Global Total Return Bond (GBP Hdg) Fund
Private Equity 30
Calton Square, 1 Greenside Row
Baillie Gifford Investment Funds II ICVC-Baillie Gifford UK Equity Core Fund
OEIC 20
12 Throgmorton Avenue
BlackRock Market Advantage Fund
Unit Trust 32
Pitheavlis, Perth, Perthshire, PH2 0NH
Aviva Investors Private Equity Programme 2008 Partnership
LP 40
Aviva (Peak No.1) UK Limited Ordinary 100 Aviva Insurance Limited Ordinary 100 Aviva Investors (FP) Limited Ordinary 100 Aviva Investors (FP) LP LP 100 General Accident plc Ordinary 100

Notes to the consolidated financial statements Continued
Aviva plc Annual report and accounts 2019 257
Strategic report Governance IFRS financial statements Other information
Company name Share Class1 % held
Aviva Investors (GP) Scotland Limited
GP 100
Pixham End, Dorking, Surrey, RH4 1QA
Aviva Administration Limited Ordinary 100 Aviva Investment Solutions UK Limited
Ordinary 100
Aviva Management Services UK Limited
Ordinary 100
Bankhall Support Services Limited
Ordinary 100
Friends AEL Trustees Limited Ordinary 100 Friends AELLAS Limited Ordinary 100 Friends AELRIS Limited £1 Stock 100 Friends Life and Pensions Limited
Ordinary 100
Friends Life Assurance Society Limited
Ordinary 100
Friends Life Company Limited Ordinary 100 Friends Life Distribution Limited
Ordinary 100
Friends Life FPG Limited Ordinary 100 Friends Life FPL Limited Ordinary 100 Friends Life FPLMA Limited Ordinary 100 Friends Life Holdings plc Ordinary 100 Friends Life Limited Ordinary 100 Friends Life WL Limited Ordinary 100 Friends Provident Distribution Holdings Limited
Ordinary 100
Friends Provident Investment Holdings Limited
Ordinary A 100
Friends Provident Life Assurance Limited
Ordinary 100
Friends Provident Managed Pension Funds Limited
Ordinary 100
Friends SL Nominees Limited Ordinary 100 Friends SLUA Limited Ordinary 100 Gateway Specialist Advice Services Limited
Ordinary 100
London and Manchester Group Limited
Ordinary 100
Premier Mortgage Service Limited
Ordinary 100
SB Loan Administration Limited
Ordinary 100
Sesame Bankhall Group Limited
Ordinary 100
Sesame Bankhall Valuation Services Limited
Ordinary A 75
Sesame General Insurance Services Limited
Ordinary 100
Sesame Limited Ordinary 100 Sesame Regulatory Services Limited
Ordinary 100
Sesame Services Limited Ordinary A 100 Suntrust Limited Ordinary 100 Undershaft FAL Limited Ordinary 100 Undershaft FPLLA Limited Ordinary 100 Undershaft SLPM Limited Ordinary 100 Wealth Limited Ordinary 100 St Helen’s, 1 Undershaft, London, EC3P 3DQ
1 Fitzroy Place Limited Ordinary 50 1 Liverpool Street General Partner Limited
Ordinary 100
1 Liverpool Street Nominee 1 Limited
Ordinary 100
1 Liverpool Street Nominee 2 Limited
Ordinary 100
Company name Share Class1 % held
10-11 GNS Limited (Great Newport Street)
Ordinary 100
11-12 Hanover Square LP LP 50 11-12 Hanover Square Nominee 1 Limited
Ordinary 50
11-12 Hanover Square Nominee 2 Limited
Ordinary 50
130 Fenchurch Street General Partner Limited
GP 50
130 Fenchurch Street Nominee 1 Limited
Ordinary 50
130 Fenchurch Street LP Limited Partnership 50 130 Fenchurch Street Nominee 2 Limited
Ordinary 50
1-5 Lowndes Square Management Company Limited
Ordinary 100
2 Fitzroy Place Limited Partnership
Limited Partnership 100
20 Lowndes Square Management Company Limited
Ordinary 50
20 Gracechurch (General Partner) Limited
GP 100
20 Gracechurch Limited Partnership
Limited Partnership 100
2-10 Mortimer Street (GP No1) Limited
GP 50
2-10 Mortimer Street GP Limited
Ordinary 50
2-10 Mortimer Street Limited Partnership
Limited Partnership 50
30 Station Road Nominee 1 Limited
Ordinary 50
30 Station Road Nominee 2 Limited
Ordinary 50
30 Station Road Unit Trust – Closed Ended Fund
Unit Trust 50
30 Warwick Street LP Limited Partnership 50 30 Warwick Street Nominee 1 Limited
Ordinary 50
30 Warwick Street Nominee 2 Limited
Ordinary 50
30-31 Golden Square Nominee LP
Ordinary 50
30-31 Golden Square Nominee 1 Ltd
Ordinary 50
30-31 Golden Square Nominee 2 Ltd
Ordinary 50
41-42 Lowndes Square Management Company Limited
Ordinary 100
43 Lowndes Square Management Company Limited
Ordinary 100
44-49 Lowndes Square Management Company Limited
Ordinary 100
50-60 Station Road Nominee 1 Limited
Ordinary 50
50-60 Station Road Nominee 2 Limited
Ordinary 50
6-10 Lowndes Square Management Company Limited
Ordinary 100
AI Special PFI SPV Limited Ordinary 100 Atlas Park Management Company Limited
Limited by Guarantee 100
AEP Feeder Fund V Unit Trust 100 Asl Infrastructure Equity Npv Ordinary 100

Notes to the consolidated financial statements Continued
Aviva plc Annual report and accounts 2019 258
Strategic report Governance IFRS financial statements Other information
Company name Share Class1 % held
Aviva Plc Ordinary 100 Aviva Investors 40 Spring Gardens (General Partner) Limited
GP 100
Aviva Investors Commercial Asset GP Limited
GP 100
Aviva Investors Pensions Limited
Ordinary 100
Aviva Investors Energy Centres No 1 Limited Partnership
GP 100
Aviva Investors Ground Rent Holdco Limited
Ordinary 100
Aviva Investors Infrastructure GP Limited
GP 100
Aviva Investors Infrastructure Income No 1 Limited
Ordinary 100
Aviva Investors Infrastructure Income No 2 Limited
Ordinary 100
Aviva Investors Infrastructure Income No 3 Limited
Ordinary 100
Aviva Investors Infrastructure Income No 4A Limited
Ordinary 100
Aviva Investors Infrastructure Income No 4B Limited
Ordinary 100
Aviva Investors Polish Retail GP Limited
GP 100
Aviva Investors Polish Retail Limited Partnership
Limited Partnership 100
Aviva Investors Property Fund Management Limited
Ordinary 100
Ascot Real Estate Investments LP2
Limited Partnership 50
Ascot Real Estate Investments GP LLP2
Limited Partnership 50
Aviva Group Holdings Limited Ordinary 100 Aviva Staff Pension Trustee Limited
Ordinary 100
Aviva Brands Limited Ordinary 100 Aviva Commercial Finance Limited
Ordinary 100
Aviva Company Secretarial Services Limited
Ordinary 100
Aviva Credit Services UK Limited
Ordinary 100
Aviva Employment Services Limited
Ordinary 100
Aviva Europe SE Ordinary 100 Aviva Insurance Services UK Limited
Ordinary 100
Aviva International Holdings Limited
Ordinary 100
Aviva International Insurance Limited
Ordinary 100
Aviva Investors Global Services Limited
Ordinary 100
Aviva Investors Ground Rent GP Limited
Ordinary 100
Aviva Investors Holdings Limited
Ordinary 100
Aviva Investors EBC Limited Partnership
LP 100
Aviva Investors EBC GP Limited GP 100 Aviva Investors UK Fund Services Limited
Ordinary 100
Aviva Investors UK Funds Limited
Ordinary 100
Aviva Overseas Holdings Limited
Ordinary 100
Aviva Public Private Finance Limited
Ordinary 100
Company name Share Class1 % held
Aviva UK Digital Limited Ordinary 100 Aviva UKLAP De-risking Limited Ordinary 100 Aviva Investors Real Estate Limited
Ordinary 100
Aviva Investors Realm Energy Centres GP Limited
GP 100
Aviva Investors Social Housing Limited
Ordinary 100
Aviva Investors Social Housing GP Limited
Ordinary 100
Aviva Investors UK CRESD GP Limited
GP 100
Aviva Investors UK Equity Ex Tobacco
Collective Investment Scheme 100
Aviva Investors 30 70 Global Equ Ccy Hedged Ind Fund
Collective Investment Scheme 100
Aviva Investors 40 60 Global Equity Index Fund
Collective Investment Scheme 100
Aviva Investors 50 50 Global Equity Index Fund
Collective Investment Scheme 100
Aviva Investors 60 40 Global Equity Index Fund
Collective Investment Scheme Collective Investment Scheme
100
Aviva Investors Asia Pacific ex Japan Fund
Collective Investment Scheme Collective
100
Aviva Investors Asia Pacific Property Fund
OEIC 80
Aviva Investors Balanced Life Fund
Collective Investment Scheme Collective
100
Aviva Investors Balanced Pension Fund
Collective Investment Scheme Collective
100
Aviva Investors Cautious Pension Fund
Collective Investment Scheme Collective
100
Aviva Investors Continental Euro Equity Index Fund
Collective Investment Scheme Collective
100
Aviva Investors Continental European Eq Alpha Fund
Collective Investment Scheme Collective
100
Aviva Investors Corporate Bond Fund
OEIC 93
Aviva Investors Dev Asia Pacific Ex Japan Eq Ind Fund
Collective Investment Scheme Collective
100
Aviva Investors Dev Euro Ex UK Equity Index Fund
Collective Investment Scheme Collective
100
Aviva Investors Dev World Ex UK Equity Index Fund
Collective Investment Scheme Collective
100
Aviva Investors Developd Overseas Gov Bd Ex UK Ind Fd
Collective Investment Scheme Collective
100
Aviva Investors Distribution Life Fund
Collective Investment Scheme Collective
100
Aviva Investors Europe Equity ex UK Fund
Collective Investment Scheme Collective
100
Aviva Investors European Property Fund
OEIC 77
Aviva Investors Global Equity Alpha Fund
Collective Investment Scheme Collective
100
Aviva Investors Global Equity Endurance Fund
OEIC 100
Aviva Investors Global Equity Fund
Collective Investment Scheme Collective
100
Aviva Investors Equity Income Fund
OEIC 78
Aviva Investors High Yield Bond Fund
OEIC 40
Aviva Investors Index Linked Gilt Fund
Collective Investment Scheme 100
Aviva Investors Idx-Lkd Gilts Ovr 5 Yrs Idx Fund
Collective Investment Scheme 100
Aviva Investors International Index Tracking Fund
Collective Investment Scheme 70
Aviva Investors Japan Equity Alpha Fund
Collective Investment Scheme 100
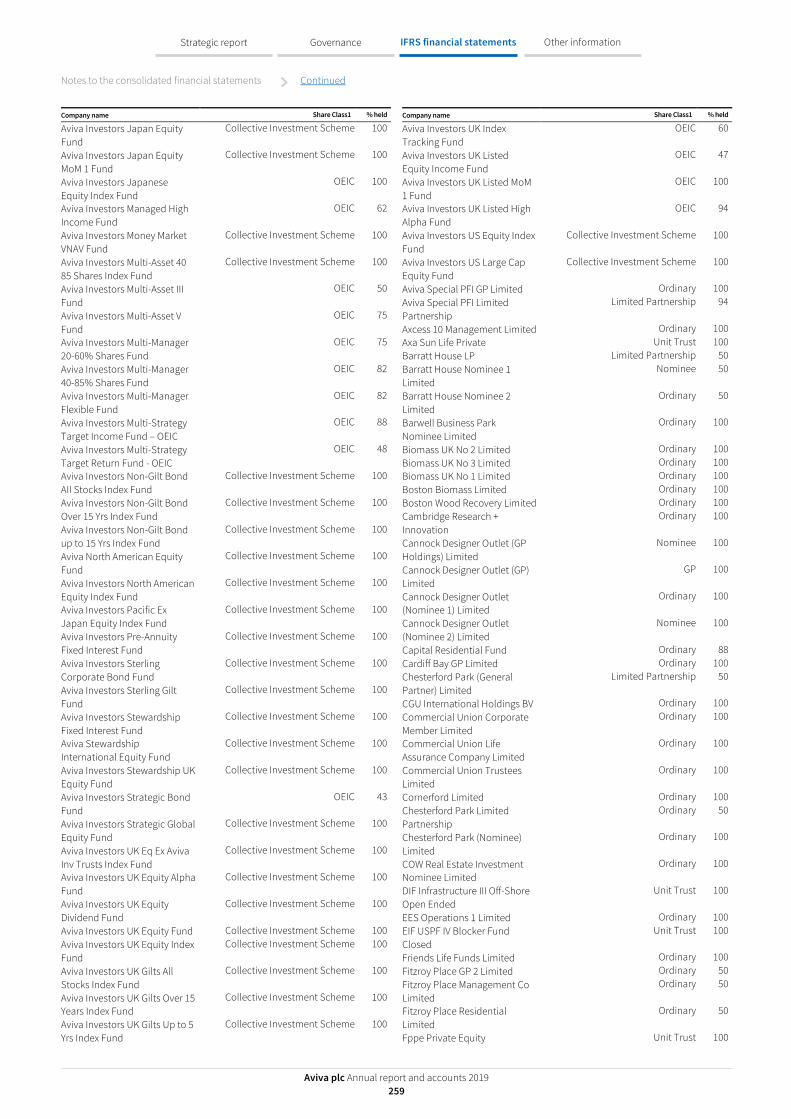
Notes to the consolidated financial statements Continued
Aviva plc Annual report and accounts 2019 259
Strategic report Governance IFRS financial statements Other information
Company name Share Class1 % held
Aviva Investors Japan Equity Fund
Collective Investment Scheme 100
Aviva Investors Japan Equity MoM 1 Fund
Collective Investment Scheme 100
Aviva Investors Japanese Equity Index Fund
OEIC 100
Aviva Investors Managed High Income Fund
OEIC 62
Aviva Investors Money Market VNAV Fund
Collective Investment Scheme 100
Aviva Investors Multi-Asset 40 85 Shares Index Fund
Collective Investment Scheme 100
Aviva Investors Multi-Asset III Fund
OEIC 50
Aviva Investors Multi-Asset V Fund
OEIC 75
Aviva Investors Multi-Manager 20-60% Shares Fund
OEIC 75
Aviva Investors Multi-Manager 40-85% Shares Fund
OEIC 82
Aviva Investors Multi-Manager Flexible Fund
OEIC 82
Aviva Investors Multi-Strategy Target Income Fund – OEIC
OEIC 88
Aviva Investors Multi-Strategy Target Return Fund - OEIC
OEIC 48
Aviva Investors Non-Gilt Bond AII Stocks Index Fund
Collective Investment Scheme 100
Aviva Investors Non-Gilt Bond Over 15 Yrs Index Fund
Collective Investment Scheme 100
Aviva Investors Non-Gilt Bond up to 15 Yrs Index Fund
Collective Investment Scheme 100
Aviva North American Equity Fund
Collective Investment Scheme 100
Aviva Investors North American Equity Index Fund
Collective Investment Scheme 100
Aviva Investors Pacific Ex Japan Equity Index Fund
Collective Investment Scheme 100
Aviva Investors Pre-Annuity Fixed Interest Fund
Collective Investment Scheme 100
Aviva Investors Sterling Corporate Bond Fund
Collective Investment Scheme 100
Aviva Investors Sterling Gilt Fund
Collective Investment Scheme 100
Aviva Investors Stewardship Fixed Interest Fund
Collective Investment Scheme 100
Aviva Stewardship International Equity Fund
Collective Investment Scheme 100
Aviva Investors Stewardship UK Equity Fund
Collective Investment Scheme 100
Aviva Investors Strategic Bond Fund
OEIC 43
Aviva Investors Strategic Global Equity Fund
Collective Investment Scheme 100
Aviva Investors UK Eq Ex Aviva Inv Trusts Index Fund
Collective Investment Scheme 100
Aviva Investors UK Equity Alpha Fund
Collective Investment Scheme 100
Aviva Investors UK Equity Dividend Fund
Collective Investment Scheme 100
Aviva Investors UK Equity Fund Collective Investment Scheme 100 Aviva Investors UK Equity Index Fund
Collective Investment Scheme 100
Aviva Investors UK Gilts All Stocks Index Fund
Collective Investment Scheme 100
Aviva Investors UK Gilts Over 15 Years Index Fund
Collective Investment Scheme 100
Aviva Investors UK Gilts Up to 5 Yrs Index Fund
Collective Investment Scheme 100
Company name Share Class1 % held
Aviva Investors UK Index Tracking Fund
OEIC 60
Aviva Investors UK Listed Equity Income Fund
OEIC 47
Aviva Investors UK Listed MoM 1 Fund
OEIC 100
Aviva Investors UK Listed High Alpha Fund
OEIC 94
Aviva Investors US Equity Index Fund
Collective Investment Scheme 100
Aviva Investors US Large Cap Equity Fund
Collective Investment Scheme 100
Aviva Special PFI GP Limited Ordinary 100 Aviva Special PFI Limited Partnership
Limited Partnership 94
Axcess 10 Management Limited Ordinary 100 Axa Sun Life Private Unit Trust 100 Barratt House LP Limited Partnership 50 Barratt House Nominee 1 Limited
Nominee 50
Barratt House Nominee 2 Limited
Ordinary 50
Barwell Business Park Nominee Limited
Ordinary 100
Biomass UK No 2 Limited Ordinary 100 Biomass UK No 3 Limited Ordinary 100 Biomass UK No 1 Limited Ordinary 100 Boston Biomass Limited Ordinary 100 Boston Wood Recovery Limited Ordinary 100 Cambridge Research + Innovation
Ordinary 100
Cannock Designer Outlet (GP Holdings) Limited
Nominee 100
Cannock Designer Outlet (GP) Limited
GP 100
Cannock Designer Outlet (Nominee 1) Limited
Ordinary 100
Cannock Designer Outlet (Nominee 2) Limited
Nominee 100
Capital Residential Fund Ordinary 88 Cardiff Bay GP Limited Ordinary 100 Chesterford Park (General Partner) Limited
Limited Partnership 50
CGU International Holdings BV Ordinary 100 Commercial Union Corporate Member Limited
Ordinary 100
Commercial Union Life Assurance Company Limited
Ordinary 100
Commercial Union Trustees Limited
Ordinary 100
Cornerford Limited Ordinary 100 Chesterford Park Limited Partnership
Ordinary 50
Chesterford Park (Nominee) Limited
Ordinary 100
COW Real Estate Investment Nominee Limited
Ordinary 100
DIF Infrastructure III Off-Shore Open Ended
Unit Trust 100
EES Operations 1 Limited Ordinary 100 EIF USPF IV Blocker Fund Closed
Unit Trust 100
Friends Life Funds Limited Ordinary 100 Fitzroy Place GP 2 Limited Ordinary 50 Fitzroy Place Management Co Limited
Ordinary 50
Fitzroy Place Residential Limited
Ordinary 50
Fppe Private Equity Unit Trust 100

Notes to the consolidated financial statements Continued
Aviva plc Annual report and accounts 2019 260
Strategic report Governance IFRS financial statements Other information
Company name Share Class1 % held
General Accident Executor and Trustee Company Limited
Ordinary 100
Gobafoss General Partner Limited
Ordinary 100
Gobafoss Partnership Nominee No 1 Limited
Ordinary 100
GS Mezzainine Partners V Offshore LP
Unit Trust 100
Hemel Hempstead Estate Management Limited
Ordinary 100
Hillswood Management Limited
Ordinary 24
Houlton Commercial Management Company Limited
Limited by Guarantee 50
Houlton Community Management Company Limited
Limited by Guarantee 50
Igloo Regeneration (Nominee) Limited
Nominee 50
Igloo Regeneration Developments (General Partner) Limited
Ordinary 50
Igloo Regeneration Developments (Nominees) Limited
Ordinary 50
Igloo Regeneration Developments LP
Ordinary 50
Igloo Regeneration Partnership LP
Ordinary 40
Igloo Regeneration Property Unit Trust
Ordinary 50
Igloo Regeneration (Butcher Street) Limited
Ordinary 50
Igloo Regeneration (General Partner) Limited
Ordinary 50
Irongate House LP2 Limited Partnership 50 Irongate House Nominee 1 Limited2
Ordinary 50
Irongate House Nominee 2 Limited
Ordinary 50
Lime Property Fund (General Partner) Limited
Ordinary 100
Lime Property Fund (Nominee) Limited
Ordinary 100
Lombard (London) 1 Limited Ordinary 100 Lombard (London) 2 Limited Ordinary 100 Matthew Parker Street (Nominee No1) Limited
Ordinary 100
Matthew Parker Street (Nominee No 2) Limited
Ordinary 100
Medium Scale Wind No 1 Limited
Ordinary 100
Mortimer Street Associated Co 1 Limited
Ordinary 50
Mortimer Street Associated Co 2 Limited
Ordinary 50
Mortimer Street Nominee 1 Limited
Ordinary 50
Mortimer Street Nominee 2 Limited
Ordinary 50
Mortimer Street Nominee 3 Limited
Ordinary 50
New Broad Street House LP Ordinary 50 New Broad Street House Nominee 1 Limited
Ordinary 50
New Broad Street Nominee 2 Limited
Ordinary 50
Norwich Union (Shareholder GP) Limited
Ordinary 100
Company name Share Class1 % held
Norwich Union Public Private Partnership Fund
Ordinary 100
NU 3PS Limited Ordinary 100 NU Developments (Brighton) Limited
Ordinary 100
NU Library For Brighton Limited
Ordinary 100
NU Offices for Redcar Limited Ordinary 100 NU Schools for Redbridge Limited
Ordinary 100
NU Technology and Learning Centres (Hackney) Limited
Ordinary 100
NUPPP (Care Technology and Learning Centres) Limited
Ordinary 100
NUPPP (GP) Limited Ordinary 100 NUPPP Nominees Limited Ordinary 100 Opus Park Management Limited
Limited By Guarantee 100
Paddington Central III Limited Partnership
Limited Partnership 100
Paddington Central III (GP) Limited
Ordinary 100
Porth Teigr Management Company Limited
Ordinary 50
Pegasus House and Nuffield House LP
Ordinary 50
Pegasus House and Nuffield House Nominee 1 Ltd
Ordinary 50
Pegasus House and Nuffield House Nominee 2 Limited
Ordinary 50
Property Management Company (Croydon) Limited
Ordinary 100
NU Local Care Centres (Farnham) Limited
Ordinary 100
Quaryvale One Limited Ordinary 100 Quaryvale Three Limited Ordinary 100 Renewable Clean Energy Limited
Ordinary 100
Rugby Radio Station (General Partner) Limited
Ordinary 50
Rugby Radio Station Limited Partnership2
Limited Partnership 50
Rugby Radio Station (Nominee) Limited
Ordinary 50
Capital Residential Fund Limited Partnership 88 Slas Axa Private Equity Unit Trust 100 Slas Venture Capital Ye Cash Ordinary 100 Solar Clean Energy Limited Ordinary 100 Southgate General Partner Limited
Ordinary 50
Southgate Limited Partnership Ordinary 50 Southgate LP (Nominee 1) Limited
Ordinary 50
Southgate LP (Nominee 2) Limited
Ordinary 50
Station Road Cambridge LP NPV
Unit Trust 50
Stonebridge Cross Management Limited
Limited by Guarantee 100
Swan Valley Management Limited
Ordinary 100
SUE Developments Limited Partnership
Limited Partnership 50
SUE GP Nominee Limited Nominee 50 SUE GP LLP GP 50 Stonebridge Cross Management Limited
Limited by Guarantee 100
Southgate LP (Nominee 2) Limited
Ordinary 50

Notes to the consolidated financial statements Continued
Aviva plc Annual report and accounts 2019 261
Strategic report Governance IFRS financial statements Other information
Company name Share Class1 % held
Stichting Aviva Infrastructure Debt Europe 1
Ordinary 100
Stichting European Secondary Infrastructure Credit
Ordinary 100
The Designer Retail Outlet Centres (Mansfield) General Partner Limited
Ordinary 100
The Designer Retail Outlet Centres (Mansfield) Limited Partnership
Ordinary 97
The Designer Retail Outlet Centres (York) General Partner Limited
Ordinary 100
The Designer Retail Outlet Centres (York) Limited Partnership
Ordinary 97
The Gobafoss Partnership Ordinary 100 The Ocean Marine Insurance Company Limited
Ordinary 100
The Square Brighton Limited Ordinary 100 Tyne Assets (No2) Limited Ordinary 100 Tyne Assets Limited Ordinary 100 Undershaft Limited Ordinary 100 W Nine LP Limited Partnership 50 W Nine Nominee 1 Limited Ordinary 50 W Nine Nominee 2 Limited Ordinary 50 The Welsh Insurance Corporation Limited
Ordinary 100
The Yorkshire Insurance Company Limited
Ordinary 100
Swan Court Waterman’s Business Park, Kingsbury Crescent, Staines, Surrey, TW18 3BA
Healthcode Limited Ordinary C, Ordinary E 20 Wellington Row, York, YO90 1WR
Aviva (Peak No.2) UK Limited Ordinary 100 Aviva Annuity UK Limited Ordinary 100 Aviva Client Nominees UK Limited
Ordinary 100
Aviva Equity Release UK Limited
Ordinary 100
Aviva ERFA 15 UK Limited Ordinary 100 Aviva Life & Pensions UK Limited
Ordinary 100
Aviva Life Holdings UK Limited Ordinary
100
Aviva Life Investments International (Recovery) Limited
Ordinary 100
Aviva Life International (General Partner) Limited
Ordinary 100
Aviva Life Services UK Limited Ordinary 100 Aviva Pension Trustees UK Limited
Ordinary 100
Aviva Trustees UK Limited Ordinary 100 Aviva Wrap UK Limited Ordinary 100 CGNU Life Assurance Limited Ordinary 100 Friends Provident Pension Scheme Trustees Limited
Ordinary 100
IFSL Tilney Bestinvest Global Income Portfolio
OEIC 22
The Lancashire and Yorkshire Reversionary Interest Company Limited
Ordinary 100
The Norwich Union Life Insurance Company Limited
Ordinary 100
Synergy Sunrise (Sentinel House) Limited
Ordinary 100
Company name Share Class1 % held
Undershaft (NULLA) Limited Ordinary 100 Voyager Park South Management Company Limited
Ordinary 52
12 Throgmorton Avenue BlackRock Market Advantage Fund
Unit Trust 52
Artemis Fund Managers Limited, 57-59 St James’s Street, London SW1A 1LD
Artemis UK Special Situations Fund
Unit Trust 24
Liontrust Fund Partners LLP, 2 Savoy Court London WC2R 0EZ
Liontrust Sustainable Future Corporate Bond Fund
OEIC 36
Liontrust Sustainable Future UK Growth Fund
OEIC 47
Liontrust Sustainable Future Global Growth Fund
OEIC 45
Liontrust Sustainable Future Absolute Growth Fund
OEIC 53
Liontrust UK Ethical Fund OEIC 68 Liontrust Future European Growth Fund
OEIC 56
Liontrust Sustainable Furture Managed Fund
OEIC 68
47 Bermondsey Street, London SE1 3XT
Neos Venures Limited Ordinary 91 1020 Eskdale Road, Winnersh, Wokingham RG41 5TS
Serviced Offices UK GP Limited GP 50 Norwich Union Life Insurance Company Limited
Ordinary 100
Synergy Sunrise (Sentinel House) Limited
Ordinary 100
1 London Wall Place, London, UK
Schroder QEP US Core Fund Unit Trust 40 BlackRock Pensions, 33 King William Street
Undrly Aquila Cnt CcyH Glb Eq108010 2L
OEIC 65
Samuel House , 6 St Albans Street, 4th Floor, SW1Y 4SQ
Acre Platforms Limited Ordinary 40 15 Canada Square, E14 5GL LUC Holdings Limited Ordinary 20 Tec Marina Terra Nova Way, Penarth, Wales United Kingdom CF64 1SA
Wealthify Group Limited A Ordinary B Ordinary
60
Wealthify Limited Ordinary 60
United States
1209 Orange Street, City of Wilmington DE 19801,
Aviva Investors Americas LLC Sole Member 100 2222 Grand Avenue, Des Moines IA 50312
Aviva Investors North America Holdings, Inc
Common Stock Of No Par Value Shares
100
2711 Centreville Road, Suite 400, Wilmington, New Castle, DE, 19808
UKP Holdings Inc. Common Stock Shares 100

Notes to the consolidated financial statements Continued
Aviva plc Annual report and accounts 2019 262
Strategic report Governance IFRS financial statements Other information
Company name Share Class1 % held
AI-RECAP GP I, LLC Limited Partnership 100 National Corporate Research Limited, 850 New Burton Road, Suite 201, Dover, Delaware Kent County 19904
Exeter Properties Inc. Common Stock Wpv Shares 95 Winslade Investments Inc. Common Stock Wpv Shares 100
Vietnam
10th Floor, Handi Resco Building, No. 521 Kim Ma, Ba Dinh, Hanoi
Aviva Vietnam Life Insurance Company Limited
Non-listed Shares 100
1 Investment Company with Variable Capital (‘ICVC’)
Fond Common de Placement (‘FCP’) Open Ended Investment Fund (‘OEIC’) Société d ‘Investment à Capital Variable (‘SICAV’) Undertaking for Collective Investment in Transferrable Securities (‘UCITS’) Irish Collective Asset Management Vehicle (‘ICAV’) Authorised Contractual Scheme (‘ACS’) Organisme de Placement Collectif Immobilier (‘OPCI’) Sociétés Civiles de Placement Immobilier (‘SCPI’)
2 Please see accounting policies (D) Consolidation principles, for further details on Joint Ventures and the factors on which joint management is based.

Notes to the consolidated financial statements Continued
Aviva plc Annual report and accounts 2019 263
Strategic report Governance IFRS financial statements Other information
66 – Subsequent events 2020 has begun with the outbreak of a new strain of the Coronavirus (COVID-19) in China, with confirmed cases in more than 50 countries, including all of those in which Aviva has material businesses. There is a risk of a significant global pandemic and economic disruption. We have reviewed the exposure of our balance sheet and are taking actions to further reduce our sensitivity to economic shocks. Notwithstanding our robust capital and liquidity position and the operational and financial actions that we are taking, a deterioration in the situation would have adverse implications for our businesses arising from the potential impacts on financial markets, our insurance exposures and our operations. As the situation is rapidly evolving it is not practicable to quantify the potential financial impact of the outbreak on the Group.

Financial statements of the Company
Where applicable, the accounting policies of the Company are the same as those of the Group on pages 117 to 131. The notes identified alphabetically on pages 268 to 273 are an integral part of these separate financial statements. Where the same items appear in the Group financial statements, reference is made to the notes (identified numerically) on pages 139 to 263.
Aviva plc Annual report and accounts 2019 264
Strategic report Governance IFRS financial statements Other information
Income statement For the year ended 31 December 2019
Note 2019
£m 2018
£m
Income Net investment income A 1,688 2,874
1,688 2,874 Expenses Operating expenses B (195) (246) Other expenses1 — (8) Finance costs C (537) (519)
(732) (773)
Profit for the year before tax 956 2,101 Tax credit D 92 96
Profit for the year after tax 1,048 2,197 1 Other expenses in 2018 include a charge of £8 million relating to goodwill payments to preference shareholders, which was announced on 30 April 2018 and associated administration costs (see note 36).
Statement of comprehensive income For the year ended 31 December 2019
Note 2019
£m 2018
£m
Profit for the year 1,048 2,197 Items that will not be reclassified to income statement Remeasurements of pension schemes H (1) 2 Forfeited dividend income H 4 4
Other comprehensive income, net of tax 3 6
Total comprehensive income for the year 1,051 2,203

Financial statements of the Company Continued
Where applicable, the accounting policies of the Company are the same as those of the Group on pages 117 to 131. The notes identified alphabetically on pages 268 to 273 are an integral part of these separate financial statements. Where the same items appear in the Group financial statements, reference is made to the notes (identified numerically) on pages 139 to 263.
Aviva plc Annual report and accounts 2019 265
Strategic report Governance IFRS financial statements Other information
Statement of changes in equity For the year ended 31 December 2019
Note
Ordinary share capital
£m
Preference share capital
£m
Share premium
£m
Capital redemption
reserve £m
Merger reserve
£m
Equity compensation
reserve £m
Retained earnings
£m
Direct capital instrument
and fixed rate tier 1 notes
£m Total equity
£m
Balance at 1 January 975 200 1,214 44 6,438 120 4,026 724 13,741 Profit for the year — — — — — — 1,048 — 1,048 Other comprehensive income — — — — — — 3 — 3 Total comprehensive income for the year — — — — — — 1,051 — 1,051 Dividends and appropriations 16 — — — — — — (1,244) — (1,244) Reserves credit for equity compensation plans 34 — — — — — 62 — — 62 Shares issued under equity compensation plans 33 5 — 25 — — (62) 55 — 23 Shares purchased in buy-back 33 — — — — — — — — — Reclassification of tier 1 notes to financial liabilities1 37,L — — — — — — 14 (224) (210) Aggregate tax effect D — — — — — — 8 — 8 Balance at 31 December 980 200 1,239 44 6,438 120 3,910 500 13,431 1 On 17 October 2019, notification was given that the Group would redeem the £210 million tier 1 notes. At that date, the instrument was reclassified as a financial liability of £210 million, representing its fair value at that date. On
21 November 2019 the instrument was redeemed in full at a cost of £210 million. See note 37 for further details.
For the year ended 31 December 2018
Note
Ordinary share capital
£m
Preference share capital
£m
Share premium
£m
Capital redemption
reserve £m
Merger reserve
£m
Equity compensation
reserve £m
Retained earnings
£m
Direct capital instrument
and fixed rate tier 1 notes
£m Total equity
£m
Balance at 1 January 1,003 200 1,207 14 6,438 111 3,555 724 13,252 Profit for the year — — — — — — 2,197 — 2,197 Other comprehensive loss — — — — — — 6 — 6 Total comprehensive income for the year — — — — — — 2,203 — 2,203 Dividends and appropriations 16 — — — — — — (1,189) — (1,189) Reserves credit for equity compensation plans 34 — — — — — 64 — — 64 Shares issued under equity compensation plans 33 2 — 7 — — (55) 49 — 3 Shares purchased in buy-back1 33 (30) — — 30 — — (600) — (600) Reclassification of tier 1 notes to financial liabilities 37,L — — — — — — — — — Aggregate tax effect D — — — — — — 8 — 8
Balance at 31 December 975 200 1,214 44 6,438 120 4,026 724 13,741 1 On 1 May 2018, the Group announced a share buyback of ordinary shares for an aggregate purchase price of up to £600 million. On completion in 2018 of this buy-back, £600 million of shares had been purchased and shares with
a nominal value of £30 million have been cancelled, giving rise to an additional capital redemption reserve of an equivalent amount. See note 33 for further details of the shares purchase in buy-back.

Financial statements of the Company Continued
Where applicable, the accounting policies of the Company are the same as those of the Group on pages 117 to 131. The notes identified alphabetically on pages 268 to 273 are an integral part of these separate financial statements. Where the same items appear in the Group financial statements, reference is made to the notes (identified numerically) on pages 139 to 263.
Aviva plc Annual report and accounts 2019 266
Strategic report Governance IFRS financial statements Other information
Statement of financial position As at 31 December 2019
Note 2019
£m 2018
£m
Assets Non-current assets Investments in subsidiaries E 31,788 31,788 Investment in joint venture E 123 123 Receivables and other financial assets F 5,025 5,401 Deferred tax assets G 9 9 Current tax assets G 85 89
37,030 37,410 Current assets Receivables and other financial assets F 241 414 Prepayments and accrued income 13 10 Cash and cash equivalents 74 15
Total assets 37,358 37,849
Equity Ordinary share capital 33 980 975 Preference share capital 36 200 200 Called up capital 1,180 1,175 Share premium 33(b) 1,239 1,214 Capital redemption reserve 33(b) 44 44 Merger reserve H 6,438 6,438 Equity compensation reserve H 120 120 Retained earnings H 3,910 4,026 Direct capital instrument and tier 1 notes 37,L 500 724
Total equity 13,431 13,741
Liabilities Non-current liabilities Borrowings J 6,534 6,699 Payables and other financial liabilities K 12,675 12,815 Pension deficits and other provisions I 47 45
19,256 19,559 Current liabilities Borrowings J 238 251 Payables and other financial liabilities K 4,344 4,206 Other liabilities 89 92
Total liabilities 23,927 24,108
Total equity and liabilities 37,358 37,849
Approved by the Board on 4 March 2020
Jason Windsor Chief Financial Officer
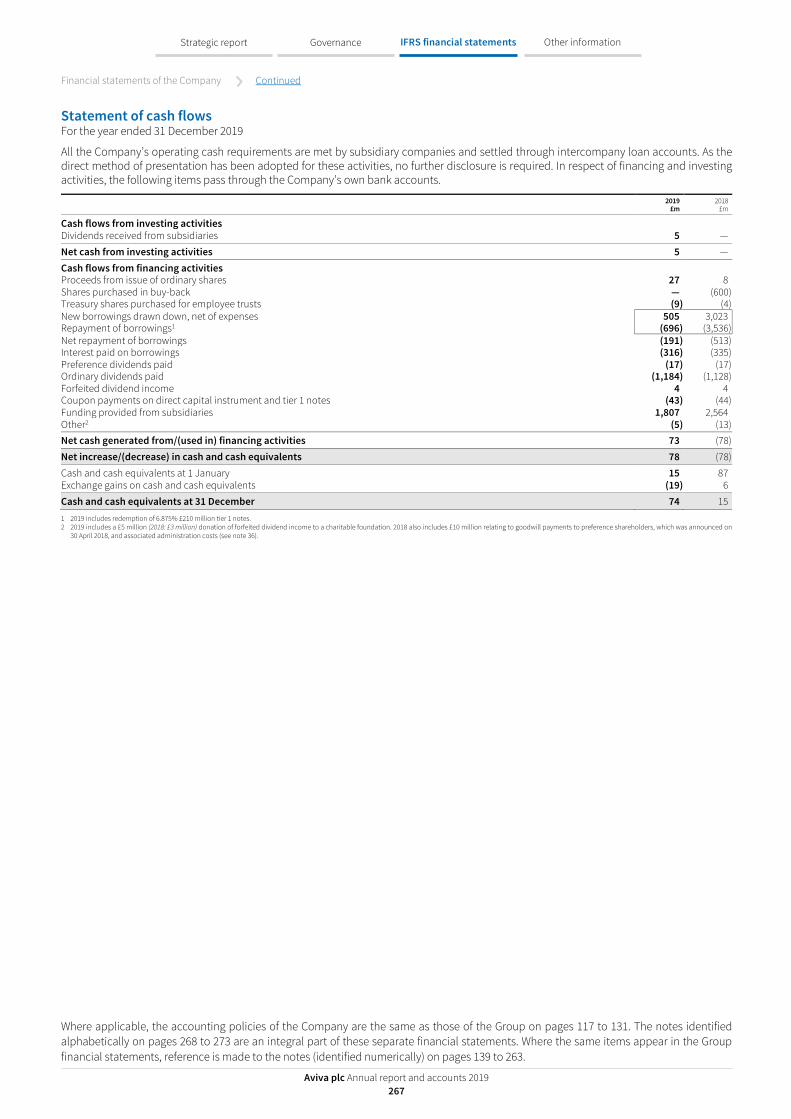
Financial statements of the Company Continued
Where applicable, the accounting policies of the Company are the same as those of the Group on pages 117 to 131. The notes identified alphabetically on pages 268 to 273 are an integral part of these separate financial statements. Where the same items appear in the Group financial statements, reference is made to the notes (identified numerically) on pages 139 to 263.
Aviva plc Annual report and accounts 2019 267
Strategic report Governance IFRS financial statements Other information
Statement of cash flows For the year ended 31 December 2019
All the Company’s operating cash requirements are met by subsidiary companies and settled through intercompany loan accounts. As the direct method of presentation has been adopted for these activities, no further disclosure is required. In respect of financing and investing activities, the following items pass through the Company’s own bank accounts.
2019
£m 2018
£m
Cash flows from investing activities Dividends received from subsidiaries 5 —
Net cash from investing activities 5 —
Cash flows from financing activities Proceeds from issue of ordinary shares 27 8 Shares purchased in buy-back — (600) Treasury shares purchased for employee trusts (9) (4) New borrowings drawn down, net of expenses 505 3,023 Repayment of borrowings1 (696) (3,536) Net repayment of borrowings (191) (513) Interest paid on borrowings (316) (335) Preference dividends paid (17) (17) Ordinary dividends paid (1,184) (1,128) Forfeited dividend income 4 4 Coupon payments on direct capital instrument and tier 1 notes (43) (44) Funding provided from subsidiaries 1,807 2,564 Other2 (5) (13) Net cash generated from/(used in) financing activities 73 (78)
Net increase/(decrease) in cash and cash equivalents 78 (78)
Cash and cash equivalents at 1 January 15 87 Exchange gains on cash and cash equivalents (19) 6
Cash and cash equivalents at 31 December 74 15 1 2019 includes redemption of 6.875% £210 million tier 1 notes. 2 2019 includes a £5 million (2018: £3 million) donation of forfeited dividend income to a charitable foundation. 2018 also includes £10 million relating to goodwill payments to preference shareholders, which was announced on
30 April 2018, and associated administration costs (see note 36).

Notes to the financial statements of the Company
Where applicable, the accounting policies of the Company are the same as those of the Group on pages 117 to 131. The notes identified alphabetically on pages 268 to 273 are an integral part of these separate financial statements. Where the same items appear in the Group financial statements, reference is made to the notes (identified numerically) on pages 139 to 263.
Aviva plc Annual report and accounts 2019 268
Strategic report Governance IFRS financial statements Other information
A – Net investment income Note
2019 £m
2018 £m
Dividends received from subsidiaries O(iii) 1,595 2,780 Interest receivable from group company loans held at amortised cost O(i) 92 92 Other income 1 2
Total 1,688 2,874
B – Operating expenses (i) Operating expenses Operating expenses comprise:
2019
£m 2018
£m
Staff costs and other employee related expenditure (see (ii) below) 19 19 Other operating costs 175 227 Net foreign exchange losses 1 —
Total 195 246
(ii) Staff costs Total staff costs were:
2019
£m 2018
£m
Equity compensation plans (see (iii) below) 19 19
Total 19 19
The Company is no longer charged staff costs directly by the UK employing entity. Staff costs are included within other operating costs as part of the overall recharges from the service company within the Group.
(iii) Equity compensation plans All transactions in the Group’s equity compensation plans, which involve options and awards for ordinary shares of the Company, are included in other operating costs. Full disclosure of these plans is given in the Group consolidated financial statements, note 34. The cost of such options and awards is borne by all participating businesses and, where relevant, the Company bears an appropriate charge. As the majority of the charge to the Company relates to directors’ options and awards, for which full disclosure is made in the directors’ remuneration report, no further disclosure is given here.
C – Finance costs
Note 2019
£m 2018
£m
Interest payable on borrowings 325 325 Interest payable to group companies O(ii) 212 194
Total 537 519
D – Tax (i) Tax credited to the income statement The total tax credit comprises:
2019
£m 2018
£m
Current tax For this year (90) (94) Prior year adjustments (2) (2)
Total current tax (92) (96)
Total tax credited to income statement (92) (96)
(ii) Tax credited to other comprehensive income There was no tax credited or charged to other comprehensive income in either 2019 or 2018.
(iii) Tax credited to equity Tax credited directly to equity in the year, in respect of coupon payments on the direct capital instrument and fixed rate tier 1 notes, amounted to £8 million (2018: £8 million).

Notes to the financial statements of the Company Continued
Where applicable, the accounting policies of the Company are the same as those of the Group on pages 117 to 131. The notes identified alphabetically on pages 268 to 273 are an integral part of these separate financial statements. Where the same items appear in the Group financial statements, reference is made to the notes (identified numerically) on pages 139 to 263.
Aviva plc Annual report and accounts 2019 269
Strategic report Governance IFRS financial statements Other information
D – Tax continued (iv) Tax reconciliation The tax on the Company’s profit before tax differs from the theoretical amount that would arise using the tax rate of the home country of the Company as follows:
2019
£m 2018
£m
Profit before tax 956 2,101 Tax calculated at standard UK corporation tax rate of 19.00% (2018: 19.00%) 182 399 Reconciling items
Adjustment to tax charge in respect of prior years (2) (2) Non-assessable dividend income (303) (528) Disallowable expenses — 7 Losses surrendered intra-group for nil value 31 28
Total tax credited to income statement (92) (96)
Finance Act 2016, which received Royal Assent on 15 September 2016, will reduce the rate of corporation tax to 17% from 1 April 2020. The reduction in rate from 19% to 17% has been used in the calculation of the Company’s deferred tax assets and liabilities at 31 December 2019.
During 2019, the UK Government indicated that it would reverse the reduction in the rate of corporation tax to 17% due from 1 April 2020. As at 31 December 2019 this measure has not been substantively enacted and therefore no impact is reflected in the calculation of the Company’s deferred tax assets and liabilities at 31 December 2019.
E – Investments in subsidiaries and joint venture (i) Subsidiaries At 31 December 2019, the Company has two wholly owned subsidiaries, both incorporated in the UK. These are General Accident plc and Aviva Group Holdings Limited. Aviva Group Holdings Limited is an intermediate holding company, while General Accident plc has preference shares listed on the London Stock Exchange. At 31 December 2019, the Company’s investments in subsidiaries have a cost of £31,788 million (2018: £31,788 million). The principal subsidiaries of the Aviva Group at 31 December 2019 are set out in note 64 to the Group consolidated financial statements.
(ii) Joint venture At 31 December 2019, the Company’s investment in the joint venture, Aviva-COFCO Life Insurance Co. Limited has a cost of £123 million (2018: £123 million).
F – Receivables and other financial assets
Note 2019
£m 2018
£m
Loans due from subsidiaries held at amortised cost O(i) 5,025 5,401 Amount due from subsidiaries held at amortised cost O(iii) 241 414
Total 5,266 5,815 Expected to be recovered in less than one year 241 414 Expected to be recovered in more than one year 5,025 5,401
5,266 5,815
Fair value of these assets approximate to their carrying amounts.
G – Tax assets and liabilities (i) Current tax Current tax assets recoverable in more than one year are £85 million (2018: £89 million).
(ii) Deferred tax (a) The balance at 31 December comprises:
2019
£m 2018
£m
Deferred tax assets 9 9
Net deferred tax assets 9 9
(b) The net deferred tax asset arises on the following items:
2019
£m 2018
£m
Pensions and other post retirement obligations 9 9
Net deferred tax assets 9 9

Notes to the financial statements of the Company Continued
Aviva plc Annual report and accounts 2019 270
Strategic report Governance IFRS financial statements Other information
H – Reserves
Merger reserve
£m
Equity compensation
reserve1 £m
Retained earnings
£m
Balance at 1 January 2018 6,438 111 3,555 Arising in the year: Profit for the year — — 2,197 Remeasurements of pension schemes — — 2 Forfeited dividend income2 — — 4 Dividends and appropriations — — (1,189) Reserves credit for equity compensation plans — 64 — Issue of share capital under equity compensation scheme — (55) 49 Shares purchased in buy-back — — (600) Reclassification of tier 1 notes to financial liabilities (note L) — — — Aggregate tax effect — — 8 Balance at 31 December 2018 6,438 120 4,026 Arising in the year: Profit for the year — — 1,048 Remeasurements of pension schemes — — (1) Forfeited dividend income2 — — 4 Dividends and appropriations — — (1,244) Reserves credit for equity compensation plans — 62 — Issue of share capital under equity compensation scheme — (62) 55 Shares purchased in buy-back — — — Reclassification of tier 1 notes to financial liabilities3 (note L) — — 14 Aggregate tax effect — — 8 Balance at 31 December 2019 6,438 120 3,910 1 See notes 34(d) and 39 for further details of balances included in the equity compensation reserve. 2 The Company has commenced a shareholder forfeiture programme, where the shares of shareholders who Aviva has lost contact with over the last 12 years will be forfeited and sold on. Any associated unclaimed dividends will
be reclaimed by the Company. After covering administration costs, the majority of the money will be put into a charitable foundation. 3 On 17 October 2019, notification was given that the Group would redeem the 6.875% £210 million tier 1 notes. At that date, the instrument was reclassified as a financial liability of £210 million, representing its fair value at that
date. On 21 November 2019 the instrument was redeemed in full at a cost of £210 million. The difference of £14 million between its carrying amount of £224 million and fair value of £210 million has been charged to retained earnings. See note L for further details.
The tax effect of £8 million (2018: £8 million) is recognised in respect of coupon payments of £43 million (2018: £44 million) on the direct capital instrument and tier 1 notes.
I – Pension deficits and other provisions (i) Carrying amounts
2019
£m 2018
£m
Total IAS 19 obligations to staff pension schemes 47 45
Total provisions 47 45
J – Borrowings The Company’s borrowings comprise:
2019
£m 2018
£m
Subordinated debt 5,482 5,586 Senior notes 1,052 1,113 Commercial paper 238 251
Total 6,772 6,950
All the above borrowings are stated at amortised cost.

Notes to the financial statements of the Company Continued
Aviva plc Annual report and accounts 2019 271
Strategic report Governance IFRS financial statements Other information
J – Borrowings continued Maturity analysis of contractual undiscounted cash flows:
2019 2018
Principal
£m Interest
£m Total
£m Principal
£m Interest
£m Total
£m
Within 1 year 238 311 549 251 315 566 1 – 5 years 686 1,194 1,880 708 1,231 1,939 5 – 10 years 635 1,451 2,086 673 1,490 2,163 10 – 15 years — 1,417 1,417 — 1,441 1,441 Over 15 years 5,251 2,636 7,887 5,365 2,923 8,288
Total contractual undiscounted cash flows 6,810 7,009 13,819 6,997 7,400 14,397
Where subordinated debt is undated, the interest payments have not been included beyond 15 years. Annual interest payments in future years for these borrowings are £49 million (2018: £49 million).
The fair value of the subordinated debt at 31 December 2019 was £6,446 million (2018: £5,831 million), calculated with reference to quoted prices. The fair value of the senior debt at 31 December 2019 was £1,134 million (2018: £1,113 million), calculated with reference to quoted prices. The fair value of the commercial paper is considered to be the same as its carrying value.
Further details of these borrowings and undrawn committed facilities can be found in the Group consolidated financial statements, note 53, with details of the fair value hierarchy in relation to these borrowings in note 24.
K – Payables and other financial liabilities
Note 2019
£m 2018
£m
Loans due to subsidiaries O(ii) 12,675 12,815 Amount due to subsidiaries O(iii) 4,344 4,206
Total 17,019 17,021 Expected to be recovered in less than one year 4,344 4,206 Expected to be recovered in more than one year 12,675 12,815
17,019 17,021
L – Direct capital instrument and tier 1 notes The 6.875% £210 million tier 1 notes were redeemed on 21 November 2019 at a cost of £210 million, see details in note 37. These were reflected in the Company financial statements at a value of £224 million following the transfer at fair value from Friends Life Holdings plc on 1 October 2015. The resulting difference of £14 million between their carrying amount of £224 million and fair value of £210 million has been charged to the Company retained earnings. These were cancelled on 25 November 2019.
M – Contingent liabilities Details of the Company’s contingent liabilities are given in the Group consolidated financial statements, note 56.
N – Risk management Risk management in the context of the Group is considered in the Group consolidated financial statements, note 60.
The business of the Company is managing its investments in subsidiaries and joint venture operations. Its risks are considered to be the same as those in the operations themselves, and full details of the major risks and the Group’s approach to managing these are given in the Group consolidated financial statements, note 60. Such investments are held by the Company at cost in accordance with accounting policy D.
Financial assets, other than investments in subsidiaries and joint ventures, largely consist of amounts due from subsidiaries. As at the balance sheet date, these receivable amounts were neither past due nor impaired. The credit quality of receivables and other financial assets is monitored by the Company, and provisions are made for expected credit losses. There are no material expected credit losses over the lifetime of the financial assets.
Financial liabilities owed by the Company as at the balance sheet date are largely in respect of borrowings (details of which are provided in note J and the Group consolidated financial statements, note 53) and loans owed to subsidiaries. Loans owed to subsidiaries were within agreed credit terms as at the balance sheet date.
Interest rate risk Loans to and from subsidiaries are at either fixed or floating rates of interest, with the latter being exposed to fluctuations in these rates. The choice of rates is designed to match the characteristics of financial investments (which are also exposed to interest rate fluctuations) held in both the Company and the relevant subsidiary, to mitigate as far as possible each company’s net exposure.
All of the Company’s long-term external borrowings are at fixed rates of interest and are therefore not exposed to changes in these rates. However, for short term commercial paper, the Company is affected by changes in these rates to the extent the redemption of these borrowings is funded by the issuance of new commercial paper or other borrowings. Further details of the Company’s borrowings are provided in note J and the Group consolidated financial statements, note 53.
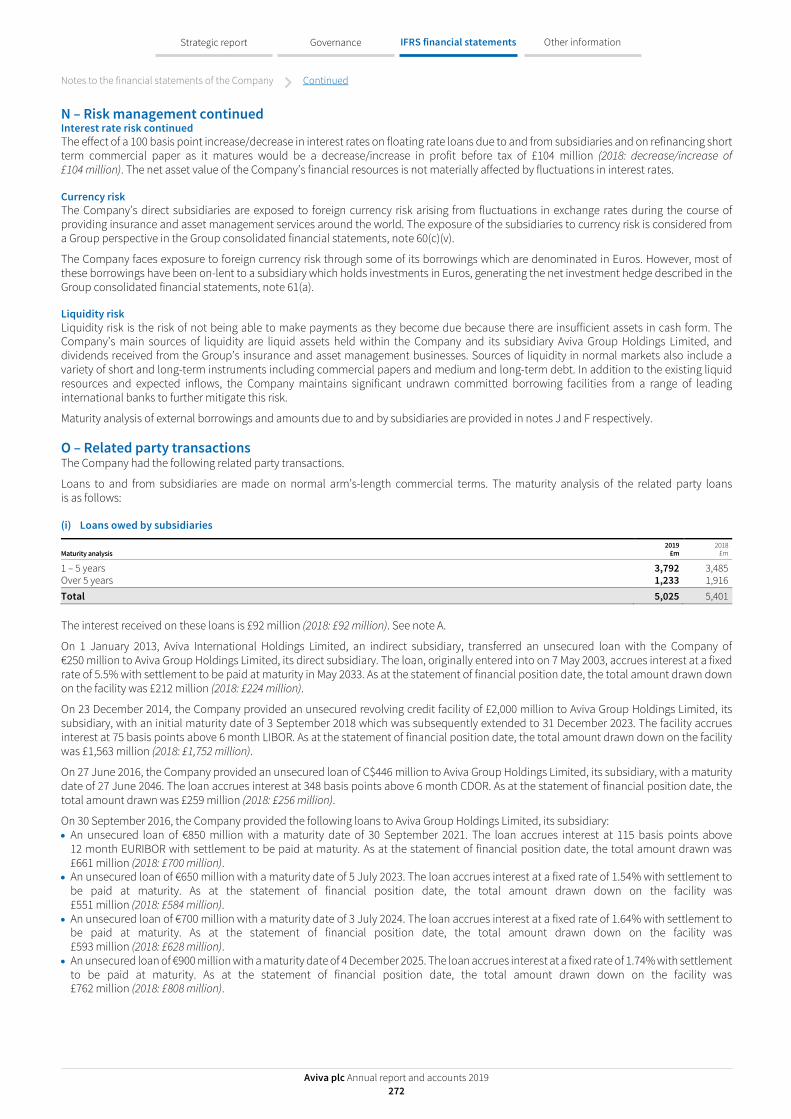
Notes to the financial statements of the Company Continued
Aviva plc Annual report and accounts 2019 272
Strategic report Governance IFRS financial statements Other information
N – Risk management continued Interest rate risk continued The effect of a 100 basis point increase/decrease in interest rates on floating rate loans due to and from subsidiaries and on refinancing short term commercial paper as it matures would be a decrease/increase in profit before tax of £104 million (2018: decrease/increase of £104 million). The net asset value of the Company’s financial resources is not materially affected by fluctuations in interest rates.
Currency risk The Company’s direct subsidiaries are exposed to foreign currency risk arising from fluctuations in exchange rates during the course of providing insurance and asset management services around the world. The exposure of the subsidiaries to currency risk is considered from a Group perspective in the Group consolidated financial statements, note 60(c)(v).
The Company faces exposure to foreign currency risk through some of its borrowings which are denominated in Euros. However, most of these borrowings have been on-lent to a subsidiary which holds investments in Euros, generating the net investment hedge described in the Group consolidated financial statements, note 61(a).
Liquidity risk Liquidity risk is the risk of not being able to make payments as they become due because there are insufficient assets in cash form. The Company’s main sources of liquidity are liquid assets held within the Company and its subsidiary Aviva Group Holdings Limited, and dividends received from the Group’s insurance and asset management businesses. Sources of liquidity in normal markets also include a variety of short and long-term instruments including commercial papers and medium and long-term debt. In addition to the existing liquid resources and expected inflows, the Company maintains significant undrawn committed borrowing facilities from a range of leading international banks to further mitigate this risk.
Maturity analysis of external borrowings and amounts due to and by subsidiaries are provided in notes J and F respectively.
O – Related party transactions The Company had the following related party transactions.
Loans to and from subsidiaries are made on normal arm’s-length commercial terms. The maturity analysis of the related party loans is as follows:
(i) Loans owed by subsidiaries
Maturity analysis 2019
£m 2018
£m
1 – 5 years 3,792 3,485 Over 5 years 1,233 1,916 Total 5,025 5,401
The interest received on these loans is £92 million (2018: £92 million). See note A.
On 1 January 2013, Aviva International Holdings Limited, an indirect subsidiary, transferred an unsecured loan with the Company of €250 million to Aviva Group Holdings Limited, its direct subsidiary. The loan, originally entered into on 7 May 2003, accrues interest at a fixed rate of 5.5% with settlement to be paid at maturity in May 2033. As at the statement of financial position date, the total amount drawn down on the facility was £212 million (2018: £224 million).
On 23 December 2014, the Company provided an unsecured revolving credit facility of £2,000 million to Aviva Group Holdings Limited, its subsidiary, with an initial maturity date of 3 September 2018 which was subsequently extended to 31 December 2023. The facility accrues interest at 75 basis points above 6 month LIBOR. As at the statement of financial position date, the total amount drawn down on the facility was £1,563 million (2018: £1,752 million).
On 27 June 2016, the Company provided an unsecured loan of C$446 million to Aviva Group Holdings Limited, its subsidiary, with a maturity date of 27 June 2046. The loan accrues interest at 348 basis points above 6 month CDOR. As at the statement of financial position date, the total amount drawn was £259 million (2018: £256 million).
On 30 September 2016, the Company provided the following loans to Aviva Group Holdings Limited, its subsidiary: • An unsecured loan of €850 million with a maturity date of 30 September 2021. The loan accrues interest at 115 basis points above
12 month EURIBOR with settlement to be paid at maturity. As at the statement of financial position date, the total amount drawn was £661 million (2018: £700 million).
• An unsecured loan of €650 million with a maturity date of 5 July 2023. The loan accrues interest at a fixed rate of 1.54% with settlement to be paid at maturity. As at the statement of financial position date, the total amount drawn down on the facility was £551 million (2018: £584 million).
• An unsecured loan of €700 million with a maturity date of 3 July 2024. The loan accrues interest at a fixed rate of 1.64% with settlement to be paid at maturity. As at the statement of financial position date, the total amount drawn down on the facility was £593 million (2018: £628 million).
• An unsecured loan of €900 million with a maturity date of 4 December 2025. The loan accrues interest at a fixed rate of 1.74% with settlement to be paid at maturity. As at the statement of financial position date, the total amount drawn down on the facility was £762 million (2018: £808 million).

Notes to the financial statements of the Company Continued
Aviva plc Annual report and accounts 2019 273
Strategic report Governance IFRS financial statements Other information
O – Related party transactions continued (i) Loans owed by subsidiaries continued On 21 November 2016, the Company provided an unsecured loan of €500 million to Aviva Group Holdings Limited, its subsidiary, with a maturity date of 27 October 2023. The loan accrues interest at a fixed rate of 1.75% with settlement to be paid at maturity. As at the statement of financial position date, the total amount drawn was £424 million (2018: £449 million).
(ii) Loans owed to subsidiaries
2019 2018
Maturity analysis of contractual undiscounted cash flows: Principal
£m Interest
£m Total
£m Principal
£m Interest
£m Total
£m
Within 1 year — 182 182 — 131 131 1 – 5 years 12,675 395 13,070 12,815 514 13,329
Total 12,675 577 13,252 12,815 645 13,460
The interest paid on these loans is £212 million (2018: £194 million). See note C.
On 3 September 2013 Aviva Group Holdings Limited, its subsidiary, provided an unsecured rolling credit facility of £5,000 million to the Company, accruing interest at 75 basis points above 6 month LIBOR and with an initial maturity date of 3 September 2018, which was subsequently extended to 31 December 2023. The total amount drawn down on the facility at 31 December 2019 was £3,045 million (2018: £3,045 million).
On 14 December 2017, the Company renewed its facility with GA plc, its subsidiary, of £9,990 million and the Board approved the extension of the maturity of the loan by five years from 31 December 2017 to 31 December 2022. The other terms of the loan will remain unchanged, including the rate of interest payable by the Company to GA plc (65 basis points above 3 month LIBOR and in the event that the LIBOR rate is less than zero, the rate shall be deemed to be zero). As at 31 December 2019, the loan balance outstanding was £9,630 million (2018: £9,770 million). This loan is secured against the ordinary share capital of Aviva Group Holdings Limited. The loan agreement also includes a penalty interest charge of 1% above the interest rate if any amounts payable under the loan agreement remain outstanding.
(iii) Other transactions Services provided to related parties
2019 2018
Income earned in year
£m
Receivable at year end
£m
Income earned in year
£m
Receivable at year end
£m
Subsidiaries 1,595 241 2,780 414
Income earned relates to dividends. The Company incurred expenses in the year of £0.5 million (2018: £0.5 million) representing audit fees paid by the Company on behalf of subsidiaries. The Company did not recharge subsidiaries for these expenses.
The related parties’ receivables are not secured and no guarantees were received in respect thereof. The receivables will be settled in accordance with normal credit terms.
Services provided by related parties
2019 2018
Expense incurred
in year £m
Payable at year end
£m
Expense incurred
in year £m
Payable at year end
£m
Subsidiaries 175 4,344 224 4,206
Expenses incurred relates to operating expenses. All the Company’s operating cash requirements are met by subsidiary companies and settled through intercompany loans.
The related parties’ payables are not secured and no guarantees were given in respect thereof. The payables will be settled in accordance with normal credit terms. Details of guarantees, indemnities and warranties given by the Company on behalf of related parties are given in note 56(f).
Key management The directors and key management of the Company are considered to be the same as for the Group. Information on both the Company and Group key management compensation can be found in note 63.
P – Subsequent events There are no subsequent events to report.