Embed Size (px)
Citation preview

2017 Full Year Results Property information, strictly private and confidential, ©2018 Rolls-Royce
BLUE page number and reference – adjust title slide on main master slide No 1
Property information, strictly private and confidential ©2018 Rolls-Royce
IFRS 15 Teach-in

Presentation title Property information, strictly private and confidential, ©2018 Rolls-Royce
BLUE page number and reference – adjust title slide on main master slide No 1
Agenda for today
2
Introduction 01
02 IFRS 15 Impact on OE
03 IFRS 15 Impact on Services
04 Deeper dive into LTSAs
05 Balance sheet
Summary and modelling implications
06
07 Questions

Presentation title Property information, strictly private and confidential, ©2018 Rolls-Royce
WHITE page number and reference – adjust title slide on main master slide No 1
3
Introduction 01

Presentation title Property information, strictly private and confidential, ©2018 Rolls-Royce
WHITE page number and reference – adjust title slide on main master slide No 1
4
IFRS 15 is simply an accounting change – economic/business case unchanged
Overview: 1 OE
Sell installed OE widebody engines below cost
Sell business jet OE engines at a profit
2 Services
Installed base and high LTSA* coverage drives engine flying hour based cash inflows
Shop visits are an intermittent cost
Additional regular costs are incurred on service provision
3 Key levers to the economic case
Reduce cash deficits on OE
Keep the fleet flying
Reduce servicing cost and frequency
Manage fixed costs
*Long term service agreement
Presentation title Property information, strictly private and confidential, ©2018 Rolls-Royce
WHITE page number and reference – adjust title slide on main master slide No 1
5
Agenda
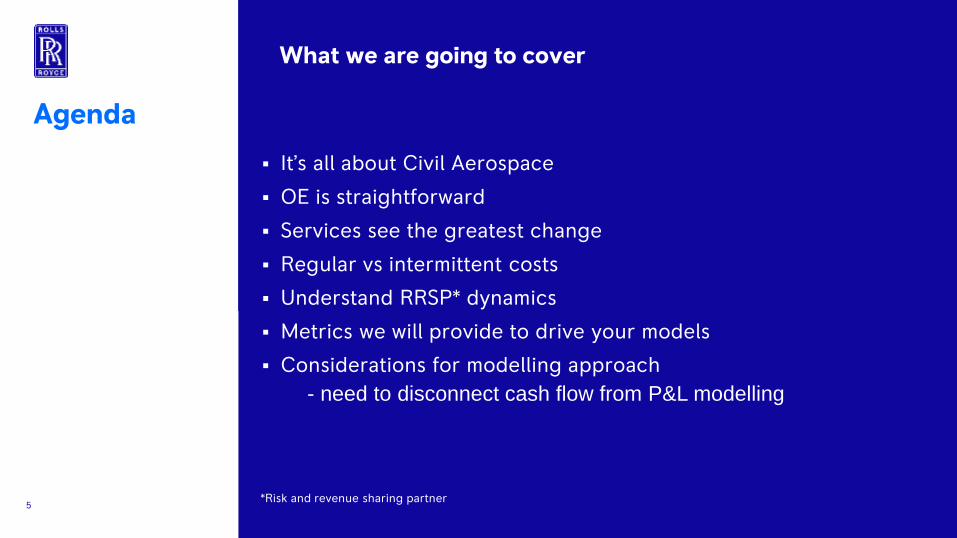
It’s all about Civil Aerospace
OE is straightforward
Services see the greatest change
Regular vs intermittent costs
Understand RRSP* dynamics
Metrics we will provide to drive your models
Considerations for modelling approach
- need to disconnect cash flow from P&L modelling
What we are going to cover
*Risk and revenue sharing partner

2017 Full Year Results Property information, strictly private and confidential, ©2018 Rolls-Royce
BLUE page number and reference – adjust title slide on main master slide No 1
6
IFRS 15 2017 analysis
Group underlying
Current accounting
2017 Change IFRS 15
2017
OE revenue (£m) 7,687 (928) 6,759
Service revenue (£m) 7,403 (480) 6,923
Total revenue (£m) 15,090 (1,408) 13,682
Operating profit / (loss) (£m) 1,175 (854) 321
Reserves (£bn) 6.2 (5.2) 1.0
2017 IFRS 15 figures are preliminary and as processes and procedures are further embedded during 2018 it is possible that some changes may result
Key drivers of difference
- £0.7bn of Widebody cash deficit
Principal Group impact is at Civil Aerospace
Bigger profit adjustment than expected due to higher margin ‘linked’ Trent 700 sales
Presentation title Property information, strictly private and confidential, ©2018 Rolls-Royce
BLUE page number and reference – adjust title slide on main master slide No 1
7
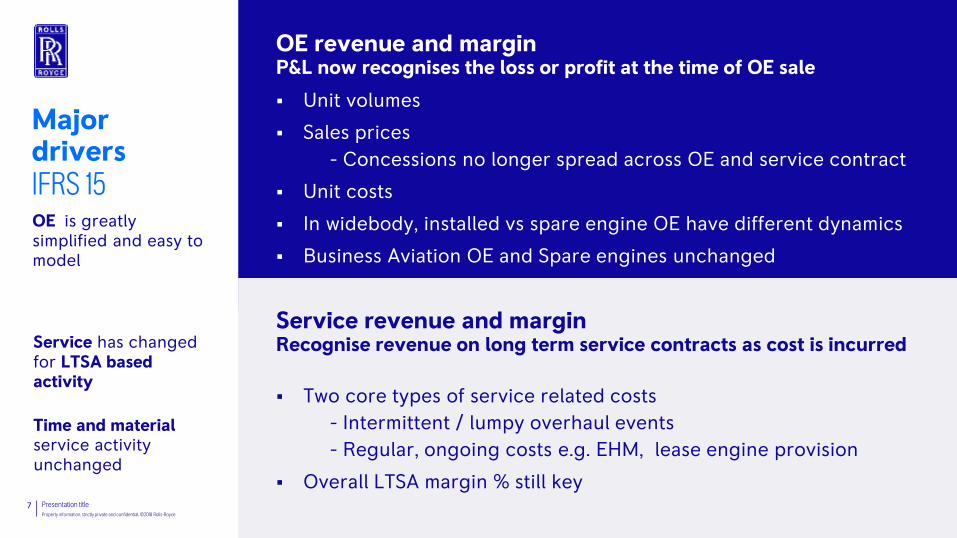
OE revenue and margin P&L now recognises the loss or profit at the time of OE sale
Service revenue and margin Recognise revenue on long term service contracts as cost is incurred
Unit volumes
Sales prices
- Concessions no longer spread across OE and service contract
Unit costs
In widebody, installed vs spare engine OE have different dynamics
Business Aviation OE and Spare engines unchanged
Two core types of service related costs
- Intermittent / lumpy overhaul events
- Regular, ongoing costs e.g. EHM, lease engine provision
Overall LTSA margin % still key
OE is greatly simplified and easy to model
Service has changed for LTSA based activity
Time and material service activity unchanged
Major drivers IFRS 15

Presentation title Property information, strictly private and confidential, ©2018 Rolls-Royce
WHITE page number and reference – adjust title slide on main master slide No 1
8
IFRS 15 Impact on OE 02

Presentation title Property information, strictly private and confidential, ©2018 Rolls-Royce
BLUE page number and reference – adjust title slide on main master slide No 1
9
IFRS 15 OE accounting is straightforward
IFRS 15 income statement $m Total
Net revenue 40
Cost of sales: engine cost (40)
Cost of sales: RRSP (10)
Margin (10)
IFRS 15 revenue = net cash revenue (price after concession)
Cash $m
Gross revenue 100
Concession (60)
Net revenue 40
Engine cost (40)
RRSP (25%) share of net revenue (10)
Cash margin (10)
1
2 RRSP share of revenue is treated as part of the “cost of sale”
1
2
Recognise a loss when the cost exceeds the price
1
2
3 The cash deficit is recognised in the P&L when the OE sale occurs
Illustrative IFRS 15 OE calculation
3
3

2017 Full Year Results Property information, strictly private and confidential, ©2018 Rolls-Royce
WHITE page number and reference – adjust title slide on main master slide No 1
10 2017 Full Year Results Property information, strictly private and confidential, ©2018 Rolls-Royce
Current accounting
OE revenue: £3.8bn
~£1.3bn of OE revenue unaffected by the transition - positive cash margin
£0.9bn lower Large engine installed OE under IFRS 15
2.5
0.6
0.2
0.5
Large engine installed OE
Business aviation OE
V2500 OE
Spare engines
1.6
0.6
0.2
0.5
Civil Aerospace: Underlying OE revenue
IFRS 15
OE revenue: £2.9bn
£0.7bn of Large engine cash deficits
£0.2bn Large engine “linked” profit
£0.9bn
£1.3bn

Presentation title Property information, strictly private and confidential, ©2018 Rolls-Royce
WHITE page number and reference – adjust title slide on main master slide No 1
11
IFRS 15 Impact on Services 03

Presentation title Property information, strictly private and confidential, ©2018 Rolls-Royce
BLUE page number and reference – adjust title slide on main master slide No 1
12
Current v IFRS 15 revenue from LTSAs
Current accounting cumulative revenue
1st overhaul
2nd overhaul
IFRS 15 cumulative revenue
service cost
margin
service cost
Revenue deferred under IFRS 15
Second overhaul cost ~1.2x first
margin
Cumulative revenue
Simplified illustrative example

Presentation title Property information, strictly private and confidential, ©2018 Rolls-Royce
BLUE page number and reference – adjust title slide on main master slide No 1
13
DESCRIPTION
11% YoY growth demonstrates the ramp up in production and the growing in-service fleet Trent engines
Recognise LTSA revenue on a flying hour basis
Recognise LTSA revenue on a cost incurred basis
IFRS 15 delays LTSA revenue recognition vs current accounting:
- young fleet of large engines: average age < 7 years
- business jet engines often on wing for many years prior to first overhaul
£bn 2017
Services revenue 4.2
LTSA: ~70% of revenues
2.9
Other/T&M revenues 1.3
£bn 2017
Services revenue 3.7
LTSA: ~65% of revenues
2.4
Other/T&M revenues 1.3
IFRS 15 Current accounting
Civil Aerospace: Underlying service revenue
LTSA vs T&M
~£1.3bn of other/T&M revenue unaffected by the transition
Around 90% of Trent engine fleet covered by LTSAs and >70% of the business aviation fleet
£0.5bn

Presentation title Property information, strictly private and confidential, ©2018 Rolls-Royce
BLUE page number and reference – adjust title slide on main master slide No 1
14
Current accounting
Service revenue: £4.2bn
IFRS 15 Service revenue £0.5m lower Principal changes:
- Timing
- Concessions
- Contract accounting adjustments
IFRS 15
Service revenue: £3.7bn
Timing – cost event vs EFH
No concession amortisation
Contract accounting adjustments
£0.3bn
2.6 0.5
0.4
0.7
Large engine
Business aviation
Regional
V2500
2.3 0.4
0.3
0.7
Timing – cost event vs EFH
Contract accounting adjustments
£0.1bn
Timing – cost event vs EFH
Contract accounting adjustments
£0.1bn
Civil Aerospace: Underlying service revenue
By category

Presentation title Property information, strictly private and confidential, ©2018 Rolls-Royce
WHITE page number and reference – adjust title slide on main master slide No 1
15
Deeper dive into LTSAs 04

Presentation title Property information, strictly private and confidential, ©2018 Rolls-Royce
BLUE page number and reference – adjust title slide on main master slide No 1
16
Cumulative cash received Cumulative IFRS 15 revenue
Cumulative cash spend
Margin
revenue = cost / ( 1 – margin % ) [ ]
£m
Combination of regular and intermittent costs
Refurbishment overhauls drive significant proportion of individual contract cost
2nd overhaul
1st overhaul
IFRS 15 LTSA accounting

Presentation title Property information, strictly private and confidential, ©2018 Rolls-Royce
BLUE page number and reference – adjust title slide on main master slide No 1
17
Low revenues recognised in early stages of service agreements under IFRS 15
Overhauls drive significant revenue recognition
LTSA accounting IFRS 15
$m 1 2 3 4 5 6 7 8 9 10 Total
Net revenue 100 100 100 100 100 100 100 100 100 100 1000
Overhaul cost – – – (200) – – – (200) – – (400)
Other costs (10) (10) (10) (10) (10) (10) (10) (10) (10) (10) (100)
Total costs (10) (10) (10) (210) (10) (10) (10) (210) (10) (10) (500)
Cash margin 90 90 90 (110) 90 90 90 (110) 90 90 500
Cash margin % 50%
Year
Annual cash revenues (constant EFH)
Cost peaks driven by overhauls
Regular lower level of other contract cost
Simplified LTSA accounting example – no RRSP
Cash
Revenue is recognised on cost
Cost recognised as incurred.
Margin recognised when cost activity occurs.
NB: In practice, costs will be spread more evenly as not all the engines in a fleet will be overhauled in the same period Refurbishment overhauls generally take place every 5-7 years. Shorter periods have been used above to simplify the calculations
$m 1 2 3 4 5 6 7 8 9 10 Total
Net revenue 20 20 20 420 20 20 20 420 20 20 1000
Cost of sales (10) (10) (10) (210) (10) (10) (10) (210) (10) (10) (500)
Margin 10 10 10 210 10 10 10 210 10 10 500
Margin (%) 50% 50% 50% 50% 50% 50% 50% 50% 50% 50% 50%
Completion (%) 2% 2% 2% 42% 2% 2% 2% 42% 2% 2% 100%
Year IFRS 15 Overhaul 1

Presentation title Property information, strictly private and confidential, ©2018 Rolls-Royce
BLUE page number and reference – adjust title slide on main master slide No 1
18
0.4bn
Large engine LTSA cost drivers
2017 Large engine LTSA cost: ~£1.1bn
$m
0.2bn
0.4bn Refurbishment overhaul cost
check and repair activity
Other contract costs
RRSP
Combination of regular and intermittent cost
Pro rata RRSP cost across regular and intermittent
Intermittent
Regular
RRSP
Cash cost
Cash cost

Presentation title Property information, strictly private and confidential, ©2018 Rolls-Royce
BLUE page number and reference – adjust title slide on main master slide No 1
19
Large engine LTSA cost drivers
Intermittent costs
$m
0.2bn
0.4bn Refurbishment overhaul cost
check and repair activity
Intermittent
RRSP
Cash cost
2017 Large engine LTSA cost
service cost variability:
- engine type
- fleet operation
- 1st v 2nd overhaul
Refurbishment overhauls generally every 5-7 years
Majority of the £170m Trent 1000 and 900 in-service costs within LTSA check and repair activity

Presentation title Property information, strictly private and confidential, ©2018 Rolls-Royce
BLUE page number and reference – adjust title slide on main master slide No 1
20
0.4bn
Large engine LTSA cost drivers
Other contract costs
2017 Large engine LTSA cost: ~£1.1bn
$m
Other contract costs
RRSP
Regular Cash cost
Other contract costs includes spare engines, transportation, tooling, engine health monitoring and on-wing support
These costs are incurred on an ongoing basis across the LTSA engine portfolio
Presentation title Property information, strictly private and confidential, ©2018 Rolls-Royce
BLUE page number and reference – adjust title slide on main master slide No 1
21
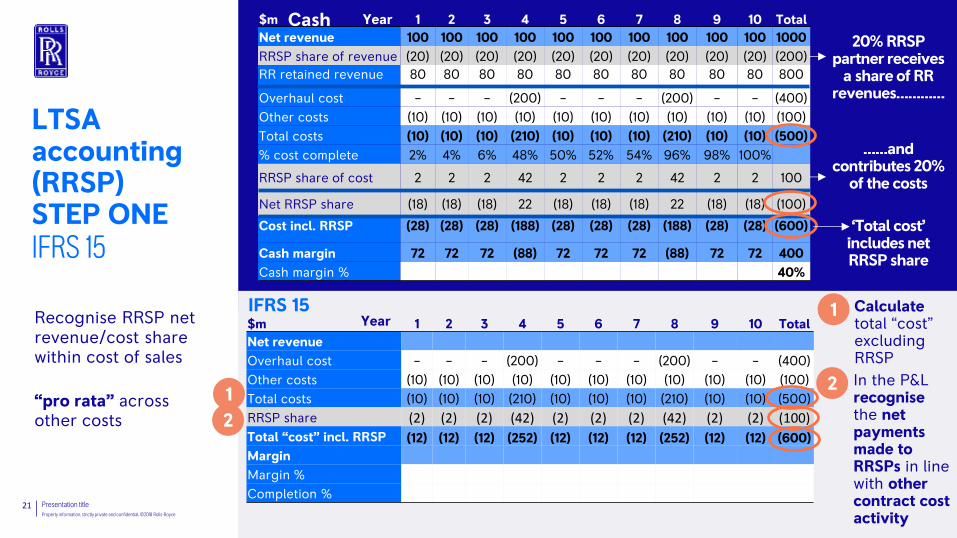
Recognise RRSP net revenue/cost share within cost of sales
“pro rata” across other costs
LTSA accounting (RRSP) STEP ONE IFRS 15
Year IFRS 15 $m 1 2 3 4 5 6 7 8 9 10 Total
Net revenue
Overhaul cost – – – (200) – – – (200) – – (400)
Other costs (10) (10) (10) (10) (10) (10) (10) (10) (10) (10) (100)
Total costs (10) (10) (10) (210) (10) (10) (10) (210) (10) (10) (500)
RRSP share (2) (2) (2) (42) (2) (2) (2) (42) (2) (2) (100)
Total “cost” incl. RRSP (12) (12) (12) (252) (12) (12) (12) (252) (12) (12) (600)
Margin
Margin %
Completion %
Calculate total “cost” excluding RRSP
1
In the P&L recognise the net payments made to RRSPs in line with other contract cost activity
2
2
1
$m 1 2 3 4 5 6 7 8 9 10 Total
Net revenue 100 100 100 100 100 100 100 100 100 100 1000
RRSP share of revenue (20) (20) (20) (20) (20) (20) (20) (20) (20) (20) (200)
RR retained revenue 80 80 80 80 80 80 80 80 80 80 800
Overhaul cost – – – (200) – – – (200) – – (400)
Other costs (10) (10) (10) (10) (10) (10) (10) (10) (10) (10) (100)
Total costs (10) (10) (10) (210) (10) (10) (10) (210) (10) (10) (500)
% cost complete 2% 4% 6% 48% 50% 52% 54% 96% 98% 100%
RRSP share of cost 2 2 2 42 2 2 2 42 2 2 100
Net RRSP share (18) (18) (18) 22 (18) (18) (18) 22 (18) (18) (100)
Cost incl. RRSP (28) (28) (28) (188) (28) (28) (28) (188) (28) (28) (600)
Cash margin 72 72 72 (88) 72 72 72 (88) 72 72 400
Cash margin % 40%
Year
20% RRSP partner receives
a share of RR revenues…………
……and
contributes 20% of the costs
‘Total cost’ includes net RRSP share
Cash

Presentation title Property information, strictly private and confidential, ©2018 Rolls-Royce
BLUE page number and reference – adjust title slide on main master slide No 1
22
LTSA accounting (RRSP) STEP TWO IFRS 15
As revenue is recognised on cost, including pro rata RRSP, overhauls are major drivers of revenue recognition
$m 1 2 3 4 5 6 7 8 9 10 Total
Net revenue 100 100 100 100 100 100 100 100 100 100 1000
RRSP share of revenue (20) (20) (20) (20) (20) (20) (20) (20) (20) (20) (200)
RR retained revenue 80 80 80 80 80 80 80 80 80 80 800
Overhaul cost – – – (200) – – – (200) – – (400)
Other costs (10) (10) (10) (10) (10) (10) (10) (10) (10) (10) (100)
Total costs (10) (10) (10) (210) (10) (10) (10) (210) (10) (10) (500)
% cost complete 2% 2% 2% 42% 2% 2% 2% 42% 2% 2% 100%
RRSP share of cost 2 2 2 42 2 2 2 42 2 2 100
Net RRSP share (18) (18) (18) 22 (18) (18) (18) 22 (18) (18) (100)
Cost incl. RRSP (28) (28) (28) (188) (28) (28) (28) (188) (28) (28) (600)
Cash margin 72 72 72 (88) 72 72 72 (88) 72 72 400
Cash margin % 40%
Year
20% RRSP partner receives
a share of RR revenues…………
……and
contributes 20% of the costs
‘Total cost’ includes net RRSP share
Cash
Year IFRS 15 $m 1 2 3 4 5 6 7 8 9 10 Total
Net revenue 20 20 20 420 20 20 20 420 20 20 1000
Overhaul cost – – – (200) – – – (200) – – (400)
Other costs (10) (10) (10) (10) (10) (10) (10) (10) (10) (10) (100)
Total costs (10) (10) (10) (210) (10) (10) (10) (210) (10) (10) (500)
RRSP cost of sale (2) (2) (2) (42) (2) (2) (2) (42) (2) (2) (100)
Total cost of sale (12) (12) (12) (252) (12) (12) (12) (252) (12) (12) (600)
Margin 8 8 8 168 8 8 8 168 8 8 400
Margin % 40% 40% 40% 40% 40% 40% 40% 40% 40% 40% 40%
% of total cost of sale 2% 2% 2% 42% 2% 2% 2% 42% 2% 2%
Apply contract margin to total “cost” including RRSP pro rata to calculate revenue
Revenue = total “cost” /
( 1 - 40%)
(600)/60% = 1000
3
3

Presentation title Property information, strictly private and confidential, ©2018 Rolls-Royce
BLUE page number and reference – adjust title slide on main master slide No 1
23
Risk & Revenue Sharing Partners (RRSPs)
$m
Programmes RRSP % in-service
engines in 2017
in-service engine % in
2017
RB211, Trent 700 and Trent 800
<10% 3,015 68%
Trent 500 and Trent 900 15-20% 640 15%
Trent 1000, Trent 7000 and Trent XWB-84 and
Trent XWB-97 25-30% 754 17%
RRSP participation on newer engine programmes is higher than for more mature programmes
RRSP in-service fleet coverage will increase in future
in-service engine % in 2020
Presentation title Property information, strictly private and confidential, ©2018 Rolls-Royce
BLUE page number and reference – adjust title slide on main master slide No 1
24
$m
Cash $m 0 1 2 3 4 5 6 7 8 9 10 Total
Net revenue – 10 10 10 10 10 10 10 10 10 10 100
Cost – (1) (1) (1) (21) (1) (1) (1) (21) (1) (1) (50)
RRSP share – (2) (2) (2) 2 (2) (2) (2) 2 (2) (2) (10)
Margin – 7 7 7 (9) 7 7 7 (9) 7 7 40
Margin % 40%
Year
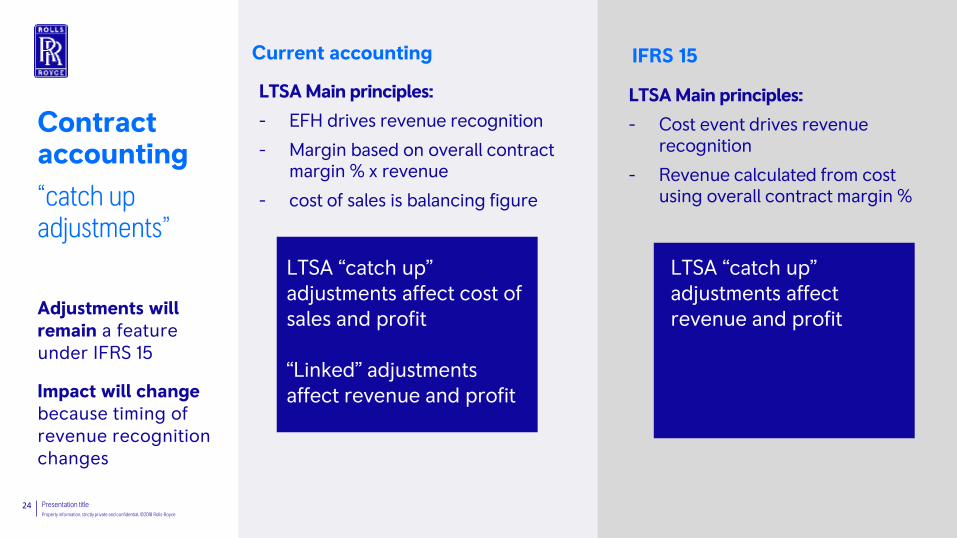
Contract accounting
“catch up adjustments”
Adjustments will remain a feature under IFRS 15
Impact will change because timing of revenue recognition changes
Current accounting IFRS 15
LTSA Main principles:
- EFH drives revenue recognition
- Margin based on overall contract margin % x revenue
- cost of sales is balancing figure
LTSA Main principles:
- Cost event drives revenue recognition
- Revenue calculated from cost using overall contract margin %
LTSA “catch up” adjustments affect cost of sales and profit “Linked” adjustments affect revenue and profit
LTSA “catch up” adjustments affect revenue and profit

Presentation title Property information, strictly private and confidential, ©2018 Rolls-Royce
WHITE page number and reference – adjust title slide on main master slide No 1
25
Balance sheet 05

Presentation title Property information, strictly private and confidential, ©2018 Rolls-Royce
BLUE page number and reference – adjust title slide on main master slide No 1
26
£bn
Current
accounting IFRS 15 Delta
Contractual Aftermarket Rights 0.8 - (0.8)
Participation Fees – Intangible Asset 0.4 - (0.4)
Participation Fees – Contract Asset - 0.4 0.4
Net Contract Debtor/(Creditor) 2.5 (2.7) (5.2)
Other (0.6) (0.3) 0.3
Risk and revenue sharing partner participation fees
(0.3) (0.8) (0.5)
Total reserves impacted (pre-tax) 2.8 (3.4) (6.2)
Tax 1.1
Total reserves impact (post tax) (5.1)
Estimated Civil Aerospace Balance Sheet impact
Change in accounting of cash contributions received from RRSPs at the start of a programme
- IFRS 15: recognised as reduction to cost of sales
- Current accounting: recognised as reduction to R&D charge
Most significant impact is the net contract balance
Reflects
- Reversal of linked profit
- EFH to cost event based revenue recognition
Presentation title Property information, strictly private and confidential, ©2018 Rolls-Royce
BLUE page number and reference – adjust title slide on main master slide No 1
27
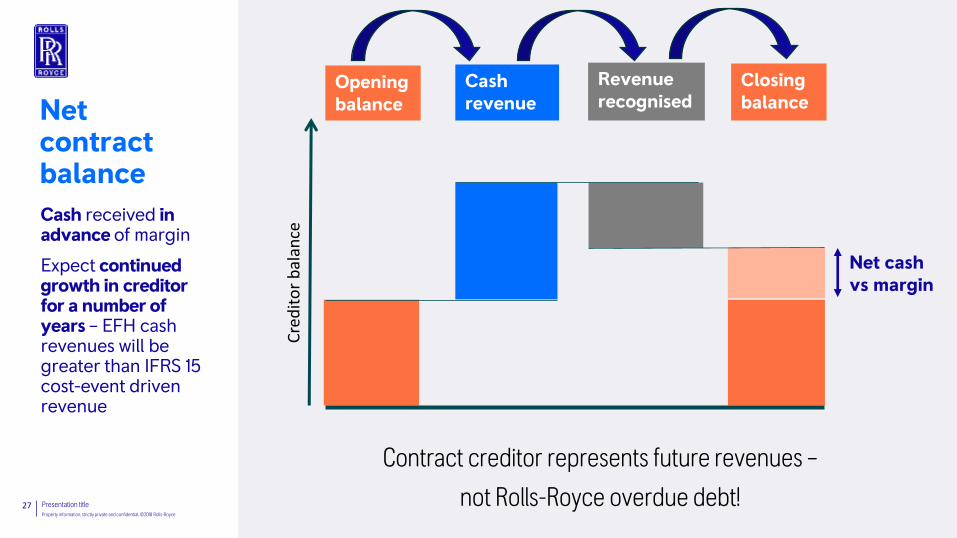
Cash received in advance of margin
Expect continued growth in creditor for a number of years – EFH cash revenues will be greater than IFRS 15 cost-event driven revenue
Net contract balance
Contract creditor represents future revenues –
not Rolls-Royce overdue debt!
Opening balance
Cash revenue
Revenue recognised
Closing balance
Net cash vs margin
Cre
dit
or
bal
ance

Presentation title Property information, strictly private and confidential, ©2018 Rolls-Royce
BLUE page number and reference – adjust title slide on main master slide No 1
28
Cash received ahead of margin is reflected on the balance sheet as a creditor
LTSA accounting IFRS 15
$m 1 2 3 4 5 6 7 8 9 10 Total
Net revenue 100 100 100 100 100 100 100 100 100 100 1000
Overhaul cost – – – (200) – – – (200) – – (400)
Other costs (10) (10) (10) (10) (10) (10) (10) (10) (10) (10) (100)
Total costs (10) (10) (10) (210) (10) (10) (10) (210) (10) (10) (500)
Cash margin 90 90 90 (110) 90 90 90 (110) 90 90 500
Cash margin % 50%
Year
Simplified LTSA accounting example – no RRSP
Cash
p&l margin only 10
…so 80 of cash received ahead of p&l margin goes onto the balance sheet as a contract balance creditor
NB: In practice, costs will be spread more evenly as not all the engines in a fleet will be overhauled in the same period Refurbishment overhauls generally take place every 5-7 years. Shorter periods have been used above to simplify the calculations
$m 1 2 3 4 5 6 7 8 9 10 Total
Net revenue 20 20 20 420 20 20 20 420 20 20 1000
Cost of sales (10) (10) (10) (210) (10) (10) (10) (210) (10) (10) (500)
Margin 10 10 10 210 10 10 10 210 10 10 500
Margin (%) 50% 50% 50% 50% 50% 50% 50% 50% 50% 50% 50%
Completion (%) 2% 2% 2% 42% 2% 2% 2% 42% 2% 2% 100%
Contract balance
(80) (160) (240) 80 0 (80) (160) 160 80 0
Year IFRS 15 Overhaul 1
In year 1
cash margin is 90

Presentation title Property information, strictly private and confidential, ©2018 Rolls-Royce
WHITE page number and reference – adjust title slide on main master slide No 1
29
Summary and modelling implications 06

Presentation title Property information, strictly private and confidential, ©2018 Rolls-Royce
BLUE page number and reference – adjust title slide on main master slide No 1
30
Conclusions
OE volumes
Average OE cash deficit
LTSA shop visits
Installed fleet
Invoiced flying hours
Reminder: IFRS 15 changes LTSA revenue; T&M still the same
Contract accounting adjustments remain a fact of life
LTC balance is growth indicator of future revenue (and doesn’t mean building overdue debt!)
Not just about the lumpy costs
Metrics we will provide

Presentation title Property information, strictly private and confidential, ©2018 Rolls-Royce
BLUE page number and reference – adjust title slide on main master slide No 1
31
$m
Modelling
Cash P&L
Modelling Need to maintain separate driver based cash and p&l models
RR will provide certain metrics & direction to help both elements
Other metrics will reflect your assumptions
OE/ spares volumes
Average OE cash deficits
Invoiced flying hours
In-service fleet
No. of LTSA engine overhauls
OE/ spares volumes
Average OE cash deficits
No. of LTSA engine overhauls
EFH revenue EFH yield
EFH revenue LTSA margin % Recurring costs

2017 Full Year Results Property information, strictly private and confidential, ©2018 Rolls-Royce
BLUE page number and reference – adjust title slide on main master slide No 1
32
The first year of adoption – still learning
IFRS 15 no change to cash
No change to in-year cash
No change to total profit or cash over the life of a long term contract
Significantly improves transparency on Civil Aerospace OE – much closer to cash
Continue long-term contract accounting – accounting adjustments remain a feature
Civil Aftermarket: greater forecasting challenge
first year of adoption
in-service vs regular overhauls
impact of overhaul deferrals

Presentation title Property information, strictly private and confidential, ©2018 Rolls-Royce
WHITE page number and reference – adjust title slide on main master slide No 1
33
Questions 07
Presentation title Property information, strictly private and confidential, ©2018 Rolls-Royce
WHITE page number and reference – adjust title slide on main master slide No 1
34
Appendices 08 Detailed adjustments

Presentation title Property information, strictly private and confidential, ©2018 Rolls-Royce
BLUE page number and reference – adjust title slide on main master slide No 1
35
Note: All adjustments shown pre-tax effects
Underlying Revenue Underlying Profit
No profit on linked OE sale £(194)m
Total OE deficit £(704)m includes: No capitalisation of linked engine cash deficit £(418)m No CARs on unlinked contracts £(286)m c Treatment of guarantees and penalties £(13)m
No profit on linked OE sales £(194)m
No amortisation of CARs £57m
Treatment of guarantees and penalties £5m
Other timing differences £20m
£(9
13)m
Treatment of participation fees £(22)m
£(8
27
)m
Estimated IFRS 15 changes - 2017 Civil Aerospace OE
Other timing differences £(14)
RRSP participation fees £23m
Total OE deficit £(704)m includes: No capitalisation of linked engine cash deficit £(418)m No CARs on unlinked contracts £(286)m
No change to cash flows from any of the revenue and profit changes
These estimated figures are preliminary and, as processes and procedures are further embedded during 2018, it is possible that some changes to the impact may result

Presentation title Property information, strictly private and confidential, ©2018 Rolls-Royce
BLUE page number and reference – adjust title slide on main master slide No 1
36
Estimated IFRS 15 changes – 2017 Civil Aerospace Services
Note: All adjustments shown pre-tax effects
Underlying Revenue Underlying Profit
£(4
97
)m
£(2
3)m
No amortisation of prior years concession deferral £353m
Contract accounting adjustments difference £(131)m
Large engine cost incurred vs engine flying hour impact £(127)m
CorporateCare® and regional cost incurred vs engine flying hour impact £(118)m
No amortisation of prior years concession deferral £353m
Contract accounting adjustments difference £(341)m
Large engine cost incurred vs engine flying hour impact £(344)m
CorporateCare® and regional cost incurred vs engine flying hour impact £(165)m
No change to cash flows from any of the revenue and profit changes
These estimated figures are preliminary and, as processes and procedures are further embedded during 2018, it is possible that some changes to the impact may result

Presentation title Property information, strictly private and confidential, ©2018 Rolls-Royce
BLUE page number and reference – adjust title slide on main master slide No 1
37
Other parts of the group
£(34)m LTSA margin impact offset by £30m favourable timing benefit from spares distribution contract in Defence Aerospace - LTSA margin impact expected to recur in the short term; timing benefit from the spares distribution contract is not
The overall net impact across the rest of the group is insignificant.
£m
Current
accounting IFRS 15 Change
Revenue Civil 8,023 6,613 (1,410) Defence 2,275 2,282 7 Power Systems 2,923 2,919 (4) Marine 1,077 1,075 (2) Nuclear 818 818 - Other (26) (25) 1 Total revenue 15,090 13,682 (1,408)
Operating profit Civil 520 (330) (850) Defence 374 370 (4) Power Systems 330 331 1 Marine (25) (26) (1) Nuclear 38 38 - Other (62) (62) - Total operating profit 1,175 321 (854)

Presentation title Property information, strictly private and confidential, ©2018 Rolls-Royce
BLUE page number and reference – adjust title slide on main master slide No 1
38
Jennifer Ramsey Contacts Head of Investor Relations
Tel: +44(0)207 227 9087
Manager, Investor Relations
Tel: +44(0)207 227 9141
Richard Foster
Assistant Director, Investor Relations
Tel: +44(0)207 227 9339
Programme Coordinator, Investor Relations
Tel: +44(0)207 227 9237
Elena Prentice
Assistant Director, Investor Relations
Tel: +44(0)207 227 9282
Helen Harman
Ross Hawley
For more information: www.rolls-royce.com/investors
Updated

Presentation title Property information, strictly private and confidential, ©2018 Rolls-Royce
BLUE page number and reference – adjust title slide on main master slide No 1
39
This announcement contains certain forward-looking statements. These forward-looking statements can be identified by the fact that they do not relate only to historical or current facts. In particular, all statements that express forecasts, expectations and projections with respect to future matters, including trends in results of operations, margins, growth rates, overall market trends, the impact of interest or exchange rates, the availability of financing to the Company, anticipated cost savings or synergies and the completion of the Company's strategic transactions, are forward-looking statements. By their nature, these statements and forecasts involve risk and uncertainty because they relate to events and depend on circumstances that may or may not occur in the future. There are a number of factors that could cause actual results or developments to differ materially from those expressed or implied by these forward-looking statements and forecasts. The forward-looking statements reflect the knowledge and information available at the date of preparation of this announcement, and will not be updated during the year. Nothing in this announcement should be construed as a profit forecast. All figures are on an underlying basis unless otherwise stated - see note 2 of the 2017 full year results statement for the definition.
Safe harbour statement