Embed Size (px)
Citation preview
THE NUTRIENT CONTENT OF FIVE TRADITIONAL SOUTH AFRICAN DARK GREEN LEAFY 1
VEGETABLES - A PRELIMINARY STUDY 2 1H.C. Schönfeldt,
2B. Pretorius 3
4 1School of Agricultural and Food Sciences, University of Pretoria, Pretoria, 0002, South Africa 5
6 2ARC – Irene Analytical Services, Livestock Business Division, Agricultural Research Council, 7
Private Bag X2, Irene, 0062, South Africa 8
9
10
ABSTRACT 11
The nutrient content (proximate, vitamin B2, ß-carotene, iron, zinc, magnesium, calcium and 12
phosphorus) of five traditional dark green leafy vegetables, traditionally consumed by rural 13
inhabitants of South Africa (SA), was determined in this study. The nutritional dilemma in SA, with 14
many children and adults suffering from micronutrients deficiencies, is a strong motivator for 15
indicating the nutritional composition of traditional foods. The moisture, protein, ash and fat 16
content in the raw leaves per 100g ranged from 81.0 – 89.9 g/100g, 3.49 – 5.68 g/100g, 1.42 – 17
3.23 g/100g and 0.12 – 0.36 g/100g respectively. There was an increase in moisture content in 18
the cooked leaves while the protein, fat and ash decreased during the cooking process. Raw 19
misbredie (Amaranthus tricolor), pumpkin leaves (Curcubita maxima) and cat’s whiskers (Cleome 20
gynandra) had a high iron content compared to cowpea leaves (Vigna unguiculata) and wild jute 21
(Corchorus olitorius), which in nutritional terms might play a role in combating iron deficiency in 22
SA. The zinc content ranged from 0.5 towards 1.0 mg/100g while the magnesium ranged from 23
54.7 mg to 146 mg/100g. As expected the minerals decreased during cooking. Cowpea leaves 24
was the poorest source of minerals compared to the other leafy vegetables but had a good index 25
of nutritional quality for protein. Raw and cooked pumpkin leaves had the highest index of 26
nutritional quality for protein. Both raw and cooked leafy vegetables contained high levels of 27
beta-carotene (with total beta-carotene levels in the range of 796 – 6134μg/100g) but low levels 28
of vitamin B2 (0.01 – 0.12 mg/100g). 29
30
Key words: Nutrient content; Traditional dark green leafy vegetables, Amaranthus tricolor, 31
Cleome gynandra, Crochorus olitorius, Curcubita maxima, Vigna unguiculata 32
1. INTRODUCTION 33
Food insecurity is one of the main reasons causing malnutrition in South Africa (SA), with 1 in 2 34
households in SA experiencing hunger as determined by the hunger scale. Furthermore, in 2005 35
one third of South Africans were at risk of hunger, and only one out of every five people were 36
recorded to be food secure (NFCS-FB-1, 2008; Schönfeldt et al., 2010). According to the 1999 37
National Food Consumption Survey (NFCS, 1999) one out of every nine children are underweight 38
and one out of five children were stunted at national level (Labadarios et al.,1999). The majority 39
of SA households consume a limited variety of foods, mainly consisting of staples, and in 40
200385% of the households in SA purchased all the foods they consume. Only 5% of households 41
have been indicated to grow their own food for consumption (UWC, 2003). The recent significant 42
increase in food inflation is recognized as one of the main contributors to food insecurity, leading 43
towards an abundant food supply that people cannot afford to buy (Schonfeldt et al., 2010). The 44
importance of food coping strategies, like planting and harvesting, own food thus strongly comes 45
into focus, 46
Surveys indicate that there are over 7 000 plant species across the world that are cultivated or 47
harvested from the wild for food. These neglected and underutilized species play a crucial role in 48
food security, income generation and food culture of the rural poor. Lack of attention in the past 49
has meant that their potential value is mostly under-estimated and under-exploited. Many 50
neglected and underutilized species are nutritionally rich and are adapted to low input agriculture 51
(IPGRI, 2000 – 2005). Food insecurity can be reduced by motivating communities to increase 52
their consumption of indigenous and traditional dark green leafy vegetables (IPGRI, 2000 – 53
2005). However, to recommend these foodstuffs as contribution to an improved diet, knowledge 54
about the nutrient content of the traditional vegetables is required. The values currently in the 55
South African Medical Research Council’s tables (Kruger et al., 1998) are based on a limited 56
amount of plants tested in Venda in one specific region (Limpopo province) of SA. It should also 57
be considered that soil and climatic conditions of different regions results in a significant 58
difference in food composition of foods produced (Greenfield & Southgate, 2003) and therefore 59
data cannot simply be borrowed between countries. 60
In order to enhance current nutrition education programs in SA, knowledge of the nutrient 61
composition of the traditional vegetables is essential. Due to financial constraints the nutrients 62
analyzed were limited to those nutrients that were high in these species according to previous 63
studies done in other parts of the world. This study aimed at determining the content of selected 64
nutrients (protein, fat, ash, moisture, vitamin B2, ß-carotene, iron, zinc, magnesium, calcium and 65
phosphorus) contained in five commonly consumed indigenous dark green leafy vegetables, 66
namely misbredie (Amaranthus tricolor), pumpkin leaves (Curcubita maxima), cat’s whiskers 67
(Cleome gynandra), cowpea leaves (Vigna unguiculata) and wild jute (Corchorus olitorius). The 68
analysis was done on both raw and cooked samples to enable determining the effect of traditional 69
cooking practices on nutrient content. 70
71
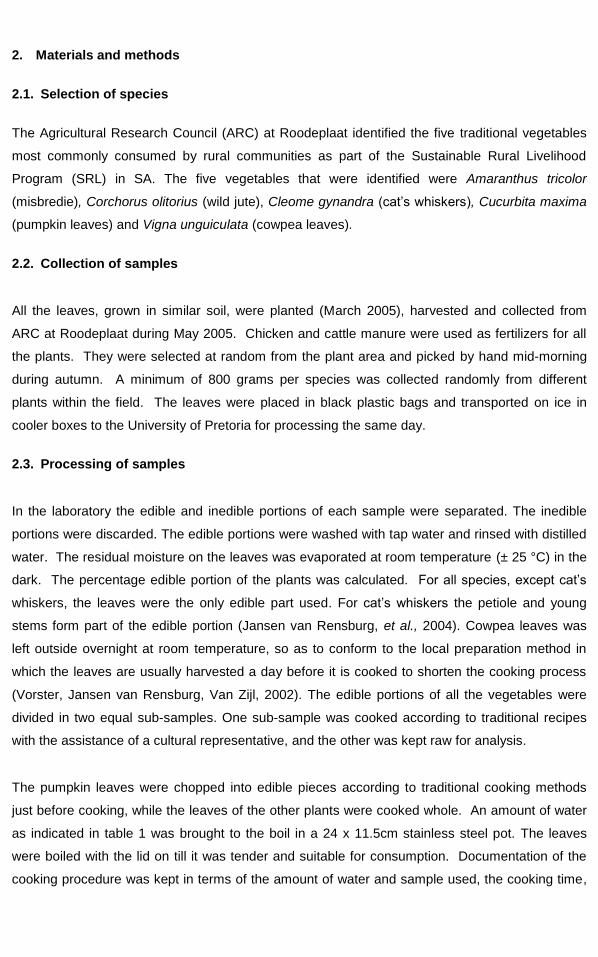
2. Materials and methods 72
2.1. Selection of species 73
The Agricultural Research Council (ARC) at Roodeplaat identified the five traditional vegetables 74
most commonly consumed by rural communities as part of the Sustainable Rural Livelihood 75
Program (SRL) in SA. The five vegetables that were identified were Amaranthus tricolor 76
(misbredie), Corchorus olitorius (wild jute), Cleome gynandra (cat’s whiskers), Cucurbita maxima 77
(pumpkin leaves) and Vigna unguiculata (cowpea leaves). 78
2.2. Collection of samples 79
All the leaves, grown in similar soil, were planted (March 2005), harvested and collected from 80
ARC at Roodeplaat during May 2005. Chicken and cattle manure were used as fertilizers for all 81
the plants. They were selected at random from the plant area and picked by hand mid-morning 82
during autumn. A minimum of 800 grams per species was collected randomly from different 83
plants within the field. The leaves were placed in black plastic bags and transported on ice in 84
cooler boxes to the University of Pretoria for processing the same day. 85
2.3. Processing of samples 86
In the laboratory the edible and inedible portions of each sample were separated. The inedible 87
portions were discarded. The edible portions were washed with tap water and rinsed with distilled 88
water. The residual moisture on the leaves was evaporated at room temperature (± 25 °C) in the 89
dark. The percentage edible portion of the plants was calculated. For all species, except cat’s 90
whiskers, the leaves were the only edible part used. For cat’s whiskers the petiole and young 91
stems form part of the edible portion (Jansen van Rensburg, et al., 2004). Cowpea leaves was 92
left outside overnight at room temperature, so as to conform to the local preparation method in 93
which the leaves are usually harvested a day before it is cooked to shorten the cooking process 94
(Vorster, Jansen van Rensburg, Van Zijl, 2002). The edible portions of all the vegetables were 95
divided in two equal sub-samples. One sub-sample was cooked according to traditional recipes 96
with the assistance of a cultural representative, and the other was kept raw for analysis. 97
The pumpkin leaves were chopped into edible pieces according to traditional cooking methods 98
just before cooking, while the leaves of the other plants were cooked whole. An amount of water 99
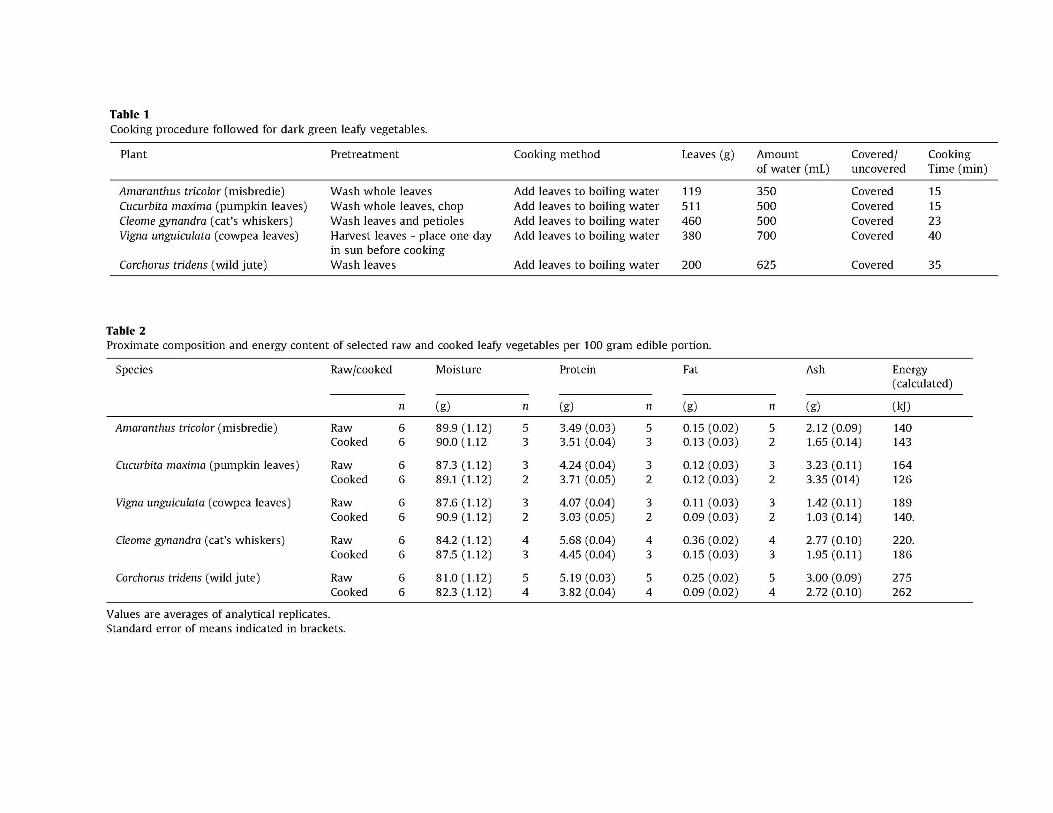
as indicated in table 1 was brought to the boil in a 24 x 11.5cm stainless steel pot. The leaves 100
were boiled with the lid on till it was tender and suitable for consumption. Documentation of the 101
cooking procedure was kept in terms of the amount of water and sample used, the cooking time, 102
and the amount of water and sample left after the cooking procedure (Table 1). Afer cooking the 103
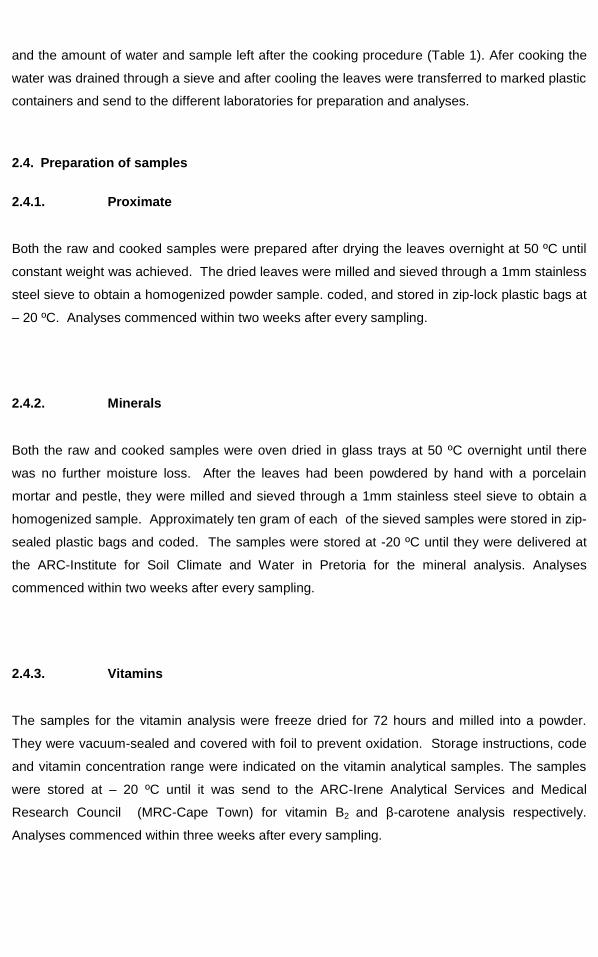
water was drained through a sieve and after cooling the leaves were transferred to marked plastic 104
containers and send to the different laboratories for preparation and analyses. 105
106
2.4. Preparation of samples 107
2.4.1. Proximate 108
Both the raw and cooked samples were prepared after drying the leaves overnight at 50 ºC until 109
constant weight was achieved. The dried leaves were milled and sieved through a 1mm stainless 110
steel sieve to obtain a homogenized powder sample. coded, and stored in zip-lock plastic bags at 111
– 20 ºC. Analyses commenced within two weeks after every sampling. 112
113
2.4.2. Minerals 114
Both the raw and cooked samples were oven dried in glass trays at 50 ºC overnight until there 115
was no further moisture loss. After the leaves had been powdered by hand with a porcelain 116
mortar and pestle, they were milled and sieved through a 1mm stainless steel sieve to obtain a 117
homogenized sample. Approximately ten gram of each of the sieved samples were stored in zip-118
sealed plastic bags and coded. The samples were stored at -20 ºC until they were delivered at 119
the ARC-Institute for Soil Climate and Water in Pretoria for the mineral analysis. Analyses 120
commenced within two weeks after every sampling. 121
122
2.4.3. Vitamins 123
The samples for the vitamin analysis were freeze dried for 72 hours and milled into a powder. 124
They were vacuum-sealed and covered with foil to prevent oxidation. Storage instructions, code 125
and vitamin concentration range were indicated on the vitamin analytical samples. The samples 126
were stored at – 20 ºC until it was send to the ARC-Irene Analytical Services and Medical 127
Research Council (MRC-Cape Town) for vitamin B2 and β-carotene analysis respectively. 128
Analyses commenced within three weeks after every sampling. 129
130
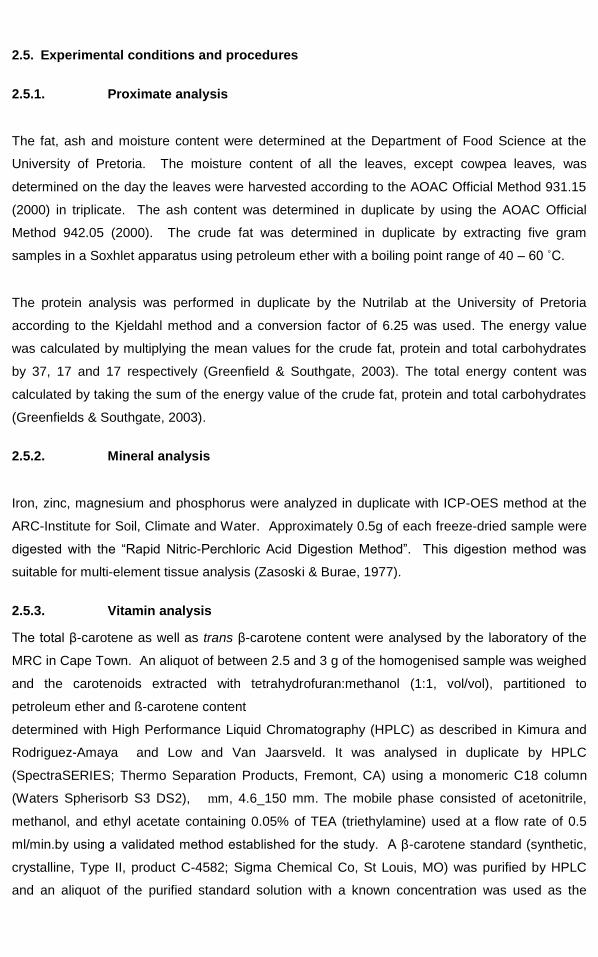
2.5. Experimental conditions and procedures 131
2.5.1. Proximate analysis 132
The fat, ash and moisture content were determined at the Department of Food Science at the 133
University of Pretoria. The moisture content of all the leaves, except cowpea leaves, was 134
determined on the day the leaves were harvested according to the AOAC Official Method 931.15 135
(2000) in triplicate. The ash content was determined in duplicate by using the AOAC Official 136
Method 942.05 (2000). The crude fat was determined in duplicate by extracting five gram 137
samples in a Soxhlet apparatus using petroleum ether with a boiling point range of 40 – 60 ˚C. 138
The protein analysis was performed in duplicate by the Nutrilab at the University of Pretoria 139
according to the Kjeldahl method and a conversion factor of 6.25 was used. The energy value 140
was calculated by multiplying the mean values for the crude fat, protein and total carbohydrates 141
by 37, 17 and 17 respectively (Greenfield & Southgate, 2003). The total energy content was 142
calculated by taking the sum of the energy value of the crude fat, protein and total carbohydrates 143
(Greenfields & Southgate, 2003). 144
2.5.2. Mineral analysis 145
Iron, zinc, magnesium and phosphorus were analyzed in duplicate with ICP-OES method at the 146
ARC-Institute for Soil, Climate and Water. Approximately 0.5g of each freeze-dried sample were 147
digested with the “Rapid Nitric-Perchloric Acid Digestion Method”. This digestion method was 148
suitable for multi-element tissue analysis (Zasoski & Burae, 1977). 149
2.5.3. Vitamin analysis 150
The total β-carotene as well as trans β-carotene content were analysed by the laboratory of the 151
MRC in Cape Town. An aliquot of between 2.5 and 3 g of the homogenised sample was weighed 152
and the carotenoids extracted with tetrahydrofuran:methanol (1:1, vol/vol), partitioned to 153
petroleum ether and ß-carotene content 154
determined with High Performance Liquid Chromatography (HPLC) as described in Kimura and 155
Rodriguez-Amaya and Low and Van Jaarsveld. It was analysed in duplicate by HPLC 156
(SpectraSERIES; Thermo Separation Products, Fremont, CA) using a monomeric C18 column 157
(Waters Spherisorb S3 DS2), mm, 4.6_150 mm. The mobile phase consisted of acetonitrile, 158
methanol, and ethyl acetate containing 0.05% of TEA (triethylamine) used at a flow rate of 0.5 159
ml/min.by using a validated method established for the study. A β-carotene standard (synthetic, 160
crystalline, Type II, product C-4582; Sigma Chemical Co, St Louis, MO) was purified by HPLC 161
and an aliquot of the purified standard solution with a known concentration was used as the 162
external standard for quantification of β-carotene in the sample extract (Van Jaarsveld et al., 163
2005; Faber et al., 2010). 164
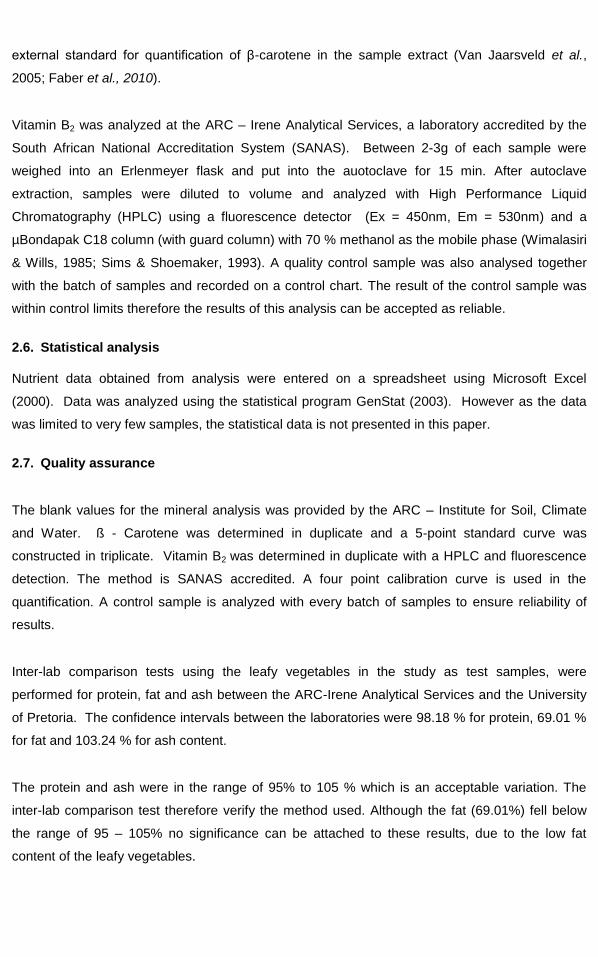
Vitamin B2 was analyzed at the ARC – Irene Analytical Services, a laboratory accredited by the 165
South African National Accreditation System (SANAS). Between 2-3g of each sample were 166
weighed into an Erlenmeyer flask and put into the auotoclave for 15 min. After autoclave 167
extraction, samples were diluted to volume and analyzed with High Performance Liquid 168
Chromatography (HPLC) using a fluorescence detector (Ex = 450nm, Em = 530nm) and a 169
µBondapak C18 column (with guard column) with 70 % methanol as the mobile phase (Wimalasiri 170
& Wills, 1985; Sims & Shoemaker, 1993). A quality control sample was also analysed together 171
with the batch of samples and recorded on a control chart. The result of the control sample was 172
within control limits therefore the results of this analysis can be accepted as reliable. 173
2.6. Statistical analysis 174
Nutrient data obtained from analysis were entered on a spreadsheet using Microsoft Excel 175
(2000). Data was analyzed using the statistical program GenStat (2003). However as the data 176
was limited to very few samples, the statistical data is not presented in this paper. 177
2.7. Quality assurance 178
The blank values for the mineral analysis was provided by the ARC – Institute for Soil, Climate 179
and Water. ß - Carotene was determined in duplicate and a 5-point standard curve was 180
constructed in triplicate. Vitamin B2 was determined in duplicate with a HPLC and fluorescence 181
detection. The method is SANAS accredited. A four point calibration curve is used in the 182
quantification. A control sample is analyzed with every batch of samples to ensure reliability of 183
results. 184
Inter-lab comparison tests using the leafy vegetables in the study as test samples, were 185
performed for protein, fat and ash between the ARC-Irene Analytical Services and the University 186
of Pretoria. The confidence intervals between the laboratories were 98.18 % for protein, 69.01 % 187
for fat and 103.24 % for ash content. 188
The protein and ash were in the range of 95% to 105 % which is an acceptable variation. The 189
inter-lab comparison test therefore verify the method used. Although the fat (69.01%) fell below 190
the range of 95 – 105% no significance can be attached to these results, due to the low fat 191
content of the leafy vegetables. 192
3. RESULTS AND DISCUSSION 193
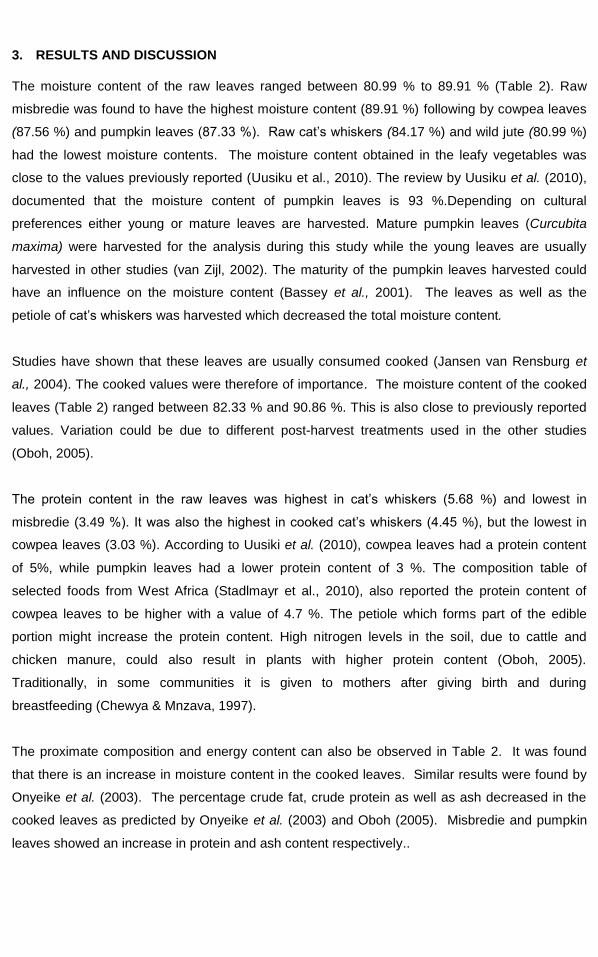
The moisture content of the raw leaves ranged between 80.99 % to 89.91 % (Table 2). Raw 194
misbredie was found to have the highest moisture content (89.91 %) following by cowpea leaves 195
(87.56 %) and pumpkin leaves (87.33 %). Raw cat’s whiskers (84.17 %) and wild jute (80.99 %) 196
had the lowest moisture contents. The moisture content obtained in the leafy vegetables was 197
close to the values previously reported (Uusiku et al., 2010). The review by Uusiku et al. (2010), 198
documented that the moisture content of pumpkin leaves is 93 %.Depending on cultural 199
preferences either young or mature leaves are harvested. Mature pumpkin leaves (Curcubita 200
maxima) were harvested for the analysis during this study while the young leaves are usually 201
harvested in other studies (van Zijl, 2002). The maturity of the pumpkin leaves harvested could 202
have an influence on the moisture content (Bassey et al., 2001). The leaves as well as the 203
petiole of cat’s whiskers was harvested which decreased the total moisture content. 204
205
Studies have shown that these leaves are usually consumed cooked (Jansen van Rensburg et 206
al., 2004). The cooked values were therefore of importance. The moisture content of the cooked 207
leaves (Table 2) ranged between 82.33 % and 90.86 %. This is also close to previously reported 208
values. Variation could be due to different post-harvest treatments used in the other studies 209
(Oboh, 2005). 210
211
The protein content in the raw leaves was highest in cat’s whiskers (5.68 %) and lowest in 212
misbredie (3.49 %). It was also the highest in cooked cat’s whiskers (4.45 %), but the lowest in 213
cowpea leaves (3.03 %). According to Uusiki et al. (2010), cowpea leaves had a protein content 214
of 5%, while pumpkin leaves had a lower protein content of 3 %. The composition table of 215
selected foods from West Africa (Stadlmayr et al., 2010), also reported the protein content of 216
cowpea leaves to be higher with a value of 4.7 %. The petiole which forms part of the edible 217
portion might increase the protein content. High nitrogen levels in the soil, due to cattle and 218
chicken manure, could also result in plants with higher protein content (Oboh, 2005). 219
Traditionally, in some communities it is given to mothers after giving birth and during 220
breastfeeding (Chewya & Mnzava, 1997). 221
222
The proximate composition and energy content can also be observed in Table 2. It was found 223
that there is an increase in moisture content in the cooked leaves. Similar results were found by 224
Onyeike et al. (2003). The percentage crude fat, crude protein as well as ash decreased in the 225
cooked leaves as predicted by Onyeike et al. (2003) and Oboh (2005). Misbredie and pumpkin 226
leaves showed an increase in protein and ash content respectively.. 227
228
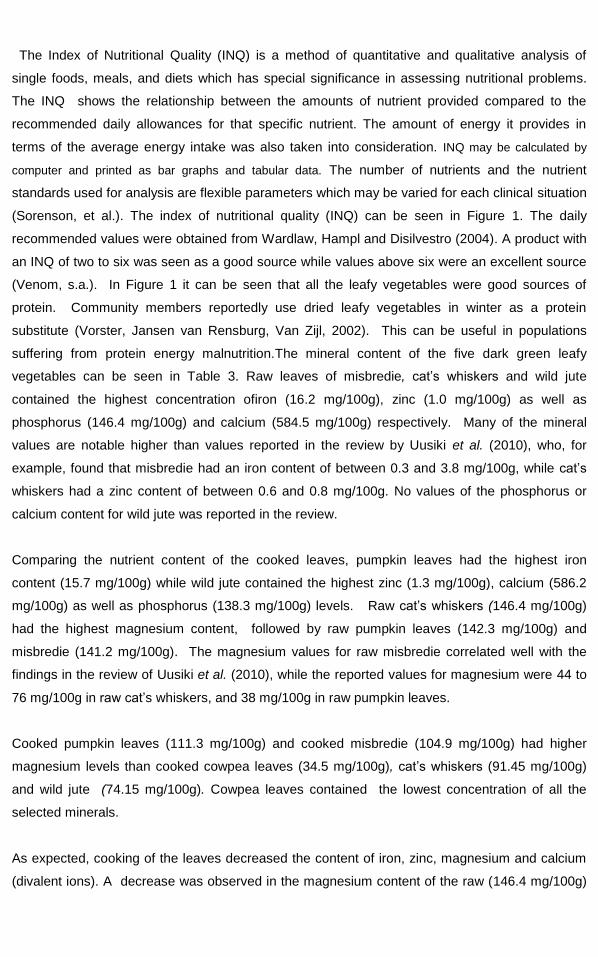
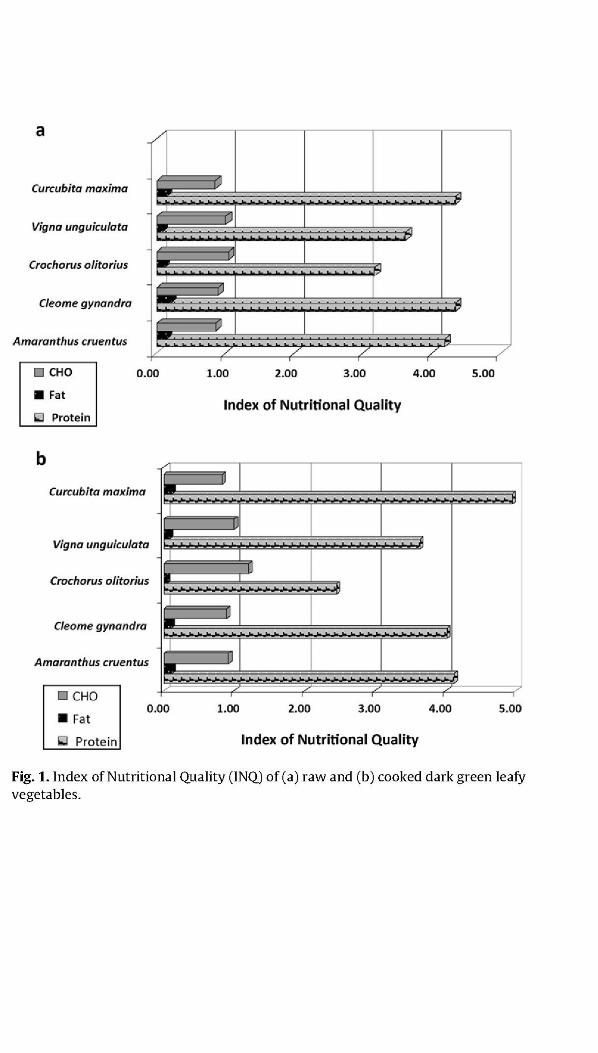
The Index of Nutritional Quality (INQ) is a method of quantitative and qualitative analysis of 229
single foods, meals, and diets which has special significance in assessing nutritional problems. 230
The INQ shows the relationship between the amounts of nutrient provided compared to the 231
recommended daily allowances for that specific nutrient. The amount of energy it provides in 232
terms of the average energy intake was also taken into consideration. INQ may be calculated by 233
computer and printed as bar graphs and tabular data. The number of nutrients and the nutrient 234
standards used for analysis are flexible parameters which may be varied for each clinical situation 235
(Sorenson, et al.). The index of nutritional quality (INQ) can be seen in Figure 1. The daily 236
recommended values were obtained from Wardlaw, Hampl and Disilvestro (2004). A product with 237
an INQ of two to six was seen as a good source while values above six were an excellent source 238
(Venom, s.a.). In Figure 1 it can be seen that all the leafy vegetables were good sources of 239
protein. Community members reportedly use dried leafy vegetables in winter as a protein 240
substitute (Vorster, Jansen van Rensburg, Van Zijl, 2002). This can be useful in populations 241
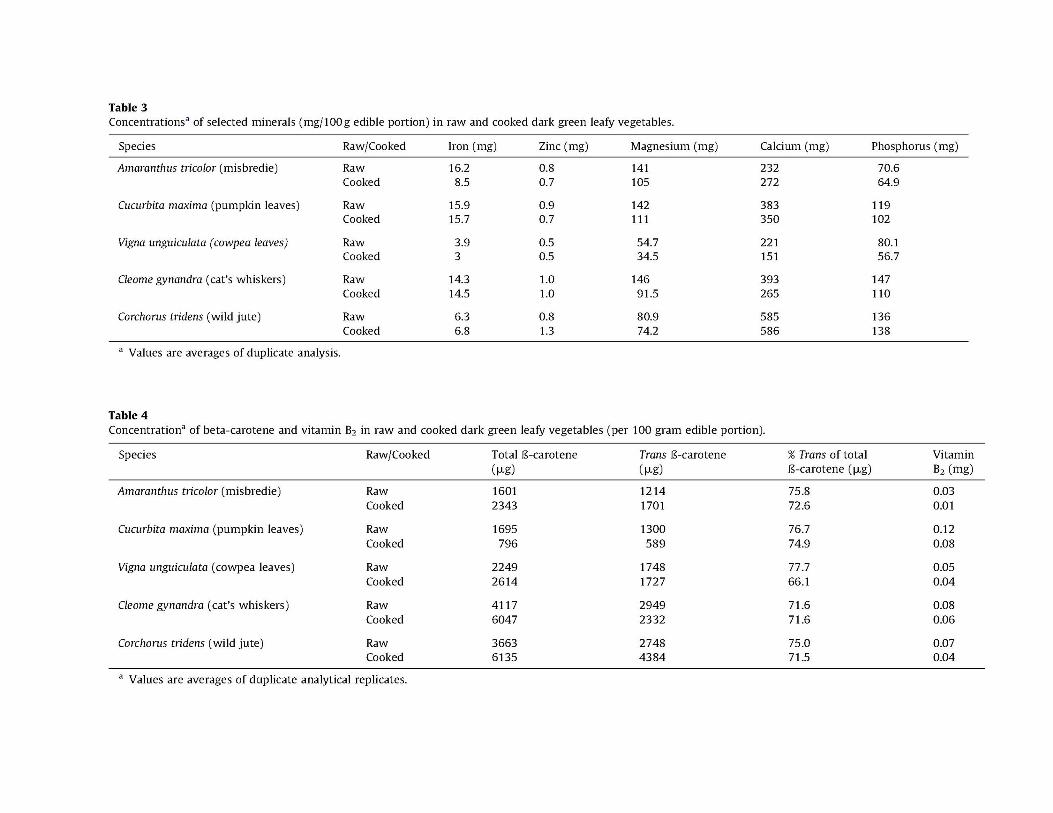
suffering from protein energy malnutrition.The mineral content of the five dark green leafy 242
vegetables can be seen in Table 3. Raw leaves of misbredie, cat’s whiskers and wild jute 243
contained the highest concentration ofiron (16.2 mg/100g), zinc (1.0 mg/100g) as well as 244
phosphorus (146.4 mg/100g) and calcium (584.5 mg/100g) respectively. Many of the mineral 245
values are notable higher than values reported in the review by Uusiki et al. (2010), who, for 246
example, found that misbredie had an iron content of between 0.3 and 3.8 mg/100g, while cat’s 247
whiskers had a zinc content of between 0.6 and 0.8 mg/100g. No values of the phosphorus or 248
calcium content for wild jute was reported in the review. 249
250
Comparing the nutrient content of the cooked leaves, pumpkin leaves had the highest iron 251
content (15.7 mg/100g) while wild jute contained the highest zinc (1.3 mg/100g), calcium (586.2 252
mg/100g) as well as phosphorus (138.3 mg/100g) levels. Raw cat’s whiskers (146.4 mg/100g) 253
had the highest magnesium content, followed by raw pumpkin leaves (142.3 mg/100g) and 254
misbredie (141.2 mg/100g). The magnesium values for raw misbredie correlated well with the 255
findings in the review of Uusiki et al. (2010), while the reported values for magnesium were 44 to 256
76 mg/100g in raw cat’s whiskers, and 38 mg/100g in raw pumpkin leaves. 257
258
Cooked pumpkin leaves (111.3 mg/100g) and cooked misbredie (104.9 mg/100g) had higher 259
magnesium levels than cooked cowpea leaves (34.5 mg/100g), cat’s whiskers (91.45 mg/100g) 260
and wild jute (74.15 mg/100g). Cowpea leaves contained the lowest concentration of all the 261
selected minerals. 262
263
As expected, cooking of the leaves decreased the content of iron, zinc, magnesium and calcium 264
(divalent ions). A decrease was observed in the magnesium content of the raw (146.4 mg/100g) 265
and cooked (91.45 mg/100g) cat’s whiskers. Due to the fact that the petioles and the leaves of 266
cat’s whiskers were cooked, more cooking water and cooking time were needed to cook the 267
leaves till tender. More magnesium could therefore leach out in the cooking water during the 268
cooking process than in the other samples. (Vorster, Jansen van Rensburg, Van Zijl, 2002). 269
270
271
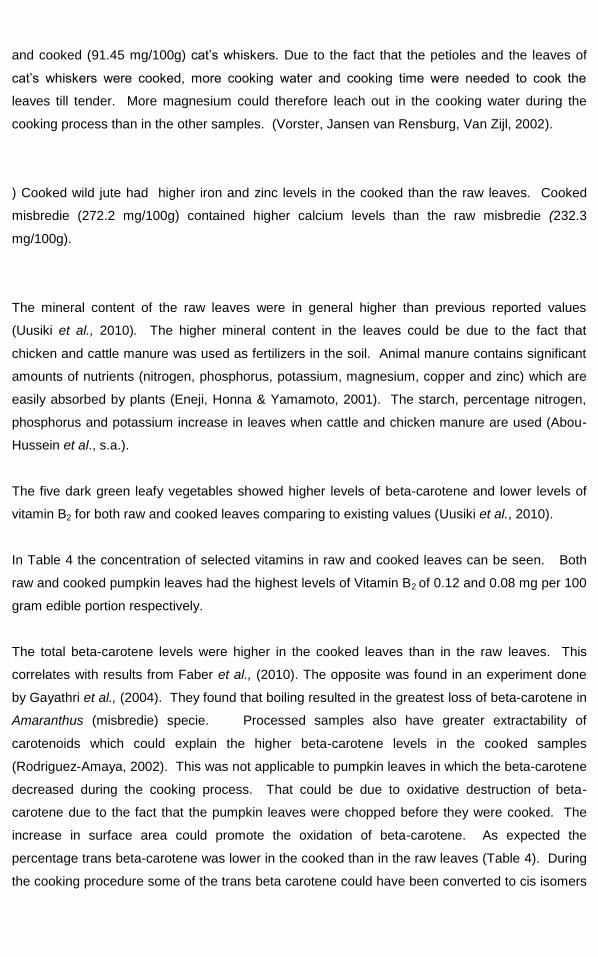
) Cooked wild jute had higher iron and zinc levels in the cooked than the raw leaves. Cooked 272
misbredie (272.2 mg/100g) contained higher calcium levels than the raw misbredie (232.3 273
mg/100g). 274
275
276
The mineral content of the raw leaves were in general higher than previous reported values 277
(Uusiki et al., 2010). The higher mineral content in the leaves could be due to the fact that 278
chicken and cattle manure was used as fertilizers in the soil. Animal manure contains significant 279
amounts of nutrients (nitrogen, phosphorus, potassium, magnesium, copper and zinc) which are 280
easily absorbed by plants (Eneji, Honna & Yamamoto, 2001). The starch, percentage nitrogen, 281
phosphorus and potassium increase in leaves when cattle and chicken manure are used (Abou-282
Hussein et al., s.a.). 283
284
The five dark green leafy vegetables showed higher levels of beta-carotene and lower levels of 285
vitamin B2 for both raw and cooked leaves comparing to existing values (Uusiki et al., 2010). 286
287
In Table 4 the concentration of selected vitamins in raw and cooked leaves can be seen. Both 288
raw and cooked pumpkin leaves had the highest levels of Vitamin B2 of 0.12 and 0.08 mg per 100 289
gram edible portion respectively. 290
291
The total beta-carotene levels were higher in the cooked leaves than in the raw leaves. This 292
correlates with results from Faber et al., (2010). The opposite was found in an experiment done 293
by Gayathri et al., (2004). They found that boiling resulted in the greatest loss of beta-carotene in 294
Amaranthus (misbredie) specie. Processed samples also have greater extractability of 295
carotenoids which could explain the higher beta-carotene levels in the cooked samples 296
(Rodriguez-Amaya, 2002). This was not applicable to pumpkin leaves in which the beta-carotene 297
decreased during the cooking process. That could be due to oxidative destruction of beta-298
carotene due to the fact that the pumpkin leaves were chopped before they were cooked. The 299
increase in surface area could promote the oxidation of beta-carotene. As expected the 300
percentage trans beta-carotene was lower in the cooked than in the raw leaves (Table 4). During 301
the cooking procedure some of the trans beta carotene could have been converted to cis isomers 302
or other oxidative products (Lee et al.,1989; Nyambaka & Ryley, 1996; Rock et al., 1998). 303
Although only trans beta carotene is potentially converted to retinol in the enterocyte (Faulks & 304
Southon, 2004) the cooked leaves’ beta-carotene are three times more bioavailable than the raw 305
leaves (Rock et al., 1998). 306
307
Riboflavin (vitamin B2) are one of the most stable vitamins but are light sensitive (Coultate, 2002; 308
269). There was a decrease in vitamin B2 levels in the cooked compared to the raw values (Table 309
4). 310
311
312
4. CONCLUSION 313
Plant material was sampled at only one location and a limited amount of material was sampled. 314
This limited the possible application of these data to a broader population of these plants. Food 315
samples are typically heterogeneous and, as a result, a bigger sample size is usually needed to 316
obtain a representative sample (Rodriguez-Amaya, 1999). More than one random sample must 317
be collected during the growing season of the food in question for analysis. Another limitation is a 318
lack of analytical uncertainty. This is particularly a limitation when it comes to evaluating and 319
comparing the nutrient content of indigenous foods. Attention must be given to these points in 320
future studies of this nature. 321
Although limitations exist, the nutrient analyses of the traditional South African dark green leafy 322
vegetables revealed that it is a good source of protein, minerals (iron, calcium, phosphorus and 323
magnesium) and β-carotene. Cooking had an effect on the nutrient content. The moisture 324
content increased in the cooking process while the proximate as well as the mineral 325
concentrations decreased. It was found that the β-carotene levels were higher in the cooked than 326
in the raw leaves. 327
Pumpkin leaves, cat’s whiskersand misbredie had a higher index of nutritional quality based on 328
protein than wild jute and cowpea leaves. All the leafy vegetables were nutrient dense for 329
calcium, phosphorus and magnesium. It was also found that the leafy vegetables were nutrient 330
dense for total β-carotene as well as trans β-carotene. The consumption of these leafy 331
vegetables should therefore be encouraged. Due to the high nutrient content of these five dark 332
green leafy vegetables, it could be promoted as a crop in SA and other developing countries to 333
assist in promoting biodiversity and combating malnutrition. 334
. 335

336
5. ACKNOWLEDGEMENT 337
Ms Elizabeth Steenkamp for her contribution towards the research as part of her honors 338
research project in Nutrition at the University of Pretoria 339
Dr Duodu at the University of Pretoria: Department Food Science – for technical advice and 340
support. 341
ARC – Roodeplaat for financial support for analysis and Mr Willem Jansen van Rensburg and 342
Mrs Ineke Vorster for supplying assistance throughout the project. 343
Ms M.F. Smith, head of the biometry unit – ARC for the statistical analysis of the data. 344
345
6. REFERENCES 346
Abou-Hussein, S.D., Abou-Hadid, A.G., El-Shorbagy, T. s.a. Effect of cattle and chicken manure 347
with or without mineral fertilizers on vegetative growth, chemical composition and yield of potato 348
crops. 349
350
AOAC, 2000. Official methods of analysis. Association of Official Analytical Chemists, 351
Washington, DC (2000).Method 942.05, Method 931.15. Method 967.21 352
353
Bassey, M.E., Etuk, E.U.I., Ibe, M.M., Ndon, B.A. 2001. Diplazium sammatii: Anthyraceae 354
(‘Nyama Idim’): Age-related nutritional and antinutritional analysis, Plant Foods for Human 355
Nutrition 56: 7-12 356
357
Coultate, T.P. 2002. Food, the chemistry of its components. 4th Edition, The Royal Society of 358
Chemisty, South Bank University, London, UK 359
360
Eneji, A.E., Honna, T., Yamamoto, S. 2001. Manuring effect of rice grain yield and extractable 361
trace elements in soils, Journal of Plant Nutrition, 24 (7); 967-977 362
363
Faber, M. Oelofse, A. Van Jaarsveld, P.J. Wenhold, F.A.M., Jansen Van Rensburg, W.S. 2010. 364
African leafy vegetables consumed by households in the Limpopo and KwaZulu-Natal 365
provinces in South Africa, South African Journal of Clinical Nutrition, 23 (1); 30-38 366
367
Faulks, R.M., Southon, S. 2004. Challenges to understanding and measuring carotenoid 368
bioavailability, Biochimica et Biophysica Acta, In Press 369
370
Gayathri, G.N., Platel, K., Prakash, J., Srinivasan, K. 2004. Influence of antioxidants spices on 371
the retention of B-carotene in vegetables during domestic cooking processes, Food Chemistry, 372
84; 35-43 373
374
GenStat® for Windows® (7th Edition) – Introduction (Editor R.W. Payne), Published 2003 by VSN 375
International, ISBN 1-904375-08-1 376
377
Greenfield, H & Southgate, D.A.T. 2003. FOOD composition Data, 2de Edition, Elsevier Science 378
Publishers, Rome, pp 75-77 379
380
International Plant Genetic Resources Institute (IPGRI), 2001 - 2005. Conserving and increasing 381
the Use of Neglected and Underutilized Crop Species. Retrieved October 15, 2005 from : 382
http://www.ipgri.cgiar.org/institute/siteinfo.html 383
384
Jansen Van Rensburg, W.S., Venter, S.L., Netshiluvhl, T.R., Van Den Heever, E., Vorster, H.J., 385
De Ronde, J.A. 2004. Role of indigenous leafy vegetables in combating hunger and malnutrition, 386
South African Journal of Botany, 70(1); 52-59 387
388
Kruger, M., Sayed, N., Langenhoven, M & Holing, F. 1998. Composition of South African Foods: 389
Vegetables and Fruit. Medical Research Council’s tables (MRC), 1998 390
391
Labadarios, D.,Maunder, E., Steyn, N., Macintyre, U., Swart, R., Gericke, G., Nesamvuni, E., 392
Huskisson,J., Vorster, H.H., Dannhauser, A. 1999. Forum Nutr, Basel, Karger, Vol 56; 106 – 109. 393
394
Lee, C.Y., Simpson, K.L., Gerber, L., 1989. Vegetables as a Major Vitamin A Source in Our Diet, 395
New York’s Food and Life Sciences Bulletin,,Doc. 126, 1 – 10. Food Science at University of 396
Rhode Island. 397
398
Nyambaka, H., Ryley, J. 1996. An isocratic reversed-phase HPLC separation of the streoisomers 399
of the provitamin A carotenoids (α- and ß-carotene) in dark green vegetables, Food Chemistry, 400
55(1)- 63-72 401
402
Oboh, G. 2005. Effect of Some Post-Harvest Treatments on the Nutritional Properties, Pakistan 403
Journal of Nutrition 4(4); 226-230. 404
405
Onyeike, E.N., Ihugba, A.C., George, C. 2003. Influence of heat processing on the nutrient 406
composition of vegetables consumed in Nigeria, Plant Foods for Human Nutrition 58; 1-11 407
408
RODRIGUEZ-AMAYA DB (1999) A Guide to Carotenoid Analysis in Foods. International Life 409
Sciences Institute, Washington DC. 64 pp 410
411
Rodriguez-Amaya, D.B. 2002. Effects of processing and storage on food carotenoids. Sight and 412
Life, Newsletter 3 413
414
Rock, C.L., Lovalvo, J.L., Emenhiser, C., Ruffin, M.T., Flatt, S.W. & Schwartz, S.J. 1998. 415
Bioavailability of ß-Carotene Is Lower in Raw than in Processed Carrots and Spinach in Women, 416
Journal of Nutrition, 128(8); 913-916 417
Sims, A. & Shoemaker, D. 1993. Simultaneous Liquid Chromatographic Determination of 418
Thiamine and Riboflavin in selected Foods. Journal of AOAC International. 76,(5). 1156 419
Sorenson, A.W., Wyse, B.W., Wittwer, A.J. & Hansen, R.G. 1976. An Index of Nutritional Quality 420
for a balanced diet. New help for an old problem. Journal of the American Dietetic Association 421
68(3); 236-242 422
Stadlmayr, B., Charrondiere, U.R., Addy, P., Samb, B., Enujiugha, V.N., Bayili, R.G., Fagbohoun, 423
E.G., Smith, I.F., Thiam, I & Burlingham, B. 2010. Composition of Selected Foods from West 424
Africa. Food ad Agriculture Organization of the United Nations. Rome. 425
426
Uusiku, N.P., Oelofse, A, Duodu K.G., Bester M.J. & Faber, M. 2010. Nutritional value of leafy 427
vegetables of sub-Saharan Africa and their potential contribution to human health: A review. 428
Journal of Food Composition and Analysis, 23; 499 – 509. 429
430
UWC -University of the Western Cape, 2003. Fair Share, School of Government. How South 431
African economy works. Retrieved January 20, 2010 from the University of the Western Cape 432
Home Page: http://www.uwc.ac.za/fairshare 433
434
Van Jaarsveld, P.J., Faber, M., Tanumihardjo, S.A.., Nestel, P., Lombard, C.J., Benade, A.J.S., 435
2005. B-Carotene-rich orange-fleshed sweet potato improves the vitamin A status of primary 436
school children assessed with the modified-relative-dose-response test, American Society for 437
Clinical Nutrition, 81; 1080 - 1087 438
439
Venom, s.a., Nutrient density, Retrieved October 15, 2005 440
from:http://www.abcbodybuilding.com/magazine03/nutrient density/nutrientdensity.htm 441
442
Vorster, H.J., Jansen Van Rensburg, W.S., Van Zijl, J.J.B., 2002. Germplasm Management of 443
African Leafy Vegetables for the Nutritional and Food Security Needs of Vulnerable Groups in 444
South Africa. IPGRI report number 01/30-06-2002, ARC-Roodeplaat Vegetable and Ornamental 445
Plant Institute. 446
447
Wardlaw. G.M., Hampl, J.S., Disilvestro, R.A. 2004. Perspectives in Nutrition, 6th Edition, 448
McGraw Hill, New York 449
Wimalasiri, P. & Wills, R.B.H. 1985 Simultaneous analysis of thiamin and riboflavin in foods by 450
high-performance liquid chromatography. J of Chrom. 318. 412-416. 451

Zasoski, R.J., Burae, R.G., 1977. A Rapid Nitric-Perchloric Acid Degestion Method For Multi-452
Elelment Tissue Analysis. Communications in Soil Science and Plant Analysis, 8(5); 425-436 453
454