Embed Size (px)
Citation preview

1
The International Forum to Advance
Capability Gap 9 “Deep Dive” Analysis
September 2019
First Responder Innovation
International Forum to AdvanceFIRST RESPONDER INNOVATION

2
Sponsored By:
Effort sponsored in whole or in part by the Department of Homeland Security (DHS) Science and Technology Directorate (S&T) and the Air Force Research Laboratory (AFRL), under Memorandum of Understanding/ Partnership Intermediary Agreement No. FA8650-09-3-9400. The U.S. government is authorized to reproduce and distribute reprints for governmental purposes notwithstanding any copyright notation thereon.
Analysis Conducted By:
The following study was completed by FirstLink. It represents the best efforts of the FirstLink team to gather, assimilate, and assess certain information pertaining to this report. It is recognized that this study analyzes certain economic conditions. As these conditions are in constant flux, neither FirstLink nor its members (Pittsburgh Gateways Corp., AMTV, LLC, or its affiliates) can be responsible for these conditions. Any decisions, actions, or investment made on the subject covered are solely those of the client.
Endorsed By:
This report accords with the International Forum to Advance First Responder Innovation’s (IFAFRI) aim to inform and guide industry and provide unbiased information on first responder technologies. However, the views and conclusions contained herein are those of the authors and should not be interpreted as necessarily representing the official policies either expressed or implied by IFAFRI. While this material has been through an IFAFRI quality assurance process, IFAFRI does not accept responsibility for the content contained herein.

3
Table of Contents Introduction .............................................................................................................................. 4
Background ........................................................................................................................... 4 IFAFRI Membership ............................................................................................................ 5 IFAFRI Common Global Capability Gaps ............................................................................. 6 Capability Gap 9 ................................................................................................................... 8
Methodology ............................................................................................................................ 10 Research Methods ............................................................................................................... 10 Market Quantification ........................................................................................................ 10 Market Phase and Factors .................................................................................................. 10 Competitive Landscape ....................................................................................................... 10 Presentation ......................................................................................................................... 11
Synopsis Overview .................................................................................................................. 12 Market Definitions and Segmentation ................................................................................ 12 Market Quantification ........................................................................................................ 12 Competitive Landscape ....................................................................................................... 12 Summary ............................................................................................................................. 12
Market Overview .................................................................................................................... 13 Market Figures........................................................................................................................ 15
Market Factors .................................................................................................................... 17 Competitive Landscape........................................................................................................... 18 First Responder-Specific Technology Solutions..................................................................... 20 Appendix A.............................................................................................................................. 30 Appendix B .............................................................................................................................. 32 Glossary ................................................................................................................................... 33 References ............................................................................................................................... 34

4
Introduction
Background The International Forum to Advance First Responder Innovation (IFAFRI) is an organization of government leaders from across the globe, focused on enhancing and expanding the development of affordable and innovative technology for first responders worldwide.
IFAFRI does this by:
1. Working with the global first responder community to define a list of common, high priority capability gaps;
2. Providing a platform for international collaboration on innovative research and development (R&D) initiatives and solutions;
3. Characterizing the global first responder markets, to inform and guide industry and academia about market opportunities and to incentivize these actors to develop and produce innovative technology solutions to first responder capability gaps; and
4. Providing information about relevant and available first responder technologies to the first responder community, while not endorsing any specific technology, product, or manufacturer.
In order to respond more safely, efficiently, and effectively to everyday and catastrophic incidents, first responders around the world need technologically advanced tools and equipment that are affordable and innovative. However, there is no centralized mechanism for first responders to identify and discuss shared needs and requirements. In addition, overall purchasing of tools and equipment is fragmented into smaller quantities, which provides little incentive for industry to commercialize innovative technologies. Therefore, the lack of consolidated requirements for first responders, along with fragmented purchasing, results in an inadequate amount of affordable, new technology being available for first responder use.
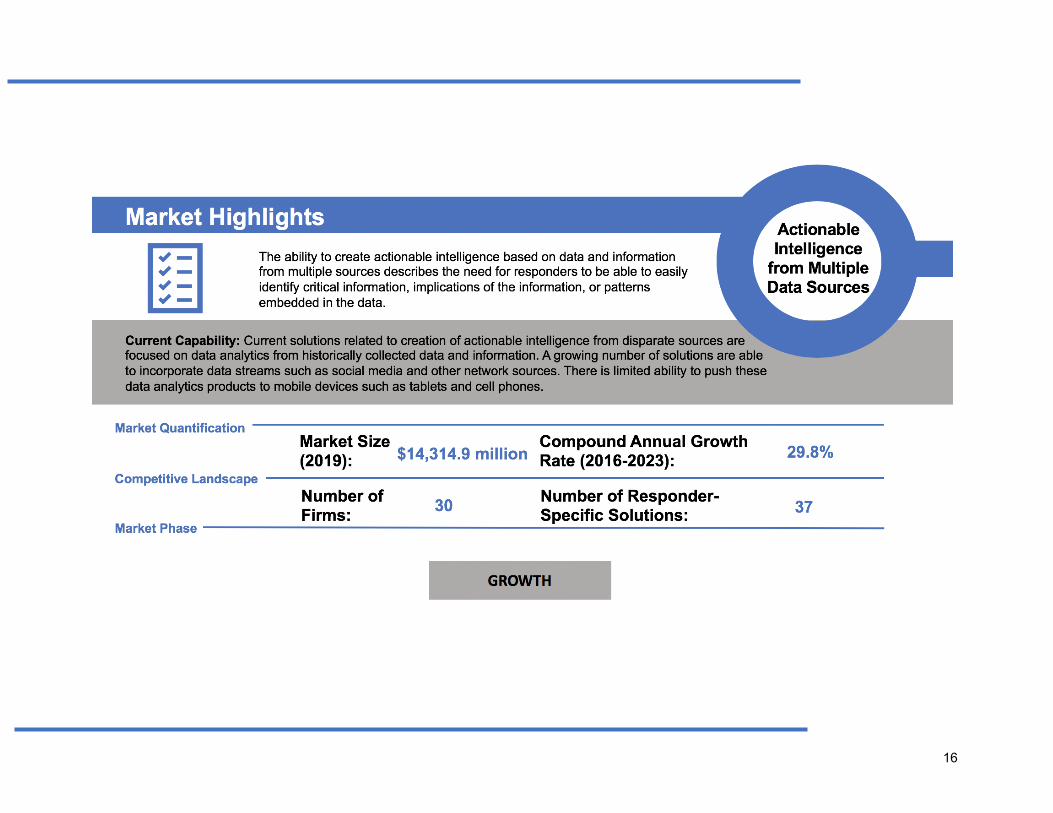
The purpose of this document is to characterize the markets and identify technology solutions relevant to IFAFRI’s Capability Gap 9: The ability to create actionable intelligence based on data and information from multiple sources. IFAFRI is publishing this information to identify potential areas of R&D where there may be opportunity for industry and academia to develop innovative solutions. Further, it is intended to provide industry and academia with key data points and analysis that will inform their decision on entering or expanding into related markets.

5
IFAFRI Membership
IFAFRI is currently composed of members from 13 different countries and the European Commission, including Australia, Canada, Finland, Germany, Israel, Japan, the Netherlands, New Zealand, Singapore, Spain, Sweden, the United Kingdom, and the United States. The figure below illustrates the global composition of IFAFRI.1
1 Note, IFAFRI membership for France and Mexico is pending.

6
IFAFRI Common Global Capability Gaps
This document is focused on the fifth of ten Common Global Capability Gaps identified by IFAFRI. The list of current gaps includes:
Capability Gap 1 The ability to know the location of responders and their proximity to risks and hazards in real time
Capability Gap 2 The ability to detect, monitor, and analyze passive and active threats and hazards at incident scenes in real time
Capability Gap 3 The ability to rapidly identify hazardous agents and contaminants
Capability Gap 4 The ability to incorporate information from multiple and nontraditional sources into incident command operations
Capability Gap 5 The ability to maintain interoperable communications with responders in any environmental conditions
Capability Gap 6 The ability to obtain critical information remotely about the extent, perimeter, or interior of the incident
Capability Gap 7 The ability to conduct on-scene operations remotely without endangering responders
Capability Gap 8 The ability to monitor the physiological signs of emergency responders
Capability Gap 9 The ability to create actionable intelligence based on data and information from multiple sources
Capability Gap 10 The ability to provide appropriate and advanced personal protective equipment
The first four capability gaps on this list were adopted by IFAFRI in 2016. To arrive at this initial set of capability gaps, the IFAFRI membership conducted analyses of first responder capability gaps in their countries. Some of the IFAFRI participants used the methodology presented in the U.S. Department of Homeland Security (DHS) Science and Technology Directorate’s (S&T) Project Responder 4 (PR4) report, as a guide in their analyses. Project Responder 4 is the fourth in a series of studies that focuses on identifying capability needs, shortfalls, and priorities for catastrophic incident response. The methodology is based upon discussions with federal, state, and local first responders, as well as technical subject matter experts.
After submission of first responder capability gaps from IFAFRI participants, a comparative analysis of all submitted gaps was conducted. The analysis found a significant level of overlap among the various countries’ gaps, which resulted in the proposal and adoption of the first four Common Global Capability Gaps in 2016. Between 2016 and 2018, IFAFRI’s Capability Gaps Committee further refined and formalized its process for adding capability gaps to the list. In 2018, individual countries solicited national capability gaps from first responders in their countries and submitted these to the Capability Gaps

7
Committee. In total, 78 national capability gaps were received from IFAFRI countries. These gaps were then synthesized to eliminate redundancy and provide overarching gaps that aggregate multiple similar gaps when needed, which resulted in a set of 45 gaps. Three of the gaps corresponded to the initial four Common Global Capability Gaps, leaving 42 gaps for prioritization. The prioritization process resulted in the addition of the Capability Gaps 5-10 to the Common Global Capability Gaps list.
To date, similar “deep dive” analyses have been conducted for each of IFAFRI’s Common Global Capability Gaps. Each of these documents has been published to the IFAFRI Web site, and is available for download. It is important to note that continued market research will be required to ensure awareness of current efforts and account for new actors in these capability gap areas.

8
Capability Gap 9 The ability to create actionable intelligence based on data and information
from multiple sources There is a significant amount of data generated during an incident, however, many sources produce raw data in a format that is not easy to understand or use. For example, hazard sensors report measurements, but without prior knowledge or additional contextual information a value or response may mean little to the user. Responders may not be able to easily identify critical information, implications of the information, or patterns embedded in the data. Raw data are often useless data; only after they are transformed into actionable information or intelligence do they have utility. Adding context, validation, and follow-on information provides value. A measurement from a chemical sensor may be insufficient to allow responders to act. However, when combined with information on the chemical type, prevailing wind direction, and recommended protective actions, responders can act purposefully to increase their level of safety. Actionable intelligence allows responders to understand the information in the context of the incident and plan their actions accordingly.2 Data analytics is used in many fields to provide context, draw conclusions, and identify patterns, correlations, and insights from raw data. Data analytics can be applied to routine operations (e.g., identifying potential increases in emergency medical service calls based on weather patterns) or to support response to a specific incident (e.g., analysis of data from multiple records sources to identify likely suspects).While there is a high level of public and private funding for advancing technology for interoperable communications, emergency responders in IFAFRI nations continue to face challenges. Many factors contribute to this lack of progress, such as country size and degree of centralized response functions, but the main obstacle is a lack of a comprehensive, affordable solution. Responders would like solutions that provide information that can be used to make more effective decisions across many responder tasks. Information should be viewable on existing platforms, including smartphones, mobile data terminals, and other computer systems. Analysis should be completed in real time and updated when additional data is available. When appropriate, information should be distilled and presented in charts, graphs, maps, etc. Potential solutions may also include templates, checklists, or other aides that allow responders and command to make more informed decisions. This gap is related to the fourth gap, “the ability to incorporate information from multiple and nontraditional sources into incident command operations,” which focuses on the integration of data. Data may need to be integrated from multiple sources to create actionable information, but this is not always the case. Solutions will focus on the analysis of individual and/or integrated data sources to create information that can be used for better planning, decision-making, and action. While there are a number of solutions in use by responders, these solutions still have shortcomings when considering the state of technology today for data analytics. This study uses the list of existing first responder gear in the SOO document for Gap 9. This list encompasses the current methods of communication available for first responders. Each method was considered a “technology type” with a corresponding, relevant market. There are six technology types for this capability gap:

9
• Joint task forces or joint intelligence cells; • Agency intelligence analysts; • Agency data analysts; • Plume models; • Commercially-available data integration and decision-support tools (limited availability
due to cost); and • State and jurisdiction-level data integration and visualization platforms.

10
Methodology
This section provides a brief overview of the processes used to obtain and assess the findings presented in this report.
Research Methods The data presented in this report was gathered from publicly-available information sources, including market reports and company web sites. The study team conducted a global scan of existing and in-development technology solutions with the aim of identifying and assessing the primary market for technologies related to this gap. However, the data presented in this report should not be considered exhaustive. This document does not contain any proprietary data, nor does it endorse or advocate for any of the technology solutions described herein. Further, the study team did not validate any of the manufacturers’ claims found in their product descriptions.
Market Quantification All relevant markets are quantified utilizing overall global revenue figures, unless otherwise noted, for the forecast period 2019-2023. The Compound Annual Growth Rate (CAGR) within each segment is used to measure growth within the forecast period and to extrapolate data when figures were not publicly available. Data for the primary market is used in the aggregated findings presented in the body of this report.
Market Phase and Factors Market phase is determined using factors in the Industry Life Cycle Model. The adapted market phase definitions are presented in the following table.3 Market factors are assessed by examining barriers to entry and market opportunities, as determined through secondary research.
Nascent New market need with dominant solutions not yet determined; growth begins increasing toward end of cycle
Growth Dominant solutions begin to emerge; high growth rates
Mature Often fewer firms than growth phase, as dominant solutions continue to capture the majority of market share and market consolidation occurs; lower growth rates that are typically on par with the general economy
Decline Further market consolidation; rapidly declining growth rates
Competitive Landscape This study also examines the competitive landscape within each market, accounting for the total number of firms, along with the number of responder-specific solutions. Total number of firms was estimated using the number of key players given within publicly available market reports for each segment. Responder-specific solutions were identified using a more tailored search. This search included examining the product offerings of key players listed in publicly available market reports to determine their relevance to the capability gap and conducting targeted keyword searches in order to identify solutions from additional companies.

11
Presentation This report includes a “Market Overview” that summarizes the overall market and provides the market quantification data for each segment. The report also presents the key findings for each market segment in the “Market Highlights” section, with a one-page summary for each segment. In addition, the “Competitive Landscape” section further categorizes the total number of firms participating in the market by segment and highlights responder-specific solutions currently available or in-development.

12
Synopsis Overview
IFAFRI has been conducting an ongoing global capability gaps market analysis in order to meet its objectives characterizing global first responder markets to inform and guide industry and academia. The key objective of this study is to characterize the markets relevant to Capability Gap 9. This synopsis highlights key data and analysis identified as part of this study.
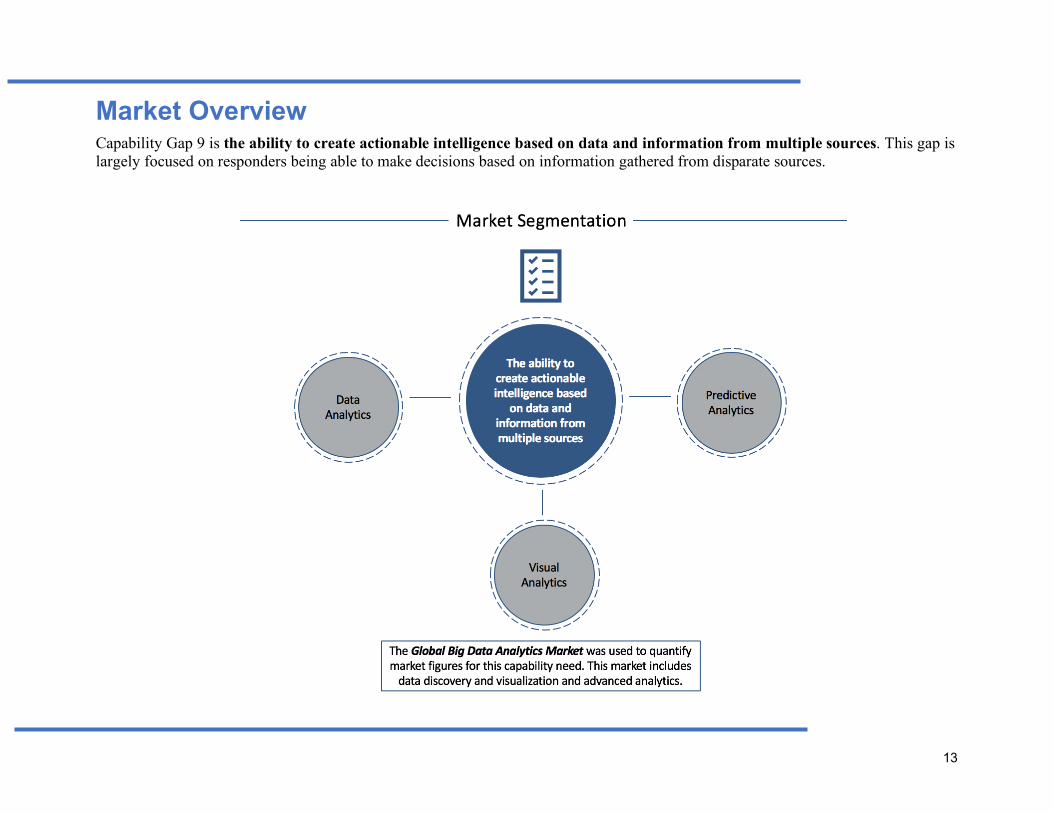
Market Definitions and Segmentation This study uses the list of existing first responder gear in the Statement of Objectives 9 (SOO 9) document to further define and segment the relevant markets for Capability Gap 9. For the six types of gear given for this capability gap, it was determined that one market best represents these technology types, and therefore only one primary market was selected. This primary market is used for market definition, segmentation, quantification and further assessment.
Market Quantification The primary market is quantified utilizing overall revenue figures derived from global markets. Growth is measured using an estimated CAGR. The Global Big Data Analytics Market was estimated to be worth more than $8.5 billion USD in 2017 and is projected to grow at a Compound Annual Growth Rate (CAGR) of 29.8% through 2023. This equates to a market value of more than $40 billion USD in 2023.
Competitive Landscape Based upon third-party market research reports, there are 30 key players and innovators identified within the global, primary market for Capability Gap 9. These key global players and innovators appear to offer solutions that address, in part, the ability to create actionable intelligence based on data and information from multiple sources. However, none of the solutions identified within this assessment appear to meet all of first responders’ target objectives for this gap. Summary In summary, the primary market identified to represent this capability gap is relatively large and growing. This growth in and of itself presents a great opportunity for new solutions to enter the market. When examining 53 existing solutions and seven developing solutions in this assessment, none fulfilled all of the objectives for this gap. Therefore, any solutions that address these target objectives and allow continuous data analysis leading to actionable intelligence will likely have the greatest commercial potential.
13
Market Overview Capability Gap 9 is the ability to create actionable intelligence based on data and information from multiple sources. This gap is largely focused on responders being able to make decisions based on information gathered from disparate sources.

14
Capability Gap 9 – The ability to create actionable intelligence based on data and information from multiple sources First responders need solutions that provide information that can be used to make more effective decisions across many responder tasks. When responders work on scenes with limited analyze incoming data, they face significant challenges to do their jobs more safely and effectively. Regardless of the operating environment, responders need viewable data on existing platforms, including smartphones, mobile data terminals, and other computer systems with analysis completed in real time and updated when additional data is available. Having this capability will likely improve responders’ abilities to help during incident response.
A myriad of data analytics solutions currently exist within the market. However, not one of these solutions appears to meet all of responders’ target objectives, which include providing users with contextual information and potential effects or consequences; delivering predictions, forecasts and models; and providing decision-support.
The Global Big Data Analytics Market is used to define, quantify and assess the various types of solutions available. This market was worth more than $8.5 billion USD in 2017 and is projected to grow at a Compound Annual Growth Rate (CAGR) of 29.8% through 2023. This equates to a market value of more than $40 billion USD in 2023.
15
Market Figures
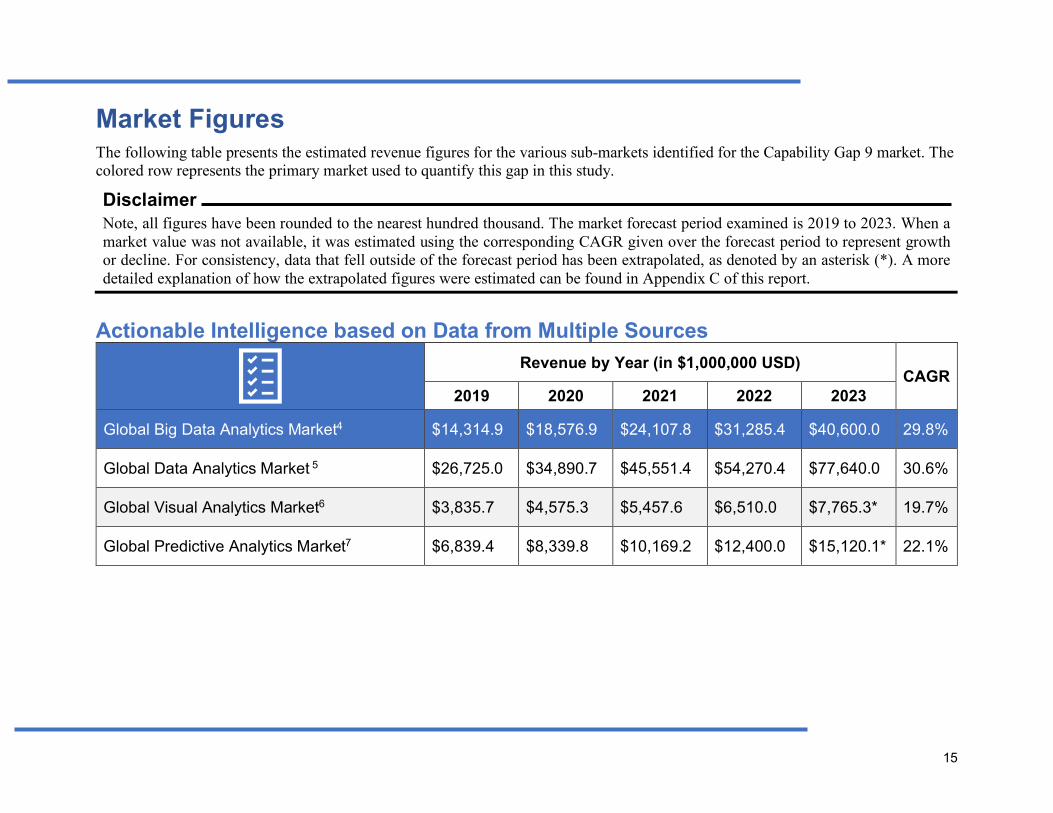
The following table presents the estimated revenue figures for the various sub-markets identified for the Capability Gap 9 market. The colored row represents the primary market used to quantify this gap in this study.
Disclaimer
Note, all figures have been rounded to the nearest hundred thousand. The market forecast period examined is 2019 to 2023. When a market value was not available, it was estimated using the corresponding CAGR given over the forecast period to represent growth or decline. For consistency, data that fell outside of the forecast period has been extrapolated, as denoted by an asterisk (*). A more detailed explanation of how the extrapolated figures were estimated can be found in Appendix C of this report.
Actionable Intelligence based on Data from Multiple Sources Revenue by Year (in $1,000,000 USD)
CAGR 2019 2020 2021 2022 2023
Global Big Data Analytics Market4 $14,314.9 $18,576.9 $24,107.8 $31,285.4 $40,600.0 29.8%
Global Data Analytics Market 5 $26,725.0 $34,890.7 $45,551.4 $54,270.4 $77,640.0 30.6%
Global Visual Analytics Market6 $3,835.7 $4,575.3 $5,457.6 $6,510.0 $7,765.3* 19.7%
Global Predictive Analytics Market7 $6,839.4 $8,339.8 $10,169.2 $12,400.0 $15,120.1* 22.1%
16

17
Market Factors The figure below summarizes the market factors associated with the analysis and transformation of data into actionable intelligence.
Opportunities Barriers
Actionable Intelligence
based on Data from Multiple
SourcesX Challenges, especially regarding dark data — data not
regularly used in business operationsX Data fragmentation across multiple locations was hindering
efforts to get the most from the informationX Verification of data locationX Data privacy concernsX Lack of trainingX Current solution not user-friendlyX Organization lacks proper technologyX Organization lacks analytic strategyX No centralized tool for capturing and analyzing dataX Analytics is not a key focusX Managing data quality and safety X Lack of integration with legacy systems and complex analytical
process
ü Organizations realizing the operational advantages of BDAü Improved DDV empowering organizations to better target consumersü Increased access to cloud-based modelsü Enterprise-grade security and data governance solutions offered by market vendorsü Continued vendor consolidationü Growing need of visual analytics software solutions across organizationsü Growing need to simplify the workload related to security and the increasing
dependence on data generated from various Information Technology (IT) systems, used for financial transactions
ü Increasing need to store and manage data coming from various connectedtransportation devices and logistics record systems, used across transportation andlogistics organizations
ü Adoption of visual analytics for IT is expected to increase significantly in the comingyears because of the increasing need to resolve IT-related issues in real-time and streamline the business process across industries
ü Demand for cloud-based visual analytics solutions is expected to grow due to itscost-effective and time-efficient features
ü Revenue generating potential of predictive analyticsü Rise in connected and integrated technologies has provided a platform to predictive
analytics software vendors for leveraging this development and the unprecedented growth of the internet

18
Competitive Landscape A total of 30 firms were identified as operating in the markets listed above, 10 of which are considered key global market players, including:
• IBM (United States) • Qlik (United States) • SAP (Germany) • SAS (United States) • Tableau (United States) • Alteryx (United States) • TIBCO (United States) • Microsoft (United States) • Oracle (United States) • MicroStrategy (United States)
Within this study there are a total of 53 existing solutions and seven research and development (R&D) initiatives with relevance to Capability Gap 9 identified. This landscape is non-exhaustive, as the number of solutions is vast and ever-changing at a rapid pace. Among the existing and developing solutions identified, 37 solutions (70 percent) appear to have first responder applications and seven solutions appear to be in development for first responder use. These numbers may indicate that industry is aware that a first responder need exists within this technology space. However, when examining how existing solutions meet responders’ needs related to this capability gap, it does not appear that any existing solution meets all of responders’ target objectives. These objectives include:
1. Provide user with contextual information and potential effects or consequences; 2. Provide predictions, forecasts and models; and 3. Provide decision-support.
It appears that the greatest gap exists for systems capable of pushing data analytics information to users in the field. Most of the existing solutions desktop or cloud-based which have limitations for pushing critical information to users when needed. While the greatest number of existing solutions (37) identified in this assessment appear to have first responder applications, 29

19
solutions have commercial applications, and 18 have defense applications. There are also a total of seven R&D initiatives related to Capability Gap 9 identified in this assessment. Among the developing solutions identified, industry is involved in the development of one solution, academia is involved in the development of six solutions, and government is not involved. Seven developing solutions are focused on first responder applications, one is also focused on commercial applications and none are focused on defense applications. Based upon the data presented, more than half of existing and developing solutions appear to be targeting or applicable to first responder applications. Therefore, industry is likely aware that a first responder need exists within this technology space. Looking more closely at these solutions, the ability of any identified existing or in development solutions would not meet all the needs of responders’ target objectives cited previously. More specifically, the ability for incident command to push critical information and actionable intelligence to responders in the field. This presents any opportunity for industry to develop solutions that can fit all of the target objectives, with a special focus on object two. For questions or comments about the information presented in this assessment, please contact IFAFRI at [email protected].

20
First Responder-Specific Technology Solutions The following section presents a selection of the first responder-specific technology solutions that align with responder requirements for this gap. The responder requirements are identified in the IFAFRI-developed Capability Gap 9 Statement of Objectives (SOO) document. None of the solutions identified during this study meet all of the requirements detailed in the SOO document. However, those presented below offer increased levels of integration or newer features than what is generally used by response agencies currently. There are a large number of potential solutions that exist or are in-development and therefore this section should not be considered exhaustive. Further, additional concepts exist in academic literature but these are not included in this study. A complete list of responder-specific technology solutions identified during this study can be found in Appendix A of this report.
The data and information provided in this section is publicly available from manufacturers’ web sites. The study team did not validate product claims made by the manufacturers.
Data Analytics
Charles River Analytics Charles River Analytics (United States) conducts AI, robotics, and human-machine interface R&D and leverages that R&D to create custom solutions for an organization. The company’s goal is to develop technology for human-machine teaming problems that impact critical operations and decision-making. Charles River has provided solutions for Government and commercial clients across a diverse collection of markets—defense, intelligence, medical technology, training, transportation, space, and cyber security.8 Charles River Analytics offers Precision Information Environment for Coordinated Emergency Support (PIECES). PIECES is part of an integrated collaborative work environment that help teams of emergency responders share and manipulate data sources. PIECES integrates critical data from multiple sources and communications channels then presents the data through customizable interfaces defined by needs. Firefighters, police, emergency medical services (EMS) and emergency managers can access the information in real time. PIECES allows first responders to share information vital to collaboration across federal, state, and local agencies and jurisdictions. PIECES provides an
Figure 1: Chalres River PIECES
21
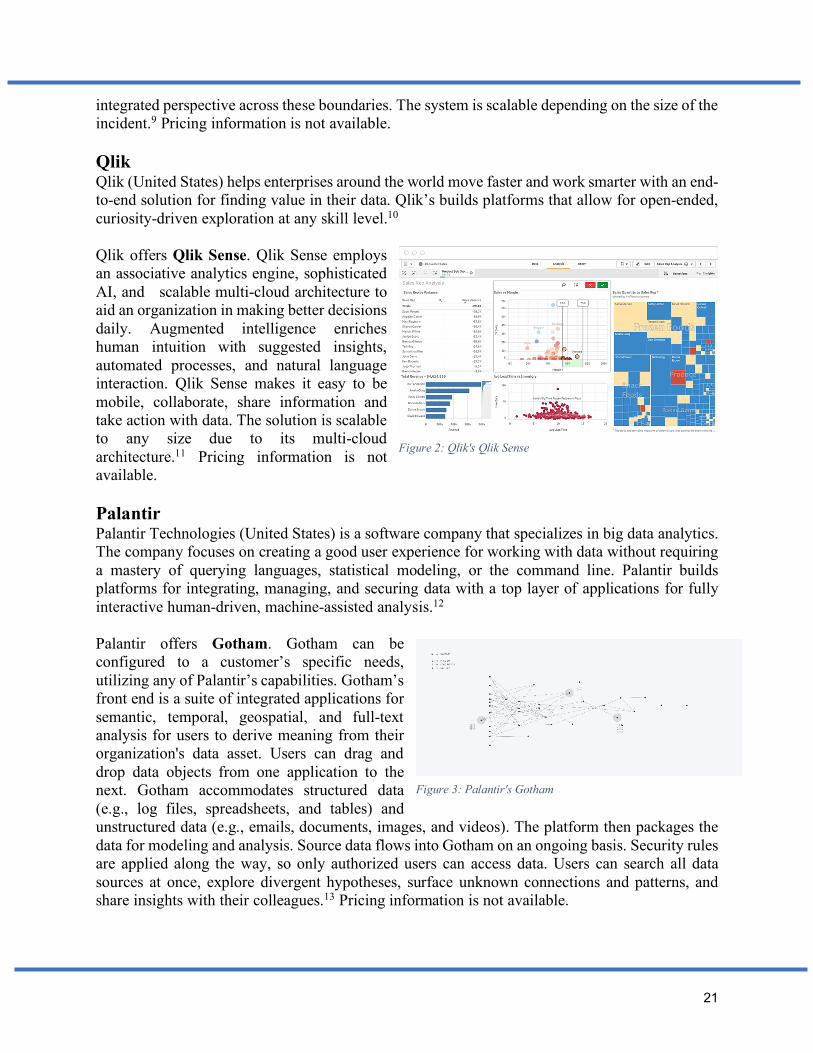
integrated perspective across these boundaries. The system is scalable depending on the size of the incident.9 Pricing information is not available. Qlik Qlik (United States) helps enterprises around the world move faster and work smarter with an end-to-end solution for finding value in their data. Qlik’s builds platforms that allow for open-ended, curiosity-driven exploration at any skill level.10 Qlik offers Qlik Sense. Qlik Sense employs an associative analytics engine, sophisticated AI, and scalable multi-cloud architecture to aid an organization in making better decisions daily. Augmented intelligence enriches human intuition with suggested insights, automated processes, and natural language interaction. Qlik Sense makes it easy to be mobile, collaborate, share information and take action with data. The solution is scalable to any size due to its multi-cloud architecture.11 Pricing information is not available. Palantir Palantir Technologies (United States) is a software company that specializes in big data analytics. The company focuses on creating a good user experience for working with data without requiring a mastery of querying languages, statistical modeling, or the command line. Palantir builds platforms for integrating, managing, and securing data with a top layer of applications for fully interactive human-driven, machine-assisted analysis.12 Palantir offers Gotham. Gotham can be configured to a customer’s specific needs, utilizing any of Palantir’s capabilities. Gotham’s front end is a suite of integrated applications for semantic, temporal, geospatial, and full-text analysis for users to derive meaning from their organization's data asset. Users can drag and drop data objects from one application to the next. Gotham accommodates structured data (e.g., log files, spreadsheets, and tables) and unstructured data (e.g., emails, documents, images, and videos). The platform then packages the data for modeling and analysis. Source data flows into Gotham on an ongoing basis. Security rules are applied along the way, so only authorized users can access data. Users can search all data sources at once, explore divergent hypotheses, surface unknown connections and patterns, and share insights with their colleagues.13 Pricing information is not available.
Figure 2: Qlik's Qlik Sense
Figure 3: Palantir's Gotham

22
New York Police Department New York Police Department (NYPD) is the primary law enforcement and investigation agency within the City of New York. It is the largest and one of the oldest municipal police departments in the United States, with approximately 36,000 officers and 19,000 civilian employees. The NYPD is divided into major bureaus for enforcement, investigations, and administration. It has 77 patrol precincts with patrol officers and detectives covering the entire city.14 NYPD offers Patternizr. Patternizr is a set of machine learning models developed in-house at the NYPD. It is the first crime analysis tool of its kind to be used in law enforcement. Patternizr searches through hundreds of thousands of crime records across all 77 precincts in NYPD’s database to find patterns. The tool defines a "pattern" as a series of crimes likely committed by the same criminal or criminals, based on a set of identifying characteristics.15 Pricing information is not available. Kinetica DB Inc. Kinetica DB, Inc. (United States) develops a distributed, in-memory database management systems using graphics processing units. The company was founded in 2009 as part of an effort to assist the United States Army Intelligence and Security Command (INSCOM) to track national security threats in real time.16 Kinetica offers the Kinetica Platform. The platform was developed to assist security agencies with threat detection by analysis of vast quantities of streaming data from over 200 different sources. The Kinetica Platform can analyze complex, multidimensional streaming and batch data interactively. Users can combine real-time data pipelines and historical data to generate better informed insights. The platform constantly assesses and queries data in real-time and prescribes actions based on results. The Kinetica platform’s architecture delivers availability, push button deployment, cloud elasticity, and auto scaling across public and private cloud infrastructure.17 Pricing information is not available. MapR Technologies MapR Technologies (United State) is software company. MapR software addresses the data complexities of high-scale and mission critical distributed processing from the cloud to the edge, IoT analytics, and event stream processing, combining analytics in real-time with operational applications. Its technology runs on both commodity hardware and public cloud computing services. In August 2019, the company was sold to Hewlett Packard.18
Figure 4: Kinetica Platform

23
MapR Technologies offers MapR Converged Data Platform. The MapR Converged Data Platform is designed to deliver utility-grade data services and commercially-supported, open-source innovations to development teams, IT operations, business analysts, and data scientists. The converged data platform prevents critical information from getting lost in “data silos” and an inefficient use of hardware resources. The MapR Platform delivers real-time insights based on secure, protected, high-fidelity data. The platform is capable of automating real-time operational decisions based on application of deep analytics insights. MapR also provides data management that it is delivered either via disk or flash.19 Pricing information is not available. Haystax Technology Haystax Technology’s (United States) mission is to rapidly deploy advanced security analytics and out-of-the-box risk management software applications that enable decision-makers, analysts and operational security teams to quickly understand and act on virtually any type of threat in real-time. The company was founded in 2012 and delivers applications and analytic products to customers in federal government agencies, commercial enterprises, local and state agencies, and major metropolitan areas.20 Haystax offers the Haystax Analytics Platform. The platform is designed to scale and work in mission critical environments The cloud-based software is able to pull in data from a number of sources, including police and fire dispatches, weather reports, maps, news agency articles, social media activity, sensors, and video camera feeds. Haystax then employs finely tuned algorithms to process data, which is processed in real-time, to deliver critical information in the form of alerts to decision makers, giving them actionable intelligence. The platform includes ready-to-use apps for collaborative visualization, threat alerting, asset cataloging, event monitoring and incident reporting – all viewable on a single screen, on any device.21 Pricing information is not available.
Figure 5: MAPR Converged Data Platform
Figure 6: Haystax Analytics Platform

24
Predictive Analytics
Conservation International Conservation International (CI) (United States) is a nonprofit environmental organization whose goal is to protect nature as a source of food, fresh water and oceans, livelihoods and a stable climate. CI's work focuses on science, policy, partnership with businesses and communities for responsible development, innovation in science, and climate protection.22 Conservation International offers Firecast a fully automated analysis and alert system that delivers near real-time monitoring products tailored to a user's specific needs. These alerts are reports, text-based emails, or fully interactive maps containing the coordinates of active fires or risk of fire within a specified area of interest as defined by the user. The alerts include map images depicting the locations of fires or risk of fires and data for import into Google Earth. The Firecast system assists with:23
• Fire-related disaster prevention • Policing of illegal activities • Enforcement of laws and land use policies • Monitoring of decision effectiveness
Pricing information is not available. Alteryx Alteryx (United States) is a computer software company. The company's products are focused on data science and analytics. The software is designed to make advanced analytics accessible to data analysts at any skill level.24 Alteryx offers the Alertyx Platform. The platform allows organizations to create new data partnerships among IT, analytic teams, and the lines of business. Alteryx combines data cataloging and powerful metadata with human insight to document the types of information an organization’s data contains, where the information comes from, who is using it, and how it is used. The platform accepts data from multiple sources. Modeling can be performed in real-time or in batches both locally and in the cloud. The platform allows an organization to:25
• Discover and collaborate • Prepare, analyze and model data • Share, scale and govern the enterprise • Deploy, manage and monitor decisions
Pricing information is not available.
Figure 7: Conservation International FIRECAST map

25
Altair Altair (United States) is a global technology company that provides software and cloud solutions in the areas of product development, high performance computing (HPC) and data intelligence. Altair provides open-architecture solutions for Computer Aided Engineering, HPC, and Data Intelligence. Altair’s products are focused on modeling and visualization, industrial and concept design, internet of things, high performance computing, and data science.26 Altair offers Knowledge Works. The platform has four components: Knowledge Hub, Monarch, Knowledge Studio, and Panopticon. Knowledge Hub offers team-driven data preparation with a centralized data repository to speed collaboration and drive governance across the enterprise. Monarch offers desktop-based, self-service data preparation to access, prepare and blend data for analysis. Knowledge Studio offers predictive models and machine learning to generate insight from the data. Panopticon offers streaming visualization of real-time data analysis, proactive alerts, and incorporation of multiple data sources to aid in decision-making and monitoring for continuous optimization. The Knowledge Works platform can be used for:27
• Data validation using external sources, like credit history or census data • Managing big data • Data prep, visualization and dashboard creation for scientists and academics • Government field audits • Government financial investigations and examinations • Crime prevention, security and Intelligence Analysis
Pricing information is not available. Dataiku Dataiku (United States) is a computer software company. The company develops collaborative data science software marketed for big data. Dataiku develops tools that lets data scientists and analysts do machine learning on any (dirty) data.28 Dataiku offers Dataiku DSS. Dataiku DSS is a collaborative data science software platform for teams to explore, prototype, build, and deliver their own data products more efficiently. Users can employ notebooks (e.g., R, Python, Scala, Hive, Pig, Spark, etc.) or a customizable drag-and-drop visual interface for use with the predictive dataflow processing, analysis, and modeling. Dataiku DSS allows for interactive exploration of data using 20+ charts. Users can prepare, enrich, blend, and clean data using 80+ built-in functions. The platform employs Machine Learning technologies to deliver instant visual & statistical feedback on model performance. Workflow can be bundled as a single deployable package for real-time predictions allowing users
Figure 8: Altair Knowledge Works platform
Figure 9: Dataiku's Dataiku DSS platform

26
to monitor live data in-production with dashboard and data validation policies (e.g., model metrics, drift, data consistency, etc.) with alerts if something changes.29 Pricing information is not available. PredPol PredPol (United States) grew out of a research project between the Los Angeles Police Department (LAPD) and University of California Los Angeles (UCLA). The LAPD chief wanted to find a way to use COMPSTAT data for forward-looking recommendations as to where and when crimes could occur as being able to anticipate these crime locations and times could allow officers to pre-emptively deploy officers and help prevent these crimes.30 PredPol offers the PredPol predictive policing modeling tool. Working with mathematicians and behavioral scientists from UCLA and Santa Clara University, the team evaluated data types and behavioral and forecasting models. PredPol uses a machine-learning algorithm to calculate its predictions and only employs three types of input data: crime type, crime location, and crime data and time. PredPol is used in day-to-day operations to identify where and when crime is most likely to occur, enabling law enforcement effectively allocate resources and prevent crime.31 Pricing information is not available. Microsoft Microsoft Corporation (United States) is a technology company. It develops, manufactures, licenses, supports, and sells computer software, consumer electronics, personal computers, and related services. Microsoft’s mission is to empower every person and every organization on the planet to achieve more.32 Microsoft, in conjunction with the New York Police Department (NYPD), offers NYPD Domain Awareness System (DAS). The Domain Awareness System (DAS) allows the NYPD to use its data to inform officer decision making with analytics and operations research. DAS delivers tailored information and analytics to mobile devices and precinct desktops to inform decision-making. DAS supports counterterrorism and general policing activities. The tool receives data from a network of sensors, databases, devices, software, and infrastructure. DAS employs a combination of analytics and information technology, including pattern recognition, machine learning, and data visualization.33 PredPol has been sold to other law enforcement agencies. Pricing information is not available.
Figure 10: PredPol modeling tool
Figure 11: PredPol Domain Awareness System

27
Visual Analytics
Qlik Qlik (United States) helps enterprises around the world move faster and work smarter with an end-to-end solution for finding value in their data. Qlik’s builds platforms that allow for open-ended, curiosity-driven exploration at any skill level.34 Qlik offers QlikView. QlikView is a classic analytics solution built on an associative engine that allows organizations to use data with intuitive visual discovery. In conjunction with Qlik Sense, it supports the full range of analytics use cases at enterprise scale. The platform offers freeform associative exploration of data, dashboarding/guided analytics, advanced data preparation, and broad data connectivity.35 Pricing information is not available. IBM International Business Machines Corporation (IBM) (United States) is an American multinational information technology company headquartered in Armonk, New York, with operations in over 170 countries. IBM is the leading American computer manufacturer, with a major share of the market both in the United States and abroad.36 IBM offers i2 Analyst’s Notebook. IBM i2 Analyst's Notebook is a visual analysis tool that helps turn data into intelligence. The notebook is able to perform analysis on a wide range of data types with a flexible data modeling and visualization environment. The solution provides features such as connected network visualizations, social network analysis, and association, geospatial, statistical or temporal views to help uncover hidden connections and patterns in data. This insight can help the user to better identify and disrupt criminal, cyber and fraudulent threats.37 Prices start at $9,060 per year. Georgia Institute of Technology Georgia Institute of Technology (Georgia Tech) (United States) is a public research university and institute of technology in Atlanta, Georgia. Georgia Tech is a leading research university committed to improving the human condition through advanced science and technology. Georgia Tech provides a technologically focused education to more than 25,000 undergraduate and graduate students in fields ranging from engineering, computing, and sciences, to business, design, and liberal arts.38
Figure 12: IBM i2 Analyst's Notebook

28
Georgia Tech offers Jigsaw. The tool is a visual analytics system that helps investigators understand large collections of text documents and spreadsheets. It combines text mining with a suite interactive visualizations of the analysis results. The system highlights connections between entities and facilitates a more rapid understanding of their important relationships. Jigsaw helps analysts “put the pieces together” and link initially unconnected activities into a more coherent story across the documents. It has been used in areas such as journalism, academic research, consumer reviews, law enforcement, and intelligence analysis.39 Pricing information is not available. Georgia Tech offers Diamond Eye. Diamond Eye is a data analytics platform that enables data ingestion, processing and visualization in a single package. Diamond Eye allows for application-specific tools for monitoring Twitter and open source data for first responders. The platform is able to adapt to new data sources, new analytics, or new visualizations. Developing a flexible application program interface (API) makes the platform user-friendly. The Diamond Eye system was designed to help users answer historical and real-time questions with their data. The platform also provides situational and predictive results. Pricing information is not available. Purdue University Purdue University (United States) is a public research university and the flagship campus of the Purdue University system. The university was founded in 1869 after Lafayette businessman John Purdue donated land and money to establish a college of science, technology, and agriculture in his name.40 Purdue offers Visual Analytics Law Enforcement Toolkit (VALET) and iVALET (mobile version). VALET provides law enforcement agencies with a suite of visual analytic tools for spatiotemporal exploration of police report record sets and statistics in linked statistical and spatial/temporal views. The tool integrates large volumes of criminal, traffic and civil incident data into a single, interactive user interface. The tool suite provides advanced analysis capabilities, allowing analysts to
Figure 13: Georgia Tech Jigsaw
Figure 15: Purdue's VALET
Figure 14: Georgia Tech's Diamond Eye

29
develop and test hypotheses about criminal activities within various areas of their community. VALET helps law enforcement decision makers, analysts, and officers identify crime trends and patterns, discover crime anomalies, and perform predictive crime analytics to assist in allocating law enforcement resources. Benefits of VALET include:41
• Can be used for a variety of functions and activities including predictive analytics, training, investigation, response, recovery.
• Integrates multiple datasets onto one visual display (for example, social media, street light locations, law enforcement records, weather reports, civil court data, and bus routes).
• Allows users to choose what types of data they want to look at or analyze • Support for multiple platforms including desktop or laptop computers, iPhones, or iPads.
Pricing information is not available. Purdue offers Visual Analytics for Security Analytics (VASA). This system provides a visual analysis and decision making environment for severe weather and natural disaster planning and response for several critical infrastructures (e.g., power, computer networks, food distribution). Officials can use VASA to evaluate continuity of operation plans, plan for contingencies, prepare for, and respond to a severe weather event or natural disaster. VASA presents historical and simulated events that allow users to instantly consider various scenarios, alternative, operational and simulation attributes. Based on these decisions and parameters, new simulations may be run to explore the effects on multiple critical infrastructures (e.g., power, computer networks, water, transportation, sewer) and the effectiveness of contingency plans and mitigation strategies.42 Pricing information is not available. Purdue offers Context-aware Mobile Visual Analytics for Emergency Response tool. The tool provides advanced analytical insight to first responders and public safety command personnel by allowing them to analyze and understand on-scene, active emergency situations through interactive, integrated data analysis and visualization. The tool integrates situational and personnel related information from images, videos, 3D models and sensor data. Results deliver context aware visualized data obtained from heterogeneous sources on mobile devices. Visualizations represent two types of information:43
• Personnel related – identification, position, time, status (health, activity levels) • Situational information – temperature, toxic gas dispersion, contamination
Pricing information is not available.
Figure 16: Purdue's VASA

30
Appendix A
The following section includes tables that list the potential first responder-specific solutions, both existing and in-development, as identified in this analysis activity. It is likely that there are additional potential solutions in the market and therefore, this section should not be considered exhaustive.
All-Source Collection, Integration and Validation of Data Existing Solutions
Solution Solution Provider(s) Country Precision Information Environment for Coordinated Emergency Support (PIECES) Multi-Network Vehicle Router
Charles River Analytics United States
Precise Predictive Intelligence TransVoyant United States Qlik Sense, Qlik View Qlik United States FireCast Conservation International United States Alteryx Server Alteryx United States Knowledge Works Altair United States Dataiku Dataiku United States PrePol PredPol United States Domain Awareness System (DAS)
Microsoft in partnership with NYPD United States
Gotham Palantir United States Palantir Law Enforcement Palantir United States IBM i2 Analyst's Notebook IBM United States Patternizr NYPD United States Heimdall Davista Technologies United States Jigsaw Georgia Tech United States VALET- Visual Analytics Law Enforcement Toolkit and iVALET (mobile version)
Purdue University United States
Visual Analytics for Security Applications (VASA) Purdue University United States
Context-aware Mobile Visual Analytics for Emergency Response
Purdue University United States
Visualization & Analytics Vigilant Platforms United States Hitachi Visualization Suite Hitachi Vantara United States DataRobot DataRobot United States Kinetica Kinetica United States

31
MapR MAPR Technologies United States
Predictive Analytics Tool Tennessee Highway Patrol & IBM United States
Haystax Analytic Platform Haystax United States Azure Microsoft United States Optima R1 United States Diamond Eye Georgia Tech United States Visallo Visallo United States Presynct On Demand Presynct Technologies United States One Concern One Concern United States
Helix International Association of Fire Chiefs United States
WayCare WayCare United States/Israel
eCORE Northrop Grumman United States Vanguard X and AIRBOX MOSAIC Gates Defense Systems United States
In-Development Solutions Solution Solution Developer(s) Country
Data Science Immersive New Light Technologies/General Assembly
United States
Data Analytics in Emergency Management Babcock University United States
Big data analytics in prevention, preparedness, response and recovery in crisis and disaster management
Hellinic Army Academy United States
Efficient and Scalable Collection, Analytics and Processing of Big Data for Disaster Applications
Missouri University of Science and Technology and Osaka University
United States
Human-Centered Situation Awareness Platform for Disaster Response and Recovery
University of Southern California and the National Institute of Informatics in Japan
United States
Disaster Preparation and Response via Big Data Analysis and Robust Networking
Arizona State University and Japan's National Institute of Information
United States
Survey of data management and analysis in disaster situations Florida International University United States

32
Appendix B
The following section includes notes (where applicable) regarding extrapolation methods for some of the revenue figures presented in the “Market Figures” section of this report. In addition, there are instances when the CAGR cited by a third-party data source does not equate to the market figures presented. In these cases, the CAGR as calculated based upon the market figures presented is utilized.
• Global Visual Analytics Market
Market figures and a CAGR were available for the time period 2016 through 2022. A CAGR of 19.3 percent was used to estimate the revenue values for 2023.
• Global Predictive Analytics Market Market figures and a CAGR were available for the time period 2017 through 2022. A CAGR of 21.9 percent was used to estimate the revenue values for 2023.

33
Glossary
Compound Annual Growth Rate (CAGR) The average annual growth rate when
compounding is taken into account; its formula is as follows:
CAGR = (FV/PV)^(1/n)-1, where FV is the future or ending value, PV is the present or starting value, and n is the number of years between PV and FV.
First Responder Those individuals who, in the early stages of
an incident, are responsible for the protection and preservation of life, property, evidence, and the environment, including fire service, law enforcement, and emergency medical services.
Project Responder 4 The fourth in a series of studies that focuses
on identifying capability needs, shortfalls, and priorities for catastrophic incident response. The methodology is based upon discussions with federal, state, and local first responders, as well as technical subject matter experts.

34
References
2 Project Responder 5, (Washington: Department of Homeland Security,) August 2017, 97. https://www.dhs.gov/sites/default/files/publications/Project-Responder-5-Report_170814-508.pdf 3 “Exploiting the Product Life Cycle,” Harvard Business Review, Nov. 1965, https://hbr.org/1965/11/exploit-the-product-life-cycle 4 “Global Big Data Analytics Market, Forecast to 2023,” Frost and Sullivan, Nov. 2018, https://store.frost.com/global-big-data-analytics-market-forecast-to-2023.html 5 “Data Analytics Market 2019 Global Size, Industry Share, Sales Revenue, Development Status, Key Players, Competitive Landscape, Future Plans and Regional Trends by Forecast 2023,” MarketWatch, Feb. 2019, https://www.researchandmarkets.com/research/xvfltf/global_land 6 “Visual Analytics Market by Component (Software and Services), Business Function (IT, Sales and Marketing, Finance, Supply Chain, and HR), Deployment Model (On-Demand and On-Premise), Organization Size, Industry, and Region - Global Forecast to 2022,” Markets and Markets, Nov. 2017, https://www.alliedmarketresearch.com/ultra-secure-smartphone-market 7 “Predictive Analytics Market by Solutions (Financial Analytics, Risk Analytics, Marketing Analytics, Sales Analytics, Web & Social Media Analytics, Network Analytics), Services, Deployment, organization size and Vertical - Global Forecast to 2022,” Market and Markets, Aug. 2017, https://www.transparencymarketresearch.com/pressrelease/mobile-satellite-services-mss-market.htm 8 “Company,” Charles River Analytics, https://www.cra.com/company 9 “Precision Information Environment for Coordinated Emergency Support (PIECES)-The Situation,” Charles River Analytics, https://www.cra.com/work/case-studies/pieces 10 “Who We Are,” Qlik, https://www.qlik.com/us/company 11 “Agent of Transformation,” Qlik, https://www.qlik.com/us/products/qlik-sense 12 “Why We Are Here,” Palantir, https://www.palantir.com/about/ 13 “Palantir Gotham,” Palantir, https://www.palantir.com/palantir-gotham/ 14 “About NYPD,” NYPD, https://www1.nyc.gov/site/nypd/about/about-nypd/about-nypd-landing.page 15 “NYPD's Patternizr crime analysis tool raises AI bias concerns,” Informs, https://www.informs.org/About-INFORMS/News-Room/O.R.-and-Analytics-in-the-News/NYPD-s-Patternizr-crime-analysis-tool-raises-AI-bias-concerns 16 “How do you evaluate millions of different signals when time is of the essence?,” Kinetica, https://www.kinetica.com/about/ 17 “Kinetica Platform Overview,” Kinetica, https://www.kinetica.com/products/ 18 “Overview,” MAPR, https://mapr.com/company/ 19 “MAPR Industry Guide For Big Data in Federal Agencies & The Public Sector,” MAPR, https://mapr.com/whitepapers/mapr-government-federal-industry-guide/assets/mapr-government-federal-industry-guide.pdf 20 “Security Analytics Redefined,” Haystax Technology, https://security.haystax.com/about/ 21 “The Haystax Platform,” Haystax Technology, https://haystax.com/platform/ 22 “About Conservation International,” Conservation International, https://www.conservation.org/about 23 FIRECAST Fact Sheet,” Firecast, https://firecast.conservation.org/files/Firecast_20160511-en.pdf 24 “About Us,” Alteryx, https://www.alteryx.com/company/about-us 25 “Alterxy Platform,” Alteryx, https://www.alteryx.com/sites/default/files/2018-11/Alteryx-Platform-datasheet-20184.pdf 26 “Innovation Intelligence,” Altair, https://www.altair.com/about/?__hstc=210815242.1fa4e1edd20c72b930632ded0feaa0e1.1567710533809.1569371413457.1569414663846.3&__hssc=210815242.10.1569414663846&__hsfp=1037199243 27 “Data Preparation for Government and Education,” Altair, https://www.datawatch.com/in-action/industries/government/ 28 “Dataiku,” Crunchbase, https://www.crunchbase.com/organization/dataiku#section-overview

35
29 “Dataiku DSS,” Dataiku, https://www.dataiku.com/dss/index.html 30 “Overview,” PredPol, https://www.predpol.com/about/ 31 “The Three Pillars of Predictive Policing,” PredPol, https://www.predpol.com/law-enforcement/ 32 “Facts about Microsoft,” Microsoft, https://news.microsoft.com/facts-about-microsoft/ 33 “The New York City Police Department’s Domain Awareness System,” Informs, https://pubsonline.informs.org/doi/full/10.1287/inte.2016.0860 34 “Who We Are,” Qlik, https://www.qlik.com/us/company 35 “QlikView,” Qlik, https://www.qlik.com/us/products/qlikview 36 “IBM,” Encyclopedia Britannica, https://www.britannica.com/topic/International-Business-Machines-Corporation 37 “IBM i2 Analyst’s Notebook,” IBM, https://www.ibm.com/us-en/marketplace/analysts-notebook 38 “About Georgia Tech,” Georgia Tech, https://www.gatech.edu/about 39 “Jigsaw,” Georgia Tech Visualization Lab, https://www.purdue.edu/discoverypark/vaccine/docs/Jigsaw.pdf 40 “About Purdue University,” Purdue University, https://www.purdue.edu/purdue/about/index.php 41 “VALET- Visual Analytics Law Enforcement Toolkit,” Purdue University, https://engineering.purdue.edu/PURVAC/pdf_fliers/PURVAC17_VALET.pdf 42 “VASA- Visual Analytics for Security Applications,” Purdue University, https://www.purdue.edu/discoverypark/vaccine/docs/VASA%20factsheet.pdf 43 “Context-aware Mobile Visual Analytics for Emergency Response,” Purdue University, https://www.purdue.edu/discoverypark/vaccine/docs/contextaware.pdf