Embed Size (px)
Citation preview
If you leave me nowExploring the implications of Brexit for the UK economy and markets

3
If you leave me now
If you leave me nowExploring the implications of Brexit for the UK economy and markets
Edward Smith, CFAAsset Allocation Strategist
Contents
1 Introduction 62 Myth busting 7 2.1 Immigration 7 2.2 Trade and industry 8 2.3 Financial services 11 2.4 Public finances 15 2.5 Investment 183 Long-term macro impact 214 Short-term market impact 235 Epilogue: a New Deal? 26
4
ForewordOn 1 January 1973, the UK joined the European Economic Community, which later became the European Union (EU).
Just two years later in 1975, Harold Wilson’s LabourGovernment held a referendum to gauge the mood for continued membership. Voters expressed their support with 67% in favour on a 65% turnout.
Fast forward 40 years and the UK is preparing for another referendum on Thursday 23 June 2016. The country has had an uneasy relationship with the European project during this time. More recently, the debate about whether the UK would be financially better off by leaving the EU and going it alone has intensified.
There are many unanswered questions. If the UK votes to leave, would it keep full access to the single market, which takes almost half its exports? If so, might it have to accept most EU rules and even pay money to Brussels in return, like Norway or Switzerland?
The profusion of question marks will remain after results day. If the body politic votes to leave, negotiations over the terms of withdrawal could last up to two years before any outcome becomes mappable. And uncertainty alone can be enough to delay business investment and increase the volatility of financial markets.
With this report we wish to re-centre the debate, to show that the economic and financial implications of both staying and going are more finely balanced than the campaign rhetoric implies. We will continue to monitor the evolving situation closely.
I hope you find the report interesting and informative.
Edward Smith, CFAAsset Allocation Strategist
If you leave me now Foreword
Edward Smith, CFAEdward supports Rathbones’ investment process with proprietary macro-based, multi-asset research and is a member of the strategic asset allocation committee.
He joined the firm in 2014 from Canaccord Genuity Wealth Management, where he was global strategist and co-lead manager of their Risk Enhanced Multi-Asset Portfolio service. He started his career at BlackRock, working with liability-driven investment solutions for institutions.
He is a CFA charterholder, has completed a course in Quantitative Economic Methods at Birkbeck, University of London and received an MA from the University of Oxford. Edward is a published expert on risk management for multi-asset portfolios, recently appearing in Quantitative Approaches to High Net Worth Investment, edited by Andrew Rudd and Professor Stephen Satchell.
5
If you leave me nowExecutive summary
Executive summaryWe believe that even if the UK votes to leave, the economic and financial implications are likely to be more finely balanced than newspaper headlines imply.
We explore five of the main issues surrounding the debate by challenging some of the hyperbole, in order to help assess the implications more accurately. The first of these is that immigration has held down wages and pushed up unemployment for UK nationals. On balance, the evidence suggests this has not happened. Therefore, we do not expect wage growth to increase or unemployment to fall substantially if the UK votes in favour of Brexit.
The second myth is that UK trade would collapse after leaving the EU, which we believe is an exaggeration. In the first instance, the government may be able to withdraw but negotiate special terms of access to the common market — a kind of ‘soft Brexit’. Even under a ‘hard Brexit’, the UK would remain protected from any unfavourable treatment by global trade rules. However, EU trade tariffs are not uniform and some sectors would suffer more than others, particularly autos, food and clothing.
The third myth is that the Swiss financial services industry has thrived outside the EU, and that this is a model for the UK. Yet Switzerland’s relationship with the EU is complex and could not be replicated. Evolving legislation could push financial services activity towards the Continent if the UK votes for Brexit, which would cause a gradual loss of business and investment.
This is not a short-term risk, however, and one should not underestimate London’s history of financial innovation, predisposing government policy and the network effects of three centuries of global financial activity. Further, we would not necessarily expect regulation to become less onerous if the UK were to leave. Recently, some of the most controversial directives have been proposed by the UK and it is far from clear that London has less regulatory zeal than Brussels.
The fourth myth is that the UK’s public finances would improve substantially if it leaves the EU. A simple calculation suggests the country would be £9 billion better off in the current tax year if it did not have to make contributions to the EU. Yet at least two-thirds of this saving would probably be eroded by state support for industry; continuing contributions to the EEA under a ‘soft Brexit’ scenario; and losses from the positive contribution of new immigrant workers. Perhaps the greatest risk to UK finances is that Brexit would create uncertainty, which could reduce growth and, in turn, government tax receipts.
The fifth myth is that foreign investors will withdraw from the UK if it leaves the EU. To date, at least, it is difficult to conclude that the prospect of Brexit is derailing investment flows. 2014 was a record year for inward investment on many measures, despite the impending inevitability of the referendum. Surveys indicate that R&D will be the focus of investment projects over the coming years, and here the UK has a near unparalleled attractiveness.
However, an Ernst & Young survey highlights that 72% of investors polled state that UK membership of the single market is at least ‘fairly’ important to the UK’s attractiveness as an investment destination. Although it is difficult to forecast the long-term implications of Brexit, we do not expect a divestment of foreign investment in the short to medium term, but suggest that investor uncertainty could adjourn future inflows, particularly in the financial sector.
Looking aheadThe referendum result could push the UK in a number of different directions, which makes it difficult to forecast the long-term effects on economic growth, interest rates and the current account balance. If the country votes to leave the EU, it could make a clean break or retain many rights of access to the single market. If the UK remains within the EU, the benefits will rely on the European project progressing successfully — and solving any problems decisively along the way.
Meanwhile, in an increasingly globalised world, the UK economy should do well if the country can successfully negotiate new treaties of economic integration with higher growth nations. We assign some probabilities to a simple schema to show that the likelihood of a sustained negative deviation from the current trend of UK economic growth is perhaps at worst 1 in 6, and more likely 1 in 10 (EU completion pursuant to ‘hard Brexit’). These numbers do not suggest a trivial risk, but it is important to think, like markets, in probabilistic terms.
In the short term, the referendum is unlikely to have a substantial directional impact on financial markets in the run-up to voting day or in the immediate aftermath if the UK votes to leave the EU. Yet we expect markets to react to any lack of clarity and associated uncertainty. Mid and small cap UK equity indices seem particularly sensitive to measures of economic uncertainty, although relative performance does not appear to have suffered yet. Meanwhile, we expect sterling to suffer the most volatility, and there are already indications that currency traders are positioning for some extreme moves.
6
If you leave me now 1. Introduction
1. IntroductionOn 23 June 2016, the government will hold a referendum on the continuation of the UK’s membership of the European Union (EU). In the Referendum Bill currently progressing through Parliament, voters will be asked, “Should the United Kingdom remain a member of the European Union?” If the run-up to the Scottish referendum is any guide, we are about to get swept up in a maelstrom of axioms and counteraxioms of dubious integrity that attempt to influence the nation’s answer to that question. Taken as read, many would have pronounced investment implications.
In this investment report, we identify some of the most common hyperbole put forward by both sides of the campaign in order to demonstrate that if the UK votes to leave the EU, the implications for the UK economy and financial markets are likely to be more finely balanced than newspaper headlines are likely to imply. We assess three arguments from the ‘no’ campaign and two from the ‘yes’ that we believe are far from the self-evident truths that they are often purported to be — in short they are myths. Towards the end of the report, we suggest some long-term macroeconomic implications as well as the short-term effects on financial markets. We also urge investors to treat individual investment recommendations that rest on the result of the referendum with considerable circumspection.
The status quoWe are not experts at predicting political votes, but one observation is worth keeping in mind — psephology (the statistical study of elections and trends in voting) suggests voters tend to support the lowest perceived risk. For example, in Australia’s 1999 referendum on seceding from the British Crown, a sizeable undecided vote swung towards the ‘stays’ due to the lack of a clear blueprint for a new head of state and the architecture of power. The latest polls in the UK indicate more than 15% of voters are undecided. Without a detailed plan for the mechanics and terms of withdrawal, most people are likely to believe that leaving the EU represents the greatest risk.
If voters believe that Prime Minister David Cameron has a detailed and credible plan to continue the UK’s membership under renegotiated terms, with the genuine support of European politicians, financial markets may start to price a lower probability of Brexit. Similarly, if the ‘Out’ campaign unveils a detailed and credible plan for the mechanics of withdrawal and economic policy after Brexit, markets may start to price a higher probability.
The latest polls in the UK indicate more than 15% of voters are undecided. Without a detailed plan for the mechanics and terms of withdrawal, most people are likely to believe that leaving the EU represents the greatest risk.
7
If you leave me now2. Myth busting
2. Myth busting2.1 ImmigrationMyth 1: Restricting migrants from the EU will lead to better prospects for UK workers.
Like an adroit politician, we’ll get the most controversial topic out of the way first, hoping that if we provoke any jeering, you will have forgotten about it by the time you reach the end of the paper. We will stick to stone cold economics, and will not stray into a political and sociocultural discourse on immigration. Foreign-born persons now constitute 16.6% of the UK’s working-age population. This figure is close to the average immigration share for developed economies, but it has doubled over the past 20 years. The increase has been driven by immigration from across the European Economic Area (EEA), which includes the 28 EU countries as well as Norway, Iceland and Liechtenstein.
Between 1995 and 2011, the number of people living in the UK born outside of the EEA rose from 2.8 million to 4.6 million (a 65% increase), while those born within the EEA rose more than threefold from 723,000 to 2.3 million. Of those that have moved to the UK since 2011 and still remain, three-quarters are from the 10 Eastern European countries that have most recently joined the EU1.i
A survey of empirical studies suggests any fears about adverse consequences of rising immigration on prospects for UK-born workers have not, on average, materialised. It is hard to find much evidence of the displacement of UK workers or lower wages.ii In absolute terms, more new jobs have gone to immigrant workers than to the native-born. Yet this trend is a function of demographics — immigration has accounted for almost 70% of UK population growth since 1995.
It is not an oversimplification to state that the majority of these new jobs would not have been created without the supply of immigrant labour. To conclude that immigrants have taken away jobs from UK nationals, the immigrant share of new jobs would have to be rising at a faster rate than the immigrant share of the working age population. This trend has not occurred over the past two decades.iii
Furthermore, if rising immigration were crowding out jobs for UK-born workers, then we should observe a relative rise in joblessness in areas that have received the most immigrants. However, looking at county data, there is no correlation between immigration flows between 2004 and 2012 and UK-born unemployment. This pattern also holds true even when one just looks at sections of the population earning low wages.iv
Impact on wagesThree studies refute the claim that immigration has held back wage growth for UK-born workers. The first, from 2008, looks specifically at Eastern European immigration and finds it has had no significant effect on wages. The authors note that economic theory had led them to expect adverse effects in lower-skilled categories of employment due to large flows of immigrant labour into this sector, but postulate that any impact may have been offset by the concurrent increase in the minimum wage.v
The second study, from 2013, concludes that in aggregate, the wages of native-born workers are not sensitive to new immigration flows and that immigrants are not perfect substitutes for domestic labour. Instead, new immigrants depress the wages of previous immigrants, with whom they now compete.vi
The third study, from 2014, does conclude that immigration has put downward pressure on the wages of workers in the bottom 15% of jobs when ranked by pay. However, it also concludes that immigration has increased the wages of those in the remaining 85% of jobs, most likely due to immigrant workers being paid less than their marginal value.vii
1. Bulgaria, Czech Republic, Estonia, Hungary, Latvia, Lithuania, Poland, Slovakia, Slovenia, Romania.
With an ageing, soon to be declining, working-age population, immigrant labour boosts potential GDP, particularly when considering that the average education level of immigrants from the EEA is higher than those in the native-born population.
8
If you leave me now 2. Myth busting
Boosting potential GDP
Wearing the skin of a cold-blooded economist, it is difficult to conclude that the UK economy has not benefited from the increase in immigrant labour from Europe. With an ageing, soon to be declining, working-age population, immigrant labour boosts potential GDP, particularly when considering that the average education level of immigrants from the EEA is higher than those in the native-born population (that is, they bring higher ‘human capital’). Immigration also seems to be preventing skills mismatches and has not had an adverse effect on the employment of most UK-born workers or their pay. As a result, we would not expect wage growth to increase or unemployment to fall if the UK votes in favour of Brexit.
We incorporate a discussion on whether EEA migrants make a net positive or net negative contribution to the budget balance in section 2.4 on public finances. We conclude that EEA migrants are positive for the public purse, including those from Eastern Europe — it is migrants from outside Europe who receive more public goods and transfers than they contribute in taxes. However, there is a risk that recent EEA immigrants may not retire to their country of birth, and place a greater burden on the UK’s underinvested public infrastructure.
2.2 Trade and industryMyth 2: The UK’s trade balance will collapse if we withdraw from the EU.
Around 50% of Britain’s exports go to EU countries.viii Our second myth is predicated on the notion that the costs to EU consumers and firms of importing UK goods and services will become so prohibitive following Brexit as to immediately render them uncompetitive.
The costs of trade from government and institutional policy (often referred to as barriers to trade) can be broadly split into two categories: tariffs (effectively government-imposed taxes on imports) and non-tariff costs (in Western markets dominated by complex regulatory and certification costs, quality assurance and labelling regimes, state subsidies and minimum import prices). There are other barriers to trade, such as language or distance, but these are unlikely to be reduced by economic policy.
In the short term, the greatest risk to trade and the UK’s trade balance (exports minus imports) stems from the imposition of tariffs. Given that the UK is already set up to comply with EU regulation and various trade regimes, additional non-tariff costs in the short term would be broadly limited to more onerous burdens of proof. However, over the longer term, non-tariff barriers represent the greater threat.
Weighted tariff on exports (%)
Value of exports to EU (US dollars)
Weighted tariff on imports (%)
Value of imports from EU (US dollars)
Chemicals and products 2.2 39,943 2.7 34,854
Transport equipment 7.2 35,341 8.1 60,382
Coke, refined petroleum and nuclear fuel 2.8 28,416 2.7 17,194
Electrical and optical equipment 1.6 23,449 2.0 38,057
Mining and quarrying 0.0 20,167 0.0 85,12
Basic and fabricated metals 1.9 18,619 2.1 26,150
Machinery 2.1 14,907 2.1 24,717
Food, beverages and tobacco 5.0 14,168 7.3 42,294
Textiles and products 9.7 8,267 9.6 11,912
Rubber and plastics 5.1 6,751 5.4 9,290
Manufacturing (not elsewhere classified) 1.7 6,179 1.7 9,730
Pulp, paper, printing and publishing 0.1 4,999 0.0 10,539
Agriculture, hunting, forestry and fishing 5.6 3,352 5.9 8,080
Other non-metallic mineral 3.3 2,120 3.8 3,553
Wood and products 3.6 471 2.4 2,942
Total trade in goods 3.3 227,149 4.4 308,206
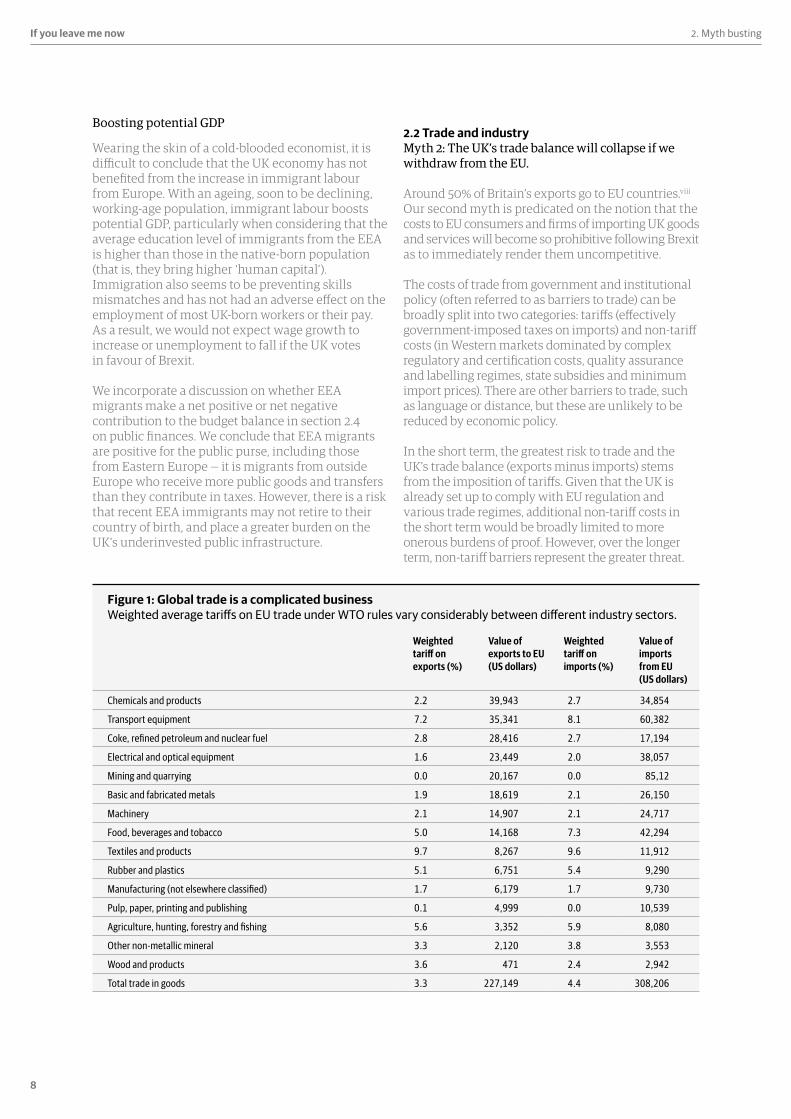
Figure 1: Global trade is a complicated business Weighted average tariffs on EU trade under WTO rules vary considerably between different industry sectors.
9
If you leave me now2. Myth busting
As a member of the EU, the UK is part of the customs union known as the Single Market Programme (SMP), which bans the imposition of tariffs on trade between members. The SMP in goods is more or less fully operational, the establishment of a common market in services has fallen far short of the original vision codified in various treaties. The EU Directive on Services in 2006 made another attempt at breaking down these barriers, but progress has been slow.
The SMP also mandates a common tariff applied to goods imported from outside the EU. Members are forbidden to agree bilateral trade agreements with non-EU countries and all external relationships must be coordinated through the Common Commercial Policy.
Terms of withdrawalBefore we move on to discuss in turn the likelihood of tariff and non-tariff costs affecting a collapse in trade if the UK leaves the EU, it is worth noting that at this stage of the debate the terms on which Brexit would take place are open to much conjecture. The government may be able to withdraw from the EU but negotiate some special rights of access to the common market — what we term a ‘soft Brexit’2.
A ‘hard Brexit’ would mean ceding all special terms of engagement. Yet even in this scenario, the trade relationship between the UK and the EU would revert to ‘most favourable nation’ (MFN) terms as negotiated by the World Trade Organisation (WTO), to which both economies belong. The WTO exists to break down barriers to global trade and prevent bilateral discrimination. Under its rules, the EU would not be allowed to enact legislation that discriminates against the UK specifically.
A ‘soft Brexit’ might see the UK withdrawing from the EU but joining the EEA and, therefore, the European Free Trade Association (EFTA). Alongside Norway, Iceland and Liechtenstein, the UK would then continue to participate in the single market in goods. The significant drawback of both the EFTA (and the ‘hard Brexit’/WTO route) however, is that the UK would have to accept any evolution in EU product market regulation, while no longer having the capacity to shape it.3 Although the WTO tries to legislate against many non-tariff barriers to trade, such as import licencing or pre-shipment inspections, unilateral product market regulation is beyond its remit.
2. Among the EU member states with the greatest political clout, the UK takes the largest share of exports from Germany, but even this is just 8%. Compared with the 50% of UK exports destined to the EU as a whole, the UK does not start from the best bargaining position. However, we think Germany would probably support some form of deal. Auto exports account for a third of Germany’s exports to the UK and these would suffer if they had to revert to the 10% WTO tariffs (see figure 1 on page 8). Furthermore, if the UK were to exit, Germany would lose its greatest ally in opposing protectionism and mercantilism, while its leaders are the most ideologically aligned to the success of the EU project and, therefore, have the most to lose. 3. A partial continuation of EU immigration policy and budget contributions is highly likely to be a quid pro quo for retaining access to the free trade area under a ‘soft Brexit’ scenario.
EFTA members also have to go through customs and obtain detailed certificates of origin — a sizeable non-tariff cost. Switzerland is not a member of the EEA but has negotiated separate terms of engagement with the single market. It has recognised the potential cost of non-tariff barriers and worked hard to institute a series of bilateral supplementations to its membership of the EFTA, freeing it from most of them. But the quid pro quo was the agreement to replicate product market regulations implemented by the EU while having no involvement to the decision-making process.
A ‘hard Brexit’A ‘soft Brexit’ — almost by definition — would negate a threat to trade, so we will jump straight to a ‘hard Brexit’ scenario. Figure 1 shows the weighted average tariff paid on UK exports and imports under the WTO’s MFN arrangements.ix (Broken out by trade sector, the tariffs paid on imports and exports differ due to the varying composition of goods within each sector, particularly the types of food and beverage.) The weighted average tariff the EU would pay to import goods from the UK totals 3.3% of their value.
It is perhaps useful here to ask if we would fear a collapse in exports if the UK’s exchange rate appreciated by 3.3%. After all, an exchange rate is arguably a non-tariff barrier to trade. In most cases, the answer is likely to be no. While a tariff may be seen to represent a permanent increase in price in a way that exchange rate volatility may not, it is rather unlikely that a 3.3% shift would suddenly make the UK uncompetitive, and make palatable to overseas firms the myriad costs of seeking new suppliers.
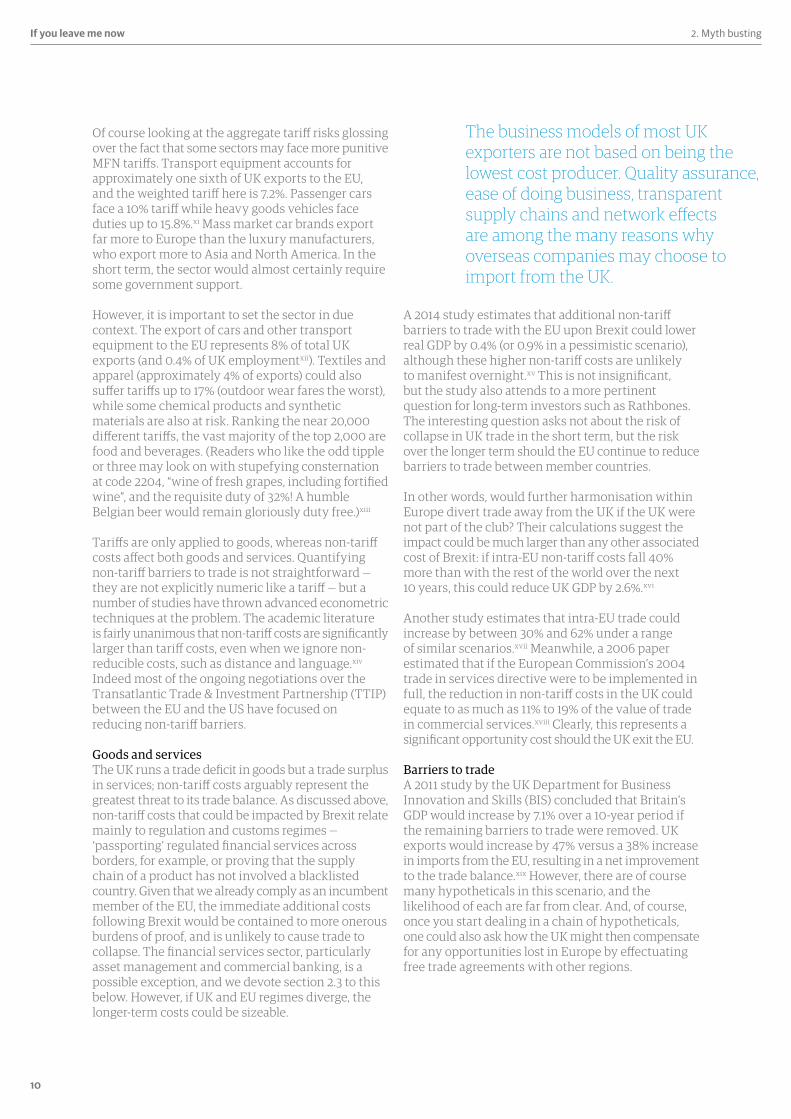
The business models of most UK exporters are not based on being the lowest cost producer. Quality assurance, ease of doing business, transparent supply chains and network effects are among the many reasons why overseas companies may choose to import from the UK. A 2014 study estimates that the imposition of MFN tariffs on trade with the EU would lead to just a 0.1% reduction to real GDP.x Moreover, the weighted-average tariff that the UK would have to pay to import from the EU is higher than 3.3% (figure 1), suggesting that in the short term the trade balance with Europe might even improve.
10
Of course looking at the aggregate tariff risks glossing over the fact that some sectors may face more punitive MFN tariffs. Transport equipment accounts for approximately one sixth of UK exports to the EU, and the weighted tariff here is 7.2%. Passenger cars face a 10% tariff while heavy goods vehicles face duties up to 15.8%.xi Mass market car brands export far more to Europe than the luxury manufacturers, who export more to Asia and North America. In the short term, the sector would almost certainly require some government support.
However, it is important to set the sector in due context. The export of cars and other transport equipment to the EU represents 8% of total UK exports (and 0.4% of UK employmentxii). Textiles and apparel (approximately 4% of exports) could also suffer tariffs up to 17% (outdoor wear fares the worst), while some chemical products and synthetic materials are also at risk. Ranking the near 20,000 different tariffs, the vast majority of the top 2,000 are food and beverages. (Readers who like the odd tipple or three may look on with stupefying consternation at code 2204, “wine of fresh grapes, including fortified wine”, and the requisite duty of 32%! A humble Belgian beer would remain gloriously duty free.)xiii
Tariffs are only applied to goods, whereas non-tariff costs affect both goods and services. Quantifying non-tariff barriers to trade is not straightforward — they are not explicitly numeric like a tariff — but a number of studies have thrown advanced econometric techniques at the problem. The academic literature is fairly unanimous that non-tariff costs are significantly larger than tariff costs, even when we ignore non-reducible costs, such as distance and language.xiv Indeed most of the ongoing negotiations over the Transatlantic Trade & Investment Partnership (TTIP) between the EU and the US have focused on reducing non-tariff barriers.
Goods and servicesThe UK runs a trade deficit in goods but a trade surplus in services; non-tariff costs arguably represent the greatest threat to its trade balance. As discussed above, non-tariff costs that could be impacted by Brexit relate mainly to regulation and customs regimes — ‘passporting’ regulated financial services across borders, for example, or proving that the supply chain of a product has not involved a blacklisted country. Given that we already comply as an incumbent member of the EU, the immediate additional costs following Brexit would be contained to more onerous burdens of proof, and is unlikely to cause trade to collapse. The financial services sector, particularly asset management and commercial banking, is a possible exception, and we devote section 2.3 to this below. However, if UK and EU regimes diverge, the longer-term costs could be sizeable.
If you leave me now 2. Myth busting
A 2014 study estimates that additional non-tariff barriers to trade with the EU upon Brexit could lower real GDP by 0.4% (or 0.9% in a pessimistic scenario), although these higher non-tariff costs are unlikely to manifest overnight.xv This is not insignificant, but the study also attends to a more pertinent question for long-term investors such as Rathbones. The interesting question asks not about the risk of collapse in UK trade in the short term, but the risk over the longer term should the EU continue to reduce barriers to trade between member countries.
In other words, would further harmonisation within Europe divert trade away from the UK if the UK were not part of the club? Their calculations suggest the impact could be much larger than any other associated cost of Brexit: if intra-EU non-tariff costs fall 40% more than with the rest of the world over the next 10 years, this could reduce UK GDP by 2.6%.xvi
Another study estimates that intra-EU trade could increase by between 30% and 62% under a range of similar scenarios.xvii Meanwhile, a 2006 paper estimated that if the European Commission’s 2004 trade in services directive were to be implemented in full, the reduction in non-tariff costs in the UK could equate to as much as 11% to 19% of the value of trade in commercial services.xviii Clearly, this represents a significant opportunity cost should the UK exit the EU.
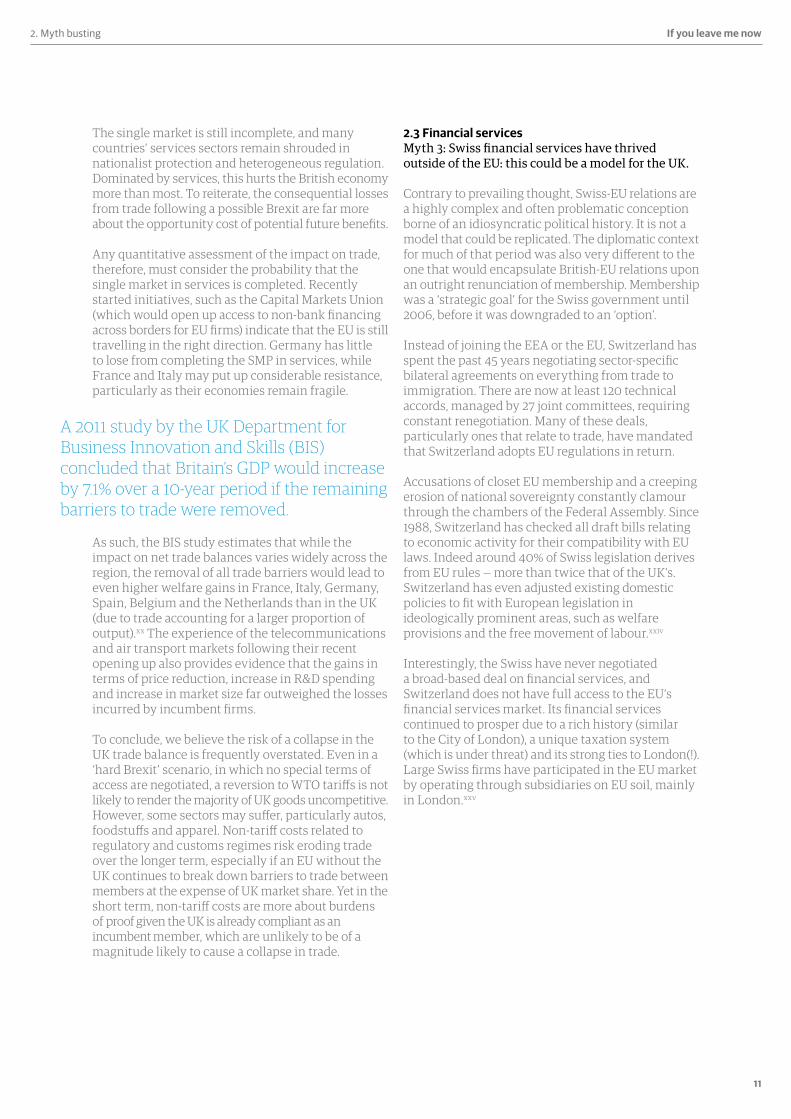
Barriers to tradeA 2011 study by the UK Department for Business Innovation and Skills (BIS) concluded that Britain’s GDP would increase by 7.1% over a 10-year period if the remaining barriers to trade were removed. UK exports would increase by 47% versus a 38% increase in imports from the EU, resulting in a net improvement to the trade balance.xix However, there are of course many hypotheticals in this scenario, and the likelihood of each are far from clear. And, of course, once you start dealing in a chain of hypotheticals, one could also ask how the UK might then compensate for any opportunities lost in Europe by effectuating free trade agreements with other regions.
The business models of most UK exporters are not based on being the lowest cost producer. Quality assurance, ease of doing business, transparent supply chains and network effects are among the many reasons why overseas companies may choose to import from the UK.
11
If you leave me now
The single market is still incomplete, and many countries’ services sectors remain shrouded in nationalist protection and heterogeneous regulation. Dominated by services, this hurts the British economy more than most. To reiterate, the consequential losses from trade following a possible Brexit are far more about the opportunity cost of potential future benefits.
Any quantitative assessment of the impact on trade, therefore, must consider the probability that the single market in services is completed. Recently started initiatives, such as the Capital Markets Union (which would open up access to non-bank financing across borders for EU firms) indicate that the EU is still travelling in the right direction. Germany has little to lose from completing the SMP in services, while France and Italy may put up considerable resistance, particularly as their economies remain fragile.
As such, the BIS study estimates that while the impact on net trade balances varies widely across the region, the removal of all trade barriers would lead to even higher welfare gains in France, Italy, Germany, Spain, Belgium and the Netherlands than in the UK (due to trade accounting for a larger proportion of output).xx The experience of the telecommunications and air transport markets following their recent opening up also provides evidence that the gains in terms of price reduction, increase in R&D spending and increase in market size far outweighed the losses incurred by incumbent firms.
To conclude, we believe the risk of a collapse in the UK trade balance is frequently overstated. Even in a ‘hard Brexit’ scenario, in which no special terms of access are negotiated, a reversion to WTO tariffs is not likely to render the majority of UK goods uncompetitive. However, some sectors may suffer, particularly autos, foodstuffs and apparel. Non-tariff costs related to regulatory and customs regimes risk eroding trade over the longer term, especially if an EU without the UK continues to break down barriers to trade between members at the expense of UK market share. Yet in the short term, non-tariff costs are more about burdens of proof given the UK is already compliant as an incumbent member, which are unlikely to be of a magnitude likely to cause a collapse in trade.
2. Myth busting
2.3 Financial servicesMyth 3: Swiss financial services have thrived outside of the EU: this could be a model for the UK.
Contrary to prevailing thought, Swiss-EU relations are a highly complex and often problematic conception borne of an idiosyncratic political history. It is not a model that could be replicated. The diplomatic context for much of that period was also very different to the one that would encapsulate British-EU relations upon an outright renunciation of membership. Membership was a ‘strategic goal’ for the Swiss government until 2006, before it was downgraded to an ‘option’.
Instead of joining the EEA or the EU, Switzerland has spent the past 45 years negotiating sector-specific bilateral agreements on everything from trade to immigration. There are now at least 120 technical accords, managed by 27 joint committees, requiring constant renegotiation. Many of these deals, particularly ones that relate to trade, have mandated that Switzerland adopts EU regulations in return.
Accusations of closet EU membership and a creeping erosion of national sovereignty constantly clamour through the chambers of the Federal Assembly. Since 1988, Switzerland has checked all draft bills relating to economic activity for their compatibility with EU laws. Indeed around 40% of Swiss legislation derives from EU rules — more than twice that of the UK’s. Switzerland has even adjusted existing domestic policies to fit with European legislation in ideologically prominent areas, such as welfare provisions and the free movement of labour.xxiv
Interestingly, the Swiss have never negotiated a broad-based deal on financial services, and Switzerland does not have full access to the EU’s financial services market. Its financial services continued to prosper due to a rich history (similar to the City of London), a unique taxation system (which is under threat) and its strong ties to London(!). Large Swiss firms have participated in the EU market by operating through subsidiaries on EU soil, mainly in London.xxv
A 2011 study by the UK Department for Business Innovation and Skills (BIS) concluded that Britain’s GDP would increase by 7.1% over a 10-year period if the remaining barriers to trade were removed.
12
If you leave me now 2. Myth busting
Exploring the Single Market Programme (SMP)
Should the UK de-emphasise the importance of the Single Market Programme (SMP) when exports to the EU have declined? The EU’s share of total UK exports has been decreasing since the creation of the single currency; before the financial crisis, the export share was falling at a rate of 0.6% a year. But one should not necessarily infer the failure of the SMP. It would be very strange if the EU’s share of UK exports had not declined. Demographic and economic growth in the developing world has far eclipsed that of the advanced economies. For trade shares not to adjust to this would have meant a catastrophic failure of trade policy.
As well as stronger domestic demand, many developing nations completed trade deals to open up their economies to Western exporters. The EU concluded free-trade agreements (FTAs) with Korea, Chile, Mexico and South Africa, while China, Taiwan and Saudi Arabia joined the World Trade Organisation (WTO). The share of the UK’s exports to other EU countries has declined in much the same way as the share of France’s, Italy’s and many other EU members’ exports destined for the UK has also declined over the same period. This is a structural shift seen in trade throughout the world and it is spurious to conclude anything more.
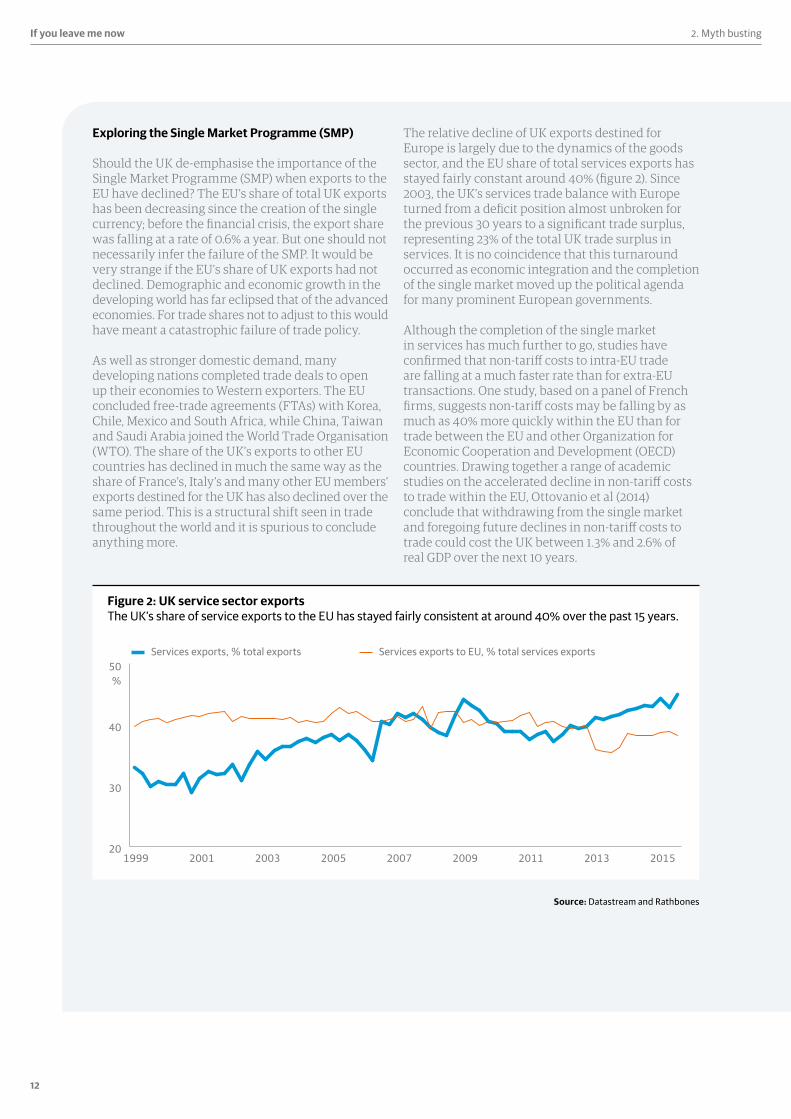
The relative decline of UK exports destined for Europe is largely due to the dynamics of the goods sector, and the EU share of total services exports has stayed fairly constant around 40% (figure 2). Since 2003, the UK’s services trade balance with Europe turned from a deficit position almost unbroken for the previous 30 years to a significant trade surplus, representing 23% of the total UK trade surplus in services. It is no coincidence that this turnaround occurred as economic integration and the completion of the single market moved up the political agenda for many prominent European governments.
Although the completion of the single market in services has much further to go, studies have confirmed that non-tariff costs to intra-EU trade are falling at a much faster rate than for extra-EU transactions. One study, based on a panel of French firms, suggests non-tariff costs may be falling by as much as 40% more quickly within the EU than for trade between the EU and other Organization for Economic Cooperation and Development (OECD) countries. Drawing together a range of academic studies on the accelerated decline in non-tariff costs to trade within the EU, Ottovanio et al (2014) conclude that withdrawing from the single market and foregoing future declines in non-tariff costs to trade could cost the UK between 1.3% and 2.6% of real GDP over the next 10 years.
20
30
40
50
201520132011200920072005200320011999
Services exports, % total exports Services exports to EU, % total services exports
%
Source: Datastream and Rathbones
Figure 2: UK service sector exports The UK’s share of service exports to the EU has stayed fairly consistent at around 40% over the past 15 years.
13
If you leave me now2. Myth busting
The counterfactual that a UK unfettered by EU restrictions could have pursued deeper and more lucrative bilateral trade deals with fast-growing developing economies is a little more compelling; although, as we have noted, the EU has negotiated some significant deals. Its trade agreements cover around 59% of the UK’s global trade, which could rise to 88% if the EU is successful in ongoing negotiations.xxi What’s more, academic studies find little evidence that what we call ‘economic integration agreements’, such as the SMP, affect trade negatively with countries outside the area of integration.xxii
Although no agreements have been reached between the EU and China, India or Brazil, the growth of the UK’s trade with these nations does not appear to have been held back relative to countries outside the EU. Meanwhile, it is far from clear that the UK would have any greater chance of reaching a deal on its own. Perhaps less diversity of interests would help: the EFTA countries negotiated an agreement with South Korea before the EU struck a deal, for example, but the sheer size of the marketplace arguably affords the EU more time at the table than the UK would receive.
Lastly, the BIS study noted previously suggests the benefits of remaining a member if the remaining non-tariff barriers to trade in the SMP were removed far eclipse any potential benefits from becoming a member of another free trade association, such as the North American Free Trade Agreement (NAFTA), for example.xxiii
The declining share of Europe in UK trade is a function of global growth dynamics and a period of rapid integration of emerging markets into the global economy. In the same way that one would hope other economies do not write off the UK as a strategic trading partner on this basis, one should not write off the EU even though the fastest pockets of export growth are likely to come from outside of its borders.
14
If you leave me now 2. Myth busting
The single greatest riskWe believe the single greatest risk to the UK if it were to leave the EU is that evolving legislation and regulation could start an ineluctable repatriation of financial services activity back towards the Continent. This would have profound effects on the economy and exchange rate: the UK’s trade surplus in services is almost entirely in financial and other professional and technical services. Before we elaborate, we must stress that this is not a risk that would be realised overnight.
It would undoubtedly be a focal point in the negotiations that may go on for two years if the UK formally decides to leave, while its realisation depends on the path Brussels and Frankfurt elect to take in the future. Nevertheless investors in companies with substantial UK bases may demand a higher premium in return for exposure to this risk — in other words, associated equity valuations could move lower.
The EEA’s ‘passporting’ directive and its elaboration under a piece of legislation known as the Markets in Financial Instruments Directive (MiFID) permits UK financial institutions to provide services across the EU from its UK domicile. Perhaps more importantly, it also means that a foreign firm can do the same from a British-based subsidiary. Although we can assume the UK’s financial services industry will be compliant on the date of Brexit, the extra burden of proof that would be required outside of the EU would probably cause a significant dent in national productivity and company profits.
Furthermore, EU-level financial regulation, and in particular MiFID II proposals, are likely to make the provision of financial services to the EU from outside of the EEA increasingly difficult. In Switzerland MiFID II is seen as creating new barriers for firms that will force more of them to open and expand subsidiaries in EEA member states. A UK Parliamentary research paper highlights how after 2019 offshore (non-EEA) providers will only be able to offer a more limited range of services in mainland Europe, and only on condition that they register with the European Securities and Markets Authority. The requirements for registration, according to a briefing note by KPMG, will be “strict and difficult to fulfil”.xxvi
Financial regulationWe have spoken with a number of legal and regulatory experts on the likely future of EU financial legislation and all were emphatic that extra-territorial activity is likely to become increasingly difficult. We have already witnessed the beginning. In 2014, the UK won a case at the European Court of Justice (ECJ) to prevent the European Central Bank from imposing regulation that attempted to mandate that the clearing of all euro-denominated financial contracts must route through central counter parties located within the eurozone.xxvii Outside the EU, the loss of recourse to the ECJ in order to defend against attempts to repatriate euro-denominated financial service activity to the Continent would leave the UK vulnerable.
Goldman Sachs and JP Morgan have both given evidence to the Parliamentary Commission on Banking Standards emphasising the importance of the UK’s EU membership in providing a base from which non-EU businesses can passport across the EU. ‘In common with financial institutions across the City, our ability to provide services to clients and engage in investment activities throughout Europe is dependent on the passport that London-based firms enjoy to operate on a cross-border basis within the Union. If the UK leaves, it is likely that the passport will no longer be available, thereby forcing firms that wish to access EU markets to move their operations to within those markets.’xxviii
A handful of foreign banks are already starting to move parts of their European bases to Dublin. US bank Citigroup is transferring its European retail banking headquarters there, pointing out that such a move not only future-proofs EU access, but also lowers the cost base substantially.
The asset management industry is likely to suffer more than most. The UK is the second-largest centre for fund management, with assets under management totalling £6.2 trillion in 2013. Under the EU’s UCITS directive, collective investment vehicles, such as unit trusts, are permitted to be sold across the region on the basis of authorisation from one member state. The regulatory burden on the UK fund management industry outside of this special zone would be severe, and it is highly likely that many European or international fund houses currently choosing to headquarter in London would move at least part of their operation back to the mainland.
We believe the single greatest risk to the UK if it were to leave the EU is that evolving legislation and regulation could start an ineluctable repatriation of financial services activity back towards the Continent.
15
If you leave me now2. Myth busting
Legal experts suggest it is naïve to think that a brass plate on the Boulevard Royal in Luxembourg will circumvent the extra-territorial clampdown. We have already seen a so-called ‘letterbox’ provision inserted into the Alternative Investment Fund Managers Directive, mandating hedge funds to locate significant management functions on EU soil. While it seems unlikely that the EU would go to such extremes as to mandate that all funds sold within its borders must be managed within its borders (it is difficult to see how this would be better for European consumers), a gradual shift of control functions to the Continent as regulation outside of the EU becomes more onerous is quite conceivable.
London’s important roleThe UK’s pre-eminent financial services industry is about far more than London as a convenient gateway into the EU marketplace. It is the agglomeration of three centuries of global financial activity, supported by world-leading professional services in accountancy and law, safeguarded by the British legal system and made accessible by the English language and a convenient time zone. The economic benefits to locating here will not be erased if the UK breaks ties with the EU. The sector — and by extension the UK economy — would not collapse upon the results of the referendum.
We should not underestimate London’s history of financial innovation and predisposing government policy. However, if the UK failed to negotiate a bilateral agreement that enshrined the continued passporting of its financial services, it is difficult not to envisage a gradual loss of business and investment. In the near term, the risks are alleviated by the lack of a single financial centre in Europe. Paris, Frankfurt, Amsterdam and Dublin would likely be the main destinations. However, they do not possess the advantages of the London ecosystem of supporting financial services, including skilled staff, legal services and market infrastructure, and they cannot be replicated overnight. Yet competition between them borne out of new barriers to trade with London would be disruptive and costly.
If a ‘soft Brexit’ arrangement were negotiated, UK financial services would continue to be fettered to EU regulation, only without any constitutional ability to influence it. As we have already discussed, renouncing all influence on regulation in one’s largest overseas market arguably diminishes rather than augments the UK’s regulatory sovereignty.
Even under an alternative scenario, we would question the conclusion that UK banks would face lower regulatory burdens on their balance sheets and business models. It should be noted that some of the most disruptive, and, indeed, contentious, items of financial regulation of the past 20 years have been proposed by the UK, not Brussels: the ring fencing of retail banking from investment banking, the bank levy and the ban on inducements.
The direction of financial regulation today is increasingly dictated by global bodies such as the G20’s Financial Stability Board (chaired by the Bank of England’s own Mark Carney) or the Basel Committee. British banks may be able to set their own capital requirements and exist less encumbered by some of the more burdensome legislation emanating from Brussels (such as 2012’s curtailment of short selling activity, 2013’s bonus caps and the European Commission’s proposals for a Financial Transaction Tax). However, it is far from clear that London has less regulatory zeal than Brussels.
On the other hand, the globalisation of regulation should prevent UK and European directives from diverging so far as to render cross-border operations impassable. Still it will do little to guard against rising costs of compliance for non-EU firms or, moreover, an EU clampdown on extra-territorial activity, which remains the key risk.
2.4 Public financesMyth 4: The UK’s budget balance would improve substantially if we leave the EU.
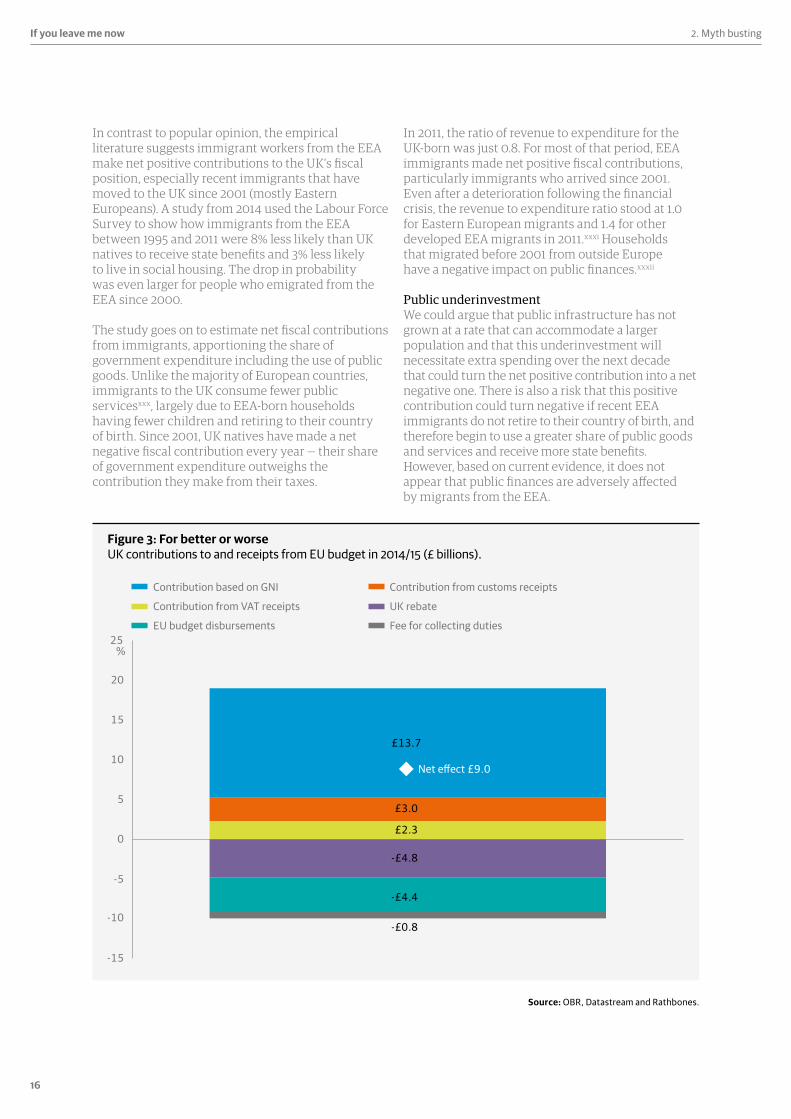
Looking at the government accounts in isolation suggests the public purse would benefit from Brexit. In fiscal year 2014/15, the UK contributed £13.7 billion to the EU budget based on the size of its economy, a further £2.3 billion of its VAT receipts and collected £3 billion of customs duties (which it would keep if it left the EU). On the other side of ledger, the UK received £4.8 billion as a rebate (a special deal dating back to 1984), a £0.8 billion fee for collecting customs duties and £4.4 billion in the form of disbursements to UK firms and households from schemes such as the Common Agricultural Policy. If we assume the UK government would compensate these firms and households for losing access to EU transfers, at least in the early years, this equates to a net contribution of £9 billion (figure 3), or 12% of the £73.5 billion government deficit forecast for 2015/16.xxix However, considering the other likely effects of Brexit on the UK economy, much of this 12% saving may be deployed or lost elsewhere.
First, as we saw in the section on trade, should a ‘hard Brexit’ scenario occur, in which the UK loses favourable rights of access to the European single market, a few manufacturing industries biased towards European sales, such as motor vehicles, may require some government support in order to offset the negative impacts of high tariffs under World Trade Organisation rules. If a ‘soft Brexit’ scenario occurred, the UK would almost certainly still contribute something to the EU budget: EEA members all make financial contributions in return for their participation in the single market and various regional policy programmes. For example, if the UK paid the same proportions as Norway then the £9 billion would be halved.
16
If you leave me now 2. Myth busting
In contrast to popular opinion, the empirical literature suggests immigrant workers from the EEA make net positive contributions to the UK’s fiscal position, especially recent immigrants that have moved to the UK since 2001 (mostly Eastern Europeans). A study from 2014 used the Labour Force Survey to show how immigrants from the EEA between 1995 and 2011 were 8% less likely than UK natives to receive state benefits and 3% less likely to live in social housing. The drop in probability was even larger for people who emigrated from the EEA since 2000.
The study goes on to estimate net fiscal contributions from immigrants, apportioning the share of government expenditure including the use of public goods. Unlike the majority of European countries, immigrants to the UK consume fewer public servicesxxx, largely due to EEA-born households having fewer children and retiring to their country of birth. Since 2001, UK natives have made a net negative fiscal contribution every year — their share of government expenditure outweighs the contribution they make from their taxes.
In 2011, the ratio of revenue to expenditure for the UK-born was just 0.8. For most of that period, EEA immigrants made net positive fiscal contributions, particularly immigrants who arrived since 2001. Even after a deterioration following the financial crisis, the revenue to expenditure ratio stood at 1.0 for Eastern European migrants and 1.4 for other developed EEA migrants in 2011.xxxi Households that migrated before 2001 from outside Europe have a negative impact on public finances.xxxii
Public underinvestmentWe could argue that public infrastructure has not grown at a rate that can accommodate a larger population and that this underinvestment will necessitate extra spending over the next decade that could turn the net positive contribution into a net negative one. There is also a risk that this positive contribution could turn negative if recent EEA immigrants do not retire to their country of birth, and therefore begin to use a greater share of public goods and services and receive more state benefits. However, based on current evidence, it does not appear that public finances are adversely affected by migrants from the EEA.
0
5
-10
-5
-15
10
15
20
25%
£13.7
Net e�ect £9.0
£3.0
£2.3
-£4.8
-£4.4
-£0.8
EU budget disbursements
UK rebateContribution from VAT receipts
Fee for collecting duties
Contribution based on GNI Contribution from customs receipts
Source: OBR, Datastream and Rathbones.
Figure 3: For better or worse UK contributions to and receipts from EU budget in 2014/15 (£ billions).
17
If you leave me now2. Myth busting
Lastly, although we do not expect the UK economy to collapse if voters choose Brexit, it is highly likely that the process of leaving would generate uncertainty. And uncertainty alone can be enough to reduce growth, and therefore government receipts. Credit rating agency S&P has stated that the UK would lose its first-class rating if Brexit becomes likely, citing the impact of economic uncertainty.xxxiii Work by the Bank of England suggests that a one standard deviation increase in its quantification of economic uncertainty, if maintained for three years, could lower the level of GDP by around 0.9%.
A one standard deviation increase is equivalent to that seen in 1992 after the UK left the Exchange Rate Mechanism, which is perhaps the only event in recent history analogous to the notion of Brexit. Using the Office for Budgetary Responsibility’s (OBR) estimates for the sensitivity of the fiscal balance to
economic growth,4 xxxiv we estimate this would translate into an additional borrowing requirement of £7.5 billion to £10 billion, although we would not expect this to come about in year one. To conclude, at face value it appears the UK would stand to make a fiscal saving equivalent to £9 billion in the current fiscal year. However, at least two-thirds of this saving would probably be eroded by state support of industry; continuing contributions to the EEA under a ‘soft Brexit’ scenario; losses from the positive fiscal contribution of new immigrant workers; or the temporary loss of output that might arise from economic uncertainty. Therefore, we do not expect gilt yields to fall (and prices rise) because investors demand less compensation for holding UK government debt.
4. A 1% change in the output gap changes net borrowing as a share of GDP by between 0.47% and 0.54%.
0
5
-5
10
-10
15
-15
20
-20
%
EquityLoans Bonds
2003–2008 2009–2012 2013 2014 2015 (Q1–Q3 only)
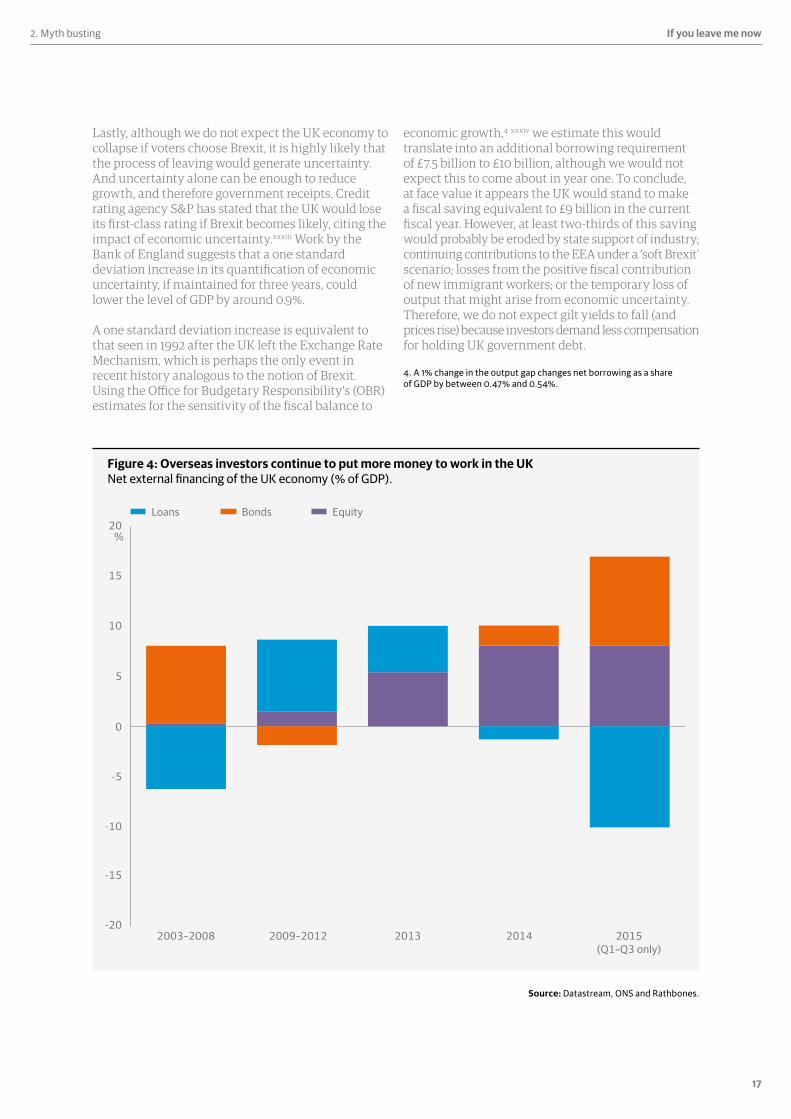
Source: Datastream, ONS and Rathbones.
Figure 4: Overseas investors continue to put more money to work in the UK Net external financing of the UK economy (% of GDP).
18
If you leave me now 2. Myth busting
2.5 InvestmentMyth 5: Foreign investors will withdraw from the UK if it leaves the EU.
The UK runs a current account deficit5, which requires funding from foreign capital. The nature of foreign funding is important when assessing the sustainability of a current account deficit. A deficit predominantly funded by debt can be unsustainable relative to a deficit funded by more permanent capital, particularly if that debt is used more for consumption than investment.
We categorise the most stable source of overseas capital as foreign direct investment (FDI) — typically a lasting ownership stake of more than 10%. Often this type of investment involves the construction of new operational facilities and so there are further direct benefits to the economy through job creation. Even if it is simply an acquisitive transfer of ownership, the economy can still benefit from potential productivity enhancements received through the introduction of new business practices and technologies.
5. Primarily, the value of its imports and investment income paid to overseas investors exceeds its exports and investment income received.
FDI is very important to the UK and occupies a rather prominent place in the campaign rhetoric. Many in the anti-Brexit camp aver investment into the UK would collapse if the UK leaves the EU. We believe the most likely outcome is more finely balanced.
Driving FDIResearch suggests the most important drivers of global FDI are market size and agglomeration (which describes the benefits when firms and industry networks locate near one another). Those that suggest FDI into the UK would collapse following Brexit believe market size is the predominant factor, assuming market size now refers to the free trade area under the Single Market Programme (SMP). However if this were true, we would expect to have seen a significant decoupling of the UK’s inward FDI from the ebb and flow of global FDI after the Single European Act in the late 1980s and the Maastricht Treaty in the early 1990s. This did not occur.
We do not want to dismiss the SMP as an important factor for attracting inward FDI and we discuss some pertinent evidence below. Yet we must emphasise the importance of agglomeration and other factors — such as the English language, legal system, labour market, tax regime and ease of doing business (figure 5) — in attracting overseas investment both before and after the various iterations of the European ecosystem.
Unfortunately, there are few studies on the effects of EU integration on FDI.xxxv A look at recent history shows inward investment flows fell in 2014 from the previous year. However, global FDI fell in 2014 too
Foreign direct investment is very important to the UK and occupies a rather prominentplace in the campaign rhetoric.
Ease of doing business
Starting a business
Protecting minority investors
Paying taxes
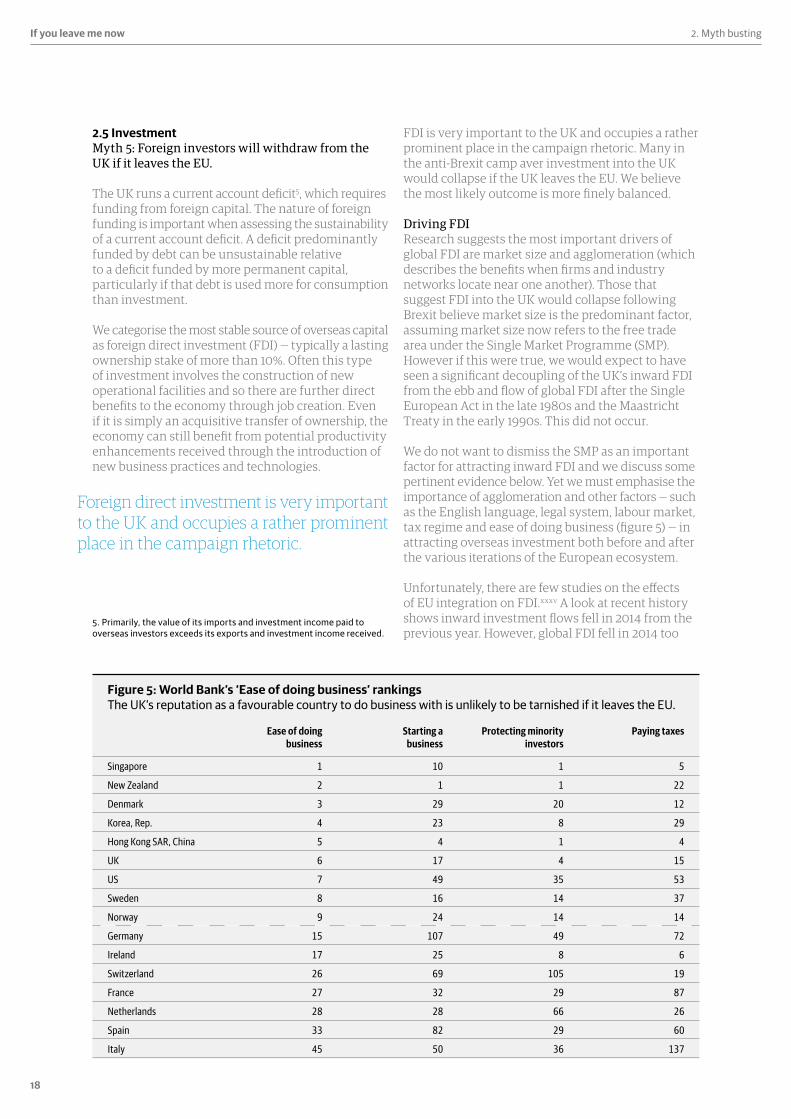
Singapore 1 10 1 5
New Zealand 2 1 1 22
Denmark 3 29 20 12
Korea, Rep. 4 23 8 29
Hong Kong SAR, China 5 4 1 4
UK 6 17 4 15
US 7 49 35 53
Sweden 8 16 14 37
Norway 9 24 14 14
Germany 15 107 49 72
Ireland 17 25 8 6
Switzerland 26 69 105 19
France 27 32 29 87
Netherlands 28 28 66 26
Spain 33 82 29 60
Italy 45 50 36 137
Figure 5: World Bank’s ‘Ease of doing business’ rankings The UK’s reputation as a favourable country to do business with is unlikely to be tarnished if it leaves the EU.
19
If you leave me now2. Myth busting
and investment into the UK fell by proportionally less. The nominal value of FDI flows is heavily skewed by a small number of multibillion pound deals, and is volatile as a result. An analysis of the number of FDI projects as well as the UK’s performance relative to other countries is arguably more helpful.
In 2014 the UK attracted a record number of 887 projects (an annual increase of 11%), and increased its share of the total pot of overseas investment flowing into Europe. Some 35% of all European headquarter moves were to London offices. The UK was also the main destination for investment in Europe from the US, Japan, Australia, Canada and India, and even France and Ireland, and even secured more manufacturing projects than Germany (164 versus 131). In figure 4 we add smaller cross-border transactions in equity and debt securities to the FDI data, alongside bank and non-bank loans. Again we see that 2015 was a strong year for UK inflows relative to outflows.
The referendum has not found its way on to the agenda surreptitiously. One should bear this in mind when reviewing the 2014 numbers. Even if Labour had won the 2015 election, it would probably not have been able to avoid a referendum given the groundswell of opinion.6 Opinion polls never offered a decisive steer, and it seems unlikely that this record investment was made blind to the prospect of a UK withdrawal from the EU.
Ernst & Young’s annual Attractiveness Survey for the UK in 2015 provides further evidence that the prospect of Brexit may not bear down on investment to the degree that some postulate. The report highlights that 54% of the 400 international companies surveyed expect the UK’s attractiveness to improve “significantly” or “slightly” over the next three years, a proportion that has stayed stable over the past few years. By way of comparison, when the same surveys were conducted in other European countries, no larger proportion of respondents believe the attractiveness of Germany will improve, while only 33% of international investors believe France will become more attractive.xxxvi
6. As the veteran politics professor, Vernon Bogdanor propounds ‘UKIP and the SNP, [are] the first popular grassroots insurgent movements in British politics since the War [and] owe their success to… a feeling of powerlessness, a belief by many English voters that the political class makes decisions on matters such as Europe and immigration without consulting the voters or considering their interests.’
The pull of soft technologySectoral trends also suggest investment into the UK is about far more than the SMP. Despite its under-representation in the UK stock market, soft technology is an important sector for FDI. In 2014 the UK received 199 FDI projects in this sector, placing it first in terms of number of projects (we do not have the data for the nominal value of these projects) and far ahead of business services, in second place, at 88 projects. The UK also receives 31% of all software investment projects into Europe from non-European enterprises.
A very lightly regulated sector, this is much more to do with the talent pool, investment networks and a tax regime that incentivises R&D and new enterprises (the Patent Box initiative, for example) than it is about Britain’s place in the SMP. Similarly, the UK receives the largest share of new R&D facilities in Europe. Forty-two percent of 808 multinational companies surveyed asserted that R&D is ‘the business function that will attract the most investment in Europe in the coming years’ far ahead of the second most important function, manufacturing, with just 17% of the vote.xxxvii Again, the UK’s image is unlikely to be tarnished by a withdrawal from the EU, although restrictions on the migration of tech talent from Europe could be damaging.
To date, at least, it is difficult to conclude that the prospect of Brexit is derailing investment flows, although of course the counterfactual may have been a more impressive out-turn in 2014. That said, the Ernst & Young survey does highlight that 72% of investors polled state that UK membership of the single market is at least ‘fairly’ important to the UK’s attractiveness as an investment destination. We have already seen US investment banks inform Parliament of the gravity with which they regard a British exit, while the Japanese government submitted an impassioned plea for the UK to remain a member, implying that UK-as-gateway-to-Europe was an essential function of the Japanese-UK economic relationship.xxxviii
12% of respondents to the Ernst & Young survey indicated they would reduce investment into the UK as a result of the possibility of Brexit, while a further 19% indicated that they intend to put investment plans on hold. Interestingly, when asked whether the UK would become more or less attractive as an investment destination if the UK were to leave the EU but retain access to the single market, 31% still responded that it would make the UK less attractive (we do not know if this is the same 31% as before). Perceptions also differ by origin of the investor: the 2015 Ernst & Young report uncovered that 72% of firms interviewed in North America thought reduced integration with the EU would actually make the UK a more attractive investment destination.
20
If you leave me now 2. Myth busting
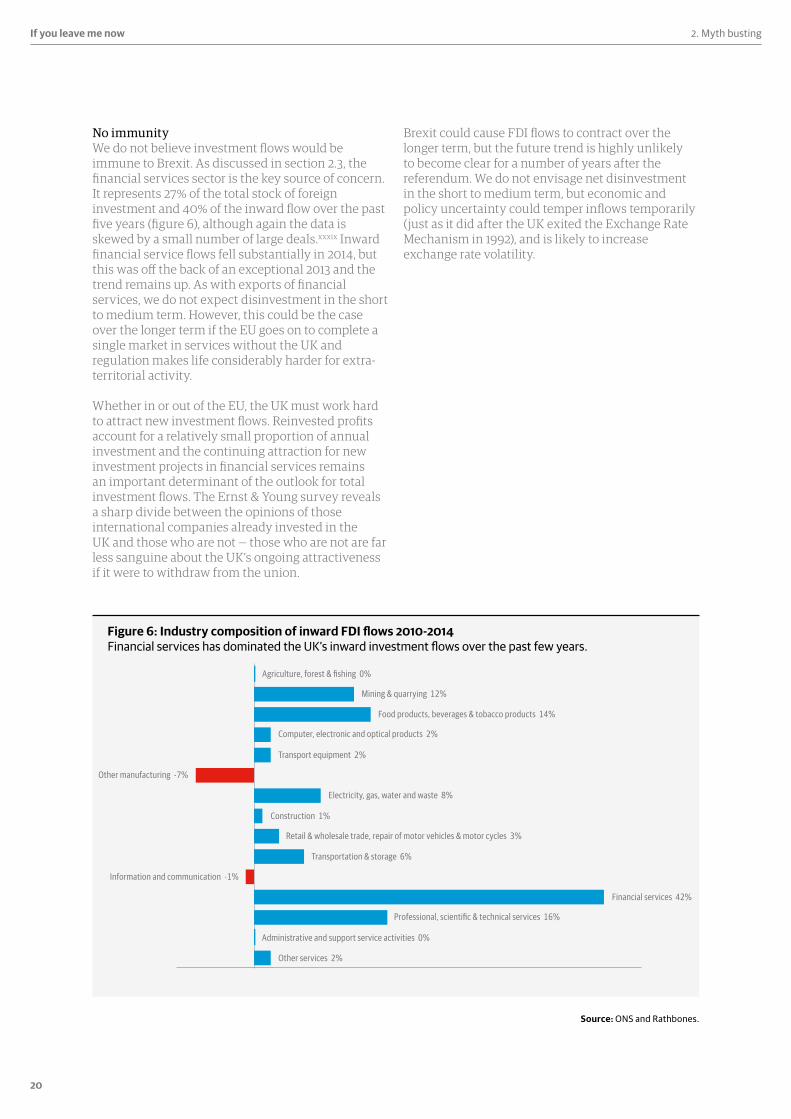
No immunityWe do not believe investment flows would be immune to Brexit. As discussed in section 2.3, the financial services sector is the key source of concern. It represents 27% of the total stock of foreign investment and 40% of the inward flow over the past five years (figure 6), although again the data is skewed by a small number of large deals.xxxix Inward financial service flows fell substantially in 2014, but this was off the back of an exceptional 2013 and the trend remains up. As with exports of financial services, we do not expect disinvestment in the short to medium term. However, this could be the case over the longer term if the EU goes on to complete a single market in services without the UK and regulation makes life considerably harder for extra-territorial activity.
Whether in or out of the EU, the UK must work hard to attract new investment flows. Reinvested profits account for a relatively small proportion of annual investment and the continuing attraction for new investment projects in financial services remains an important determinant of the outlook for total investment flows. The Ernst & Young survey reveals a sharp divide between the opinions of those international companies already invested in the UK and those who are not — those who are not are far less sanguine about the UK’s ongoing attractiveness if it were to withdraw from the union.
Brexit could cause FDI flows to contract over the longer term, but the future trend is highly unlikely to become clear for a number of years after the referendum. We do not envisage net disinvestment in the short to medium term, but economic and policy uncertainty could temper inflows temporarily (just as it did after the UK exited the Exchange Rate Mechanism in 1992), and is likely to increase exchange rate volatility.
Source: ONS and Rathbones.
Figure 6: Industry composition of inward FDI flows 2010-2014 Financial services has dominated the UK’s inward investment flows over the past few years.
Agriculture, forest & fishing 0%
Administrative and support service activities 0%
Mining & quarrying 12%
Food products, beverages & tobacco products 14%
Computer, electronic and optical products 2%
Transport equipment 2%
Other services 2%
Transportation & storage 6%
Professional, scientific & technical services 16%
Financial services 42%
Electricity, gas, water and waste 8%
Construction 1%
Retail & wholesale trade, repair of motor vehicles & motor cycles 3%
Other manufacturing -7%
Information and communication -1%
21
If you leave me now3. Long-term macro impact
Brexit? Future of EU? Outcome
60%
Completion
Further removalof barriers to trade and FDI
Completion
Further removalof barriers to trade and FDI
10%
‘Soft Brexit’ UK retains many rights of access to trade union and the free movement of capital
17%40% Stalling
Few further gains from removing barriers to trade and FDI
StallingFew further gains from removing barriers to trade and FDI
7%
Referendum66%
No
17%
60%
10%
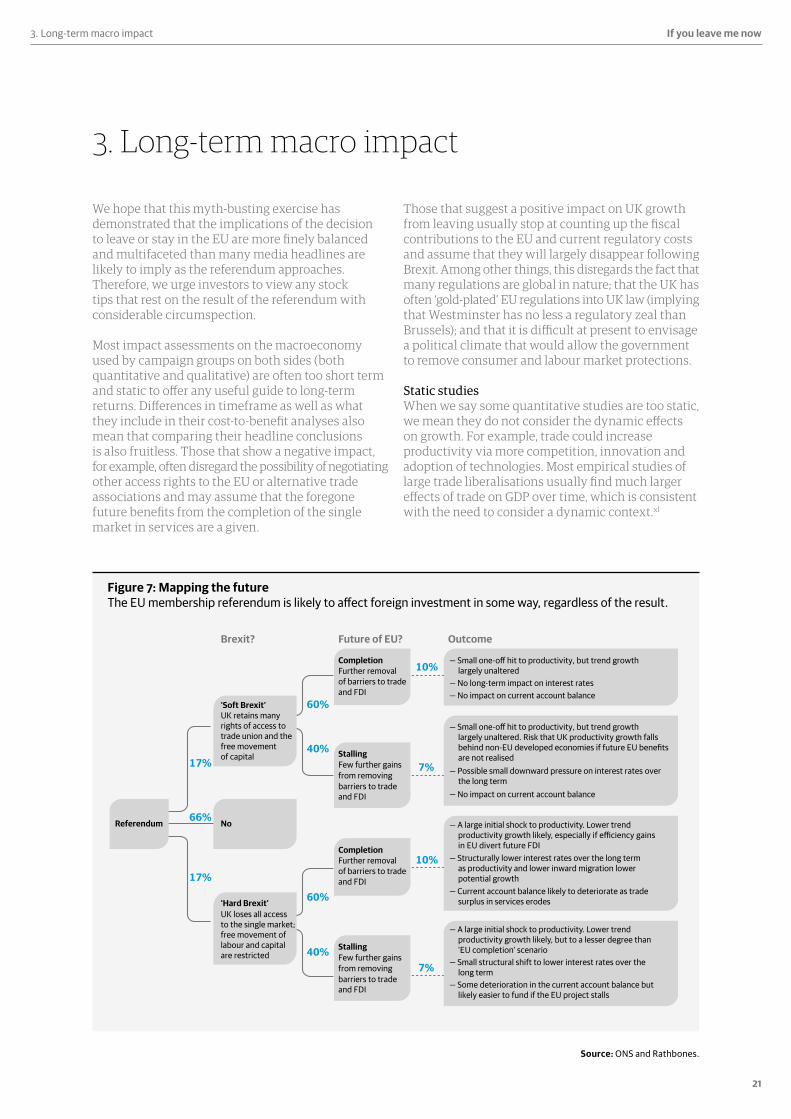
— A large initial shock to productivity. Lower trend productivity growth likely, especially if e�ciency gains in EU divert future FDI
— Structurally lower interest rates over the long term as productivity and lower inward migration lower potential growth
— Current account balance likely to deteriorate as trade surplus in services erodes‘Hard Brexit’
UK loses all access to the single market; free movement of labour and capital are restricted 40%
7%
— A large initial shock to productivity. Lower trend productivity growth likely, but to a lesser degree than 'EU completion' scenario
— Small structural shift to lower interest rates over the long term
— Some deterioration in the current account balance but likely easier to fund if the EU project stalls
— No long-term impact on interest rates— No impact on current account balance
— Small one-o� hit to productivity, but trend growth largely unaltered
— Possible small downward pressure on interest rates over the long term
— No impact on current account balance
— Small one-o� hit to productivity, but trend growth largely unaltered. Risk that UK productivity growth falls behind non-EU developed economies if future EU bene�ts are not realised
Source: ONS and Rathbones.
3. Long-term macro impact
We hope that this myth-busting exercise has demonstrated that the implications of the decision to leave or stay in the EU are more finely balanced and multifaceted than many media headlines are likely to imply as the referendum approaches. Therefore, we urge investors to view any stock tips that rest on the result of the referendum with considerable circumspection.
Most impact assessments on the macroeconomy used by campaign groups on both sides (both quantitative and qualitative) are often too short term and static to offer any useful guide to long-term returns. Differences in timeframe as well as what they include in their cost-to-benefit analyses also mean that comparing their headline conclusions is also fruitless. Those that show a negative impact, for example, often disregard the possibility of negotiating other access rights to the EU or alternative trade associations and may assume that the foregone future benefits from the completion of the single market in services are a given.
Those that suggest a positive impact on UK growth from leaving usually stop at counting up the fiscal contributions to the EU and current regulatory costs and assume that they will largely disappear following Brexit. Among other things, this disregards the fact that many regulations are global in nature; that the UK has often ‘gold-plated’ EU regulations into UK law (implying that Westminster has no less a regulatory zeal than Brussels); and that it is difficult at present to envisage a political climate that would allow the government to remove consumer and labour market protections.
Static studiesWhen we say some quantitative studies are too static, we mean they do not consider the dynamic effects on growth. For example, trade could increase productivity via more competition, innovation and adoption of technologies. Most empirical studies of large trade liberalisations usually find much larger effects of trade on GDP over time, which is consistent with the need to consider a dynamic context.xl
Figure 7: Mapping the future The EU membership referendum is likely to affect foreign investment in some way, regardless of the result.
22
If you leave me now 3. Long-term macro impact
In the petri-dish of economic theory, economic integration leads to considerable improvements in productivity over the long term.xli This is particularly the case for the removal of trade barriers. The reduction of costs to cross-border trade opens up markets to a greater degree of competition, which leads firms to set lower prices. In the medium term, firms react to this by looking for ways to reduce production costs — becoming more efficient.
This process leads to the least efficient firms exiting the market and resources are then reallocated to the surviving (or new) higher productivity companies and industries. If free movement of investment capital accompanies a true free trade environment, the reallocation of resource to more efficient firms is expedited. In the longer term, these larger, more productive companies invest more in innovation as a result of improved economies of scale.
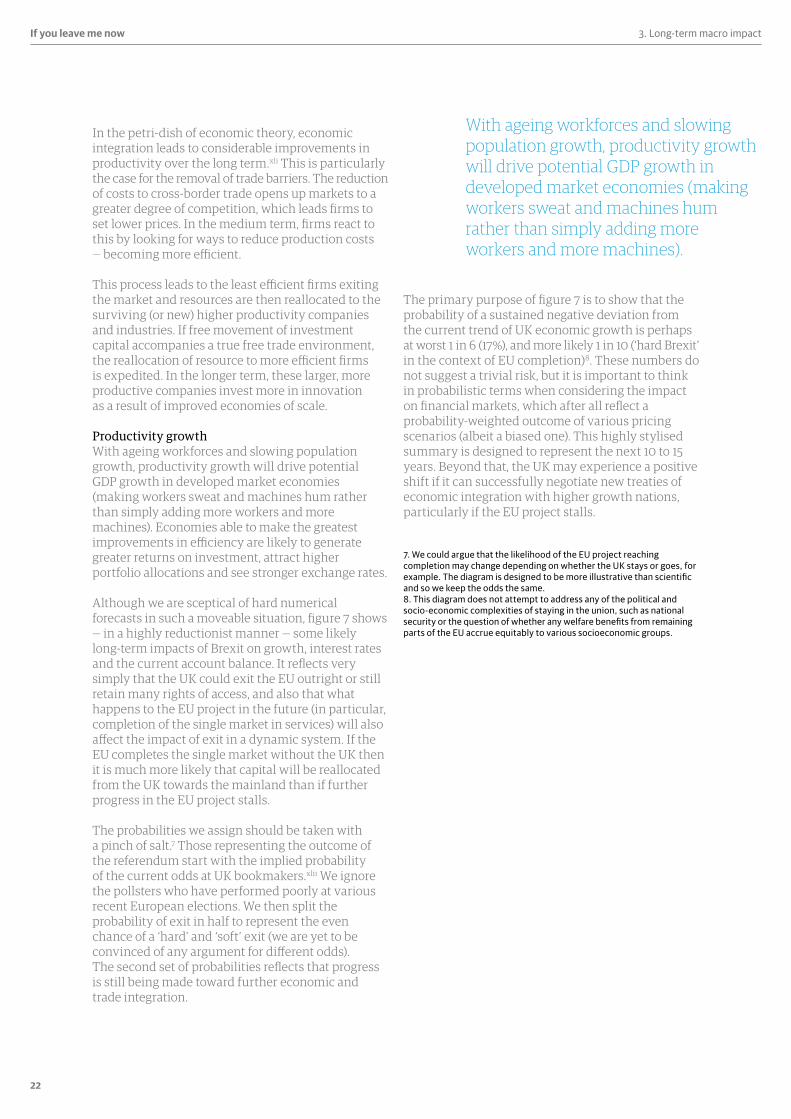
Productivity growthWith ageing workforces and slowing population growth, productivity growth will drive potential GDP growth in developed market economies (making workers sweat and machines hum rather than simply adding more workers and more machines). Economies able to make the greatest improvements in efficiency are likely to generate greater returns on investment, attract higher portfolio allocations and see stronger exchange rates.
Although we are sceptical of hard numerical forecasts in such a moveable situation, figure 7 shows — in a highly reductionist manner — some likely long-term impacts of Brexit on growth, interest rates and the current account balance. It reflects very simply that the UK could exit the EU outright or still retain many rights of access, and also that what happens to the EU project in the future (in particular, completion of the single market in services) will also affect the impact of exit in a dynamic system. If the EU completes the single market without the UK then it is much more likely that capital will be reallocated from the UK towards the mainland than if further progress in the EU project stalls.
The probabilities we assign should be taken with a pinch of salt.7 Those representing the outcome of the referendum start with the implied probability of the current odds at UK bookmakers.xlii We ignore the pollsters who have performed poorly at various recent European elections. We then split the probability of exit in half to represent the even chance of a ‘hard’ and ‘soft’ exit (we are yet to be convinced of any argument for different odds). The second set of probabilities reflects that progress is still being made toward further economic and trade integration.
The primary purpose of figure 7 is to show that the probability of a sustained negative deviation from the current trend of UK economic growth is perhaps at worst 1 in 6 (17%), and more likely 1 in 10 (‘hard Brexit’ in the context of EU completion)8. These numbers do not suggest a trivial risk, but it is important to think in probabilistic terms when considering the impact on financial markets, which after all reflect a probability-weighted outcome of various pricing scenarios (albeit a biased one). This highly stylised summary is designed to represent the next 10 to 15 years. Beyond that, the UK may experience a positive shift if it can successfully negotiate new treaties of economic integration with higher growth nations, particularly if the EU project stalls.
7. We could argue that the likelihood of the EU project reaching completion may change depending on whether the UK stays or goes, for example. The diagram is designed to be more illustrative than scientific and so we keep the odds the same.8. This diagram does not attempt to address any of the political and socio-economic complexities of staying in the union, such as national security or the question of whether any welfare benefits from remaining parts of the EU accrue equitably to various socioeconomic groups.
With ageing workforces and slowing population growth, productivity growth will drive potential GDP growth in developed market economies (making workers sweat and machines hum rather than simply adding more workers and more machines).
23
If you leave me now4. Short-term market impact
4. Short-term market impact
We do not expect any pervasive directional trends in financial markets in the run-up to the referendum or in the immediate aftermath if the UK votes to leave the EU, such is the finely balanced assortment of economic outcomes and the lack of clarity on the exact terms of withdrawal. That said, we do expect markets to react to the associated uncertainty.
Gilts are likely to be more sensitive to political uncertainty. In section 2.4 we discussed why we do not believe Brexit would facilitate enough of an improvement in the fiscal position to precipitate any sort of rerating. General economic uncertainty could place upward pressure on government bond yields.
After the UK left the Exchange Rate Mechanism (ERM) in 1992, foreign purchases of gilts evaporated, but did not reverse. Today, overseas holdings of gilts as a proportion of the total outstanding volume are close to an all-time high, if we strip out the Bank of England’s position from its quantitative easing (QE) programme, increasing the gilt market’s vulnerability to souring sentiment.
We can perform a threefold decomposition of sovereign bond yields into the expected path of real rates, inflation expectations and the term premium. Heightened uncertainty around Brexit affects the term premium, while expectations of a possible fall in sterling may also push up inflation expectations. The term premium has been pushed down since the financial crisis by the global savings glut and the effects of QE. Recently we have observed term premiums tracking eurozone cyclical indicators, the latter being a proxy for the need for more QE.
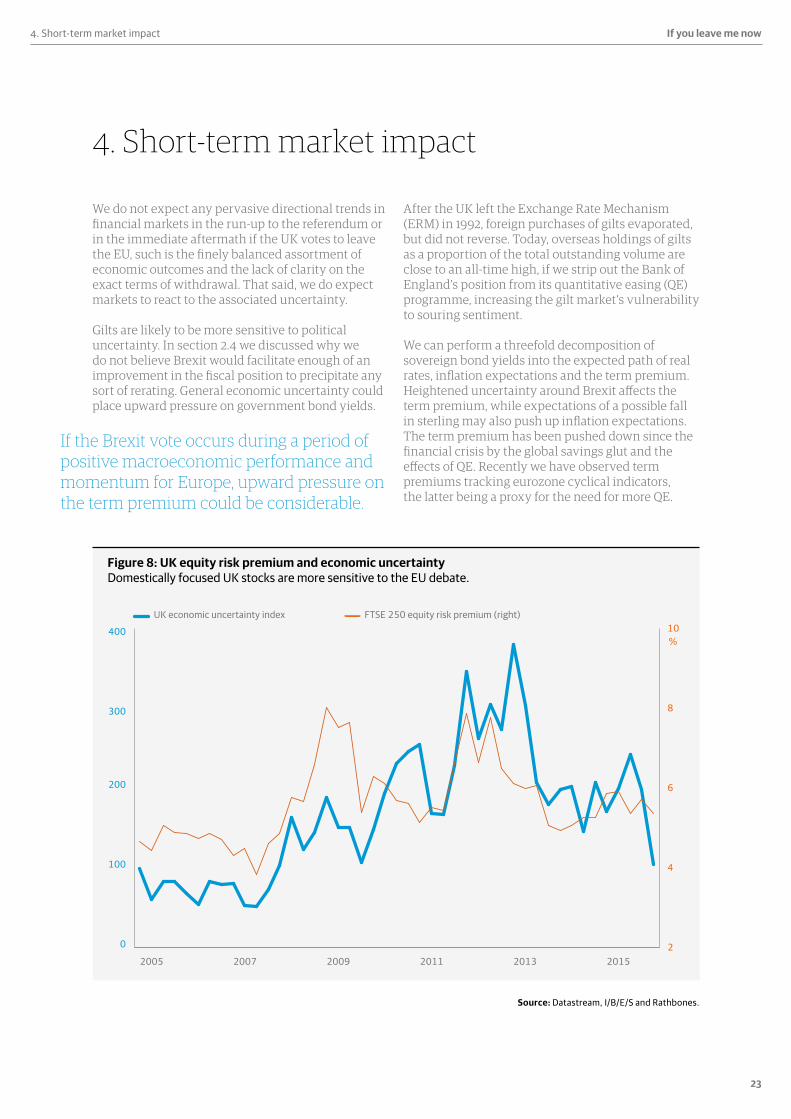
If the Brexit vote occurs during a period of positive macroeconomic performance and momentum for Europe, upward pressure on the term premium could be considerable.
UK economic uncertainty index FTSE 250 equity risk premium (right)
%
0
100
200
300
400
2015201320112009200720052
4
6
8
10
Source: Datastream, I/B/E/S and Rathbones.
Figure 8: UK equity risk premium and economic uncertainty Domestically focused UK stocks are more sensitive to the EU debate.
24
If you leave me now 4. Short-term market impact
If the Brexit vote occurs during a period of positive macroeconomic performance and momentum for Europe, upward pressure on the term premium could be considerable. However, the real interest rate component of gilt yields is likely to move in an offsetting direction, as the Bank of England offers a monetary policy response (likely forward guidance/‘lower for longer’) to offset or anticipate negative effects from economic uncertainty and confidence.
Stock market flowsForeign investment flows into UK equity markets did not reverse in the build-up or aftermath of the ERM crisis, even though the revenue of FTSE companies was considerably more domestically focused than it is today. Over three-quarters of FTSE 100 revenues stem from operations abroad so we do not expect a large amount of portfolio flow volatility. Only approximately one pound in every six is earned in Europe.
However, our market-implied measure of the equity risk premium for the more domestically oriented FTSE 250 index correlates with our Economic Policy Uncertainty Index (figure 8). Any increase in the likelihood of a ‘hard Brexit’ scenario would probably send premiums higher here (and, therefore, price-to-earnings multiples lower). Yet we did not see the volatility of domestically geared stocks increase relative to large cap stocks in either the run-up to September 2014’s Scottish referendum or May 2015’s general election. In section 2.3 we emphasised that the financial sector faces the largest risks. We are yet to see a break out in the relative volatility of banking stocks but this situation could change if the sector becomes a focus of pre-referendum debate.
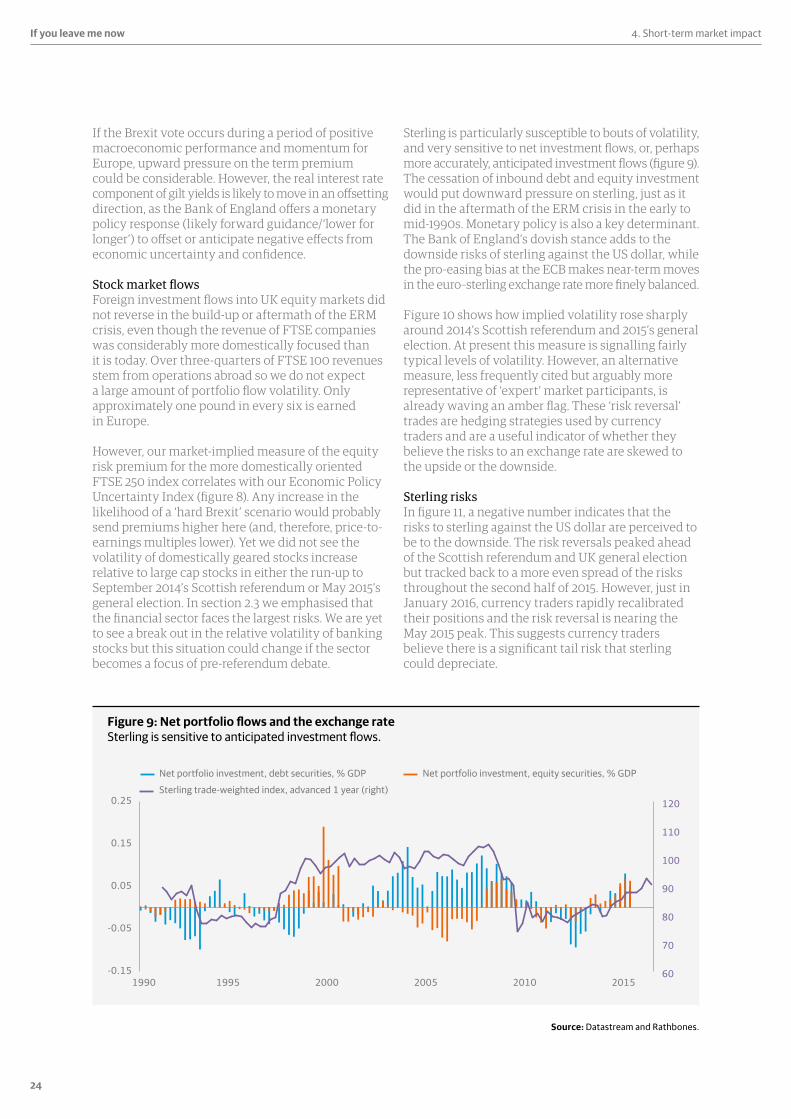
Sterling is particularly susceptible to bouts of volatility, and very sensitive to net investment flows, or, perhaps more accurately, anticipated investment flows (figure 9). The cessation of inbound debt and equity investment would put downward pressure on sterling, just as it did in the aftermath of the ERM crisis in the early to mid-1990s. Monetary policy is also a key determinant. The Bank of England’s dovish stance adds to the downside risks of sterling against the US dollar, while the pro-easing bias at the ECB makes near-term moves in the euro–sterling exchange rate more finely balanced.
Figure 10 shows how implied volatility rose sharply around 2014’s Scottish referendum and 2015’s general election. At present this measure is signalling fairly typical levels of volatility. However, an alternative measure, less frequently cited but arguably more representative of ‘expert’ market participants, is already waving an amber flag. These ‘risk reversal’ trades are hedging strategies used by currency traders and are a useful indicator of whether they believe the risks to an exchange rate are skewed to the upside or the downside.
Sterling risks In figure 11, a negative number indicates that the risks to sterling against the US dollar are perceived to be to the downside. The risk reversals peaked ahead of the Scottish referendum and UK general election but tracked back to a more even spread of the risks throughout the second half of 2015. However, just in January 2016, currency traders rapidly recalibrated their positions and the risk reversal is nearing the May 2015 peak. This suggests currency traders believe there is a significant tail risk that sterling could depreciate.
-0.15
-0.05
0.05
0.15
0.25
201520102005200019951990
Net portfolio investment, debt securities, % GDP Net portfolio investment, equity securities, % GDP
60
70
80
90
100
110
120Sterling trade-weighted index, advanced 1 year (right)
Source: Datastream and Rathbones.
Figure 9: Net portfolio flows and the exchange rate Sterling is sensitive to anticipated investment flows.
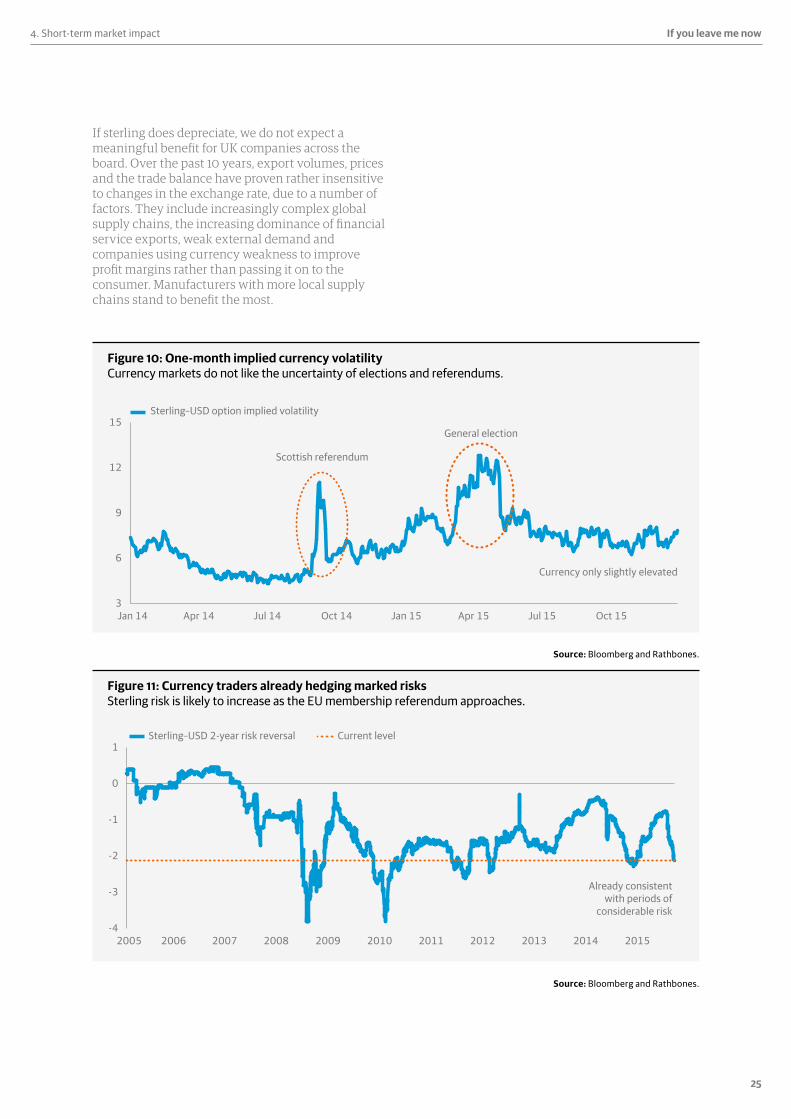
25
If you leave me now4. Short-term market impact
If sterling does depreciate, we do not expect a meaningful benefit for UK companies across the board. Over the past 10 years, export volumes, prices and the trade balance have proven rather insensitive to changes in the exchange rate, due to a number of factors. They include increasingly complex global supply chains, the increasing dominance of financial service exports, weak external demand and companies using currency weakness to improve profit margins rather than passing it on to the consumer. Manufacturers with more local supply chains stand to benefit the most.
3
6
9
12
15
Oct 15Jul 15Apr 15Jan 15Oct 14Jul 14Apr 14Jan 14
Sterling–USD option implied volatility
General election
Currency only slightly elevated
Scottish referendum
-4
-3
-2
-1
0
1
20152014201320122011201020092008200720062005
Sterling–USD 2-year risk reversal Current level
Already consistent with periods of
considerable risk
Source: Bloomberg and Rathbones.
Source: Bloomberg and Rathbones.
Figure 10: One-month implied currency volatility Currency markets do not like the uncertainty of elections and referendums.
Figure 11: Currency traders already hedging marked risks Sterling risk is likely to increase as the EU membership referendum approaches.
26
If you leave me now 5. Epilogue: a New Deal?
5. Epilogue: a New Deal?
On 19 February, the European Council (EC) released decisions reached by the Heads of State on a ‘new settlement’ for the UK with the EU, to take effect as and when the UK informs the Council of its decision to remain a member of the union. The decisions are structured around the four areas of concern outlined by Prime Minister David Cameron at the EC Summit in June 2015: fairness, competitiveness, sovereignty and free movement (although the EC has mollified ‘fairness’ to ‘economic governance’).
Cameron has trumpeted the deal as a victory, one that he believes will pacify swing-voters currently threatening to vote to leave. However, while it is a significant milestone on the path to the upcoming referendum, proving that the UK’s concerns are being listened to, the proposal for a mechanism to restrict social benefits to immigrants is unlikely to satisfy those for whom immigration is the driving force behind their anti-EU position.
Remember that the EU, as a standalone issue, consistently ranks well below most other subjects in the Ipsos MORI polls of public sentiment. Indeed, there is little evidence to suggest that economic governance, competitiveness and sovereignty matter to most voters, and the agreements reached on 19 February are likely too technical to resonate if they do. The issue of immigration is a very different matter, however, frequently ranking as the main topic with which the electorate are concerned. As such, we do not think Cameron’s new deal will materially alter the balance of likely outcomes.
The first three sections of the decision documents clarify the existing ordinance and represent an instrument for the interpretation of the extant treaties. The fourth requires legislative changes.
1. Economic governanceThis section confirms that special funds and crisis measures to safeguard the stability of the euro will not entail budget responsibility for non-euro states. Where the general budget is used, full reimbursement will be ensured. Further, additional macro-prudential policy (for example, banking regulation) imposed in view of preserving the euro will not be obligatory for non-euro states.
2. CompetitivenessThis section reaffirms a commitment to proceed towards the completion of the single market in goods, services and capital. This has always been the party line, and while the addendum is explicit that more needs to be done to encourage and facilitate entrepreneurism, it is otherwise rather vague.
3. SovereigntyThis section clarifies that the UK does not need to commit to further political integration and that the ‘right level’ of participation depends on whether integration would produce clear benefits for each nation’s citizens.
Although this does not require a change to the Treaties, the Heads of State have committed to incorporating this tenet into code at the time of their next revision. Importantly, the document confirms that current references to an ever closer union do not offer a legal basis for an extensive interpretation of the powers of the EU.
Recent polls show that immigration remains the key issue, and only large changes to existing legislation are likely to succeed in changing voters’ minds.
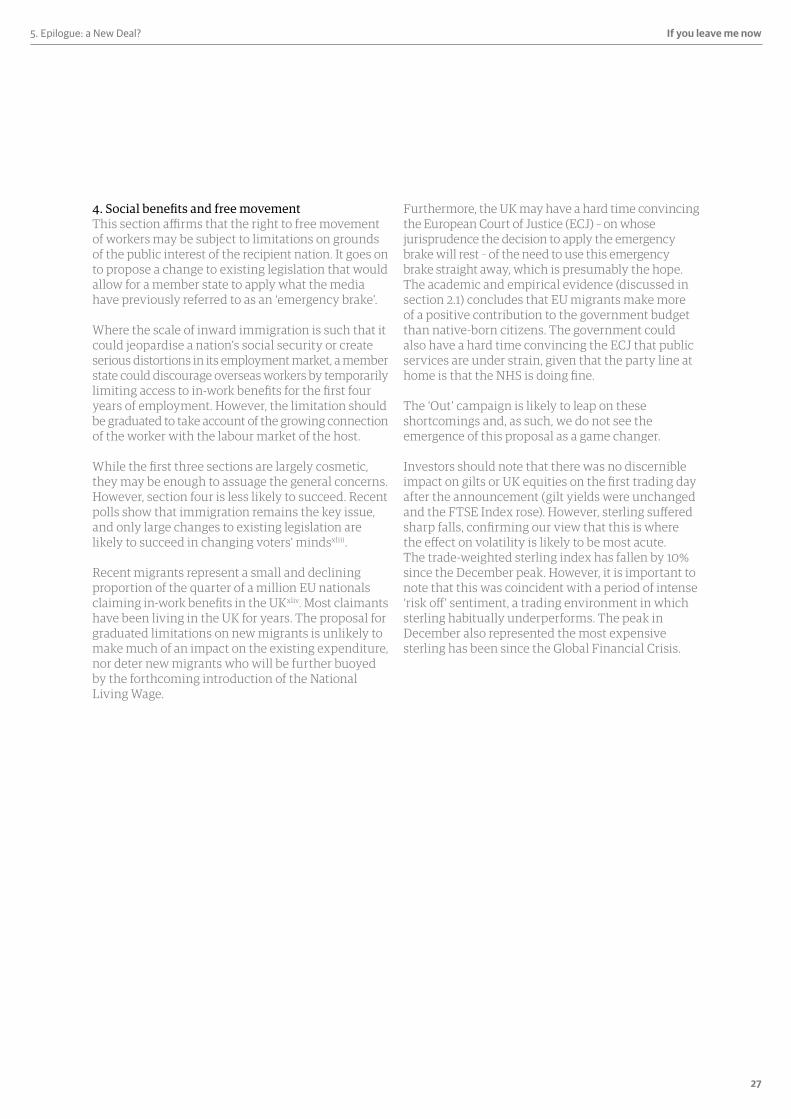
27
If you leave me now5. Epilogue: a New Deal?
4. Social benefits and free movementThis section affirms that the right to free movement of workers may be subject to limitations on grounds of the public interest of the recipient nation. It goes on to propose a change to existing legislation that would allow for a member state to apply what the media have previously referred to as an ‘emergency brake’.
Where the scale of inward immigration is such that it could jeopardise a nation’s social security or create serious distortions in its employment market, a member state could discourage overseas workers by temporarily limiting access to in-work benefits for the first four years of employment. However, the limitation should be graduated to take account of the growing connection of the worker with the labour market of the host.
While the first three sections are largely cosmetic, they may be enough to assuage the general concerns. However, section four is less likely to succeed. Recent polls show that immigration remains the key issue, and only large changes to existing legislation are likely to succeed in changing voters’ mindsxliii.
Recent migrants represent a small and declining proportion of the quarter of a million EU nationals claiming in-work benefits in the UKxliv. Most claimants have been living in the UK for years. The proposal for graduated limitations on new migrants is unlikely to make much of an impact on the existing expenditure, nor deter new migrants who will be further buoyed by the forthcoming introduction of the National Living Wage.
Furthermore, the UK may have a hard time convincing the European Court of Justice (ECJ) – on whose jurisprudence the decision to apply the emergency brake will rest – of the need to use this emergency brake straight away, which is presumably the hope. The academic and empirical evidence (discussed in section 2.1) concludes that EU migrants make more of a positive contribution to the government budget than native-born citizens. The government could also have a hard time convincing the ECJ that public services are under strain, given that the party line at home is that the NHS is doing fine.
The ‘Out’ campaign is likely to leap on these shortcomings and, as such, we do not see the emergence of this proposal as a game changer.
Investors should note that there was no discernible impact on gilts or UK equities on the first trading day after the announcement (gilt yields were unchanged and the FTSE Index rose). However, sterling suffered sharp falls, confirming our view that this is where the effect on volatility is likely to be most acute. The trade-weighted sterling index has fallen by 10% since the December peak. However, it is important to note that this was coincident with a period of intense ‘risk off’ sentiment, a trading environment in which sterling habitually underperforms. The peak in December also represented the most expensive sterling has been since the Global Financial Crisis.

28
If you leave me now Contact us
Contact us
If you would like further information or to arrange an initial meeting, please contact us on 020 7399 0000 or email [email protected]
Head Office1 Curzon Street, London W1J 5FB020 7399 0000
We also have offices at the following locations:
Aberdeen01224 218 180rathbones.com/aberdeen
Birmingham0121 233 2626rathbones.com/birmingham
Bristol0117 929 1919rathbones.com/bristol
Cambridge01223 229 229rathbones.com/cambridge
Chichester01243 775 373rathbones.com/chichester
Edinburgh0131 550 1350rathbones.com/edinburgh
Exeter01392 201 000rathbones.com/exeter
Glasgow0141 397 9900rathbones.com/glasgow
Kendal01539 561 457rathbones.com/kendal
Liverpool0151 236 6666rathbones.com/liverpool
Lymington01590 647 657rathbones.com/lymington
Newcastle0191 255 1440rathbones.com/newcastle
Winchester01962 857 000rathbones.com/winchester
For ethical investment services:Rathbone Greenbank Investments0117 930 3000rathbonegreenbank.com
For offshore investment management services:Rathbone Investment Management International01534 740 500rathboneimi.com
rathbones.com
@Rathbones1742
Rathbone Brothers PLC
29
If you leave me nowEndnotes
Endnotes
i. C. Dustmann & T. Frattini (2014), The fiscal effects of immigration to the UK, The Economic Journal, vol.124 issue 580
ii. J. Wadsworth (2015), Immigration and the UK labour market, Centre for Economic Performance 2015 Election Analysis Series
iii. Ibid.
iv. S. Dhingra, G. Ottavanio & T. Sampson (2015), Britain’s future in Europe, Centre for Economic Performance
v. S. Lemos & J. Portes (2008), New Labour? The impact of migration from central and eastern European countries on the UK labour market, IZA Discussion Paper Series No. 3756
vi. M. Manacorda, A. Manning & J. Wadsworth (2012), The impact of immigration on the structure of wages: theory and evidence from Britain, Journal of the European Economic Association 10(1)
vii. C. Dustmann, T. Frattini & I. Preston (2013), The effect of immigration along the distribution of wages, Review of Economic Studies 80
viii. IMF Direction of Trade statistics
ix. G. Ottaviano, J. P. Pessoa, T. Sampson & J. Van Reenen (2014), The costs and benefits of leaving the EU, CFS Working Paper No. 472
x. Ibid.
xi. http://tariffdata.wto.org/default.aspx (accessed 29.12.2015)
xii. Open Europe (2015), The impact of Brexit on the UK’s key export sectors
xiii. http://tariffdata.wto.org/default.aspx (accessed 29.12.2015)
xiv. H. Looi kee, A. Nicita & M. Olarreaga (2006), Estimating trade restrictiveness indices, World Bank Policy Research Working Paper 3840
xv. Ottaviano et al (2014)
xvi. Ibid.
xvii. H. Kox, A. Lejour & R. Montizaan (2005), The free movement of services within the EU, CPB Netherlands Bureau for Economic Policy Analysis WP 69
xviii. R. de Bruijin, H. Kox & A. Lejour (2006), The trade-induced effects of the services directive and the country of origin principle, ENEPRI Working paper no. 44
xix. V. Aussillous, H. Boumellassa, C. Emlinger & L. Fontagne (2011), The economic consequences for the UK and the EU of completing the single market, BIS Economics paper no. 11
xx. Ibid.
xxi. Open Europe http://openeurope.org.uk/intelligence/britain-and-the-eu/open-europe-poses-ten-questions-for-the-eu-referendum-remain-and-leave-campaigns/
xxii. Cf. C.S. Magee (2008), ‘New measure of trade creation and trade diversion’, Journal of International Economics, 75(2)
xxiii. Aussillous et al (2011)
xxiv. Centre for Swiss Politics (2013), Switzerland’s approach to EU engagement (commissioned by the City of London). We contacted the authors to clarify if both Swiss and UK included statutory instruments, but are yet to receive a reply at the time of publication.
xxv. Ibid.
xxvi. V. Miller (ed.) (2013), Leaving the EU, House of Commons Library Research Paper 13/42
xxvii. FTI Consulting
xxviii. V. Miller (ed.) (2013)
xxvix. Office for Budgetary Responsibility
xxx. OECD (2013), International Migration Outlook 2013
xxxi. While there is evidence that immigrant households are larger net recipients of the public purse than native households during downturns in the business cycle (such as 2003-2004 and 2007- 2009), this is explained by their employment status (for example, proportionately fewer on long term contracts). Once the data samples are adjusted for employment status, immigrant households again make larger net fiscal contributions than native equivalents. http://www.oecd.org/els/mig/IMO-2013-chap3-fiscal-impact-of-immigration.pdf
xxxii. Dustmann & Frattini (2014)
xxxiii. http://www.cnbc.com/2015/06/15/brexit-how-it-could-harm-the-uk-according-to-sp.html (accessed 30.12.2015)
xxxiv. T. Helgadottir, G. Chamberlin, P. Dhami, S. Farrington & J. Robins (2012), Cyclically adjusting the public finances, OBR Working paper No. 3
xxxv. Bank of England (2015), EU membership and the Bank of England
xxxvi. Ernst & Young, 2015 UK attractiveness survey
xxxvii. Ernst & Young, 2015 UK attractiveness survey
xxxviii. http://www.uk.emb-japan.go.jp/en/japanUK/ governmental/130711_UKEU.html
xxxix. Office for National Statistics
xl. Ottovanio et al (2014)
xli. M.J. Melitz (2003): ‘The Impact of Trade on Intra-Industry Reallocations and Aggregate Industry Productivity’, Econometrica, 71(6)
xlii. 12 bookmakers listed on http://www. oddschecker.com/politics/british-politics/eureferendum/ referendum-on-eu-membership-result (accessed 22.02.2016)
xliii. YouGov, Capital Economics.
xliv. http://www.niesr.ac.uk/blog/migrants-benefits-and-uks-renegotiation-questions-and-answers-updated#. VrCo1s6JBWa
30
If you leave me now
Important information
This document and the information within it does not constitute investment research or a research recommendation. Forecasts of future performance are not a reliable indicator of future performance. The above information represents the current and historic views of Rathbones’ strategic asset allocation committee in terms of weighting of asset classes, and should not be classed as research, a prediction or projection of market conditions or returns, or of guidance to investors on structuring their investments.
The opinions expressed and models provided within this document and the statements made are, due to the dynamic nature of the items discussed, valid only at the point of being published and are subject to change without notice, and their accuracy and completeness cannot be guaranteed. Figures shown above may be subject to rounding for illustrative purposes, and such rounding could have a material effect on asset weightings in the event that the proportions above were replicated by a potential investor.
Nothing in this document should be construed as a recommendation to purchase any product or service from any provider, shares or funds in any particular asset class or weighting, and you should always take appropriate independent advice from a professional, who has made an evaluation, at the point of investing.
The value of investments and the income generated by them can go down as well as up, as can the relative value and yields of different asset classes. Emerging or less mature markets or regimes may be volatile and subject to significant political and economic change. Hedge funds and other investment classes may not be subject to regulation or the protections afforded by the Financial Conduct Authority (FCA) or the Prudential Regulation Authority (PRA) regulatory regimes.
The asset allocation strategies included are provided as an indication of the benefits of strategic asset allocation and diversification in constructing a portfolio of investments, without provision of any views in terms of stock selection or fund selection. Changes to the basis of taxation or currency exchange rates, and the effects they may have on investments are not taken into account. The process of strategic asset allocation should underpin a subsequent stock selection process. Rathbones produces these strategies as guidance to its investment managers in the construction of client portfolios, which the investment managers combine with the specific circumstances, needs and objectives of their client, and will vary the asset allocation accordingly to provide a bespoke asset allocation for that client.
The asset allocation strategies included should not be regarded as a benchmark or measure of performance for any client portfolio. Rathbones will not, by virtue of distribution of this document, be responsible to any person for providing the protections afforded to clients for advising on any investment, strategy or scheme of investments. Neither Rathbones nor any associated company, director, representative or employee accepts any liability whatsoever for errors of fact, errors or differences of opinion or for forecasts or estimates or for any direct or consequential loss arising from the use of or reliance on information contained in this document, provided that nothing in this document shall exclude or restrict any duty or liability which Rathbones may have to its clients under the rules of FCA or the PRA.
We are covered by the Financial Services Compensation Scheme (FSCS). The FSCS can pay compensation to investors if a bank is unable to meet its financial obligations. For further information (including the amounts covered and the eligibility to claim) please refer to the FSCS website www.fscs.org.uk or call 020 7892 7300 or 0800 678 1100. Rathbone Investment Management International is the Registered Business Name of Rathbone Investment Management International Limited which is regulated by the Jersey Financial Services Commission. Registered office: 26 Esplanade, St. Helier, Jersey JE1 2RB. Company Registration No. 50503. Rathbone Investment Management International Limited is not authorised or regulated by the PRA or the FCA in the UK.
Rathbone Investment Management International Limited is not subject to the provisions of the UK Financial Services and Markets Act 2000 and the Financial Services Act 2012; and, investors entering into investment agreements with Rathbone Investment Management International Limited will not have the protections afforded by that Act or the rules and regulations made under it, including the UK FSCS. This document is not intended as an offer or solicitation for the purpose or sale of any financial instrument by Rathbone Investment Management International Limited.
Not for distribution in the United States. Copyright ©2016 Rathbone Brothers Plc. All rights reserved. No part of this document may be reproduced in whole or in part without express prior permission. Rathbones and Rathbone Greenbank Investments are trading names of Rathbone Investment Management Limited, which is authorised by the PRA and regulated by the FCA and the PRA. Registered Office: Port of Liverpool Building, Pier Head, Liverpool L3 1NW. Registered in England No. 01448919. Rathbone Investment Management Limited is a wholly owned subsidiary of Rathbone Brothers Plc.
Our logo and logo symbol are registered trademarks of Rathbone Brothers Plc.
Important information

For further information and updates on the Brexit debate, please visit rathbones.com

rathbones.com@Rathbones1742Rathbone Brothers Plc
The value of investments and income arising from them may fall as well as rise and you might get back less than you originally invested.
Rathbone Investment Management Limited is authorised by the Prudential Regulation Authority and regulated by the Financial Conduct Authority and the Prudential Regulation Authority.