Embed Size (px)
Citation preview

-
If you have issues viewing or accessing this file, please contact us at NCJRS.gov.
./;- ,/ 'I
,I' ~\
/
~URVEY AND COST ANALYSIS OF
EDUCATIONAL AND VOCATIONAL PROGRAMS AT i i'M., NNESOTA STATE PR I SON AND
STATE REFORMATORY FOR MEN
prepared by ~ Research and Information Systems
Minnesota Department of Corrections August 2, 1978
Summary
This study was undertaken to assess the participant cost and inmate uti lization of the educational and vocational programs at the Minnesota State Prison and the State Reformatory for Men and to provIde a more detai led accounting of program costs than is available through normal budget procedures. Part lof the report contains an analysis of educational and vocational programs at MSP and Part 1/ contains a similar analysis of programs at SRM.
Although there are many methods of analyzing the economic aspects of programs or agencies, the choice in this case was largely dl'ctated by the flnancial accounting procedures of the Department and by the record keeping system of the education unit at MSP and SRM.
The original plan cal led for a cost analysis of fiscal year 1976-77 expenditures for educational and vocational programs. This proved. to be impossible because records on student participation were not avai lable for the entire period. As a result, data was collected for the six month period, January I, 1977 through June 30, 1977. The average number of participants was calculated for this period and under the assumption that this ave~age would remain relatively constant was applied to the annual ex,penditures for the individual programs.
At MSP records were obtained from two educational ~rograms: the Adult Basic Education CABE) program and the General Education Development (GED) program. Both of these programs are designed for inmates who have not finished high school. The vocational programs in operating during the study period and for which data were collected are welding, drafting, office machine repair, Pro Shop, machine shop and Arts in Corrections. .
At SRM data were collected for thirteen vocational programs, six educational programs: the high school, Learning Resource Center, Adult Basic Education, General Education Development CGED), Title I, Mlgher Education, and the Arts in Corrections program.
Program expenditures were obtained from the Department of Corrections CDOC) accounting section, the central office education unit and the education directors at MSP and SRM. The cosf figures include instructor salary and fringe benefits, suppl ies and other instructional materials and administrative costs. These figures do not include indirect costs or capital expenditures. Such expenditures in the public school system increase the cost of elementary and secondary education by sixty percent. The tables below summarize program participati.on and cost per participant year.
S-2
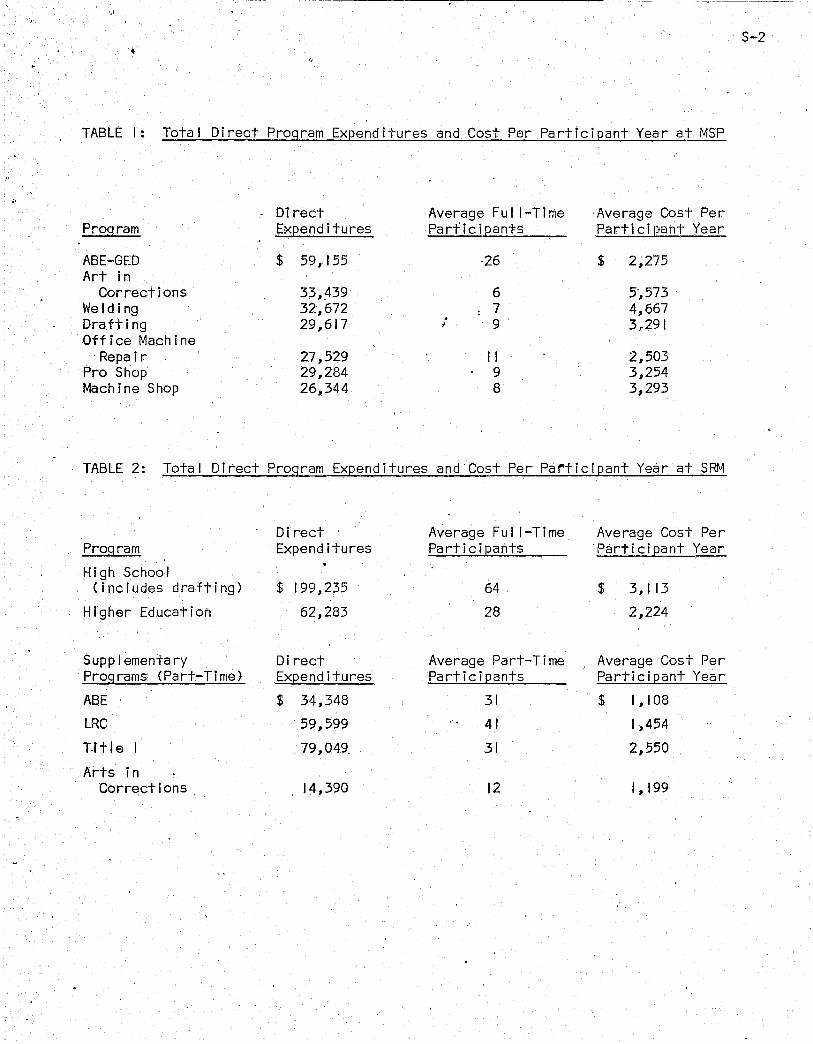
TABLE I: Total Direct Program Expenditures and Cost Per Participant Year at MSP
~
Direct Average Ful I-Time Average Cost Per Program Expenditures Participants Particil?ant Year
ABE-GED $ 59,155 ·26 $ 2,275 Art in
Corrections 33,.439 6 5',573 ' Welding 32,672 7 4,667 Draft i ng 29,617 f 9 3,,291 Office Machine
. Repa i r 27,529 II 2,503 Pro Shop 29,284 9 3,254 Machine Shop 26,344 8 3,293
, TABLE 2: Total Direct Program Expenditures and'CostPerParticipant Year at SRM
Direct Average Fu II-Time Average Cost Per Program Expenditures Pa rt i c i pants Participant Year
High School (includes drafting) $ 199,235 64 $ 3,113
Higher Education 62,283 28 2,224
Supp I ementary Direct Average Part-Time Average Cost Per Programs (Part-Time) Expenditures Participants Participant Year
ABE $ 34,348 31 $ 1,108
LRC 59,599 41 1,454
T.ttle 79,049, 31 2,550
Arts in Corrections 14,390 12 1,199
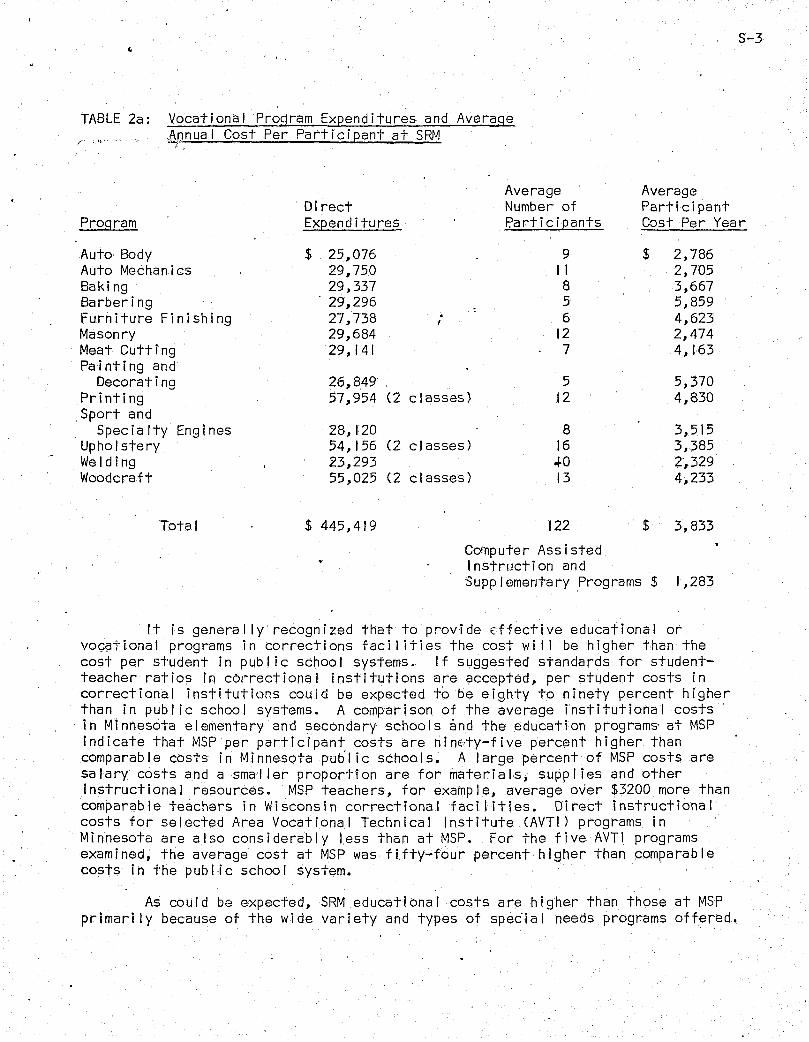
TABLE 2a: .... :.~.,
Vocational Program Expenditures and Average .;~pnual Cost Per Participant at SRM
Average Direct Number of
S-3
Average Participant
Program Expenditures P.a rt i c i pants Cost Per Year
Auto Body $ 25~076 9 $ 2~786 Auto Mechanics 29,750 II 2~705 Saki ng 29,337 8 .3,667 Barber i ng - 29,296 5 5,859 Furniture Finishing 27,738 . 6 4~623 I
Masonry 29,684 12 2~474 Meat Cutting 29~ 141 7 4,163 Painting and
Decorating 26,849 5 5~370 Printing 57,954 (2 classas) 12 4,830 Sport and
Specialty Engines 28,120 8 3~515 Upholstery 54,156 (2 classes) 16 3,385 Welding 23~293 ./-0 2'~329 Woodcraft 55,025 (2 classes) 13 4~233
Total $ 445~419 122 $ 3~833
Computer Assisted Instruction and Supplementary Programs $ 1,283
It is generally recognized that to provide effective educational or vO'~9tional programs in corrections faci I ities the cost wi II be higher than the cost per student in publ ic school systems. If suggested standards for studentteacher ratios in cOI-rectional institutions are accepted~ per student costs in correctional institutions could be expected to be eighty to ninety percent higher than in publ ic school systems. A comparison of the average institutional costs in Minnesota elementary and secondary schools and the education programs' at MSP indicate that MSP per participant costs are nin&ty-five percent higher than comparable costs in Minnesota publ ic schools. A large percent of MSP costs are salary costs and a smaller propor-i-ion are for materials, supplies and other instructional resources. MSP teachers, for example~ average over $3200 more than comparable teachers in Wisconsin correctional faci lities. Direct instructional costs for selected Area Vocational Technical Institute CAVTI) programs in Minnesota are also considerably I.ess than at MSP. For the five AVTI programs examined, the average cost at MSP was fifty-four percent higher than comparable costs in the publ ic school system.
As could be expected, SRM educational costs are higher than those at MSP primarily because of the wide variety and types of spe~ial needs programs offered.
----- - -------
, "
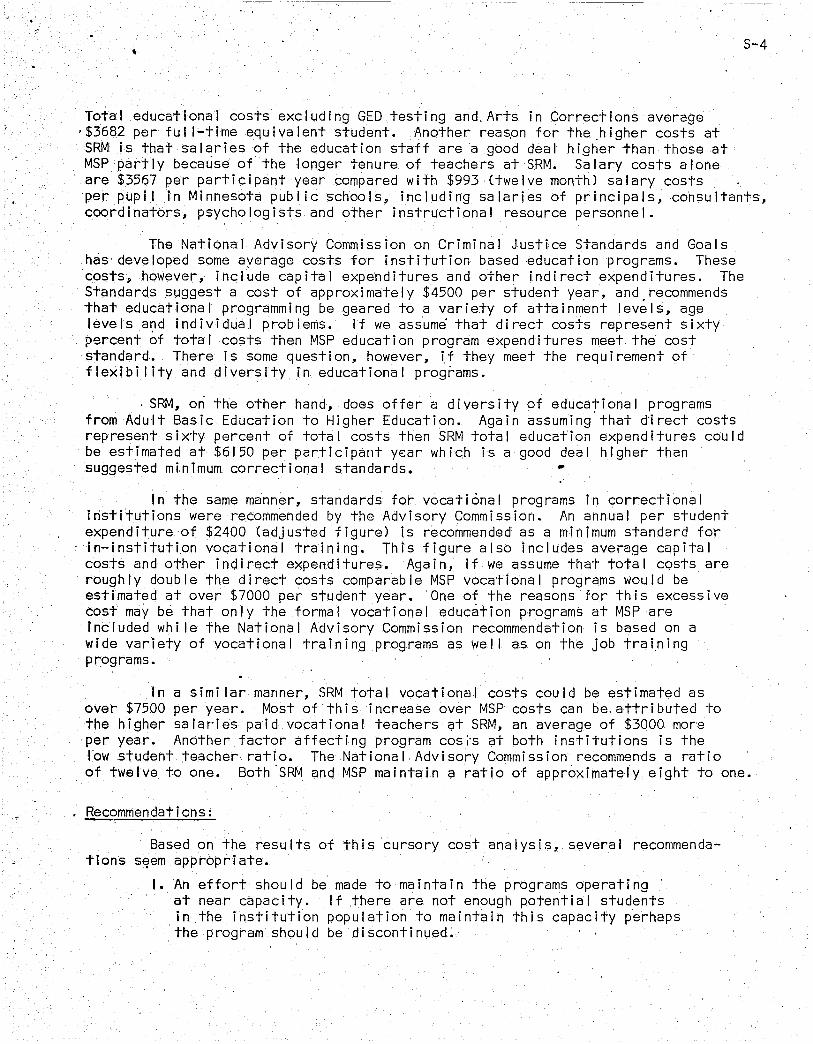
Total educational costs excluding GED testing and. Arts in Corrections average ,$3682 per ful I-time equivalent student. Another reas.on for the ,higher costs at
SRM is that salaries of the education staff area good deal higher than those at MSP partly because of the longer tenure of teachers at SRM. Salary costs alone are $3567 per participant year compared with $993 (twelve month) salary costs
S-4
per pupil in Minnesota public schools, including salaries of principals,consultants, coordinators, psychologists and other instructional resource personnel.
The National Advisory Commission on Criminal Justice Standards and Goals has developed some ayerage costs for institution based education programs. These costs, however, include capital expenditures and other indirect expenditures. The Standards suggest a cost of approximately $4500 per student year, and recommends that educational programming be geared to a variety of attainment levels, age levels a~d individual problems. If we assume that direct costs represent sixty percent of total costs then MSP education program expenditures meet the cost standard. There is some question, however, if they meet the requirement of flexibi lity and diversity in educational programs •
. SRM, on the other hand, does offer a diversity of educational programs from Adult Basic Education to Higher Education. Again assuming that d'irect costs represent sixty percent of total costs then SRM total education expenditures could be estimated at $6150 per participant year which is a good deal higher than suggested minimum correctional standards. ~
In the same manner, standards for vocational programs in correctional institutions were recommended by the Advisory Commission. An annual per student expenditure of $2400 (adjusted figure) is recommended as a minimum standard for in-instituti,on vocational training. This figure also includes average capital costs and other indirect expenditures. Again, if we assume that total costs are roughly double the direct costs comparable MSP vocational programs would be estimated at over $7000 per student year. One of the reasons for this excessive cost may be that only the formal vocational education programs at MSP are included whi Ie the National Advisory Commission recommendation is based on a wide variety of vocational training programs as wei I as on the job training programs.
In a simi lar manner, SRM total vocational costs could be estimated as over $7500 per year. Most of this increase over MSP costs can be, attributed to the higher salar"ies paid vocational teachers <;It SRM, an average of $3000 mer's per year. Another factor affecting program cosi's at both institutions is the I~w student teacher ratio. The National Advisory Commission recommends a ratio of twelve to one. Both 'SRM and MSP maintain a ratio of approximately eight to one.
Recommendations:
Based on the results of this cursory cost analysis, several recommendations s~em appropriate.
I.An effort should be made to maintain the programs operating' at near capacity. If there are not enough potential students in the instftution population to maintain this capacity perhaps the program should be discontinued.
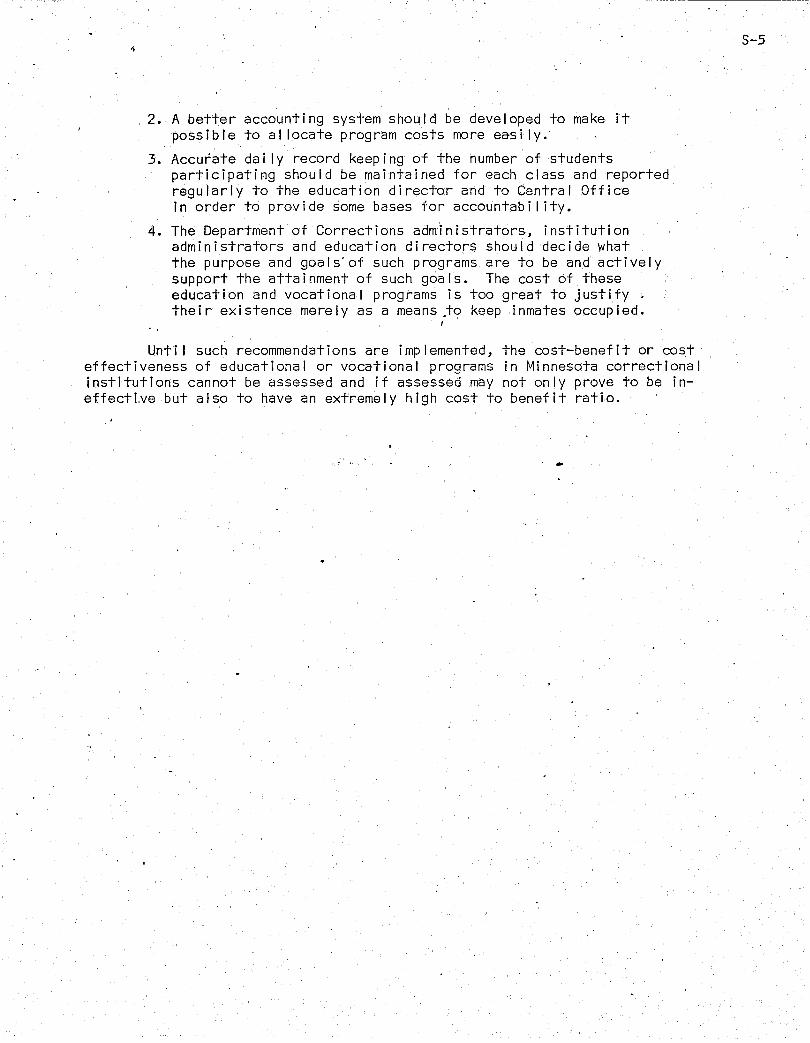
2. A better accounting system should be developed to make it possible to al locate program costs more easi Iy.
3. Accurate dai Iy record keeping of the number of students participating should be maintained for each class and reported regularly to the education director and to Central Office in order to prov i de some bases ·f"or accountab iii ty.
4. The Department of Corrections administrators, institution administrators and education directors should decide what the purpose and goals·of such programs are to be and actively support the attainment of such goals. The cost of these education and vocational programs is too great to justify. their existence merely as a means .to keep inmates occupied.
I
Unti I such recommendations are implemented, the cost-benefit or cost effectiveness of educational or vocational programs in Minnesota correctional institutions cannot be assessed and if assessed may not only prove to be ineffecti~e but also to have an extremely high cost to benefit ratio.
S-5

• "
PART I
MINNESOTA STATE PRISON
'1 ntrod uct ion
The cost of crimin~ljustice activities has increased over 200 percent in the last decade. Increased publ ic concern over the rising crime rate resulted in vast out-pourings of federal monies for criminal justice programs. More recently, studies have questioned the concept of offender rehabi litation programs. At a time when other social programs are demanding more and more of the tax dollar, there is increased interest in an assessment of the results of government expenditures. When budget requests exceed the avai lable revenue, resources must be al located on the basis of need, effectiveness and maximum uti lization of resources.
Although there are many other programs and services that demand a share of the corrections dollar in Minnesota, this study is concerned only with the assessment of costs of the educational and vocational programs at the Minnesota State Prison CMSP). The major concern is not the lack of resourc~s, but rather the uti I ization of the resources that do exist. Expanding educational and vocational programs or establ ishing new ones at MSP makes sense only if the programs that already exist are being fully uti I ized. -It was with these concerns in mind that this study was undertaken.
Background .. There are four major types of economic analyses that have application
for decision making. A common form is simple cost analysis. This type of cost analysis does not have the decision making importance of the more sophisticated measures, but is often a necessary first step. Cost analysis should consider al I direct and indirect costs, operating costs, support services costs, capital costs and other non-appropriated funds expended. The kinds of costs and detai Is used depend to a large extent on the avai labi I ity of detai led ~udget items and' the purpose of the analysis. A cursory cost analysis may use only direct ·recu rr i ng costs.
The second major form of economic analysis is comparative cost analysis. This type of analysis may be used to compare costs of two or more agencies or programs at some peint in time or a single program at two points in time. There are certain difficulties in~erent in comparing two agencies that must be considered -- differing start-up times, quantity of service provided or value of donated services. Often these kinds of detailed expenditures are not avai lable or not totally comparable.
The third major type of economic analysis is cost effectiveness. This method relates cost to some physical measure of program output. A primary role of this kind of analysis is to provide information on additional resources needed to bring about a specified level of results. To determine cost effectiveness it is necessary to have a clear statement of objectives and goals of the pr:ogram.
Cost Benefit analysis is an attempt to apply economic criteria to output and requires translating benefits into dollar figures. For example, benefit to the offender derived from an educational program, might be translated into increased earning power, thereby increasing benefit to society by payment of taxes, removal from welfare rol Is and presumably el iminating further contact with the Criminal Justice System.
"
, 4
AI I these methods of analyzing the economic aspects of programs or agencies are difficult under budgeting and accounting procedures normally used by governmental agencies and, in some instances, proper cost al locations are almost impossible. The method chosen depends to a large extent on the kinds of cost figures it is possible to obtC1h1.,. the types of output measures designated and the purpose the analysis is to serve.
Related Research
Some efforts have been made recently to develop cost figures for educational and vocational programs in correctional institutions throughout the country. These figures are related to the standards suggested for such programs by the Unit1d States National ~dvis9ry Commission on Criminal Justice Standards and Goals. , I
It is generally recognized that to provide effective academic educational programs in correctional facilities, the cost must be higher than the cost per pupi I in a normal academic environment. According to standards suggested by the National Advisory Commission on Criminal Justice Standards and Goals, minimum standards would require a $4500 to.. $4800 annual ~xpenditur'e per participant. 2 (~igures adjusted to 1977 do! lars.) These cost estimates, however, include capital and indirect costs which are not included in the rnstitutional costs.
2.
These figures assume a twenty-five percent participatron rate in educQtional p~ograms. Costs for in-institution vocational training wi I I also be considerably higher than comparable costs in the public system. The National Advisory Committee suggests a minimum standard of $2400 per puprl for prison vocational training programs. These estimates are based on a participation rate of fifteen percent of the institution population. In publ ic elfilmentary and secondary schools a . class size of twenty-five to thirty is generally felt to be the maximum size. Some eVfdence suggests that for the disadvantaged slow learners and dropouts, a redrlced class size is more effective. Since many prison inmates fal I into these categories, the Advisory Commission recommends a ratio of twelve students to each teacher for educational and vocational programs in correctional faci I iti es.
There is co~siderable disagreement about the economic benefits of academic education programs in correctional institutions. Often benefits are realized only if the inmate gets a GED or completes high school, because a high school graduation or equivalency is often a major credential for entering the labor market. Thus, raising the reading grade level several years may have no real impact on the future of the inmate once he is released. It has been estimated, -however, that a high school diploma returns fifteen to twenty percent in increased I ifetime ea~nings.3
At MSP, twenty-nine percent of those terminated from the education programs received a GED. This is a comparatively high completion rate. In the Alabama Draper Cnrrectional Center, Intensive Education Project, nineteen per-cent of the inmates enrol led passed their GED test. 4 In Cal ifornia Department of Corrections faci lities the percentage of inmates completing the GED program averaged sixteen percent. 5
The case for economic benefits of vocational programs in correctional , Institutions does not fare a good deal better. Vocational training has
traditionally b~en a part of rehabi I itation efforts, particularly for younger inmates, but has had less emphasis in prisons hQusing older inmates. Such programs are designed to give a student the ski I I necessary for successful competition in our society. The benefit for the inmate is thought to come from increased earnings on the outside. It has not, however, been demonstrated that prison vocational training has any impact on the offender's work behavior outside the institution. A 1962 study of a Cal ifornia Prison vocational training program found that f.ewer than one-third of the graduates of a training program were employed in the industry or related ski I I for which trained. 5 In the Draper Correctional Center training program it was found that the proportion of released offenders working in jobs related t9 their training was seventeen to thirty-t.wo percent depending on the type of training. 2 The same study found that an untrained control grou~ performed as wei I as any trainee group in terms of both employment and income. In a fol low-up of graduates of the Sandstone Vocational Training School, it was found that sixty-one percent were employed seven months Gfter completion6 and of these forty-three percent were employed in their special ski II area.
Method
This analysis was initiated to provide a more detarled accounting of program c~sts than is avai lable through normal b~dget procedures. The goal of the study, then, is to provide the Department of Corrections with an analysis of comparative costs of the several programs and suggest ways to make more effective use of the resources aVqi lable.
The original plan cal1ed for a cost analysis of fiscal year 1976-77 pl'ogram expenditures. The depth of the cost analysis would be dependent on the avai labi I ity of detai led expenditures for eacr of the programs. It was soon decided that the financial accounting procedures used by the DOC did not permit a detai led accounting of costs. For example, support services such as payrol I and accounting, personnel services ~nd othen central ized services or overhead costs could not be.isolated for specific programs. Capital expenditures for start-up ·costs, repair or new equipment are not included since state accounting procedures do not always identify these costs as program related. Even direct program costs are simply grouped into vocational and ·academic budget items. However, with the help of the Central Office accounting staff and the Minnesota State Prison educational staff, it was possible to al locate these direct costs to t~e individual programs. In addition, funds from the Central Office budget al located to institutional programs. were isolated and included in program costs. Nevertheless, the cost data used here is cursory at best and includes only direct operating costs. It is estimated that as a minimum, costs would have to be increased by approximately sixty percent to incl~de indirect costs, support services and capital expenditures.
'The second problem encountered in this attempt to review educational and vocational programs was the lack of adequate record keeping of clients served. The education staff at MSP acknowledged that it. would be virtually impossible to obtain records of inmates participating In these programs prior
3.
, "
to January I, 1977. It was agreed, then, that student data would be collected , for a six month period and the average number of participants d,uring that period
would be used to calculate the annual cost per participant. This method would provide a reliable figure except in such cases where a great difference in the number of participants during the first and last half ~f the year existed. This did not appear to be the case in any of the programs reviewed.
Information on students was collected by the teachers involved ~nd included test scores when avai lable, the date of admission and termination, time in program and ,reason for termination. Data was collected on two education programs: the ABE (Adult Basic Education) and the GED (General Education Development) programs. There were six vocational programs for which ,data was ava i I ab Ie: we I ding,. draft i.ng, off i ce mach i ne repa i r, arts in correcti ons, machine ,shop and the Pro shop (prosthetics repair shop).
Data Presentation
During the fiscal year under study there were only two educational p~ograms avai lable at MSP, both designed for inmates who had not finished high school. The Adult Basic Education program is intended for students who read at or below the eighth grade level and is designed to improve their ski I Is sufficiently to enter into the GED program. ..
In 1977 about seventeen percent of MSP inmates had completed eight grades G>r less but many others also scored below the eighth grade level. Over: fifty percent had not finished high school. One would expect then, that twenty to twenty-five percent of the prison population would be el.igible for ABE and an
/, additional twenty-five to thirty percent would be el igible f0r the GED program. Ye:t, at anyone ti'me, less th2ln three percent were enrolled in ABE or GED programs. Vocat i ona I programs WE3re not ut iii zed much better. Less than six percent of the inmates were enrol led in vocational programs at anyone time.
The total number of inmates participating ton an educational or vocational program at MSP was 232 during the six month period for which data were collected. This represents about seventeen percent of the total prison population during fhat peri'od. A few inmates participated In more than one p~ogram; primari Iy those who completed the Adult Basic Education and moved {'nto the GED program.
In spite of the establ ished need for ABE and GED programs and the lack of vocational ski I Is of· many of the inmates, participation in these programs remains refatively low. It appears that vocational as w~1 I as educational programs must compete with the needs of industry and the higher pay avai lable in the private industries program. Also, the prison population is somewhat older than that a,t the State Reformatory for Men (SRtvD and many inmates may have tried various training programs before. Inmates who had not completed high sc~ool before incarceration face simi lar problems. Many may have had repeated attempts and failures in the public sch901 system, and are no longer interested. Whatever th~ reasons, the low rate of participation tends to increase the cost per inmate participant of such programs. , ,
The fol lowing tables indicate the number of inmates ent~ring and leaving the various programs during the six month' period and the mean raw scores and percentile rank received on the standardized AGeT Jest.
4.
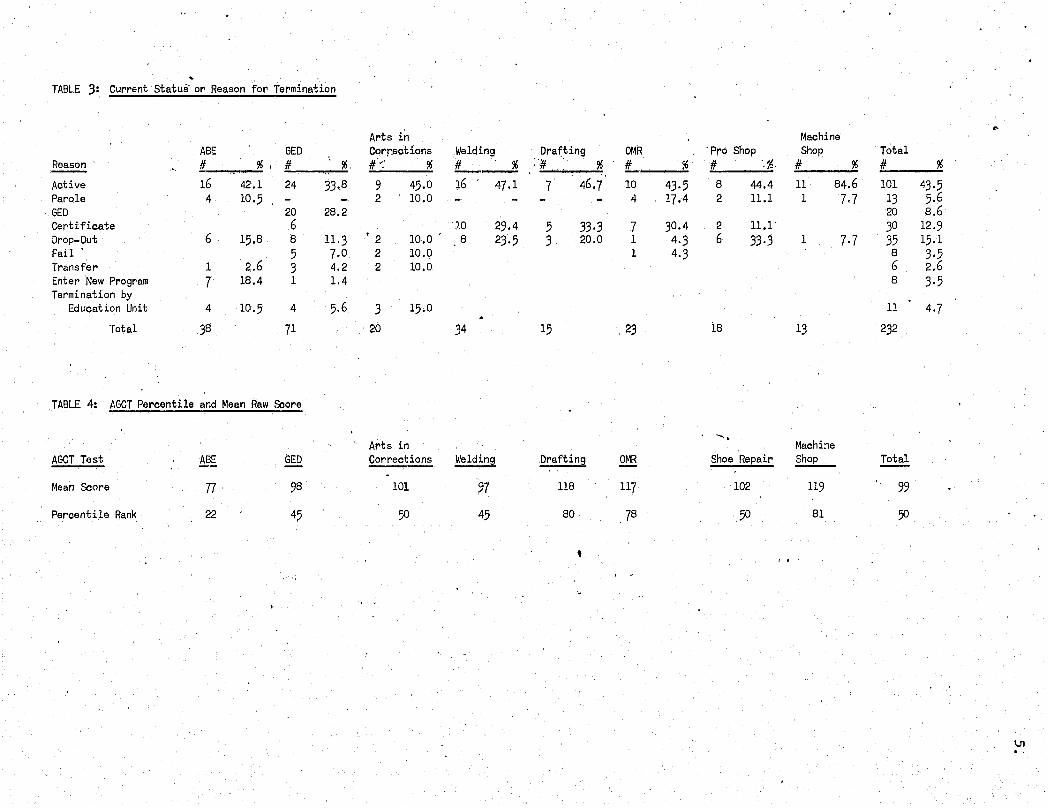
TABLE 3: Current status or Reason for Termination
Arts in Machine ABE GED Corrections Welding Dra~ting OMR 'Pro Shop Shop Total
Reason 1/ -11, 1/ % #',,: % 1/ % .:11. % 1/ % # ',"-, 1/ % 1/ % -:--
Active 16 42.1 24 33.8 9 45.0 16 47·1 7 46.7 10 43·5 8 44.4 11 84.6 101 43·5 Parole 4 10·5 2 10.0 4 17.4 2 11.1 1 7·7 13 5.6 GED 20 28.2 20 8.6 Certi ficate 6 J.O 29.4 5 33·3 7 30.4 2 11.1 30 12·9 Drop-Out 6 15.8 8 11·3 • 2 10.0 . 8 23·5 3 20.0 1 4·3 6 33·3 1 7·7 35 15·1 Fail . 5 7.0 2 10.0 1 4·3 8 3·5 Transfer 1 2.6 3 4.2 2 10.0 6 2.6 Enter New Program 7 18.4 1 1.4 8 3·5 Termination by
Education Unit 4 10·5 4 5. 6 3 15.0 11 4·7 Total 38 71 20 34 15 23 18 13 232
TABLE 4: AGCT Percentile and Mean Raw Score
...... Arts in Machi:le
AGCT Test ABE GED Corrections Weldin~ Drafting OMR Shoe Repair Shop Total
Mean Score 77 98 101 97 118 117 102 119 99
Percentile Rank 22 45 50 45 80 78 50 81 50
,
IJ1
if
6.
There appears to be a good deal of va'riatio'n in drop-out rate among the several programs. The highest drop-out rate was for Pro-shop participants, 'the lowest for; Office Machine Repair st.udents. The proportion of vocational students earning a ce~tificate was simi lar (about one-third)for welding, drafting and OMR students. Th~\ Pro-shop had a low completion rate (eleven percent) and the machine shop program had not been in existence long enough to have had program graduates.
The AGCT (Army General Classification Test) was administered to most inmates on admission to the instituti'ons. Table 2 indicates the average raw score received by students in each of the programs and the corresponding . '
percenti Ie rank.
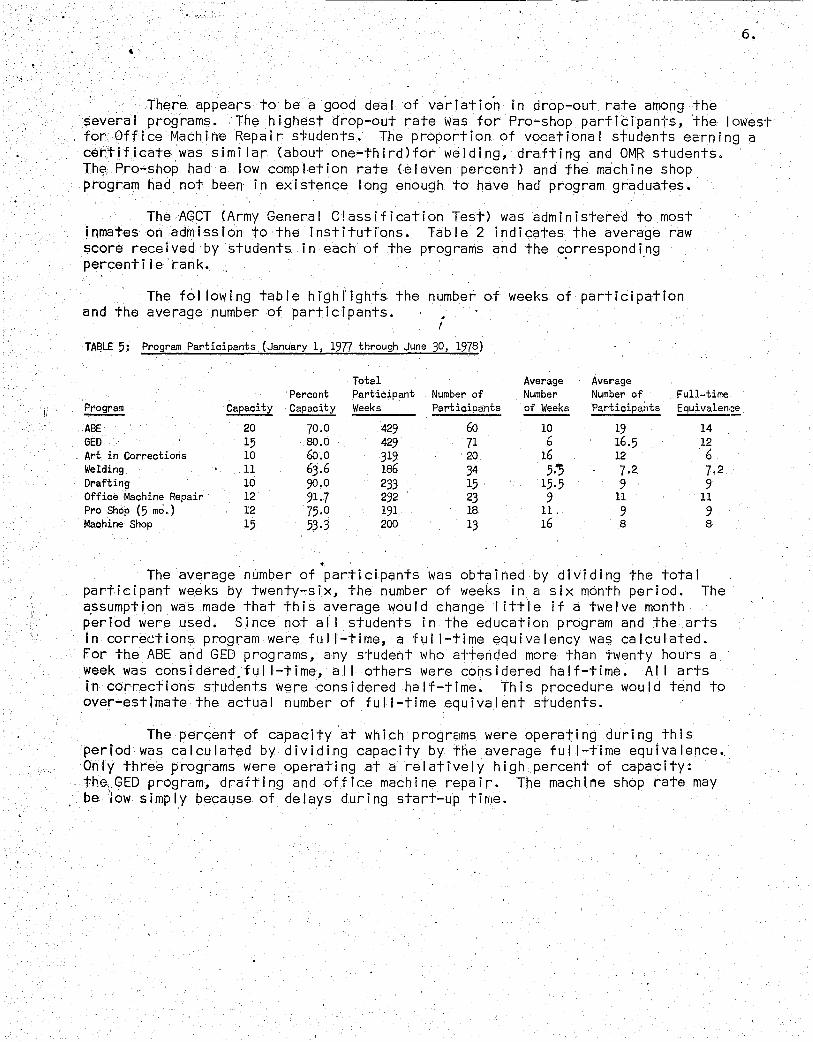
The fol lowing table highlights the number of weeks of participation and the average number of participants. •
I
TA~LE 5: Program Participants (January 1, 1977 through June 30, 1978)
Total Average Av&rage Percent Participant Number of Number Number of Full-time
Pl'ogram Capacity Capacity Weeks Participants of Weeks Participants Equivalenl~e
ABE 20 70.0 429 60 10 19 14 GED 15 SO.O 429 71 6 16.5 12
. Art in Corrections 10 60.0 319 20 16 12 6 Welding 11 63. 6 186 34 5.; 7·2. 7·2 Drafting 10 90·0 233 15 15·5 9 9 Office Machine Repair 12 91.7 292 23 9 11 11 Pro Shop (5 mo.) 12 75.0 191 18 11. 9 9 Machine Shop 15 53·3 200 13 16 8 8
. The average number of participants was obtained by dividing the total
participant weeks by twenty-six, the number of weeks in a six month period. The a,ssumption was made that this average would change I ittle if a twelve month period were used. Since not al I students in the education program and the arts in corrections program were ful I-time, a ful I-time equivalency was calculated. For the ABE and GED programs, any student who attended more than twenty hours a week was considered, ful I-time, al I others were considered half-time. AI I arts in corrections students were considered half-time. This procedure would tend to over-estimate the actual number of ful I-time equivalent students.
The percent of capacity at which programs were operating during this period was calculated by dividing capacity by the average ful I-time equivalence~ Only three programs were operating at a relatively high percent of capacity: the ... GEO program, drafting and office. machine repair. The machine shop rate may be 'low simply because of delays during start-up t i rile.
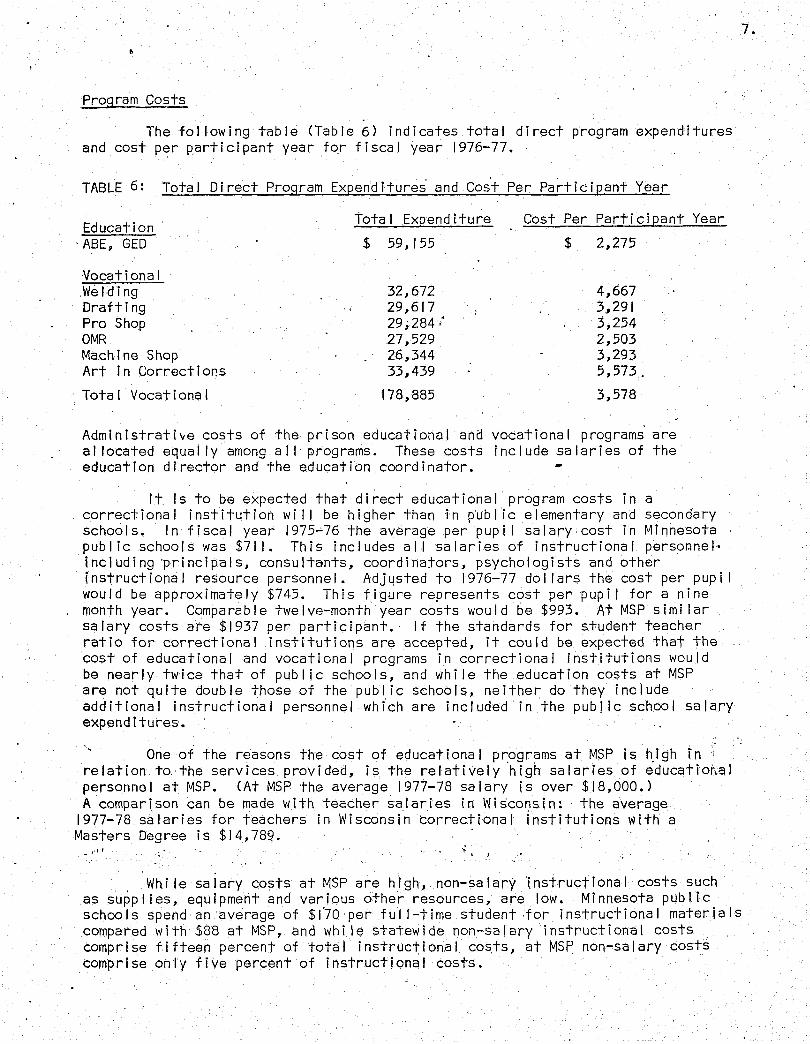
Prog ram Costs
The fol lowing table (Table 6) indicates total direct program expenditures and cost per participant year for fiscal year 1976-77.
TABLE 6: Total Direct Program Expenditures' and Cost Per Participant Year
Education . ABE, GED
Vocational Wed ding Drafting Pro Shop OMR Machine Shop Art in Corrections
Total Vocational
Total Expenditure
$ 59,155
32,672 29,617 29 ;284" 27,529 26,344 33,439
178,885
Cost Per Participant Year
$ 2,275
4,667 3,291 3,254 2,503 3,293 5,573.
3,578
Administrative costs of the prison educational and vocational programs are al located equally among al I programs. These costs include salaries of the education director and the education coordinator. -
It is to be expected that direct educational program costs in a correctional institution wi I I be higher than in publ ic elementary and secondary schools. In fiscal year 1975-76 the average per pupi I salary cost in Minnesota publ ic schools was $71 I. This includes al I salaries of instructional perso~nel· including 'principals, consultants, coordinators, psychologists and other instructional resource personnel. Adjusted to 1976-77 dol lars the cost per pupi I would be approximately $745. This figure represents cost per pupi I for a nine month year. Comparable twelve-month year costs would be $993. At MSP simi lar salary costs are $1937 per participant. If the standards for student teacher ratio for correctional institutions are accepted, it could be expected that the cost of educational and vocational programs in correctional institutions would be nearly twice that of public schools, and whi Ie the education costs at MSP are not quite double those of the publ ic schools, neither do they include additional instructional personnel which are included in the publ ic school salary expenditures.
One of the reasons the cost of educational p~ograms at MSP is high in re lati on to. the serv ices prov i ded, is the re I ati ve I y high sa I ari es of educatio!\a I personnel at MSP. (At MSP the average 1977-78 salary is over $18,000.) A comparison can be made with teacher salaries in Wiscol!s\n: the average
1977-78 salaries for teachers in Wisconsin correctional institutions with a Masters Degree is $14,789.
,~ . ,.
Whi Ie salary costs at MSP are high, non-salary instructional costs such as supplies, equipment and various other resources, are low. Minnesota public schools spend an average of $(70 per full-time student ·for instructional materials compared with $88 at MSP, and whi Ie statewide non-salary instructional costs comprise fifteen percent of total instructional cos.ts, at MSP non-salary costs comprise only five percent of instructional costs.
7.
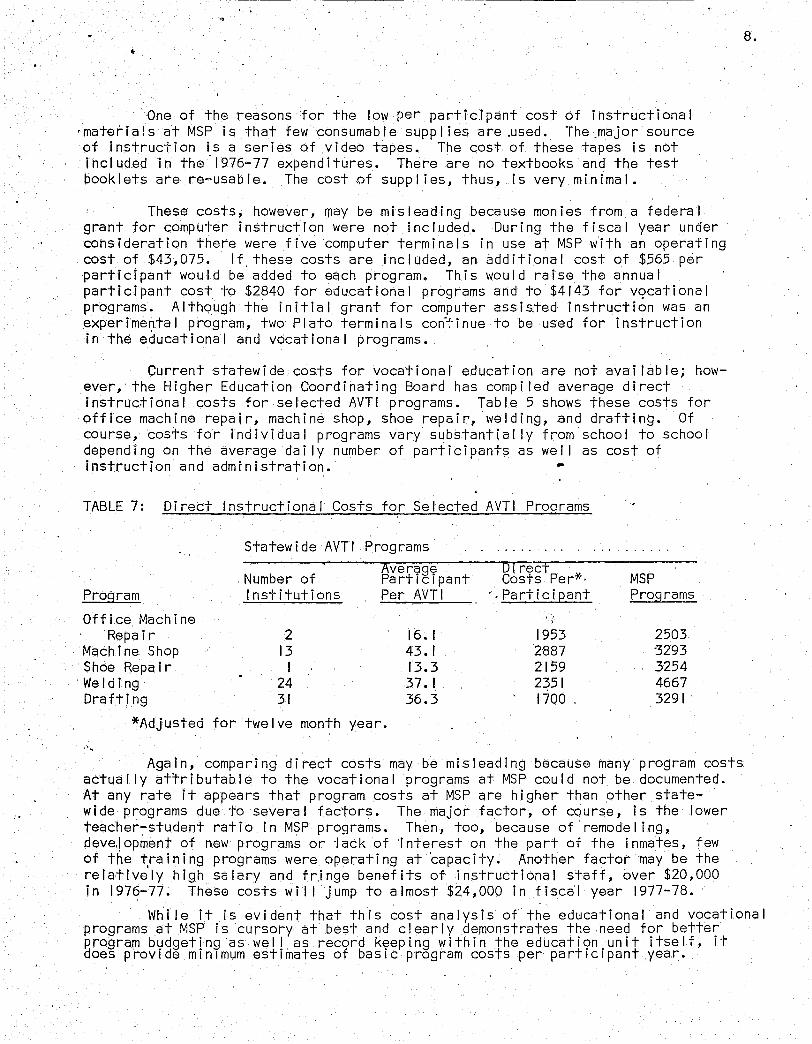
One of the reasons for the low per partlc1pant cost of instructional 'materials at MSP is that few consumable supplies are ,used. The ,major source of instruc'rion is a series of video tapes. The cost of these tapes is not included in the '1976-77 expenditures. There are no textbooks and the test booklets are re-usable. The cost of suppl ies, thus, is very minimal.
These costs, however, l')1ay be misleading because monies from a federal grant for computer instruction were not included. During the fiscal year under consideration there were five computer terminals in use at MSP with an operating cost of $43,075. If, these costs are included, an additional cost of $565 per participant would be added to each program. This would raise the annual participant cost to $2840 for educational programs and to $4143 for vqcational programs. Although the initial grant for computer assis.,ted instruction was an experimental program, two Plato terminals con'~'inue to be used for instruction in the educational and vocational programs.
Current statewide costs for vocational education are not avai lable; however, the Higher Educati'on Coordinating Board has compi led average direct instructional costs for selected AVTI programs. Table 5 shows these costs for office machine repair, machine shop, shoe repair, welding, and drafting. Of course" costs for individual programs vary substantially from school to school depending on the average dai Iy number of participants as wei I as cost of instruction and administration. -
TABLE 7: Direct Instructional Costs for Selected AVTI Programs
Statewide AVTI Programs
Program
Office Machine
Number of Institutions
Repair 2 Machine Shop 13 Shoe Repair I Welding 24 Drafting 31
Average Participant Per AVTI
16. I 43.1 13.3 37. I 36.3
*Adjusted for twelve month year.
Direct Costs Per*'
'". Pa rt i c i pan t
1953 2887 2159 2~51 1700
MSP Programs
2503 -3293 3254 4667 3291
Again, comparing direct costs may be misleading because many program costs actually attributable to the vocational programs at MSP could not be documented. At any rate it appears that program costs at MSP are higher than other state-wide programs due to several factors. The major factor, of course, is the lower tea~her-student ratio in MSP programs. Then, too, because of remodel ing, deve.lopment of new programs or 'lack of interest on the part of the inmates, few of the tra in i ng programs were operati ng at 'capac i ty. Another factor may be the relatively high salary and fringe benefits of instructional staff, over $20,000 in 1976-77. These costs wil I jump to almost $24,000 in fiscal year 1977-78.
8.
W~i Ie it is evident that this cost analysis of the educational and vocational programs at MSP is cursory at best and clearly demonstrates the need for better p'rogram budgeting as wei I as record keepinq within the education unit itself, it does provide minimum estimates of basic program costs per participant year.
Inmate Questionnaire
Another goal of this study was to explore some of the reasons why MSP inmates do not participate in educational and vocational programs. A questionnaire was distributed by the tvlSP Education Director to every inmate. The number of questionnaires returned was very low, less than eight percent, which may be indicative of the general lack of interest in educational and vocational programs at MSP or to "the method used to sol icit responses. The questionnaire was placed in each inmate's box and a fol low-up request was also made. Completed questionnaires were to be returned to the MSP Education Department. Most of the inmates who did respond were already enrol led in a program.
The ethn i c background o'f respondents twas proporti ona I to the tota I institutional population but thE3re were some·clear-cut differences. in characteristics and occupational interests. Whites were represented in every age group; on the other hand, eighty-one percent of the blacks responding were twenty-six to forty years old. Other minority respondents were al I under thirty years old. White respondents had been incarcerated for a longer period of time than non-white respondents. Reasons given for not participati.ng were also.different. White respondents were more I ikely to feel that they didn't need training or would rather work. Non-whites were more I ikely to feel that no programs offered were of interest to them or that they were given other assignments. Of those inmates responding, whites were more likely to be enrol led in vocational p~ograms and non-whites w~re more often enrol led in education p~ograms.
When asked about what kinds of training they would like to have offered, whites were more likely to warrt -rechnical ski I I training such as electronics, programming, mechanics or sheet metal. Blacks were more intere~ted in cosmoto logy, barber i ng, counse I i.ng, sa I es or ta i lor ing.
9.

· I
PART II
STATE REFORMATORY FOR MEN
Background
This study was undertaken in conjunction wii~h a sur'vey,of educationa I and vocational ,programs at MSP, but is presented in a separate section without comparison to programs or program costs at MSP. The approach was taken because 'it was felt that without an in-depth analysis of total program activity and an understanding of the special needs of the inmates at the two institutions cost or program comparisons of this type could be misleading.
Method
The original plan cal led for a cost analysis of fiscal year 1976-77 program expenditures. A simple analysis using direct operating costs was decided upon because of the difficulty under. current financial accounting procedures of obtaining detailed accounting of other indirect or related program costs. Nevertheless, this analysis should provide a more detailed accounting of these costs than is currently available through normal budget procedures.
, t n add I t I on to the d i ff i cu I ty of a I I ocat i ng program costs, the I ack of systematized record keeping of cl ients served made collecting data on, inmate participation in the various programs a time-consuming task. For this reason as wei I as because of the large number of students involved in the reformatory programs, it was decided that data would be collected for the six month period January I through June 30, 1977. The average number of participants was calculated for each program and used to determine the annual cost per participant. This method would provide a reliable figure except in such cases where a great difference in the number of participants occurred throughout the year. This did not appear to be the case in any of the programs reviewed. Information' ?~ students invol.ved in vocational programs was collected by the research staff from payrol I records; most of the data for the,educational programs was provided by the education staff at SRM. Program expenditures and allocations were obtained from the Department of Corrections accounting unit, the Central Office education staff and the Fiscal Officer and the Education Director at SRM.
II.
Data were <.;:ollected· for thirteen vocational programs: auto body building, auto mechanics, baking, barbering, furniture refinishing, masonry, meat cutting, painting and decorating, printing, smal I engine repair, upholest~y, welding and woodcraft. Programs classified under education are: the High School Learning Resource Center, Adult Basic Education, General Education Development, Title I, ·h.igher education and Arts in Corrections. SRM also has a drivers' education ,and traini.ng program but records of the number of students participating were 'not ava i I ab I e. No attempt was made to assess the effecti" veness of any of the programs.
Data Presentation
. The Minnesota State Reformatory, unlike MSP which serves somewhat older inmates, places a great deal of emphasis on its educational and vocational programs. The need for such programs seems evident. Three-four'ths of the offenders admitted to SRM had not complet~d high school prior to commitment.
Few had significant vocational training or work experience. During the six month study period there v/E;lre 751 program participants representing 468 individuals or about 54% of al I inmates entering the reformatory. Almost 350 of these were entol led in education programs lead,ing to a GED or high school diplomaj many participated in both vocational and educationell programs. With the exception of higher education and high school, most other educational progr.'3ms are part-time, generally only one or two hours a day. Vocational programs are considered to be full-time, although o(1ly six hours a day are spent in training. Thus, many of these students may spend an additional bour in selected high school classes or supplementary programs such as Title I, ABE, or the Learning Resource Center.
The largest single education program offered at SRM is high school, with an average of fifty-seven ful I-time and twenty-five part-time students. D~rfng the six month period under study, thirteen students received high school diplomas. Many students attended high school classes as preparation for the GED or to upgrade reading or mathematics skil Is needed for many vocat i ona I tra i n 1.ng p rog rams '
The GED, a Ithough I isted as an educationa I program, is primari Iy a testi,ng prqcedure. Pre-tests are administered to students seeking a high school equivalency to assess their abi I ity to pass the GED examination. If test scores are low, the student may need further preparation before taking the examination. This preparation may be through self-study, LRC, Title I, ABE or high school classes. Many students who do obtain a GED Certificate· continu~ high school class attendance preferring, in some 'cases, to have a ~egular high school diploma, if possible, before leaving the institution. During the first half of 1977, ninety-four inmates were given the pre-test screening examination. A total of fifty-one inmates were administered the GED test and thirty-three of these or sixty-five percent passe~ the examination.
:In addition to programs leading to a high school degree, several ~(gher education opportunities exist. The higher education program gives inIIJCltes an opportunity to earn col lege credits at SRM. Credits earned in the col I~ge program are transferable to col leges and' universities in the community. Since the opport,;m.i ty to enro I lin correspondence cou rses through the Extens ion Division of the University of Minnesota, most inmates spend no more than righteen months at SRM, 'completion' of education programs has I ittle meaning although a student may be able to obtain a high school diploma or GED in that period of time. Because of the nature of these programs, the turnover rate
'Is high. The exception is the higher education program which maintains a jrelativel Y stable population and a turnover rate of less than e,ighteen percent.
Vocational programs, on the other hand, are designed to provide the inmate with competencies necessary to meet trade entry level ski I Is and are normal I,">, considered to require a year of training. These programs at SRM are plagued by high turnover rates and a very low rate of completion.
The fol lowing table shows the reason for leaving the program and the rate of turnover of the various vocational programs.
12.
, ,
, '13.
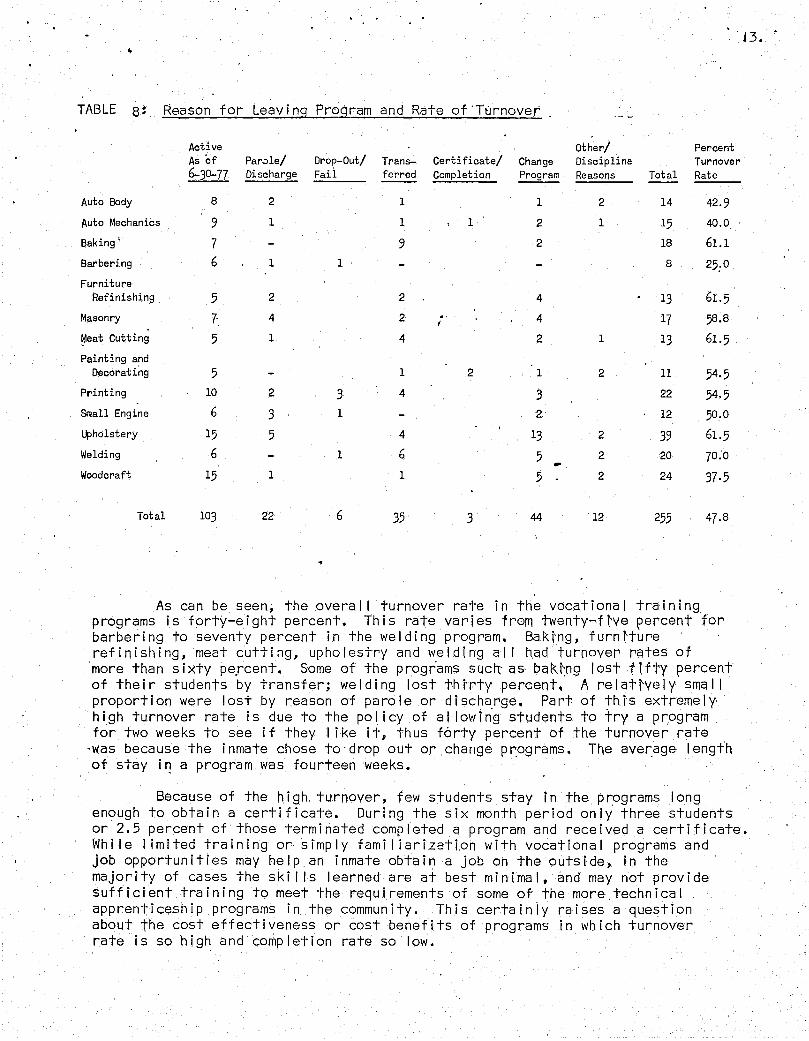
TABLE 8: Reason for Leavi ng Program and Rate of 'Turnover
Active Other/ Percent As of Par-:lle/ Drop-Out/ Trans- Certi ficate/ Change Discipline Turnover 6-30-77 Discharge Fail ferred Completion Program Reasons Total Rate
Auto Body 8 2 1 1 2 14 42·9
Auto Mechanics 9 1 1 1 2 1 15 40.0
Baking I 7 9 2 18 61.1
Barbering 6 1 1 8 25: 0
Furniture Refinishing 5 2 2 4 13 61.5
Masonry 7' 4 2 .' ' 4 17 58·8 f
~eat Cutting 5 1 4 2 1 13 61.5
Painting and Decorating 5 1 2 1 2 11 54·5
Printing 10 2 3 4 3 22 54·5 Small Engine 6 3 1 2' 12 50. 0
Upholstery 15 5 4 13 2 39 61.5
Welding 6 1 6 5 2 20 70.0 .. Woodcraft 15 1 1 5 2 24 37·5
Total 103 22 6 35 3 44 12 255 47.8
As can be seen, the overal I turnover rate in the vocational training programs is forty-eight percent. This rate varies from twenty .... fl've percent for barbering to seventy percent in the welding program. Baki'ng, furntture refinishing, meat cutting, upholestry and welding al I had turnover rates of more than sixty percent. Some of the progr'ams sucft as bakl~ng 10st flfty percent' of their students by transfer; welding lost thtrty percent. A relattvelY smal I proportion were lost by reason of parole or discharge. Part of thi's extremely high turnover rate is due to the po Ii cy of a I low i n'g students to try a program for two weeks to see if they I ike it~ thus forty percent of the turnover rate
'was beca use the inmate chose to' drop out or change p r:og rams. The aver,age length of stay i~ a program was fourteen weeks.
Because of the high turnover, few students stay in the programs long enough to obtain a certificate. During the six month period only three students or 2.5 percent of those terminated completed a program and received a certificate. Whi Ie I imited training or simply fami liarization with vocational programs and job opportunities may help an inmate obtain a job on the outside, in the majority of cases the ski I Is learned are at best minimal, and may not provide sufficient training to meet the requirements of some of the more technical apprenticeship programs in the community. This certainiy raises a question about the cost effectivensss or cost benefits of programs in which turnover rate is so high and completion rate so low.
Program Costs
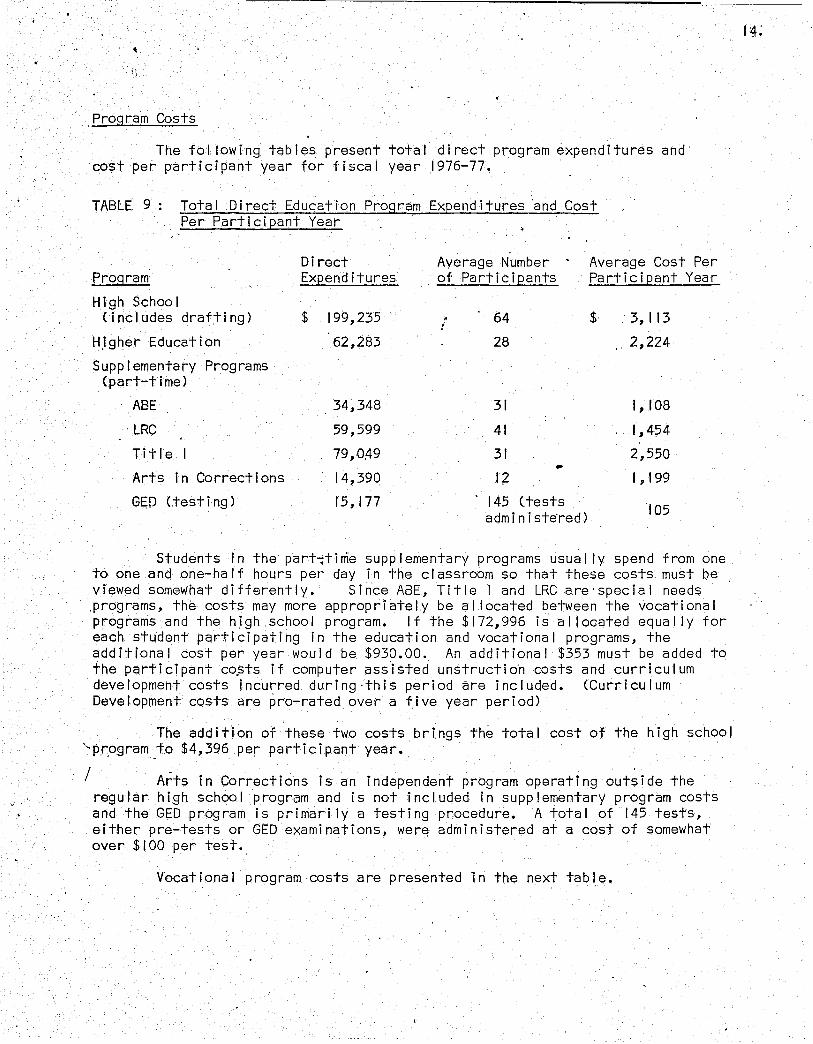
The following tables present total direct program expenditures and cost per participant year for fiscal year 1976-77.
TABLE 9: Total Direct Education Program Expenditures 'and Cost Per Participant Year
Program Di rect Expenditures
Average Number of Participants
Average Cost Per Participant Year
High School (includes drafting) $ 199,235
62,283
. !
64
28
$ 3, I 13
2,224 H,igher Education
Supp I ementary Programs (part-time)
ABE
LRC
Title I
Arts in Corrections
GED (test i ng )
34,348
59,599
79,0,49
14,390
15,177
31 1,108
41 1,454
31 2,550 .. 12 1,199
145 (tests 105 adm in i ste'red)
Students in the part~tirrie supplementary programs usually spend from one to one and one-half hours per' day in the classroom so that these costs must be viewed somewhat differently. Since ABE, Title I and LRC are'special needs ,programs, the costs may more appropriately be al located between the vocational programs and the high school program. If the $172,996 is al located equally for each student participating in the education and vocational programs, the additional cost per year would be $930.00. An additional $353 must be added to the participant co?ts if computer assisted unstruction costs and curriculum development costs incurred during,this period are included. (Curriculum Development costs are pro-rated over a five year period)
The addition of these two costs brings the total cost of the high school '-pr,ogram_to $4,396 per participant year.
/ Arts in Corrections is an independent program operating outside the regular high school program and is not included in supplementary program costs and the GED program is primari Iy a testing procedure. A total of 145 tests, either pre-tests or GED examinations, were administered at a cost of somewhat over $100 per test.
Vocational program costs are presented in the next table.
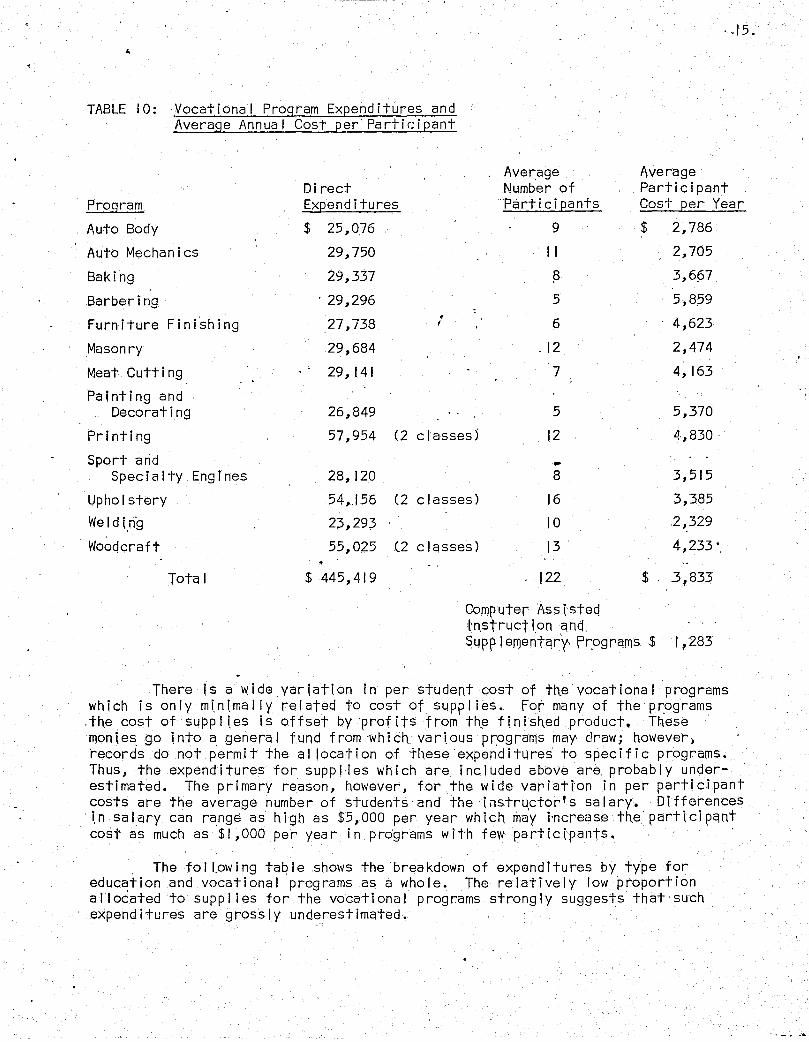
TABLE 10: yocational Program Expenditures and Average Annual Cost per'Participant
Average
. ,15.
Average Direct Number of Parti c i pant
Program Expenditures Participants Cost per Year
Auto Body $ 25,076 9 $ 2,786
Auto Mechanics 29,750 II 2,705
Baking 29,337 ~ 3,6(57
Barbering . 29,296 5 5,8.59 . Furniture Finishing 27,738 ,. 6 4,623
Masonry 29,684 .12 2,474
Meat Cutting 29,141 7 4,163
Painting and Decorating 26,849 5 5,370
Pri nti ng 57,954 (2 classes) 12 4·,830
Sport and .. Specialty Engines 28,120 8 3,515
Upholstery 54,.156 (2 classes) 16 3,385
We I d i,n'g 2;3,29;3 10 2,329
Wooc:jcraft 55,025 (2 classes) 13 4,233·
Total $ 445,419 122 $ 3,.833
Compwter Assistec:j 1'r1,strLlct ion qnc:j . . SLlpple~entgrt P~ograms $ 1,283
There is a wide variation in per student cost of th.e vocational programs wh i ch is on I y m i, n i,ma I lyre I ated to cost of supp lies. For many of the p ~ograms .th.e cost of sLlPplles is offset by 'profits from th.,e flnish.ed product. Th.ese monies. go into a generql fund from whiCh. vari.ous programs may draw; however, records do not permit the al location of these expenditures to specific programs. Thus, the expenditures for suppl ies which are included above ar'e probably underestimated. The primary reason, however, for the wide variatton in per participant costs are the average number of stUdents and the I nstru.ctor' s sa I ary. Di fferences i.nsalary can ra,nge as high as $5,000 per year which. may increase th.eparticipcmt cost as much as $1,000 per year in programs with few partidpants.
The fol Lowing table shows the breakdown of expenditures by type for education and vocational programs as a whole. The relatively low proportion a II ocated to supp lies for the vocati ana I p rag rams strong I y suggests that such expenditures are grossly underestimated.
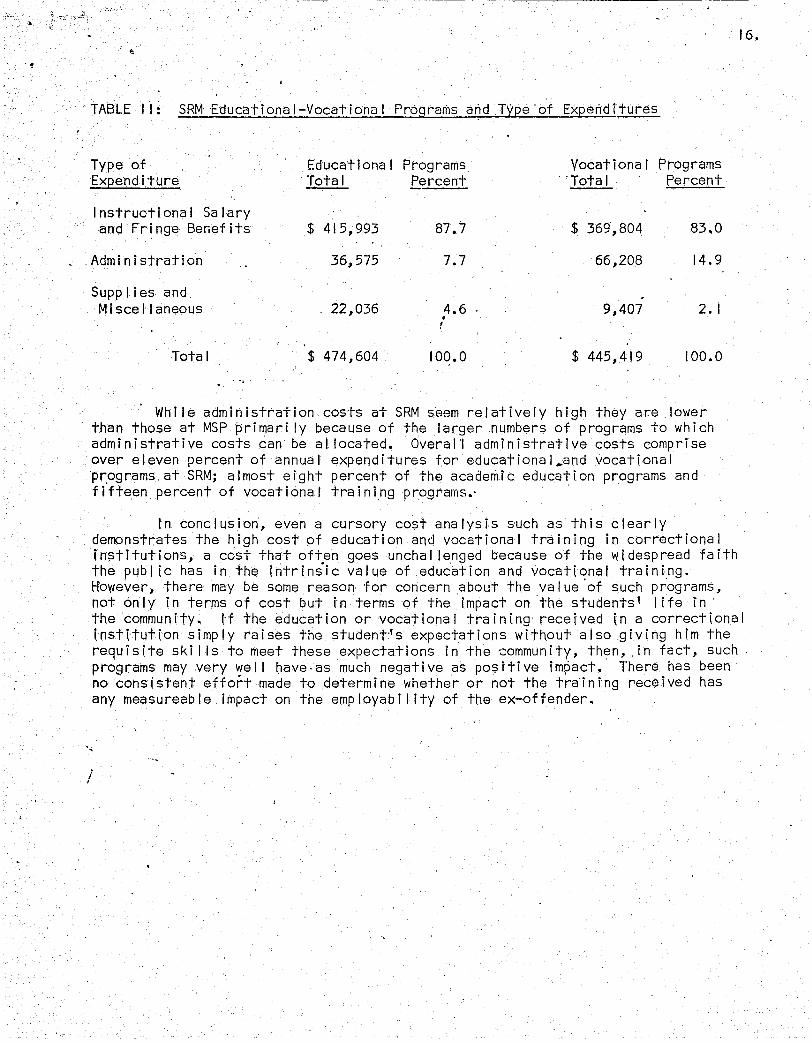
TABLE I I : SRM Educational-Vocational Programs and Type 'of Expenditures
Type of Educational Programs Vocational Programs Expenditure Total Percent ' 'Total percent
Instructional Sa lary and Fringe Benefits $ 415,993 87.7 $ 369,804 83.0
Administration 36,575 7.7 66,208 14.9
Supp lies and M j sce I I aneous 22,036 4.6 9,407 2. I
• f
Total $ 474,604 100.0 $ 445,419 100.0
While administration costs at SRM seem relatively high they ar.e lower than those at MSPprimari Iy because of the larger numbers of programs to which administrative costs can be allocated. Overal'l admini'strative costs comprise over eleven percent of annual expenditures foreducatlonal.and vocational p~ograms,at SRM; almost eight percent of the academic education programs and fifteen percent of vocat i ona I tra i n ing programs.'
tn conclusion, even a cursory cost analysis such as this clearly demonstrates the high cost of education and vocational training in correctional institutions, a cost that often goes unchallenged because of the widespread faith the publ tc has in the intrinii6 value of ,edu6ation and vocatt~nal training. However, there may be some reason 'for concern about the value of such programs, not only in terms of cost but tn terms of the tmpact on 'the students~ life in
16.
the community. l'f the education or vocational training received In a correctional tnstltutlon simply raises the student~'s expectations without also giving him the requisite ski I Is to meet these expectations in the community, then, in fact, such, programs may very wei I have,as much negative as positive impact. There has been no consistent effo~t made to determine whether or not the tratntng received has any measureable impact on the employabi lity of the ex-offender.
I
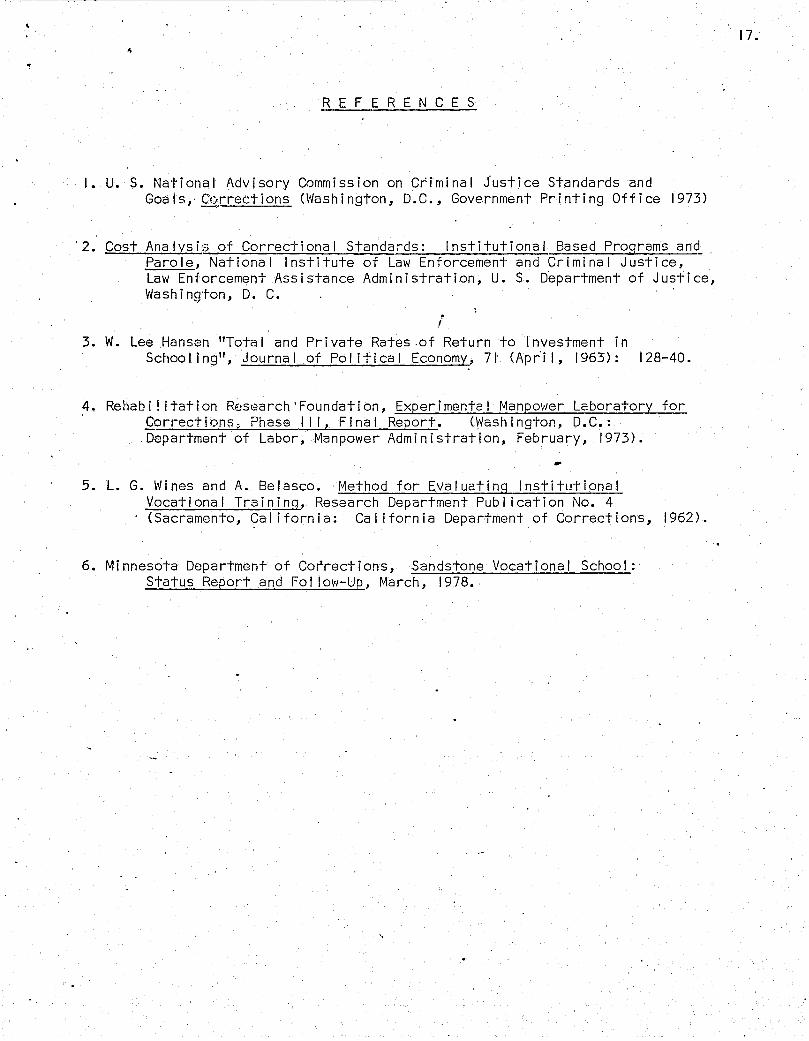
REF ERE N C E S
I. U. S. National Advisory Commission on Cfiminal Justice Standards and Goals,',g'.Q,rrections (Washington, D.C., Government Printing Office 1973)
'2. Cost Analysi':'; of Correctional Standa;-ds: Institutional Based Programs and_ Parole, National Institute of Law Enforcement and Criminal Justice, Law Enforcement Assistance Administration, U. S. D~partment of Justice, Washington, D. C.
l 3. W. Lee Hansen "Total and Private Rates ,of Return to Investment in
Schooling", Journal of Political Economy, 71 (Apr'il, 1963): 128-40.
4. Rehab 1 ! i tat i on Res~1arch' Foundat i on, Exper i menta I Manpower Laboratory for Corrections? Phase I I I, Final Report. (~ashington, D.C.: Department of Labor, Manpower Administration, February, 1973),
5. L. G. Wines and A. Belasco. Method for Evaluating Institutional Vocational TrainJiul, Research Department Publ ication No.4 (Sacramento, Cal ifornia: Cal ifornia Department of Corrections, 1962).
6. Minnesota Department of Corrections, Sandstone Vocational School: Status Report and Fol low-Up, March, 1978.
"
17.

I'
I '
1
T