Embed Size (px)
Citation preview
Policy Research Working Paper 7762
If It Pays, It Stays
Can Agribusiness Internalize the Benefits of Malaria Control?
Richard Sedlmayr
Development Economics Vice PresidencyOperations and Strategy TeamJuly 2016
WPS7762P
ublic
Dis
clos
ure
Aut
horiz
edP
ublic
Dis
clos
ure
Aut
horiz
edP
ublic
Dis
clos
ure
Aut
horiz
edP
ublic
Dis
clos
ure
Aut
horiz
ed
Produced by the Research Support Team
Abstract
The Policy Research Working Paper Series disseminates the findings of work in progress to encourage the exchange of ideas about development issues. An objective of the series is to get the findings out quickly, even if the presentations are less than fully polished. The papers carry the names of the authors and should be cited accordingly. The findings, interpretations, and conclusions expressed in this paper are entirely those of the authors. They do not necessarily represent the views of the International Bank for Reconstruction and Development/World Bank and its affiliated organizations, or those of the Executive Directors of the World Bank or the governments they represent.
Policy Research Working Paper 7762
This paper is a product of the Operations and Strategy Team, Development Economics Vice Presidency. It is part of a larger effort by the World Bank to provide open access to its research and make a contribution to development policy discussions around the world. Policy Research Working Papers are also posted on the Web at http://econ.worldbank.org. The author may be contacted at [email protected].
Might a malaria control intervention entail agricultural effects that allow a commercial agribusiness to offset its costs? The randomized allocation of 39,936 insecticide-treated mosquito nets among 81,597 smallholder cotton farming households in 1,507 clusters helps evaluate this in the context
of Zambia’s cotton outgrowing industry. But despite large health impacts on treated households, no impact on cotton deliveries to the agribusiness is detected. With some caveats, the results tend to strike a discord with recent evidence on the agricultural productivity effects of malaria control.
If It Pays, It Stays: Can Agribusiness Internalize the Benefits of Malaria Control?
Richard Sedlmayr1
Keywords: Bed net adoption, contract farming, insecticide-treated nets, malaria, public-private
partnerships
JEL Codes: C930, I390, Q120
1Richard Sedlmayr, Independent; his email address is [email protected]. This work was supported by
the Program for Appropriate Technology in Health (PATH). I am grateful to John Miller, Andrea Lozano, Rodrick
Masaiti, Charles Hayward, Nigel Seabrook, Mwela Namonje, Nguli Zulu, Rick Steketee, Duncan Earle, and
Zambia’s National Malaria Control Centre for help in the initiation and implementation of this project; to Guenther
Fink for ideas, collaboration, and data; and to Yansi Chen, Holden Karnofsky, David Weil, the seminar participants
of the CSAE Conference 2014, and further readers and reviewers for comments and suggestions. This study was
approved by PATH REC and UNZA REC. This trial and its main outcome variables were recorded in a public trial
registry before the underlying data became available (clinicaltrials.gov identifier: NCT01397851). Study
instruments, data, code, and supplementary materials can be found on the Open Science Framework (“The
Outgrower Opportunity”).
2
Background
Malaria incidence has fallen by nearly half since the year 2000 and more than half in Africa
(WHO 2014). The World Health Organization cites the growing use of insecticide-treated
mosquito nets as a central cause (WHO 2014); approximately 700 million nets have been
distributed over the last fifteen years (Bhatt and Gething 2014). It is widespread policy to
distribute nets for free (WHO 2007). One reason is that malaria control has positive externalities
(Hanson 2004). Furthermore, demand for nets is low even at heavily subsidized prices, and it has
been demonstrated that charging for them neither serves to induce selection of those who have
the highest need, nor to increase usage rates among recipients (Cohen and Dupas 2010).
Meanwhile, the distribution of free nets does not appear to dampen demand later on (Dupas
2014). Overall, there is ample evidence to suggest that decisive policy leads to higher technology
adoption and better health outcomes than market solutions would.
However, if malaria control enhances economic output by increasing the availability and
productivity of labor, commercial actors may be able to internalize its benefits to a degree (Roll
Back Malaria 2011). The guiding idea of the research presented here is that supporting evidence
could help expand malaria control in the private sector, thereby diminishing the risks associated
with a possible waning of ongoing political support for global malaria control efforts.
Specifically, if a credible link between malaria control and agricultural output could be
established in the Zambian cotton sector, at-scale opportunities for financially sustainable
malaria control would present themselves. Research by the World Bank suggests that over much
of last decade, 300,000 Zambian households grew cotton in contractual arrangements with
private agribusinesses (Tschirley and Kabwe 2009). In these so-called outgrowing agreements,
companies offer smallholder farmers agricultural inputs in exchange for a commitment to deliver
3
crop. Even a modest increase in cotton deliveries could make the provision of mosquito nets a
commercially viable intervention that might be sustained without public or philanthropic support.
This study evaluates this conjecture in more detail, using a large-scale randomized trial.
It also adds a mosaic of evidence on the impact of ill health on poverty. A substantial body of
cross-country literature argues that malaria is a major drag on economic growth (Bloom and
Sachs 1998), (Gallup and Sachs 2001), (WHO 2001), (Sachs and Malaney 2002), (Bloom and
Canning 2005); a smaller body of research tends to downplay this (Weil 2007), (Acemoglu and
Johnson 2007), (Ashraf, Lester and Weil 2008). Recent experimental efforts successfully linked
malaria prevention and treatment to increases in agricultural output (Dillon, Friedman and
Serneels 2014); (Fink and Masiye 2015).
Context on Zambia’s Cotton Industry
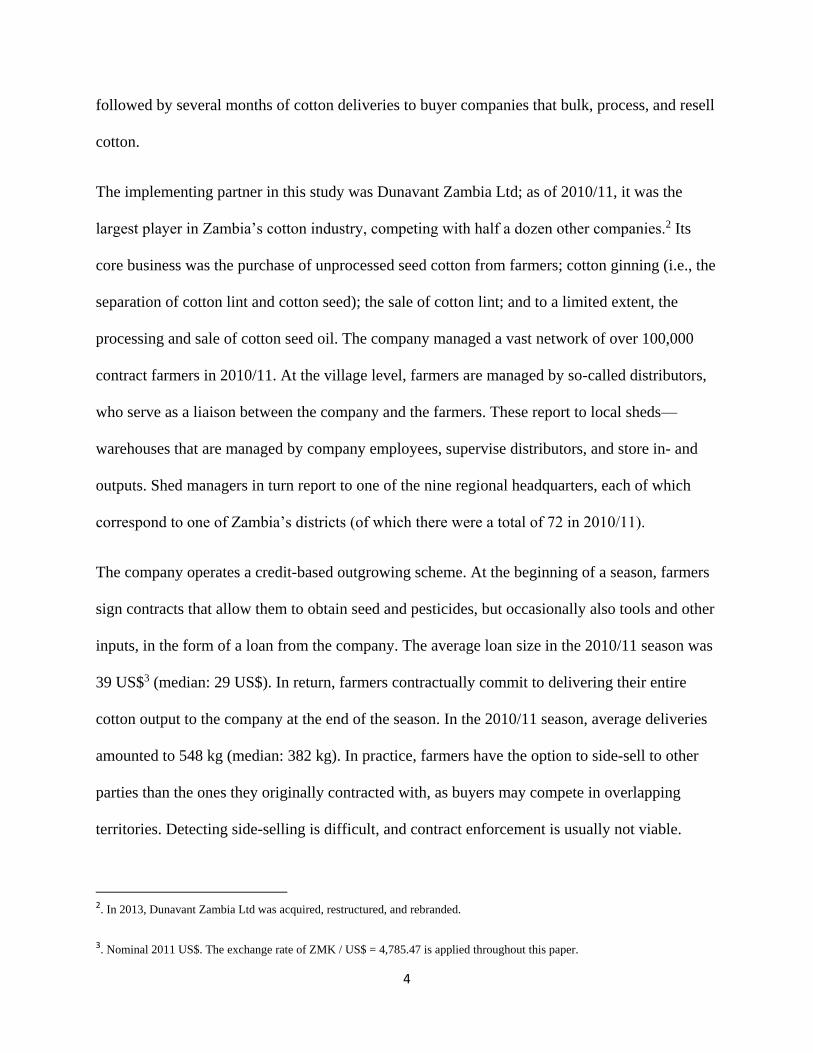
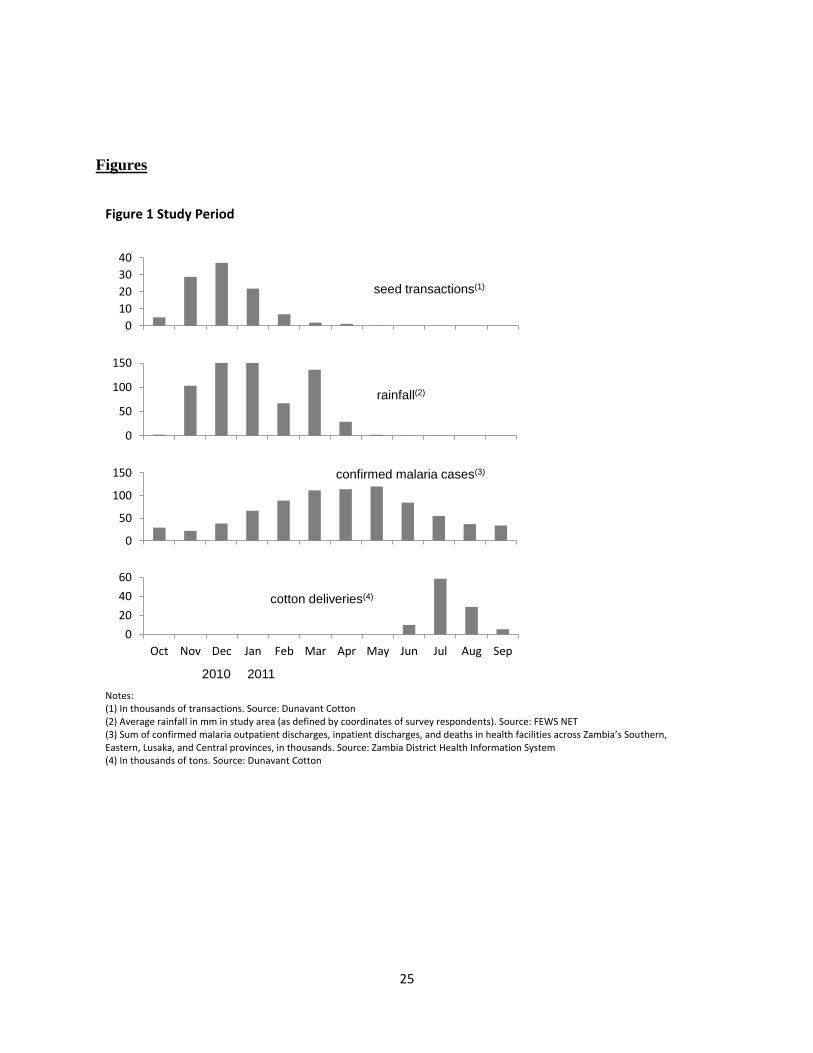
As illustrated in figure 1, Zambia experiences only one rainy season, with rainfalls usually
starting in early November, peaking in January, and ceasing again in April. The pronounced
fluctuations strongly affect malaria transmission. The burden of the disease follows the rains
with a brief time lag because the Anopheles mosquito—the transmitter of the Plasmodium
falciparum parasite that is the main cause of malaria in Zambia (WHO 2014)—breeds in
stagnant water.
The climactic fluctuations also determine the annual cycle of rain-fed smallholder agriculture:
field work generally starts with the return of the rains in November, and most planting occurs in
December. This is when contract farmers in Zambia’s cotton industry obtain the bulk of their
cotton seed, as displayed in figure 1. The most labor-intensive field activities, especially
weeding, continue through the peak of malaria season. Cotton harvests start in May and are
4
followed by several months of cotton deliveries to buyer companies that bulk, process, and resell
cotton.
The implementing partner in this study was Dunavant Zambia Ltd; as of 2010/11, it was the
largest player in Zambia’s cotton industry, competing with half a dozen other companies.2 Its
core business was the purchase of unprocessed seed cotton from farmers; cotton ginning (i.e., the
separation of cotton lint and cotton seed); the sale of cotton lint; and to a limited extent, the
processing and sale of cotton seed oil. The company managed a vast network of over 100,000
contract farmers in 2010/11. At the village level, farmers are managed by so-called distributors,
who serve as a liaison between the company and the farmers. These report to local sheds—
warehouses that are managed by company employees, supervise distributors, and store in- and
outputs. Shed managers in turn report to one of the nine regional headquarters, each of which
correspond to one of Zambia’s districts (of which there were a total of 72 in 2010/11).
The company operates a credit-based outgrowing scheme. At the beginning of a season, farmers
sign contracts that allow them to obtain seed and pesticides, but occasionally also tools and other
inputs, in the form of a loan from the company. The average loan size in the 2010/11 season was
39 US$3 (median: 29 US$). In return, farmers contractually commit to delivering their entire
cotton output to the company at the end of the season. In the 2010/11 season, average deliveries
amounted to 548 kg (median: 382 kg). In practice, farmers have the option to side-sell to other
parties than the ones they originally contracted with, as buyers may compete in overlapping
territories. Detecting side-selling is difficult, and contract enforcement is usually not viable.
2. In 2013, Dunavant Zambia Ltd was acquired, restructured, and rebranded.
3. Nominal 2011 US$. The exchange rate of ZMK / US$ = 4,785.47 is applied throughout this paper.
5
Strategic default (which would be associated with 100% side-selling) was uncommon in the
2010/11 season; the median farmer repays the loan in full, and average defaults amount to little
over one dollar. For more details on the outgrowing contract, see appendix A.
Study Rationale
As illustrated in appendix B, the company’s central challenge is to process a sufficient volume of
cotton to offset fixed costs and achieve profitability. The company’s budgeting systems model
expected profitability by multiplying cotton volume by a fixed contribution margin (i.e., the
monetary amount that one kilogram of delivered farmgate cotton contributes to marginal profit).
Both fixed costs and the contribution margin are substantial: in other words, cotton outgrowing is
a volume-driven business with high operating leverage. This creates demand for innovations that
have the potential to increase cotton deliveries. For a number of reasons, insecticide-treated nets
may plausibly be counted among the candidates:
First, they have proven effective in preventing malaria (Lengeler 2004), which is endemic
throughout Zambia’s cotton growing regions (WHO 2014), and there is ample literature
highlighting the costs of malaria on agricultural output via labor hours and productivity (Conly
1972), (Sauerborn, et al. 1991), (Attanayake, Fox-Rushby and Mills 2000). Studies variably
define time costs as including the opportunity cost of time spent sick; of time caring for others
who are sick; and of productivity impairments before full recovery. Partly because of differences
in definitions, and potentially because of differences in terms the type of labor, the type of
parasite, available treatment options, acquired resistance, and other contextual factors, time cost
estimates vary widely (Shephard, et al. 1991); (Chima RI 2003), (Ayieko, et al. 2009); (Fink and
6
Masiye 2015). Overall, 5–6 work days (i.e., one work week) of household labor lost per
household malaria episode appears to be a plausible working assumption in the context at hand.
Second, Zambian cotton farmers are (given the company’s input financing system) not
constrained in their access to inputs, and only rarely report being constrained in terms of
available land; consistent with literature on the economics of smallholder farming (Cleave 1974),
Zambian cotton farmers typically identify labor constraints as the primary factor in determining
plot size. Weeding is a labor-intensive activity, and as both the growth of weeds on the cotton
fields and the growth of malaria incidence are driven by annual rainfall patterns (see fig. 1) and
peak at the same time, it is plausible that malaria control could relieve binding labor constraints.
Third, given their extensive preexisting infrastructure, cotton outgrowing companies are
exceptionally well positioned to conduct even remote household-level distributions of
insecticide-treated mosquito nets at very low marginal cost. In the context of this study, the
marginal cost of procuring and distributing insecticide-treated mosquito nets was 5 US$
(Sedlmayr, et al. 2013).
The central purpose of this study was therefore to evaluate if independent private sector malaria
control efforts would be viable for Zambia’s cotton industry, which had not traditionally been
involved in such operations. A valuation was performed to establish the financial impact, and it
was agreed that if the intervention would prove commercially viable based on the research
results and this tool, the company would purchase mosquito nets and distribute them to its
contract farmers for free in future seasons. The most plausible mechanism involved expected
increases in cotton yields. Dividing the marginal cost of one insecticide-treated net (5 US$) by
the contribution margin derived and quantified in appendix B (in US$ / kg) yields 21.74 kg; this
7
is the threshold increase in overall cotton deliveries that would suffice to offset the cost of one
net. Appendix B also demonstrates that costs could be further defrayed by a reduction in loan
defaults; 5.38 kg in additional deliveries from delinquent farmers would suffice to offset the cost
of one net.
The validation of protocol adherence in net delivery and the measurement of health impacts—
both critical links in the theory of change—allowed for the simultaneous data collection on the
impacts on maize farming. In 2010–11, the company did not have a commercial interest in maize
and did not collect data on this crop. However, as 99% of surveyed farmers grow maize, effects
are of theoretical interest. Though maize is (like cotton) a rain-fed crop in the study context,
farmers report that it requires less weeding, so effects on maize yields were more speculative.
I. STUDY DESIGN
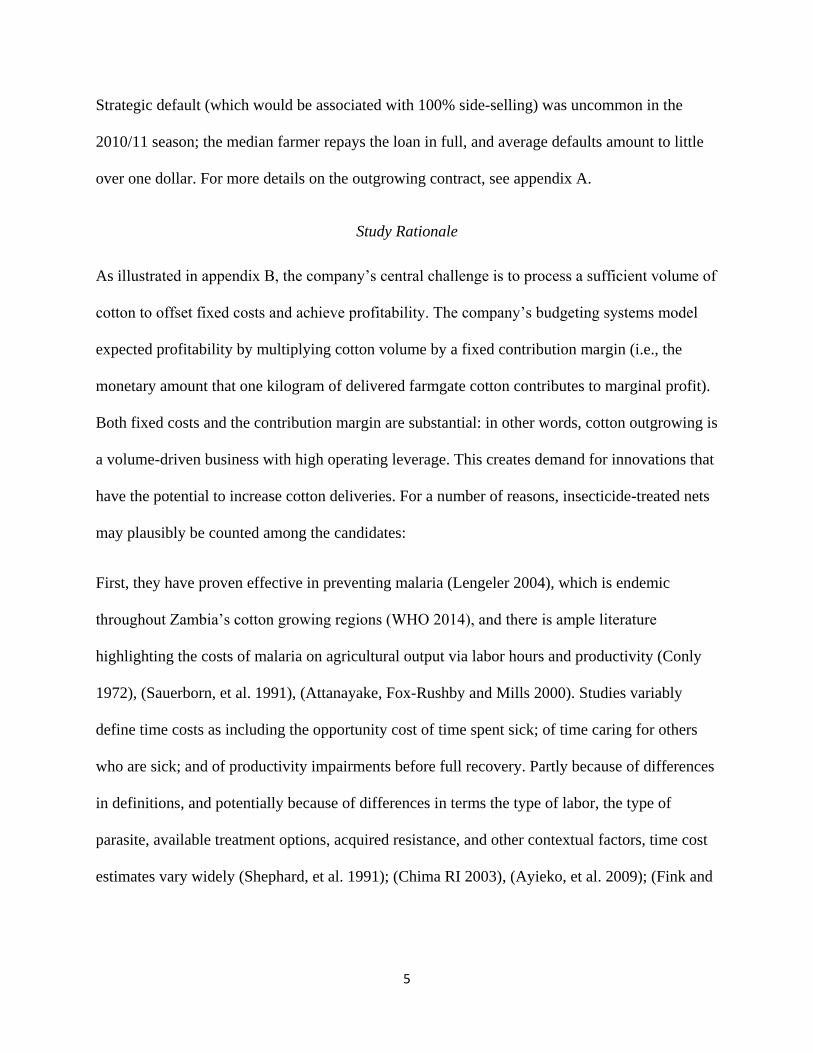
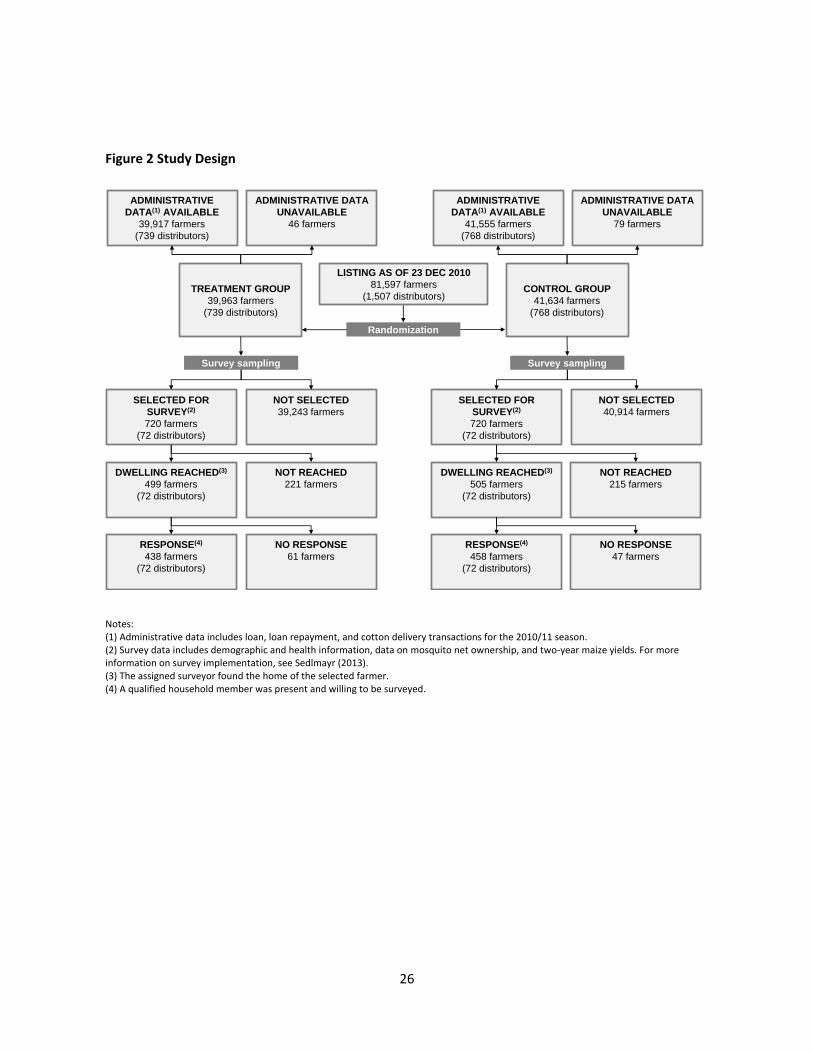
The study population was composed of all farmers having a standing contract farming agreement
with the company for the 2010/11 season on December 23, 2010. By this time, 81,597 annual
contracts associated with 1,507 distributors were registered in the company’s database (see fig.
2). Farmers whose contracts had not been processed by the cutoff date in December 2010 were
not recruited into the study.
Data
This study uses two data sources. The first is an administrative database owned and operated by
the cotton outgrowing company. This database identifies farmers and the region, shed, and
distributor they work with, and captures their annual input loans and cotton output.
8
The primary outcome measure, as registered in the public trial registry, is: “Farmer's cotton
yields (kg delivered per household), as defined in the routine data collection system of the
participating cotton outgrowing agribusiness” [Notes: Time frame 2010–2011 season.] Two
qualifications are in order. First, administrative outcome data are unavailable for 125 of the
81,597 study participants (see fig. 2). Second, the yields captured in the database are cotton
deliveries received by the company. These are not necessarily identical to farmer’s true cotton
yields because farmers have the option to side-sell a share of their cotton to other buyers in
breach of their contract. For the core purpose of the study, which is to determine the commercial
viability of the intervention from the company’s perspective, cotton deliveries to the company
are more relevant than their true cotton yields. Also, honest survey responses on true cotton yield
would be are likely difficult to obtain in an environment of side-selling. Nonetheless, this
variable is of theoretical interest and will be revisited in the discussion section.
The administrative database is also used for the collection of a secondary outcome defined in the
registration as “Defaults on input loans, as defined in the routine data collection system of the
participating cotton outgrowing agribusiness. [Notes: Time Frame 2010–2011 season; Odds
ratios calculated in accordance with NIH guidance].” As described above, a categorical default
variable is merely a proxy indicator for the purposes of evaluating the commercial impact on
lending operations; as described in appendix B, a more accurate (if less intuitive) indicator is the
absolute growth in loan repayments among delinquent farmers, defined in kg of cotton.
Beyond the administrative database of the company, a second data source for this study was the
aforementioned survey, collected in one single round between June 20th and July 11th 2011 in a
randomly selected subset of clusters. The central purpose of this survey was to validate the
adherence to the distribution protocol and evaluate health impacts; but it also allowed for the

9
collection of further secondary outcome variables, as well as explanatory variables about adverse
events on farmers’ plots.
Short of using blood samples, malaria parasitemia are difficult to measure accurately. The
current public health literature accepts self-reported estimates of fever and self-reported
estimates of malaria as outcome variables in impact studies on malaria (Sedlmayr, et al. 2013).
The survey therefore asked respondents to list cases of fever (i.e., suspected malaria) in the
household over the course of the last two weeks and used recall about diagnostic procedures to
identify those cases where a malaria diagnosis had been confirmed by health workers. Both are
used to describe the outcome of “Self-reported malaria incidence over two weeks before
interview. [Notes: Time Frame 2010–2011 season; Odds ratios calculated in accordance with
NIH guidance].”
The survey also allowed for the collection of land productivity data on maize plots, both in the
year of the survey and in the year before it. This allowed for a construction of an outcome called
“Increase in self-reported maize productivity (yield on maize plots divided by size of maize
plots), calculated as maize productivity 2010–11 minus maize productivity 2009–10, measured in
bags” [Notes: Time Frame: 2009–2010 and 2010–2011 seasons; bags are ordinarily 50 kg, but
kg measure not specified].”
Experimental Design
As illustrated in figure 2, the study used a randomized design that clustered treatment at the
distributor level. In order to ensure a balanced roll-out across regions, the 62 sheds were treated
as separate strata in the randomization. Nets were delivered to the shed level, and shed managers
were trained on the training of distributors to ensure protocol adherence.
10
Following the randomization, bed nets were distributed between January 20th and January 28th
2011. As a fair and simple distribution rule, it was determined that each treatment household
would be eligible for exactly one bed net through the program. Building on the aforementioned
literature on bed net adoption, it was expected that smallholder’s willingness to pay would be
minimal, so nets were distributed for free. No information on the purpose of nets was provided;
as indicated in table 1, households in the region already often owned one net. However,
distributors were encouraged to help recipients hang the nets, and provided with string to do so.
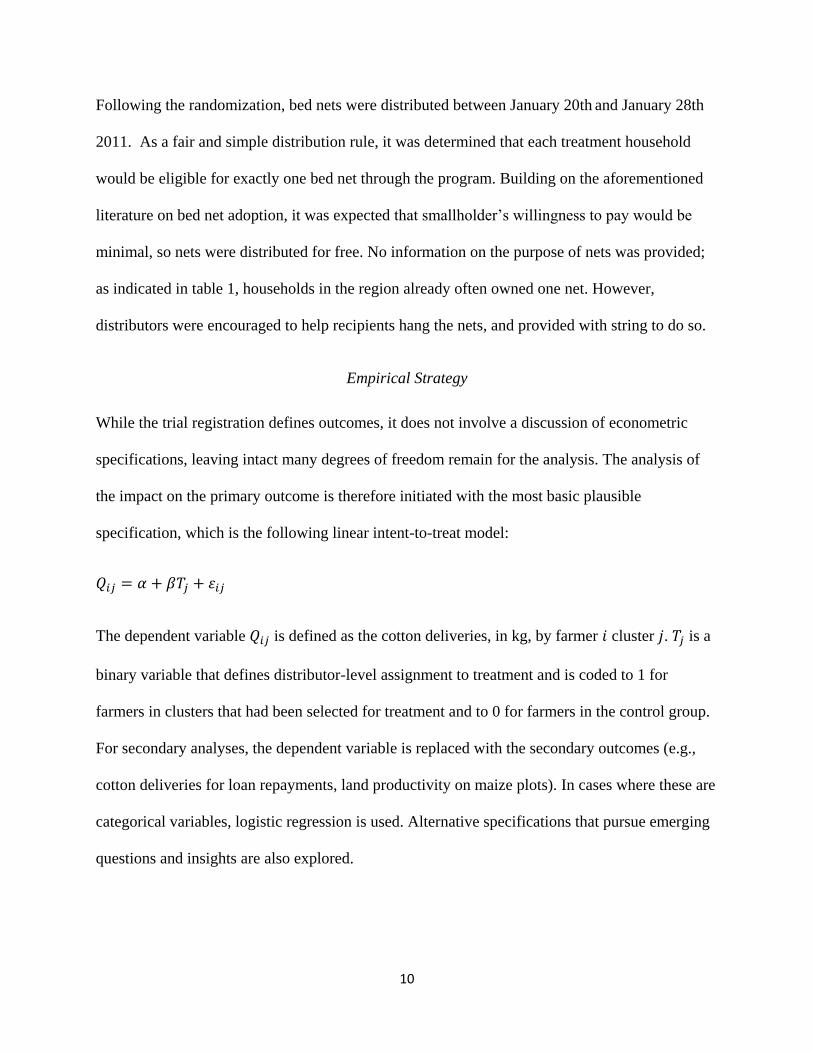
Empirical Strategy
While the trial registration defines outcomes, it does not involve a discussion of econometric
specifications, leaving intact many degrees of freedom remain for the analysis. The analysis of
the impact on the primary outcome is therefore initiated with the most basic plausible
specification, which is the following linear intent-to-treat model:
𝑄𝑖𝑗 = 𝛼 + 𝛽𝑇𝑗 + 𝜀𝑖𝑗
The dependent variable 𝑄𝑖𝑗 is defined as the cotton deliveries, in kg, by farmer 𝑖 cluster 𝑗. 𝑇𝑗 is a
binary variable that defines distributor-level assignment to treatment and is coded to 1 for
farmers in clusters that had been selected for treatment and to 0 for farmers in the control group.
For secondary analyses, the dependent variable is replaced with the secondary outcomes (e.g.,
cotton deliveries for loan repayments, land productivity on maize plots). In cases where these are
categorical variables, logistic regression is used. Alternative specifications that pursue emerging
questions and insights are also explored.

11
II. EXPERIMENTAL RESULTS
Balance Checks, Protocol Adherence, and Bed Net Adoption
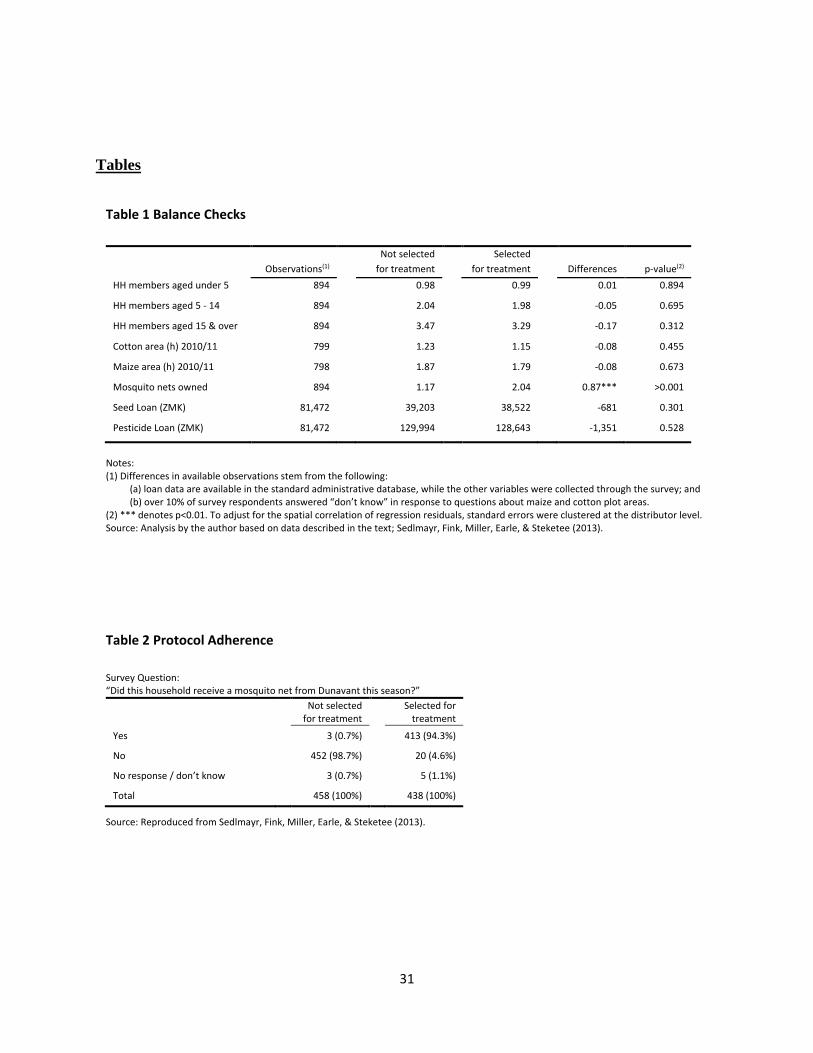
Treatment and control groups are well balanced with regards to baseline characteristics (see table
1). However, clear differences emerge in net ownership, with households in the treatment group
owning 0.87 more mosquito nets on average than households in the control group. The fact that
this number is not equal to one is only partially explained by leakage in the distribution process:
4.6% of households in the treatment group reported not having received a net from the company
(see table 2). The propensity to replace, sell, or gift nets may have increased in the treatment
group.
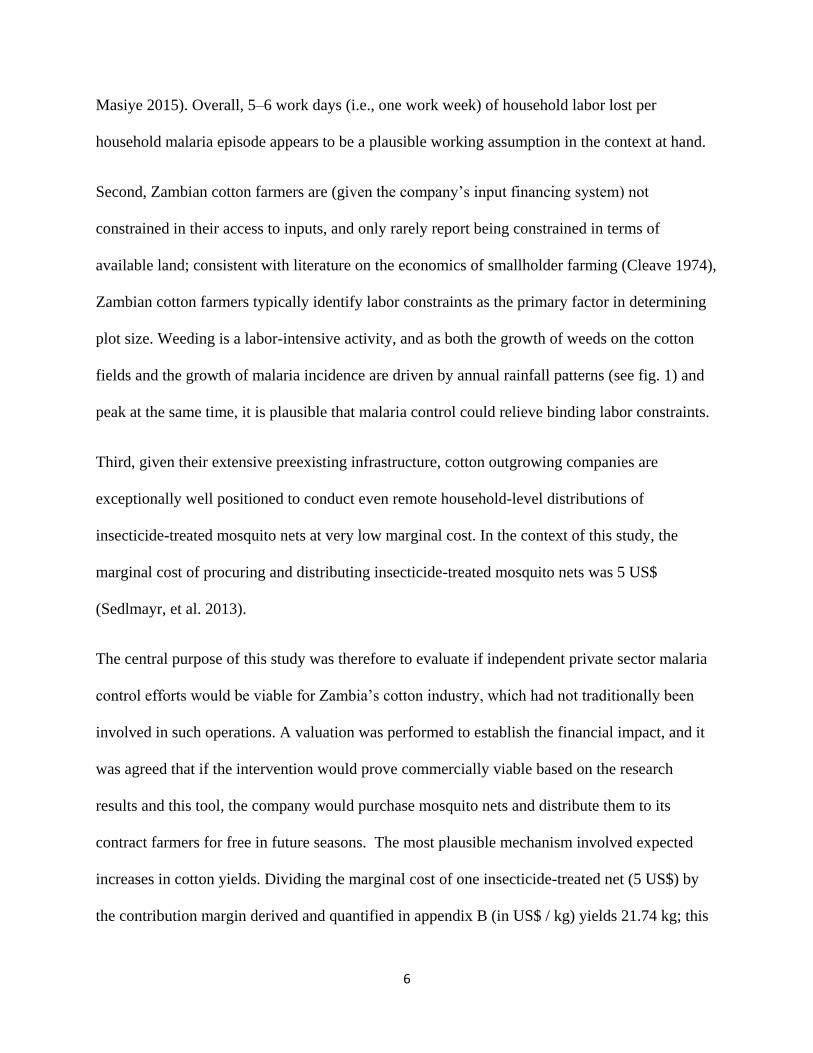
Figure 3 illustrates bed net usage patterns across age groups in both treatment and control
groups. It also compares these to the results from a nationally representative survey. Baseline
mosquito net usage (as approximated by the control group) is substantially below the Zambian
average; treatment shifts it to slightly above-average rates.
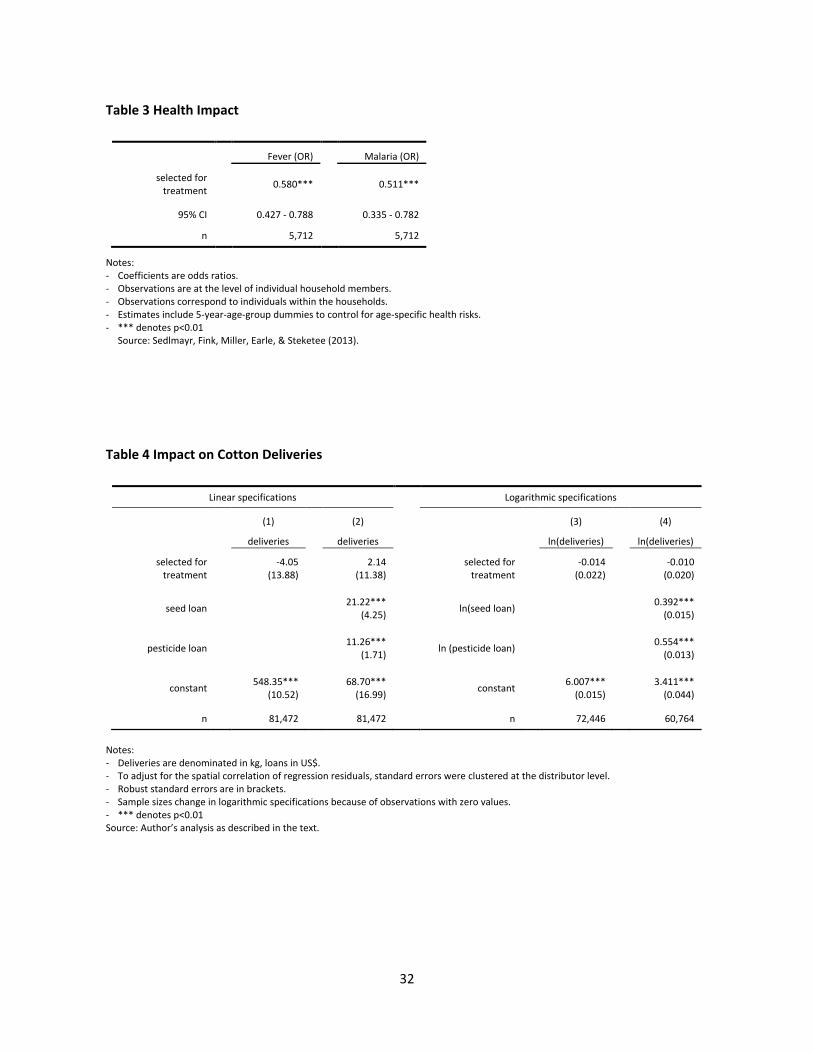
Health Impacts
Over the course of the study period, the average rates of self-reported fever and malaria
incidence among individual household members were 24% and 12% in the control group. There
is a 42% reduction in the odds of self-reported fever (p<.001) and a 49% reduction in the odds of
self-reported malaria (p=.002) (see table 3). The respective rates of fever and malaria incidence
are 15% and 6% in the treatment group. A more detailed discussion of the health effects by (e.g.,
by age group) can be found in a separate publication (Sedlmayr, et al. 2013).

12
Impacts on Cotton Output
Cotton deliveries are lower in the treatment group by 4.05 kg. The effect is insignificant using
the basic linear model, which was described above and is defined as specification (1) in table 4.
The upper bound of the 95% confidence interval for coefficient 𝛽 is 23.15 kg, which would
equate a 4.2% increase. While this suggests that very meaningful effects are not likely, an effect
equal to the critical threshold of 21.74 kg (i.e., a 4% increase) cannot be dismissed.
One concern is that robust standard errors of the treatment effect are relatively high. As seed and
pesticide loans were made before the nets were distributed and are therefore exogenous, and as
they are simultaneously plausible determinants of output, they are added as covariates to the
regression, as demonstrated in specification (2) of table 4. Indeed, the coefficients for seed and
pesticide loans are highly significant, and their inclusion reduces the robust standard error of the
treatment effect. However, a 4% increase in deliveries continues to lie within the confidence
interval.
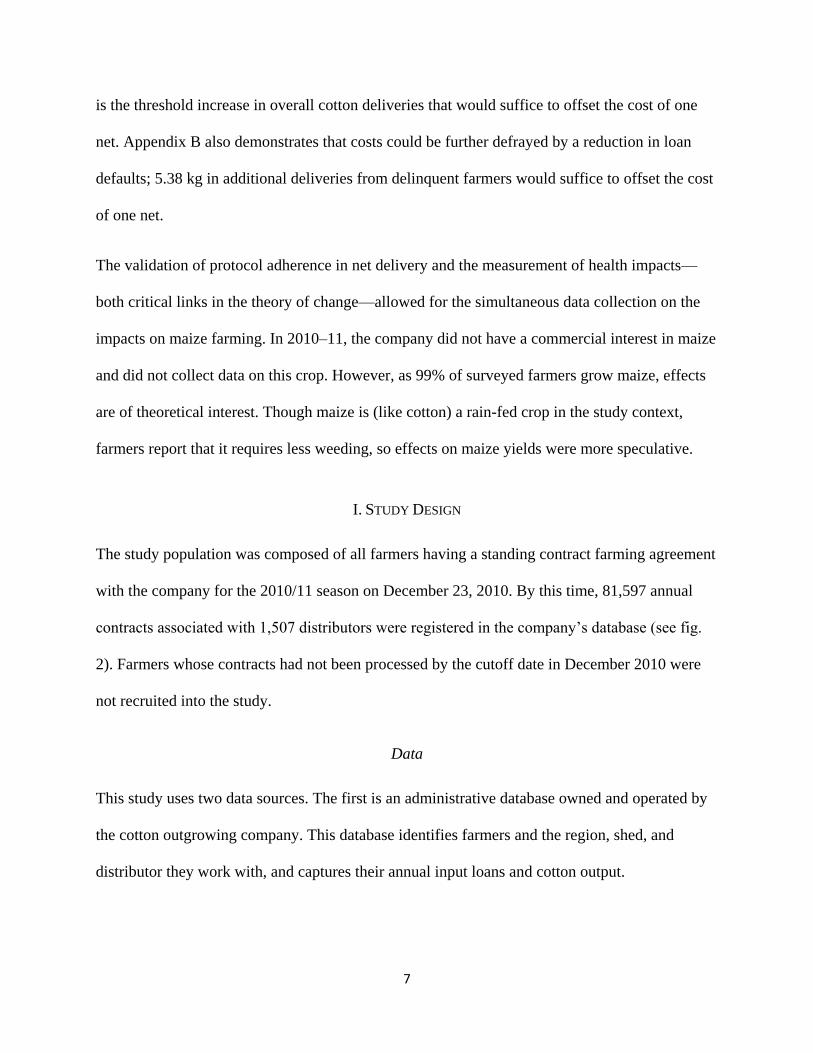
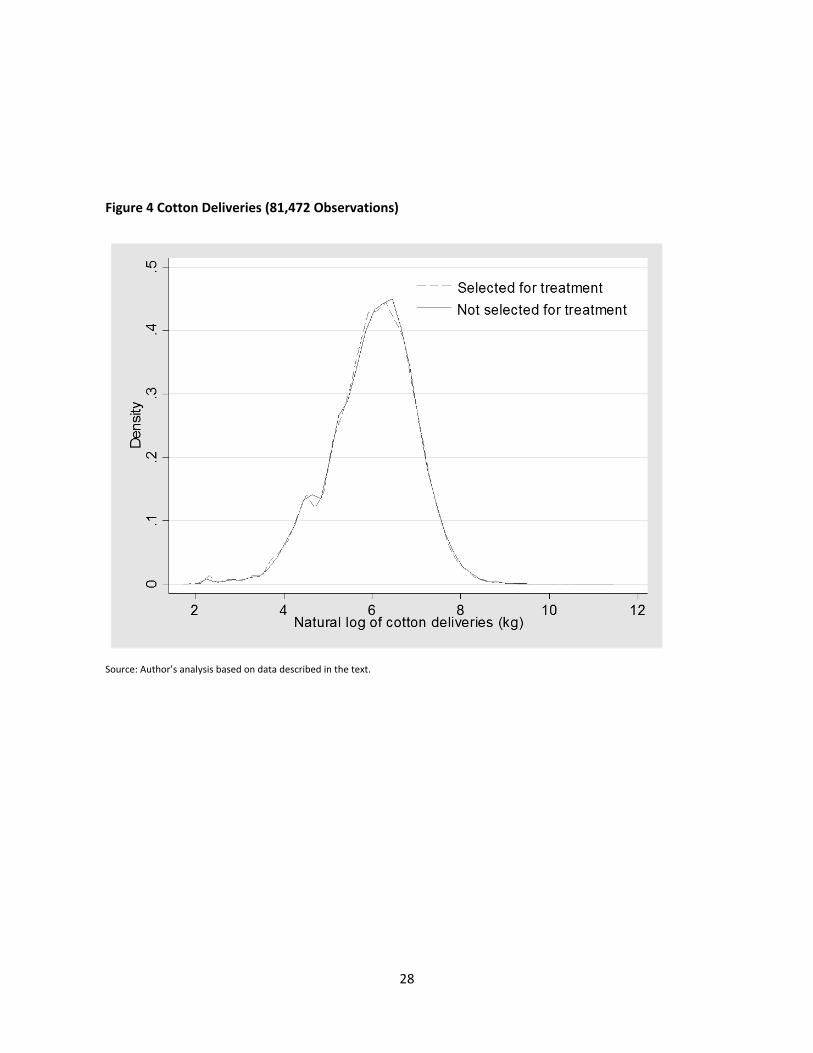
Density functions are depicted in figure 4; a number of insights can be gleaned from them. First,
the distribution of cotton deliveries in the treatment and control groups is virtually identical;
differences can barely be discerned. Second, the distribution is highly skewed, which can be
addressed through logarithmic transformation. Rerunning specifications (1) and (2) in log-
transformed form leads to specifications (3) and (4) in table 4. With upper bounds of 2.8% and
2.9%, respectively, these specifications allow for the dismissal of a 4% increase in deliveries.
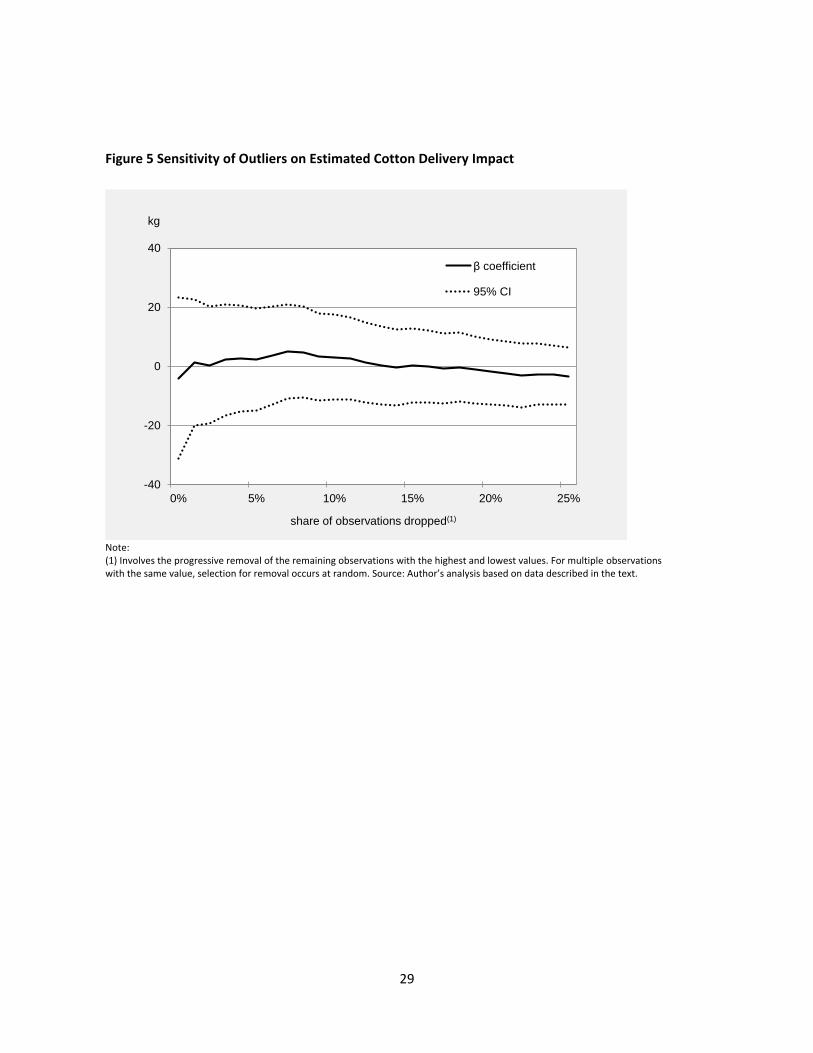
To further evaluate the robustness of the result, the sensitivity of specification (1) to outliers is
evaluated. Figure 5 depicts treatment coefficients and confidence intervals for subsamples that
13
exclude the highest and lowest observations. While confidence intervals narrow substantially
with the progressive restriction of the subsample, the findings prove very robust.
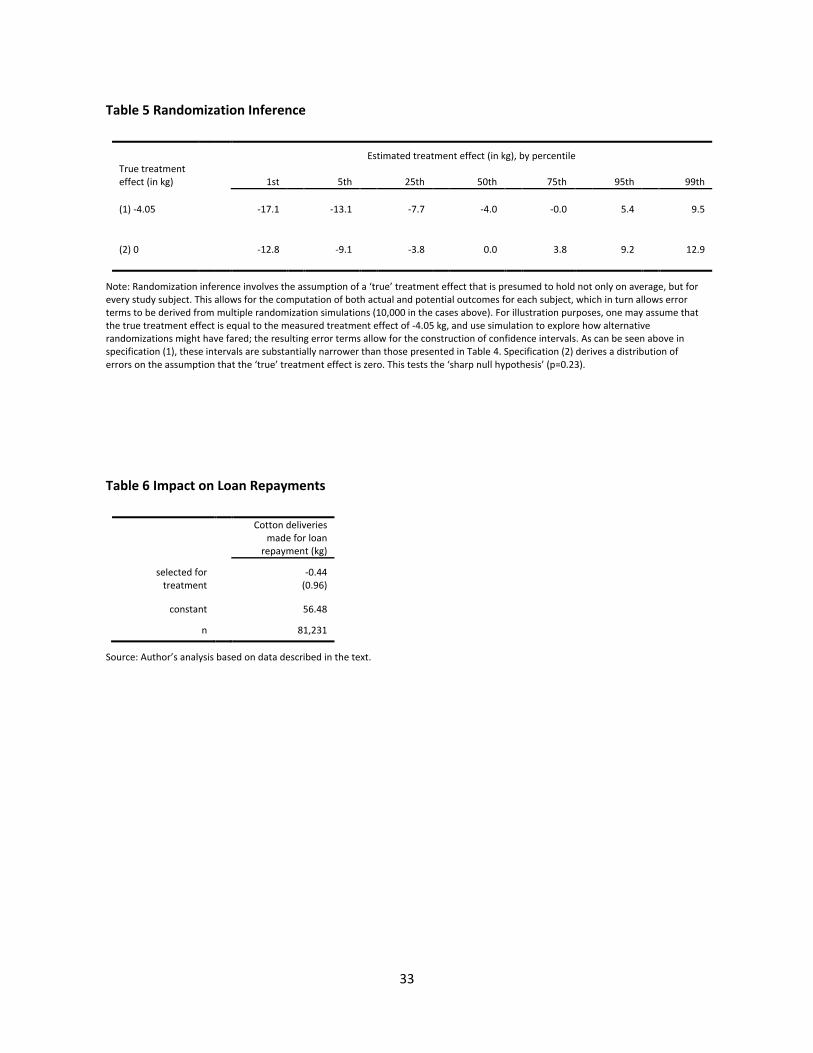
Finally, Fischer’s nonparametric permutation test (or “randomization inference”) is used to test
the “sharp null hypothesis” that the true treatment effect is zero for all subjects (see table 5). If
the true treatment effect is assumed to have been null for all subjects, nearly a quarter of
alternative randomizations would have resulted in an estimated treatment effect below the one
that was measured. The sharp null hypothesis cannot be dismissed.
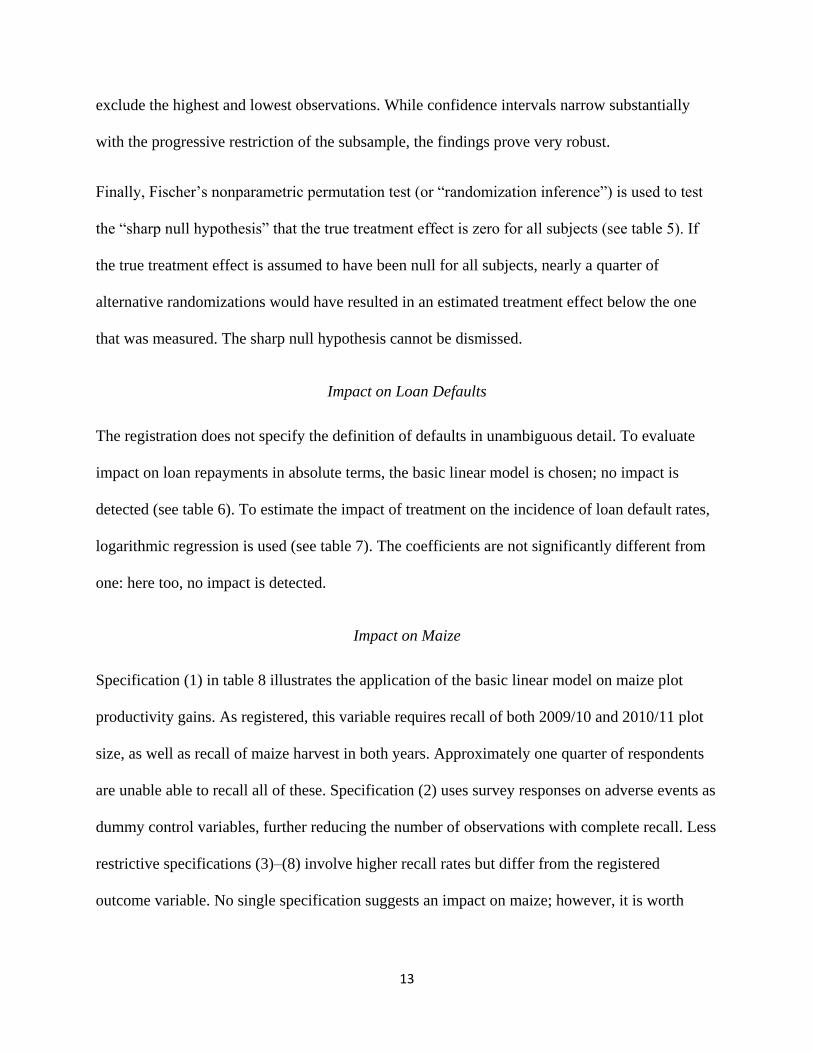
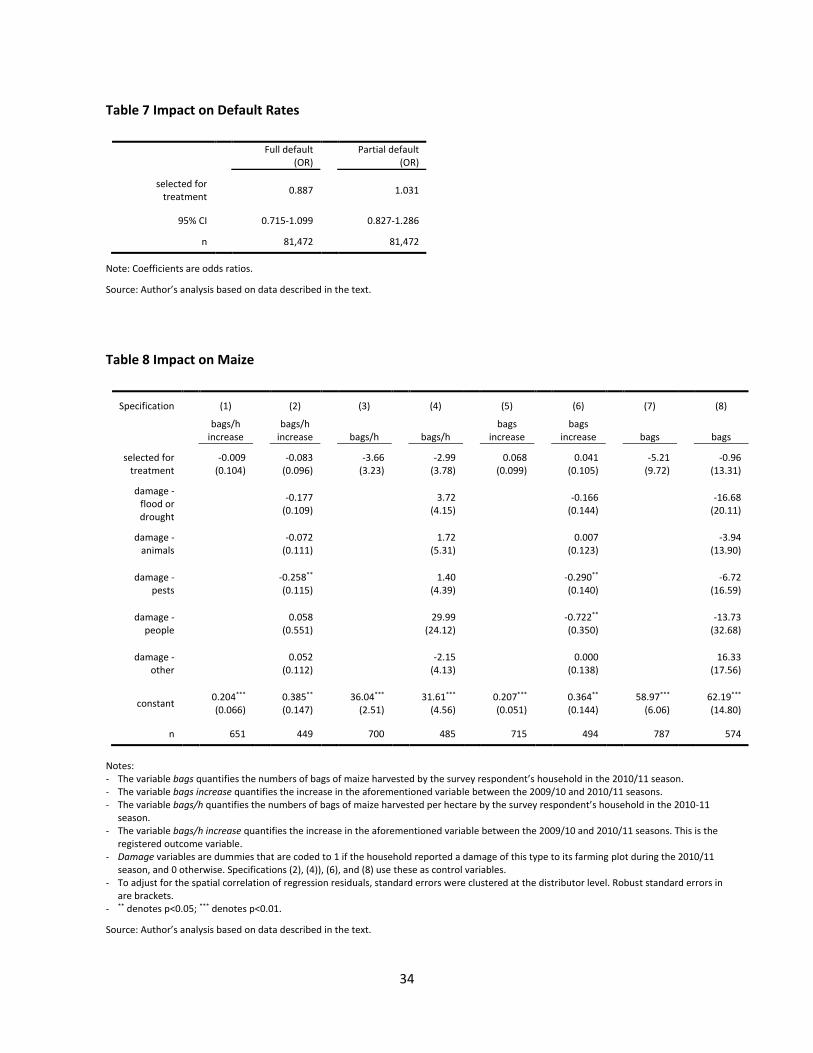
Impact on Loan Defaults
The registration does not specify the definition of defaults in unambiguous detail. To evaluate
impact on loan repayments in absolute terms, the basic linear model is chosen; no impact is
detected (see table 6). To estimate the impact of treatment on the incidence of loan default rates,
logarithmic regression is used (see table 7). The coefficients are not significantly different from
one: here too, no impact is detected.
Impact on Maize
Specification (1) in table 8 illustrates the application of the basic linear model on maize plot
productivity gains. As registered, this variable requires recall of both 2009/10 and 2010/11 plot
size, as well as recall of maize harvest in both years. Approximately one quarter of respondents
are unable able to recall all of these. Specification (2) uses survey responses on adverse events as
dummy control variables, further reducing the number of observations with complete recall. Less
restrictive specifications (3)–(8) involve higher recall rates but differ from the registered
outcome variable. No single specification suggests an impact on maize; however, it is worth
14
noting that effects can be picked up on other potential explanatory variables, such as the
incidence of reported crop damage by pests and by people (i.e., theft or vandalism).
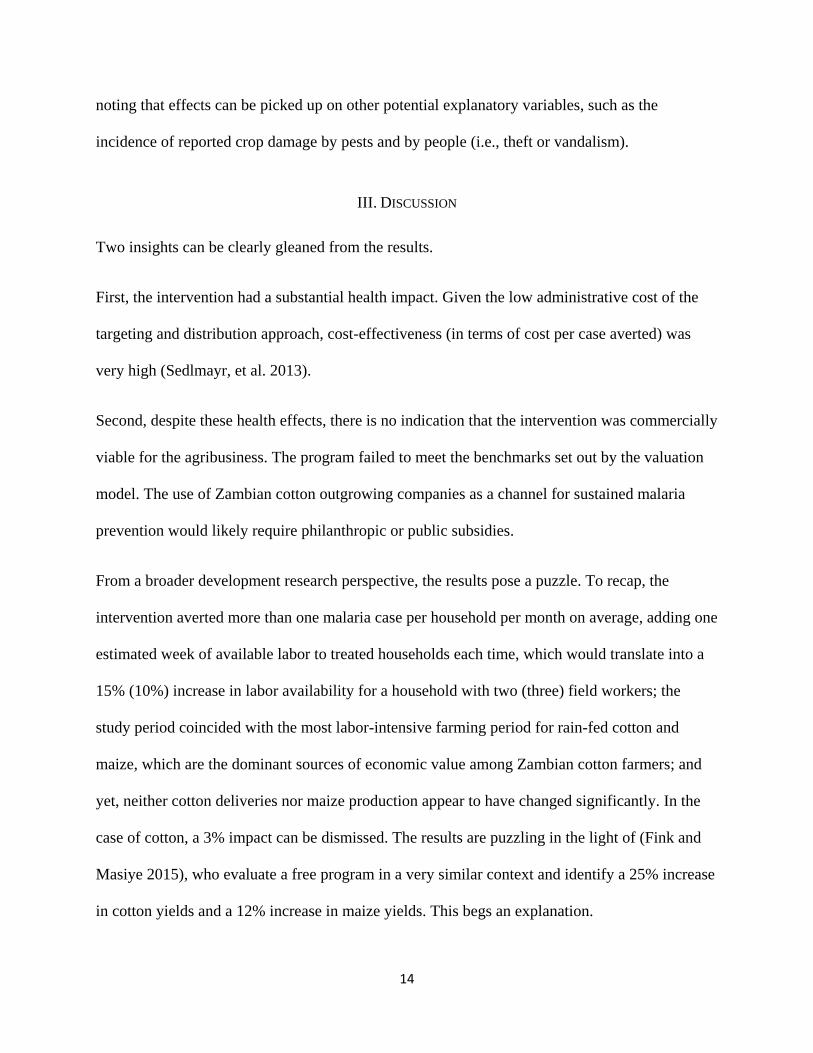
III. DISCUSSION
Two insights can be clearly gleaned from the results.
First, the intervention had a substantial health impact. Given the low administrative cost of the
targeting and distribution approach, cost-effectiveness (in terms of cost per case averted) was
very high (Sedlmayr, et al. 2013).
Second, despite these health effects, there is no indication that the intervention was commercially
viable for the agribusiness. The program failed to meet the benchmarks set out by the valuation
model. The use of Zambian cotton outgrowing companies as a channel for sustained malaria
prevention would likely require philanthropic or public subsidies.
From a broader development research perspective, the results pose a puzzle. To recap, the
intervention averted more than one malaria case per household per month on average, adding one
estimated week of available labor to treated households each time, which would translate into a
15% (10%) increase in labor availability for a household with two (three) field workers; the
study period coincided with the most labor-intensive farming period for rain-fed cotton and
maize, which are the dominant sources of economic value among Zambian cotton farmers; and
yet, neither cotton deliveries nor maize production appear to have changed significantly. In the
case of cotton, a 3% impact can be dismissed. The results are puzzling in the light of (Fink and
Masiye 2015), who evaluate a free program in a very similar context and identify a 25% increase
in cotton yields and a 12% increase in maize yields. This begs an explanation.
15
Explanation 1: Differences in Treatment Intensity
One notable difference between the net program evaluated here and the free net program
evaluated by Fink and Masiye is the intensity of household-level treatment. Their free net
program complied more closely with WHO guidelines on universal coverage (WHO 2007) by
aiming to offer one net per uncovered sleeping space to households in the treatment group, while
the study presented here aimed for one single net.
WHO compliance per se is not a satisfactory explanation for the absence of economic effects:
recall that the desired health effects did materialize in the trial at hand. (Indeed, these health
effects are so substantial, and the intervention was so cost-effective, that one may question the
virtues of universal coverage: it appears that opportunities to reduce malaria incidence at the
margin through ad hoc net distributions—even in the absence of reliable household-level net
coverage data—can be worthwhile).
But as a consequence of their distribution rule, the number of nets successfully transferred in
Fink and Masiye’s free net program amounted to 2.41 per treatment household on average,
substantially more than the 0.94 nets studied here. This helps explain the majority of the
divergence in economic impacts. That said, the same paper also evaluates a program that
provides nets on loan and achieves a much lower take-up (0.81 nets per household on average),
while the estimated impact on cotton yields remains in the vicinity of 25%. (Maize impacts drop
from 12% to 6%).
Explanation 2: Differences in Yield Measurement
This paper measures maize output similarly to Fink and Masiye. However, it relies on
administrative sources for cotton deliveries, while Fink and Masiye use household surveys that

16
elicit self-reported cotton yields. As mentioned above, cotton deliveries may not be equivalent to
true cotton yield: any household could choose to side-sell a share of their cotton output instead of
honoring their contractual obligation with the company. As illustrated in appendix A, the
company rewards surplus volumes with higher prices because it assumes side-selling to be
positively associated with cotton production. If this is true, it may help explain the divergence in
results to a degree: increases in cotton yield could have materialized, but then been side-sold
before delivery.
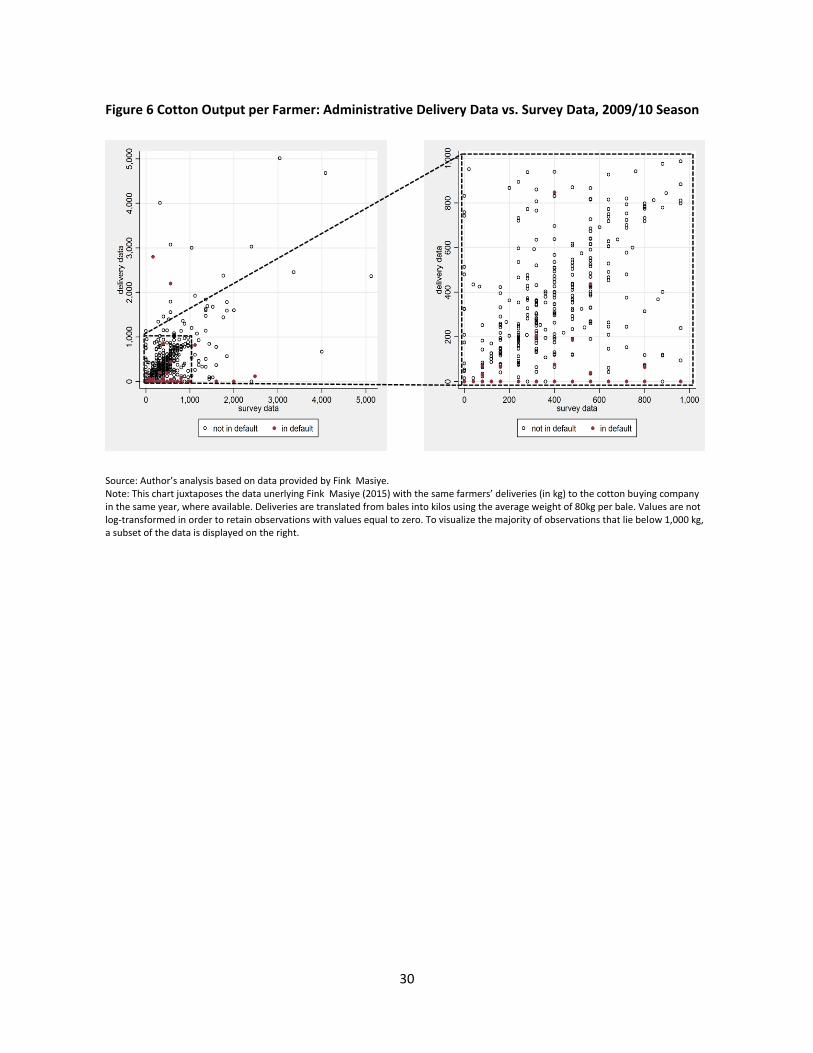
Figure 6 juxtaposes survey data from Fink and Masiye with administrative data on deliveries to
the outgrowing company in the same year (which is available for approximately 90% of the
farmers in their sample). While survey data on cotton yields are approximately 15% higher than
delivery data on average (which may provide a sense of the volume of side-selling)4, the rate of
apparent side-selling does not appear to be clearly associated with cotton volumes. The sample
had not been on the precipice of some threshold volume typically associated with high rates of
side-selling; there is no indication that the propensity to side-sell should have increased in the
treatment group.5
That said, side-selling does diminish the returns that the company can expect to reap from any
investments in farmer productivity (including the health investment studied here). It leads to the
inefficient contract described in appendix A and more generally contributes to an apparent cycle
of low investment and low productivity. The nonmarket alternative of buyer coordination and the
4. One caveat is that this assumes honest survey responses in the presence of side-selling. A second caveat is that any possible
side-“buying” is not quantified, so the data technically refer to net side selling.
5. Indeed, behavioral reasoning suggests that treatment could reduce the propensity to side-sell by triggering reciprocity. The
opposite may hold for the 4.6% of treatment households who had been allocated to the treatment group but did not end up
receiving a net. Indeed, leakage is negatively associated with cotton deliveries. However, this may be a matter of selection bias,
and controlling for leakage does not render treatment effects significant.
17
outright formation of monopsonies in diverse African countries is also associated with diverse
failures (Short, Barreiro‐Hurle and Balié 2014). There may be substantial promise in
microeconomic innovations that improve contractual design, and in behavioral innovations that
improve relationships between farmers and buyers. Examples may include improved loan
enforcement through farmer identification (Giné, Goldberg and Yang 2012) or collateralization
(Jack, et al. 2016); the introduction of savings and/or commitment devices (Casaburi and
Macchiavello 2016); and more broadly the stimulation of loyalty (Casaburi and Macchiavello,
2015).
Explanation 3: Unexplained Differences, Implying Failed Replication
The above explanations provide some intuition for why the cotton output effects measured here
might have been expected to fall below those of previous research. However, even when both
explanations are considered jointly, they fail to explain the magnitude of the difference in results.
Ultimately, this paper does strike a sobering discord with recent encouraging evidence on the
agricultural productivity effects of malaria control. It appears that hidden factors moderate these
effects, and that the nature of these moderators is not yet well understood.
From a theoretical standpoint, there are numerous reasons for why labor shocks (such as the
health effects discussed above) may fail to translate into an impact on cotton yield.
For instance, in the presence of complete and competitive markets, the health intervention should
not translate into changes in the household’s agricultural output, as the household’s supply and
demand decisions would be separable (Krishna 1964). Apparent labor market imperfections are
one frequently cited violation of the assumptions underlying separation, but the hypothesis that
farm labor allocation is independent of household structure has withstood empirical scrutiny

18
(Benjamin 1992). Separation is commonly invoked in empirical studies of agricultural
production in poor countries, and has been presented as robust to the nonexistence of some
markets (Udry 1999).
The possible absence of labor markets does not negate that households have more than one
option for how to invest their time. Even if these options were extremely limited (say, to farming
and the production of home-made goods), the rational allocation of labor would entail the
assimilation of marginal returns to labor across these activities. In such an environment, the
rational response to a labor shock may be to disproportionally reduce labor allocation to that
activity for which output reacts less elastically. In other words, it may be precisely because
cotton output reacts elastically to weeding activities that farmers may dampen shocks on this
activity at the cost of less time-sensitive ones. While the extent of the production of home-made
goods in the sample and during the farming season is not known, the season does overlap with
the school year, so school-age household members may be one source of labor in times of urgent
need.
Furthermore, even farmers who are subject to labor constraints may still have the capacity to
mobilize substantial labor reserves in times of need. Fafchamps (1993) plausibly assumes that
farmers value leisure and views labor choices as the result of a dynamic optimization process in
response to a series of exogenous shocks. The model can be taken as a basis for arguing that
malaria predominantly enters the production function not via actual, but via expected labor
constraints (for which farmers make allowances in the process of determining plot size); and by
extension, that the nets in in the study at hand may have arrived at a time when plot sizes had
been determined—too late to have a large impact on the production of most farmers in the study
season 2010/11. While this is plausible, one might expect the treatment group to anticipate
19
reduced labor constraints, plant more aggressively, and achieve higher yields in the coming
season—and this is not borne out: to the extent it is possible to identify study farmers in the
company’s farmer database from the subsequent season,6 rerunning the regressions from table 4
continues to estimate insignificant treatment effects.
A behavioral explanation for the results could be grounded in reference-dependent, non-
optimizing behavior in the spirit of satisficing (Simon 1956). Farmers may only aspire to limited
yields, but if illness triggers an experience of perceived shortfall or loss, they may compensate
aggressively and with little concern for leisure (Selten 1998). Unlike Fafchamps (1993), this
does not imply that yields should rise in future seasons.
IV. CONCLUSION
It appears clear that the investment was not profitable for the company. Meanwhile, as farmers
experienced reduced sickness, benefits for them are beyond doubt. How gains in available time
were allocated among diverse activities remains unclear, but these activities do not appear to
have predominantly involved cotton or maize farming. Multiple strands of previous research can
help make sense of this result, though even neoclassical reasoning encounters no puzzle in it.
While neoclassical reasoning also provides a parsimonious explanation for why Zambia’s cotton
industry has not independently provided mosquito nets to its farmers in the past, it struggles to
illuminate why farmers rarely adopt them independently (Dupas 2014).
Overall, while the results can be reconciled with previous microeconomic research on the
smallholder labor and technology adoption, they tend to strike a discord with literature that
6. 48,272 study subjects (24,501 of control subjects and 23,771 of treatment subjects, i.e., 59% of both) can be matched between
the two databases via national registration card numbers.
20
draws unqualified links between health and economic performance. The conditions under which
health shocks reduce agricultural output may not yet be adequately understood.
21
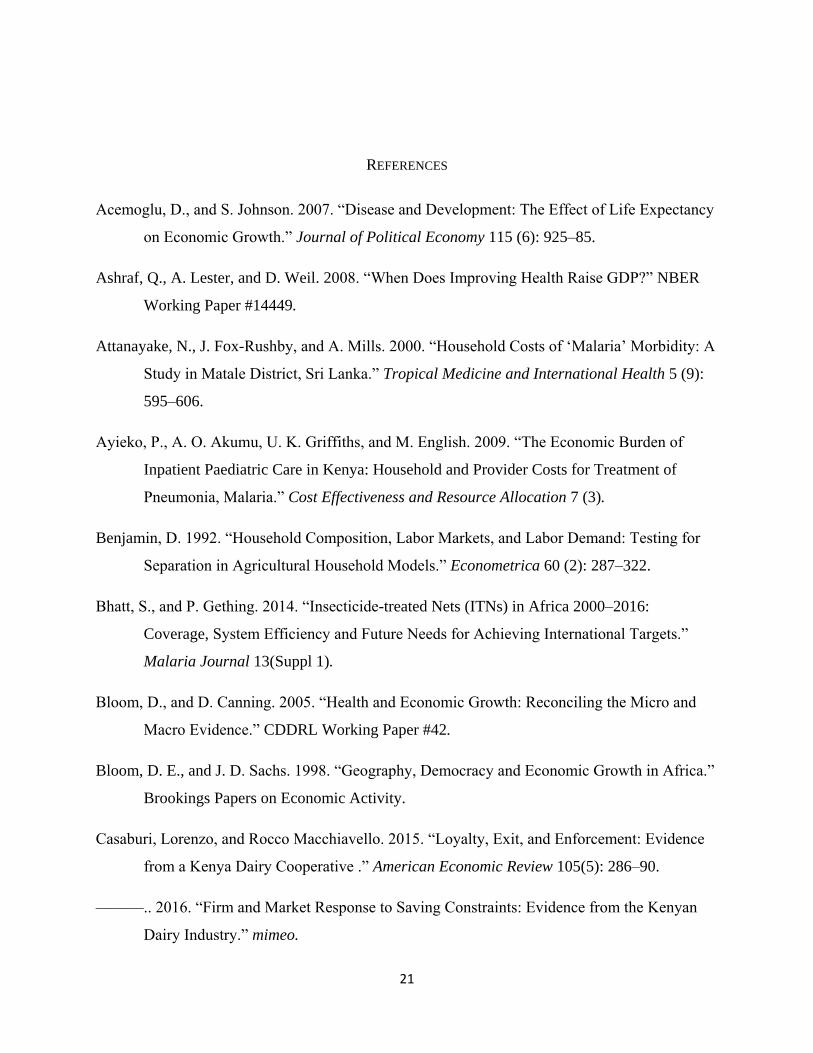
REFERENCES
Acemoglu, D., and S. Johnson. 2007. “Disease and Development: The Effect of Life Expectancy
on Economic Growth.” Journal of Political Economy 115 (6): 925–85.
Ashraf, Q., A. Lester, and D. Weil. 2008. “When Does Improving Health Raise GDP?” NBER
Working Paper #14449.
Attanayake, N., J. Fox-Rushby, and A. Mills. 2000. “Household Costs of ‘Malaria’ Morbidity: A
Study in Matale District, Sri Lanka.” Tropical Medicine and International Health 5 (9):
595–606.
Ayieko, P., A. O. Akumu, U. K. Griffiths, and M. English. 2009. “The Economic Burden of
Inpatient Paediatric Care in Kenya: Household and Provider Costs for Treatment of
Pneumonia, Malaria.” Cost Effectiveness and Resource Allocation 7 (3).
Benjamin, D. 1992. “Household Composition, Labor Markets, and Labor Demand: Testing for
Separation in Agricultural Household Models.” Econometrica 60 (2): 287–322.
Bhatt, S., and P. Gething. 2014. “Insecticide-treated Nets (ITNs) in Africa 2000–2016:
Coverage, System Efficiency and Future Needs for Achieving International Targets.”
Malaria Journal 13(Suppl 1).
Bloom, D., and D. Canning. 2005. “Health and Economic Growth: Reconciling the Micro and
Macro Evidence.” CDDRL Working Paper #42.
Bloom, D. E., and J. D. Sachs. 1998. “Geography, Democracy and Economic Growth in Africa.”
Brookings Papers on Economic Activity.
Casaburi, Lorenzo, and Rocco Macchiavello. 2015. “Loyalty, Exit, and Enforcement: Evidence
from a Kenya Dairy Cooperative .” American Economic Review 105(5): 286–90.
———.. 2016. “Firm and Market Response to Saving Constraints: Evidence from the Kenyan
Dairy Industry.” mimeo.

22
Chima R. I., C. A. Goodman, and A. Mills. 2003. “The Economic Impact of Malaria in Africa: A
Critical Review of the Evidence.” Health Policy 63 (1): 17–36.
Cleave, J. 1974. African Farmers: Labor Use in the Development of Smallholder Agriculture.
New York: Praeger.
Cohen, J., and P. Dupas. 2010. “Free Distribution or Cost-Sharing? Evidence from a
Randomized Malaria Prevention Experiment.” The Quarterly Journal of Economics 125
(1): 1–45.
Conly, C. N. 1972. “The Impact of Malaria on Economic Development.” The American Journal
of Tropical Medicine and Hygiene 21 (5): 668–74.
Dillon, A, J Friedman, and P Serneels. 2014. “(2014) Health Information, Treatment, and
Worker Productivity: Experimental Evidence from Malaria Testing and Treatment among
Nigerian Sugarcane Cutters.” Institute for the Study of Labor Discussion Paper #8074.
Dupas, P. 2014. “Short-Run Subsidies and Long-Run Adoption of New Health Products:
Evidence from a Field Experiment.” Econometrica 82: 197–228.
Fafchamps, M. 1993. “Sequential Labor Decisions under Uncertainty: An Estimable Household
Model of West African Farmers.” Econometrica 61 (5): 1173–97.
Fink, Guenther, and Felix Masiye. 2012. “Assessing the Impact of Scaling-up Bednet Coverage
through Agricultural Loan Programmes: Evidence from a Cluster Randomised Controlled
Trial in Katete, Zambia.” Transactions of the Royal Society of Tropical Medicine and
Hygiene 106 (11): 660–67.
———.. 2015. “Health and Agricultural Productivity: Evidence from Zambia.” Journal of
Health Economics 42: 151–64.
Gallup, John L., and Jeffrey D. Sachs. 2001. “The Economic Burden of Malaria.” The American
Journal of Tropical Medicine and Hygiene 64 (1–2 Suppl): 85–96 .

23
Giné, Xavier, Jessica Goldberg, and Dean Yang. 2012. “Credit Market Consequences of
Improved Personal Identification: Field Experimental Evidence from Malawi.” American
Economic Review 102 (6): 2923–54.
Hanson, K. 2004. “Public and Private Roles in Malaria Control: The Contributions of Economic
Analysis.” American Journal of Tropical Medicine and Hygiene 71(Suppl 2): 168–73.
Jack, W., M Kremer, Joost de Laat, and Tavneet Suri. 2016. “Joint Liability, Asset
Collateralization, and Credit Access: Evidence from Rainwater Harvesting Tanks in
Kenya.” mimeo.
Krishna, R. 1964. “Theory of the Firm: Rapporteur's Report.” Indian Economic Journal 11 (4):
514–25.
Lengeler, Christian. 2004. “Insecticide-treated Bed Nets and Curtains for Preventing Malaria.”
Cochrane Database of Systematic Reviews. Issue 2. Art. No.: CD000363.
Roll Back Malaria . 2011. Business Investing in Malaria Control: Economic Returns and
Healthy Workforce for Africa. Progress and Impact Series #6.
Sachs, Jeffrey, and Pia Malaney. 2002. “The Economic and Social Burden of Malaria.” Nature
415: 680–85.
Sauerborn, R., D. S. Shepard, M. B. Ettling, U. Brinkmann, A. Nougtara, and H. J. Diesfeld.
1991. “Estimating the Direct and Indirect Economic Costs of Malaria in a Rural District
of Burkina Faso.” Tropical Medicine and Parasitology 42 (3): 219–23.
Sedlmayr, Richard, Guenther Fink, John M Miller, Duncan Earle, and Richard W Steketee. 2013.
“Health Impact and Cost-Effectiveness of a Private Sector Bed Net Distribution:
Experimental Evidence from Zambia.” Malaria Journal 12:102.
Selten, Reinhard. 1998. “Aspiration Adaptation Theory.” Journal of Mathematical Psychology
42 (2–3): 191–214.
Shephard, D. S., M. B. Ettling, U. Brinkmann, and R. Sauerborn. 1991. “The Economic Cost of
Malaria in Africa.” Tropical Medicine and Parasitology 42(3): 199–203.
24
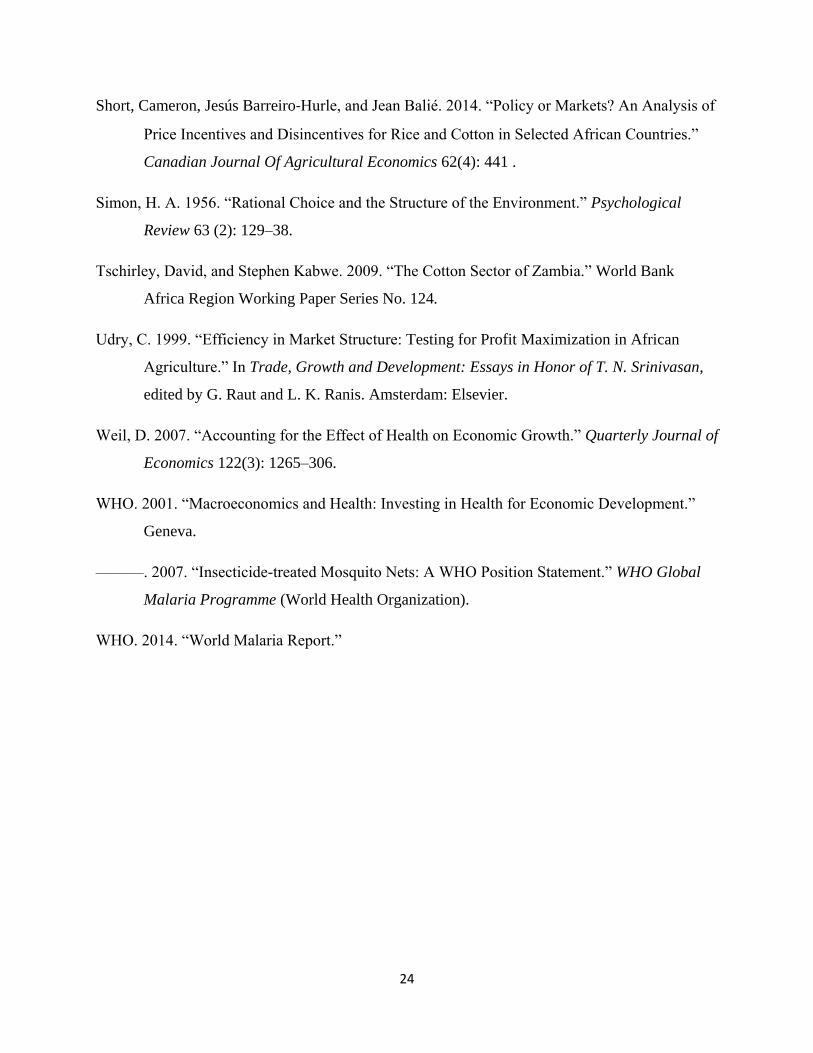
Short, Cameron, Jesús Barreiro‐Hurle, and Jean Balié. 2014. “Policy or Markets? An Analysis of
Price Incentives and Disincentives for Rice and Cotton in Selected African Countries.”
Canadian Journal Of Agricultural Economics 62(4): 441 .
Simon, H. A. 1956. “Rational Choice and the Structure of the Environment.” Psychological
Review 63 (2): 129–38.
Tschirley, David, and Stephen Kabwe. 2009. “The Cotton Sector of Zambia.” World Bank
Africa Region Working Paper Series No. 124.
Udry, C. 1999. “Efficiency in Market Structure: Testing for Profit Maximization in African
Agriculture.” In Trade, Growth and Development: Essays in Honor of T. N. Srinivasan,
edited by G. Raut and L. K. Ranis. Amsterdam: Elsevier.
Weil, D. 2007. “Accounting for the Effect of Health on Economic Growth.” Quarterly Journal of
Economics 122(3): 1265–306.
WHO. 2001. “Macroeconomics and Health: Investing in Health for Economic Development.”
Geneva.
———. 2007. “Insecticide-treated Mosquito Nets: A WHO Position Statement.” WHO Global
Malaria Programme (World Health Organization).
WHO. 2014. “World Malaria Report.”
25
Figures
Figure 1 Study Period
Notes: (1) In thousands of transactions. Source: Dunavant Cotton (2) Average rainfall in mm in study area (as defined by coordinates of survey respondents). Source: FEWS NET (3) Sum of confirmed malaria outpatient discharges, inpatient discharges, and deaths in health facilities across Zambia’s Southern, Eastern, Lusaka, and Central provinces, in thousands. Source: Zambia District Health Information System (4) In thousands of tons. Source: Dunavant Cotton
0
10
20
30
40
0
50
100
150
0
50
100
150
0
20
40
60
Oct Nov Dec Jan Feb Mar Apr May Jun Jul Aug Sep
seed transactions(1)
rainfall(2)
confirmed malaria cases(3)
cotton deliveries(4)
20112010
26
Figure 2 Study Design
Notes: (1) Administrative data includes loan, loan repayment, and cotton delivery transactions for the 2010/11 season. (2) Survey data includes demographic and health information, data on mosquito net ownership, and two-year maize yields. For more information on survey implementation, see Sedlmayr (2013). (3) The assigned surveyor found the home of the selected farmer. (4) A qualified household member was present and willing to be surveyed.
TREATMENT GROUP
39,963 farmers
(739 distributors)
Randomization
ADMINISTRATIVE
DATA(1) AVAILABLE
39,917 farmers
(739 distributors)
ADMINISTRATIVE DATA
UNAVAILABLE
46 farmers
ADMINISTRATIVE
DATA(1) AVAILABLE
41,555 farmers
(768 distributors)
ADMINISTRATIVE DATA
UNAVAILABLE
79 farmers
CONTROL GROUP
41,634 farmers
(768 distributors)
LISTING AS OF 23 DEC 2010
81,597 farmers
(1,507 distributors)
Survey sampling
SELECTED FOR
SURVEY(2)
720 farmers
(72 distributors)
NOT SELECTED
39,243 farmers
Survey sampling
SELECTED FOR
SURVEY(2)
720 farmers
(72 distributors)
NOT SELECTED
40,914 farmers
DWELLING REACHED(3)
499 farmers
(72 distributors)
NOT REACHED
221 farmers
DWELLING REACHED(3)
505 farmers
(72 distributors)
NOT REACHED
215 farmers
RESPONSE(4)
438 farmers
(72 distributors)
NO RESPONSE
61 farmers
RESPONSE(4)
458 farmers
(72 distributors)
NO RESPONSE
47 farmers

27
Figure 3 Self-reported Net Usage by Age Group
Source: Author’s analysis based on data described in the text; Zambia National Malaria Indicator Survey (‘MIS’) 2010
0%
20%
40%
60%
80%
0-4 5-9 10-14 15-19 20-24 25-29 30-34 35-39 40-44 45-49 50-54 55-59 60+
Selected for treatment
Not selected for treatment
MIS
28
Figure 4 Cotton Deliveries (81,472 Observations)
Source: Author’s analysis based on data described in the text.
29
Figure 5 Sensitivity of Outliers on Estimated Cotton Delivery Impact
Note: (1) Involves the progressive removal of the remaining observations with the highest and lowest values. For multiple observations with the same value, selection for removal occurs at random. Source: Author’s analysis based on data described in the text.
-40
-20
0
20
40
0% 5% 10% 15% 20% 25%
β coefficient
95% CI
share of observations dropped(1)
kg
30
Figure 6 Cotton Output per Farmer: Administrative Delivery Data vs. Survey Data, 2009/10 Season
Source: Author’s analysis based on data provided by Fink Masiye. Note: This chart juxtaposes the data unerlying Fink Masiye (2015) with the same farmers’ deliveries (in kg) to the cotton buying company in the same year, where available. Deliveries are translated from bales into kilos using the average weight of 80kg per bale. Values are not log-transformed in order to retain observations with values equal to zero. To visualize the majority of observations that lie below 1,000 kg, a subset of the data is displayed on the right.
31
Tables
Table 1 Balance Checks
Observations(1)
Not selected
for treatment
Selected
for treatment Differences p-value(2)
HH members aged under 5 894 0.98 0.99 0.01 0.894
HH members aged 5 - 14 894 2.04 1.98 -0.05 0.695
HH members aged 15 & over 894 3.47 3.29 -0.17 0.312
Cotton area (h) 2010/11 799 1.23 1.15 -0.08 0.455
Maize area (h) 2010/11 798 1.87 1.79 -0.08 0.673
Mosquito nets owned 894 1.17 2.04 0.87*** >0.001
Seed Loan (ZMK) 81,472 39,203 38,522 -681 0.301
Pesticide Loan (ZMK) 81,472 129,994 128,643 -1,351 0.528
Notes: (1) Differences in available observations stem from the following:
(a) loan data are available in the standard administrative database, while the other variables were collected through the survey; and (b) over 10% of survey respondents answered “don’t know” in response to questions about maize and cotton plot areas.
(2) *** denotes p<0.01. To adjust for the spatial correlation of regression residuals, standard errors were clustered at the distributor level. Source: Analysis by the author based on data described in the text; Sedlmayr, Fink, Miller, Earle, & Steketee (2013).
Table 2 Protocol Adherence
Survey Question: “Did this household receive a mosquito net from Dunavant this season?”
Not selected
for treatment
Selected for treatment
Yes 3 (0.7%) 413 (94.3%)
No 452 (98.7%) 20 (4.6%)
No response / don’t know 3 (0.7%) 5 (1.1%)
Total 458 (100%) 438 (100%)
Source: Reproduced from Sedlmayr, Fink, Miller, Earle, & Steketee (2013).
32
Table 3 Health Impact
Fever (OR) Malaria (OR)
selected for treatment
0.580***
0.511***
95% CI 0.427 - 0.788 0.335 - 0.782
n 5,712 5,712
Notes: - Coefficients are odds ratios. - Observations are at the level of individual household members. - Observations correspond to individuals within the households. - Estimates include 5-year-age-group dummies to control for age-specific health risks. - *** denotes p<0.01
Source: Sedlmayr, Fink, Miller, Earle, & Steketee (2013).
Table 4 Impact on Cotton Deliveries
Linear specifications Logarithmic specifications
(1) (2) (3) (4)
deliveries deliveries ln(deliveries) ln(deliveries)
selected for treatment
-4.05 2.14 selected for treatment
-0.014 -0.010
(13.88) (11.38) (0.022) (0.020)
seed loan 21.22***
ln(seed loan) 0.392***
(4.25)
(0.015)
pesticide loan 11.26***
ln (pesticide loan) 0.554***
(1.71)
(0.013)
constant 548.35*** 68.70***
constant 6.007*** 3.411***
(10.52) (16.99) (0.015) (0.044)
n 81,472 81,472 n 72,446 60,764
Notes: - Deliveries are denominated in kg, loans in US$. - To adjust for the spatial correlation of regression residuals, standard errors were clustered at the distributor level. - Robust standard errors are in brackets. - Sample sizes change in logarithmic specifications because of observations with zero values. - *** denotes p<0.01 Source: Author’s analysis as described in the text.
33
Table 5 Randomization Inference
Estimated treatment effect (in kg), by percentile True treatment effect (in kg) 1st 5th 25th 50th 75th 95th 99th
(1) -4.05
-17.1
-13.1
-7.7
-4.0
-0.0
5.4
9.5
(2) 0
-12.8
-9.1
-3.8
0.0
3.8
9.2
12.9
Note: Randomization inference involves the assumption of a ‘true’ treatment effect that is presumed to hold not only on average, but for every study subject. This allows for the computation of both actual and potential outcomes for each subject, which in turn allows error terms to be derived from multiple randomization simulations (10,000 in the cases above). For illustration purposes, one may assume that the true treatment effect is equal to the measured treatment effect of -4.05 kg, and use simulation to explore how alternative randomizations might have fared; the resulting error terms allow for the construction of confidence intervals. As can be seen above in specification (1), these intervals are substantially narrower than those presented in Table 4. Specification (2) derives a distribution of errors on the assumption that the ‘true’ treatment effect is zero. This tests the ‘sharp null hypothesis’ (p=0.23).
Table 6 Impact on Loan Repayments
Cotton deliveries made for loan
repayment (kg)
selected for treatment
-0.44 (0.96)
constant 56.48
n 81,231
Source: Author’s analysis based on data described in the text.
34
Table 7 Impact on Default Rates
Full default
(OR) Partial default
(OR)
selected for treatment
0.887
1.031
95% CI 0.715-1.099 0.827-1.286
n 81,472 81,472
Note: Coefficients are odds ratios.
Source: Author’s analysis based on data described in the text.
Table 8 Impact on Maize
Specification (1) (2) (3) (4) (5) (6) (7) (8)
bags/h
increase bags/h
increase bags/h bags/h bags
increase bags
increase bags bags
selected for treatment
-0.009 -0.083 -3.66 -2.99 0.068 0.041 -5.21 -0.96
(0.104) (0.096) (3.23) (3.78) (0.099) (0.105) (9.72) (13.31)
damage - flood or drought
-0.177 3.72 -0.166 -16.68
(0.109)
(4.15) (0.144)
(20.11)
damage - animals
-0.072 1.72 0.007 -3.94
(0.111)
(5.31) (0.123)
(13.90)
damage - pests
-0.258** 1.40 -0.290** -6.72
(0.115)
(4.39) (0.140)
(16.59)
damage - people
0.058 29.99 -0.722** -13.73
(0.551)
(24.12) (0.350)
(32.68)
damage - other
0.052 -2.15 0.000 16.33
(0.112)
(4.13) (0.138)
(17.56)
constant 0.204*** 0.385** 36.04*** 31.61*** 0.207*** 0.364** 58.97*** 62.19***
(0.066) (0.147) (2.51) (4.56) (0.051) (0.144) (6.06) (14.80)
n 651 449 700 485 715 494 787 574
Notes: - The variable bags quantifies the numbers of bags of maize harvested by the survey respondent’s household in the 2010/11 season. - The variable bags increase quantifies the increase in the aforementioned variable between the 2009/10 and 2010/11 seasons. - The variable bags/h quantifies the numbers of bags of maize harvested per hectare by the survey respondent’s household in the 2010-11
season. - The variable bags/h increase quantifies the increase in the aforementioned variable between the 2009/10 and 2010/11 seasons. This is the
registered outcome variable. - Damage variables are dummies that are coded to 1 if the household reported a damage of this type to its farming plot during the 2010/11
season, and 0 otherwise. Specifications (2), (4)), (6), and (8) use these as control variables. - To adjust for the spatial correlation of regression residuals, standard errors were clustered at the distributor level. Robust standard errors in
are brackets. - ** denotes p<0.05; *** denotes p<0.01.
Source: Author’s analysis based on data described in the text.

35

36
Appendix A: The Outgrowing Contract
Contract farmers receive loan 𝐿 from the company at the outset of the season and in return
contractually commit to delivering their entire cotton output 𝑄 to the company at the end of the
season. While the pricing of inputs is set by the company, loans do not nominally accrue interest
over time. Still, the company’s purchasing and lending operations are not easily separable, as
farmgate cotton prices are a function of loan volumes. The initial portion of farmgate crop
deliveries is used to repay the loan, using farmgate loan repayment price 𝑝𝑙 per kilogram of
cotton. For any crop volume beyond that, farmers get paid in cash, receiving farmgate cash price
𝑝𝑐 per kilogram of cotton.
Farmers who deliver no cotton, or insufficient cotton to repay their loans in full, are considered
to be in default and received no payment from the company. The cash payment 𝐶 to any given
farmer 𝑖 is therefore defined as
𝐶𝑖 = { (𝑄𝑖 −
𝐿𝑖
𝑝𝑙) 𝑝𝑐 𝑖𝑓 𝑄𝑖 >
𝐿𝑖
𝑝𝑙
0 𝑜𝑡ℎ𝑒𝑟𝑤𝑖𝑠𝑒
In the 2010/11 season, price 𝑝𝑙 was 0.67 US$, 𝑝𝑐 was 0.70 US$, and the average cash payment C
was 344 US$ (median: 237 US$). The difference in the two farmgate prices can be attributed to
the company’s judgment that farmers are more likely to side-sell quantities beyond those
required to cover the loan, as the perceived moral burden of doing so may be lower. As 𝑝𝑙 is
regarded as a mental anchor, a small bonus implicit in the higher 𝑝𝑐 was meant to nudge farmers
to honor their 2010/11 contract in full.

37
The risk of side-selling leads the company to refrain from committing to forward prices at the
outset of the season, although this is when farmers make investment decisions and obtain loans.
Announcing forward prices would make it easier for competitors to outbid the company if world
spot prices end up being high at the time of harvest, while it would create a liability for the
company if world spot prices end up being low. Any costs of hedging world price risk at the
outset of the season would not accrue to competitors, thereby enhancing their relative
competitiveness as buyers. As a consequence, farmgate prices end up being largely determined
by the world spot price for processed cotton. In an apparent market failure, this shifts price risk
to the farmers, likely reducing their willingness to specialize on cotton. It helps explain why
virtually all farmers in the sample grow maize as well.
38
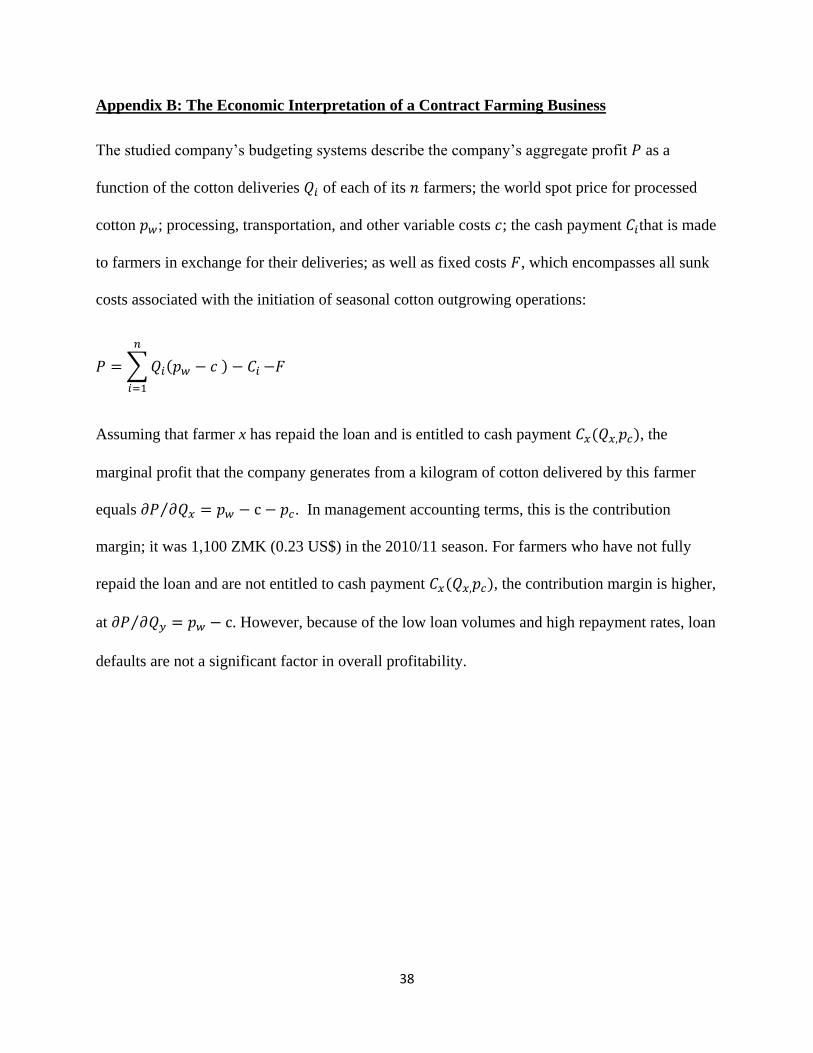
Appendix B: The Economic Interpretation of a Contract Farming Business
The studied company’s budgeting systems describe the company’s aggregate profit 𝑃 as a
function of the cotton deliveries 𝑄𝑖 of each of its 𝑛 farmers; the world spot price for processed
cotton 𝑝𝑤; processing, transportation, and other variable costs 𝑐; the cash payment 𝐶𝑖that is made
to farmers in exchange for their deliveries; as well as fixed costs 𝐹, which encompasses all sunk
costs associated with the initiation of seasonal cotton outgrowing operations:
𝑃 = ∑ 𝑄𝑖(𝑝𝑤 − 𝑐 ) − 𝐶𝑖 −𝐹
𝑛
𝑖=1
Assuming that farmer x has repaid the loan and is entitled to cash payment 𝐶𝑥(𝑄𝑥,𝑝𝑐), the
marginal profit that the company generates from a kilogram of cotton delivered by this farmer
equals 𝜕𝑃 𝜕𝑄𝑥⁄ = 𝑝𝑤 − c − 𝑝𝑐. In management accounting terms, this is the contribution
margin; it was 1,100 ZMK (0.23 US$) in the 2010/11 season. For farmers who have not fully
repaid the loan and are not entitled to cash payment 𝐶𝑥(𝑄𝑥,𝑝𝑐), the contribution margin is higher,
at 𝜕𝑃 𝜕𝑄𝑦⁄ = 𝑝𝑤 − c. However, because of the low loan volumes and high repayment rates, loan
defaults are not a significant factor in overall profitability.