Embed Size (px)
DESCRIPTION
If biodiversity is so precious and important, then why is it so threatened?. Distinguish between physical agents of biodiversity loss, and the underlying policy and social reasons - PowerPoint PPT Presentation
Citation preview
Dr. John A. FinnUniversity of Reading
If biodiversity is so precious and important, then why is it so threatened?
Distinguish between physical agents of biodiversity loss, and the underlying policy and social reasons
Existence of trade-offs- those actions harmful to one component of nature also provide valuable societal benefits (Tilman 1999)
Much of current environmental policy is rooted in policy developed for an older and much different world
Dr. John A. FinnUniversity of Reading
Social, cultural and economic driving forces that cause reduced biodiversity need addressing:
a) difference between value to individual and society need to be removed, especially where irreversible damage caused
b) reform social and economic policies that drive species loss
c) more research and institutions for biodiversity conservation. Science has an integral role in contributing to policy reform; “Society invests in science because science benefits society”
Folke et al, 1996
Dr. John A. FinnUniversity of Reading
Human population in the biodiversity hotspots.
25 biodiversity hotspots that have exceptionally high species richness and endemicity. Are also very threatened by human activities. (Cincotta et al. Nature 404: 990-992.)
Overhead- indicates relationship between biodiversity hotspots and population pressure
Dr. John A. FinnUniversity of Reading
“The world that exists in 100 and 1000 years will be of human design, whether deliberate or haphazard. Principles of design need to be based on science and ethics”
Tilman 1999
Dr. John A. FinnUniversity of Reading
References for previous section:
Biological diversity, ecosystems and the human scale. 1996. Folke et al. Ecological Applications 6: 1018- 1024. (electronically available through library)
Causes, consequences and ethics of biodiversity. 1999 Tilman, D. Nature 405: 208-211. (electronically available through registration at Nature website http://www.nature.com/nature/info/insights.html)
Human population in the biodiversity hotspots. Cincotta et al. Nature 404: 990-992.
Biodiversity and ecosystem function: pattern, process and prospects
Dr. John A. Finn
Department of Agriculture,The University of Reading
Dr. John A. FinnUniversity of Reading
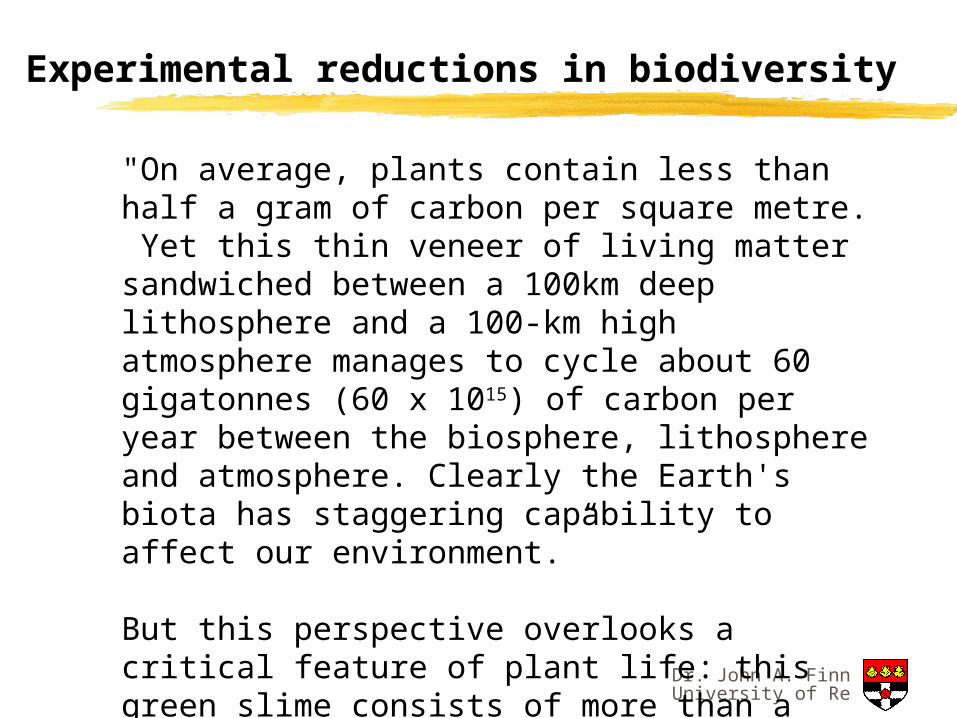
"On average, plants contain less than half a gram of carbon per square metre. Yet this thin veneer of living matter sandwiched between a 100km deep lithosphere and a 100-km high atmosphere manages to cycle about 60 gigatonnes (60 x 1015) of carbon per year between the biosphere, lithosphere and atmosphere. Clearly the Earth's biota has staggering capability to affect our environment.”
But this perspective overlooks a critical feature of plant life: this green slime consists of more than a quarter of a million species. What, if any, is the role of such extraordinary diversity? ”
Naeem [1999]
Experimental reductions in biodiversity
Dr. John A. FinnUniversity of Reading
Eco
syst
em f
un
ctio
n
Species richness
low highlow high low high
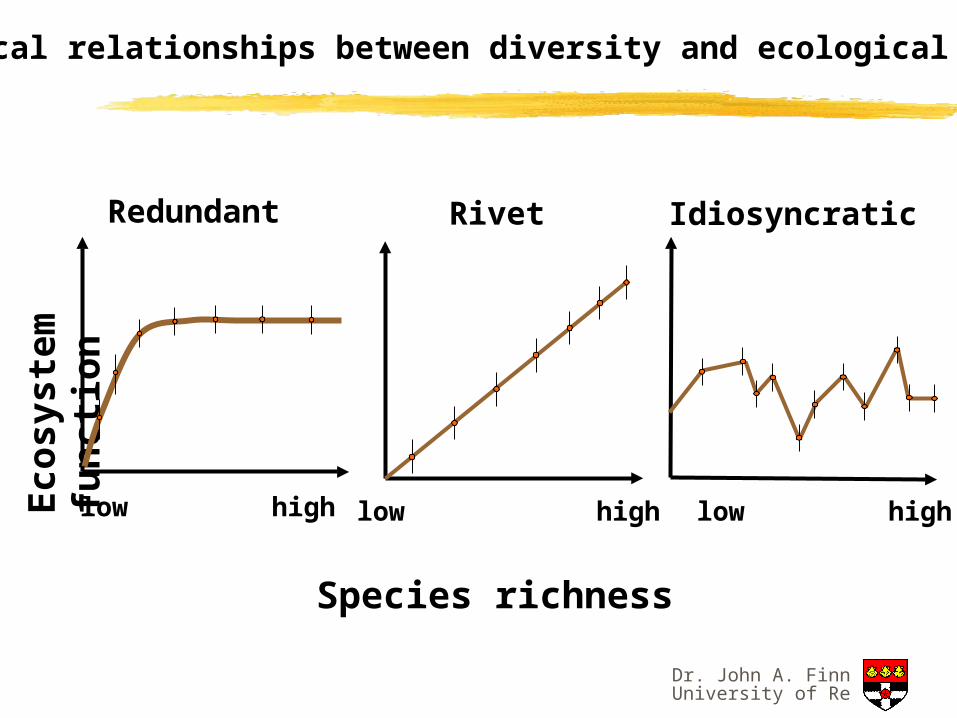
Redundant Rivet Idiosyncratic
Hypothetical relationships between diversity and ecological processes
Dr. John A. FinnUniversity of Reading
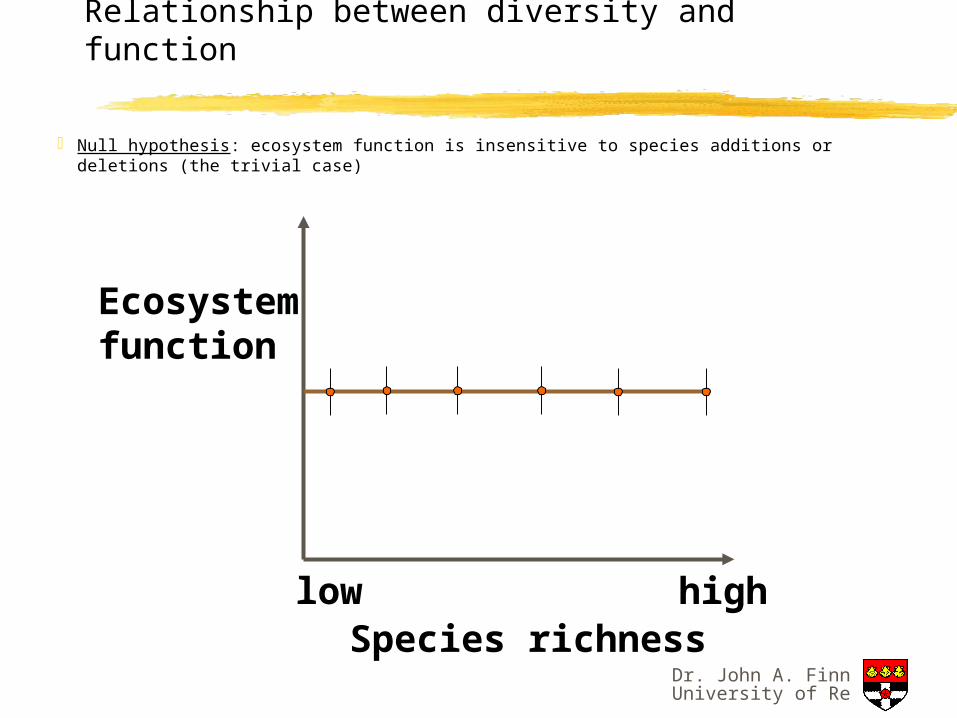
Relationship between diversity and function
Null hypothesis: ecosystem function is insensitive to species additions or deletions (the trivial case)
Ecosystem function
Species richnesslow high
Dr. John A. FinnUniversity of Reading
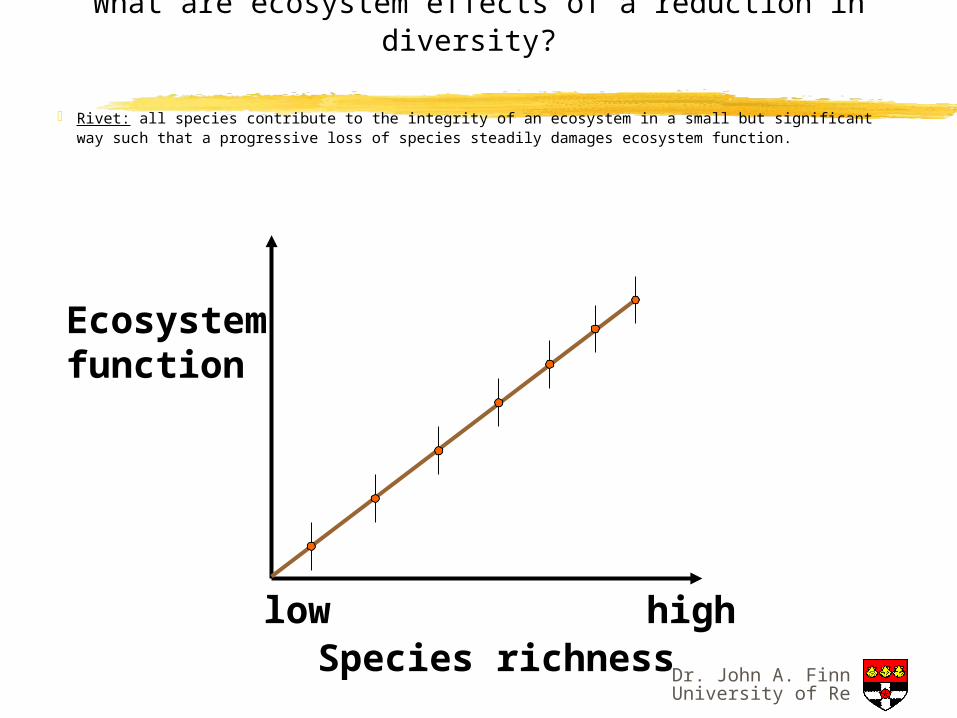
What are ecosystem effects of a reduction in diversity?
Rivet: all species contribute to the integrity of an ecosystem in a small but significant way such that a progressive loss of species steadily damages ecosystem function.
Ecosystem function
Species richnesslow high
Dr. John A. FinnUniversity of Reading
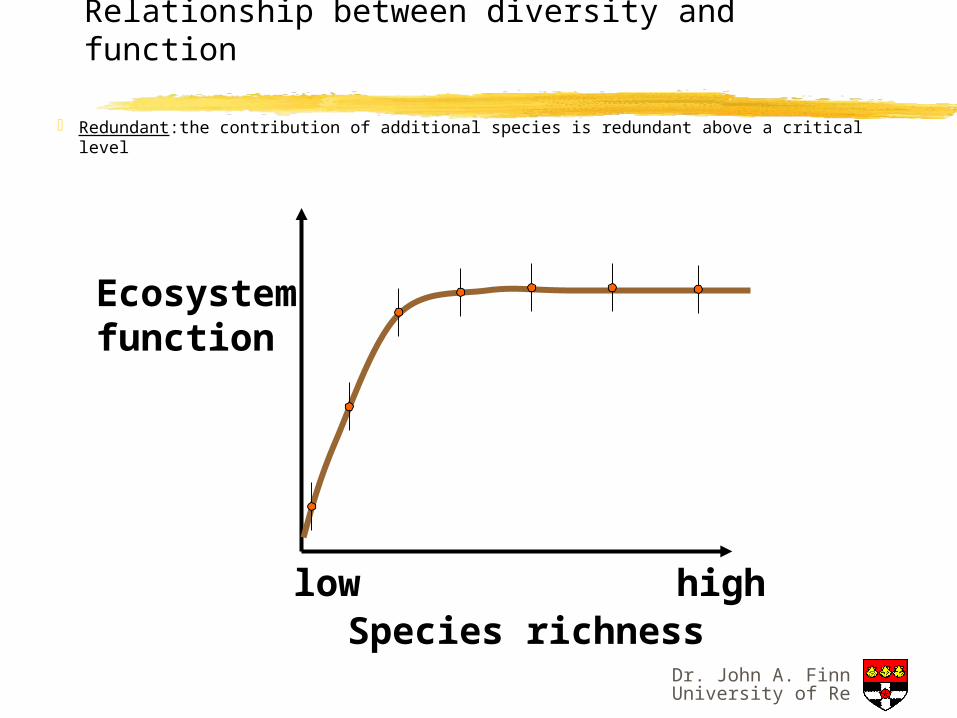
Relationship between diversity and function
Redundant:the contribution of additional species is redundant above a critical level
Ecosystem function
Species richnesslow high
Dr. John A. FinnUniversity of Reading
Relationship between diversity and function
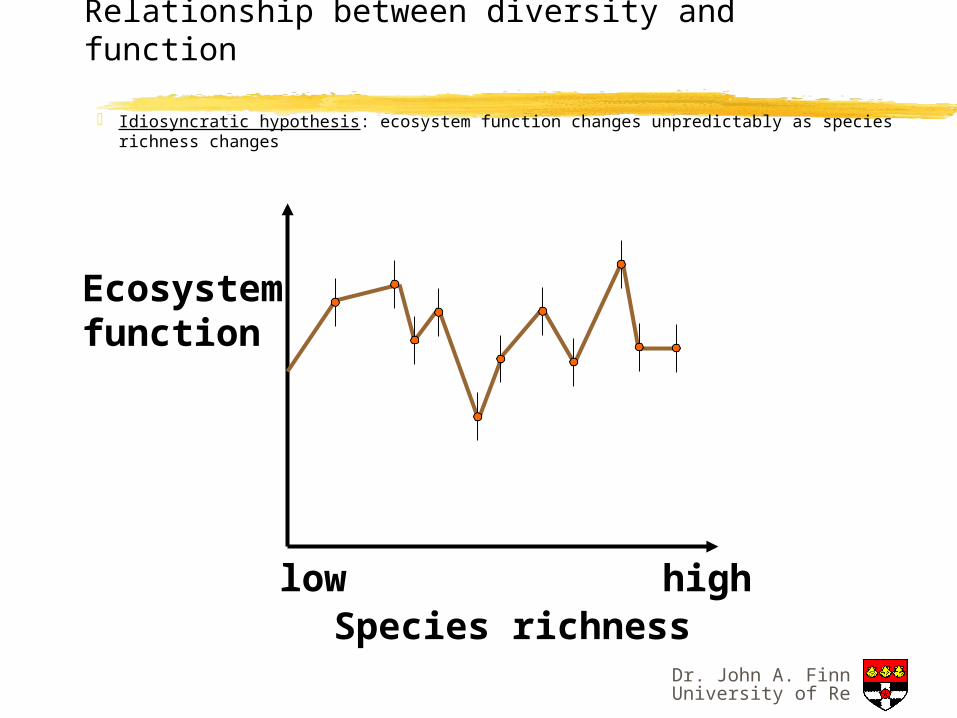
Idiosyncratic hypothesis: ecosystem function changes unpredictably as species richness changes
Ecosystem function
Species richnesslow high
Dr. John A. FinnUniversity of Reading
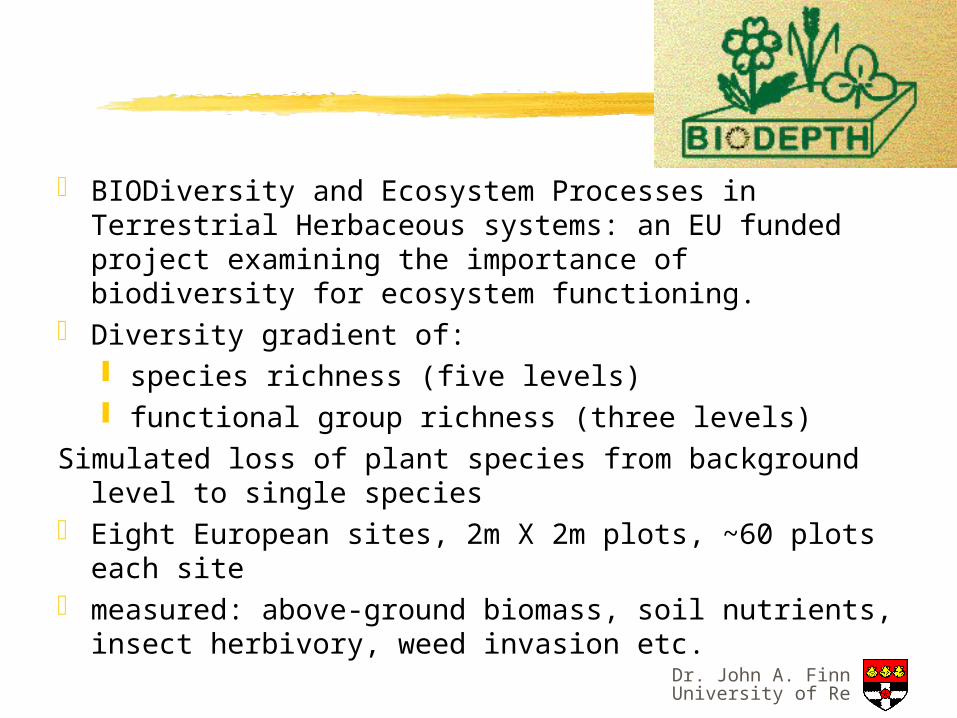
BIODiversity and Ecosystem Processes in Terrestrial Herbaceous systems: an EU funded project examining the importance of biodiversity for ecosystem functioning.
Diversity gradient of: species richness (five levels) functional group richness (three levels)
Simulated loss of plant species from background level to single species
Eight European sites, 2m X 2m plots, ~60 plots each site
measured: above-ground biomass, soil nutrients, insect herbivory, weed invasion etc.
Dr. John A. FinnUniversity of Reading
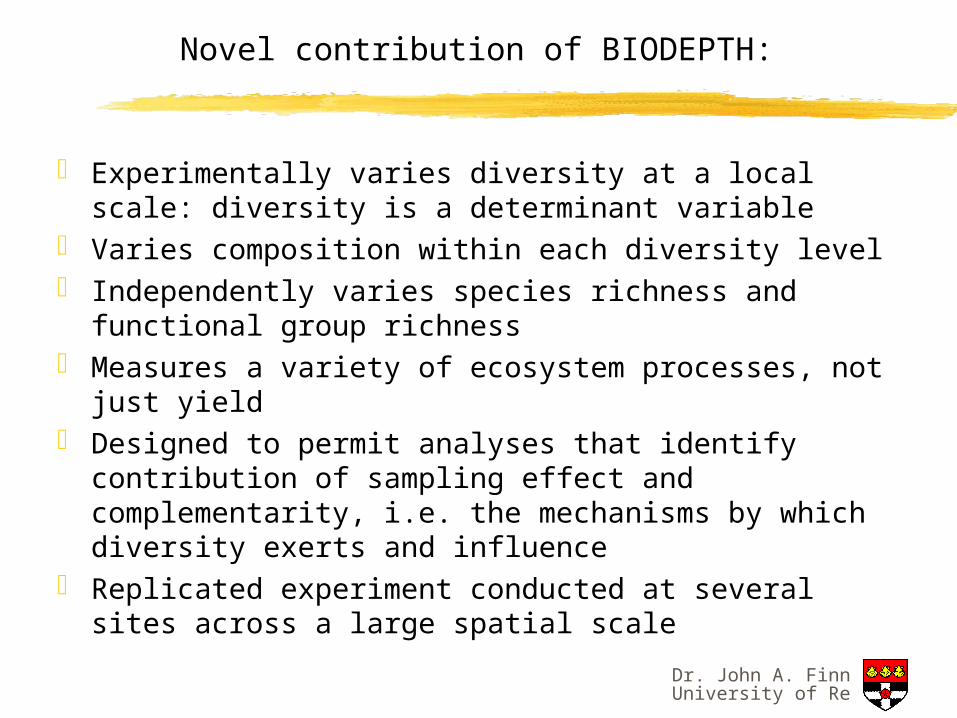
Novel contribution of BIODEPTH:
Experimentally varies diversity at a local scale: diversity is a determinant variable
Varies composition within each diversity level Independently varies species richness and functional
group richness Measures a variety of ecosystem processes, not just
yield Designed to permit analyses that identify
contribution of sampling effect and complementarity, i.e. the mechanisms by which diversity exerts and influence
Replicated experiment conducted at several sites across a large spatial scale
Dr. John A. FinnUniversity of Reading
32 16 8 4 2 10
500
1000
1500
Abo
vegr
ound
bio
mas
s (
g/m
2 )
32 16 8 4 2 10
500
1000
1500
32 16 8 4 2 10
500
1000
1500 Switzerland
32 16 8 4 2 10
500
1000
1500Greece
32 16 8 4 2 10
500
1000
1500
ANOVA: P < 0.001
Ireland
32 16 8 4 2 10
500
1000
1500 Sweden
32 16 8 4 2 10
500
1000
1500 UK (Sheffield)
D e c r e a s i n g s p e c i e s r i c h n e s s ( l o g2
s c a l e )
32 16 8 4 2 10
500
1000
1500
ANOVA: P < 0.01
UK (Silwood)
PortugalGermany
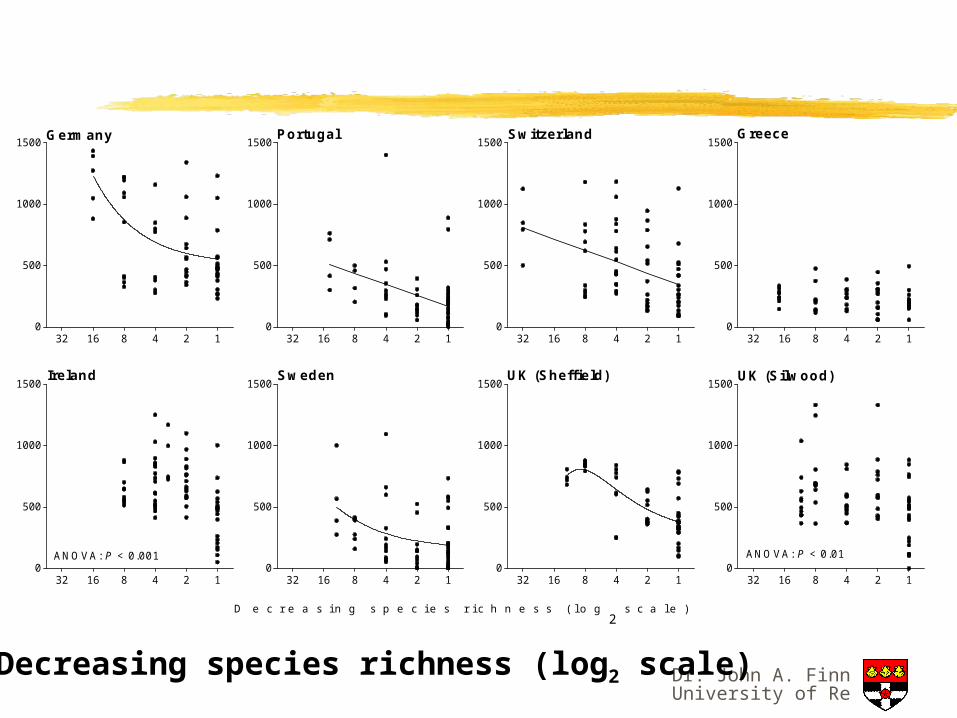
Decreasing species richness (log2 scale)
Dr. John A. FinnUniversity of Reading
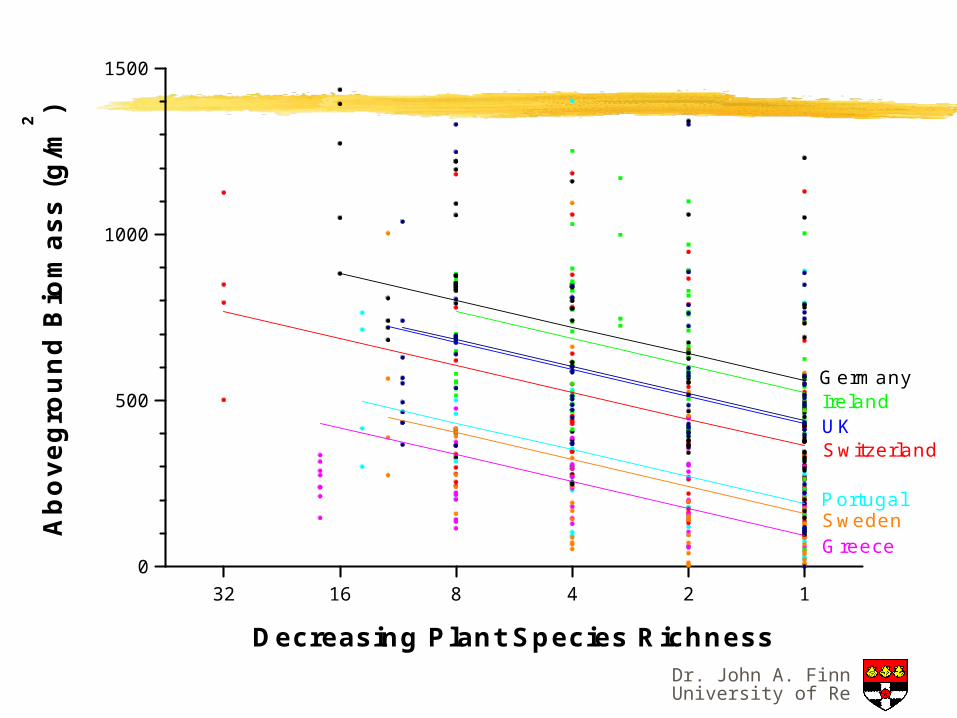
The previous slide show the relationship between diversity and aboveground biomass at each of the local sites (countries). When each data set from individual sites were analysed individually, the relationship was best described by a variety of models: linear (Portugal and Switzerland); curvilinear ( Germany, Sweden, Sheffield); ANOVA (Ireland and Silwood).
Dr. John A. FinnUniversity of Reading
32 16 8 4 2 10
500
1000
1500
GreeceSwedenPortugal
UKIreland
Switzerland
Germany
Ab
ove
gro
un
d B
iom
ass
(g/m
2 )
Decreasing Plant Species Richness
Dr. John A. FinnUniversity of Reading
The previous slide shows a ‘meta-analysis’ (combined analysis) of all of the data simultaneously. The analyses attributed variation mostly to location (30% of variation), diversity (20%) and species composition (40%). There was no significant diversity*location interaction. This means that the shape of the relationship between biomass and diversity at each site did not differ significantly. Thus, overall, the relationship was described as a log-linear reduction in biomass as diversity decreased. This corresponds to a general reduction of about 80 g biomass per sq. metre for each halving of species richness in European grasslands.
Dr. John A. FinnUniversity of Reading
Explanations for differences between single sites and meta-analysis
(i) all sites conform to the same underlying pattern seen in the overall analysis, and differences between individual sites are due to reduced sample size and statistical power
(ii) sites do differ in their responses, but the overall analysis is not powerful enough to reveal a significant location-by-species richness relationship
(iii) a significant general pattern emerges despite differences in detail at individual locations; while at any single location the effect of changes in species richness may vary from strong (e.g. Portugal, Switzerland) to undetectable (e.g. Greece), but on average we would expect productivity to decline as species richness declines.

Dr. John A. FinnUniversity of Reading
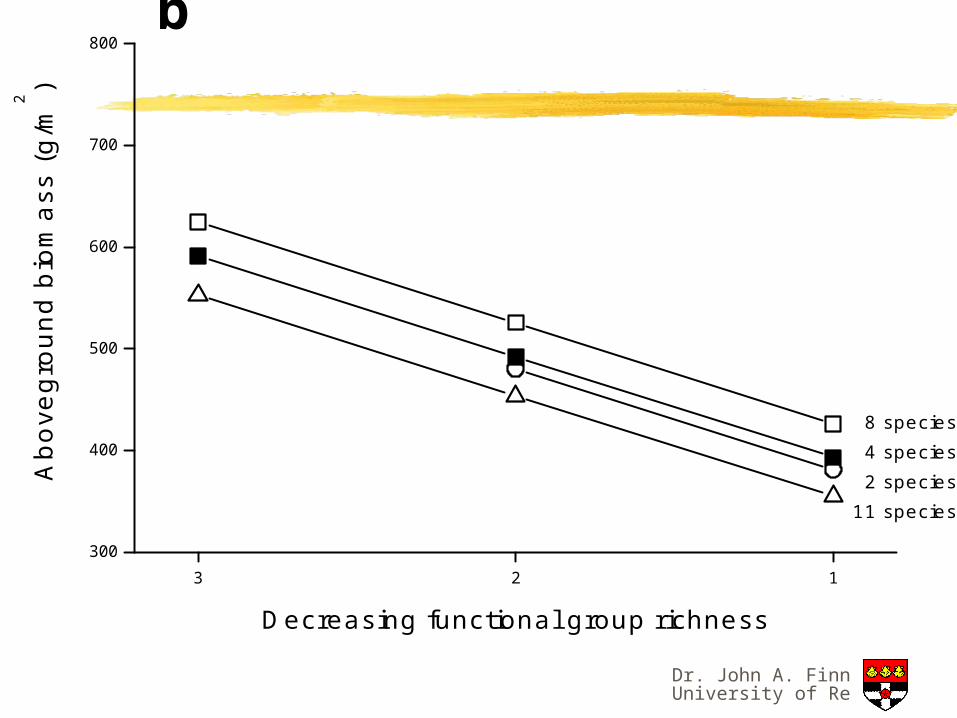
3 2 1300
400
500
600
700
800b
8 species 4 species 2 species11 species
Ab
ove
gro
un
d b
iom
ass
(g
/m2 )
Decreasing functional group richness
Dr. John A. FinnUniversity of Reading
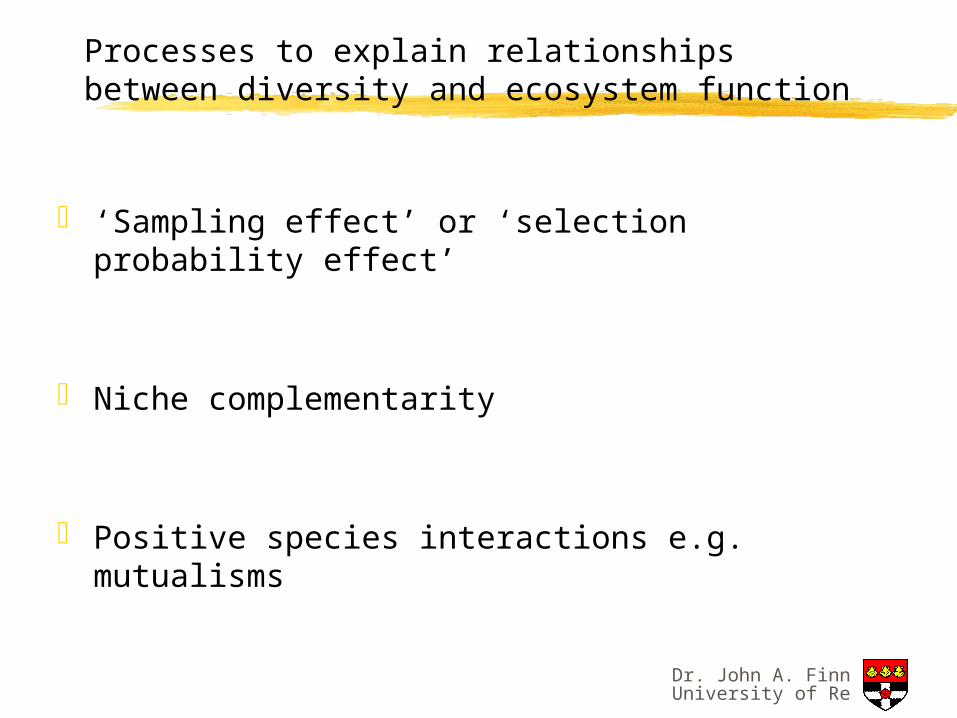
Processes to explain relationships between diversity and ecosystem function
‘Sampling effect’ or ‘selection probability effect’
Niche complementarity
Positive species interactions e.g. mutualisms
Dr. John A. FinnUniversity of Reading
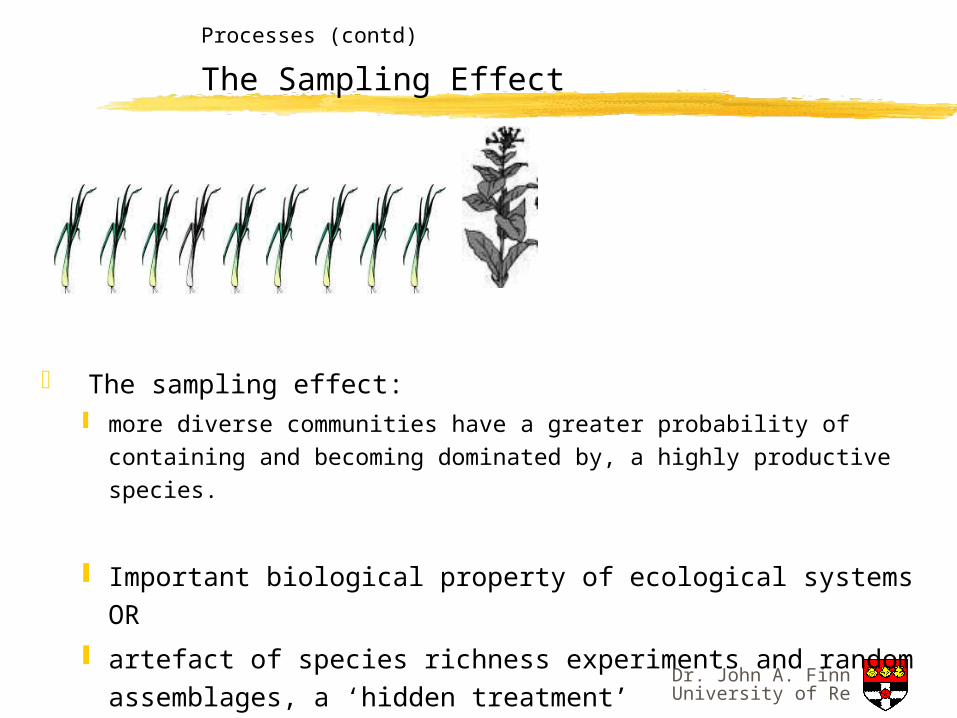
Processes (contd)
The Sampling Effect
The sampling effect: more diverse communities have a greater probability of containing
and becoming dominated by, a highly productive species.
Important biological property of ecological systems OR
artefact of species richness experiments and random assemblages, a ‘hidden treatment’
Dr. John A. FinnUniversity of Reading
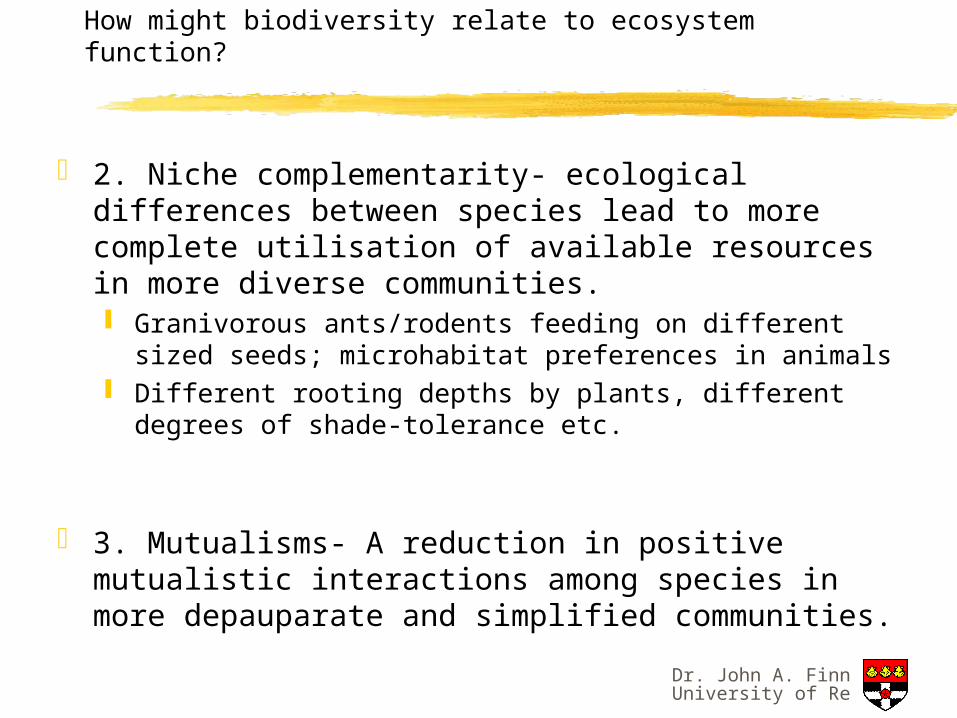
How might biodiversity relate to ecosystem function?
2. Niche complementarity- ecological differences between species lead to more complete utilisation of available resources in more diverse communities. Granivorous ants/rodents feeding on different sized
seeds; microhabitat preferences in animals Different rooting depths by plants, different degrees of
shade-tolerance etc.
3. Mutualisms- A reduction in positive mutualistic interactions among species in more depauparate and simplified communities.
Dr. John A. FinnUniversity of Reading
FG 2
FG 3
FG 1SP 1
SP 2
SP 3 SP 4
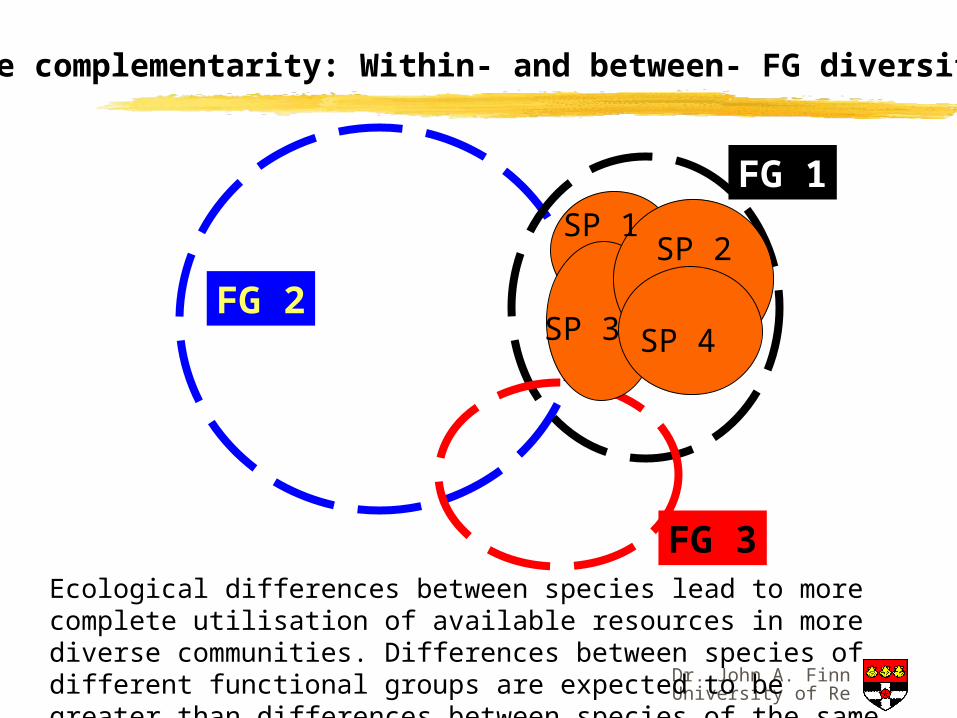
Niche complementarity: Within- and between- FG diversity
Ecological differences between species lead to more complete utilisation of available resources in more diverse communities. Differences between species of different functional groups are expected to be greater than differences between species of the same FG
Dr. John A. FinnUniversity of Reading
3 2 1300
400
500
600
700
800b
8 species 4 species 2 species11 species
Ab
ove
gro
un
d b
iom
ass
(g
/m2 )
Decreasing functional group richness
Dr. John A. FinnUniversity of Reading
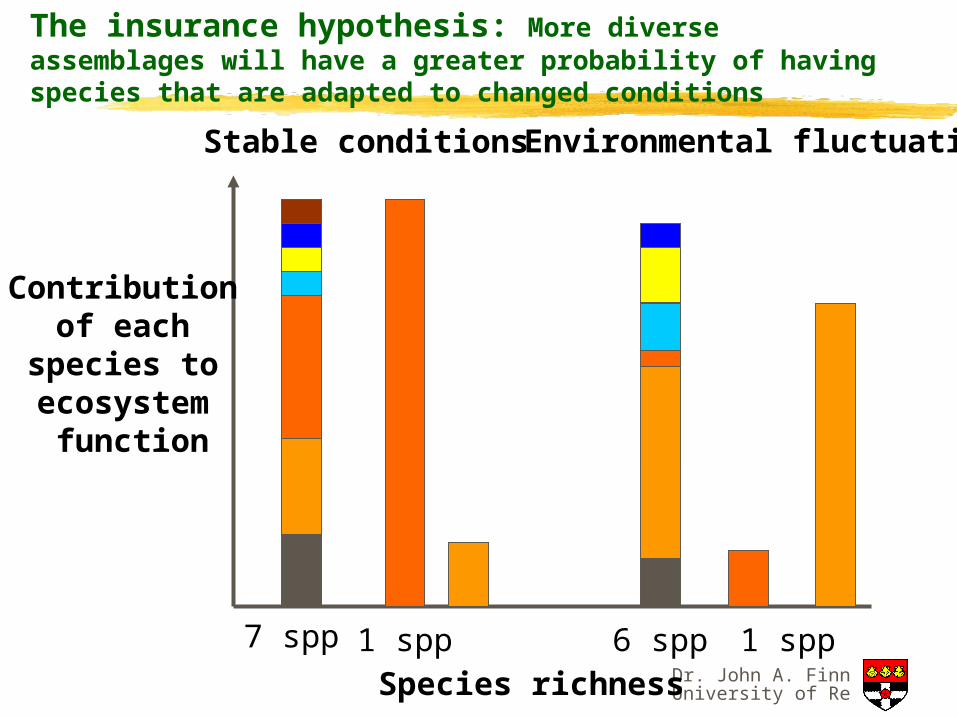
Environmental fluctuation
6 spp 1 spp7 spp 1 spp
Stable conditions
The insurance hypothesis: More diverse assemblages will have a greater probability of having species that are adapted to changed conditions
Contribution of each
species to ecosystem function
Species richness
Dr. John A. FinnUniversity of Reading
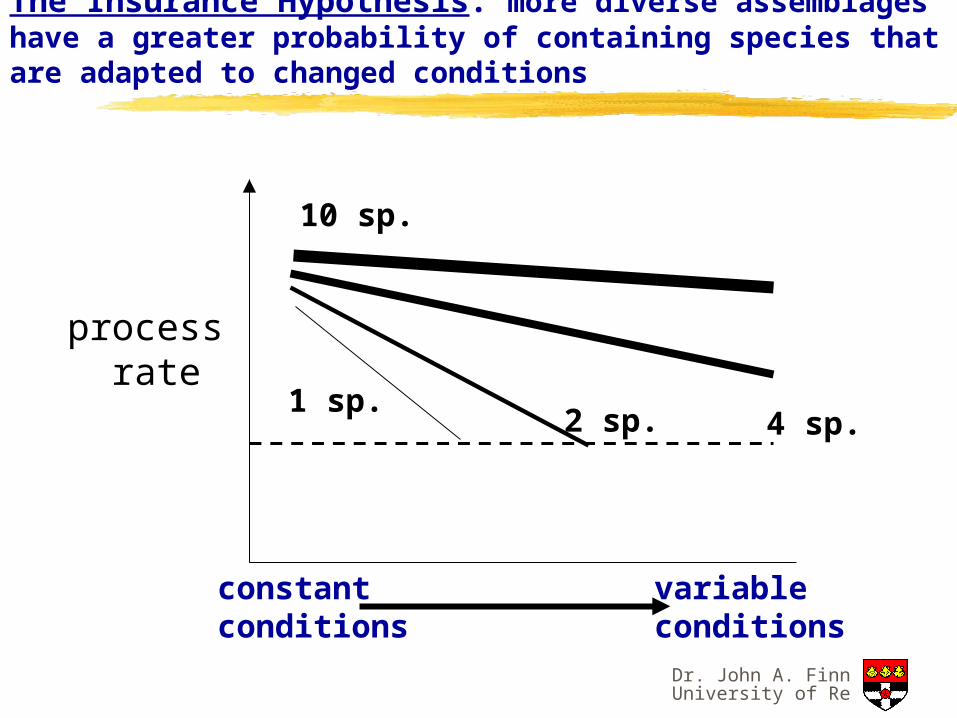
process rate
constantconditions
variableconditions
1 sp.2 sp. 4 sp.
10 sp.
The Insurance Hypothesis: more diverse assemblages have a greater probability of containing species that are adapted to changed conditions
Dr. John A. FinnUniversity of Reading
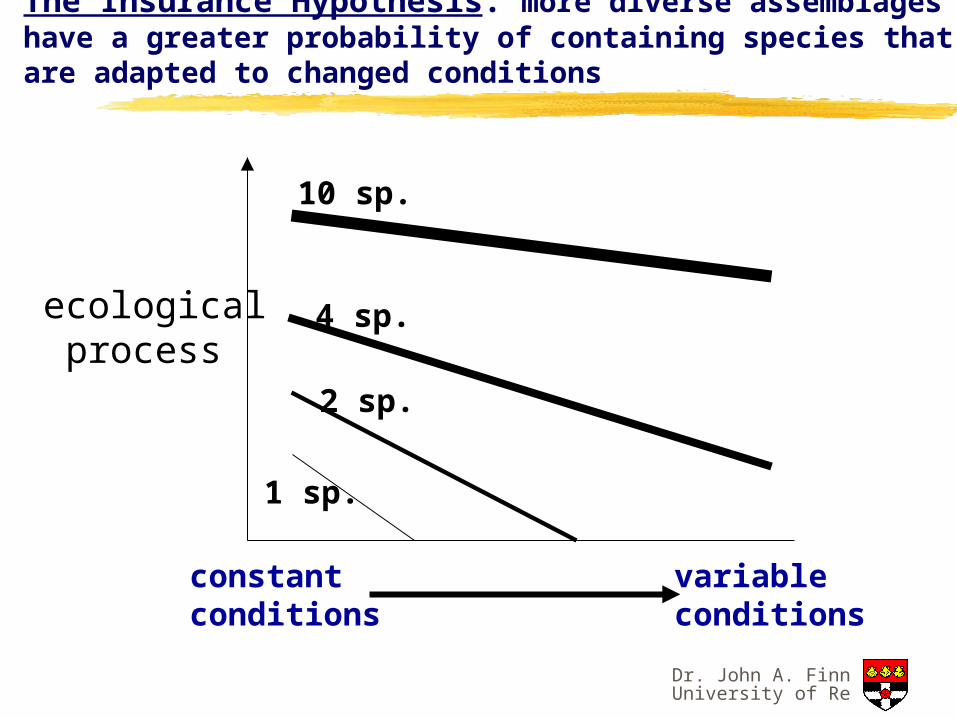
ecologicalprocess
constantconditions
variableconditions
1 sp.
2 sp.
4 sp.
10 sp.
The Insurance Hypothesis: more diverse assemblages have a greater probability of containing species that are adapted to changed conditions
Dr. John A. FinnUniversity of Reading
Further references on function-diversity work:
Hector, A. et al. (1999) Plant diversity and productivity experiments in European grasslands. Science, 286, 1123-1127. (BIODEPTH project)
Hooper, D.U. (1998) The role of complementarity and competition in ecosystem responses to variation in plant diversity. Ecology, 79, 704 - 719.
Jonsson, M. and Malmqvist, B. 2000. Ecosystem process rate increases with animal species richness: evidence from leaf-eating, aquatic insects. - Oikos 89: 519-523.
Tilman, D., Knops, J., Wedin, D., Reich, P., Ritchie, M. & Siemann, E. (1997a) The influence of functional diversity and composition on ecosystem processes. Science, 277, 1300-1302.


![God’s Great and Precious Promises · GOD’S PROMISE [God] has given us his very great and precious promises, so that through them you may participate in the divine nature. —2](https://img.pdfslide.us/doc/110x75/5c1a8d4709d3f2a87b8c2a53/gods-great-and-precious-promises-gods-promise-god-has-given-us-his-very.jpg)