Embed Size (px)
Citation preview
If bad money drives out good money:deunionisation and productivity slowdown
M. C. Pereira∗1,2, G. Dosi†2, R. Freeman‡3, A. Roventini§2,4, and M. E.Virgillito¶5,2
1University of Campinas2Scuola Superiore Sant’Anna
3Harvard University and NBER4OFCE, Sciences Po
5Universita’ Cattolica del Sacro Cuore
AbstractWe develop an agent-based model able to account for the macroeconomic conse-
quences of an endogenous process of de-unionisation resulting from a competition mech-anism between two types of firms, namely unionised and non-unionised. Whenevernon-unionised firms prevail, the average productivity growth declines, the productivitystandard deviation and the market concentration increase, in a “winner-takes-it-all” sce-nario, cost competition induces a deflationary spiral, and product quality is reduced. Bymeans of a shift and share decomposition, we track the within, between, cross, entry andexit components of productivity growth and the ensuing wage-productivity nexus.
Keywords: Deunionization, productivity slow-down, agent-based modelDesenvolvemos um modelo agent-based capaz de analizar as consequências macroe-
conômicas de um processo endógeno de dessindicalização resultante de um mecanismode concorrência entre dois tipos de firmas, sindicalizadas ou não. Sempre que as em-presas não sindicalizadas prevalecem, o crescimento médio da produtividade declina,o desvio padrão da produtividade e a concentração do mercado aumentam, em umcenário “o ganhador fica com tudo”, a competição de custos induz uma espiral defla-cionária e a qualidade do produto é reduzida. Por meio de uma decomposição do tiposhift-and-share, rastreamos os componentes do crescimento da produtividade e o nexosalário-produtividade resultante.
Palavras-chave: Dessindicalização, desaceleração produtividade, modelo agent-basedÁrea ANPEC: Crescimento, Desenvolvimento Econômico e Instituições (6)JEL codes: C63, E02, E24
∗Corresponding author: Institute of Economics, University of Campinas, Campinas - SP (Brazil), 13083-970.E-mail address: mcper<at>unicamp.br†Institute of Economics, Scuola Superiore Sant’Anna, Piazza Martiri della Liberta’ 33, I-56127, Pisa (Italy).
E-mail address: gdosi<at>santannapisa.it‡Harvard University and NBER, Cambridge (MA), US§Institute of Economics, Scuola Superiore Sant’Anna, Piazza Martiri della Liberta’ 33, I-56127, Pisa (Italy),
and OFCE, Sciences Po, Nice France. E-mail address: andrea.roventini<at>santannapisa.it¶Institute of Economic Policy, Universita’ Cattolica del Sacro Cuore, Via Pietro Necchi 5, I-20123, Milan
(Italy). E-mail addressmariaenrica.virgillito<at>unicatt.it
1
1 Introduction
A new emerging malaise of capitalist organizations is currently affecting many matureeconomies, namely productivity slowdown. Since the First Industrial Revolution produc-tivity has been the engine pumping wage and output growth and ensuring better standardof leaving. Currently, the dynamics of productivity does exhibit alarming trends. Syverson(2017) documents that US productivity growth more than halved between 1995 and 2015,moving from 2.8% in (1995-2004) to 1.3% (2005 – 2015). A similar pattern characterizes 29out of 30 countries analysed in the same study, with an average decline of 1.2 percentagepoints and 0.9 p.p. of standard deviation.
Less new are the patterns affecting wage dynamics: stagnant real wage growth and thesurge in wage inequality. Already since the late Eighties, scholars have been studying the in-creasing patterns of wage dispersion (Freeman, 1984; Lee, 1999). More recent is the acknowl-edgement of a declining labour share in developed countries (Hutchinson and Persyn, 2012;Karabarbounis and Neiman, 2013). If the Golden Age of capitalism was characterized by aproportional wage/productivity growth, and a constant wage share, since the eighties thewage-productivity nexus has weakened its relationships, with a declining pass-through ofproductivity growth on wage growth. The decoupling of wage-productivity growth is there-fore the result of two concurrent factors: declining labour share and increasing divergencebetween median and average income (Schwellnus et al., 2017).
Moving from macro to micro, a growing stream of literature digs inside into the dynam-ics of firm/establishment level wage dispersion. In particular, looking at the main drivers ofwage inequality, since the contribution by Dunne et al. (2004), it appears that the between-establishment component of the overall wage inequality has been the main driver of thegrowth of wages dispersion, while the within one, contributed more moderately to the in-crease in the latter. Recent findings by Barth et al. (2016), linking the Census Bureau’s Lon-gitudinal Business Data Base (LBD) and the Longitudinal Employer-Household Dynamicsdata (LEHD) show that the inter-establishment wage dispersion does contribute roughlytwice with respect to the intra-establishment one. In fact, paraphrasing the article by Barthet al. (2016), it is exactly where you work that has been strongly impacting on the increasein wages and earnings dispersion in the US. In a similar vein Berlingieri et al. (2017) haverecently documented a surge in both wage and productivity dispersions across 16 OECDcountries from the mid-1990s to 2012, especially in the service sectors and concerning thebottom-part of the distributions (50-10 percentiles).
Which are the causes at the root of the latter empirical patterns? Among the main possi-ble mechanisms, ranging from demand to supply side ones, the explanation we are going toexplore in this work is the link between the wage structure and firms market performance,in terms of productivity growth: if low-productive firms are also low-wage firms they mightin tune remain alive leveraging on their cost structure. In this respect, alternative wage set-ting schemes act as a selection/non selection mechanism cleansing or not the market. Thisselection process, going from wage, to productivity to survival/exit is tightly linked to thechanging nature of labour market organization, which in the last decades has seen, togetherwith many fundamental changes, a dramatic decline in the unionization rate.
How much of the emerging pattern of average productivity slowdown and increasingproductivity dispersion can be accounted by the process of deunionization of firms? Thispaper is meant to address the latter question by means of a simulated economy populatedby a set of heterogeneous interacting agents, according to the modelling practice going
2
under the heading of Agent-Based Models (ABMs). ABMs are large-scale, computationalmodels which allow the simulation of artificial economies wherein ensembles of heteroge-neous agents interact on the ground of simple behavioural rules. Aggregate-level outcomesare the emergent properties from the interactions of such boundedly rational agents. Un-likely DSGE models driven by the search of closed-form solutions derived from linearisa-tion around equilibrium conditions, ABMs are open-ended systems where the notion ofcoordination substitutes the one of equilibrium. Moreover such models may display path-dependency along each simulation history, as well as between alternative simulations. Shortof any derivation from some principle of rationality, ABMs ought to be primarily judged ontheir ability to reproduce as emergent properties sets of stylised facts, i.e. empirically observedstatistical regularities. The use of agent-based models has become the standard practice inmany disciplines dealing with complex phenomena, wherein the micro and the macro lev-els are not isomorphic. More recently, these models have also been adopted in economics.Indeed, the features of ABMs are particularly suited to the analysis of economic phenomenacharacterised by (i) disequilibrium processes and (ii) persistent heterogeneity. Therefore wemodel the process of deunionziation following a bottom-down perspective, according to thespurt model first investigated in (Freeman, 1997). Unionised and non-unionised firms docompete in the product market arena in terms of their relative efficiency, affected by prices,quality and quantity (excess, unfilled demand) variables. The model produces two possi-ble statistical equilibrium patterns: a stable case of unsuccessful invasion by non-unionisedfirms, and a stable case of invasion by non-unionised firms.
Whenever non-unionised firms prevail the average productivity growth declines, pro-ductivity standard deviation and market concentration increase, mimicking a “winners-take-all” scenario, cost-competition induces a deflationary spiral, and also product qualityis reduced. By means of a shift and share decomposition, we track the within, between, cross,entry and exit components of productivity growth and the ensuing wage-productivity nexus.
2 At the source of weak selection
Microeconometric firm level studies have been devoting attention to the patterns of firmlevel idiosyncratic learning, in terms of productivity growth, and of market selection, focus-ing on the reallocation dynamics between incumbent firms and at the entry/exit patterns(Foster et al., 2001). Results from this stream of literature emphasize the phenomenon ofjob reallocation as a signal of the cleansing occurring in the market, with workers movingfrom low-productivity to high-productivity firms (Davis et al., 1998). However, recent find-ings provide contrasting evidence: Dosi et al. (2015) using a sample of US listed, big firms(COMPUSTAT) show that also in the US economy, considered to be quite prone to the pur-ported reallocation dynamics, according to which less efficient firms lose market shares infavour of the more efficient ones, the main driver of productivity growth is a within (in-side the firm) process of accumulation of learning, while the selection process appears tobe quite weak. In line, Foster et al. (2016) find that the pace of reallocation in terms of jobcreation/job destruction rates and the ensuing cleansing effect in the Great Recession waslower than those recorded in previous crisis periods. Additionally, the evidence on the re-lationship between relative efficiency and firm growth does not provide a strong link onthe co-variations between the two latter variables: in a way, improvements in productivitydo not directly translate into firms market-performance, in terms of sales growth (Bottazzi
3
et al., 2010). These findings suggest (i) the existence of ample heterogeneity in firm level pro-ductivity dynamics, (ii) a weak productivity-growth nexus, (iii) the absence of any convergeprocess in the productivity dynamics across firms. A tale of double divergence seems toemerge: not only firms do present persistent heterogeneity in their performance variables –including productivity - , but there is also no sign of convergence in wages. On the contrary,divergence seems to prevail and grow.
Currently investigated causes of this divergence are the impact of easy access to creditand entry slowdown. A recent OECD study (McGowan et al., 2017), recalling the idea ofzombie firms, analyses how, over the last decade (2003-2013), the share of zombie firms -defined as those firms in such financial troubles that are unable to meet their interest pay-ments, but are still alive - have been steadily increasing. Keeping alive, those firms mighthamper productivity growth. This latter evidence is again in line with some slow-down ofthe selection/reallocation process, which is lacking to produce the expected cleansing ef-fect, especially during recessionary phases. Related, the declining business dynamism, witha slowdown of entry and a constant exit rate, is the further signal of the reduction in theselection process (Decker et al., 2016).
However, less attention has been devoted to the link between labour market organiza-tion and the ensuing productivity and technological conditions. Given the emerging tale ofdouble divergence, it is naturally to investigate to what extent the increasing wage disper-sion has allowed low productivity firms to remain alive. Some empirical evidence points infavour of the latter mechanism. Barth et al. (2014) when looking at the Scandinavian modeldo find evidence that more compressed wage structures, like those in Norway, Sweden andDenmark, are able to fuel more creative destruction in the market, reducing the dispersionin productivity. Similarly, Hibbs Jr and Locking (2000) find that lower within-plant wagedispersion exerts a positive effect on productivity, with a shift of capital and labour fromlow-productivity to high-productivity firms. If less unequal between-plant wage level mightfoster selection, the process of deunionization, which has largely invested many advancedeconomies, is one of the major force pushing in the opposite direction. In this respect, theincreasing wage dispersion between firms induced by deunionization (Freeman, 1984), hasbeen an implicit buffer which indirectly helped low productivity firms to survive.
Granted the deunionization-productivity slowdown link we intend to explore, an in-herent problem relies on how to model the process of deunionization. Freeman (1997),documenting the patterns of unionization in many advanced economies, proposes themetaphor of the spurt: unionization was a phase transition occurred after that some thresh-olds/tipping points have been reached, resulting as a bottom-up emergent property of thesystem; clearly, the probability that the spurt occurs positively depends on the existence ofalready unionised workers/firms. On the contrary many labour historians and economistssee unionism as the result of some top down act, as the Wagner Act in US, the Blum govern-ment in France, the PC 1003 in Canada. However, the exogenous shock interpretation leavesreduced scope to interpret the spurt dynamics of union rise and decline and it predicts astable unionization rate over time, which is clearly not revealed by the data.
Interpreting unionization as a bottom up process allows also to model the process of de-unionization. Bryson et al. (2017) argue that the process of union decline, more than due toabandonment rate from previously unionised workers is due to the “never-member" effects,which see new cohorts of worker never adhere to union organizations. Those firms experi-encing the “never-member" effects result into being non unionised ones, therefore moving
4
Productiongood firms
Queue
MachinesWorkers
Consumptiongood firms
Queue
Heterogeneousconsumption goods
Government Bank
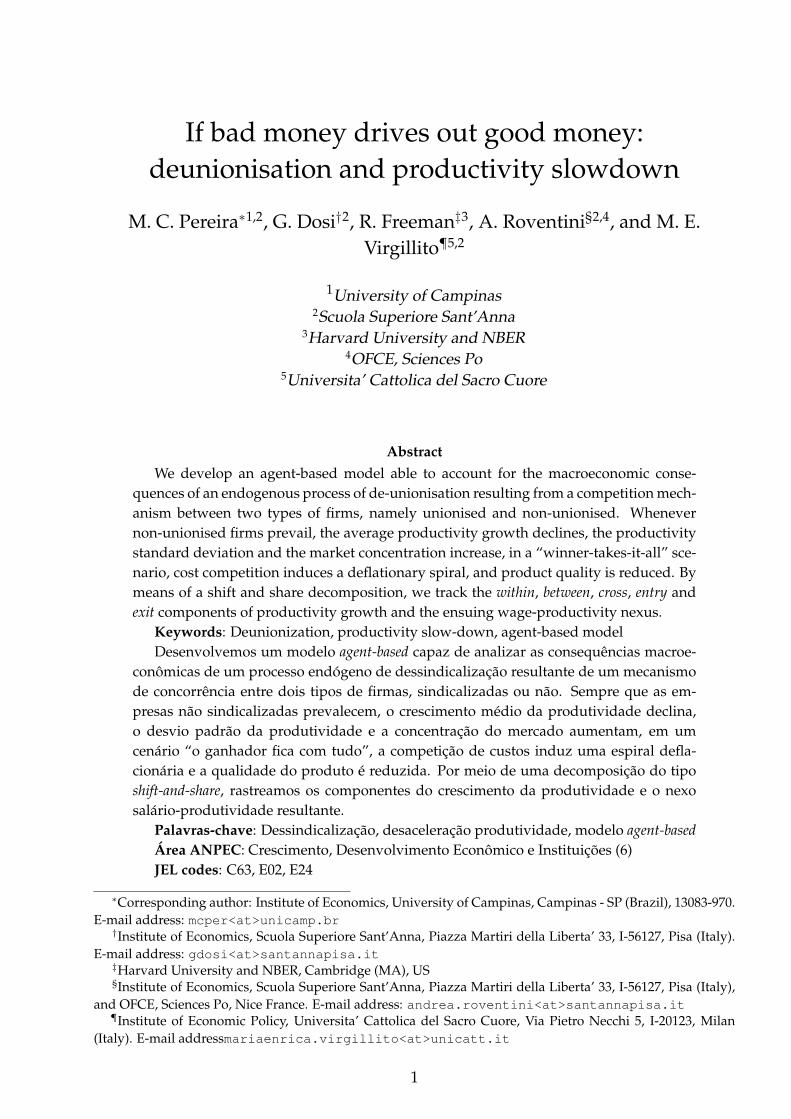
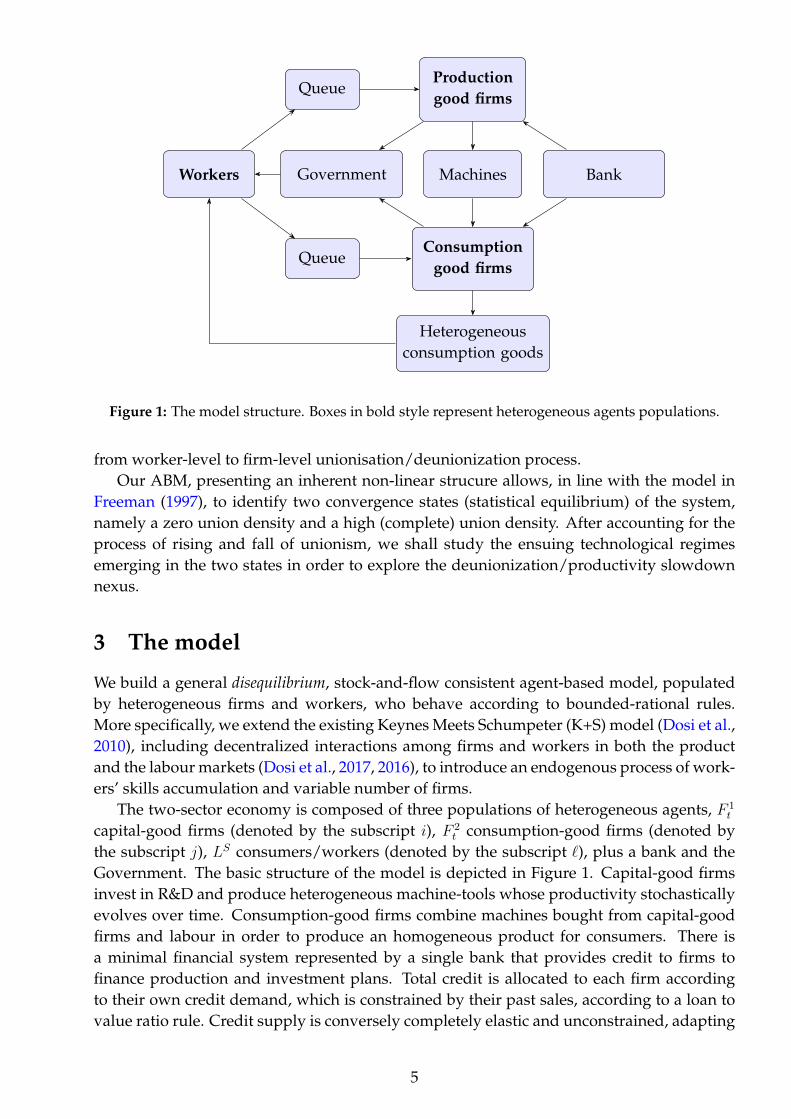
Figure 1: The model structure. Boxes in bold style represent heterogeneous agents populations.
from worker-level to firm-level unionisation/deunionization process.Our ABM, presenting an inherent non-linear strucure allows, in line with the model in
Freeman (1997), to identify two convergence states (statistical equilibrium) of the system,namely a zero union density and a high (complete) union density. After accounting for theprocess of rising and fall of unionism, we shall study the ensuing technological regimesemerging in the two states in order to explore the deunionization/productivity slowdownnexus.
3 The model
We build a general disequilibrium, stock-and-flow consistent agent-based model, populatedby heterogeneous firms and workers, who behave according to bounded-rational rules.More specifically, we extend the existing Keynes Meets Schumpeter (K+S) model (Dosi et al.,2010), including decentralized interactions among firms and workers in both the productand the labour markets (Dosi et al., 2017, 2016), to introduce an endogenous process of work-ers’ skills accumulation and variable number of firms.
The two-sector economy is composed of three populations of heterogeneous agents, F 1t
capital-good firms (denoted by the subscript i), F 2t consumption-good firms (denoted by
the subscript j), LS consumers/workers (denoted by the subscript `), plus a bank and theGovernment. The basic structure of the model is depicted in Figure 1. Capital-good firmsinvest in R&D and produce heterogeneous machine-tools whose productivity stochasticallyevolves over time. Consumption-good firms combine machines bought from capital-goodfirms and labour in order to produce an homogeneous product for consumers. There isa minimal financial system represented by a single bank that provides credit to firms tofinance production and investment plans. Total credit is allocated to each firm accordingto their own credit demand, which is constrained by their past sales, according to a loan tovalue ratio rule. Credit supply is conversely completely elastic and unconstrained, adapting
5
to credit demand. Workers submit job applications to a subset of the firms. Firms hireaccording to their individual adaptive demand expectations. The government levies taxeson firms, pays unemployment benefits and set minimum wages, according to the policysetting, absorbing excess profits and losses from the bank and keeping a relatively balancedbudget in the long run.
In the following, we first summarize the functioning of the capital- and the consumption-good sectors of our economy, with a focus on the entry process, and then present the labourmarket dynamics, detailing the skills accumulation and deterioration mechanisms. Finally,we describe the two alternative policy regime settings (and variations thereof) under whichthe model has been explored.
3.1 The capital- and consumption-good sectors
The capital-good industry is the locus where innovation is endogenously generated in themodel. Capital-good firms develop new machine-embodied techniques or imitate the onesof their competitors in order to produce and sell more productive and cheaper machinery.On demand, they supply machine-tools to consumption-good firms, producing with labouras the only input. Firms have access to bank loans to cover liquidity problems up to a limit.The capital-good market is characterized by imperfect information and Schumpeterian com-petition driven by technological innovation. Machine-tool firms signal the price and produc-tivity of their machines to their current customers as well to a subset of potential new ones,and invest a fraction of past revenues in R&D aimed at searching for new machines or copyexisting ones. Prices are set using a fixed mark-up over (labour) costs of production.
Consumption-good firms produce a quality-differentiated single good employing capital(composed by different “vintages” of machine-tools) and labour under constant returns toscale. Desired production is determined according to adaptive (myopic) demand expecta-tions. Given the actual inventories, if the current capital stock is not sufficient to produce thedesired output, firms order new machines to expand their installed capacity, paying in ad-vance – drawing on their retained past profits or, up to some limit, on bank loans. Moreover,they replace old machines according to a payback-period rule. As new machines embedstate-of-the-art technologies, the labour productivity of consumption-good firms increasesover time according to the mix of vintages of machines in their capital stocks. Consumption-good firms choose in every period their capital-good supplier comparing the price and theproductivity of the machines they are aware of. Firms then fix their prices applying a vari-able mark-up rule on their production costs, trying to balance profit margins and marketshares. More specifically, firms increase their mark-up and price whenever their marketshare is expanding and vice versa. Imperfect information is also the normal state of theconsumption-good market so consumers do not instantaneously switch to the most com-petitive producer. Market shares evolve according to a (quasi) replicator dynamics: morecompetitive firms expand, while firms with relatively lower competitiveness levels shrink,or exit the market.
The process of entry-exit is entirely endogenous in both sectors. Firms leave the marketwhenever their market shares get close to zero or their net assets turn negative (bankruptcy).Conversely, the number of entrants stochastically depends on the number of incumbents andon the prevailing financial conditions. When the sectoral liquidity-to-debt ratio is shrinkingnew firms find it easier to enter, and vice versa.
6
3.2 The labour market and skills dynamics
The labour market in the model implements a fully-decentralized search and hiring processbetween workers and firms. The aggregate supply of labour LS is fixed and all workers areavailable to be hired in any period. When unemployed, workers submit a certain number ofjob applications to firms. Employed workers may apply or not for better positions, accordingto the institutional set up. Larger firms have a proportionally higher probability of receivingjob applications, which are organized in separated, firm-specific application queues. Thelabour market is characterized by imperfect information as firms only observe workers skillsand wage requests and workers are aware only of the wage offers they may receive.
Firms decide about their individual labour demand based on the received orders (capital-good sector), the expected demand (consumption-good sector), and the expected labourproductivity levels. Considering the number and the productivity of the already employedworkers, firms decide whether to (i) hire new workers, (ii) fire part of the existing ones, or(iii) keep the existing labour force. Each hiring firm defines a unique wage offer for theapplicant workers, based on its internal conditions and the received applications. Workersselect the best offer they get from the firms to which they submitted applications, if any.If already employed, depending on the institutional regime, they might quit the currentjob if a better wage offer is received. There are no further rounds of bargaining betweenworkers and firms in the same period. Thus, firms have no guarantee of fulfilling all theopen positions, and no market clearing is ever guaranteed. Moreover, there are no firing orhiring transaction costs.
3.3 Competition between unionised and non-unionised firms
We employ the model described above to study a process of evolutionary competition be-tween two types of firms, which we call unionised and non unionised. The distinctive featuresof the two types of firms are telegraphically sketched in Table 1.
In unionised firms, whose market share are denoted as fU2 , wages are insensitive to the
labour market conditions and indexed to the productivity gains of the firms. There is asort of covenant between firms and workers concerning “long term” employment: firms fireonly when their profits become negative, while workers are loyal to employers and do notseek for alternative jobs. When hiring/firing, firms aim to keep the more skilled workers.Labour market institutions contemplate a minimum wage fully indexed to aggregated econ-omy productivity and unemployment benefits financed by taxes on profits. Conversely, innon-unionised firms, whose market share are denoted as fNU
2 , flexible wages respond to un-employment and decentralised market dynamics, and are set by means of an asymmetricbargaining process where firms have the last say. Employed workers search for better paidjobs with some positive probability and firms freely adjust (fire) their excess workforce ac-cording to their planned production. Hiring/firing workers by firms are based on a balancebetween skills and wages, using a simple payback comparison rule. Non unionised firmsoperate under different labour institutions: minimum wage is only partially indexed to pro-ductivity and unemployment benefits – and the associated taxes on profits – are relativelylower.
We simulate an artificial economy where at the beginning only unionised firms exist.After 100 periods non unionised firms start to enter into the market according to an evo-lutionary competition process. For the following 100 time steps, defined by the parameter
7
ent2trdChg, non unionised firms enter with a fixed proportion with respect to unionised ones,namely 50%, defined by the parameter ent2HldPer. This time window serves as a buffer inorder to let the new entrant firms growing and populating the market. After the criticalthreshold is met, there exists a given probability for a new born firm of being non unionised,being this probability the realization of a random draw from a uniform distribution boundedfrom below by a minimum floor f 2
min and from above by the share of existing types of non-unionised firms f 2,NU
t−1 :
fNUb2,t = U [f 2
min, fNU2,t−1] (1)
where fNUb2,t is the share of new entrant firms of type NU, while 1 − fNU
b2,t is the shareof existing firms of type U. Firms compete in the product market according to their relativecompetitiveness. In particular, Consumption-good prices are set applying a variable markupµj,t on average unit costs:
pj,t = (1 + µj,t)cj,t. (2)
Mark-up changes are regulated by the evolution of firm market shares (fj,t):
µj,t = µj,t−1
(1 + υ
fj,t−1 − fj,t−2fj,t−2
)(3)
with υ ∈ (0, 1). Firm market shares evolve according to a replicator dynamics:
fj,t = fj,t−1
(1 + χ
Ej,t − EtEt
), Et =
1
F 2t
∑j
Ej,tfj,t−1, (4)
where the firms relative competitiveness Ej,t is defined based on the individual normalizedprices p′j,t, unfilled demands l′j,t and product qualities q′j,t:
Ej,t = −ω1p′j,t−1 − ω2l
′j,t−1 − ω3q
′j,t−1, (5)
being (ω1, ω2, ω3) ∈ R2+ parameters. Unfilled demand lj,t is the difference between thedemand Dj,t the firm gets and its production Qj,t plus inventories Nj,t, if positive:
lj,t = max [Dj,t − (Qj,t +Nj,t), 0] . (6)
Product quality is defined as the average of the log skills s`,t of the firm’s workers:
qj,t =1
Lj,t−1
∑`∈{Lj,t−1}
log [s`,t−1] . (7)
The skill level s`,t > 0 of each worker ` evolves over time as a multiplicative process:
s`,t =
(1 + τT )s`,t−1 if employed in t− 11
1 + τUs`,t−1 if unemployed and not under training in t− 1,
(8)
where τT ≥ 0 is a parameter governing the learning rate while the worker is employed,and τU ≥ 0 is the corresponding parameter accounting for the skills deterioration when aworker is unemployed. As a consequence, when worker ` is employed her abilities improveover time, as she becomes more experienced in her task or acquire new skills. Conversely,unemployed workers lose skills. When a worker is hired, she immediately acquires the
8
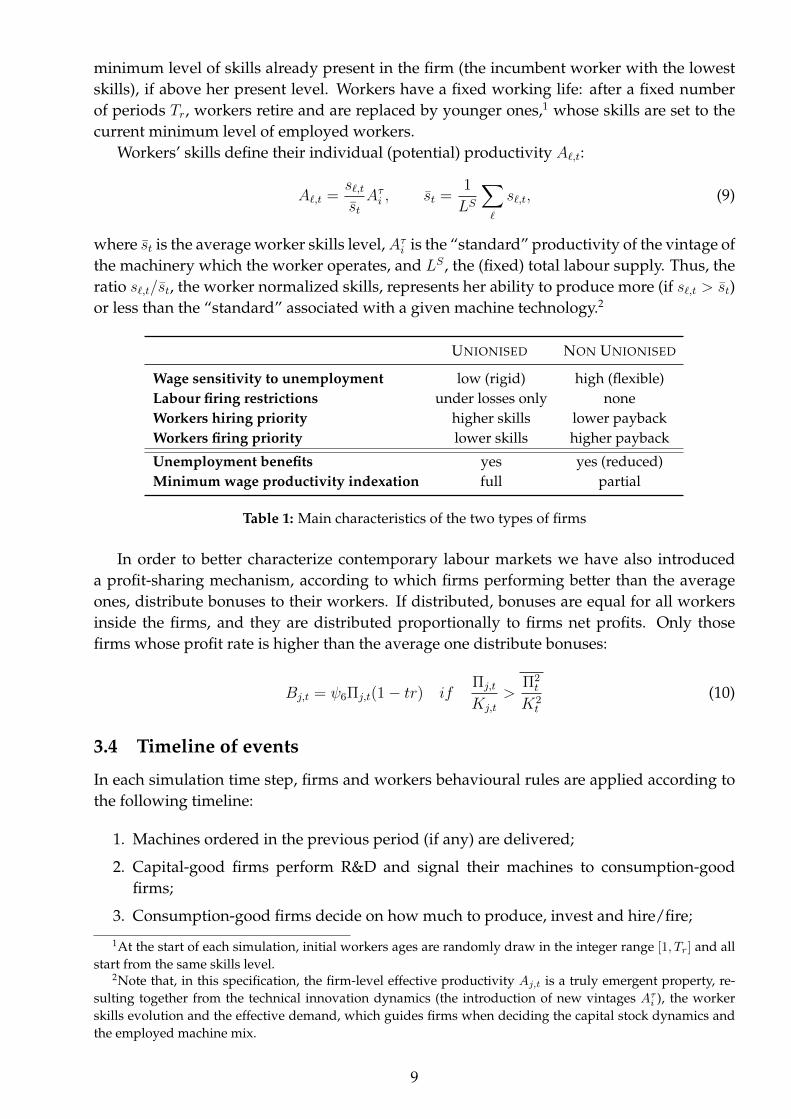
minimum level of skills already present in the firm (the incumbent worker with the lowestskills), if above her present level. Workers have a fixed working life: after a fixed numberof periods Tr, workers retire and are replaced by younger ones,1 whose skills are set to thecurrent minimum level of employed workers.
Workers’ skills define their individual (potential) productivity A`,t:
A`,t =s`,tstAτi , st =
1
LS
∑`
s`,t, (9)
where st is the average worker skills level,Aτi is the “standard” productivity of the vintage ofthe machinery which the worker operates, and LS , the (fixed) total labour supply. Thus, theratio s`,t/st, the worker normalized skills, represents her ability to produce more (if s`,t > st)or less than the “standard” associated with a given machine technology.2
UNIONISED NON UNIONISED
Wage sensitivity to unemployment low (rigid) high (flexible)Labour firing restrictions under losses only noneWorkers hiring priority higher skills lower paybackWorkers firing priority lower skills higher payback
Unemployment benefits yes yes (reduced)Minimum wage productivity indexation full partial
Table 1: Main characteristics of the two types of firms
In order to better characterize contemporary labour markets we have also introduceda profit-sharing mechanism, according to which firms performing better than the averageones, distribute bonuses to their workers. If distributed, bonuses are equal for all workersinside the firms, and they are distributed proportionally to firms net profits. Only thosefirms whose profit rate is higher than the average one distribute bonuses:
Bj,t = ψ6Πj,t(1− tr) ifΠj,t
Kj,t
>Π2t
K2t
(10)
3.4 Timeline of events
In each simulation time step, firms and workers behavioural rules are applied according tothe following timeline:
1. Machines ordered in the previous period (if any) are delivered;
2. Capital-good firms perform R&D and signal their machines to consumption-goodfirms;
3. Consumption-good firms decide on how much to produce, invest and hire/fire;
1At the start of each simulation, initial workers ages are randomly draw in the integer range [1, Tr] and allstart from the same skills level.
2Note that, in this specification, the firm-level effective productivity Aj,t is a truly emergent property, re-sulting together from the technical innovation dynamics (the introduction of new vintages Aτi ), the workerskills evolution and the effective demand, which guides firms when deciding the capital stock dynamics andthe employed machine mix.
9
4. To fulfil production and investment plans, firms allocate cash-flows and (if needed)borrow from bank;
5. Firms send/receive machine-tool orders for the next period (if applicable);
6. Workers (employed and unemployed) update their own skills;
7. Firms open job queues and job-seekers send applications to them (“queue”);
8. Wages are set (indexation or bargaining) and job vacancies are partly or totally filled;
9. Government collects taxes and pays unemployment subsidies;
10. Consumption-good market opens and the market shares of firms evolve according tocompetitiveness;
11. Firms in both sectors compute their profits, pay wages, distribute bonuses and repaydebt;
12. Exit takes place, firms with near-zero market share or negative net assets are eschewedfrom the market;
13. Prospective entrants decide to enter according to the markets conditions;
14. Aggregate variables are computed and the cycle restarts.
4 Deunionization and productivity slowdown
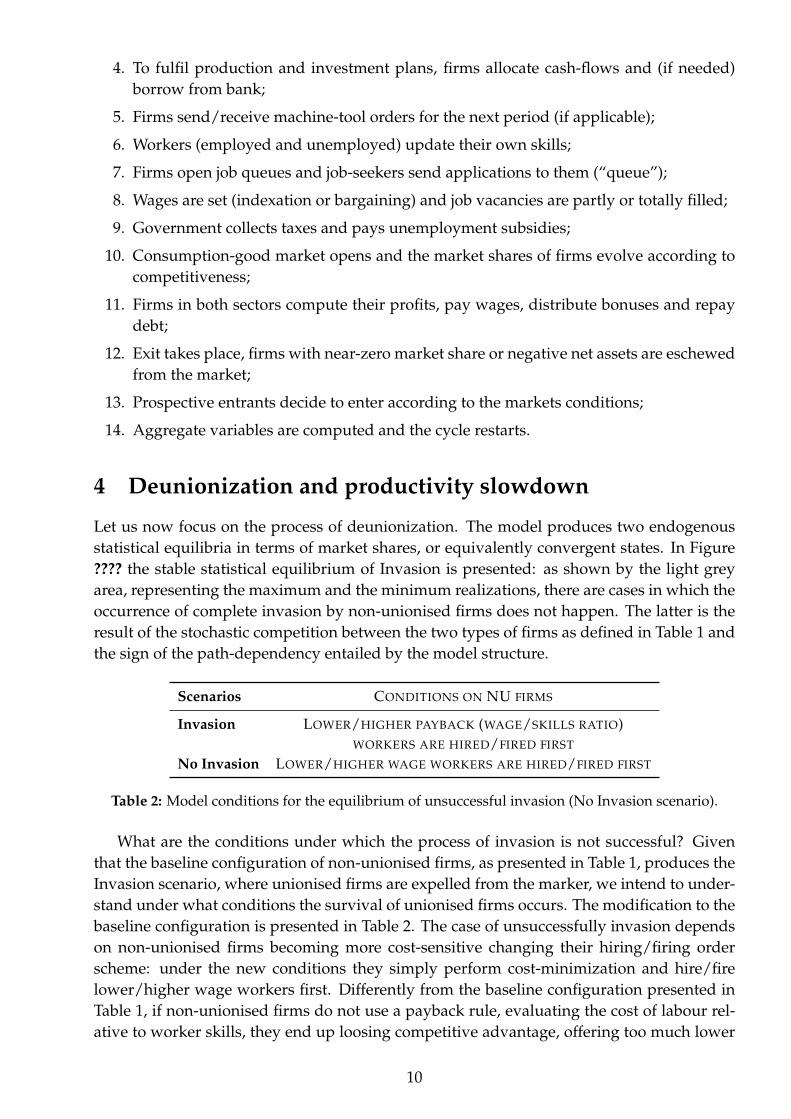
Let us now focus on the process of deunionization. The model produces two endogenousstatistical equilibria in terms of market shares, or equivalently convergent states. In Figure???? the stable statistical equilibrium of Invasion is presented: as shown by the light greyarea, representing the maximum and the minimum realizations, there are cases in which theoccurrence of complete invasion by non-unionised firms does not happen. The latter is theresult of the stochastic competition between the two types of firms as defined in Table 1 andthe sign of the path-dependency entailed by the model structure.
Scenarios CONDITIONS ON NU FIRMS
Invasion LOWER/HIGHER PAYBACK (WAGE/SKILLS RATIO)WORKERS ARE HIRED/FIRED FIRST
No Invasion LOWER/HIGHER WAGE WORKERS ARE HIRED/FIRED FIRST
Table 2: Model conditions for the equilibrium of unsuccessful invasion (No Invasion scenario).
What are the conditions under which the process of invasion is not successful? Giventhat the baseline configuration of non-unionised firms, as presented in Table 1, produces theInvasion scenario, where unionised firms are expelled from the marker, we intend to under-stand under what conditions the survival of unionised firms occurs. The modification to thebaseline configuration is presented in Table 2. The case of unsuccessfully invasion dependson non-unionised firms becoming more cost-sensitive changing their hiring/firing orderscheme: under the new conditions they simply perform cost-minimization and hire/firelower/higher wage workers first. Differently from the baseline configuration presented inTable 1, if non-unionised firms do not use a payback rule, evaluating the cost of labour rel-ative to worker skills, they end up loosing competitive advantage, offering too much lower
10
quality products in the market. Note in fact that under Equation 5, the product quality af-fects firm competitiveness, and quality, under Equation 7 depends on the average workers’skills at the firm level.
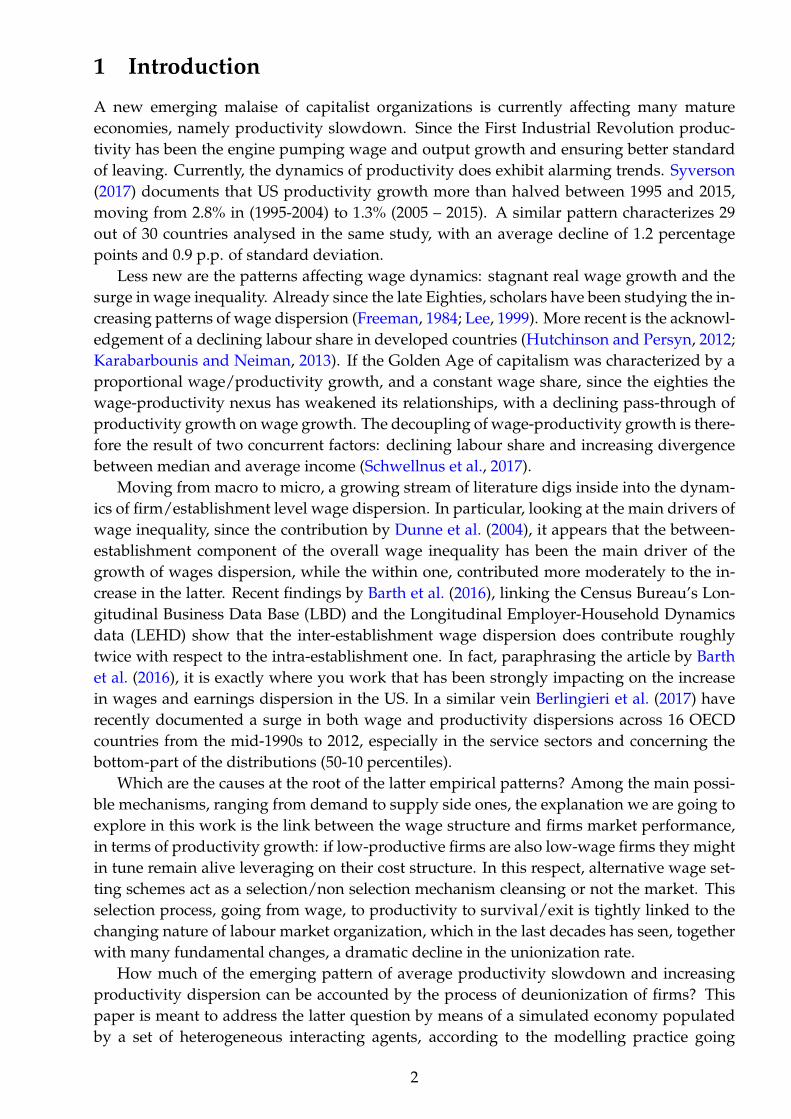
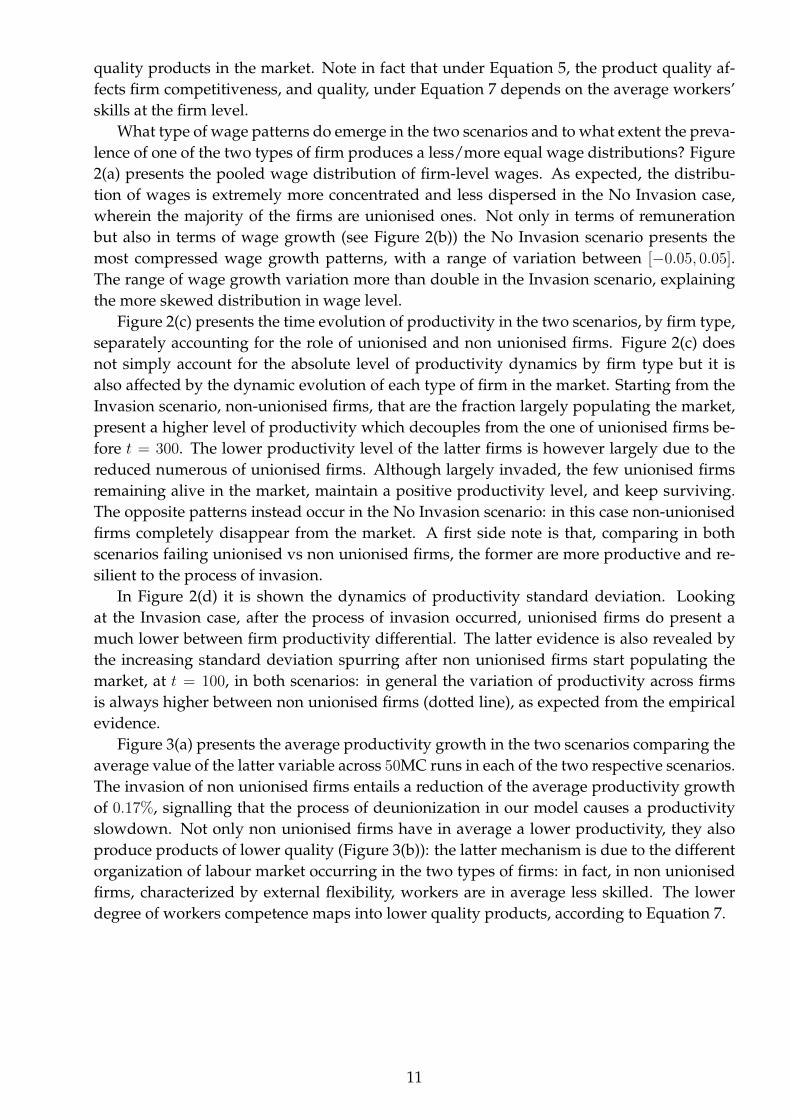
What type of wage patterns do emerge in the two scenarios and to what extent the preva-lence of one of the two types of firm produces a less/more equal wage distributions? Figure2(a) presents the pooled wage distribution of firm-level wages. As expected, the distribu-tion of wages is extremely more concentrated and less dispersed in the No Invasion case,wherein the majority of the firms are unionised ones. Not only in terms of remunerationbut also in terms of wage growth (see Figure 2(b)) the No Invasion scenario presents themost compressed wage growth patterns, with a range of variation between [−0.05, 0.05].The range of wage growth variation more than double in the Invasion scenario, explainingthe more skewed distribution in wage level.
Figure 2(c) presents the time evolution of productivity in the two scenarios, by firm type,separately accounting for the role of unionised and non unionised firms. Figure 2(c) doesnot simply account for the absolute level of productivity dynamics by firm type but it isalso affected by the dynamic evolution of each type of firm in the market. Starting from theInvasion scenario, non-unionised firms, that are the fraction largely populating the market,present a higher level of productivity which decouples from the one of unionised firms be-fore t = 300. The lower productivity level of the latter firms is however largely due to thereduced numerous of unionised firms. Although largely invaded, the few unionised firmsremaining alive in the market, maintain a positive productivity level, and keep surviving.The opposite patterns instead occur in the No Invasion scenario: in this case non-unionisedfirms completely disappear from the market. A first side note is that, comparing in bothscenarios failing unionised vs non unionised firms, the former are more productive and re-silient to the process of invasion.
In Figure 2(d) it is shown the dynamics of productivity standard deviation. Lookingat the Invasion case, after the process of invasion occurred, unionised firms do present amuch lower between firm productivity differential. The latter evidence is also revealed bythe increasing standard deviation spurring after non unionised firms start populating themarket, at t = 100, in both scenarios: in general the variation of productivity across firmsis always higher between non unionised firms (dotted line), as expected from the empiricalevidence.
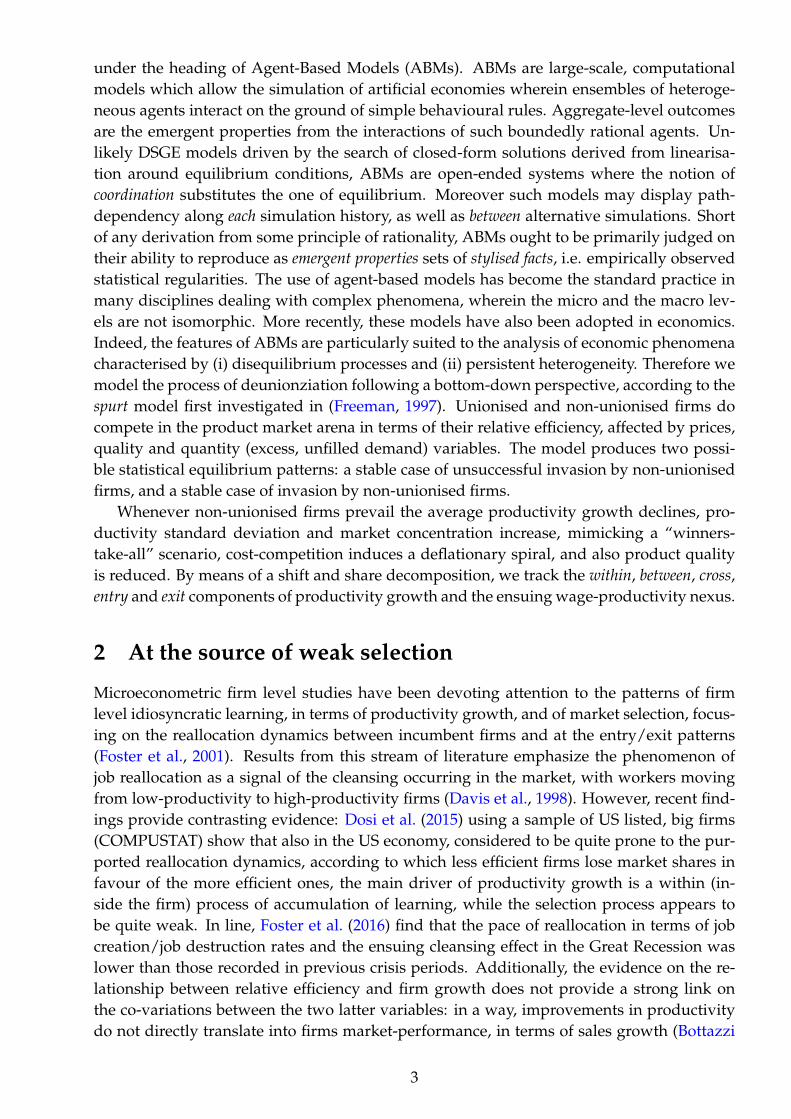
Figure 3(a) presents the average productivity growth in the two scenarios comparing theaverage value of the latter variable across 50MC runs in each of the two respective scenarios.The invasion of non unionised firms entails a reduction of the average productivity growthof 0.17%, signalling that the process of deunionization in our model causes a productivityslowdown. Not only non unionised firms have in average a lower productivity, they alsoproduce products of lower quality (Figure 3(b)): the latter mechanism is due to the differentorganization of labour market occurring in the two types of firms: in fact, in non unionisedfirms, characterized by external flexibility, workers are in average less skilled. The lowerdegree of workers competence maps into lower quality products, according to Equation 7.
11
Figure 2: Wage and productivity dynamics I - Distributional and time series analysis
(a) Pooled wage distribution
−0.4 −0.2 0.0 0.2
0.05
0.10
0.20
0.50
1.00
2.00
5.00
10.0
0
Pooled average wages distribution ( all experiments )
( Consumption−goods sector )log(normalized average real wage)
Bin
ned
dens
ity
InvasionNo InvasionNormal fits
(b) Pooled wage growth rate distribution
−0.10 −0.05 0.00 0.05 0.10
0.1
0.2
0.5
1.0
2.0
5.0
10.0
20.0
Pooled average wage growth distribution ( all experiments )
( Consumption−goods sector )Normalized average real wage growth rate
Bin
ned
dens
ity
InvasionNo InvasionLaplace fits
(c) Productivity dynamics by firm type
0 100 200 300 400
02
46
810
Productivity by firm type ( all experiments )
( vertical dotted line: regime change / sector 2 only / MC runs = 100 )Time
Log
prod
uctiv
ity
InvasionNo Invasion
Pre−change firmsPost−change firms
(d) Productivity standard deviation by firm type
0 100 200 300 400
0.0
0.1
0.2
0.3
0.4
0.5
Productivity standard deviation by firm type ( all experiments )
( vertical dotted line: regime change / sector 2 only / MC runs = 100 )Time
Sta
ndar
d de
viat
ion
of lo
g pr
oduc
tivity
InvasionNo Invasion
Pre−change firmsPost−change firms
12
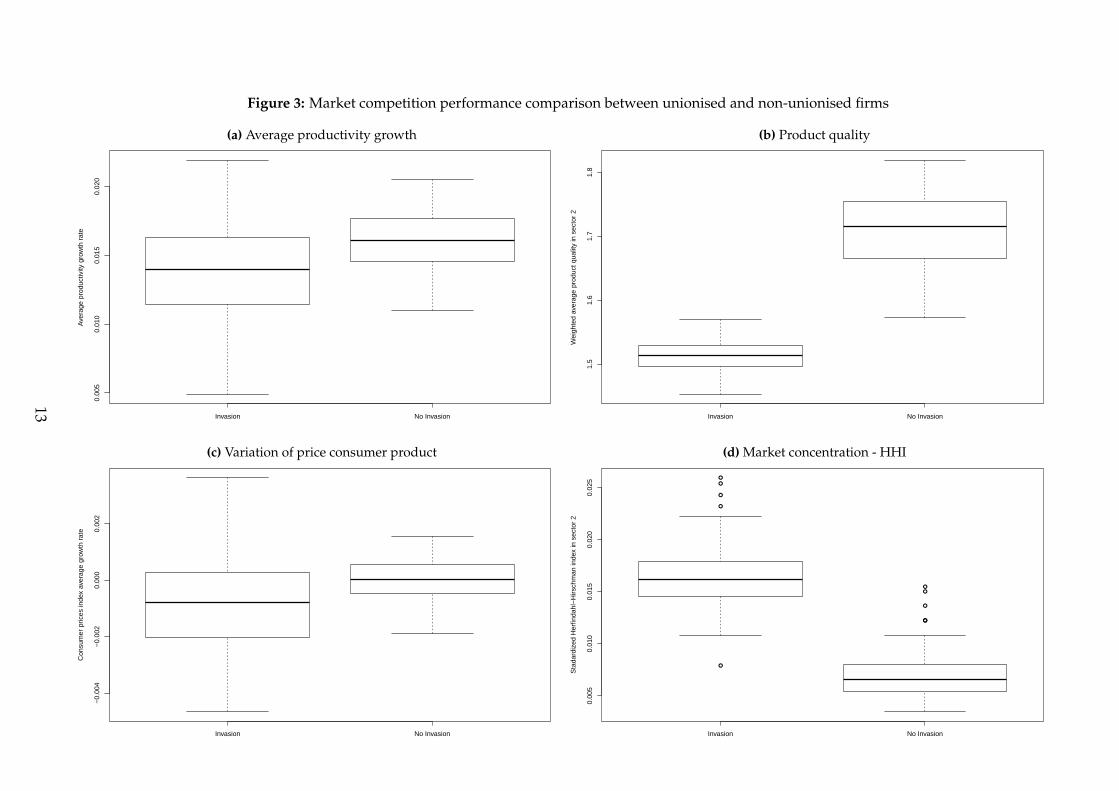
Figure 3: Market competition performance comparison between unionised and non-unionised firms
(a) Average productivity growth
Invasion No Invasion
0.00
50.
010
0.01
50.
020
Productivity growth
( bar: median / box: 2nd−3rd quartile / whiskers: max−min / points: outliers / MC runs = 100 / period = 301 − 500 )
Ave
rage
pro
duct
ivity
gro
wth
rat
e
(b) Product quality
Invasion No Invasion
1.5
1.6
1.7
1.8
Quality
( bar: median / box: 2nd−3rd quartile / whiskers: max−min / points: outliers / MC runs = 100 / period = 301 − 500 )
Wei
ghte
d av
erag
e pr
oduc
t qua
lity
in s
ecto
r 2
(c) Variation of price consumer product
Invasion No Invasion
−0.
004
−0.
002
0.00
00.
002
Inflation
( bar: median / box: 2nd−3rd quartile / whiskers: max−min / points: outliers / MC runs = 100 / period = 301 − 500 )
Con
sum
er p
rices
inde
x av
erag
e gr
owth
rat
e
(d) Market concentration - HHI
●
●
●
●
●
●
●
●
●
●
Invasion No Invasion
0.00
50.
010
0.01
50.
020
0.02
5
Market concentration
( bar: median / box: 2nd−3rd quartile / whiskers: max−min / points: outliers / MC runs = 100 / period = 301 − 500 )
Sta
dard
ized
Her
finda
hl−
Hirs
chm
an in
dex
in s
ecto
r 2
13
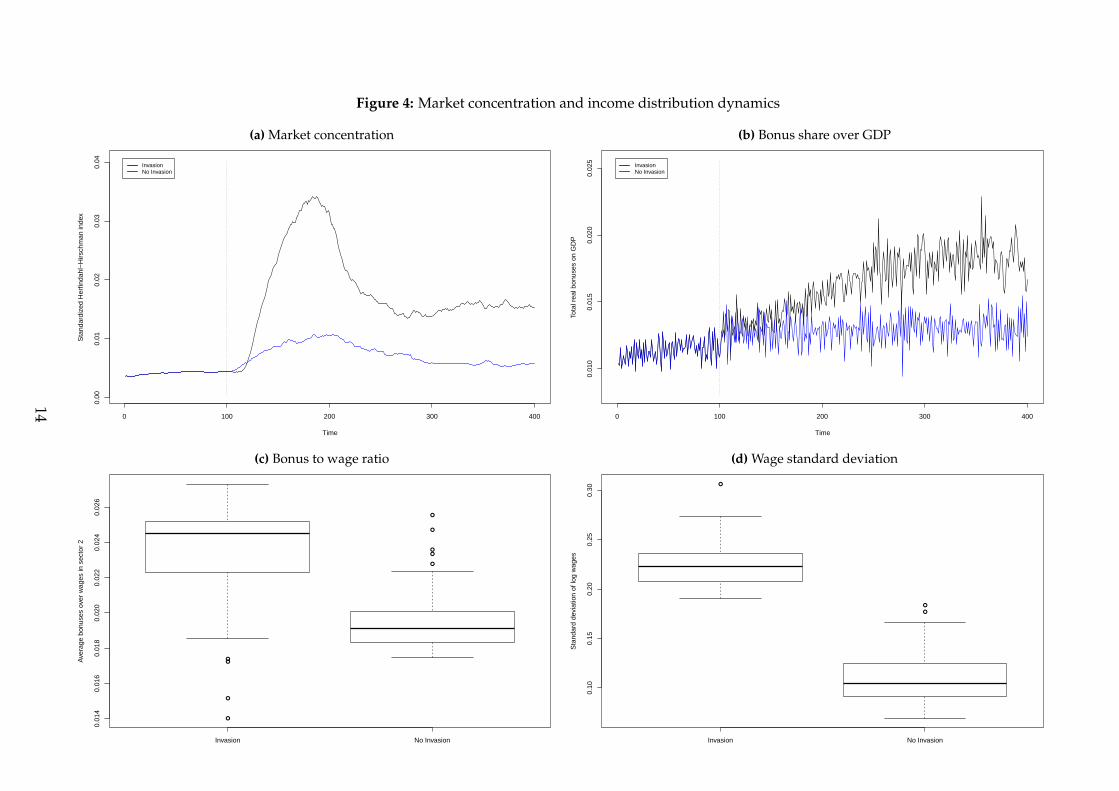
Figure 4: Market concentration and income distribution dynamics
(a) Market concentration
0 100 200 300 400
0.00
0.01
0.02
0.03
0.04
Market concentration ( all experiments )
( vertical dotted line: regime change / Sector 2 only / MC runs = 100 )Time
Sta
ndar
dize
d H
erfin
dahl
−H
irsch
man
inde
x
InvasionNo Invasion
(b) Bonus share over GDP
0 100 200 300 400
0.01
00.
015
0.02
00.
025
Bonus share ( all experiments )
( vertical dotted line: regime change / MC runs = 100 )Time
Tota
l rea
l bon
uses
on
GD
P
InvasionNo Invasion
(c) Bonus to wage ratio
●
●●
●
●
●
●
●
●
Invasion No Invasion
0.01
40.
016
0.01
80.
020
0.02
20.
024
0.02
6
Bonus to wage ratio
( bar: median / box: 2nd−3rd quartile / whiskers: max−min / points: outliers / MC runs = 100 / period = 301 − 500 )
Ave
rage
bon
uses
ove
r w
ages
in s
ecto
r 2
(d) Wage standard deviation
●
●
●
Invasion No Invasion
0.10
0.15
0.20
0.25
0.30
Wages spread
( bar: median / box: 2nd−3rd quartile / whiskers: max−min / points: outliers / MC runs = 100 / period = 301 − 500 )
Sta
ndar
d de
viat
ion
of lo
g w
ages
14
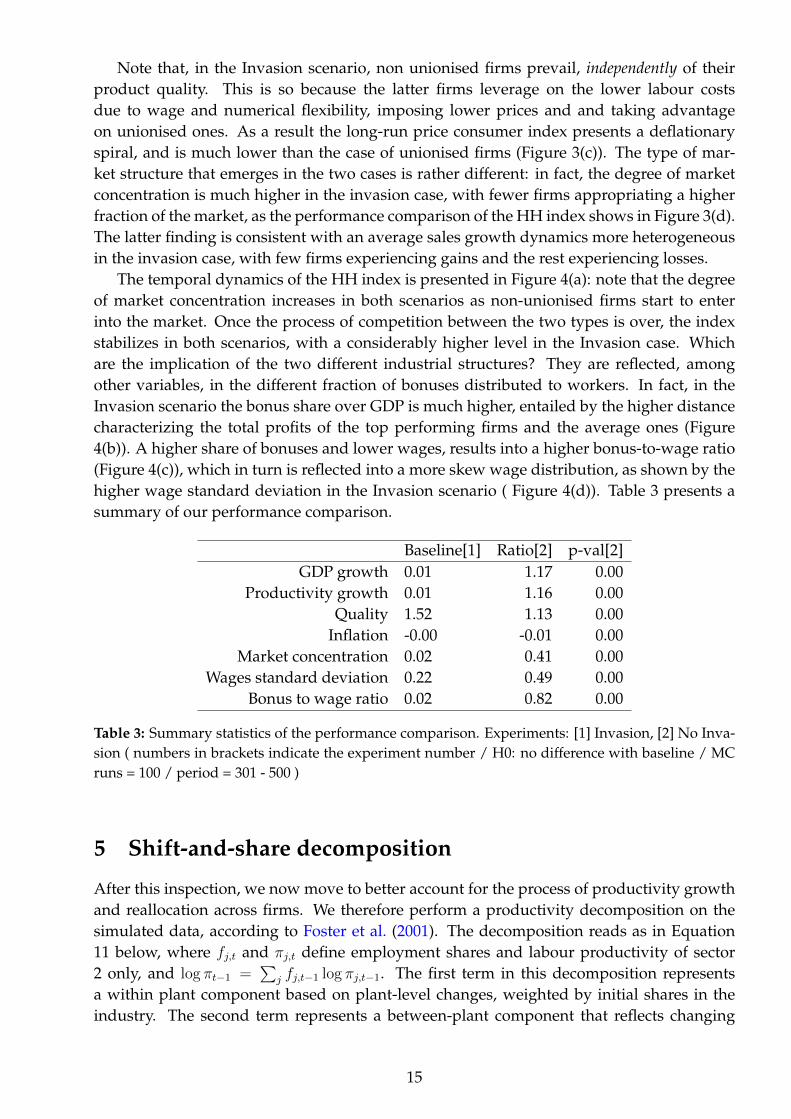
Note that, in the Invasion scenario, non unionised firms prevail, independently of theirproduct quality. This is so because the latter firms leverage on the lower labour costsdue to wage and numerical flexibility, imposing lower prices and and taking advantageon unionised ones. As a result the long-run price consumer index presents a deflationaryspiral, and is much lower than the case of unionised firms (Figure 3(c)). The type of mar-ket structure that emerges in the two cases is rather different: in fact, the degree of marketconcentration is much higher in the invasion case, with fewer firms appropriating a higherfraction of the market, as the performance comparison of the HH index shows in Figure 3(d).The latter finding is consistent with an average sales growth dynamics more heterogeneousin the invasion case, with few firms experiencing gains and the rest experiencing losses.
The temporal dynamics of the HH index is presented in Figure 4(a): note that the degreeof market concentration increases in both scenarios as non-unionised firms start to enterinto the market. Once the process of competition between the two types is over, the indexstabilizes in both scenarios, with a considerably higher level in the Invasion case. Whichare the implication of the two different industrial structures? They are reflected, amongother variables, in the different fraction of bonuses distributed to workers. In fact, in theInvasion scenario the bonus share over GDP is much higher, entailed by the higher distancecharacterizing the total profits of the top performing firms and the average ones (Figure4(b)). A higher share of bonuses and lower wages, results into a higher bonus-to-wage ratio(Figure 4(c)), which in turn is reflected into a more skew wage distribution, as shown by thehigher wage standard deviation in the Invasion scenario ( Figure 4(d)). Table 3 presents asummary of our performance comparison.
Baseline[1] Ratio[2] p-val[2]GDP growth 0.01 1.17 0.00
Productivity growth 0.01 1.16 0.00Quality 1.52 1.13 0.00
Inflation -0.00 -0.01 0.00Market concentration 0.02 0.41 0.00
Wages standard deviation 0.22 0.49 0.00Bonus to wage ratio 0.02 0.82 0.00
Table 3: Summary statistics of the performance comparison. Experiments: [1] Invasion, [2] No Inva-sion ( numbers in brackets indicate the experiment number / H0: no difference with baseline / MCruns = 100 / period = 301 - 500 )
5 Shift-and-share decomposition
After this inspection, we now move to better account for the process of productivity growthand reallocation across firms. We therefore perform a productivity decomposition on thesimulated data, according to Foster et al. (2001). The decomposition reads as in Equation11 below, where fj,t and πj,t define employment shares and labour productivity of sector2 only, and log πt−1 =
∑j fj,t−1 log πj,t−1. The first term in this decomposition represents
a within plant component based on plant-level changes, weighted by initial shares in theindustry. The second term represents a between-plant component that reflects changing
15
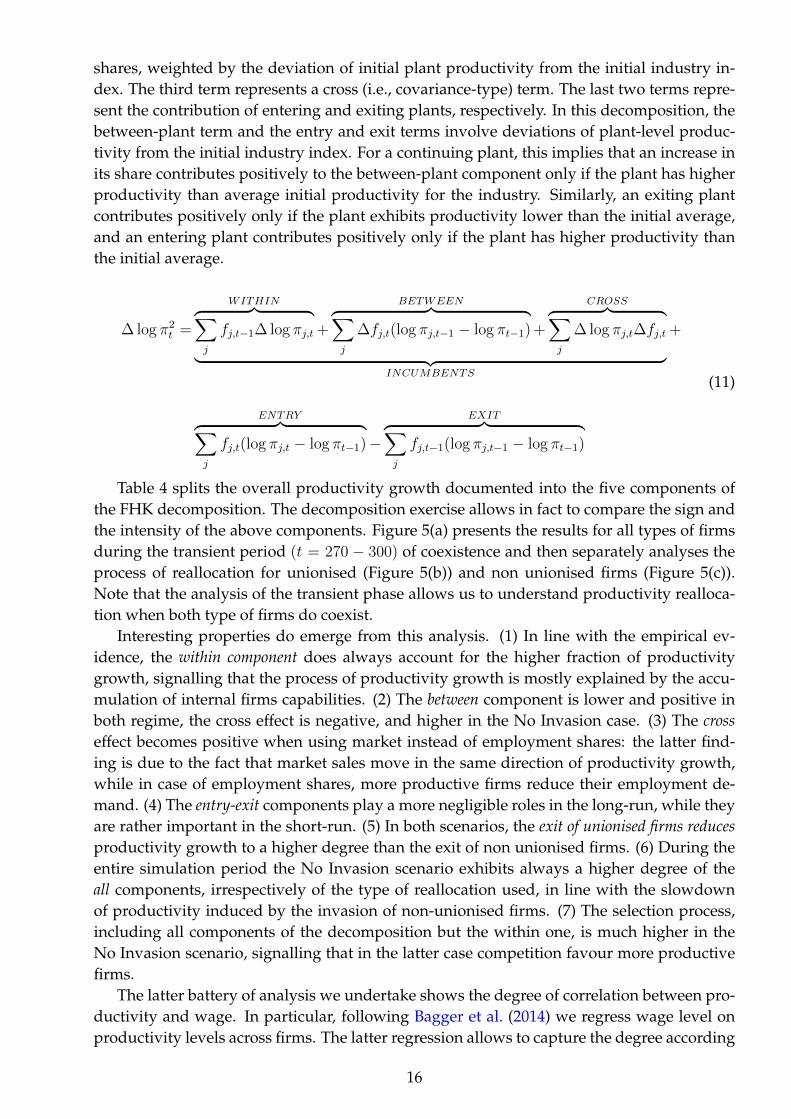
shares, weighted by the deviation of initial plant productivity from the initial industry in-dex. The third term represents a cross (i.e., covariance-type) term. The last two terms repre-sent the contribution of entering and exiting plants, respectively. In this decomposition, thebetween-plant term and the entry and exit terms involve deviations of plant-level produc-tivity from the initial industry index. For a continuing plant, this implies that an increase inits share contributes positively to the between-plant component only if the plant has higherproductivity than average initial productivity for the industry. Similarly, an exiting plantcontributes positively only if the plant exhibits productivity lower than the initial average,and an entering plant contributes positively only if the plant has higher productivity thanthe initial average.
∆ log π2t =
WITHIN︷ ︸︸ ︷∑j
fj,t−1∆ log πj,t +
BETWEEN︷ ︸︸ ︷∑j
∆fj,t(log πj,t−1 − log πt−1) +
CROSS︷ ︸︸ ︷∑j
∆ log πj,t∆fj,t︸ ︷︷ ︸INCUMBENTS
+
ENTRY︷ ︸︸ ︷∑j
fj,t(log πj,t − log πt−1)−
EXIT︷ ︸︸ ︷∑j
fj,t−1(log πj,t−1 − log πt−1)
(11)
Table 4 splits the overall productivity growth documented into the five components ofthe FHK decomposition. The decomposition exercise allows in fact to compare the sign andthe intensity of the above components. Figure 5(a) presents the results for all types of firmsduring the transient period (t = 270 − 300) of coexistence and then separately analyses theprocess of reallocation for unionised (Figure 5(b)) and non unionised firms (Figure 5(c)).Note that the analysis of the transient phase allows us to understand productivity realloca-tion when both type of firms do coexist.
Interesting properties do emerge from this analysis. (1) In line with the empirical ev-idence, the within component does always account for the higher fraction of productivitygrowth, signalling that the process of productivity growth is mostly explained by the accu-mulation of internal firms capabilities. (2) The between component is lower and positive inboth regime, the cross effect is negative, and higher in the No Invasion case. (3) The crosseffect becomes positive when using market instead of employment shares: the latter find-ing is due to the fact that market sales move in the same direction of productivity growth,while in case of employment shares, more productive firms reduce their employment de-mand. (4) The entry-exit components play a more negligible roles in the long-run, while theyare rather important in the short-run. (5) In both scenarios, the exit of unionised firms reducesproductivity growth to a higher degree than the exit of non unionised firms. (6) During theentire simulation period the No Invasion scenario exhibits always a higher degree of theall components, irrespectively of the type of reallocation used, in line with the slowdownof productivity induced by the invasion of non-unionised firms. (7) The selection process,including all components of the decomposition but the within one, is much higher in theNo Invasion scenario, signalling that in the latter case competition favour more productivefirms.
The latter battery of analysis we undertake shows the degree of correlation between pro-ductivity and wage. In particular, following Bagger et al. (2014) we regress wage level onproductivity levels across firms. The latter regression allows to capture the degree according
16
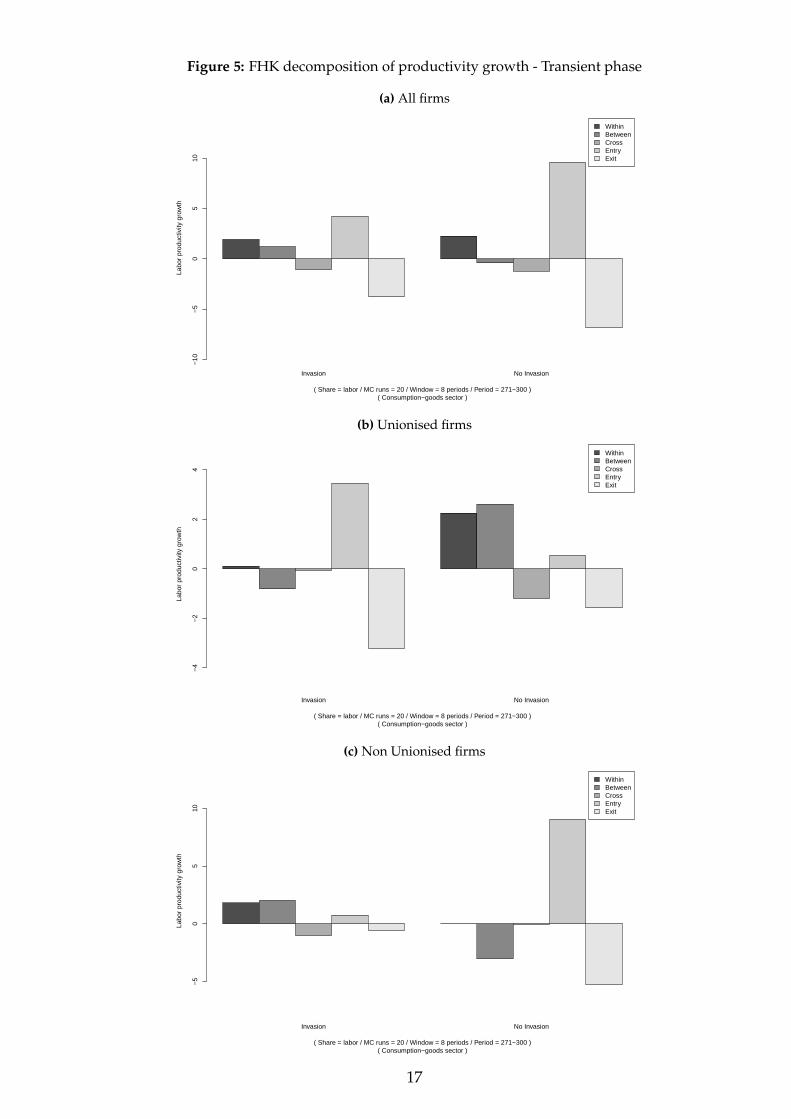
Figure 5: FHK decomposition of productivity growth - Transient phase
(a) All firms
Invasion No Invasion
WithinBetweenCrossEntryExit
Labo
r pr
oduc
tivity
gro
wth
−10
−5
05
10
FHK decomposition of productivity growth ( all firms )
( Share = labor / MC runs = 20 / Window = 8 periods / Period = 271−300 )( Consumption−goods sector )
(b) Unionised firms
Invasion No Invasion
WithinBetweenCrossEntryExit
Labo
r pr
oduc
tivity
gro
wth
−4
−2
02
4
FHK decomposition of productivity growth ( pre−change firms )
( Share = labor / MC runs = 20 / Window = 8 periods / Period = 271−300 )( Consumption−goods sector )
(c) Non Unionised firms
Invasion No Invasion
WithinBetweenCrossEntryExit
Labo
r pr
oduc
tivity
gro
wth
−5
05
10
FHK decomposition of productivity growth ( post−change firms )
( Share = labor / MC runs = 20 / Window = 8 periods / Period = 271−300 )( Consumption−goods sector )
17
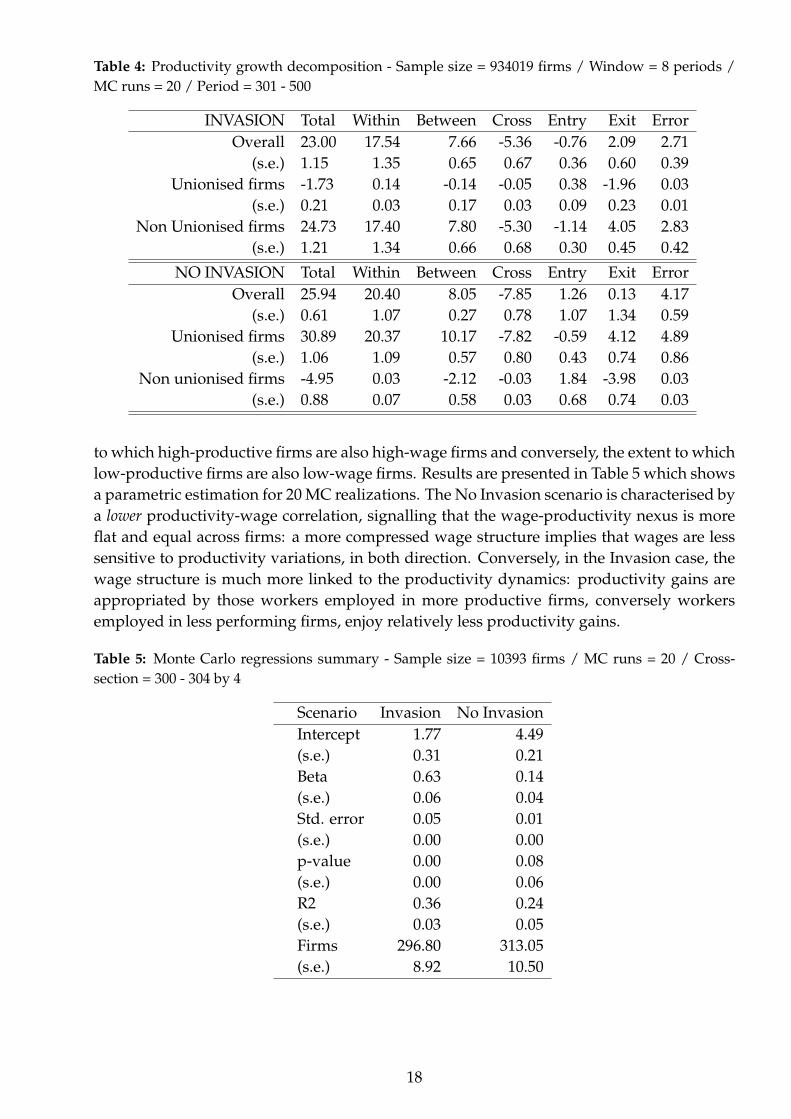
Table 4: Productivity growth decomposition - Sample size = 934019 firms / Window = 8 periods /MC runs = 20 / Period = 301 - 500
INVASION Total Within Between Cross Entry Exit ErrorOverall 23.00 17.54 7.66 -5.36 -0.76 2.09 2.71
(s.e.) 1.15 1.35 0.65 0.67 0.36 0.60 0.39Unionised firms -1.73 0.14 -0.14 -0.05 0.38 -1.96 0.03
(s.e.) 0.21 0.03 0.17 0.03 0.09 0.23 0.01Non Unionised firms 24.73 17.40 7.80 -5.30 -1.14 4.05 2.83
(s.e.) 1.21 1.34 0.66 0.68 0.30 0.45 0.42
NO INVASION Total Within Between Cross Entry Exit ErrorOverall 25.94 20.40 8.05 -7.85 1.26 0.13 4.17
(s.e.) 0.61 1.07 0.27 0.78 1.07 1.34 0.59Unionised firms 30.89 20.37 10.17 -7.82 -0.59 4.12 4.89
(s.e.) 1.06 1.09 0.57 0.80 0.43 0.74 0.86Non unionised firms -4.95 0.03 -2.12 -0.03 1.84 -3.98 0.03
(s.e.) 0.88 0.07 0.58 0.03 0.68 0.74 0.03
to which high-productive firms are also high-wage firms and conversely, the extent to whichlow-productive firms are also low-wage firms. Results are presented in Table 5 which showsa parametric estimation for 20 MC realizations. The No Invasion scenario is characterised bya lower productivity-wage correlation, signalling that the wage-productivity nexus is moreflat and equal across firms: a more compressed wage structure implies that wages are lesssensitive to productivity variations, in both direction. Conversely, in the Invasion case, thewage structure is much more linked to the productivity dynamics: productivity gains areappropriated by those workers employed in more productive firms, conversely workersemployed in less performing firms, enjoy relatively less productivity gains.
Table 5: Monte Carlo regressions summary - Sample size = 10393 firms / MC runs = 20 / Cross-section = 300 - 304 by 4
Scenario Invasion No InvasionIntercept 1.77 4.49(s.e.) 0.31 0.21Beta 0.63 0.14(s.e.) 0.06 0.04Std. error 0.05 0.01(s.e.) 0.00 0.00p-value 0.00 0.08(s.e.) 0.00 0.06R2 0.36 0.24(s.e.) 0.03 0.05Firms 296.80 313.05(s.e.) 8.92 10.50
18
6 Conclusions
This paper presents an ABM which endogenously accounts for the process of deunioniza-tion. The process of deunionziation occurs following a bottom-down perspective, accordingto the spurt model first investigated in (Freeman, 1997). Unionised and non-unionised firmsdo compete in the product market arena in terms of their relative efficiency, affected byprices, quality and (excess) quantity variables. The model produces two possible statisticalequilibrium patterns: a stable case of unsuccessful invasion by non-unionised firms, and astable case of stable invasion by non-unionised firms.
The results from our analysis provide support in favour of the efficient dynamics fos-tered by a “Social market economy”, populated by unionised firms, wherein the processof innovation, and therefore productivity growth is triggered by the accumulation of firmslevel capabilities, workers skills, incremental innovation and an egalitarian wage structure.Under these conditions, the process of firms competition in the product market features apositive selection dynamics, with high-productivity firms prevailing upon low-productivityones. At the opposite end of the spectrum, a “Free market economy”, populated by non-unionised firms ensuing a more dispersed wage structure, results into a slowdown of marketselection, with low-productivity firms remaining in the market, therefore reducing averageproductivity and increasing its standard deviation. In this latter case, the exit dynamics neg-atively contributes to the average growth of productivity, such as the negatively contributesthe cross effect, capturing the covariation between market share and productivity. .
Acknowledgements
We gratefully acknowledge the support by the European Union’s Horizon 2020 research andinnovation programme under grant agreement No. 649186 - ISIGrowth, and by Fundaçãode Amparo à Pesquisa do Estado de São Paulo (FAPESP), process No. 2015/24341-7.
References
Bagger, J., B. J. Christensen, and D. T. Mortensen (2014). Wage and labor productivity disper-sion: The roles of total factor productivity, labor quality, capital intensity, and rent sharing.In 2014 Meeting Papers.
Barth, E., A. Bryson, J. C. Davis, and R. Freeman (2016). It’s where you work: Increases in thedispersion of earnings across establishments and individuals in the united states. Journalof Labor Economics 34(S2), S67–S97.
Barth, E., K. O. Moene, and F. Willumsen (2014). The scandinavian model—an interpretation.Journal of Public Economics 117, 60–72.
Berlingieri, G., P. Blanchenay, and C. Criscuolo (2017). Great divergences: The growingdispersion of wages and productivity in oecd countries.
Bottazzi, G., G. Dosi, N. Jacoby, A. Secchi, and F. Tamagni (2010). Corporate performancesand market selection: some comparative evidence. Industrial and Corporate Change 19(6),1953–1996.
19
Bryson, A., R. Freeman, R. Gomez, and P. Willman (2017). The twin track model of employeevoice: An anglo-american perspective on union decline and the rise of alternative formsof voice.
Davis, S. J., J. C. Haltiwanger, S. Schuh, et al. (1998). Job creation and destruction. MIT PressBooks 1.
Decker, R. A., J. Haltiwanger, R. S. Jarmin, and J. Miranda (2016). Declining business dy-namism: What we know and the way forward. American Economic Review 106(5), 203–07.
Dosi, G., G. Fagiolo, and A. Roventini (2010). Schumpeter meeting Keynes: A policy-friendlymodel of endogenous growth and business cycles. Journal of Economic Dynamics and Con-trol 34(9), 1748–1767.
Dosi, G., D. Moschella, E. Pugliese, and F. Tamagni (2015, Oct). Productivity, market selec-tion, and corporate growth: comparative evidence across us and europe. Small BusinessEconomics 45(3), 643–672.
Dosi, G., M. C. Pereira, A. Roventini, and M. E. Virgillito (2016). The Effects of LabourMarket Reforms upon Unemployment and Income Inequalities: an Agent Based Model.Socio-economic Review (2016/27).
Dosi, G., M. C. Pereira, A. Roventini, and M. E. Virgillito (2017). When more Flexibility Yieldsmore Fragility: the Microfoundations of Keynesian Aggregate Unemployment. Journal ofEconomic Dynamics and Control.
Dunne, T., L. Foster, J. Haltiwanger, and K. R. Troske (2004). Wage and productivity dis-persion in united states manufacturing: The role of computer investment. Journal of LaborEconomics 22(2), 397–429.
Foster, L., C. Grim, and J. Haltiwanger (2016). Reallocation in the great recession: cleansingor not? Journal of Labor Economics 34(S1), S293–S331.
Foster, L., J. C. Haltiwanger, and C. J. Krizan (2001). Aggregate productivity growth: Lessonsfrom microeconomic evidence. In New developments in productivity analysis, pp. 303–372.University of Chicago Press.
Freeman, R. B. (1984). Longitudinal analyses of the effects of trade unions. Journal of laborEconomics 2(1), 1–26.
Freeman, R. B. (1997). Spurts in union growth: Defining moments and social processes.Technical report, National Bureau of Economic Research.
Hibbs Jr, D. A. and H. Locking (2000). Wage dispersion and productive efficiency: Evidencefor Sweden. Journal of Labor Economics 18(4), 755–782.
Hutchinson, J. and D. Persyn (2012, Apr). Globalisation, concentration and footloose firms:in search of the main cause of the declining labour share. Review of World Economics 148(1),17–43.
Karabarbounis, L. and B. Neiman (2013). The global decline of the labor share. The QuarterlyJournal of Economics 129(1), 61–103.
Lee, D. S. (1999). Wage inequality in the united states during the 1980s: Rising dispersion orfalling minimum wage? The Quarterly Journal of Economics 114(3), 977–1023.
McGowan, M. A., D. Andrews, and V. Millot (2017). Insolvency regimes, zombie firms andcapital reallocation.
Schwellnus, C., A. Kappeler, and P.-A. Pionnier (2017). Decoupling of wages from produc-tivity.
Syverson, C. (2017, May). Challenges to mismeasurement explanations for the us produc-tivity slowdown. Journal of Economic Perspectives 31(2), 165–86.
20


![Hüseyin Taştan Asuman Oktayer - doiSerbia...Axel Dreher and Noel Gaston 2007]. The diminishing role of unions (or deunionization), decentralization of wage bargaining, and adoption](https://img.pdfslide.us/doc/110x75/60b2a2c295f0b9506c4bc5e9/hseyin-tatan-asuman-oktayer-axel-dreher-and-noel-gaston-2007-the-diminishing.jpg)