Embed Size (px)
Citation preview
A S H R A E J O U R N A L a s h r a e . o r g S E P T E M B E R 2 0 2 14 6
This peer-reviewed column does not represent official ASHRAE guidance. For more information on ASHRAE resources on COVID-19, visit ashrae.org/COVID19.
ColumnIEQ APPLICATIONS
Wei Sun, P.E., is president of Engsysco with offices in Ann Arbor and Farmington Hills, Mich. He is an ASHRAE Distinguished Lecturer, member of Technology Council, past Chair of Environmental Health Committee and TC 9.11, Clean Spaces. He was past IEST Society President and serves as NEBB’s CPT Standard Chair and ISO TC209 Standards U.S. Delegate.
Inspirations From Cleanroom HVAC Technologies
Reducing Airborne Contamination, Transmission & MigrationBY WEI SUN, P.E., FELLOW ASHRAE
HVAC technologies used in cleanrooms can achieve ultralow airborne contamina-tion, transmission and migration to meet industrial specifications. Traditionally, people assume cleanrooms consume high levels of energy, and their technologies and associated costs are only justified for high-tech sectors. However, emerging design concepts and approaches are becoming more cost-effective and energy efficient while achieving excellent airborne cleanliness performance. Many mitigation strategies have been studied to tackle COVID-19 challenges in airborne contamination control. Cleanrooms’ unique and mature air handling, distribution, cascading, segregation and filtration techniques may encourage experimenting with some of its concepts for commercial spaces to achieve better airborne infectious disease transmission control where applicable and cost-effective.
Cleanroom and HVAC Design ComplexityA cleanroom is an enclosed space in which airborne
particles (both nonviable and viable) are controlled and
classified. A cleanroom is designed, constructed and
operated to minimize particle generation and reten-
tion inside the room, as well as migration from adjacent
spaces to accomplish ultrahigh-purity airborne and
surface-borne cleanliness.
In addition to controlling cleanroom temperature,
humidity and ventilation rate,its airflow pattern, pres-
sure, filtration, particle and gaseous concentrations,
etc., also need to be well controlled and quantitatively
tested to meet stringent ISO 14644 standards and pro-
cess specifications. If a cleanroom’s supply airflow rate
varies, the room’s airflow pattern, pressure differential,
contaminant removal and particle/microbial/gaseous
concentrations are going to be altered or distorted
Wei Sun
This article was published in ASHRAE Journal, September 2021. Copyright 2021 ASHRAE. Posted at www.ashrae.org. This article may not be copied and/or distributed electronically or in paper form without permission of ASHRAE. For more information about ASHRAE Journal, visit www.ashrae.org.
S E P T E M B E R 2 0 2 1 a s h r a e . o r g A S H R A E J O U R N A L 47
TABLE 1 Air cleanliness by particle concentration.1
ISO CLASS NUMBER
MAXIMUM ALLOWABLE PARTICLE CONCENTRATION (COUNTS/m³) EQUAL TO AND GREATER THAN THE CONSIDERED S IZES1
0.1 µm 0.2 µm 0.3 µm 0.5 µm 1.0 µm 5.0 µm
Class 1 10
Class 2 100 24 10
Class 3 1,000 237 102 35
Class 4 10,000 2,370 1,020 352 83
Class 5 100,000 23,700 10,200 3,520 832
Class 6 1,000,000 237,000 102,000 35,200 8,320 293
Class 7 352,000 83,200 2,930
Class 8 3,520,000 832,000 29,300
Class 9 35,200,000 8,320,000 293,000
TABLE 2 Indoor airborne particle (viable and nonviable) controls for cleanrooms and commercial spaces. (Courtesy of Wei Sun, P.E., from his ASHRAE Distinguished Lecturer Presentation)
SOURCE CONTROL DI LUTION W ITH FI LTRATION TRANSMISSION CONTROL MIGRATION CONTROL
CLEA
NROO
MS
Control source-strength by reduction, isolation and/or removal. Isolate particle generations with containment devices and remove particles directly from room by using: • Lower emission rate• Mask and gowning• Fume hood• Snorkel local exhaust• Equipment integral exhaust• Purge/flush cycle• UVGI or hydrogen peroxide (H2O2) disinfection
If contaminants are still released into room volume, then room concentration can be reduced through the dilution of HEPA (≥99.97% efficiency) or ULPA (≥99.997% efficiency) filtered supply air to minimize particles’ entry through dilution air, typically the higher of air change rate, the lower of room contaminant concentration.
ach may range from 15 to 600, mainly through secondary recirculation air instead of primary AHU air.
Keep distance from contaminant sources.
Use segregation and cascading airflow arrangement.
Apply pressurization or depressurization.
Install anteroom or airlock.
COM
MER
CIAL
SPA
CES Control source-strength is not common, but optional
methods can be applied with:• Mask • Return air to be the main path for contaminant exit,
no local exhaust. • Flush cycle to be integrated into AHU.
Multiple layers of filters in AHU, combined efficiency 60% to 85%, efficiency could be increased to reduce contaminant reentry through supply air.
ach may range from 3 to 12, all through primary AHU air, secondary recirculation air is not common.
Supply air uses “shared return airs” from multiple rooms within same AHU zone; fine particles emitted from other rooms could reenter room, even filtered in AHU.
Distance from potential source if required.
Not typical.
COLUMN IEQ APPLICATIONS
almost instantaneously. To maintain all these
room conditions within specified tolerances,
cleanroom HVAC system design is often much
more complex and complicated than that for
commercial spaces.
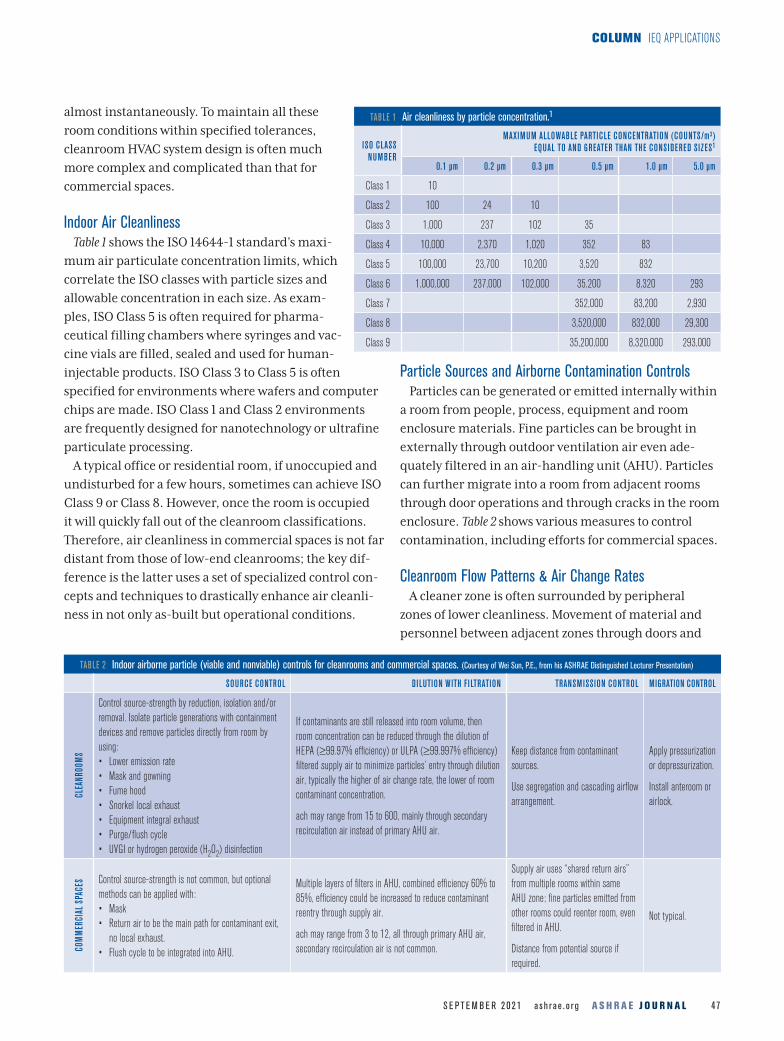
Indoor Air CleanlinessTable 1 shows the ISO 14644-1 standard’s maxi-
mum air particulate concentration limits, which
correlate the ISO classes with particle sizes and
allowable concentration in each size. As exam-
ples, ISO Class 5 is often required for pharma-
ceutical filling chambers where syringes and vac-
cine vials are filled, sealed and used for human-
injectable products. ISO Class 3 to Class 5 is often
specified for environments where wafers and computer
chips are made. ISO Class 1 and Class 2 environments
are frequently designed for nanotechnology or ultrafine
particulate processing.
A typical office or residential room, if unoccupied and
undisturbed for a few hours, sometimes can achieve ISO
Class 9 or Class 8. However, once the room is occupied
it will quickly fall out of the cleanroom classifications.
Therefore, air cleanliness in commercial spaces is not far
distant from those of low-end cleanrooms; the key dif-
ference is the latter uses a set of specialized control con-
cepts and techniques to drastically enhance air cleanli-
ness in not only as-built but operational conditions.
Particle Sources and Airborne Contamination ControlsParticles can be generated or emitted internally within
a room from people, process, equipment and room
enclosure materials. Fine particles can be brought in
externally through outdoor ventilation air even ade-
quately filtered in an air-handling unit (AHU). Particles
can further migrate into a room from adjacent rooms
through door operations and through cracks in the room
enclosure. Table 2 shows various measures to control
contamination, including efforts for commercial spaces.
Cleanroom Flow Patterns & Air Change RatesA cleaner zone is often surrounded by peripheral
zones of lower cleanliness. Movement of material and
personnel between adjacent zones through doors and
A S H R A E J O U R N A L a s h r a e . o r g S E P T E M B E R 2 0 2 14 8
FIGURE 1 Cleanroom airflow patterns.1
Unidirectional Flow (Horizontal and Vertical)
SA RA
SA
RA RA
Nonunidirectional Flow
SA SA
RARA
Mixed Flow
SA SA SA
RARARA
COLUMN IEQ APPLICATIONS
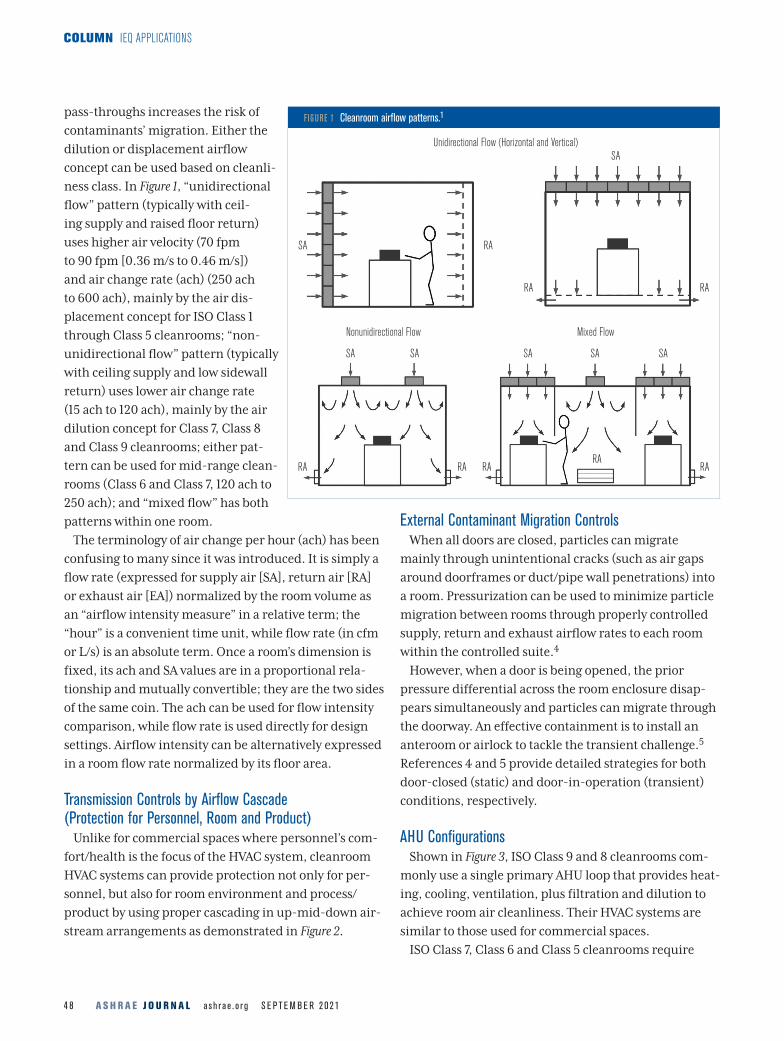
pass-throughs increases the risk of
contaminants’ migration. Either the
dilution or displacement airflow
concept can be used based on cleanli-
ness class. In Figure 1, “unidirectional
flow” pattern (typically with ceil-
ing supply and raised floor return)
uses higher air velocity (70 fpm
to 90 fpm [0.36 m/s to 0.46 m/s])
and air change rate (ach) (250 ach
to 600 ach), mainly by the air dis-
placement concept for ISO Class 1
through Class 5 cleanrooms; “non-
unidirectional flow” pattern (typically
with ceiling supply and low sidewall
return) uses lower air change rate
(15 ach to 120 ach), mainly by the air
dilution concept for Class 7, Class 8
and Class 9 cleanrooms; either pat-
tern can be used for mid-range clean-
rooms (Class 6 and Class 7, 120 ach to
250 ach); and “mixed flow” has both
patterns within one room.
The terminology of air change per hour (ach) has been
confusing to many since it was introduced. It is simply a
flow rate (expressed for supply air [SA], return air [RA]
or exhaust air [EA]) normalized by the room volume as
an “airflow intensity measure” in a relative term; the
“hour” is a convenient time unit, while flow rate (in cfm
or L/s) is an absolute term. Once a room’s dimension is
fixed, its ach and SA values are in a proportional rela-
tionship and mutually convertible; they are the two sides
of the same coin. The ach can be used for flow intensity
comparison, while flow rate is used directly for design
settings. Airflow intensity can be alternatively expressed
in a room flow rate normalized by its floor area.
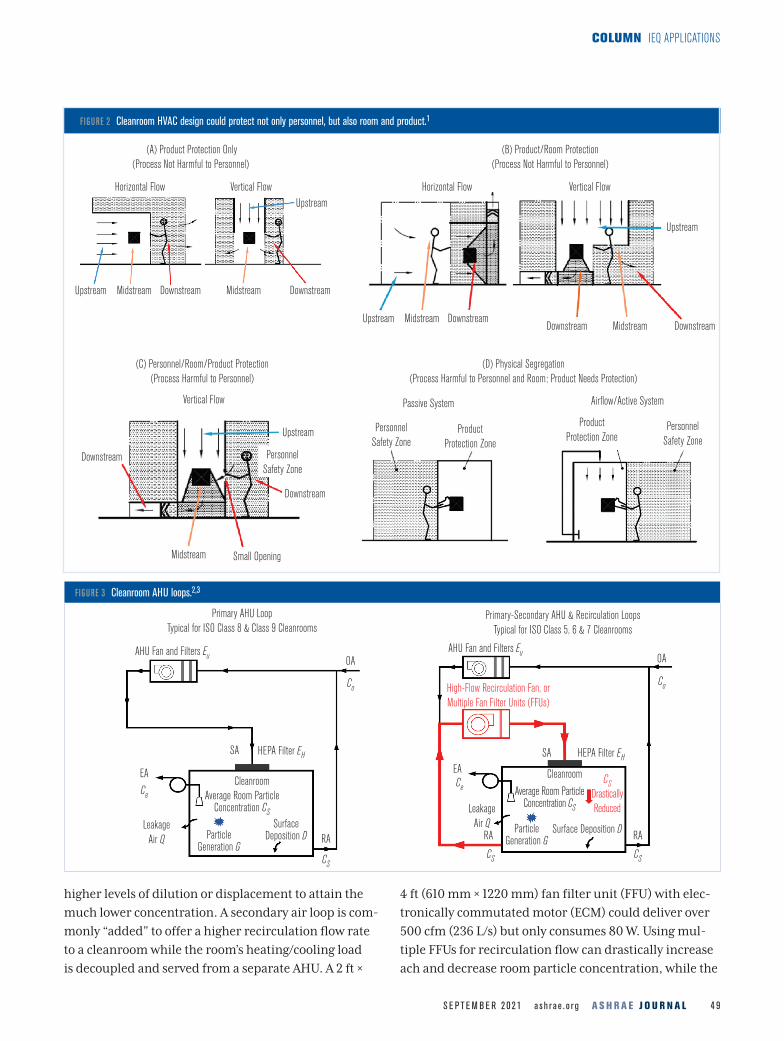
Transmission Controls by Airflow Cascade (Protection for Personnel, Room and Product)
Unlike for commercial spaces where personnel’s com-
fort/health is the focus of the HVAC system, cleanroom
HVAC systems can provide protection not only for per-
sonnel, but also for room environment and process/
product by using proper cascading in up-mid-down air-
stream arrangements as demonstrated in Figure 2.
External Contaminant Migration Controls When all doors are closed, particles can migrate
mainly through unintentional cracks (such as air gaps
around doorframes or duct/pipe wall penetrations) into
a room. Pressurization can be used to minimize particle
migration between rooms through properly controlled
supply, return and exhaust airflow rates to each room
within the controlled suite.4
However, when a door is being opened, the prior
pressure differential across the room enclosure disap-
pears simultaneously and particles can migrate through
the doorway. An effective containment is to install an
anteroom or airlock to tackle the transient challenge.5
References 4 and 5 provide detailed strategies for both
door-closed (static) and door-in-operation (transient)
conditions, respectively.
AHU ConfigurationsShown in Figure 3, ISO Class 9 and 8 cleanrooms com-
monly use a single primary AHU loop that provides heat-
ing, cooling, ventilation, plus filtration and dilution to
achieve room air cleanliness. Their HVAC systems are
similar to those used for commercial spaces.
ISO Class 7, Class 6 and Class 5 cleanrooms require
S E P T E M B E R 2 0 2 1 a s h r a e . o r g A S H R A E J O U R N A L 4 9
Primary AHU Loop Typical for ISO Class 8 & Class 9 Cleanrooms
AHU Fan and Filters Eu OA
HEPA Filter EH
Average Room Particle Concentration CS
Particle Generation G
Cleanroom
Co
SA
EA
Surface Deposition D RA
CS
Leakage Air Q
Ce
Primary-Secondary AHU & Recirculation Loops Typical for ISO Class 5, 6 & 7 Cleanrooms
OA
Co
AHU Fan and Filters Eu
HEPA Filter EHSAEACe
Leakage Air Q
RA
CS
Cleanroom
RA
CS
Surface Deposition D
Average Room Particle Concentration CS
High-Flow Recirculation Fan, or Multiple Fan Filter Units (FFUs)
CS Drastically Reduced
Particle Generation G
FIGURE 3 Cleanroom AHU loops.2,3
Horizontal Flow Vertical Flow Horizontal Flow
Vertical Flow
Vertical FlowUpstream
DownstreamDownstreamUpstream Midstream Midstream
Passive System Airflow/Active System
Personnel Safety Zone
Product Protection Zone
Product Protection Zone
Personnel Safety Zone
Personnel Safety Zone
Small Opening
(A) Product Protection Only(Process Not Harmful to Personnel)
(B) Product/Room Protection(Process Not Harmful to Personnel)
(C) Personnel/Room/Product Protection(Process Harmful to Personnel)
(D) Physical Segregation (Process Harmful to Personnel and Room; Product Needs Protection)
DownstreamUpstream Midstream
Upstream
DownstreamDownstream Midstream
Midstream
Downstream
Upstream
Downstream
FIGURE 2 Cleanroom HVAC design could protect not only personnel, but also room and product.1
COLUMN IEQ APPLICATIONS
higher levels of dilution or displacement to attain the
much lower concentration. A secondary air loop is com-
monly “added” to offer a higher recirculation flow rate
to a cleanroom while the room’s heating/cooling load
is decoupled and served from a separate AHU. A 2 ft ×
4 ft (610 mm × 1220 mm) fan filter unit (FFU) with elec-
tronically commutated motor (ECM) could deliver over
500 cfm (236 L/s) but only consumes 80 W. Using mul-
tiple FFUs for recirculation flow can drastically increase
ach and decrease room particle concentration, while the
A S H R A E J O U R N A L a s h r a e . o r g S E P T E M B E R 2 0 2 15 0
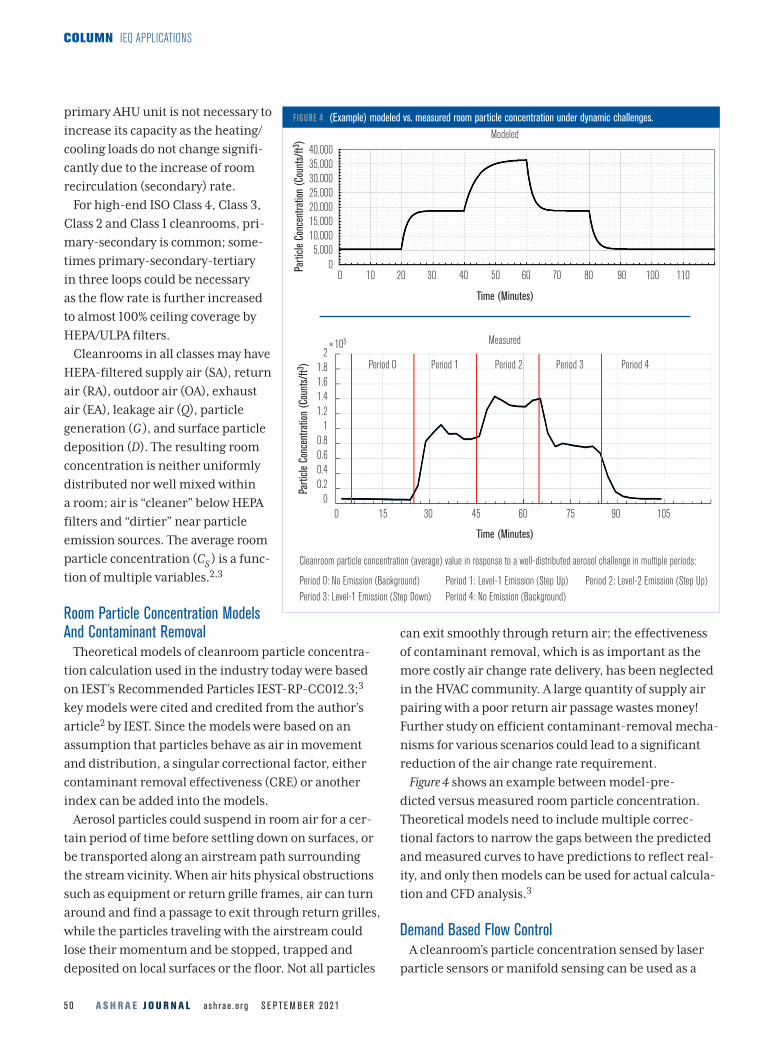
Cleanroom particle concentration (average) value in response to a well-distributed aerosol challenge in multiple periods:
Period 0: No Emission (Background) Period 1: Level-1 Emission (Step Up) Period 2: Level-2 Emission (Step Up) Period 3: Level-1 Emission (Step Down) Period 4: No Emission (Background)
Measured2
1.81.61.41.2
10.80.60.40.2
0
Parti
cle C
once
ntra
tion
(Cou
nts/
ft3 )
×105
Period 0 Period 1 Period 2 Period 3 Period 4
0 15 30 45 60 75 90 105
Time (Minutes)
40,00035,00030,00025,00020,00015,00010,0005,000
0Parti
cle C
once
ntra
tion
(Cou
nts/
ft3 )
Modeled
0 10 20 30 40 50 60 70 80 90 100 110
Time (Minutes)
FIGURE 4 (Example) modeled vs. measured room particle concentration under dynamic challenges.
COLUMN IEQ APPLICATIONS
primary AHU unit is not necessary to
increase its capacity as the heating/
cooling loads do not change signifi-
cantly due to the increase of room
recirculation (secondary) rate.
For high-end ISO Class 4, Class 3,
Class 2 and Class 1 cleanrooms, pri-
mary-secondary is common; some-
times primary-secondary-tertiary
in three loops could be necessary
as the flow rate is further increased
to almost 100% ceiling coverage by
HEPA/ULPA filters.
Cleanrooms in all classes may have
HEPA-filtered supply air (SA), return
air (RA), outdoor air (OA), exhaust
air (EA), leakage air (Q), particle
generation (G ), and surface particle
deposition (D). The resulting room
concentration is neither uniformly
distributed nor well mixed within
a room; air is “cleaner” below HEPA
filters and “dirtier” near particle
emission sources. The average room
particle concentration (CS ) is a func-
tion of multiple variables.2,3
Room Particle Concentration Models And Contaminant Removal
Theoretical models of cleanroom particle concentra-
tion calculation used in the industry today were based
on IEST’s Recommended Particles IEST-RP-CC012.3;3
key models were cited and credited from the author’s
article2 by IEST. Since the models were based on an
assumption that particles behave as air in movement
and distribution, a singular correctional factor, either
contaminant removal effectiveness (CRE) or another
index can be added into the models.
Aerosol particles could suspend in room air for a cer-
tain period of time before settling down on surfaces, or
be transported along an airstream path surrounding
the stream vicinity. When air hits physical obstructions
such as equipment or return grille frames, air can turn
around and find a passage to exit through return grilles,
while the particles traveling with the airstream could
lose their momentum and be stopped, trapped and
deposited on local surfaces or the floor. Not all particles
can exit smoothly through return air; the effectiveness
of contaminant removal, which is as important as the
more costly air change rate delivery, has been neglected
in the HVAC community. A large quantity of supply air
pairing with a poor return air passage wastes money!
Further study on efficient contaminant-removal mecha-
nisms for various scenarios could lead to a significant
reduction of the air change rate requirement.
Figure 4 shows an example between model-pre-
dicted versus measured room particle concentration.
Theoretical models need to include multiple correc-
tional factors to narrow the gaps between the predicted
and measured curves to have predictions to reflect real-
ity, and only then models can be used for actual calcula-
tion and CFD analysis.3
Demand Based Flow ControlA cleanroom’s particle concentration sensed by laser
particle sensors or manifold sensing can be used as a
S E P T E M B E R 2 0 2 1 a s h r a e . o r g A S H R A E J O U R N A L 5 1
COLUMN IEQ APPLICATIONS
feedback signal to control supply flow rate not only to
meet a cleanroom’s heating and cooling loads, but also to
maintain the room’s air cleanliness class automatically.
The strategy is to modulate the supply rate to maintain
the same cleanliness based on real-time particle sens-
ing value; significant fan energy can be saved especially
during partial load and unoccupied times.
ConclusionsCleanrooms’ unique HVAC techniques can achieve
ultralow airborne contamination to meet industrial
specifications and to protect human, room and products
in providing much higher air purity and lower contami-
nant concentrations than commercial spaces.
These techniques include but are not limited to: add-
ing air recirculation loop with ceiling FFU units to deliver
a higher air change rate to achieve superb air cleanli-
ness without much extra fan energy; using contaminant
source-strength reduction, isolation and removal, plus
transmission controls before applying a large quantity of
filtered dilution air; arranging cascading airflow direction
in up-mid-down streams; applying pressurization and
installing anteroom/airlock to reduce external con-
taminant migration; and applying particle sensor-based
VAV demand flow control to prevent airflow oversupply.
Engineers could be inspired to imitate some less-intense
approaches for commercial applications in achieving
enhanced contamination control only if feasible, appli-
cable and cost-effective. Some findings of this article are
from the ongoing ASHRAE RP-1604 Research Project.
References1. ISO. 2015. “ISO 14644-1:2015, Cleanrooms and Associated
Controlled Environments—Part 1: Classification of Air Cleanliness by Particle Concentration.” International Organization for Standardization.
2. Sun, W., et al. 2010. “Development of cleanroom required airflow rate model based on establishment of theoretical basis and lab validation.” ASHRAE Transactions 116(1).
3. IEST. 2015. “IEST-RP-CC012.3. Considerations in Cleanroom Design.” Institute of Environmental Sciences and Technology.
4. Sun, W. 2020. “Controlled environments: room pressure, flow offset, airtightness and pressurization strategies.” ASHRAE Journal 62(12).
5. Sun, W. 2018. “Cleanroom airlock performance and beyond.” ASHRAE Journal 60(2).
Advertisement formerly in this space.


![Breakfast with the stars presentation.ppt [Read-Only] George St Presentation.pdf · IEQ 15 Mould Prevention 1 0 IEQ 14 Formaldehyde Minimisation 1 1 IEQ 13 Volatile Organic Compounds](https://img.pdfslide.us/doc/110x75/5f6a9c3b11b77309965dcadd/breakfast-with-the-stars-read-only-george-st-presentationpdf-ieq-15-mould-prevention.jpg)