Embed Size (px)
Citation preview
Residual dispersionequalization using correlationdetection in Nyquist OTDMscheme
Kosuke Morimotoa) Yuji Miyoshib) Hirokazu Kubotaand Masaharu OhashiGraduate School of Engineering Osaka Prefecture University
1ndash1 Gakuen-cho Naka-ku Sakai Osaka 599ndash8531 Japan
a) sxb01191eduosakafu-uacjp
b) miyoshieisosakafu-uacjp
Abstract We propose a wavelength-dispersion equalizing scheme that
counteracts the signal degradation caused by residual dispersion in Nyquist
optical time-division multiplexing To counteract the signal degradation this
scheme uses optical correlation receivers and a distorted reference signal
At a Q factor of 64 dB the permissible values of the residual dispersion
increased from 145 psnm to 995 psnm at a baud rate of 160GBd
Keywords OTDM residual dispersion correlation detection
Classification Fiber-Optic Transmission for Communications
References
[1] M Nakazawa T Hirooka P Ruan and P Guan ldquoUltrahigh-speed ldquoorthogonalrdquoTDM transmission with an optical Nyquist pulse trainrdquo Opt Express vol 20no 2 pp 1129ndash1140 Jan 2012 DOI101364OE20001129
[2] F Ito ldquoDemultiplexed detection of ultrafast optical signal using interferometriccross-correlation techniquerdquo J Lightwave Technol vol 15 no 6 pp 930ndash937 June 1997 DOI10110950588661
[3] J G Proakis and M Salehi Digital Communications 5th ed McGraw HillNew York 2005 pp 177ndash179
[4] Y Miyoshi H Kubota and M Ohashi ldquoNyquist OTDM scheme using opticalroot-Nyquist pulse and optical correlation receiverrdquo IEICE Electron Expressvol 11 no 2 20130943 Jan 2014 DOI101587elex1020130943
[5] Y Miyoshi H Kubota and M Ohashi ldquoSignal degradation due to finiteintegration time for correlation detection in Nyquist OTDM schemerdquo IEICECommun Express vol 6 no 4 pp 142ndash147 Apr 2017 DOI101587comex2016XBL0203
[6] G P Agrawal Nonlinear Fiber Optics 5th ed Academic Press New York2012 pp 78ndash81
[7] K Morimoto Y Miyoshi H Kubota and M Ohashi ldquoCorrelation detectionscheme for suppression of residual dispersion in Nyquist OTDMrdquo Proc 22ndOpto-Electronics and Communications Conference Singapore SingaporeP2-020 Aug 2017
[8] Z Jiang D E Leaird and A M Weiner ldquoOptical arbitraly waveformgeneration and characterization using spectral line-by-line controlrdquo J Lightwave
copy IEICE 2018DOI 101587comex2017XBL0166Received October 30 2017Accepted December 5 2017Publicized December 20 2017Copyedited March 1 2018
60
IEICE Communications Express Vol7 No3 60ndash64
Technol vol 24 no 7 pp 2487ndash2494 July 2006 DOI101109JLT2006874661
[9] Y Miyata K Sugihira W Matsumoto K Onohara T Sugihara K Kubo HYoshida and T Mizuochi ldquoA triple-concatenated FEC using soft-dicisiondecoding for 100Gbs optical transmissionrdquo Proc Optical Fiber Conference2010 San Diego USA OthL3 March 2010 DOI101364OFC2010OThL3
1 Introduction
A Nyquist optical time division multiplexing (OTDM) scheme can realize low
inter-symbol interference and high spectral efficiency with a high baud rate [1] To
achieve a high optical signal-to-noise ratio (OSNR) tolerance with high spectral
efficiency we previously proposed a Nyquist OTDM scheme based on correlation
detection [2 3 4 5] However the signal spread caused by residual dispersion
increases with increasing baud rate [6] The signal spread causes inter-symbol
interference that degrades the signal quality Therefore a precise dispersion
compensation is needed to suppress the signal degradation
This paper proposes and investigates a residual-dispersion equalization scheme
that detects distorted optical signals with residual dispersion using a distorted
reference signal and optical correlation receivers [7] This scheme reduces the
required accuracy of the dispersion compensation We then investigate the permis-
sible value of the residual dispersion by numerical simulation
2 Principle of residual dispersion equalization
Fig 1 shows a Nyquist OTDM scheme using correlation detection A tributary
signal is generated by an optical impulse train source and an optical modulator The
spectrum of the modulated signal is limited by an optical root-raised cosine (RRC)
filter with a 3-dB bandwidth of 1=T where T is the time slot of the multiplexed
signal The tributary signal is multiplexed by an OTDM multiplexer [5] The
chromatic dispersion which distorts the multiplexed signal in the single mode fiber
(SMF) is compensated by a dispersion compensation fiber (DCF) The mismatch
between the SMF and DCF causes a residual dispersion that distorts the received
signal The spectrum of the received signal is given by
SRXethTHORN frac14 SOTDMethTHORN exp jcRd
20
eth 0THORN2
eth1THORN
where SOTDM c 0 and Rd are the multiplexed signal before transmission velocity
of light carrier frequency and residual dispersion respectively [6] The lowercase
s and uppercase S denote a signal in the time and frequency domains respectively
To simplify the discussion we ignore the loss and Kerr effects in the optical fibers
An optical correlation receiver which comprises optical 90deg hybrid and two
balanced photo receivers (BPRs) with integrators de-multiplexes and detects the
real and imaginary parts of the received signal The detected signal is given by
sOUTethtTHORN frac14 CBPR
Z tthornMT2
tMT2
sRXethTHORNsREFethTHORNd eth2THORNcopy IEICE 2018DOI 101587comex2017XBL0166Received October 30 2017Accepted December 5 2017Publicized December 20 2017Copyedited March 1 2018
61
IEICE Communications Express Vol7 No3 60ndash64
where sREF denotes the complex conjugate of the reference signal When the
multiplicity is sufficiently high and the influence of adjacent signals can be ignored
Eq (2) can be approximated by an infinite time integral using Parsevalrsquos theorem
sOUT CBPR
Z 1
1sRXethTHORNsREFethTHORNd
CBPR
Z 1
1SRXethTHORNSREFethTHORNd
eth3THORN
where the constant CBPR includes the photo-current sensitivity of the photo
receivers and the gain of the trans-impedance amplifiers Previously a conventional
reference signal was generated by an impulse train source and transmitted by the
same optical RRC filter The residual dispersion induces inter-symbol interference
and signal amplitude reduction
To suppress the degradation caused by residual dispersion we propose an
equalization scheme that counteracts the residual dispersion using the distorted
reference signal with the same residual dispersion The spectrum of the distorted
reference signal is given by
SREF-DethTHORN frac14 SREF-RRCethTHORN exp jcRd
20
eth 0THORN2
eth4THORN
where SREF-RRC is the conventional reference signal using the optical RRC filter
The distorted reference signal can be generated by an optical short-pulse source and
an optical pulse-shaping filter [8] From Eqs (1) (3) and (4) the detected signal
with the distorted reference signal is expressed as
Fig 1 Nyquist OTDM scheme based on correlation detection
copy IEICE 2018DOI 101587comex2017XBL0166Received October 30 2017Accepted December 5 2017Publicized December 20 2017Copyedited March 1 2018
62
IEICE Communications Express Vol7 No3 60ndash64
sOUT CBPR
Z 1
1SRXethTHORNSREF-DethTHORNd
Z 1
1SOTDMethTHORN exp jcRd
20
eth 0THORN2
SREF-RRCethTHORN exp jcRd
20
eth 0THORN2
d
CBPR
Z 1
1SOTDMethTHORNSREF-RRCethTHORNd
eth5THORN
The distorted reference signal can counteract the residual dispersion effect In
practice the temporal integration limits are finite [5] and the waveforms of the
received and reference signals are broadened by residual dispersion The finite
integral time and signal broadening might degrade the signal quality
3 Relationship between residual dispersion and Q factor
We investigated the permissible range of the residual dispersion under the influence
of finite integral time and temporal broadening of the signals The signal generation
was modulated by binary phase-shift keying and the pattern length of the pseudo-
random bit sequence was 29 1 The signal wavelength was 1550 nm The roll-off
factor multiplicity and baud rate were 01 16 and 16 10GBd respectively The
OSNR of the received signal was 30 dB The noises of the BPDs and the integrators
were ignored
Fig 2 shows the relationship between the residual dispersion and the quality
factor (Q factor) using the conventional reference signal SREF-RRC and the proposed
reference signal SREF-D To investigate only the effect of the residual dispersion the
fiber loss and Kerr effects in the transmission line were ignored In this case the Q
factor depended on the absolute value of the residual dispersion The Q factor of
the proposed reference signal was reduced by the limited integral time MT frac14100 ps and the temporal expansion of the signals by residual dispersion In an
ideally matched filter with zero residual dispersion the theoretical upper limit of the
Q factor is 1892 dB In the proposed scheme the permissible values of the residual
dispersion at a 64-dB Q factor increased from 145 psnm to 995 psnm The Q
factor of 64 dB was the forward error correction (FEC) limit of the triple-
concatenated FEC in soft decision decoding [9]
Fig 3 plots the relationship between the residual dispersion and the Q factor
of signals distorted by Kerr effects in the transmission fiber The nonlinear pa-
rameter γ fiber loss α length L and dispersion coefficient D were 20Wminus1 kmminus1
02 dBkm 100 km and 17 pskm-nm respectively In both the conventional and
proposed schemes the Q factor degraded with increasing average launch power
Pin This degradation was caused by Kerr effects which distort the signals in the
absence of residual dispersion At a Q factor of 64 dB the permissible values of the
residual dispersion within the Pin range 0ndash13 dBm increased from 142ndash145 psnm
in the conventional method to 984ndash995 psnm in the proposed method The
improvement was that expected after removing the residual dispersion leaving
only the Kerr effectcopy IEICE 2018DOI 101587comex2017XBL0166Received October 30 2017Accepted December 5 2017Publicized December 20 2017Copyedited March 1 2018
63
IEICE Communications Express Vol7 No3 60ndash64
4 Conclusion
We proposed a scheme that equalizes the residual dispersion in OTDM and thereby
suppresses signal degradation The Q factor of the detected signal was improved by
distorting the reference signal with the same residual dispersion We also inves-
tigated the effect of finite integration time and temporal broadening of the signals
due to residual dispersion At a Q factor of 64 dB the proposed scheme increased
the permissible value of the residual dispersion from 145 psnm to 995 psnm at
the baud rates of 16 10GBd The same improvement was observed with and
without signal distortion caused by Kerr effects
Acknowledgment
This work was supported by JSPS KAKENHI Grant Number 15K18068
Fig 3 Relationship between residual dispersion and Q factor withsignal distortion due to Kerr effects
Fig 2 Relationship between residual dispersion and Q factor withoutsignal distortion due to Kerr effects
copy IEICE 2018DOI 101587comex2017XBL0166Received October 30 2017Accepted December 5 2017Publicized December 20 2017Copyedited March 1 2018
64
IEICE Communications Express Vol7 No3 60ndash64
Optical-fiber-connectedpassive primary surveillanceradar for aeronauticalsurveillance
Junichi Hondaa) and Takuya OtsuyamaSurveillance and Communications Department
Electronic Navigation Research Institute (ENRI)
National Institute of Maritime Port and Aviation Technology
Chofu Tokyo 182ndash0012 Japan
a) j-hondaenrigojp
Abstract A new radar system using a radio over fiber (RoF) is proposed
The proposed system is optical-fiber-connected passive primary surveillance
radar (OFC-PPSR) which is based on a passive bistatic radar approach and
uses RoF technology A separate receiver unit uses the waves scattered from
aircraft and the radar reference data transmitted by the RoF The reference
data include the radio frequency signals of the transmitter unit and the
processing data of the controller unit such as radar rotation angle We first
present the principles of OFC-PPSR and the experimental system which
was deployed at the Sendai airport in Japan Moreover we present some
preliminary experimental results obtained with the proposed system The
proposed system is capable of detecting moving aircraft as demonstrated by
a comparison of the experimental results with real surveillance data
Keywords primary surveillance radar multistatic primary surveillance
radar radio over fiber aeronautical surveillance air traffic management
Classification Sensing
References
[1] M I Skolnik Introduction to RADAR Systems 3rd ed McGraw-Hill NewYork NY USA 1962
[2] M C Stevens Secondary Surveillance Radar Artech House Norwood MA1988
[3] S Marquard ldquoSuitability of multi-static surveillance system for aeronauticaluse (passive radar)rdquo International Civil Aviation Organization Working PaperMontreal WP ASP12-12 Mar 2012
[4] ICAO (International Civil Aviation Organization) Doc 9924 AeronauticalSurveillance Manual 1st ed 2010
[5] J Honda and T Otsuyama ldquoFeasibility study on aircraft positioning by usingISDB-T signal delayrdquo IEEE Antennas Wireless Propag Lett vol 15 pp 1787ndash1790 Mar 2016 DOI101109LAWP20162536725
[6] T Ito R Takahashi S Morita and K Hirata ldquoExperimental result of passivebistatic radar with unknown transmitting radar pulserdquo Proc 2013 EuropeanRadar Conference Nuremberg pp 455ndash458 Oct 2013
copy IEICE 2018DOI 101587comex2017XBL0179Received November 17 2017Accepted November 29 2017Publicized December 20 2017Copyedited March 1 2018
65
IEICE Communications Express Vol7 No3 65ndash70
[7] J Honda and T Otsuyama ldquoPreliminary Experimental result of optical fiberconnected passive primary surveillance radarrdquo Proc Int Symp Antennas andPropagation (ISAP) Okinawa Japan POS2-71 Oct 2016
1 Introduction
Airport surveillance radar typically include both a primary surveillance radar (PSR)
[1] and a secondary surveillance radar (SSR) [2] Since the SSR uses the reply
signals from an aircraft and provides the aircraftrsquos position identify and altitude it
has become the main surveillance system in air traffic management On the other
hand PSRs play an important role as backup and in improving the security of
operations because it uses the waves scattered by aircraft and is a type of
independent noncooperative surveillance [3] However the update and detection
rates of PSRs are lower than those of SSR technologies Therefore PSR application
technologies are required to improve operational security
Recently multistatic primary surveillance radar (MSPSR) [4] has been ex-
pected to be used as a conventional PSR alternative One interesting property is
the selection of some signal sources eg present radar signals digital terrestrial
television broadcasts mobile communication (eg 3G and LTE) global navigation
satellite system and so on [5] Our final goal is to develop a combined surveillance
system using several signals As one core technology of MSPSR we consider
passive radar using the PSR signal The purpose of this system is to expand the
present PSR coverage and to contribute to the spectral efficiency The present PSR
coverage is about 60NM and the required detection rate is about 70 Since PSR
depends on the waves scattered from obstacles undetected area exists eg aircraft
at low altitude and the shadowed areas behind mountains or buildings To over-
come this problem we propose optical-fiber-connected passive PSR (OFC-PPSR)
to expand the present PSR coverage One of the strengths of this proposal lies in
its use of radio over fiber (RoF) which enables radio frequency (RF) signals to be
transmitted to a separate receiver over a long distance by an optical fiber
Consequently OFC-PPSR is capable of operating in the same manner as conven-
tional PSR In addition because a receiver unit is connected to a transmitter unit by
RoF the receiver always computes the target position even if the incident waves
cannot be detected The signal-to-noise ratio (SN) would also be better than that
using incident waves propagating in the atmosphere Moreover as one application
the existing infrastructure can be shared by collaborating with other surveillance
systems such as multilateration (MLAT)
In this letter the system concept and its operating principle are described first
Then a prototype system deployed at Sendai airport is introduced Finally we
show the experimental results It is shown that the proposed system can detect
aircraft through comparison with real surveillance data
2 Optical-fiber-connected passive primary surveillance radar
In general a radar has a transmitter unit combined with a receiver unit [1] As the
receiver unit always receives the information of the transmitted signals (transmitted
copy IEICE 2018DOI 101587comex2017XBL0179Received November 17 2017Accepted November 29 2017Publicized December 20 2017Copyedited March 1 2018
66
IEICE Communications Express Vol7 No3 65ndash70
timing antenna rotation angle etc) estimation of the target position is relatively
easy However in a passive radar system the separate receiver unit does not have
this information Hence it requires some signal processing [6] and a mechanism
to estimate the transmitted waves In order to overcome these problems and to
simplify the system we propose a new radar concept based on passive bistatic
radar [7]
The proposed system employs RoF technology which enables the transmission
of RF signals over long distances in comparison with a coaxial cable An OFC-
PPSR receiver unit is connected to the transmitter at a radar site by an optical fiber
Thus OFC-PPSR can stably use the original RF signals as a reference Hence the
receiver unit can be located far from the transmitter unit even if the directed waves
do not arrive at the receiver side Consequently similar to the present radar the
receiver unit can easily estimate aircraft positions by using the transmitted timing
radar rotation angles trigger and others Given that the proposed system is capable
of using scattered waves that do not return to the radar site it is expected to be
capable of expanding the coverage area of the current PSR Moreover owing to
RoF the SN is expected to be improved in comparison with the use of incident
waves propagating in the atmosphere It should be noted that sharing the same
infrastructure with other surveillance systems such as MLAT is an advantage
Therefore OFC-PPSR is expected to be used as a PSR distributed surveillance
system in correspondence with the common use of SSR applications
Fig 1 shows the system conceptual diagram of the proposed system and an
ellipsoidal curve illustrating the principles of passive bistatic radar (PBR) An RoF
transmitter unit is located at the radar site and it collects the RF signals transmitted
by a rotating antenna and some information in the controller unit and they are
provided to the separate receiver unit by RoF On the other hand the receiver unit
consists of a receiving antenna for the scattered waves a preamplifier a down-
converter a signal processing unit and an RoF receiver unit
The estimation procedure is summarized as follows
bull Adjust the signal delays corresponding to the optical fiber length from the
transmitter unit to the receiver unit
bull Measure the RF signals (1 scattered waves from aircraft 2 RF signals
transmitted by RoF) and collect radar information (1 timing when PSR faces
north 2 RF transmitted timing)
bull Analyze the bistatic ranging from the time difference of arrival between the
radar transmitted timing and the waves scattered from aircraft
In the above procedure the signal delay τ is given by
frac14 L1 thorn L2 L0c
frac12s eth1THORNwhere L1 thorn L2 is the total distance from the source to the receiver via obstacles L0is the direct distance from the source to the receiver and c is the velocity of light
These relations are shown in Fig 1b In the proposed system L0 is modified by the
optical fiber length and the source and receiver positions τ is computed by the
receiver unit as mentioned above However since L1 and L2 are unknown
parameters one of them is required to obtain a solution L1 is computed bycopy IEICE 2018DOI 101587comex2017XBL0179Received November 17 2017Accepted November 29 2017Publicized December 20 2017Copyedited March 1 2018
67
IEICE Communications Express Vol7 No3 65ndash70
L1 frac14 eth thorn 2L0THORN2L0eth1 cos thorn =L0THORN eth2THORN
where Δ is defined by frac14 c and the angle between the directions of the radar and
the target is given by θ The result computed for L1 (or L2) is an ellipsoidal curve
3 System deployment and experimental results
A prototype system has been developed and deployed at Sendai airport in Japan
and preliminary experiments were performed to confirm the basic operation of the
OFC-PPSR system Fig 2 shows the experimental environment and setup In this
experiment a training radar was used it is located at the southern part of the airport
where the RoF transmitter unit is also located A general PSR produces an
asymmetric beam shape known as a fan beam and the vertical plane is the
cosecant-squared elevation pattern The RoF transmitter unit is connected to the
RoF receiver unit located at the western part of airport by an optical fiber
The PSR emits a short pulse of 1 micros and a long pulse of 80 micros Long pulses are
modulated by FM chirp Since the long pulse is emitted after transmitting the short
pulse the coverage area of the short pulse is limited by the time interval between
the short and long pulses The frequency is assigned to the S band The distance
from the radar site to the OFC-PPSR receiver is sim1800m The signal processing
(a) Principles of OFC-PPSR
(b) Estimated curve of PBR
Fig 1 Principles of OFC-PPSR and estimated curve of PBR
copy IEICE 2018DOI 101587comex2017XBL0179Received November 17 2017Accepted November 29 2017Publicized December 20 2017Copyedited March 1 2018
68
IEICE Communications Express Vol7 No3 65ndash70
unit separately analyzes both pulses and a standard horn antenna is selected as the
receiver
Fig 3 shows the experimental results This is illustrated by overlapping five
scans (frac14 20 s) of data and the figure is converted from the estimated bistatic
ranging to the PPI scope In this figure there are large echoes on the left side We
confirmed that the echoes are located at Mt Zao on the map On the right side of
the airport waves reflected from a moving object are also observed In order to
check whether the moving object is an aircraft we compare the experimental results
with the real surveillance data obtained by automatic dependent surveillance-
broadcast (ADS-B) The right side of Fig 3 shows a magnification and compar-
ison The ADS-B tracks are indicated by red circles The positions between the
echoes from the moving object and ADS-B are slightly different However as
ADS-B has some errors and the results obtained by the proposed system disregard
Fig 2 Experimental environment
Fig 3 Experimental results in comparison with ADS-B tracks
copy IEICE 2018DOI 101587comex2017XBL0179Received November 17 2017Accepted November 29 2017Publicized December 20 2017Copyedited March 1 2018
69
IEICE Communications Express Vol7 No3 65ndash70
the height the echo of the moving aircraft and the ADS-B tracks are almost
identical Therefore we conclude that these echoes represent a moving aircraft
4 Conclusion
In this letter we proposed OFC-PPSR as a new radar system by using RoF One of
the characteristics is the use of original RF signals at a separate receiver unit This
results in the same operation as conventional PSR even if the receiving antenna is
in the non-line-of-sight of the transmitter Moreover SN of reference signal with
RoF is higher and stable than that with monitoring antenna to receive the signal
from PSR Experiments were performed at Sendai airport in Japan It was shown
that the proposed system detects the echoes from a mountain and moving object
Comparing the experimental results with ADS-B it was demonstrated that the
moving object was an aircraft
The proposed system is expected to expand the coverage area of present
aeronautical surveillance systems However all signal processing in the proposed
system was disregarded Our future work will consider some radar signal process-
ing techniques such as moving target indication (MTI) and constant false-alarm rate
(CFAR) in order to suppress unnecessary signals from fixed structures It will be
our future work
Acknowledgments
We would like to express our gratitude to the Aeronautical Safety College and
Sendai Airport for their support
The work was supported in part by a Grant-in-Aid for Young Scientists (B)
(16K18072) from the Japan Society for Promotion of Science
copy IEICE 2018DOI 101587comex2017XBL0179Received November 17 2017Accepted November 29 2017Publicized December 20 2017Copyedited March 1 2018
70
IEICE Communications Express Vol7 No3 65ndash70
High-resolution geomagneticobservation system usingHTS-SQUID
Yuta Katori1a) Shinji Isogami2 Tsunehiro Hato3Akira Tsukamoto3 Keiichi Tanabe3 Nobuhito Ohnishi4Chikara Furukawa4 and Kan Okubo1b)1 Graduate School of System Design Tokyo Metropolitan University
6ndash6 Asahigaoka Hino Tokyo 191ndash0065 Japan2 Research Center for Magnetic and Spintronic Materials National Institute
for Materials Science 1ndash2ndash1 Sengen Tsukuba Ibaraki 305ndash0047 Japan3 Superconducting Sensing Technology Research Association
2ndash11ndash19 Minowa-Cho Kohoku-ku Yokohama Kanagawa 223ndash0051 Japan4 TIERRA TECNICA Ltd
3ndash25ndash1 Enoki Musashimurayama Tokyo 208ndash0022 Japan
a) katori-yutaedtmuacjp
b) kannetmuacjp
Abstract Our research group reported successful observation of ldquoco-
faultingrdquo Earthrsquos magnetic field changes because of piezomagnetic effects
caused by earthquake tremors during the 2008 Iwate-Miyagi Nairiku earth-
quake of M72 using a geomagnetic observation system with flux-gate
magnetometers This is an important finding electromagnetic fields prop-
agate from a source to an observation site at the light speed in the crustal
materials Further earthquake detection efforts can lead us to a new system
for super-early warning of earthquake detection with the geomagnetic signal
However the observed result with the earthquake was suggested that the
geomagnetic field change accompanying fault movement whose sources are
the piezomagnetic effects is very small and short term Therefore to develop
an extremely important high-resolution magnetometer system we first con-
ducted long-term precise geomagnetic observations using a high-temperature
superconductor based superconducting quantum-interference device (HTS-
SQUID) magnetometer system The HTS-SQUID magnetometer system had
never been used for high-resolution geomagnetic observations outdoors
Since March 2012 we have observed geomagnetic field using the HTS-
SQUID magnetometer at Iwaki observation site (IWK) in Fukushima Japan
Comparison between the introduced HTS-SQUID magnetometer and con-
ventional flux-gate clarified that the HTS-SQUID magnetometer in our
system has higher resolution of magnetic field observation
copy IEICE 2018DOI 101587comex2017XBL0168Received November 1 2017Accepted November 28 2017Publicized December 22 2017Copyedited March 1 2018
71
IEICE Communications Express Vol7 No3 71ndash76
Keywords HTS-SQUID magnetometer geomagnetic observation high-
resolution
Classification Sensing
References
[1] F D Stacey ldquoThe seismomagnetic effectrdquo Pure Appl Geophys vol 58 no 1pp 5ndash22 Jan 1964 DOI101007BF00879136
[2] M J S Johnston and R J Mueller ldquoSeismomagnetic observation with the July8 1986 ML 59 North Palm Springs earthquakerdquo Science vol 237 no 4819pp 1201ndash1203 1987 DOI101126science23748191201
[3] M J S Johnston R J Mueller and Y Sasai ldquoMagnetic field observations inthe near-field the 28 June 1992 Mw 73 Landers California earthquakerdquo BullSeismol Soc Am vol 84 no 3 pp 792ndash798 June 1994
[4] K Okubo N Takeuchi M Utsugi K Yumoto and Y Sasai ldquoDirect magneticsignals from earthquake rupturing Iwate-Miyagi earthquake of M 72 JapanrdquoEarth Planet Sci Lett vol 305 no 1ndash2 pp 65ndash72 May 2011 DOI101016jepsl201102042
[5] P Wessel W H F Smith R Scharroo J Luis and F Wobbe ldquoGenericmapping tools Improved version releasedrdquo Eos Trans AGU vol 94 no 45pp 409ndash410 Nov 2013 DOI1010022013EO450001
[6] P Wessel and W H F Smith ldquoNew improved version of generic mapping toolsreleasedrdquo Eos Trans AGU vol 79 no 47 p 579 Nov 1998 DOI10102998EO00426
[7] P Wessel and W H F Smith ldquoNew version of the generic mapping toolsrdquo EosTrans AGU vol 76 no 33 p 329 Aug 1995 DOI10102995EO00198
[8] P Wessel and W H F Smith ldquoFree software helps map and display datardquo EosTrans AGU vol 72 no 41 pp 441ndash446 Oct 1991 DOI10102990EO00319
[9] Kakioka Magnetic Observatory ldquoKakioka Magnetic Observatory Home PagerdquoKakioka Magnetic Observatory Japan Meteorological Agency httpwwwkakioka-jmagojpenindexhtml accessed Feb 28 2017
1 Introduction
11 Background
For decades researchers have studied the seismomagnetic effects [1 2 3] Their
reports describe that the surrounding magnetic field changed before and after
earthquake occurrence
From our continuous observations our research group also reported a success-
ful result which is ldquoco-faultingrdquo Earthrsquos magnetic field variation due to piezomag-
netic effects caused by earthquake rupturing (ie earthquake-piezomagnetic
effects) in 2008 Iwate-Miyagi Nairiku earthquake of M72 [4]
However the magnetic field changes are very small variations of 300 pT [4]
Our successful result is observed by geomagnetic observation system with a flux-
gate magnetometer (10Hz sampling rate) and a synchronized accelerometer
The magnetic field propagates from the sources to the observation point at the
light speed Therefore our result suggested the possibility of earthquake detection
from magnetic signal If we can detect an earthquake from magnetic field we are
copy IEICE 2018DOI 101587comex2017XBL0168Received November 1 2017Accepted November 28 2017Publicized December 22 2017Copyedited March 1 2018
72
IEICE Communications Express Vol7 No3 71ndash76
able to early warn the occurrence Further efforts could lead us to a new system for
super-early warning of earthquake detection with the magnetic signal [4]
12 Magnetometer for geomagnetic observation
In general geomagnetic observation it might be said that the sampling frequency of
1Hz is sufficient for observation and that it is not important to observe with higher
accuracy
However our successful observation of the Iwate-Miyagi Nairiku earthquake
the magnetic field variations had continued to change only several seconds from the
earthquake occurrence time Therefore our system (10Hz sampling rate) recorded
magnetic field variations of only several tens of data points
Additionally because the highest magnetic field resolution of a flux-gate
magnetometer is greater than 10 pT such a conventional magnetometer is not
suitable to observe a small signal by the earthquake-piezomagnetic (EQ-piezomag-
netic) effects
Incidentally a LTS-SQUID magnetometer using liquid helium is considered to
be more accurate as an element of sensor Nevertheless it is not promising for
continuous long-term geomagnetic observation because it requires liquid helium
That is the long-term geomagnetic observation demands a magnetometer which
not only is easily operated in the outdoor field but also has very high resolution
2 Geomagnetic observation
21 Observation system using HTS-SQUID magnetometer
Our research group has developed a new geomagnetic observation system with low
running cost and higher resolution we introduce high-temperature-superconductor
based superconducting-quantum-interference-device (HTS-SQUID) as a magne-
tometer for a long-term geomagnetic observations The HTS-SQUID magnetometer
has much lower running costs than LTS-SQUID because it uses liquid nitrogen to
maintain a superconducting state This is the most important point It is the first trial
in the world that we had adopted the HTS-SQUID magnetometer for a geomagnetic
observation system
The sampling-frequency of our magnetometer system is 50Hz (002 s) which
are higher sampling frequency than our conventional observation system using a
flux-gate Our system observed the orthogonal three-vectors of geomagnetic field
vibration ethHx Hy HzTHORN The clock of this system is synchronized with a GPS signal
These observed data are uploaded to the web server through the mobile network
22 Observation at IWK site
Since March 2012 we have observed three geomagnetic field components using a
HTS-SQUID magnetometer at Iwaki observation point in Fukushima Japan Here
Iwaki was assumed as an area affected by aftershocks of The 2011 off the Pacific
coast of Tohoku Earthquake Figure 1(a) shows the location of IWK site The map
(b) is a zoom up view of (a) Here we use Generic Mapping Tool (GMT) for
making the map of this figure [5 6 7 8]copy IEICE 2018DOI 101587comex2017XBL0168Received November 1 2017Accepted November 28 2017Publicized December 22 2017Copyedited March 1 2018
73
IEICE Communications Express Vol7 No3 71ndash76
Figure 1 also depicts Kakioka Geomagnetic Observatory (KAK) operated by
the Japan Meteorological Agency The distance separating IWK and KAK is about
100 km Geomagnetic observation results obtained at KAK are used as reference
data
As an example of the result observed by the system at IWK Fig 1(c) shows the
geomagnetic signal on March 17th 2015 The geomagnetic signal at KAK [9] is
also depicted in this figure Here the sampling frequency of KAK data was 10Hz
The daily K-index on March 17 2015 was 5 where the K-index quantifies
disturbances in the horizontal component of earthrsquos magnetic field with an integer
[9]
From this figure we can confirm that geomagnetic signals using the HTS-
SQUID magnetometer at IWK are very valid by a comparison of waveforms
obtained at the two observation points (IWK and KAK) It is reasonable that two
waveforms are similar because the geomagnetic longitude of two observation
points is almost same
3 Results
31 Geomagnetic field observed by HTS-SQUID magnetometer
We show the three orthogonal components of the geomagnetic field observed using
the HTS-SQUID magnetometer in Fig 2 where the DC offset of the data is
adjusted for easy visibility The signals are observed on October 28th 2015 whose
daily k-index is the smallest 0 over this year Hence geomagnetic variation itself of
this day was very small
Fig 1 Location of IWK geomagnetic observation system
copy IEICE 2018DOI 101587comex2017XBL0168Received November 1 2017Accepted November 28 2017Publicized December 22 2017Copyedited March 1 2018
74
IEICE Communications Express Vol7 No3 71ndash76
For subsequent evaluation we use observation data of 1800ndash1900 (UTC)
corresponding to the middle of night of Japan (ie relatively much lower artificial
noise period) in Fig 2(b) For comparison to a conventional magnetometer the
flux-gate observation result at IWK is also portrayed in this figure The sampling
frequency of the setup flux-gate magnetometer is 10Hz
32 Evaluation
To evaluation the magnetic field resolution of the system the mean absolute
deviation (MAD) is used as an evaluation value as
MAD frac14 1
nt
Xn
ifrac140jHi Hijt eth1THORN
where Hi represents the mean of Hi
Figure 3 presents results of calculating the MAD for each of the three-
components of the two magnetometers (HTS-SQUID and Flux-Gate) using the
data observed in 1800ndash1900UT on October 28 2015 As shown in Fig 3(a1)ndash
(a6) we calculated the MAD every second because the observation target signal by
the EQ-piezomagnetic effect changes during a few or several seconds Additionally
the average of MAD per hour is displayed in Fig 3(b)
As shown in Fig 3 the deviation of signals observed using the HTS-SQUID
magnetometer is smaller than that of the flux-gate magnetometer Results show that
the HTS-SQUID magnetometer in our system has higher resolution of magnetic
field observation than the usual flux-gate magnetometer The HTS-SQUID magne-
tometer in our system provides geomagnetic field observations with a high
accuracy and a high sampling rate
Fig 2 Observation result at IWK site
copy IEICE 2018DOI 101587comex2017XBL0168Received November 1 2017Accepted November 28 2017Publicized December 22 2017Copyedited March 1 2018
75
IEICE Communications Express Vol7 No3 71ndash76
4 Conclusion
For this study we develop a geomagnetic field observation system with high
accuracy and high sampling rate In this first trial the HTS-SQUID magnetometer
was used for a continuous long-term geomagnetic observation
Comparison of the proposed magnetometer and a conventional flux-gate
clarified that the HTS-SQUID magnetometer we used has higher resolution of
magnetic field observations The deviation of the HTS-SQUID magnetometer is
about 3 pT to 6 pT We can say that this value is extremely small rather than
conventional magnetometer system
Future task is to accumulate the geomagnetic field signals accompanying the
EQ-piezomagnetic effect using the HTS-SQUID magnetometer and to reveal that
effect
Acknowledgement
I would like to extend my greatest appreciation to Dr Nobunao Takeuchi (Professor
Emeritus Akita Prefectural University) who provided helpful comments and
suggestions This study was partly supported by JSPS KAKENHI Grant Number
26289348 24560507 and 23686130
Fig 3 MAD result at IWK site
copy IEICE 2018DOI 101587comex2017XBL0168Received November 1 2017Accepted November 28 2017Publicized December 22 2017Copyedited March 1 2018
76
IEICE Communications Express Vol7 No3 71ndash76
Implementation and usertesting of personalauthentication havingshoulder surfing resistancewith mouse operations
Makoto Nagatomo1 Yoshihiro Kita2 Kentaro Aburada3Naonobu Okazaki3 and Mirang Park1a)1 Kanagawa Institute of Technology
1030 Shimo-Ohino Atsugi Kanagawa 243ndash0292 Japan2 Tokyo University of Technology
1404ndash1 Katakura Hachioji Tokyo 192ndash0982 Japan3 University of Miyazaki
1ndash1 Gakuen-Kibanadai-Nishi Miyazaki Miyazaki 889ndash2192 Japan
a) mirangnwkanagawa-itacjp
Abstract Typically typing character strings on a keyboard is used for
personal authentication for PC login and unlocking Although some graph-
ical and biometric-based methods have been developed most of them have
weak authentication strength weak shoulder surfing resistance or other
drawbacks In this paper we propose a personal authentication method
that employs mouse operations in which the mouse itself does not need to
be moved Thus the user can hide the mouse during authentication so the
method has shoulder surfing resistance and can be used in public places We
performed user testing to validate the proposed method
Keywords personal authentication mouse operation shoulder surfing
resistance
Classification Multimedia Systems for Communications
References
[1] CSE SECUREMATRIX httpcse-americacomindexhtm accessed Sept 202017
[2] V Rajanna S Polsley P Taele and T Hammond ldquoA gaze gesture-based userauthentication system to counter shoulder-surfing attacksrdquo Proc 2017 CHIConference Extended Abstracts on Human Factors in Computing Systemspp 1978ndash1986 2017 DOI10114530270633053070
[3] M Karim H Heickal and Md Hasanuzzaman ldquoUser authentication frommouse movement data using multiple classifiersrdquo Proc 9th InternationalConference on Machine Learning and Computing pp 122ndash127 2017 DOI10114530556353056620
[4] Y Kita N Okazaki H Nishimura H Torii T Okamoto and M ParkldquoImplementation and evaluation of shoulder-surfing attack resistant usersrdquo
copy IEICE 2018DOI 101587comex2017XBL0170Received November 10 2017Accepted December 15 2017Publicized January 11 2018Copyedited March 1 2018
77
IEICE Communications Express Vol7 No3 77ndash82
IEICE Trans Inf amp Syst vol J97-D no 12 pp 1770ndash1784 2014 (inJapanese)
[5] H Manabe and M Fukumoto ldquoAwareLess authentication insensible inputbased authenticationrdquo Proc of CHI rsquo07 Extended Abstracts on Human Factorsin Computing Systems (CHI EA rsquo07) pp 22561ndash2566 2007 DOI10114512408661241041
[6] K Watanabe F Higuchi M Inami and T Igarashi ldquoCursorCamouflageMultiple Dummy Cursors as A Defense against Shoulder Surfingrdquo Proc ofSIGGRAPH Asia 2012 Emerging Technologies no 6 2 pages 2012 DOI10114524077072407713
1 Introduction
Currently many people use character-based passwords entered by keyboard for
personal authentication in public places such as a classroom of office to unlock a
PC or sign into a service on the userrsquos own PC or a public PC This method in these
situations risks leakage of passwords by shoulder surfing
SECUREMATRIX [1] provides a graphical password as positions on three
or four matrices The memory burden is less than it is for a character string An
attacker however can identify the password by shoulder surfing attack by watching
the keyboard and the monitor
In the gaze-following method [2] a user performs authentication by following
a moving icon on the monitor using their eyes This method has shoulder surfing
resistance but the user must use a camera
In the method presented in [3] the user registers extracted features of the userrsquos
mouse movements on a desk The user can use this method in many public places
since most PCs have a mouse However the attacker can imitate mouse movements
by shoulder surfing
The Secret Tap with Double Shift (STDS) method [4] requires the user to
register icons as a password on the screen of a smartphone The user authenticates
the icons by selecting the icons This method has shoulder surfing resistance but
the genuine icons can be revealed by recording attack twice
As described above no easy-to-use method has shoulder surfing resistance for a
PC in public places In this paper we propose a method that uses mouse clicks and
mouse wheel rotations This method can improve shoulder surfing resistance
because the user does not need visual feedback and can operate the mouse under
a desk
2 Mouse authentication method
21 Overview
Here we define the personal authentication method The input interface is a
common mouse with right and left click upward and downward wheel rotation
and wheel click The output interface is an N N matrix
Use case A user unlocks a PC or signs into a service on a PC in a public place
while hiding the mouse such as under the desk For example a user signs into an
e-mail service on their own laptop in a cafeacute
copy IEICE 2018DOI 101587comex2017XBL0170Received November 10 2017Accepted December 15 2017Publicized January 11 2018Copyedited March 1 2018
78
IEICE Communications Express Vol7 No3 77ndash82
Strength When the user registers m positions (including the registration order) on
an N N matrix the probability that an attacker succeeds in a random attack on
this method (accidental authentication probability) is 1=N2m We are aiming for an
accidental authentication probability of less than 110000
Registration phase Registration is performed as follows
1 The screen displays an N N matrix with an initial position randomly
selected
2 The user registers a position on the matrix using mouse operations The current
position is marked by a red circle and the positions moves left by left click
right by right click up by upward wheel rotation and down by downward
rotation The user registers the current position with a wheel click
3 The user registers m positions by repeating (1) and (2) The registered order is
part of the authentication information
Authentication phase Authentication is performed as follows
1 The screen displays an N N matrix with a randomly selected initial position
2 The user specifies the first registered position with mouse operations The
mouse operations and its effects are the same as (2) in the registration phase
The user hides the mouse such as under the desk and only the initial position
is displayed not the current positions to strengthen shoulder surfing resist-
ance
3 The user specifies m registered positions in their registered order using the
same mouse operations used during registration
Benefits The mouse operations in this method are intuitive Some people cannot
operate a keyboard intuitively while hiding it In addition the proposed method is
a challenge and response authentication system in which the screen position and
position order are hidden Therefore users can use this method in public places
safely
22 Implementation
We implemented the proposed method using a 5 5 matrix (N frac14 5) which struck
a balance between the usability and authentication strength A position count of
m 3 meets 1=52m 1=10000 so we decided to make the ldquopasswordrdquo three or
more positions long
Fig 1 shows an animation of the proposed method It is natural to fix the initial
position on the matrix but the shoulder surfing resistance is weak against hearing
the mouse sounds sometimes Therefore although it seems that the usability is
lower than when the initial position is fixed we decided that the initial position is
determined randomly The registered position is revealed when an initial position is
near it in the authentication phase so the user must register a position after moving
at least three times
We developed two variations in which the user (1) selects positions directly by
combinations of mouse clicks and mouse movements or (2) selects by combina-
tions of colors and numbers on the matrix A user can select a variation according
to their tastecopy IEICE 2018DOI 101587comex2017XBL0170Received November 10 2017Accepted December 15 2017Publicized January 11 2018Copyedited March 1 2018
79
IEICE Communications Express Vol7 No3 77ndash82
3 Evaluation
We conducted two experiments on the usability and shoulder surfing resistance of
the implemented method The subjects used a desktop PC and a common mouse
with mouse clicks and wheel rotations (Logicool wireless mouse M186) This
mouse emits the sound of clicks and rotations clearly In the user testing and
shoulder surfing experiment reported here we did not use the two variations but
we plan to conduct experiments of these in the future
31 Usability test
We conducted the usability test as follows
1 We explained to the subject how to use the method
2 The subject completed a tutorial to become familiar with the mouse operations
3 The subject registered three positions
4 The subject performed three authentications successfully
5 The subject answered a questionnaire on comprehension ease of use ease of
familiarization safety for shoulder surfing and user needs These items were
rated from 1 to 5 (very bad to very good)
Fig 2 shows the result of the usability tests The subjects were 20 Kanagawa
Institute of Technology students The average time to complete the third successful
authentication was 155 s [see Fig 2(a)] and the average authentication success
rate was 631 It took time for users to get used to this authentication method and
the success rate was not enough due to the invisibility of the current positions
Fig 2(b) shows the result of the responses to the usability testing questionnaire All
five averages are over 3 so usability of this method is confirmed
32 Shoulder surfing resistance test
In the second experiment shoulder surfers were positioned 1m behind the user so
that the surfer could see the monitor and hear the mouse sounds We eliminated
ambient noise so that the surfer could hear the mouse sound clearly The procedure
of the shoulder surfing resistance experiment was as follows
Fig 1 Animation of the proposed method
copy IEICE 2018DOI 101587comex2017XBL0170Received November 10 2017Accepted December 15 2017Publicized January 11 2018Copyedited March 1 2018
80
IEICE Communications Express Vol7 No3 77ndash82
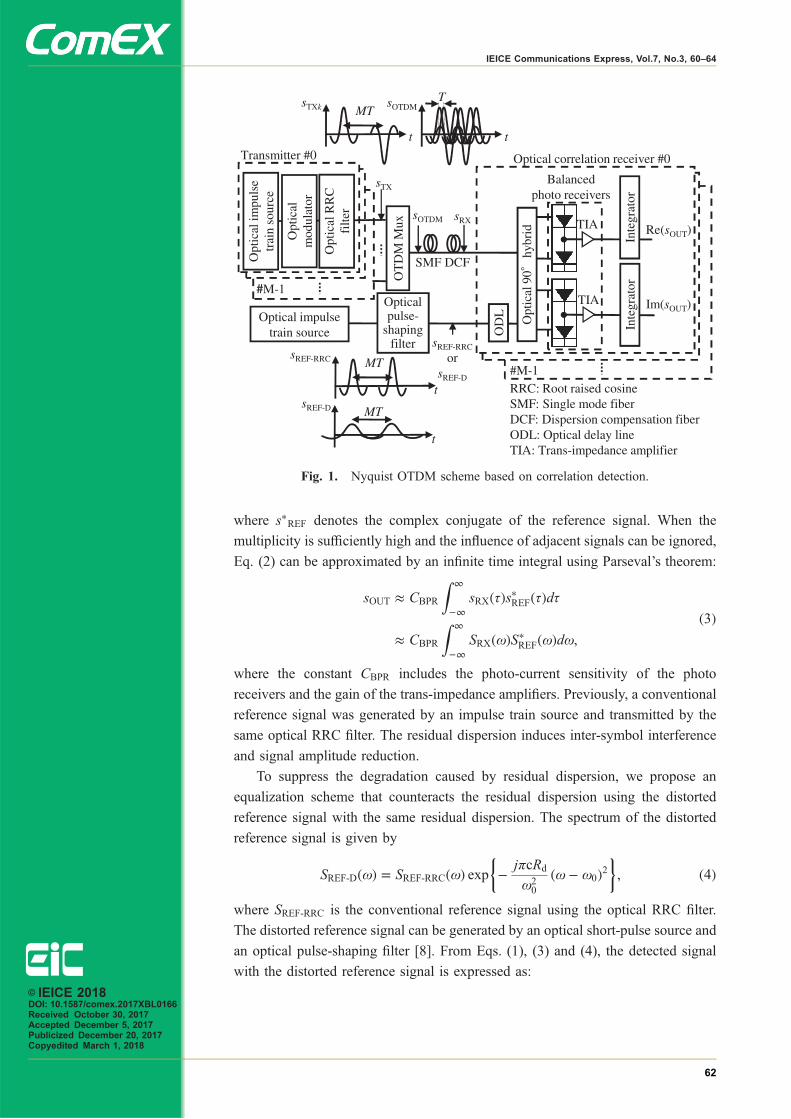
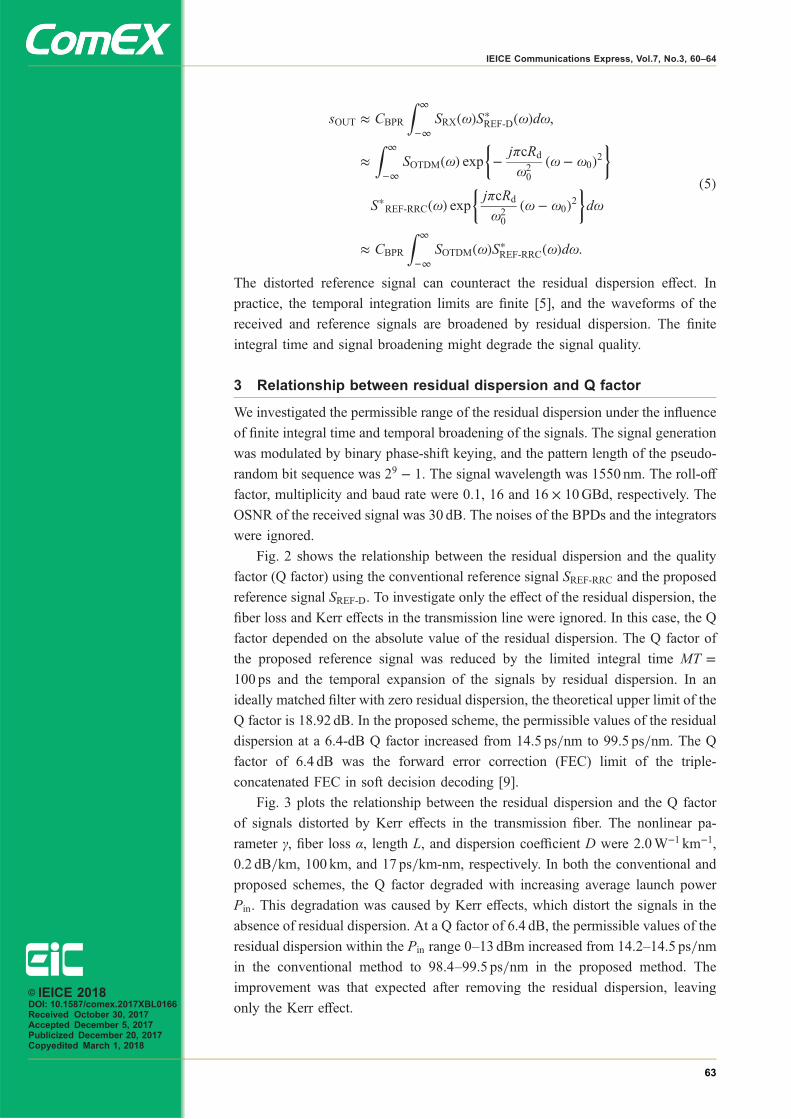
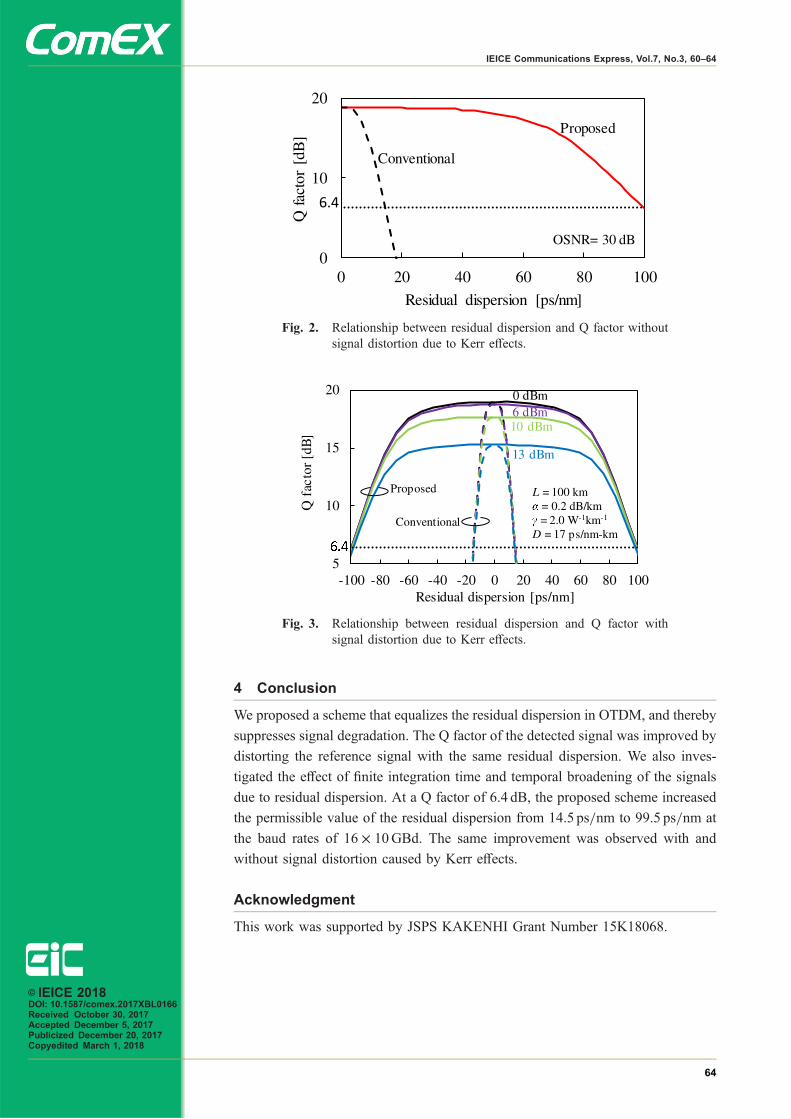
4 Conclusion
We proposed a scheme that equalizes the residual dispersion in OTDM and thereby
suppresses signal degradation The Q factor of the detected signal was improved by
distorting the reference signal with the same residual dispersion We also inves-
tigated the effect of finite integration time and temporal broadening of the signals
due to residual dispersion At a Q factor of 64 dB the proposed scheme increased
the permissible value of the residual dispersion from 145 psnm to 995 psnm at
the baud rates of 16 10GBd The same improvement was observed with and
without signal distortion caused by Kerr effects
Acknowledgment
This work was supported by JSPS KAKENHI Grant Number 15K18068
Fig 3 Relationship between residual dispersion and Q factor withsignal distortion due to Kerr effects
Fig 2 Relationship between residual dispersion and Q factor withoutsignal distortion due to Kerr effects
copy IEICE 2018DOI 101587comex2017XBL0166Received October 30 2017Accepted December 5 2017Publicized December 20 2017Copyedited March 1 2018
64
IEICE Communications Express Vol7 No3 60ndash64
Optical-fiber-connectedpassive primary surveillanceradar for aeronauticalsurveillance
Junichi Hondaa) and Takuya OtsuyamaSurveillance and Communications Department
Electronic Navigation Research Institute (ENRI)
National Institute of Maritime Port and Aviation Technology
Chofu Tokyo 182ndash0012 Japan
a) j-hondaenrigojp
Abstract A new radar system using a radio over fiber (RoF) is proposed
The proposed system is optical-fiber-connected passive primary surveillance
radar (OFC-PPSR) which is based on a passive bistatic radar approach and
uses RoF technology A separate receiver unit uses the waves scattered from
aircraft and the radar reference data transmitted by the RoF The reference
data include the radio frequency signals of the transmitter unit and the
processing data of the controller unit such as radar rotation angle We first
present the principles of OFC-PPSR and the experimental system which
was deployed at the Sendai airport in Japan Moreover we present some
preliminary experimental results obtained with the proposed system The
proposed system is capable of detecting moving aircraft as demonstrated by
a comparison of the experimental results with real surveillance data
Keywords primary surveillance radar multistatic primary surveillance
radar radio over fiber aeronautical surveillance air traffic management
Classification Sensing
References
[1] M I Skolnik Introduction to RADAR Systems 3rd ed McGraw-Hill NewYork NY USA 1962
[2] M C Stevens Secondary Surveillance Radar Artech House Norwood MA1988
[3] S Marquard ldquoSuitability of multi-static surveillance system for aeronauticaluse (passive radar)rdquo International Civil Aviation Organization Working PaperMontreal WP ASP12-12 Mar 2012
[4] ICAO (International Civil Aviation Organization) Doc 9924 AeronauticalSurveillance Manual 1st ed 2010
[5] J Honda and T Otsuyama ldquoFeasibility study on aircraft positioning by usingISDB-T signal delayrdquo IEEE Antennas Wireless Propag Lett vol 15 pp 1787ndash1790 Mar 2016 DOI101109LAWP20162536725
[6] T Ito R Takahashi S Morita and K Hirata ldquoExperimental result of passivebistatic radar with unknown transmitting radar pulserdquo Proc 2013 EuropeanRadar Conference Nuremberg pp 455ndash458 Oct 2013
copy IEICE 2018DOI 101587comex2017XBL0179Received November 17 2017Accepted November 29 2017Publicized December 20 2017Copyedited March 1 2018
65
IEICE Communications Express Vol7 No3 65ndash70
[7] J Honda and T Otsuyama ldquoPreliminary Experimental result of optical fiberconnected passive primary surveillance radarrdquo Proc Int Symp Antennas andPropagation (ISAP) Okinawa Japan POS2-71 Oct 2016
1 Introduction
Airport surveillance radar typically include both a primary surveillance radar (PSR)
[1] and a secondary surveillance radar (SSR) [2] Since the SSR uses the reply
signals from an aircraft and provides the aircraftrsquos position identify and altitude it
has become the main surveillance system in air traffic management On the other
hand PSRs play an important role as backup and in improving the security of
operations because it uses the waves scattered by aircraft and is a type of
independent noncooperative surveillance [3] However the update and detection
rates of PSRs are lower than those of SSR technologies Therefore PSR application
technologies are required to improve operational security
Recently multistatic primary surveillance radar (MSPSR) [4] has been ex-
pected to be used as a conventional PSR alternative One interesting property is
the selection of some signal sources eg present radar signals digital terrestrial
television broadcasts mobile communication (eg 3G and LTE) global navigation
satellite system and so on [5] Our final goal is to develop a combined surveillance
system using several signals As one core technology of MSPSR we consider
passive radar using the PSR signal The purpose of this system is to expand the
present PSR coverage and to contribute to the spectral efficiency The present PSR
coverage is about 60NM and the required detection rate is about 70 Since PSR
depends on the waves scattered from obstacles undetected area exists eg aircraft
at low altitude and the shadowed areas behind mountains or buildings To over-
come this problem we propose optical-fiber-connected passive PSR (OFC-PPSR)
to expand the present PSR coverage One of the strengths of this proposal lies in
its use of radio over fiber (RoF) which enables radio frequency (RF) signals to be
transmitted to a separate receiver over a long distance by an optical fiber
Consequently OFC-PPSR is capable of operating in the same manner as conven-
tional PSR In addition because a receiver unit is connected to a transmitter unit by
RoF the receiver always computes the target position even if the incident waves
cannot be detected The signal-to-noise ratio (SN) would also be better than that
using incident waves propagating in the atmosphere Moreover as one application
the existing infrastructure can be shared by collaborating with other surveillance
systems such as multilateration (MLAT)
In this letter the system concept and its operating principle are described first
Then a prototype system deployed at Sendai airport is introduced Finally we
show the experimental results It is shown that the proposed system can detect
aircraft through comparison with real surveillance data
2 Optical-fiber-connected passive primary surveillance radar
In general a radar has a transmitter unit combined with a receiver unit [1] As the
receiver unit always receives the information of the transmitted signals (transmitted
copy IEICE 2018DOI 101587comex2017XBL0179Received November 17 2017Accepted November 29 2017Publicized December 20 2017Copyedited March 1 2018
66
IEICE Communications Express Vol7 No3 65ndash70
timing antenna rotation angle etc) estimation of the target position is relatively
easy However in a passive radar system the separate receiver unit does not have
this information Hence it requires some signal processing [6] and a mechanism
to estimate the transmitted waves In order to overcome these problems and to
simplify the system we propose a new radar concept based on passive bistatic
radar [7]
The proposed system employs RoF technology which enables the transmission
of RF signals over long distances in comparison with a coaxial cable An OFC-
PPSR receiver unit is connected to the transmitter at a radar site by an optical fiber
Thus OFC-PPSR can stably use the original RF signals as a reference Hence the
receiver unit can be located far from the transmitter unit even if the directed waves
do not arrive at the receiver side Consequently similar to the present radar the
receiver unit can easily estimate aircraft positions by using the transmitted timing
radar rotation angles trigger and others Given that the proposed system is capable
of using scattered waves that do not return to the radar site it is expected to be
capable of expanding the coverage area of the current PSR Moreover owing to
RoF the SN is expected to be improved in comparison with the use of incident
waves propagating in the atmosphere It should be noted that sharing the same
infrastructure with other surveillance systems such as MLAT is an advantage
Therefore OFC-PPSR is expected to be used as a PSR distributed surveillance
system in correspondence with the common use of SSR applications
Fig 1 shows the system conceptual diagram of the proposed system and an
ellipsoidal curve illustrating the principles of passive bistatic radar (PBR) An RoF
transmitter unit is located at the radar site and it collects the RF signals transmitted
by a rotating antenna and some information in the controller unit and they are
provided to the separate receiver unit by RoF On the other hand the receiver unit
consists of a receiving antenna for the scattered waves a preamplifier a down-
converter a signal processing unit and an RoF receiver unit
The estimation procedure is summarized as follows
bull Adjust the signal delays corresponding to the optical fiber length from the
transmitter unit to the receiver unit
bull Measure the RF signals (1 scattered waves from aircraft 2 RF signals
transmitted by RoF) and collect radar information (1 timing when PSR faces
north 2 RF transmitted timing)
bull Analyze the bistatic ranging from the time difference of arrival between the
radar transmitted timing and the waves scattered from aircraft
In the above procedure the signal delay τ is given by
frac14 L1 thorn L2 L0c
frac12s eth1THORNwhere L1 thorn L2 is the total distance from the source to the receiver via obstacles L0is the direct distance from the source to the receiver and c is the velocity of light
These relations are shown in Fig 1b In the proposed system L0 is modified by the
optical fiber length and the source and receiver positions τ is computed by the
receiver unit as mentioned above However since L1 and L2 are unknown
parameters one of them is required to obtain a solution L1 is computed bycopy IEICE 2018DOI 101587comex2017XBL0179Received November 17 2017Accepted November 29 2017Publicized December 20 2017Copyedited March 1 2018
67
IEICE Communications Express Vol7 No3 65ndash70
L1 frac14 eth thorn 2L0THORN2L0eth1 cos thorn =L0THORN eth2THORN
where Δ is defined by frac14 c and the angle between the directions of the radar and
the target is given by θ The result computed for L1 (or L2) is an ellipsoidal curve
3 System deployment and experimental results
A prototype system has been developed and deployed at Sendai airport in Japan
and preliminary experiments were performed to confirm the basic operation of the
OFC-PPSR system Fig 2 shows the experimental environment and setup In this
experiment a training radar was used it is located at the southern part of the airport
where the RoF transmitter unit is also located A general PSR produces an
asymmetric beam shape known as a fan beam and the vertical plane is the
cosecant-squared elevation pattern The RoF transmitter unit is connected to the
RoF receiver unit located at the western part of airport by an optical fiber
The PSR emits a short pulse of 1 micros and a long pulse of 80 micros Long pulses are
modulated by FM chirp Since the long pulse is emitted after transmitting the short
pulse the coverage area of the short pulse is limited by the time interval between
the short and long pulses The frequency is assigned to the S band The distance
from the radar site to the OFC-PPSR receiver is sim1800m The signal processing
(a) Principles of OFC-PPSR
(b) Estimated curve of PBR
Fig 1 Principles of OFC-PPSR and estimated curve of PBR
copy IEICE 2018DOI 101587comex2017XBL0179Received November 17 2017Accepted November 29 2017Publicized December 20 2017Copyedited March 1 2018
68
IEICE Communications Express Vol7 No3 65ndash70
unit separately analyzes both pulses and a standard horn antenna is selected as the
receiver
Fig 3 shows the experimental results This is illustrated by overlapping five
scans (frac14 20 s) of data and the figure is converted from the estimated bistatic
ranging to the PPI scope In this figure there are large echoes on the left side We
confirmed that the echoes are located at Mt Zao on the map On the right side of
the airport waves reflected from a moving object are also observed In order to
check whether the moving object is an aircraft we compare the experimental results
with the real surveillance data obtained by automatic dependent surveillance-
broadcast (ADS-B) The right side of Fig 3 shows a magnification and compar-
ison The ADS-B tracks are indicated by red circles The positions between the
echoes from the moving object and ADS-B are slightly different However as
ADS-B has some errors and the results obtained by the proposed system disregard
Fig 2 Experimental environment
Fig 3 Experimental results in comparison with ADS-B tracks
copy IEICE 2018DOI 101587comex2017XBL0179Received November 17 2017Accepted November 29 2017Publicized December 20 2017Copyedited March 1 2018
69
IEICE Communications Express Vol7 No3 65ndash70
the height the echo of the moving aircraft and the ADS-B tracks are almost
identical Therefore we conclude that these echoes represent a moving aircraft
4 Conclusion
In this letter we proposed OFC-PPSR as a new radar system by using RoF One of
the characteristics is the use of original RF signals at a separate receiver unit This
results in the same operation as conventional PSR even if the receiving antenna is
in the non-line-of-sight of the transmitter Moreover SN of reference signal with
RoF is higher and stable than that with monitoring antenna to receive the signal
from PSR Experiments were performed at Sendai airport in Japan It was shown
that the proposed system detects the echoes from a mountain and moving object
Comparing the experimental results with ADS-B it was demonstrated that the
moving object was an aircraft
The proposed system is expected to expand the coverage area of present
aeronautical surveillance systems However all signal processing in the proposed
system was disregarded Our future work will consider some radar signal process-
ing techniques such as moving target indication (MTI) and constant false-alarm rate
(CFAR) in order to suppress unnecessary signals from fixed structures It will be
our future work
Acknowledgments
We would like to express our gratitude to the Aeronautical Safety College and
Sendai Airport for their support
The work was supported in part by a Grant-in-Aid for Young Scientists (B)
(16K18072) from the Japan Society for Promotion of Science
copy IEICE 2018DOI 101587comex2017XBL0179Received November 17 2017Accepted November 29 2017Publicized December 20 2017Copyedited March 1 2018
70
IEICE Communications Express Vol7 No3 65ndash70
High-resolution geomagneticobservation system usingHTS-SQUID
Yuta Katori1a) Shinji Isogami2 Tsunehiro Hato3Akira Tsukamoto3 Keiichi Tanabe3 Nobuhito Ohnishi4Chikara Furukawa4 and Kan Okubo1b)1 Graduate School of System Design Tokyo Metropolitan University
6ndash6 Asahigaoka Hino Tokyo 191ndash0065 Japan2 Research Center for Magnetic and Spintronic Materials National Institute
for Materials Science 1ndash2ndash1 Sengen Tsukuba Ibaraki 305ndash0047 Japan3 Superconducting Sensing Technology Research Association
2ndash11ndash19 Minowa-Cho Kohoku-ku Yokohama Kanagawa 223ndash0051 Japan4 TIERRA TECNICA Ltd
3ndash25ndash1 Enoki Musashimurayama Tokyo 208ndash0022 Japan
a) katori-yutaedtmuacjp
b) kannetmuacjp
Abstract Our research group reported successful observation of ldquoco-
faultingrdquo Earthrsquos magnetic field changes because of piezomagnetic effects
caused by earthquake tremors during the 2008 Iwate-Miyagi Nairiku earth-
quake of M72 using a geomagnetic observation system with flux-gate
magnetometers This is an important finding electromagnetic fields prop-
agate from a source to an observation site at the light speed in the crustal
materials Further earthquake detection efforts can lead us to a new system
for super-early warning of earthquake detection with the geomagnetic signal
However the observed result with the earthquake was suggested that the
geomagnetic field change accompanying fault movement whose sources are
the piezomagnetic effects is very small and short term Therefore to develop
an extremely important high-resolution magnetometer system we first con-
ducted long-term precise geomagnetic observations using a high-temperature
superconductor based superconducting quantum-interference device (HTS-
SQUID) magnetometer system The HTS-SQUID magnetometer system had
never been used for high-resolution geomagnetic observations outdoors
Since March 2012 we have observed geomagnetic field using the HTS-
SQUID magnetometer at Iwaki observation site (IWK) in Fukushima Japan
Comparison between the introduced HTS-SQUID magnetometer and con-
ventional flux-gate clarified that the HTS-SQUID magnetometer in our
system has higher resolution of magnetic field observation
copy IEICE 2018DOI 101587comex2017XBL0168Received November 1 2017Accepted November 28 2017Publicized December 22 2017Copyedited March 1 2018
71
IEICE Communications Express Vol7 No3 71ndash76
Keywords HTS-SQUID magnetometer geomagnetic observation high-
resolution
Classification Sensing
References
[1] F D Stacey ldquoThe seismomagnetic effectrdquo Pure Appl Geophys vol 58 no 1pp 5ndash22 Jan 1964 DOI101007BF00879136
[2] M J S Johnston and R J Mueller ldquoSeismomagnetic observation with the July8 1986 ML 59 North Palm Springs earthquakerdquo Science vol 237 no 4819pp 1201ndash1203 1987 DOI101126science23748191201
[3] M J S Johnston R J Mueller and Y Sasai ldquoMagnetic field observations inthe near-field the 28 June 1992 Mw 73 Landers California earthquakerdquo BullSeismol Soc Am vol 84 no 3 pp 792ndash798 June 1994
[4] K Okubo N Takeuchi M Utsugi K Yumoto and Y Sasai ldquoDirect magneticsignals from earthquake rupturing Iwate-Miyagi earthquake of M 72 JapanrdquoEarth Planet Sci Lett vol 305 no 1ndash2 pp 65ndash72 May 2011 DOI101016jepsl201102042
[5] P Wessel W H F Smith R Scharroo J Luis and F Wobbe ldquoGenericmapping tools Improved version releasedrdquo Eos Trans AGU vol 94 no 45pp 409ndash410 Nov 2013 DOI1010022013EO450001
[6] P Wessel and W H F Smith ldquoNew improved version of generic mapping toolsreleasedrdquo Eos Trans AGU vol 79 no 47 p 579 Nov 1998 DOI10102998EO00426
[7] P Wessel and W H F Smith ldquoNew version of the generic mapping toolsrdquo EosTrans AGU vol 76 no 33 p 329 Aug 1995 DOI10102995EO00198
[8] P Wessel and W H F Smith ldquoFree software helps map and display datardquo EosTrans AGU vol 72 no 41 pp 441ndash446 Oct 1991 DOI10102990EO00319
[9] Kakioka Magnetic Observatory ldquoKakioka Magnetic Observatory Home PagerdquoKakioka Magnetic Observatory Japan Meteorological Agency httpwwwkakioka-jmagojpenindexhtml accessed Feb 28 2017
1 Introduction
11 Background
For decades researchers have studied the seismomagnetic effects [1 2 3] Their
reports describe that the surrounding magnetic field changed before and after
earthquake occurrence
From our continuous observations our research group also reported a success-
ful result which is ldquoco-faultingrdquo Earthrsquos magnetic field variation due to piezomag-
netic effects caused by earthquake rupturing (ie earthquake-piezomagnetic
effects) in 2008 Iwate-Miyagi Nairiku earthquake of M72 [4]
However the magnetic field changes are very small variations of 300 pT [4]
Our successful result is observed by geomagnetic observation system with a flux-
gate magnetometer (10Hz sampling rate) and a synchronized accelerometer
The magnetic field propagates from the sources to the observation point at the
light speed Therefore our result suggested the possibility of earthquake detection
from magnetic signal If we can detect an earthquake from magnetic field we are
copy IEICE 2018DOI 101587comex2017XBL0168Received November 1 2017Accepted November 28 2017Publicized December 22 2017Copyedited March 1 2018
72
IEICE Communications Express Vol7 No3 71ndash76
able to early warn the occurrence Further efforts could lead us to a new system for
super-early warning of earthquake detection with the magnetic signal [4]
12 Magnetometer for geomagnetic observation
In general geomagnetic observation it might be said that the sampling frequency of
1Hz is sufficient for observation and that it is not important to observe with higher
accuracy
However our successful observation of the Iwate-Miyagi Nairiku earthquake
the magnetic field variations had continued to change only several seconds from the
earthquake occurrence time Therefore our system (10Hz sampling rate) recorded
magnetic field variations of only several tens of data points
Additionally because the highest magnetic field resolution of a flux-gate
magnetometer is greater than 10 pT such a conventional magnetometer is not
suitable to observe a small signal by the earthquake-piezomagnetic (EQ-piezomag-
netic) effects
Incidentally a LTS-SQUID magnetometer using liquid helium is considered to
be more accurate as an element of sensor Nevertheless it is not promising for
continuous long-term geomagnetic observation because it requires liquid helium
That is the long-term geomagnetic observation demands a magnetometer which
not only is easily operated in the outdoor field but also has very high resolution
2 Geomagnetic observation
21 Observation system using HTS-SQUID magnetometer
Our research group has developed a new geomagnetic observation system with low
running cost and higher resolution we introduce high-temperature-superconductor
based superconducting-quantum-interference-device (HTS-SQUID) as a magne-
tometer for a long-term geomagnetic observations The HTS-SQUID magnetometer
has much lower running costs than LTS-SQUID because it uses liquid nitrogen to
maintain a superconducting state This is the most important point It is the first trial
in the world that we had adopted the HTS-SQUID magnetometer for a geomagnetic
observation system
The sampling-frequency of our magnetometer system is 50Hz (002 s) which
are higher sampling frequency than our conventional observation system using a
flux-gate Our system observed the orthogonal three-vectors of geomagnetic field
vibration ethHx Hy HzTHORN The clock of this system is synchronized with a GPS signal
These observed data are uploaded to the web server through the mobile network
22 Observation at IWK site
Since March 2012 we have observed three geomagnetic field components using a
HTS-SQUID magnetometer at Iwaki observation point in Fukushima Japan Here
Iwaki was assumed as an area affected by aftershocks of The 2011 off the Pacific
coast of Tohoku Earthquake Figure 1(a) shows the location of IWK site The map
(b) is a zoom up view of (a) Here we use Generic Mapping Tool (GMT) for
making the map of this figure [5 6 7 8]copy IEICE 2018DOI 101587comex2017XBL0168Received November 1 2017Accepted November 28 2017Publicized December 22 2017Copyedited March 1 2018
73
IEICE Communications Express Vol7 No3 71ndash76
Figure 1 also depicts Kakioka Geomagnetic Observatory (KAK) operated by
the Japan Meteorological Agency The distance separating IWK and KAK is about
100 km Geomagnetic observation results obtained at KAK are used as reference
data
As an example of the result observed by the system at IWK Fig 1(c) shows the
geomagnetic signal on March 17th 2015 The geomagnetic signal at KAK [9] is
also depicted in this figure Here the sampling frequency of KAK data was 10Hz
The daily K-index on March 17 2015 was 5 where the K-index quantifies
disturbances in the horizontal component of earthrsquos magnetic field with an integer
[9]
From this figure we can confirm that geomagnetic signals using the HTS-
SQUID magnetometer at IWK are very valid by a comparison of waveforms
obtained at the two observation points (IWK and KAK) It is reasonable that two
waveforms are similar because the geomagnetic longitude of two observation
points is almost same
3 Results
31 Geomagnetic field observed by HTS-SQUID magnetometer
We show the three orthogonal components of the geomagnetic field observed using
the HTS-SQUID magnetometer in Fig 2 where the DC offset of the data is
adjusted for easy visibility The signals are observed on October 28th 2015 whose
daily k-index is the smallest 0 over this year Hence geomagnetic variation itself of
this day was very small
Fig 1 Location of IWK geomagnetic observation system
copy IEICE 2018DOI 101587comex2017XBL0168Received November 1 2017Accepted November 28 2017Publicized December 22 2017Copyedited March 1 2018
74
IEICE Communications Express Vol7 No3 71ndash76
For subsequent evaluation we use observation data of 1800ndash1900 (UTC)
corresponding to the middle of night of Japan (ie relatively much lower artificial
noise period) in Fig 2(b) For comparison to a conventional magnetometer the
flux-gate observation result at IWK is also portrayed in this figure The sampling
frequency of the setup flux-gate magnetometer is 10Hz
32 Evaluation
To evaluation the magnetic field resolution of the system the mean absolute
deviation (MAD) is used as an evaluation value as
MAD frac14 1
nt
Xn
ifrac140jHi Hijt eth1THORN
where Hi represents the mean of Hi
Figure 3 presents results of calculating the MAD for each of the three-
components of the two magnetometers (HTS-SQUID and Flux-Gate) using the
data observed in 1800ndash1900UT on October 28 2015 As shown in Fig 3(a1)ndash
(a6) we calculated the MAD every second because the observation target signal by
the EQ-piezomagnetic effect changes during a few or several seconds Additionally
the average of MAD per hour is displayed in Fig 3(b)
As shown in Fig 3 the deviation of signals observed using the HTS-SQUID
magnetometer is smaller than that of the flux-gate magnetometer Results show that
the HTS-SQUID magnetometer in our system has higher resolution of magnetic
field observation than the usual flux-gate magnetometer The HTS-SQUID magne-
tometer in our system provides geomagnetic field observations with a high
accuracy and a high sampling rate
Fig 2 Observation result at IWK site
copy IEICE 2018DOI 101587comex2017XBL0168Received November 1 2017Accepted November 28 2017Publicized December 22 2017Copyedited March 1 2018
75
IEICE Communications Express Vol7 No3 71ndash76
4 Conclusion
For this study we develop a geomagnetic field observation system with high
accuracy and high sampling rate In this first trial the HTS-SQUID magnetometer
was used for a continuous long-term geomagnetic observation
Comparison of the proposed magnetometer and a conventional flux-gate
clarified that the HTS-SQUID magnetometer we used has higher resolution of
magnetic field observations The deviation of the HTS-SQUID magnetometer is
about 3 pT to 6 pT We can say that this value is extremely small rather than
conventional magnetometer system
Future task is to accumulate the geomagnetic field signals accompanying the
EQ-piezomagnetic effect using the HTS-SQUID magnetometer and to reveal that
effect
Acknowledgement
I would like to extend my greatest appreciation to Dr Nobunao Takeuchi (Professor
Emeritus Akita Prefectural University) who provided helpful comments and
suggestions This study was partly supported by JSPS KAKENHI Grant Number
26289348 24560507 and 23686130
Fig 3 MAD result at IWK site
copy IEICE 2018DOI 101587comex2017XBL0168Received November 1 2017Accepted November 28 2017Publicized December 22 2017Copyedited March 1 2018
76
IEICE Communications Express Vol7 No3 71ndash76
Implementation and usertesting of personalauthentication havingshoulder surfing resistancewith mouse operations
Makoto Nagatomo1 Yoshihiro Kita2 Kentaro Aburada3Naonobu Okazaki3 and Mirang Park1a)1 Kanagawa Institute of Technology
1030 Shimo-Ohino Atsugi Kanagawa 243ndash0292 Japan2 Tokyo University of Technology
1404ndash1 Katakura Hachioji Tokyo 192ndash0982 Japan3 University of Miyazaki
1ndash1 Gakuen-Kibanadai-Nishi Miyazaki Miyazaki 889ndash2192 Japan
a) mirangnwkanagawa-itacjp
Abstract Typically typing character strings on a keyboard is used for
personal authentication for PC login and unlocking Although some graph-
ical and biometric-based methods have been developed most of them have
weak authentication strength weak shoulder surfing resistance or other
drawbacks In this paper we propose a personal authentication method
that employs mouse operations in which the mouse itself does not need to
be moved Thus the user can hide the mouse during authentication so the
method has shoulder surfing resistance and can be used in public places We
performed user testing to validate the proposed method
Keywords personal authentication mouse operation shoulder surfing
resistance
Classification Multimedia Systems for Communications
References
[1] CSE SECUREMATRIX httpcse-americacomindexhtm accessed Sept 202017
[2] V Rajanna S Polsley P Taele and T Hammond ldquoA gaze gesture-based userauthentication system to counter shoulder-surfing attacksrdquo Proc 2017 CHIConference Extended Abstracts on Human Factors in Computing Systemspp 1978ndash1986 2017 DOI10114530270633053070
[3] M Karim H Heickal and Md Hasanuzzaman ldquoUser authentication frommouse movement data using multiple classifiersrdquo Proc 9th InternationalConference on Machine Learning and Computing pp 122ndash127 2017 DOI10114530556353056620
[4] Y Kita N Okazaki H Nishimura H Torii T Okamoto and M ParkldquoImplementation and evaluation of shoulder-surfing attack resistant usersrdquo
copy IEICE 2018DOI 101587comex2017XBL0170Received November 10 2017Accepted December 15 2017Publicized January 11 2018Copyedited March 1 2018
77
IEICE Communications Express Vol7 No3 77ndash82
IEICE Trans Inf amp Syst vol J97-D no 12 pp 1770ndash1784 2014 (inJapanese)
[5] H Manabe and M Fukumoto ldquoAwareLess authentication insensible inputbased authenticationrdquo Proc of CHI rsquo07 Extended Abstracts on Human Factorsin Computing Systems (CHI EA rsquo07) pp 22561ndash2566 2007 DOI10114512408661241041
[6] K Watanabe F Higuchi M Inami and T Igarashi ldquoCursorCamouflageMultiple Dummy Cursors as A Defense against Shoulder Surfingrdquo Proc ofSIGGRAPH Asia 2012 Emerging Technologies no 6 2 pages 2012 DOI10114524077072407713
1 Introduction
Currently many people use character-based passwords entered by keyboard for
personal authentication in public places such as a classroom of office to unlock a
PC or sign into a service on the userrsquos own PC or a public PC This method in these
situations risks leakage of passwords by shoulder surfing
SECUREMATRIX [1] provides a graphical password as positions on three
or four matrices The memory burden is less than it is for a character string An
attacker however can identify the password by shoulder surfing attack by watching
the keyboard and the monitor
In the gaze-following method [2] a user performs authentication by following
a moving icon on the monitor using their eyes This method has shoulder surfing
resistance but the user must use a camera
In the method presented in [3] the user registers extracted features of the userrsquos
mouse movements on a desk The user can use this method in many public places
since most PCs have a mouse However the attacker can imitate mouse movements
by shoulder surfing
The Secret Tap with Double Shift (STDS) method [4] requires the user to
register icons as a password on the screen of a smartphone The user authenticates
the icons by selecting the icons This method has shoulder surfing resistance but
the genuine icons can be revealed by recording attack twice
As described above no easy-to-use method has shoulder surfing resistance for a
PC in public places In this paper we propose a method that uses mouse clicks and
mouse wheel rotations This method can improve shoulder surfing resistance
because the user does not need visual feedback and can operate the mouse under
a desk
2 Mouse authentication method
21 Overview
Here we define the personal authentication method The input interface is a
common mouse with right and left click upward and downward wheel rotation
and wheel click The output interface is an N N matrix
Use case A user unlocks a PC or signs into a service on a PC in a public place
while hiding the mouse such as under the desk For example a user signs into an
e-mail service on their own laptop in a cafeacute
copy IEICE 2018DOI 101587comex2017XBL0170Received November 10 2017Accepted December 15 2017Publicized January 11 2018Copyedited March 1 2018
78
IEICE Communications Express Vol7 No3 77ndash82
Strength When the user registers m positions (including the registration order) on
an N N matrix the probability that an attacker succeeds in a random attack on
this method (accidental authentication probability) is 1=N2m We are aiming for an
accidental authentication probability of less than 110000
Registration phase Registration is performed as follows
1 The screen displays an N N matrix with an initial position randomly
selected
2 The user registers a position on the matrix using mouse operations The current
position is marked by a red circle and the positions moves left by left click
right by right click up by upward wheel rotation and down by downward
rotation The user registers the current position with a wheel click
3 The user registers m positions by repeating (1) and (2) The registered order is
part of the authentication information
Authentication phase Authentication is performed as follows
1 The screen displays an N N matrix with a randomly selected initial position
2 The user specifies the first registered position with mouse operations The
mouse operations and its effects are the same as (2) in the registration phase
The user hides the mouse such as under the desk and only the initial position
is displayed not the current positions to strengthen shoulder surfing resist-
ance
3 The user specifies m registered positions in their registered order using the
same mouse operations used during registration
Benefits The mouse operations in this method are intuitive Some people cannot
operate a keyboard intuitively while hiding it In addition the proposed method is
a challenge and response authentication system in which the screen position and
position order are hidden Therefore users can use this method in public places
safely
22 Implementation
We implemented the proposed method using a 5 5 matrix (N frac14 5) which struck
a balance between the usability and authentication strength A position count of
m 3 meets 1=52m 1=10000 so we decided to make the ldquopasswordrdquo three or
more positions long
Fig 1 shows an animation of the proposed method It is natural to fix the initial
position on the matrix but the shoulder surfing resistance is weak against hearing
the mouse sounds sometimes Therefore although it seems that the usability is
lower than when the initial position is fixed we decided that the initial position is
determined randomly The registered position is revealed when an initial position is
near it in the authentication phase so the user must register a position after moving
at least three times
We developed two variations in which the user (1) selects positions directly by
combinations of mouse clicks and mouse movements or (2) selects by combina-
tions of colors and numbers on the matrix A user can select a variation according
to their tastecopy IEICE 2018DOI 101587comex2017XBL0170Received November 10 2017Accepted December 15 2017Publicized January 11 2018Copyedited March 1 2018
79
IEICE Communications Express Vol7 No3 77ndash82
3 Evaluation
We conducted two experiments on the usability and shoulder surfing resistance of
the implemented method The subjects used a desktop PC and a common mouse
with mouse clicks and wheel rotations (Logicool wireless mouse M186) This
mouse emits the sound of clicks and rotations clearly In the user testing and
shoulder surfing experiment reported here we did not use the two variations but
we plan to conduct experiments of these in the future
31 Usability test
We conducted the usability test as follows
1 We explained to the subject how to use the method
2 The subject completed a tutorial to become familiar with the mouse operations
3 The subject registered three positions
4 The subject performed three authentications successfully
5 The subject answered a questionnaire on comprehension ease of use ease of
familiarization safety for shoulder surfing and user needs These items were
rated from 1 to 5 (very bad to very good)
Fig 2 shows the result of the usability tests The subjects were 20 Kanagawa
Institute of Technology students The average time to complete the third successful
authentication was 155 s [see Fig 2(a)] and the average authentication success
rate was 631 It took time for users to get used to this authentication method and
the success rate was not enough due to the invisibility of the current positions
Fig 2(b) shows the result of the responses to the usability testing questionnaire All
five averages are over 3 so usability of this method is confirmed
32 Shoulder surfing resistance test
In the second experiment shoulder surfers were positioned 1m behind the user so
that the surfer could see the monitor and hear the mouse sounds We eliminated
ambient noise so that the surfer could hear the mouse sound clearly The procedure
of the shoulder surfing resistance experiment was as follows
Fig 1 Animation of the proposed method
copy IEICE 2018DOI 101587comex2017XBL0170Received November 10 2017Accepted December 15 2017Publicized January 11 2018Copyedited March 1 2018
80
IEICE Communications Express Vol7 No3 77ndash82
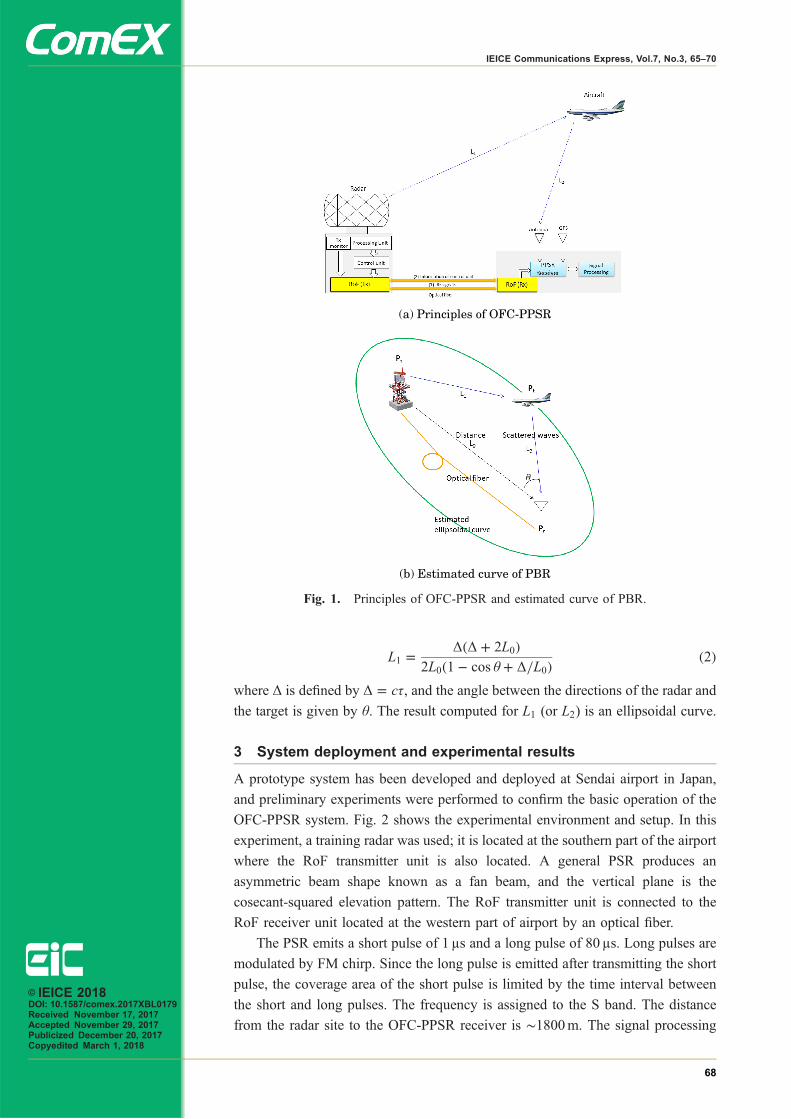
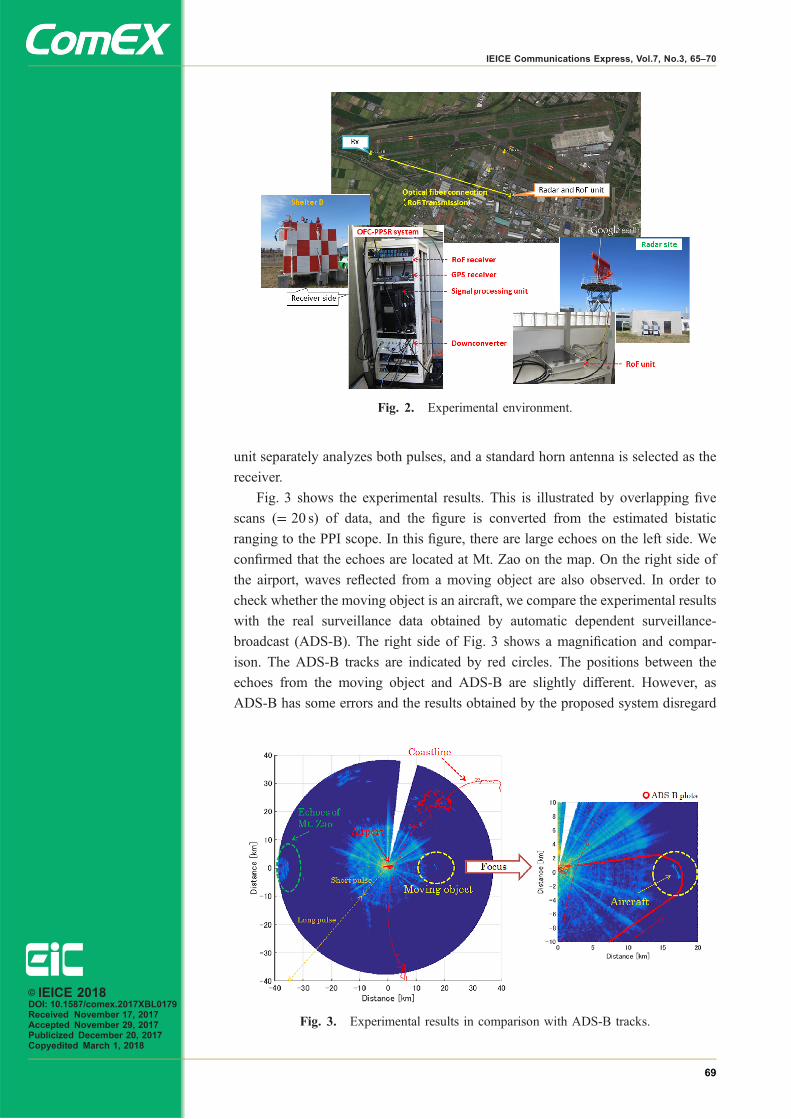
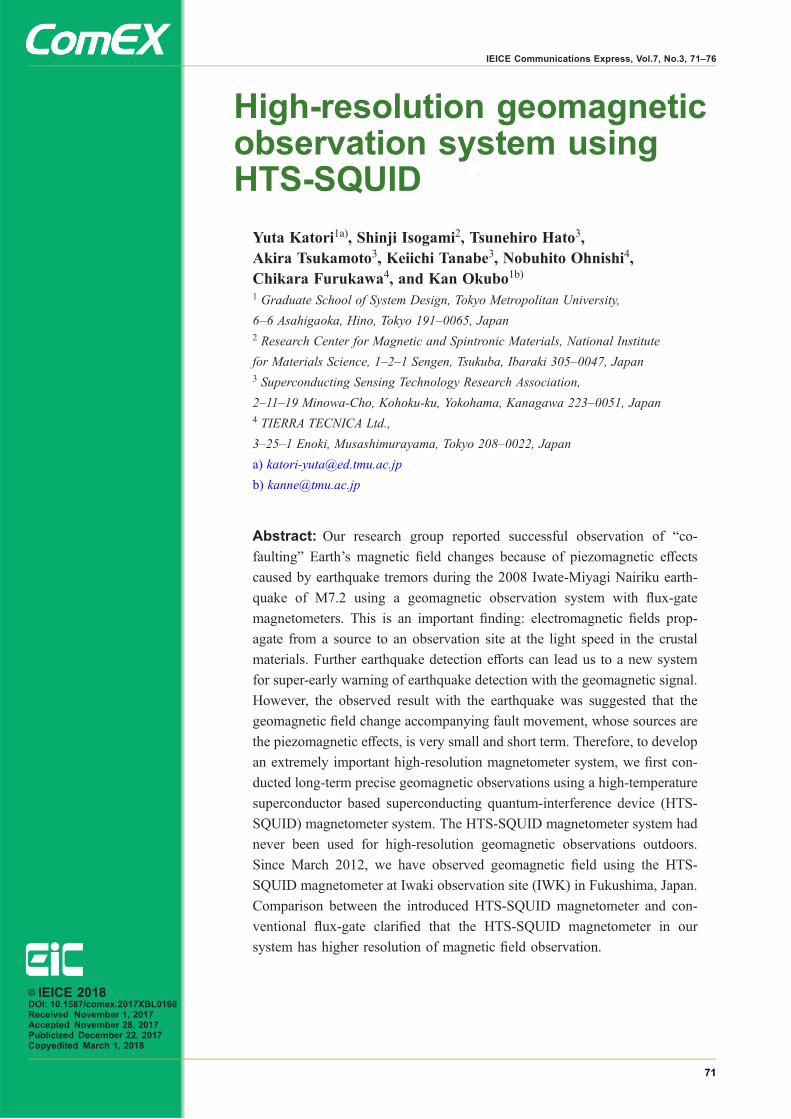
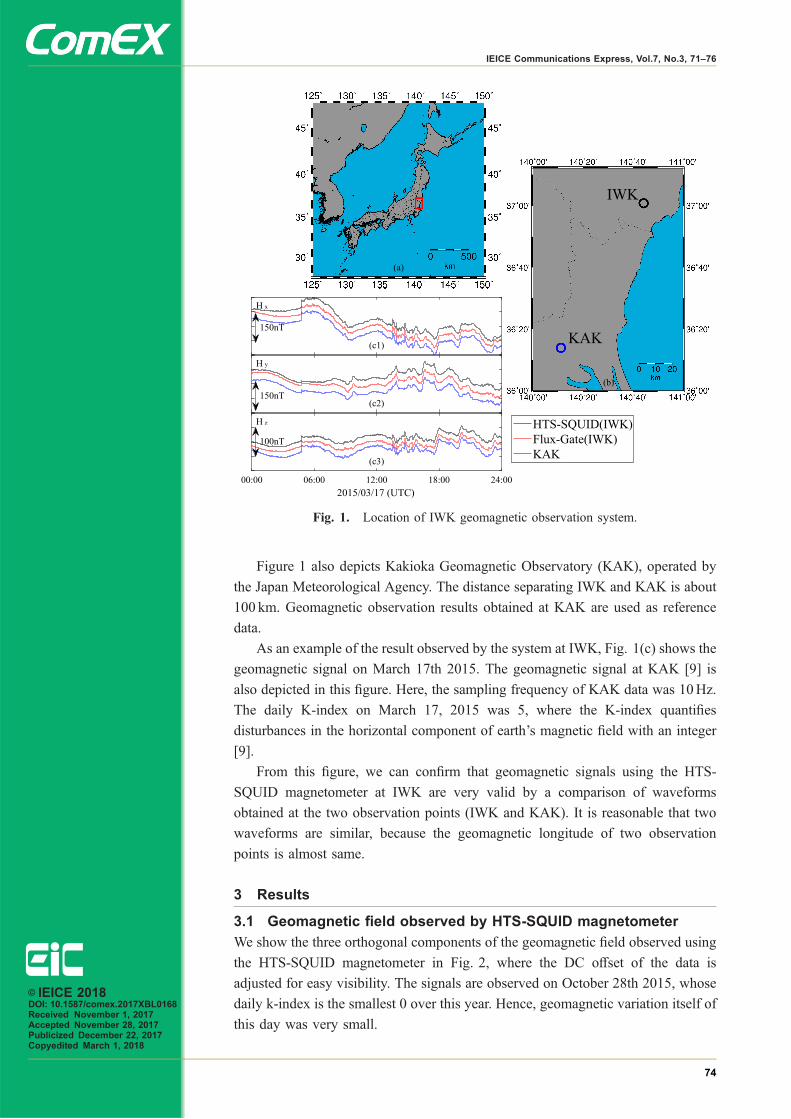
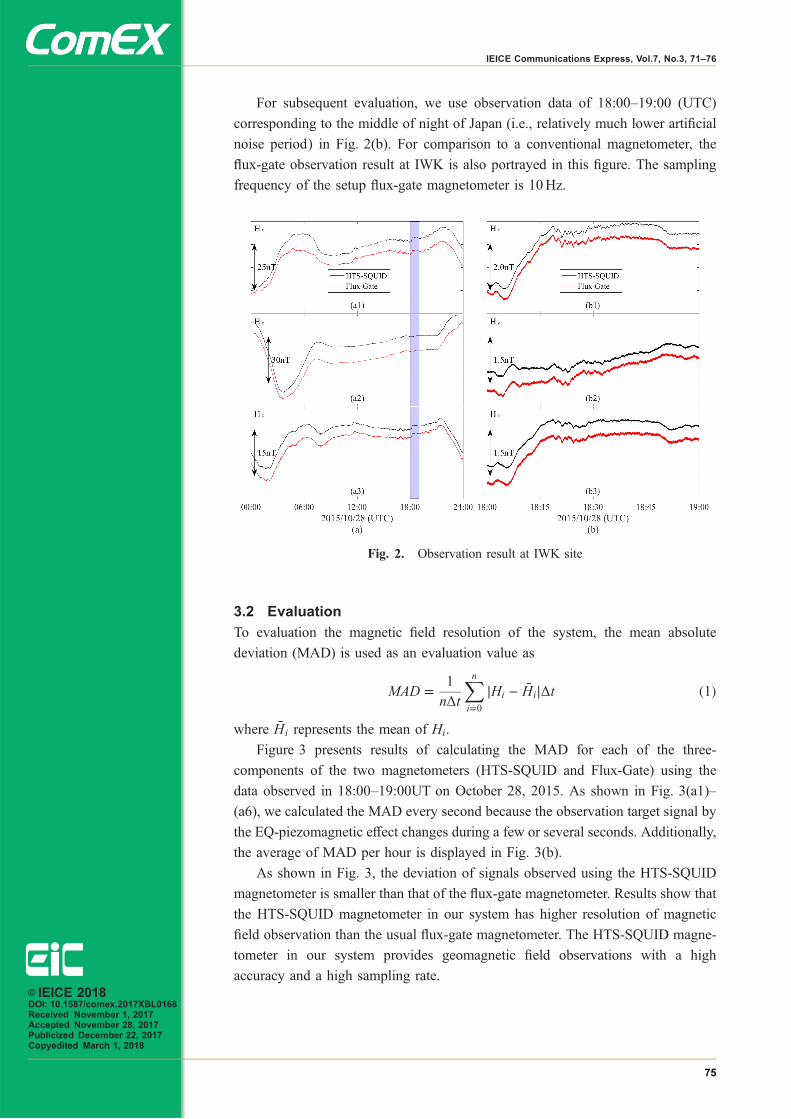
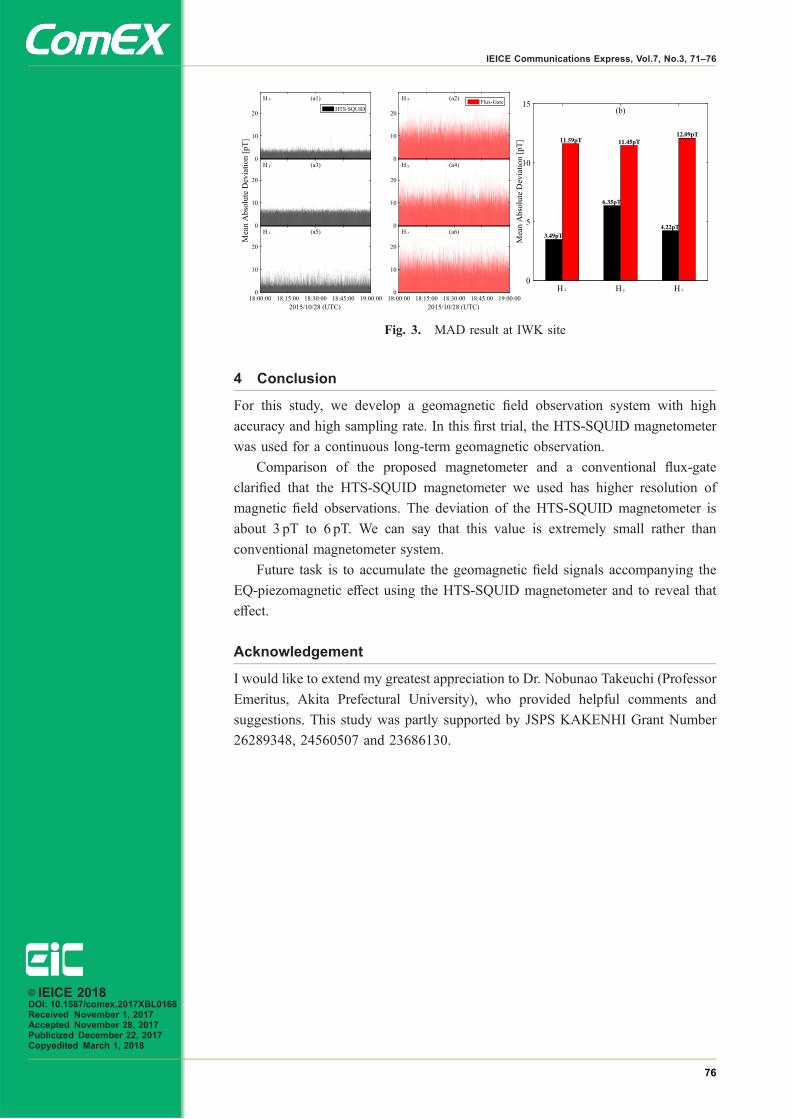

1 We formed teams consisting of five or six people
2 We choose a user from each team and the user registered three positions in the
method Shoulder surfers were the other people in each team and not allowed
to see the monitor during the registration
3 The user performed ten authentication successes while hiding the mouse under
the desk Shoulder surfers observed the authentication and tried to detect the
registered positions they were allowed to take notes
4 We repeated steps 2ndash4 until everyone on the team was a user once
The subjects were 16 Kanagawa Institute of Technology students We per-
formed this experiment using one team with six people and two teams with five
people each The result shows that the detection rates for one two and three
positions were 228 86 and 14 respectively Only once were all three of a
userrsquos registered positions detected (by one person) For the other 15 subjects only
one or two registered positions were detected Under real conditions in public
places ambient sound would interfere with the shoulder surfing so the results
indicate that this method has shoulder surfing resistance
33 Comparison with other methods
We compared the proposed method with related methods [1 2 4] as shown
in Table I The proposed method has fewer password combinations than
SECUREMATRIX [1] and the gaze-following method [2] but it has shoulder
(a) Average authentication time for each success
(b) Average of the items of the questionnaire
Fig 2 Results of usability tests
copy IEICE 2018DOI 101587comex2017XBL0170Received November 10 2017Accepted December 15 2017Publicized January 11 2018Copyedited March 1 2018
81
IEICE Communications Express Vol7 No3 77ndash82
surfing resistance and needs no special device The STDS method on a smartphone
[4] has shoulder surfing resistance and does not require special devices but the
proposed method has more password combinations than does STDS
4 Conclusion
We proposed a personal authentication method with shoulder surfing resistance
using mouse operations In the proposed method a user can hide the mouse and
thereby achieve shoulder surfing resistance We implemented the proposed method
and evaluated it for usability and shoulder surfing resistance The results show that
the proposed method has good usability shoulder surfing resistance However the
sounds made by the mouse during operation is a possible source of password
detection A measure to protect against this will be developed in the future
Moreover although we assumed that a user always hides a mouse such as under
a desk in authentication phase we will develop the method that have shoulder
surfing resistance without hiding a mouse
Acknowledgments
This work was supported by JSPS KAKENHI Grant Numbers JP17H01736
JP17K00139
Table I Comparison with related methods
Existing method
SECUREMATRIX [1]
Gaze-following method [2] STDS [4]Proposedmethod
Combinations 323 frac14 32768 363 frac14 46656 163 frac14 4096 253 frac14 15625
(in case of 3 digitsof passwords)
(in case of threematrices)
(includingdummy icons)
Shoulder surfingresistance
- x x x
Secret information Positions Icons Icons and shifts Positions
Special devices none camera none none
copy IEICE 2018DOI 101587comex2017XBL0170Received November 10 2017Accepted December 15 2017Publicized January 11 2018Copyedited March 1 2018
82
IEICE Communications Express Vol7 No3 77ndash82
Experimental path loss modelfor liver implanted wirelesscommunication channel atultra-wideband range
Pongphan Leelatien1a) Koichi Ito2 and Kazuyuki Saito21 Graduate School of Engineering Chiba University
1ndash33 Yayoi-cho Inage-ku Chiba 263ndash8522 Japan2 Center for Frontier Medical Engineering Chiba University
1ndash33 Yayoi-cho Inage-ku Chiba 263ndash8522 Japan
a) pongphanchiba-ujp
Abstract With the potential use of wireless implanted devices for trans-
planted liver monitoring applications it is important to investigate the in-
body propagation channel at liver area and to demonstrate the feasibility of
the applications Experimental measurements were performed using our
developed multilayer human equivalent phantoms Subsequently path loss
data were recorded and analyzed for various distances between the implanted
and on-body antennas at lower range of ultra-wideband to assess the in-body
propagation channel Finally our preliminary results indicate a possibility for
liver implanted wireless communications using UWB technology in the
example case scenario
Keywords ultra-wideband (UWB) liver implanted wireless communica-
tion path loss model transplanted liver monitoring
Classification Antennas and Propagation
References
[1] M N Ericson M A Wilson G L Coteacute J S Baba W Xu M Bobrek C LBritton M S Hileman M R Moore M S Emery and R LenarduzzildquoImplantable sensor for blood flow monitoring after transplant surgeryrdquo MinimInvasive Ther Allied Technol vol 13 no 2 pp 87ndash94 Apr 2004 DOI10108013645700410027866
[2] M I Prince and M Hudson ldquoLiver transplantation for chronic liver diseaseAdvances and controversies in an era of organ shortagesrdquo Postgrad Med Jvol 78 no 917 pp 135ndash141 Mar 2002 DOI101136pmj78917135
[3] T J Akl M A Wilson M N Ericson E Farquhar and G L Coteacute ldquoWirelessmonitoring of liver hemodynamics in vivordquo PLoS One vol 9 no 7p e102396 Jul 2014 DOI101371journalpone0102396
[4] A Khaleghi R Chaacutevez-Santiago and I Balasingham ldquoUltra-widebandstatistical propagation channel model for implant sensors in the human chestrdquoIET Microw Antennas Propag vol 5 no 15 pp 1805ndash1812 Dec 2011DOI101049iet-map20100537
[5] P A Floor R Chaacutevez-Santiago S Brovoll Oslash Aardal J Bergsland O-J H NGrymyr P S Halvorsen R Palomar D Plettemeier S-E Hamran T A
copy IEICE 2018DOI 101587comex2017XBL0164Received October 25 2017Accepted December 15 2017Publicized January 15 2018Copyedited March 1 2018
83
IEICE Communications Express Vol7 No3 83ndash88
Ramstad and I Balasingham ldquoIn-body to on-body ultra wideband propagationmodel derived from measurements in living animalsrdquo IEEE J Biomed HealthInform vol 19 no 3 pp 938ndash948 May 2015 DOI101109JBHI20152417805
[6] J Shi and J Wang ldquoChannel characterization and diversity feasibility for in-body to on-body communication using low-band UWB signalsrdquo Proc 3rdInternational Symposium on Applied Sciences in Biomedical and Communica-tion Technologies (ISABEL) Roma Italy pp 1ndash4 Nov 2010 DOI101109ISABEL20105702784
[7] H Bahrami S A Mirbozorgi L A Rusch and B Gosselin ldquoBiologicalchannel modeling and implantable uwb antenna design for neural recordingsystemsrdquo IEEE Trans Biomed Eng vol 62 no 1 pp 88ndash98 Jan 2015DOI101109TBME20142339836
[8] P Leelatien K Ito and K Saito ldquoWireless monitoring of transplanted organ atUWB rangerdquo IEICE Society Conference 2016 B-1-82 Sep 2016
[9] S Gabriel R W Lau and C Gabriel ldquoThe dielectric properties of biologicaltissues II Measurements in the frequency range 10Hz to 20GHzrdquo Phys MedBiol vol 41 no 11 pp 2251ndash2269 Apr 1996 DOI1010880031-91554111002
1 Introduction
Recently wireless implanted device is of an interest in the area of medicine for
healthcare monitoring and collecting biological parameters One of the promising
wireless implanted applications is physiological monitoring of transplanted organs
Nowadays organ transplantation has been continuously performed during medical
treatments [1] Particularly liver transplantation has become the primary clinical
treatment for end stage liver disorders [2] However the technical failure rate is
reported to be highest during the first two-week period after surgery [3] Conven-
tional techniques such as periodic blood testing and liver tissue biopsy do not offer
real-time and constant monitoring after organ transplantation and are often too slow
to respond to the potential loss of transplanted organ Being one of the most
common transplanted solid organs with only a limited number of organ donors this
strongly emphasizes the need to minimize liver transplantation failure [1]
Fig 1 demonstrates an example scenario for the wireless implanted monitoring
system Wireless implanted device positioned on the liver surface monitors and
transmits body parameters such as blood flow and oxygen saturation which are
predictors of transplanted liver function [3] to on-body node which acts as a
Fig 1 An overview of the wireless implanted monitoring system
copy IEICE 2018DOI 101587comex2017XBL0164Received October 25 2017Accepted December 15 2017Publicized January 15 2018Copyedited March 1 2018
84
IEICE Communications Express Vol7 No3 83ndash88
relay for wireless transmissions to personal devices or hospital servers This
application can provide a reliable method of instantaneous and continuous mon-
itoring to report the organ status of a patient to any healthcare staffs This early
detection should enable prompt medical operations before serious damage occurs to
the transplanted liver [1 3] Moreover together with future biodegradable materi-
als an implanted device will not need to be removed from a patient thus patient
risks will be reduced Eventually this will potentially improve the success rate of
liver transplantation
On the other hand it is important to select the appropriate frequency band of
wireless communications between the devices that is suitable to the specific
applications in consideration Ultra-wideband (UWB) technology is a favorable
option for wireless implanted applications [4] Due to its high frequency range the
physical size of implantable antennas can be significantly reduced Moreover since
it has a simplicity on the transmitter side this will lead to the miniaturization of
implanted devices Its low power consumption will extend the implanted device
longevity However at UWB range the signals encounter severe loss inside the
human body leading to the difficulty of system implementation Therefore it is
important to evaluate the characteristics of propagation channel at UWB range to
achieve reliable in-body wireless communication links There have been various
attempts to study UWB propagation channel at various locations inside human
body eg chest [4] abdomen [5 6] and brain [7] Nevertheless to the authorsrsquo
knowledge UWB channel characteristics at liver location for liver implanted
wireless monitoring system has not been reported in any open literature Hence
to this aim we performed experimental measurements using our developed
simplified multilayer human equivalent phantoms to obtain attenuation data and
proposed path loss model which would provide initial understandings of the
characteristics of liver implanted wireless communications using UWB channel [8]
2 UWB antenna and measurement setup
The antennas used as the on- and in-body antennas in our measurements were
Skycross UWB antennas (SMT-3TO10M-A) manufactured by Skycross Inc as
shown in Fig 2(a) Experimental measurements were conducted using multilayer
phantoms as illustrated in Figs 2(b) and 2(c) The measurement setup consisted of
the two Skycross UWB antennas (SMT-3TO10M-A) as shown in Fig 2(a) an
Agilent N5230C PNA-L vector network analyzer (VNA) two coaxial cables
connecting each antenna to port 1 and port 2 of the VNA and the human
equivalent semi-solid UWB phantoms of fat muscle and liver tissues The whole
size of phantoms was approximately 200mm 130mm 120mm The cablesrsquo
frequency response was subtracted from the channel measurements by the method
of VNA calibration A broadband measurement of phantom dielectric properties
was conducted to confirm their values compared to values reported in the work of
Gabriel et al [9]
S21 data within the frequency range of 3ndash5GHz for various distances between
the antennas in the measurements were recorded five times and averaged Our
measurements were set up as followed One antenna located on the liver surface
copy IEICE 2018DOI 101587comex2017XBL0164Received October 25 2017Accepted December 15 2017Publicized January 15 2018Copyedited March 1 2018
85
IEICE Communications Express Vol7 No3 83ndash88
under the muscle layer (referred to as in-body antenna) was at a fixed position while
the other antenna (referred to as on-body antenna) was placed directly on the fat
layer and moved from the beginning point (0mm) in steps of 20mm in each
measurement up to the ending point (100mm) Both antennas were placed in a
face-to-face orientation as presented in Fig 2(b)
3 Results
Firstly to confirm the performance of the antennas we recorded the S11 result of the
on-body antenna and the S22 result of the in-body antenna within the 3ndash5GHz
range as illustrated in Figs 3(a) and 3(b) respectively We can see that within the
considered frequency range the on-body antenna shows good behavior On the
other hand since this UWB antenna was originally designed for free space
utilization the performance of the in-body antenna is not good but is acceptable
for our research purpose here Subsequently with the in-body antenna at the fixed
position we moved the on-body antenna from the starting point (0mm) to the
ending point (100mm) and obtained experimental results of S21 parameter for
various separation distances between the in- and on-body antennas Then to
evaluate the signal attenuations inside the human body we later processed all
recorded S21 data from the measurements to obtain the path loss (PL) data of each
link as PL frac14 meanfjS21jg in decibels Consequently we obtained the path loss
model of the in-body channel as a function of the propagation distance by applying
linear fitting to the path loss data at all points The log-distance path loss model was
applied as the following expression
Fig 2 Measurement setup
copy IEICE 2018DOI 101587comex2017XBL0164Received October 25 2017Accepted December 15 2017Publicized January 15 2018Copyedited March 1 2018
86
IEICE Communications Express Vol7 No3 83ndash88
PLdBethdTHORN frac14 PL0dB thorn 10n log10d
d0
eth1THORN
where d is the separation distance in millimeters between the in- and on-body
antennas and d0 is the reference depth of implantation which is 40mm PL0 is the
path loss at the reference location d0 frac14 40mm The exponent n which is known
as path loss exponent can be used to evaluate how fast the signal power attenuates
with the distance Fig 3(c) shows the average path loss data collected from the
measurements as a function of the logarithmic antenna separation distances and the
linear fitting curve of the measured data In our case PL0 was 4795 dB The path
loss exponent which is the slope of the obtained fitting curve was 625
4 Conclusion
The propagation characteristics of in-body channels using UWB technology for
liver implanted wireless communications have been investigated for the first time
Fig 3 Measured results and path loss model
copy IEICE 2018DOI 101587comex2017XBL0164Received October 25 2017Accepted December 15 2017Publicized January 15 2018Copyedited March 1 2018
87
IEICE Communications Express Vol7 No3 83ndash88
by mean of experimental measurements using simplified multilayer human equiv-
alent phantoms This study provides important preliminary insights for liver
implanted wireless monitoring system The in-body path loss data for various
propagation distance values between the implanted and on-body antennas within
the 3ndash5GHz band obtained using measurement approaches were presented It was
found that path loss data were between 45 dB and 80 dB within 40mm and 100mm
propagation range approximately Our preliminary studies in this paper show that
the realization of liver implanted wireless monitoring system using UWB channel
in the example scenario case is possible Moreover our results reveal path loss data
for liver-skin surface communication channel which is a necessary parameter for
the design and evaluation of liver implanted wireless communication links The
information here can be used as guidelines for future studies of various in vivo
medical applications such as wireless implanted monitoring of organs and implant-
able drug delivery at precise targeted locations and would also encourage other
innovative applications utilizing UWB technology
For our future work due to the necessity to accurately characterize the in-body
wireless communication channel at liver location and to further confirm the
feasibility of liver implanted wireless monitoring system in the example scenario
case we will continue our further investigations using antennas designed for the
implantation at liver location In addition we will conduct simulations using
various digital human models as well as experimental measurements using realistic
human phantoms including liver and other internal organs around the liver area to
obtain insights of antenna performances and propagation channels for liver im-
planted wireless communications under more realistic environments
Acknowledgments
The authors would like to thank Dr Akram Alomainy Queen Mary University of
London for the useful discussions on the in-body wireless communications during
this research and AET Inc Japan for their supports on CST Microwave Studio
copy IEICE 2018DOI 101587comex2017XBL0164Received October 25 2017Accepted December 15 2017Publicized January 15 2018Copyedited March 1 2018
88
IEICE Communications Express Vol7 No3 83ndash88
Multi-slot and multi-user jointdetection scheme for CRDSAin satellite network
Yali Feng Guangliang Rena) and Huining ZhangState Key Laboratory of Integrated Service Networks Xidian University
Xirsquoan China
a) glrenmailxidianeducn
Abstract A multi-slot and multi-user detection scheme is presented for the
contention resolution diversity slotted ALOHA (CRDSA) in satellite net-
works The scheme can effectively resolve the deadlock loop of the collided
packets of J users in J slots and can be applied to DVB-RCS2 directly with a
little change on receiver The simulation results show the throughput of the
CRDSA with the proposed scheme can improve greatly when the PLR is at
0001 and has less latency compared with the conventional CRDSA
Keywords CRDSA satellite networks dead loop collided packets
Classification Satellite Communications
References
[1] M De Sanctis E Cianca G Araniti I Bisio and R Prasad ldquoSatellitecommunications supporting internet of remote thingsrdquo IEEE Internet Things Jvol 3 no 1 pp 113ndash123 2016 DOI101109JIOT20152487046
[2] E Casini R D Gaudenzi and O D R Herrero ldquoContention resolutiondiversity slotted ALOHA (CRDSA) An enhanced random access scheme forsatellite access packet networksrdquo IEEE Trans Wireless Commun vol 6 no 4pp 1408ndash1419 2007 DOI101109TWC2007348337
[3] R De Gaudenzi and O D R Herrero ldquoAdvances in random access protocolsfor satellite networksrdquo International Workshop on Satellite and SpaceCommunications IEEE pp 331ndash336 2009 DOI101109IWSSC20095286351
[4] G Liva ldquoGraph-based analysis and optimization of contention resolutiondiversity slotted ALOHArdquo IEEE Trans Commun vol 59 no 2 pp 477ndash4872011 DOI101109TCOMM2010120710100054
[5] P T Mathiopoulos E A Candreva A B Awoseyila V Dalakas D TarchiB G Evans A Vanelli-Coralli and G E Corazza ldquoPerformance improvementtechniques for the DVB-RCS2 return link air interfacerdquo Int J Satell CommunNetw vol 33 no 5 pp 371ndash390 2015 DOI101002sat1124
1 Introduction
Random access technique has attracted much more attentions in recent years which
can provide a large access capacity for the huge number of the machine to machine
(M2M) communication terminals with low latencies [1] Among the available RA
copy IEICE 2018DOI 101587comex2017XBL0169Received November 2 2017Accepted November 24 2017Publicized January 15 2018Copyedited March 1 2018
89
IEICE Communications Express Vol7 No3 89ndash94
techniques CRDSA [2] significantly enhances the throughput and the Packet Loss
Ratio (PLR) with the iterative interference cancellation at the demodulator and it
has been employed in the DVB-RCS2 standards However in the CRDSA the
collisions resolution with the interference cancelling (IC) depends on the clean
packets in the frame and it performs well only for the long frame with hundreds of
slots The so-called ldquodeadlock looprdquo increases as the channel load increases or the
number of slots in the frame decreases which greatly degrades the performance of
the CRDSA CRDSA++ and IRSA and other variants [3 4] are proposed to
mitigate the deadlock loop and further improve the throughput with the cost of
more replicas or additional signalling overhead However the deadlock loops still
exist and the power consumption of the user terminal is also highly increasing
By analysing the remained collided packet signals after the IC processing in the
CRDSA at the access point we model the collided packets of J users in the J slots
one of the deadlock loops as a new multiple inputs and multiple outputs (MIMO)
signal model and propose a multi-slot and multi-user joint detection (MMJD)
scheme to recover the packets of J users It can improve the throughput of the
CRDSA without any modification and increasing the power consumption at the
user terminal and is independence on the clean packets and is also suitable for the
short frame with several tens of slots which can reduce the latency of the user data
compared with the conventional CRDSA
2 Proposed method
21 Signal model
A typical satellite random access system with the CRDSA is considered and there
are M terminals try to access the common channel in the frame with Nslot slots By
taking advantage of the broadcasting signal in the satellite network the user
terminal employs the time advance (TA) and frequency offset pre-compensation
to synchronize in the uplink Suppose the transmitted complex data of the packet of
the uth user terminal in the slot is sethuTHORN frac14 diagfrac12sethuTHORNeth1THORN sethuTHORNeth2THORN sethuTHORNethLTHORN where L is
the number of the symbols The uth user terminal randomly selects the slots to send
the packets according the CRDSA protocol If there are packets of K users which
are sent on the jth slot the discrete complex received signals can be described as
yj frac14XK
ufrac141hethuTHORNj sethuTHORN thorn wj eth1THORN
where yj frac14 frac12yjeth1THORN yjeth2THORN yjethLTHORNT hethuTHORNj frac14 frac12hethuTHORNj eth1THORN hethuTHORNj eth2THORN hethuTHORNj ethLTHORNT is the
complex channel vector between the uth user terminal and the access point during
the j slot wj and is the zero mean and covariance matrix with EfwjwHj g frac14 2wIL
and IL is the identical matrix with L order
22 Multi-slot and multi-user joint detection scheme
At the access point in the satellite network the received packets signal of the frame
is firstly processed as that in the CRDSA which searches the clean packets and
recovers the corrupted packets with the interference cancellation (IC) processing
After the IC processing there are still remained many corrupted packets on the slots
when the channel load is high This is because the collided packets of the different
copy IEICE 2018DOI 101587comex2017XBL0169Received November 2 2017Accepted November 24 2017Publicized January 15 2018Copyedited March 1 2018
90
IEICE Communications Express Vol7 No3 89ndash94
users are in the formation of the deadlock loops By analysing packets of the
deadlock loops we find that the probability of the packets of J users colliding on
the J slots is high where J is less than the slot number of the frame To resolve the
loop and recover the packets of J users we firstly model the received signals of the
J slots and then present the data recovery method
In the deadlock loop of the packets of J users colliding on J slots the indexes of
the slots and users are written as j1 j2 jJ and u1 u2 uJ respectively By
Eq (1) the received signals of J slots can be given as
yj1
yji
yjJ
2
66666664
3
77777775
frac14
hethu1THORNj1 hethuiTHORNj1
hethuJTHORNj1
hethu1THORNji hethuiTHORNji
hethuJTHORNji
hethu1THORNjJ hethuiTHORNjJ
hethuJTHORNjJ
2
666666664
3
777777775
sethu1THORN
sethuiTHORN
sethuJTHORN
2
66666664
3
77777775
thorn
wj1
wji
wjJ
2
66666664
3
77777775
eth2THORN
where the frac12hethuiTHORNj1hethuiTHORNj2
hethuiTHORNjJT in the channel matrix is the channel vector
between the uthi user terminal and the access point on the different slots and the
elements are zero except the channel elements on the selected slots that the uthi user
terminal transmitted the packets It is also noted that the nonzero channel elements
in the channel matrix can be estimated by the preambles of the packets and the
channel matrix is a sparse matrix For the received vector in the J slots the kth
received symbol vector is
YJk frac14 frac12yj1ethkTHORN yjiethkTHORN yjJ ethkTHORNT frac14 HJkSJk thornWJk
frac14
hethu1THORNj1ethkTHORN hethuiTHORNj1
ethkTHORN hethuJTHORNj1ethkTHORN
hethu1THORNjiethkTHORN hethuiTHORNji
ethkTHORN hethuJTHORNjiethkTHORN
hethu1THORNjJethkTHORN hethuiTHORNjJ
ethkTHORN hethuJTHORNjJethkTHORN
2
66666664
3
77777775
sethu1THORNethkTHORN
sethuiTHORNethkTHORN
sethuJTHORNethkTHORN
2
66666664
3
77777775
thorn
wj1ethkTHORN
wjiethkTHORN
wjJ ethkTHORN
2
66666664
3
77777775
eth3THORN
From the Eq (3) it is seen that the received signal model during the kth symbol
period is a MIMO signal model The model can be dubbed the multi-slot and multi-
user joint MIMO signal model Therefore many MIMO detection algorithms can
be used to recover the data of the J symbols of the J users
To recover the packets of J users effectively we employ a soft MIMO detection
algorithm to give the soft information of the coded bits in the symbols and the soft
decoders are employed to decode the bits of the J users The multi-slot and multi-
user joint detection (MMJD) scheme is shown in Fig 1 The received signals of
the J slots are input to the MMJD detector If the complex symbol in Eq (3)
contains Q coded bits which can be described as cethuiTHORNk frac14 frac12cethuiTHORNk1 cethuiTHORNkq c
ethuiTHORNkQ
the log-likelihood ratio (LLR) in Fig 1 can be represented as
LLRethcethuiTHORNkq THORN frac14 lnpethcethuiTHORNkq frac14 1jYJkTHORNpethcethuiTHORNkq frac14 0jYJkTHORN
eth4THORN
By using Eq (4) the MMJD detector output the soft information of the coded
bits of the J packets which are input to the corresponding de-interleavers and soft-
copy IEICE 2018DOI 101587comex2017XBL0169Received November 2 2017Accepted November 24 2017Publicized January 15 2018Copyedited March 1 2018
91
IEICE Communications Express Vol7 No3 89ndash94
decoders The soft-decoders output the bits of the J users The transmitted data of
the J users can be recovered from the collided packet signals in the J slots
23 Algorithm for CRDSA with MMJD
The MMJD scheme can effectively resolve the collided packets of J users on the J
slots one of the deadlock loops in the CRDSA Its algorithm to process the
received signals is described as follow
Algorithm for CRDSA with MMJD
Initialization
Set the number of the clean packets the number of loop the initial number of users
in the loop and the number of all the slots in the frame as Nclean frac14 0 Nloop frac14 0
J frac14 2 and Nslot respectively Initialize the clean packet index set Pindex and the loop
index set Ploop to the empty sets
START
1) Scan and search the clean packets in all the slots in the frame and set Nclean frac14the number of clean packets and Pindex frac14 findexes of cleans packetsg
2) If Nclean ne 0 get the indexes of the clean packets from the set Pindex demodulate
the clean packets else go to 4)
3) Using the demodulated data of the clean packets reconstruct the signals of their
replicas and cancel them from the collided packets signals go to 1)
4) Scan and search the loop of the packets of the J users in the J slots in the
remained signals set Nloop frac14 the number of loops and Ploop = findexes of theloopsg
5) If Nloop ne 0 get the indexes of the loops from the set Ploop use the MMJD
scheme to demodulate the packets of J users
6) Increase J if J lt Nslot thorn 1 go to 4) else go to 7)
7) End
3 Simulation results
In the simulation the SC-FDMA packet with preamble and pilots in [5] and the
3GPP turbo code are employed at the user terminal the channel model is ITU-R
M1225 and the perfect power control is assumed The frame size of 100 slots is
used The traffic of user terminal is modeled as Poisson traffic sources and transmits
fixed copies of packets (2 or 3) at random selected slots during a frame according
to the CRDSA An open loop transmission scheme is assumed that is there is no
re-transmission or congestion control in simulation
Fig 1 Multi-slot and multi-user joint detection scheme
copy IEICE 2018DOI 101587comex2017XBL0169Received November 2 2017Accepted November 24 2017Publicized January 15 2018Copyedited March 1 2018
92
IEICE Communications Express Vol7 No3 89ndash94
Fig 2 shows the packet error rate (PER) curves of two detection methods It
can be found that the PLR of the MMJD is better than that of the detection of the
clean packets because the user packet and its replicas are all used in the MMJD and
only one packet of the user is employed in the detection of the clean packets
Fig 3(a) shows the throughput of the CRDSAwith and without MMJD versus
channel load It is seen that the throughput peak of CRDSA-2 with MMJD is higher
6 than the CRDSA-2 and the CRDSA-3 with MMJD is higher 232 than the
CRDSA-3
Fig 3(b) shows PLR of the CRDSA with and without MMJD versus channel
load It is seen that the PLR of the CRDSA with MMJD is lower than that of the
CRDSA At the PLR frac14 103 the channel loads of the CRDSA-2 without and with
MMJD are 0055 and 035 respectively and those of the CRDSA-3 without and
with MMJD are 055 and 08 respectively So the MMJD scheme can improve the
channel load 64 and 15 times for the CRDSA-2 and CRDSA-3 respectively
31 Conclusion
By using proposed multi-slot and multi-user detection algorithm some of the
deadlock loops in the collided packets can be solved effectively The proposed
scheme can be applied to DVB-RCS2 directly with a little change on receiver
Fig 2 Packet error rate of two detection methods
(a) (b)
Fig 3 (a) Throughput of the CRDSA with and without MMJD(b) PLR of the CRDSA with and without MMJD
copy IEICE 2018DOI 101587comex2017XBL0169Received November 2 2017Accepted November 24 2017Publicized January 15 2018Copyedited March 1 2018
93
IEICE Communications Express Vol7 No3 89ndash94
improve the throughput and reduce the latency of the return link by using short
frame size effectively
Acknowledgements
This work was supported in part by National Natural Science Foundation of China
(grant No 91538105) and the National Basic Research Program of China (973
Program 2014CB340206)
copy IEICE 2018DOI 101587comex2017XBL0169Received November 2 2017Accepted November 24 2017Publicized January 15 2018Copyedited March 1 2018
94
IEICE Communications Express Vol7 No3 89ndash94
Wideband shieldingeffectiveness of laminatedsheet using copper andmagnetic materials
Dai Sakamoto1a) Akihisa Tsuchiya2 Ryosuke Suga1b)Hideaki Sugama2 and Osamu Hashimoto11 Department of Electrical and Electronics Engineering Aoyama Gakuin University
5ndash10ndash1 Fuchinobe Chuo-ku Sagamihara-shi Kanagawa 252ndash5258 Japan2 Kanagawa Institute of Industrial Science and Technology
705ndash1 Shimoimaizumi Ebina-shi Kanagawa 243ndash0435 Japan
a) sakamotoeeaoyamaacjp
b) rsugaeeaoyamaacjp
Abstract This paper presents conditions of a laminated sheet composed of
copper and magnetic sheets for obtaining wideband shielding effectiveness
below 10MHz The following two conditions are clarified (1) the optimum
thickness ratio of the copper sheet to the laminated sheet is 05ndash07 (2) the
loss factor (tan δ) of the relative permeability of the magnetic sheet is above 1
for increasing reflection losses of the laminated sheet These conditions are
validated by measuring the shielding effectiveness of the laminated sheet
The shielding effectiveness of the laminated sheet is higher than that of the
copper sheet in the frequency from 01MHz to 10MHz
Keywords radiation noise shielding sheet lamination
Classification Electromagnetic Compatibility (EMC)
References
[1] B K Bose ldquoThe past present and future of power electronicsrdquo IEEE IndElectron Mag vol 3 no 2 pp 7ndash14 June 2009 DOI101109MIE2009932709
[2] A Dutta and S S Ang ldquoElectromagnetic interference simulations for wide-bandgap power electronic modulesrdquo IEEE J Emerg Sel Topics PowerElectron vol 4 no 3 pp 757ndash766 Sep 2016 DOI101109JESTPE20162573315
[3] C Abbate and R D Folco ldquoModelling and analysis of EMI generated of powerIGBT modulesrdquo Universal J of Electrical and Electronic Engineering vol 3pp 49ndash54 2015 DOI1013189ujeee2015030203
[4] J R Moser ldquoLow-frequency shielding of a circular loop electromagnetic fieldsourcerdquo IEEE Trans Electromagn Compat vol 9 no 1 pp 6ndash18 Mar 1967DOI101109TEMC19674307447
[5] S Tang and R Hui ldquoEvaluation of the shielding effects on printed-circuit-boardtransformers using ferrite plates and copper sheetsrdquo IEEE Trans PowerElectron vol 17 no 6 pp 1080ndash1088 Nov 2002 DOI101109TPEL2002805585
copy IEICE 2018DOI 101587comex2017XBL0178Received November 16 2017Accepted December 13 2017Publicized January 15 2018Copyedited March 1 2018
95
IEICE Communications Express Vol7 No3 95ndash100
[6] K Yamada M Ishida S Yutaka and M Yamaguchi ldquoHigh-performancelaminated thin-film shield with conductors magnetic material multilayerrdquo IEEEInternational Symposium on Electromagn Compat pp 432ndash437 2011DOI101109ISEMC20116038350
[7] T Matsubara A Nishikata Y Shimizu and Y Yamanaka ldquoCalculation modelsfor a magnetic shielding effectiveness measuring instrumentrdquo IEICE Tech RepEMCJ99-105 vol 51 no 3 pp 27ndash34 Dec 1992 (in Japanese)
[8] B Li and T Oya ldquoFabrication of novel electromagnetic shielding sheetsusing carbon-nanotube-composite paperrdquo e-J Surf Sci Nanotech E vol 12pp 242ndash246 May 2014 DOI101380ejssnt2014242
[9] The homepage of ANSYS Corporation [Online] Available httpwwwansyscomja-jpproductselectronicsansys-hfss
1 Introduction
Clean power generation is demanded owing to increasing energy consumption and
greenhouse gas emission [1] Power electronics equipment such as electric vehicles
and photovoltaic power systems are expected as the technologies to meet the
demand Recently switching frequencies of power semiconductors in the equip-
ment have been increasing for the higher power conversion efficiency Accordingly
the switching devices radiate high frequency and wideband noise whose levels are
so high [2 3] The semiconductors such as insulated gate bipolar transistor (IGBT)
and metal-oxide-semiconductor field-effect transistor (MOSFET) operate in low
frequency (LF 30ndash300 kHz) band and the noise frequencies are up to high
frequency (HF 3ndash30MHz) band Currently electromagnetic compatibility stand-
ards for radiation noises do not cover below 30MHz but suppression of the
radiation noises is needed because of the above reason
Metallic materials are mostly used for suppressing the radiation noises from LF
and HF bands Although the materials should be thin for workability and function-
ality the materials are required to be thick for shielding magnetic field effectively in
the wideband frequency [4] The authors focus on laminated sheets to solve the
above problem Laminated sheets which are composed of copper and magnetic
materials are expected to obtain higher shielding effectiveness than that of the
metallic materials [5 6] However optimum conditions of laminated sheets for
obtaining wideband shielding effectiveness from LF to HF bands were not reported
This paper presents optimum conditions of a laminated sheet for obtaining
wideband shielding effectiveness below 10MHz and discusses the thickness ratio of
the copper sheet to the laminated sheet and the relative permeability of the magnetic
sheet Since material thicknesses are quite thin against the wavelength in the above
target frequency attenuation losses of the laminated sheet are negligibly small
Therefore the discussion is focused on reflection losses of the laminated sheet
2 Shielding effectiveness analysis
21 Evaluation method
Fig 1 shows (a) a magnetic shield measurement system called Kansai Electronic
Industry Development Center (KEC) method [7 8] and (b) its electromagnetic
copy IEICE 2018DOI 101587comex2017XBL0178Received November 16 2017Accepted December 13 2017Publicized January 15 2018Copyedited March 1 2018
96
IEICE Communications Express Vol7 No3 95ndash100
simulation model As shown in Fig 1(a) this system is composed of two shielded
loop antennas embedded in two metal cavities A part of the antenna is arranged in
the center of metal cavity and a shielding sheet is set in between the cavities A
signal generator a spectrum analyzer and an amplifier are used for the measure-
ment Shielding effectiveness is defined as the received power normalized to that
without shielding sheet As shown in the Fig 1(b) the shielded loop antennas and
the metal cavity are modeled for the simulation that 3D electromagnetic simulator
HFSS [9] is used The ends of each shielded loop antenna are terminated with 50Ω
22 Evaluation results
First a shielding effectiveness of a laminated sheet is simulated in order to clarify
the optimum thickness ratio of the copper sheet to the laminated sheet The
laminated sheet of which the total thickness is 53 microm is composed of copper
(conductivity 58 107 Sm) and magnetic sheets Here real part 0r and imaginary
part 00r of the relative permeability of the magnetic sheet are assumed to be 1000
and 0 respectively Fig 2(a) shows the shielding effectiveness against the thickness
(a) Measurement system
(b) Electromagnetic simulation model
Fig 1 KEC method to evaluate shielding effectiveness
copy IEICE 2018DOI 101587comex2017XBL0178Received November 16 2017Accepted December 13 2017Publicized January 15 2018Copyedited March 1 2018
97
IEICE Communications Express Vol7 No3 95ndash100
ratio of the copper sheet to the laminated sheet The thickness ratio at maximum
shielding effectiveness is also shown with large symbols in the Fig 2(a) The
shielding effectiveness decreases with decreasing frequency therefore improving
the shielding effectiveness in the lower frequency is required The thickness ratio at
the maximum shielding effectiveness is 05ndash07 in the frequency from 01MHz to
10MHz and the shielding effectiveness at 01MHz is 7 dB higher than that of
copper sheet Therefore the optimum ratio of the copper sheet to laminated sheet is
05ndash07 for obtaining wideband shielding effectiveness
Secondly the relative permeability of the magnetic sheet is treated The thick-
ness of the copper sheet is set to 35 microm (total thickness of 53microm) to satisfy the
optimum thickness condition Fig 2(b) shows the shielding effectiveness of the
laminated sheet against 0r at 00r frac14 0 The shielding effectiveness of copper sheet
with 53 microm thickness is also shown for comparison The shielding effectiveness
increases with increasing 0r This result means the reflection loss contributes to the
shielding effectiveness The color values in Fig 2(b) indicate 0r at the intersectionpoints of the shielding effectiveness of the laminated sheet and that of the copper
sheet The values are minimum conditions of the magnetic sheet for obtaining
higher shielding effectiveness than that of the copper sheet Fig 2(c) shows the
shielding effectiveness of laminated sheet against tan (frac14 00r=0r) The shielding
(a) Shielding effectiveness against thickness ratio of copper sheet to laminated sheet
(b) Shielding effectiveness of laminated sheetagainst μrsquo
r at μrdquor = 0
(c) Shielding effectiveness of laminated sheetagainst tanδ
Fig 2 Simulated shielding effectiveness of laminated sheet
copy IEICE 2018DOI 101587comex2017XBL0178Received November 16 2017Accepted December 13 2017Publicized January 15 2018Copyedited March 1 2018
98
IEICE Communications Express Vol7 No3 95ndash100
effectiveness increases drastically as tan of the magnetic sheet exceeds 1 In order
to interpret the simulated results the relationship between tan of the magnetic
sheet and the reflection loss of the laminated sheet is examined Characteristic
impedance ZS of a material is expressed by Eq (1)
ZS frac14ffiffiffiffiffiffiffiffiffiffiffiffiffiffiffiffiffij
thorn j
seth1THORN
where σ μ and ε are the conductivity permeability and permittivity of the material
and ω is the angular frequency On the assumption that frac14 0 and ε is constant the
real part of ZS is given by Eq (2) Here Z0 is impedance of free spaces
ReethZSTHORN frac14 Z0
ffiffiffiffiffiffiffiffiffiffiffiffiffiffiffiffiffiffiffiffiffiffiffiffiffiffiffiffiffiffiffiffiffiffiffiffiffiffiffiffiffir 0
2eth1 thorn
ffiffiffiffiffiffiffiffiffiffiffiffiffiffiffiffiffiffiffi1 thorn tan2
pTHORN
reth2THORN
Eq (2) exhibits the drastic increase in ZS with tan above 1 The high shielding
effectiveness is due to increasing the reflection loss by the impedance mismatch
between the low-impedance copper sheet and high-impedance magnetic sheet
Therefore the magnetic sheet with tan over 1 should be selected for increasing
the reflection loss of the laminated sheet
3 Measurements
Shielding effectiveness of the laminated sheet is measured to validate the above
discussions From the conditions obtained in previous section the magnetic sheet
of amorphous ribbon containing iron as a main component is selected Thickness
of the magnetic sheet is 18 microm Fig 3 shows (a) 0r and (b) tan of the magnetic
sheet The conditions of relative permeability of the magnetic sheet are also shown
with dotted lines The 0r is smaller than the conditions over 4MHz but the
laminated sheet would have higher shielding effectiveness than the copper sheet
because its tan meet the conditions in the frequency from 01MHz to 10MHz
Fig 3(c) shows the measured and simulated shielding effectiveness of the lami-
nated sheet The shielding effectiveness of the copper sheet with 53 microm thickness is
also shown for comparison The measurement results are consistent with the
simulation within 5 dB errors The shielding effectiveness of the laminated sheet
at 01MHz is 26 dB higher than that of the copper sheet Additionally the shielding
effectiveness of the laminated sheet is higher than that of the copper sheet in the
frequency from 01MHz to 10MHz The conditions are validated by the measure-
ment results
copy IEICE 2018DOI 101587comex2017XBL0178Received November 16 2017Accepted December 13 2017Publicized January 15 2018Copyedited March 1 2018
99
IEICE Communications Express Vol7 No3 95ndash100
4 Conclusions
This paper presents conditions for obtaining wideband shielding effectiveness of
the laminated sheet below 10MHz by using electromagnetic simulation As a
result the following conditions were clarified (1) the optimum thickness ratio of
the copper sheet to the laminated sheet is 05ndash07 (2) tan of the relative
permeability of the magnetic sheet is above 1 for increasing reflection losses of
the laminated sheet To validate the above discussions the shielding effectiveness
of the laminated sheet satisfying these conditions was measured As a result the
shielding effectiveness of the laminated sheet at 01MHz was 26 dB higher than
that of the copper sheet Moreover the shielding effectiveness of the laminated
sheet is higher than that of the copper sheet in the frequency from 01MHz to
10MHz Therefore the conditions were validated by the measurement results
Acknowledgments
This work is partially supported by MEXT-Supported Program for the Strategic
Research Foundation at Private Universities 2013ndash2017 (Ministry of Education
Culture Sports Science and Technology)
(a) μrsquor of the magnetic sheet (b) tanδ of the magnetic sheet
(c) Measured shielding effectiveness of laminated sheet
Fig 3 Relative permeability of the magnetic sheet and the measure-ment results
copy IEICE 2018DOI 101587comex2017XBL0178Received November 16 2017Accepted December 13 2017Publicized January 15 2018Copyedited March 1 2018
100
IEICE Communications Express Vol7 No3 95ndash100
Numerical study on arotationally-symmetricaldipole array antenna positionfor a MIMO full-duplex system
Yoshiyuki Yamamoto1a) Masakuni Tsunezawa2 Kentaro Murata3Naoki Honma2 and Qiang Chen11 Graduate School of Engineering Tohoku University
6ndash6ndash5 Aramakiaza-Aoba Aoba-ku Sendai Miyagi 980ndash8579 Japan2 Graduate School of Engineering Iwate University
4ndash3ndash5 Ueda Morioka Iwate 020ndash8551 Japan3 Graduate School of Engineering National Defense Academy
1ndash10ndash20 Hashirimizu Yokosuka Kanagawa 239ndash8686 Japan
a) yamamoto-yeceitohokuacjp
Abstract In this letter a rotationally-symmetrical array (RSA) arrange-
ment of a receiving dipole array antenna is optimized to maximize the
performance of the null-beamforming method for the suppression of self-
interference The optimum RSA for a receiving dipole array with four
elements is clarified Through numerical simulations we found that the
optimized RSA arrangement suppressed the self-interference significantly
Keywords MIMO full-duplex self-interference antenna arrangement
null-beamforming
Classification Antennas and Propagation
References
[1] J I Choi M Jain K Srinivasan P Levis and S Katti ldquoAchieving singlechannel full duplex wireless communicationrdquo Proc 2010 ACM MobiCompp 1ndash12 Sep 2010
[2] I E Telatar ldquoCapacity of multi-antenna Gaussian channelsrdquo Tech Rep ATampT-Bell Labs June 1995
[3] D Bharadia E McMilin and S Katti ldquoFull-duplex radiosrdquo Proc ACMSIGCOMM Comp Commun Rev pp 375ndash386 Oct 2013
[4] S Zhou and G B Giannakis ldquoOptimal transmitter eigen-beamforming andspace-time block coding based on channel mean feedbackrdquo IEEE Trans on SigProc vol 50 no 10 pp 2599ndash2613 Oct 2002 DOI101109TSP2002803355
[5] Y Yamamoto R Takahashi M Tsunezawa N Honma and K MurataldquoExperimental evaluation of interference reducation effect Eigen-beamformingand digital subtraction by using MIMO-OFDM signalsrdquo IEICE CommunExpress vol 6 no 2 pp 71ndash76 Feb 2017 DOI101587comex2016XBL0175
[6] M Tsunezawa N Honma K Takahashi K Murata and K NishimorildquoRotationally-symmetrical array for self-interference reduction in full-duplex
copy IEICE 2018DOI 101587comex2017XBL0182Received November 25 2017Accepted December 22 2017Publicized January 15 2018Copyedited March 1 2018
101
IEICE Communications Express Vol7 No3 101ndash106
MIMOrdquo IEICE Commun Express vol 6 no 6 pp 363ndash368 Jun 2017DOI101587comex2016SPL0040
1 Introduction
Full-duplex system and multiple-input multiple-output (MIMO) technology are
promising technologies that can improve communication capacity without using
additional frequency bands [1 2] The full-duplex system enables simultaneous two-
way wireless communication in the same frequency band while the MIMO tech-
nology improves frequency utilization efficiency using multiple antennas The
combination of the MIMO technology and the full-duplex system is called the
MIMO full-duplex system However it is well-known that the full-duplex system
suffers from the so-called self-interference [3] The self-interference problem leads
to the saturation of the radio frequency (RF) front-end because the level of the
transmitting signal is considerably higher than that of the receiving signal Con-
sequently the RF front-end suffers from undesired nonlinearity and can be damaged
In addition the eigen-beamforming (EBF) method is a technique to improve the
communication quality by controlling the radiation pattern at the transmitter side
using transmission weight vector [4] The control of the radiation pattern at the
transmitter side can be also effective in circumventing the self-interference because
the interference cannot reach the receiving antennas ideally The null-beamforming
(NBF) method is defined as the EBF method used to suppress self-interference
using transmission weight vectors obtained by singular value decomposition (SVD)
of the self-interference channel [5] The performance of the NBF method is strongly
affected by the nature of self-interference channel in terms of spatial correlation In
general high spatial correlation leads to higher performance of the NBF method
Previously an array antenna arrangement such as rotationally-symmetrical
array (RSA) has been proposed to increase the spatial correlation and improve
the performance of the NBF method [6] In RSA the NBF method can considerably
suppress the self-interference if all antennas are point wave sources However the
actual antenna has mutual coupling from other antennas
Due to the highly symmetric arrangement of the RSA the self-interference
can be suppressed but the influence of asymmetry of mutual coupling between the
array antenna elements can negatively impact its performance The mutual coupling
between the array antenna depends on the position of the array antenna
In this letter the receiving antenna arrangement for the RSA is optimized from
the viewpoint of self-interference channel between the transmitting and receiving
array antenna elements Both transmitting and receiving antennas are array antenna
consisting of four-element dipole antennas
2 Antenna arrangement suitable for NBF method
Fig 1 shows a system model of our proposed MIMO full-duplex system N and M
are the number of transmitting antenna (Tx) and receiving antenna (Rx) respec-
tively H is the self-interference channel i is the i-th singular value of H in
copy IEICE 2018DOI 101587comex2017XBL0182Received November 25 2017Accepted December 22 2017Publicized January 15 2018Copyedited March 1 2018
102
IEICE Communications Express Vol7 No3 101ndash106
descending order and vi is the i-th transmission weight vector obtained by SVD of
H By arranging the array antenna so that the rank of H becomes 1 the singular
values other than the first singular value degenerate The NBF method uses the
transmission weight vectors excluding the first singular value The magnitude of
the self-interference channel norm using NBF method is given by
kH ~V1k2F frac14XminethMNTHORN
ifrac1422i eth1THORN
where ~V1 is the transmission weight matrix excluding the first singular value~V1 frac14 frac12v2 vN This means that Tx weighted by ~V1 forms a null in Rx direction
to suppress 1 using the NBF method
Fig 2 shows the antenna arrangement to gain high spatial correlation The Tx
linear array is located on the z-axis The Rx circular array is located on the
circumference around the z-axis D is the distance from the end of the Tx array
to the origin of the Rx array de is the element spacing of the Tx array and re is the
radius in the Rx array We assume that all antennas are point wave sources and there
is no mutual coupling
In RSA Line-of-sight paths from the arbitrary transmitting element to all of Rx
elements are the same strength and phase because the distance between an arbitrary
transmitting point and all of receiving point wave sources are equal Therefore all
elements in each column vector of the self-interference channel matrix H are
identical and the rank of self-interference channel H equals 1
The self-interference power Pw=NBF and Pw=oNBF are defined as
Fig 1 System model
copy IEICE 2018DOI 101587comex2017XBL0182Received November 25 2017Accepted December 22 2017Publicized January 15 2018Copyedited March 1 2018
103
IEICE Communications Express Vol7 No3 101ndash106
Pw=NBF frac14 P
N 1
XminethMNTHORN
ifrac1422i eth2THORN
Pw=oNBF frac14 P
N
XminethMNTHORN
ifrac1412i eth3THORN
where P is the sum of the transmission power The singular value of the self-
interference channel becomes 0 except for first singular value if the rank of H is 1
Therefore the self-interference power with and without NBF method are
Pw=NBF frac14 0 and Pw=oNBF frac14 P21=N Therefore the NBF method can suppress the
self-interference by excluding only the first singular value
However the gain of each Rx antenna varies if the mutual coupling of the Rx
array antenna is asymmetric due to the mutual coupling among Rx In this letter the
symmetry of the mutual coupling of the RSA antenna is evaluated from the
magnitude of the mutual coupling of each Rx antenna
3 Numerical analysis results
31 Simulation setup
The antenna arrangement used for numerical analysis is shown in Fig 2 The
antenna is a half-wavelength dipole antenna The distance from the end of the Tx
array to the origin of the Rx array the element spacing of the Tx array and the
Fig 2 Antenna arrangement
copy IEICE 2018DOI 101587comex2017XBL0182Received November 25 2017Accepted December 22 2017Publicized January 15 2018Copyedited March 1 2018
104
IEICE Communications Express Vol7 No3 101ndash106
radius of the Rx array are set to D frac14 10 de frac14 05 and re frac14 05 respectively
(λ wavelength in a vacuum) e is the rotation angle of the receiving antennas
moving in the direction from x-axis to y-axis In this numerical analysis we
changed the rotation angle e from 0deg to 90deg
32 Simulation results
Fig 3(a) shows the singular value characteristics The first singular value was
almost the same at all rotation angles the second singular value become smaller as
it approaches e frac14 45deg We found that the second singular value at e frac14 45deg was at
maximum 48 dB lower than that at e frac14 0deg From the results we found that the
spatial correlation become higher as approach at e frac14 45deg
Fig 3(b) shows the mutual coupling of the Rx antenna versus rotation angle
The mutual coupling of i-th Rx antenna Ci is given as
Ci frac14XN
kfrac141jSikj2 ethi ne kTHORN eth4THORN
where Sik is S-parameter from k-th Rx antenna to i-th Rx antenna The mutual
coupling difference of each Rx antenna become smaller as it approaches e frac14 45deg
In particular all mutual coupling at e frac14 45deg were almost equal The sum of mutual
Fig 3 Simulation results
copy IEICE 2018DOI 101587comex2017XBL0182Received November 25 2017Accepted December 22 2017Publicized January 15 2018Copyedited March 1 2018
105
IEICE Communications Express Vol7 No3 101ndash106
coupling from the adjacent antenna (e 90deg) is equal if the directivity of the
RSA antenna is point-symmetric Therefore Ci is affected by the mutual coupling
of the diagonal RSA antenna (e thorn 180deg) The dipole antenna is omnidirectional
on the xz-plane perpendicular to the element axis (y-axis) and forms a null at the
end of element on the xy-plane Thus the mutual coupling C1 and C3 were large
and C2 and C4 were small at e frac14 0deg However mutual coupling between Rx
antennas at e frac14 45deg were almost equal because the mutual coupling of the dipole
antennas on the diagonal was equal Therefore the mutual coupling at e frac14 45deg was
symmetrical
Fig 3(c) shows the self-interference power versus rotation angle The self-
interference power without NBF method (Pw=oNBF) was minus37 dB at all rotation
angles In other hand the self-interference power with NBF method (Pw=NBF)
was suppressed by more than 95 dB at all rotation angles In particular the self-
interference power was suppressed by 143 dB at e frac14 45deg This shows that the NBF
method at e frac14 45deg suppresses the self-interference significantly because the self-
interference channel including the influence of mutual coupling was symmetrical
4 Conclusions
Numerical analysis confirmed that the self-interference power with NBF method
varies with the rotation angle of the receiving dipole array antenna of RSA The
self-interference power was changed according to the rotation angles because the
mutual coupling of the receiving dipole array antennas alters the symmetry The
self-interference power with NBF method (Pw=NBF) was suppressed by 143 dB at
e frac14 45deg Therefore we found that the most efficient arrangement of the dipole
array antenna in RSA is at e frac14 45deg
Acknowledgments
This research and development work was supported by the MICSCOPE
155002002
copy IEICE 2018DOI 101587comex2017XBL0182Received November 25 2017Accepted December 22 2017Publicized January 15 2018Copyedited March 1 2018
106
IEICE Communications Express Vol7 No3 101ndash106
Errata
The following editorial correction has been found in Vol 6 No 9 and should be
corrected as follows
Wrong
p 517 (in Fig 2)
time interval = 800 s
Correct
time interval = 4ms
copy IEICE 2018DOI 101587comex2018XBL8001
Published March 1 2018
107
IEICE Communications Express Vol7 No3 107
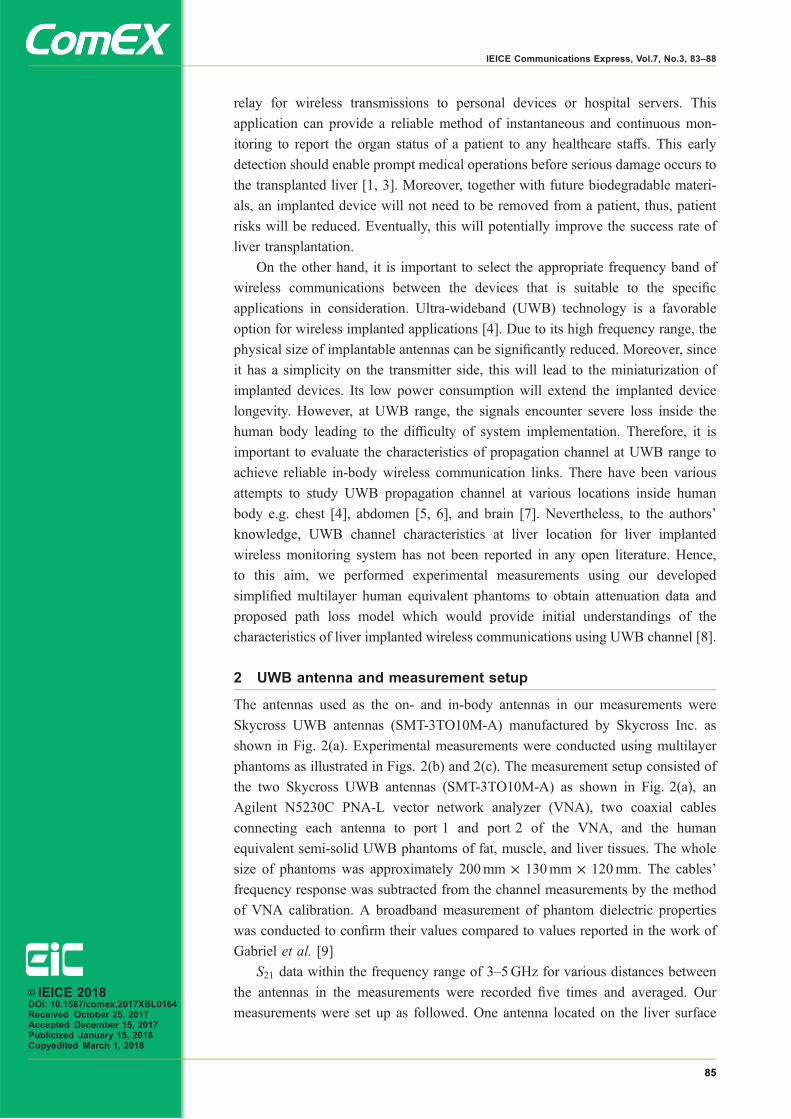
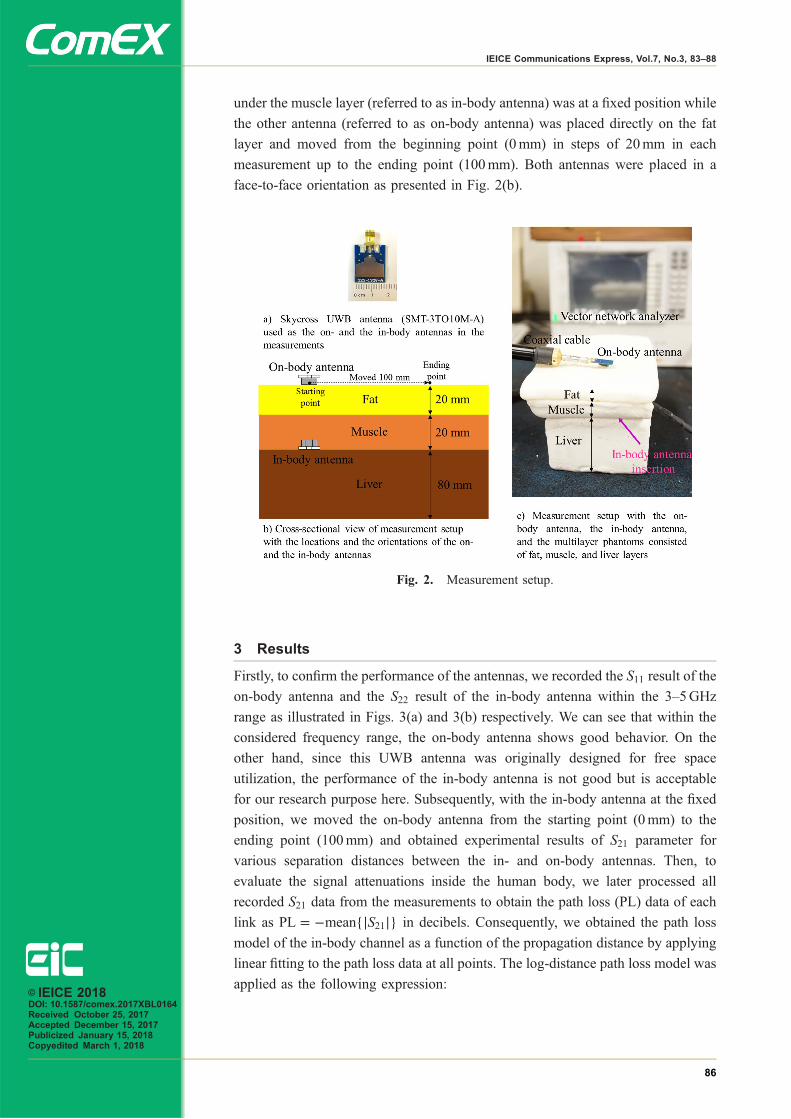
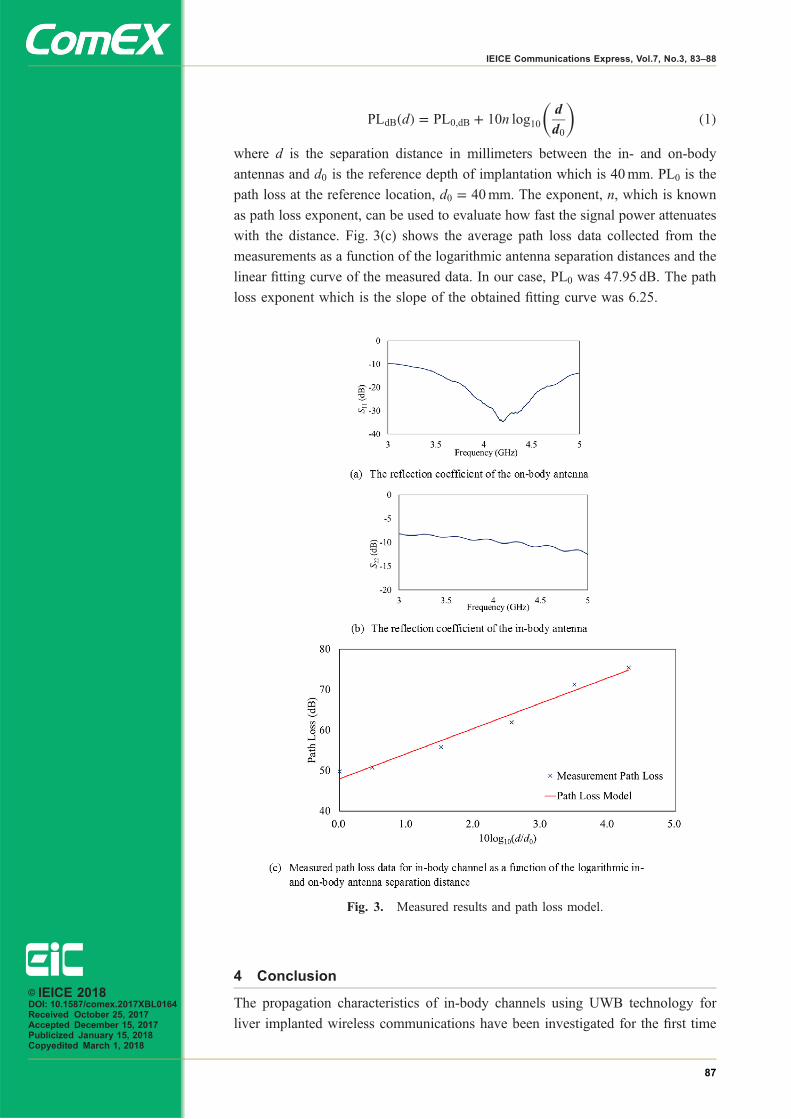
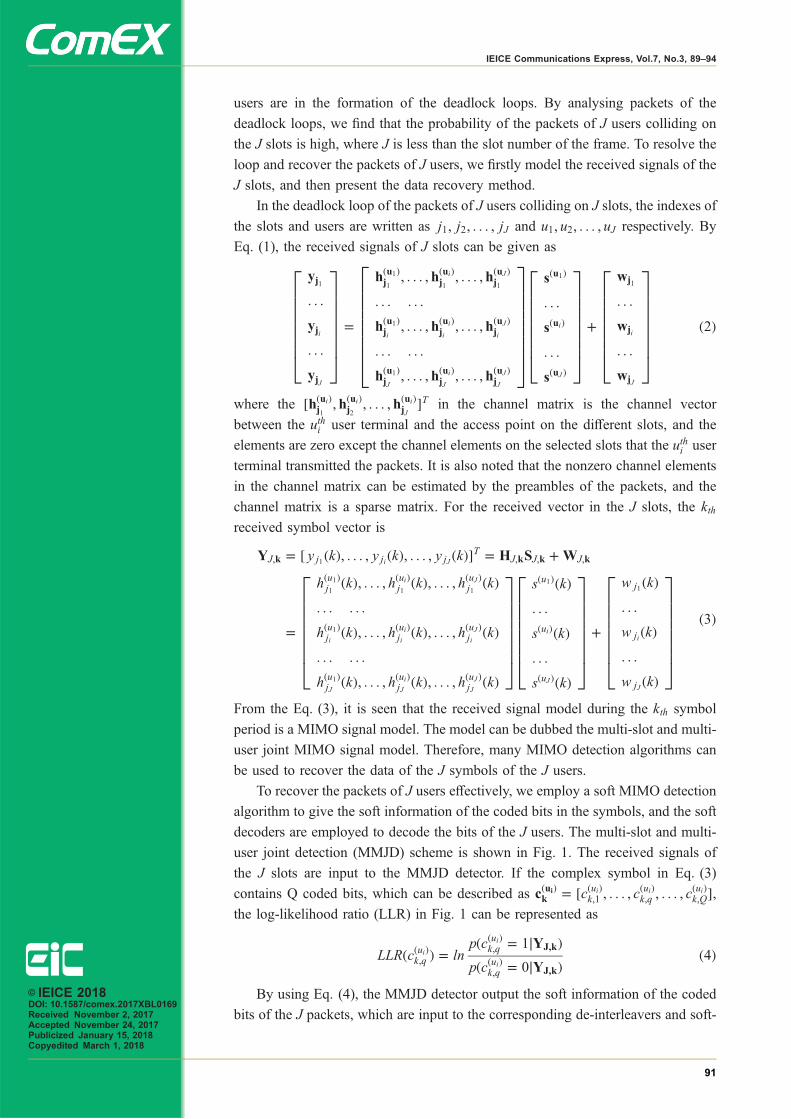
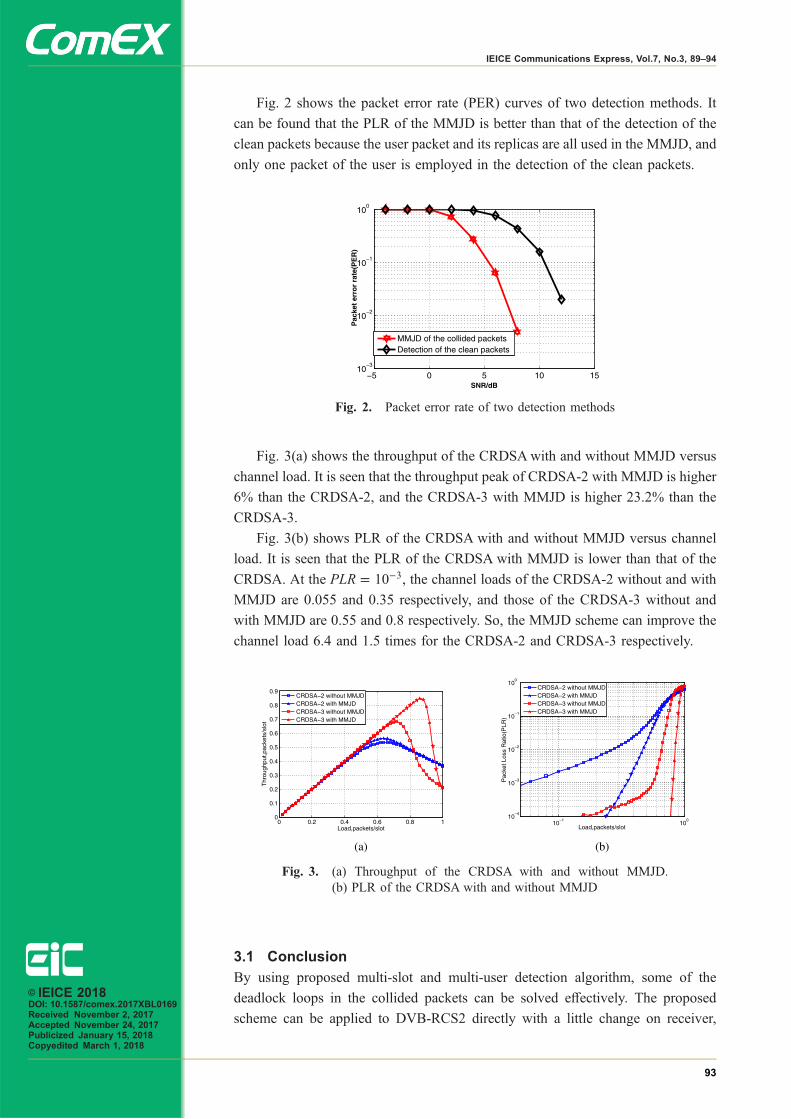
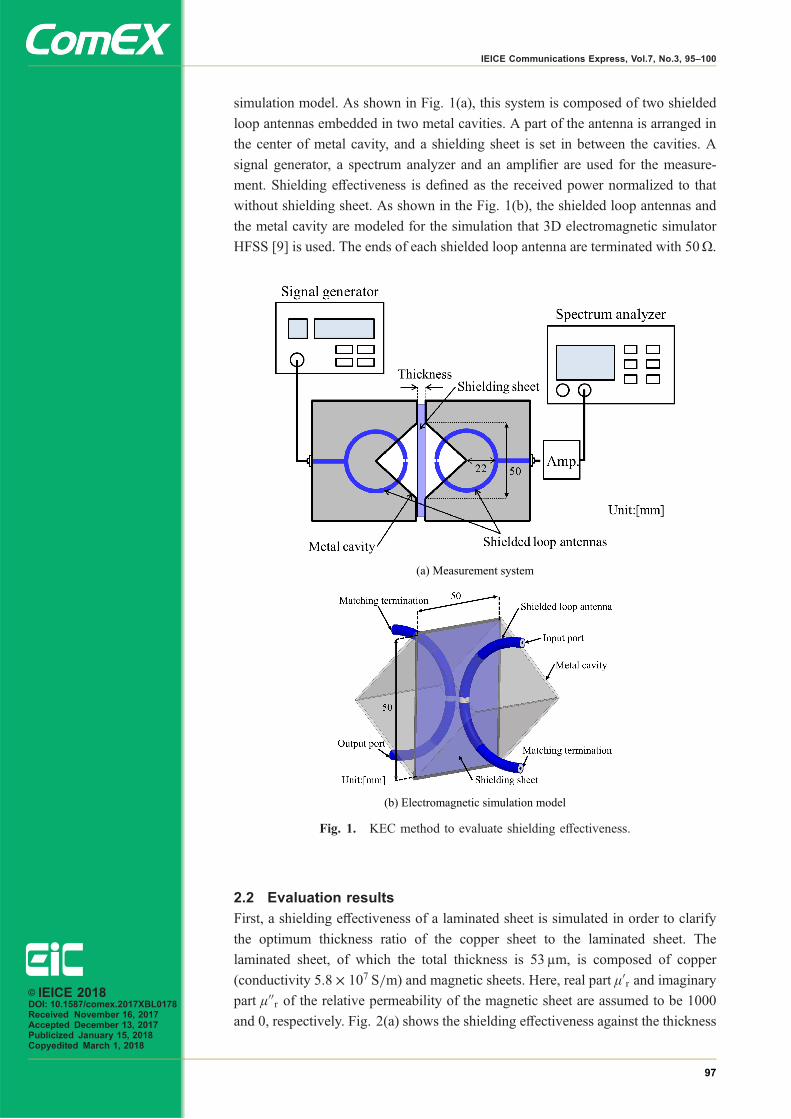
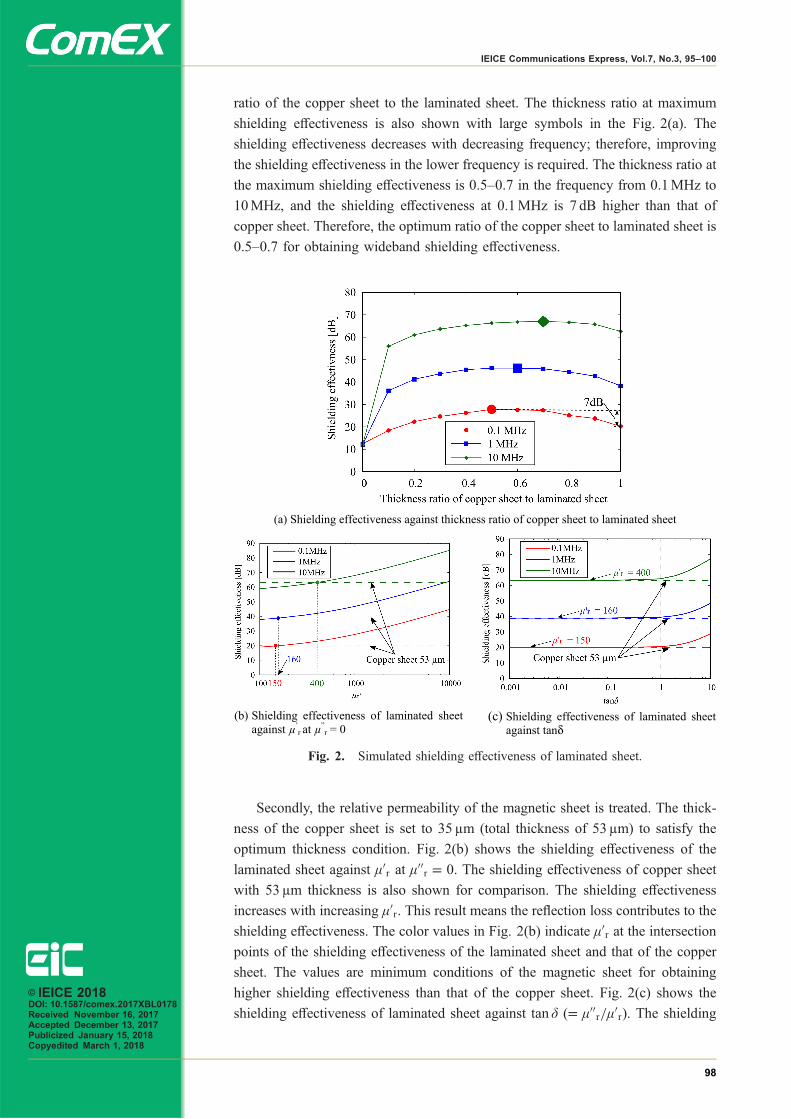
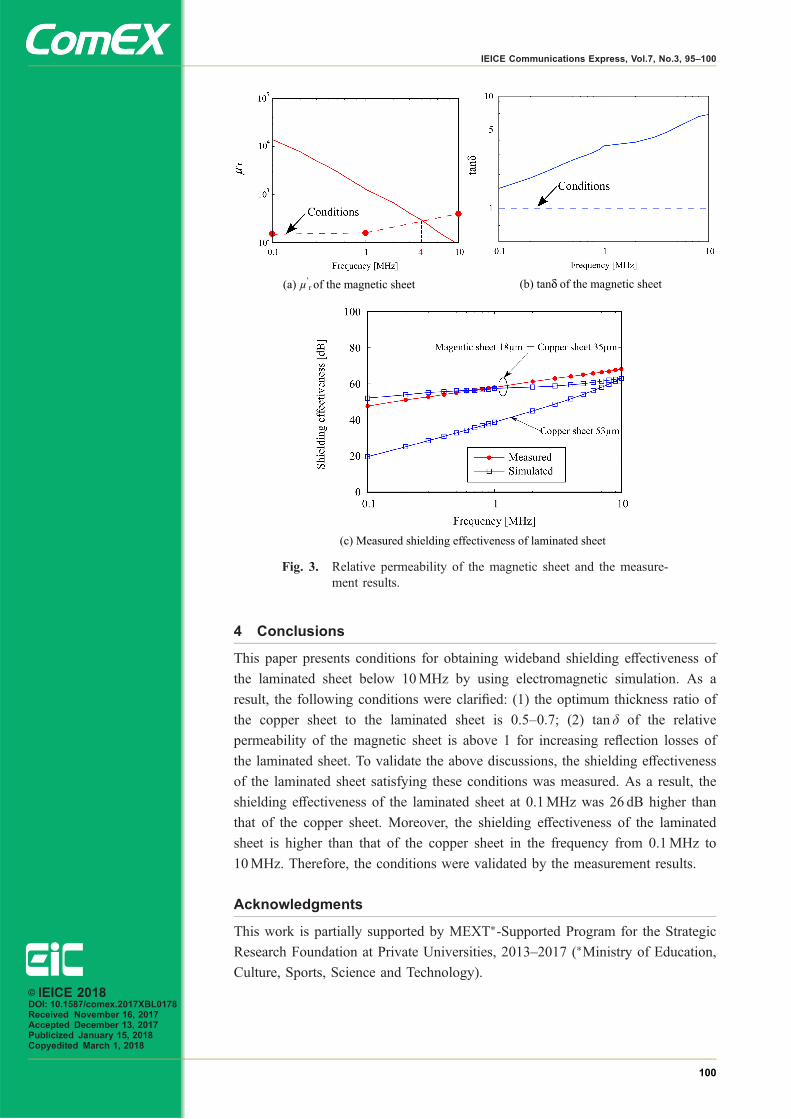
4 Conclusions
This paper presents conditions for obtaining wideband shielding effectiveness of
the laminated sheet below 10MHz by using electromagnetic simulation As a
result the following conditions were clarified (1) the optimum thickness ratio of
the copper sheet to the laminated sheet is 05ndash07 (2) tan of the relative
permeability of the magnetic sheet is above 1 for increasing reflection losses of
the laminated sheet To validate the above discussions the shielding effectiveness
of the laminated sheet satisfying these conditions was measured As a result the
shielding effectiveness of the laminated sheet at 01MHz was 26 dB higher than
that of the copper sheet Moreover the shielding effectiveness of the laminated
sheet is higher than that of the copper sheet in the frequency from 01MHz to
10MHz Therefore the conditions were validated by the measurement results
Acknowledgments
This work is partially supported by MEXT-Supported Program for the Strategic
Research Foundation at Private Universities 2013ndash2017 (Ministry of Education
Culture Sports Science and Technology)
(a) μrsquor of the magnetic sheet (b) tanδ of the magnetic sheet
(c) Measured shielding effectiveness of laminated sheet
Fig 3 Relative permeability of the magnetic sheet and the measure-ment results
copy IEICE 2018DOI 101587comex2017XBL0178Received November 16 2017Accepted December 13 2017Publicized January 15 2018Copyedited March 1 2018
100
IEICE Communications Express Vol7 No3 95ndash100
Numerical study on arotationally-symmetricaldipole array antenna positionfor a MIMO full-duplex system
Yoshiyuki Yamamoto1a) Masakuni Tsunezawa2 Kentaro Murata3Naoki Honma2 and Qiang Chen11 Graduate School of Engineering Tohoku University
6ndash6ndash5 Aramakiaza-Aoba Aoba-ku Sendai Miyagi 980ndash8579 Japan2 Graduate School of Engineering Iwate University
4ndash3ndash5 Ueda Morioka Iwate 020ndash8551 Japan3 Graduate School of Engineering National Defense Academy
1ndash10ndash20 Hashirimizu Yokosuka Kanagawa 239ndash8686 Japan
a) yamamoto-yeceitohokuacjp
Abstract In this letter a rotationally-symmetrical array (RSA) arrange-
ment of a receiving dipole array antenna is optimized to maximize the
performance of the null-beamforming method for the suppression of self-
interference The optimum RSA for a receiving dipole array with four
elements is clarified Through numerical simulations we found that the
optimized RSA arrangement suppressed the self-interference significantly
Keywords MIMO full-duplex self-interference antenna arrangement
null-beamforming
Classification Antennas and Propagation
References
[1] J I Choi M Jain K Srinivasan P Levis and S Katti ldquoAchieving singlechannel full duplex wireless communicationrdquo Proc 2010 ACM MobiCompp 1ndash12 Sep 2010
[2] I E Telatar ldquoCapacity of multi-antenna Gaussian channelsrdquo Tech Rep ATampT-Bell Labs June 1995
[3] D Bharadia E McMilin and S Katti ldquoFull-duplex radiosrdquo Proc ACMSIGCOMM Comp Commun Rev pp 375ndash386 Oct 2013
[4] S Zhou and G B Giannakis ldquoOptimal transmitter eigen-beamforming andspace-time block coding based on channel mean feedbackrdquo IEEE Trans on SigProc vol 50 no 10 pp 2599ndash2613 Oct 2002 DOI101109TSP2002803355
[5] Y Yamamoto R Takahashi M Tsunezawa N Honma and K MurataldquoExperimental evaluation of interference reducation effect Eigen-beamformingand digital subtraction by using MIMO-OFDM signalsrdquo IEICE CommunExpress vol 6 no 2 pp 71ndash76 Feb 2017 DOI101587comex2016XBL0175
[6] M Tsunezawa N Honma K Takahashi K Murata and K NishimorildquoRotationally-symmetrical array for self-interference reduction in full-duplex
copy IEICE 2018DOI 101587comex2017XBL0182Received November 25 2017Accepted December 22 2017Publicized January 15 2018Copyedited March 1 2018
101
IEICE Communications Express Vol7 No3 101ndash106
MIMOrdquo IEICE Commun Express vol 6 no 6 pp 363ndash368 Jun 2017DOI101587comex2016SPL0040
1 Introduction
Full-duplex system and multiple-input multiple-output (MIMO) technology are
promising technologies that can improve communication capacity without using
additional frequency bands [1 2] The full-duplex system enables simultaneous two-
way wireless communication in the same frequency band while the MIMO tech-
nology improves frequency utilization efficiency using multiple antennas The
combination of the MIMO technology and the full-duplex system is called the
MIMO full-duplex system However it is well-known that the full-duplex system
suffers from the so-called self-interference [3] The self-interference problem leads
to the saturation of the radio frequency (RF) front-end because the level of the
transmitting signal is considerably higher than that of the receiving signal Con-
sequently the RF front-end suffers from undesired nonlinearity and can be damaged
In addition the eigen-beamforming (EBF) method is a technique to improve the
communication quality by controlling the radiation pattern at the transmitter side
using transmission weight vector [4] The control of the radiation pattern at the
transmitter side can be also effective in circumventing the self-interference because
the interference cannot reach the receiving antennas ideally The null-beamforming
(NBF) method is defined as the EBF method used to suppress self-interference
using transmission weight vectors obtained by singular value decomposition (SVD)
of the self-interference channel [5] The performance of the NBF method is strongly
affected by the nature of self-interference channel in terms of spatial correlation In
general high spatial correlation leads to higher performance of the NBF method
Previously an array antenna arrangement such as rotationally-symmetrical
array (RSA) has been proposed to increase the spatial correlation and improve
the performance of the NBF method [6] In RSA the NBF method can considerably
suppress the self-interference if all antennas are point wave sources However the
actual antenna has mutual coupling from other antennas
Due to the highly symmetric arrangement of the RSA the self-interference
can be suppressed but the influence of asymmetry of mutual coupling between the
array antenna elements can negatively impact its performance The mutual coupling
between the array antenna depends on the position of the array antenna
In this letter the receiving antenna arrangement for the RSA is optimized from
the viewpoint of self-interference channel between the transmitting and receiving
array antenna elements Both transmitting and receiving antennas are array antenna
consisting of four-element dipole antennas
2 Antenna arrangement suitable for NBF method
Fig 1 shows a system model of our proposed MIMO full-duplex system N and M
are the number of transmitting antenna (Tx) and receiving antenna (Rx) respec-
tively H is the self-interference channel i is the i-th singular value of H in
copy IEICE 2018DOI 101587comex2017XBL0182Received November 25 2017Accepted December 22 2017Publicized January 15 2018Copyedited March 1 2018
102
IEICE Communications Express Vol7 No3 101ndash106
descending order and vi is the i-th transmission weight vector obtained by SVD of
H By arranging the array antenna so that the rank of H becomes 1 the singular
values other than the first singular value degenerate The NBF method uses the
transmission weight vectors excluding the first singular value The magnitude of
the self-interference channel norm using NBF method is given by
kH ~V1k2F frac14XminethMNTHORN
ifrac1422i eth1THORN
where ~V1 is the transmission weight matrix excluding the first singular value~V1 frac14 frac12v2 vN This means that Tx weighted by ~V1 forms a null in Rx direction
to suppress 1 using the NBF method
Fig 2 shows the antenna arrangement to gain high spatial correlation The Tx
linear array is located on the z-axis The Rx circular array is located on the
circumference around the z-axis D is the distance from the end of the Tx array
to the origin of the Rx array de is the element spacing of the Tx array and re is the
radius in the Rx array We assume that all antennas are point wave sources and there
is no mutual coupling
In RSA Line-of-sight paths from the arbitrary transmitting element to all of Rx
elements are the same strength and phase because the distance between an arbitrary
transmitting point and all of receiving point wave sources are equal Therefore all
elements in each column vector of the self-interference channel matrix H are
identical and the rank of self-interference channel H equals 1
The self-interference power Pw=NBF and Pw=oNBF are defined as
Fig 1 System model
copy IEICE 2018DOI 101587comex2017XBL0182Received November 25 2017Accepted December 22 2017Publicized January 15 2018Copyedited March 1 2018
103
IEICE Communications Express Vol7 No3 101ndash106
Pw=NBF frac14 P
N 1
XminethMNTHORN
ifrac1422i eth2THORN
Pw=oNBF frac14 P
N
XminethMNTHORN
ifrac1412i eth3THORN
where P is the sum of the transmission power The singular value of the self-
interference channel becomes 0 except for first singular value if the rank of H is 1
Therefore the self-interference power with and without NBF method are
Pw=NBF frac14 0 and Pw=oNBF frac14 P21=N Therefore the NBF method can suppress the
self-interference by excluding only the first singular value
However the gain of each Rx antenna varies if the mutual coupling of the Rx
array antenna is asymmetric due to the mutual coupling among Rx In this letter the
symmetry of the mutual coupling of the RSA antenna is evaluated from the
magnitude of the mutual coupling of each Rx antenna
3 Numerical analysis results
31 Simulation setup
The antenna arrangement used for numerical analysis is shown in Fig 2 The
antenna is a half-wavelength dipole antenna The distance from the end of the Tx
array to the origin of the Rx array the element spacing of the Tx array and the
Fig 2 Antenna arrangement
copy IEICE 2018DOI 101587comex2017XBL0182Received November 25 2017Accepted December 22 2017Publicized January 15 2018Copyedited March 1 2018
104
IEICE Communications Express Vol7 No3 101ndash106
radius of the Rx array are set to D frac14 10 de frac14 05 and re frac14 05 respectively
(λ wavelength in a vacuum) e is the rotation angle of the receiving antennas
moving in the direction from x-axis to y-axis In this numerical analysis we
changed the rotation angle e from 0deg to 90deg
32 Simulation results
Fig 3(a) shows the singular value characteristics The first singular value was
almost the same at all rotation angles the second singular value become smaller as
it approaches e frac14 45deg We found that the second singular value at e frac14 45deg was at
maximum 48 dB lower than that at e frac14 0deg From the results we found that the
spatial correlation become higher as approach at e frac14 45deg
Fig 3(b) shows the mutual coupling of the Rx antenna versus rotation angle
The mutual coupling of i-th Rx antenna Ci is given as
Ci frac14XN
kfrac141jSikj2 ethi ne kTHORN eth4THORN
where Sik is S-parameter from k-th Rx antenna to i-th Rx antenna The mutual
coupling difference of each Rx antenna become smaller as it approaches e frac14 45deg
In particular all mutual coupling at e frac14 45deg were almost equal The sum of mutual
Fig 3 Simulation results
copy IEICE 2018DOI 101587comex2017XBL0182Received November 25 2017Accepted December 22 2017Publicized January 15 2018Copyedited March 1 2018
105
IEICE Communications Express Vol7 No3 101ndash106
coupling from the adjacent antenna (e 90deg) is equal if the directivity of the
RSA antenna is point-symmetric Therefore Ci is affected by the mutual coupling
of the diagonal RSA antenna (e thorn 180deg) The dipole antenna is omnidirectional
on the xz-plane perpendicular to the element axis (y-axis) and forms a null at the
end of element on the xy-plane Thus the mutual coupling C1 and C3 were large
and C2 and C4 were small at e frac14 0deg However mutual coupling between Rx
antennas at e frac14 45deg were almost equal because the mutual coupling of the dipole
antennas on the diagonal was equal Therefore the mutual coupling at e frac14 45deg was
symmetrical
Fig 3(c) shows the self-interference power versus rotation angle The self-
interference power without NBF method (Pw=oNBF) was minus37 dB at all rotation
angles In other hand the self-interference power with NBF method (Pw=NBF)
was suppressed by more than 95 dB at all rotation angles In particular the self-
interference power was suppressed by 143 dB at e frac14 45deg This shows that the NBF
method at e frac14 45deg suppresses the self-interference significantly because the self-
interference channel including the influence of mutual coupling was symmetrical
4 Conclusions
Numerical analysis confirmed that the self-interference power with NBF method
varies with the rotation angle of the receiving dipole array antenna of RSA The
self-interference power was changed according to the rotation angles because the
mutual coupling of the receiving dipole array antennas alters the symmetry The
self-interference power with NBF method (Pw=NBF) was suppressed by 143 dB at
e frac14 45deg Therefore we found that the most efficient arrangement of the dipole
array antenna in RSA is at e frac14 45deg
Acknowledgments
This research and development work was supported by the MICSCOPE
155002002
copy IEICE 2018DOI 101587comex2017XBL0182Received November 25 2017Accepted December 22 2017Publicized January 15 2018Copyedited March 1 2018
106
IEICE Communications Express Vol7 No3 101ndash106
Errata
The following editorial correction has been found in Vol 6 No 9 and should be
corrected as follows
Wrong
p 517 (in Fig 2)
time interval = 800 s
Correct
time interval = 4ms
copy IEICE 2018DOI 101587comex2018XBL8001
Published March 1 2018
107
IEICE Communications Express Vol7 No3 107
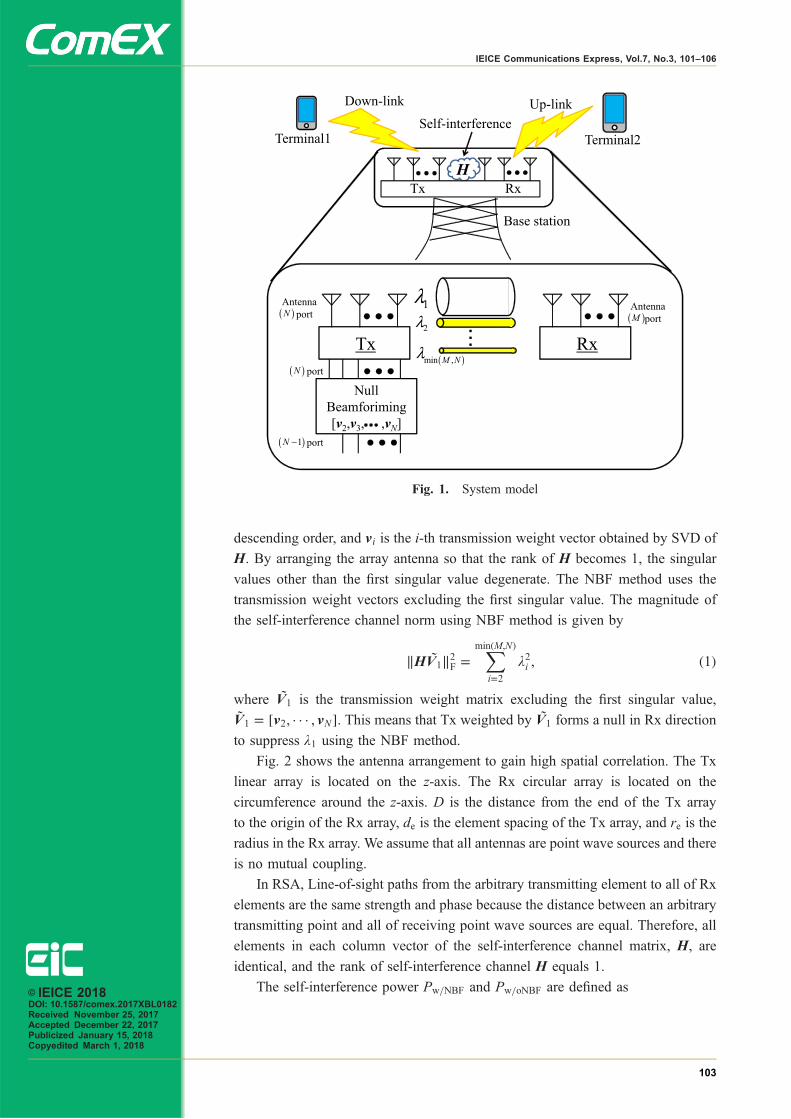
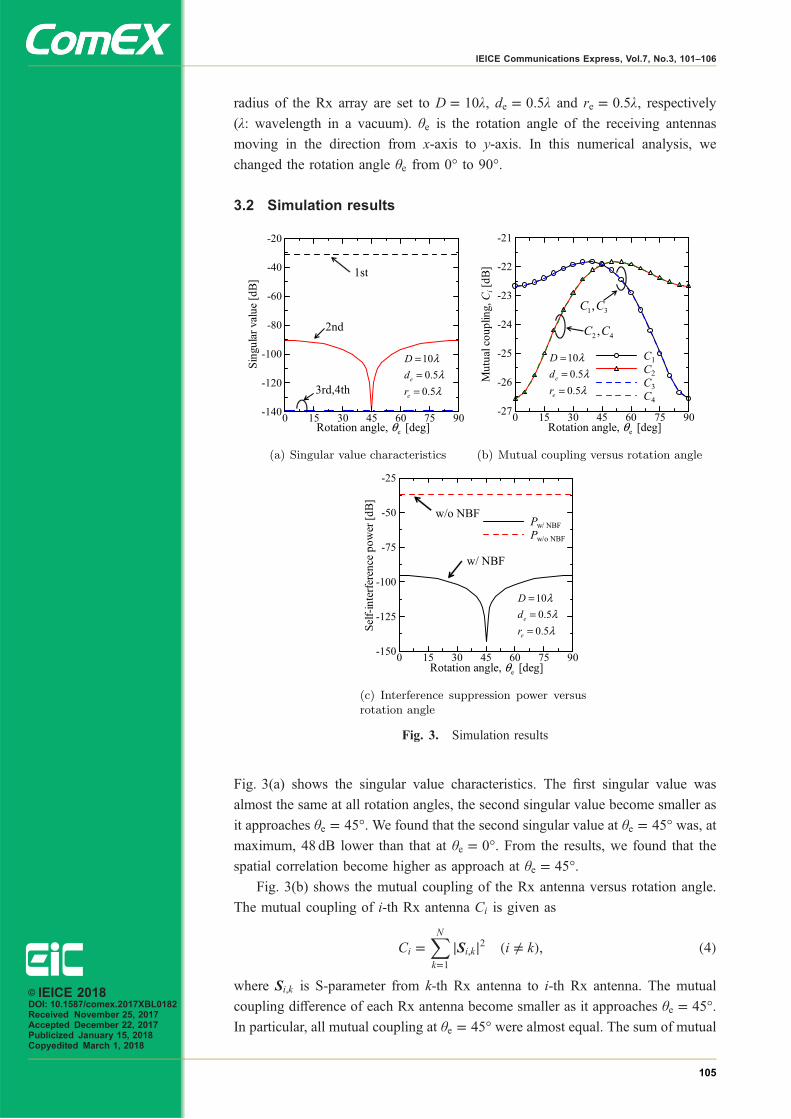

Errata
The following editorial correction has been found in Vol 6 No 9 and should be
corrected as follows
Wrong
p 517 (in Fig 2)
time interval = 800 s
Correct
time interval = 4ms
copy IEICE 2018DOI 101587comex2018XBL8001
Published March 1 2018
107
IEICE Communications Express Vol7 No3 107