Embed Size (px)
Citation preview
IEEE TRANSACTIONS ON VISUALIZATION AND COMPUTER GRAPHICS 1
Visual Perception and Mixed-Initiative Interactionfor Assisted Visualization Design
Christopher G. Healey, Sarat Kocherlakota, Vivek Rao, Reshma Mehta, and Robert St. Amant
Abstract— This paper describes the integration of perceptualguidelines from human vision with an AI-based mixed-initiativesearch strategy. The result is avisualization assistantcalled ViA,a system that collaborates with its users to identify perceptuallysalient visualizations for large, multidimensional datasets. ViAapplies knowledge of low-level human vision to: (1) evaluatethe effectiveness of a particular visualization for a given datasetand analysis tasks; and (2) rapidly direct its search towardsnew visualizations that are most likely to offer improvementsover those seen to date. Context, domain expertise, and ahigh-level understanding of a dataset are critical to identifyingeffective visualizations. We apply a mixed-initiative strategy thatallows ViA and its users to share their different strengths andcontinually improve ViA’s understanding of a user’s preferences.
We visualize historical weather conditions to compare ViA’ssearch strategy to exhaustive analysis, simulated annealing, andreactive tabu search, and to measure the improvement providedby mixed-initiative interaction. We also visualize intelligent agentscompeting in a simulated online auction to evaluate ViA’s percep-tual guidelines. Results from each study are positive, suggestingthat ViA can construct high-quality visualizations for a range ofreal-world datasets.
Index Terms— computer graphics, perception, search, userinterfaces, visualization
I. I NTRODUCTION
A N important problem in computer graphics is visualization,the conversion of collections of strings and numbers (or
datasets) into images that viewers can use to explore, discover,and analyze within their data [37], [46]. The rapid growth inour ability to generate, capture, and archive vast amounts ofinformation has dramatically increased the need for effectivevisualization techniques. Unfortunately, methods to display in-formation in useful and meaningful ways have not always keptpace.
Numerous research efforts are now underway to identify newvisualization algorithms [27], [28], [53]. One promising approachis the use of guidelines from visual perception. The human visualsystem can detect certain image properties very rapidly, oftenin only a few hundred milliseconds. Visualization techniquesthat harness human perception have the potential to significantlyincrease data throughput and improve viewer comprehension. Theneed to consider perception during visualization was highlightedas an important research issue in the original NSF report onscientific visualization [37], and it continues to offer the potentialto improve a wide range of visualization algorithms [27], [28],[53].
Our specific interest in this paper is the visualization ofmul-tidimensionaldatasets that encode multiple attributes. Considera datasetD representingn data attributesA = (A1, . . . , An),n > 1 and containingm data elementsej , D = (e1, . . . , em).Each element encodes one value for every attribute,ej =
{aj,1, . . . , aj,n}, aj,i ∈ Ai. One way to visualizeD is to
selectn visual featuresV = (V1, . . . , Vn) to represent eachAi.FunctionsΦ = (φ1, . . . , φn) map the domain ofAi to the rangeof displayable values inVi, φi : Ai 7→ Vi. Described in this way,visualization is the selection of a data-feature mappingM(V, Φ),together with an evaluation of a viewer’s ability to comprehendthe images generated byM . Results from human psychophysicscan be used to construct perceptually effectiveM that allowviewers to rapidly and accurately understand their data.
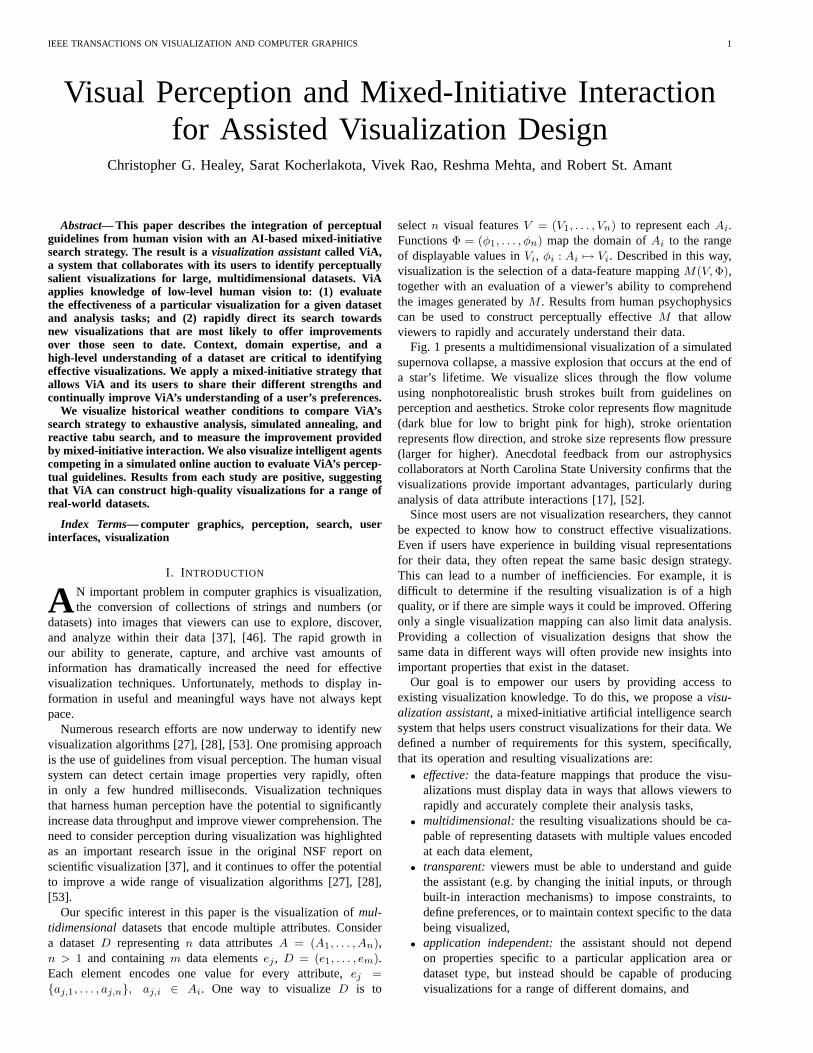
Fig. 1 presents a multidimensional visualization of a simulatedsupernova collapse, a massive explosion that occurs at the end ofa star’s lifetime. We visualize slices through the flow volumeusing nonphotorealistic brush strokes built from guidelines onperception and aesthetics. Stroke color represents flow magnitude(dark blue for low to bright pink for high), stroke orientationrepresents flow direction, and stroke size represents flow pressure(larger for higher). Anecdotal feedback from our astrophysicscollaborators at North Carolina State University confirms that thevisualizations provide important advantages, particularly duringanalysis of data attribute interactions [17], [52].
Since most users are not visualization researchers, they cannotbe expected to know how to construct effective visualizations.Even if users have experience in building visual representationsfor their data, they often repeat the same basic design strategy.This can lead to a number of inefficiencies. For example, it isdifficult to determine if the resulting visualization is of a highquality, or if there are simple ways it could be improved. Offeringonly a single visualization mapping can also limit data analysis.Providing a collection of visualization designs that show thesame data in different ways will often provide new insights intoimportant properties that exist in the dataset.
Our goal is to empower our users by providing access toexisting visualization knowledge. To do this, we propose avisu-alization assistant, a mixed-initiative artificial intelligence searchsystem that helps users construct visualizations for their data. Wedefined a number of requirements for this system, specifically,that its operation and resulting visualizations are:
• effective: the data-feature mappings that produce the visu-alizations must display data in ways that allows viewers torapidly and accurately complete their analysis tasks,
• multidimensional:the resulting visualizations should be ca-pable of representing datasets with multiple values encodedat each data element,
• transparent:viewers must be able to understand and guidethe assistant (e.g. by changing the initial inputs, or throughbuilt-in interaction mechanisms) to impose constraints, todefine preferences, or to maintain context specific to the databeing visualized,
• application independent:the assistant should not dependon properties specific to a particular application area ordataset type, but instead should be capable of producingvisualizations for a range of different domains, and
IEEE TRANSACTIONS ON VISUALIZATION AND COMPUTER GRAPHICS 2
Fig. 1. A painterly visualization of 2D flow in a simulated supernova collapse,flow direction→ stroke orientation,magnitude→ color, pressure→ size
• extensible:the assistant should easily extend to support newvisualization results as they are discovered.
The key idea is to divide the visualization process betweenthe computer and the end-user in a way that harnesses theunique strengths of each participant. Since most users are notvisualization experts, details about how to construct and evaluatea multidimensional visualization are assigned to the visualizationassistant. Usersare experts on their data, however, so they areasked to provide information about the dataset and analysis tasksto be performed, to make decisions about how the data canbe preprocessed, and to consider domain-specific constraints toenforce any visual context required in the final visualizations
II. PERCEPTUALFOUNDATIONS
Our visualizations are constructed from psychophysical studiesof how the human visual system “sees” fundamental propertiesof color and texture in an image.
Color is a common visual feature used in many visualizationdesigns. This belies its complex nature, however [60]. Simplecolor scales include the rainbow spectrum, the grey-red saturationscale, and red-blue or red-green ramps [55]. More sophisticatedmethods divide color along basic dimensions like luminance, hue,and saturation to better control the differences viewers perceive[32]. Perceptually balanced models like CIE LUV or Munsellroughly equate perceived color difference to Euclidean distance[8], [39]. Methods have been proposed to emphasize specificdata ranges with non-linear paths through a color model [42],to choose color scales based on data attribute properties [45], tocontrol color surround errors [55], or to pick small collections ofdistinguishable colors [16].
Our current color scales combine many of these findings [17].We build paths along a monitor gamut’s boundary in CIE LUV,either as a single spiral that monotonically increases in luminance,or as a single loop with a constant luminance. A path is subdividedinto named regions that are parameterized to have equal arclength. The result is a color scale that: (1) is balanced alongits length; (2) controls color surround errors; (3) can vary hueand luminance independently; and (4) can suggest small sets ofequally distinguishable colors.
Like color, texture can be decomposed into a collection offundamental perceptual dimensions. Mapping data attributes totexture properties produces texture patterns that change their
visual appearance based on the data they represent [16], [26], [56],[58]. Texture dimensions have been identified both in computervision and visual perception [7], [29], [35], [40], [41], [54], [59].For example, automatic texture segmentation measure propertieslike size (or height), spatial packing density, orientation, andregularity. Results from computer vision cannot always be applieddirectly during visualization design, however, so care must betaken to confirm the visual system’s ability to distinguish andidentify individual texture properties [16], [25], [30], [56].
Visual properties that work well in isolation do not necessarilyfunction with the same efficiency if they are shown together.For example, random changes in luminance can interfere witha viewer’s ability to recognize hue patterns [6], [16], [50]. Thisinterference effect is asymmetric: random variations in hue haveno effect on a viewer’s ability to perceive luminance. Both hueand luminance interfere with texture dimensions, again in anasymmetric manner: random hue or luminance masks textureproperties, but random texture properties have no effect on hue orluminance [7], [16], [50]. Small but significant interference effectsalso occur between texture dimensions: density or regularity canmask small targets, and size or regularity can mask sparse targets.We do not want to map a low-relevance attribute to a high-saliencevisual feature, since this could obscure important data.
Our visualization designs focus on visual features that areeasily recognized, both in isolation and in combination. We mapindividual data attributes to features in ways that draw a viewer’sfocus of attention to important areas in a visualization. The abilityto harness low-level human vision is attractive, since:
• high-level exploration and analysis tasks are rapid and accu-rate, usually requiring 200 milliseconds or less to complete,
• the time to perform a task is independent of the number ofelements in the display, and
• different features can interact with one another to maskinformation; psychophysical experiments allow us to identifyand avoid these visual interference patterns [15]–[17].
III. A RCHITECTURE
Numerous systems exist with extensive capabilities for the pre-sentation of data, for example, Vis5D, AVS, or the VisualizationToolkit (vtk) [21], [48]. What these systems lack is a method ofsuggesting to usershow to represent their data in ways that are
IEEE TRANSACTIONS ON VISUALIZATION AND COMPUTER GRAPHICS 3
best-suited to their specific analysis and exploration needs. Thisis exactly the problem that we are trying to address.
Some previous work in visualization has investigated automat-ing the selection of a visual mappingM . Wehrend and Lewisbuilt a classification system to describe visualization techniquesin a domain-independent manner [57]; these classifications areused to try to suggest an appropriateM . A similar technique isdescribed by Lohse et al. [33]. Robertson uses a natural sceneparadigm to guide the choice of visual representations for data[43], [44]; this methodology identifies the types of informationconveyed by a particular representation, then tries to match theseto the underlying characteristics of a dataset. Mackinlay proposesautomated methods that measure expressiveness and effectivenessto develop 2D graphical presentations [34]. Beshers and Feinerapply similar rules to build graph-based “worlds within worlds”to visualize multidimensional data [4]. Senay and Ignatius extendMackinlay’s work to 3D using a visualization system built onheuristic rules [49]. Gallop proposes data models and structuresto classify visualizations [12]. Rogowitz and Treinish describe arule-based visualization architecture for representing continuoussurfaces [45], built on perceptual rules to guarantee that ann-fold increase in an attribute’s value results in a perceptualn-foldincrease in the visual presentation for that value. Bergman et al.[3] describe a colormap tool that uses system-generated and user-provided information about a dataset to limit a viewer’s choiceof color scales during visualization.
Unfortunately, the construction of the perceptual rules usedby these systems is often left as work-in-progress. As well, thetechniques include a number of potential limitations, for example:(1) only oneM is recommended for each type of dataset; (2) theparameters used to categorize a dataset are relatively coarse, somany differentD will map to the sameM ; and (3) there is nosimple way to intelligently modifyM to support context or userpreferences. Design galleries [36] address the first limitation byconverting input parameters to images via a mapping function;a set of images maximally dispersed from one another can beautomatically identified, arranged, and displayed to provide anoverview of how different inputs affect the resulting image.Although expressive, perceptual knowledge and expertise are stillneeded to select the “best”M for the user’s visualization andexploration needs.
A. ViA
We propose an AI-based visualization assistant called ViA[18], [19], built with perceptual guidelines from human vision,heuristic AI search strategies, and mixed-initiative interactions.ViA collaborates with its users to design high quality, perceptuallysalient visualizations that are well-suited to the underlying dataand analysis needs.
ViA begins by asking a short set of questions about the datasetand the user’s analysis tasks. These initial constraints allow ViAto evaluate the applicability of different visualization mappingsM . Users can modify the constraints, either through mixed-initiative interaction during the search process, or after a set ofvisualizations are proposed by ViA. Once the dataset propertiesand analysis tasks are defined, ViA begins constructing and testingvisualizations. A potential mappingM is decomposed into itsndata attribute-to-visual feature pairs(Ai, Vi). For each pair, anevaluation engineassesses the use of visual featureVi. The enginereturns a normalized evaluation weight to rate the effectiveness
of the pairing. For pairings with low weights, an engine may alsoreturn one or morehints on how the pairing could be improved,together with an estimated evaluation weight increase if the hintwere applied.
The simple strategy of exhaustively searching the state spaceof all possible data-feature mappings forM with the largestevaluation weight quickly becomes infeasible, even for smallnumbers of data attributes and visual features. Allowing usersto add, remove, or modify their initial inputs while ViA runschanges the evaluation constraints, further increasing the numberof different visualizations that must be considered.
Rather than applying a brute-force approach, ViA tries torestrict its searches to locations that are most likely to containhigh-quality mappings. The search algorithm collects weights andhints for all the attribute-feature pairs inM . Chains of non-conflicting hints are bundled withM and placed on a priorityqueue in order of estimated evaluation weight improvement. Thechain with the largest expected improvement is then removedfrom the queue and applied toM to form a new mappingM ′. M ′
is evaluated in an identical manner, producing new hints that maylead to even better visualizations. This allows the search engineto focus on mappings that have a high probability of representingbetter visualizations. Searching continues until the queue is empty,or until a user-specified stopping conditions is reached.
B. User Input
Users are asked to enter a small amount of application-independent information prior to initiating a search. These inputsare used as an initial set of constraints when candidate visualiza-tions are evaluated. For each data attribute, the user defines:
• attribute importance:a normalized importance weight, toorder the attributes and to identify which attributes are mostimportant to the user,
• spatial frequency:the spatial frequency of the attribute’svalues (high or low); an initial guess is made by ViA, andcan be accepted or modified by the user,
• continuous or discrete:whether the data represents discretevalues, or samples from an underlying, continuous datasource1, and
• task: the analysis tasks, if any, the user wants to performon the attribute; ViA supports searching for a specific value(search), identifying spatial boundaries between regions withcommon values (boundary detect), estimating the number orratio of data with a particular value (estimate), and trackingregions with common values as they move over time (track).
These properties were derived in part from our own experiences indecomposing domain-specific analysis requests into fundamentalanalysis tasks, and from existing automated visualization systemsand task analysis research, which use many of these sameproperties to drive their visualization selection strategies.
C. Evaluation Engines
Evaluation engines are the basic building blocks that determinethe quality of a given visualizationM . The evaluation is based inpart onM ’s perceptual strengths and limitations, and in part onthe data being visualized, the user’s stated interests in the data,and the analysis tasks the user wants to perform.
1ViA currently supports numeric data only, so nominal data is not consid-ered
IEEE TRANSACTIONS ON VISUALIZATION AND COMPUTER GRAPHICS 4
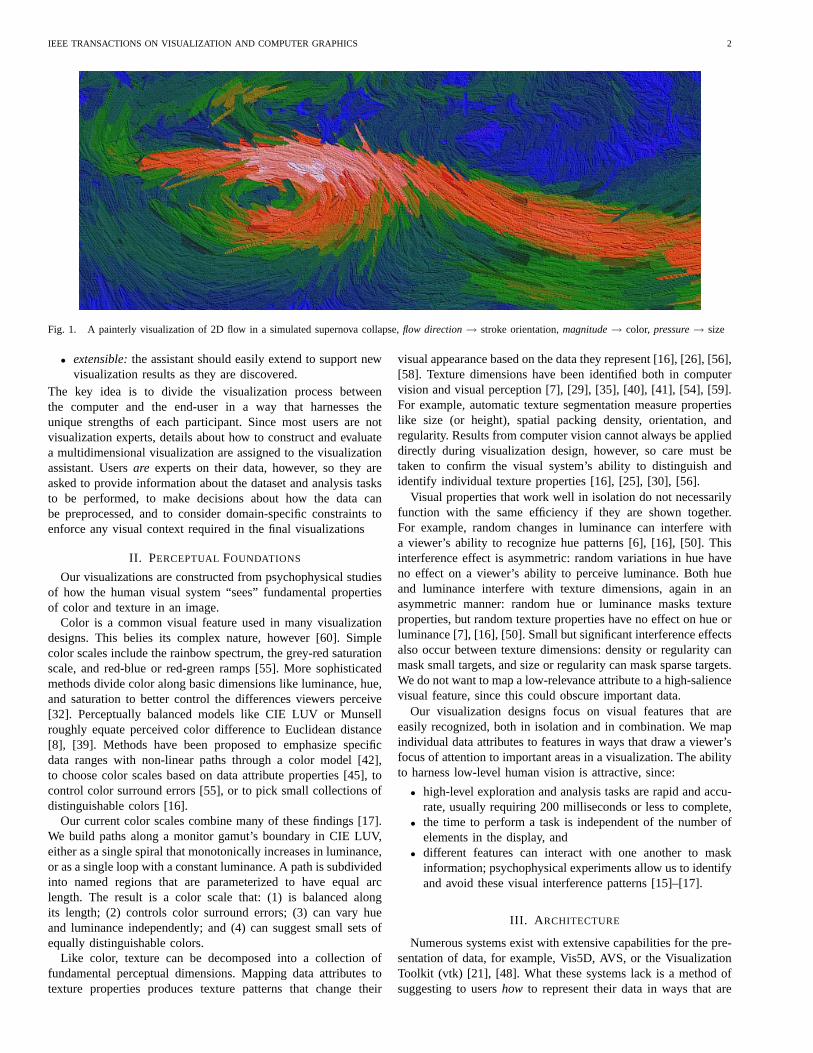
luminance hue size (height) density orientation regularity
• importance weights• tasks• spatial frequency• domain type
D weight,hints
data-featurepair
weight,hints
data-featurepair. . .
Mixed-Initiative Search Algorithm
Usermixed-initiative
interaction
top kmappings
Fig. 2. ViA’s architecture, made up of a datasetD, initial inputs from a user, a mixed-initiative search algorithm, and visual feature evaluation engines
Evaluation engines are categorized by visual feature. ViAcurrently includes engines for luminance, hue, size, density,orientation, and regularity. This design makes it easy to extendViA to include new visual features. Once sufficient perceptualknowledge is available, a new engine can be implemented andintegrated directly into ViA’s search algorithms.
An evaluation engine performs four different classes of testsfor each attribute-feature pair(Ai, Vi):
1) Spatial frequency:Certain visual features are best appliedto either high or low spatial frequency data (e.g. luminanceis appropriate for high spatial frequency data, while iso-luminant hues are better suited for low spatial frequencypatterns). ViA checksAi’s spatial frequency against whatVi can best support.
2) Interference:Visual features can interact with one another,causing visual interference patterns (e.g. luminance canmask hue patterns, and luminance and hue can mask texturepatterns). Features that lie near the top of the visual saliencehierarchy should not be used to represent data attributeswith low importance. ViA searchesM for cases where lesssalient visual featuresVj are mapped to more importantdata attributesAj , that is,Vj < Vi but impj > impi.
3) Task type:Different visual features are best-suited for dif-ferent types of analysis tasks. ViA checks to see which tasksa user has asked to perform on attributeAi, to determinewhetherVi can support the given task fully, partially, or notat all.
4) Attribute type:Different visual features work better witheither continuous or discrete data. ViA comparesVi’s capa-bilities to Ai’s domain, and to the total number of uniquevalues ofAi contained inD.
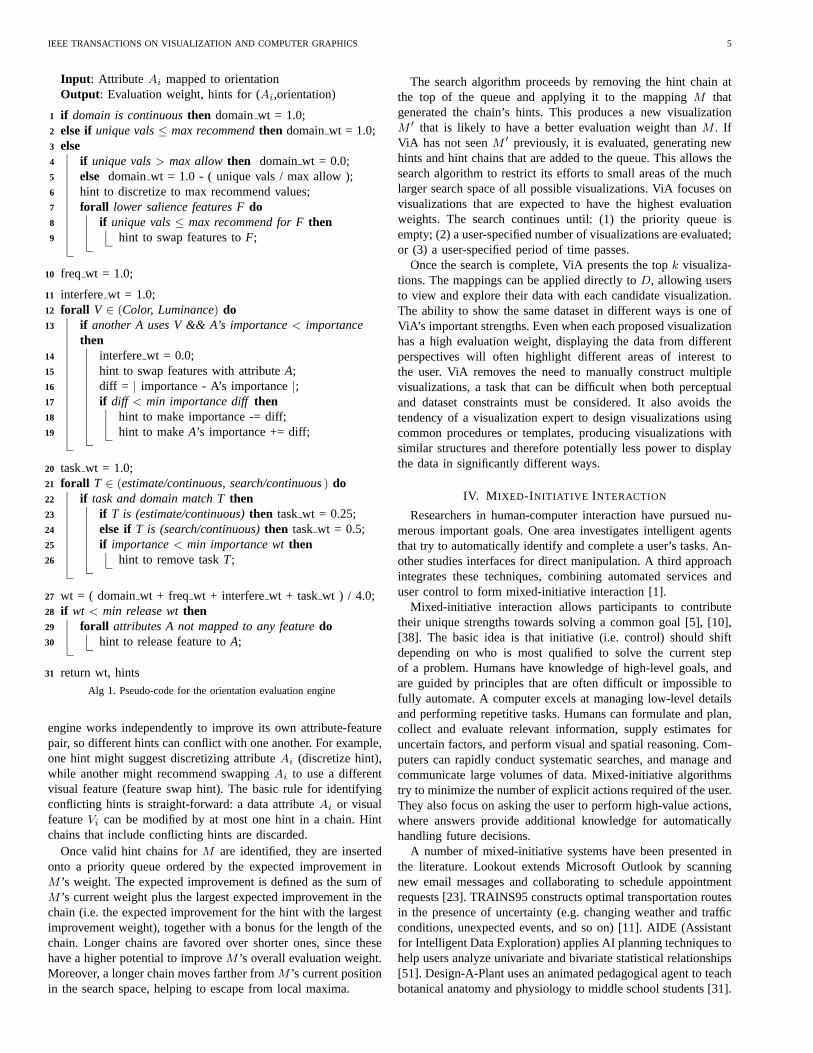
Each test is weighted evenly, comprising 25% of the total evalu-ation score. Their sum is returned as the final evaluation weightfor the current(Ai, Vi) pairing in M . Alg. 1 shows a pseudo-code overview describing how the orientation evaluation engineoperates. Although the specifics for number of recommendedvalues, maximum number of allowed values, invalid task anddomain pairs, weight penalties, and so on vary between engines,their basic structure is identical.
We considered different ways to penalize flaws in a visualiza-tion mapping, including some that were fairly complicated. In theend, we decided to begin with a simple set of weight reductions,for example, 1 or 0 for supporting a particular constraint, or aliner increase in a penalty as the mapping moves away from a
known optimal value. This strategy was selected as a startingpoint for two reasons. First, past research in artificial intelligencehas show that very simple weighting schemes for automatedsearch can often produce results that are as good as morecomplicated techniques [9]. Second, choosing basic, recognizablevalues makes it easier to critique and correct the performance ofeach evaluation engine.
Results to date for real-world datasets have been positive, to theextent that although we are considering minor improvements tothe evaluation engines’ weighting schemes, we are not planningwholesale changes to the underlying strategies they employ. Aslong as the existing approach continues to return good results, weintend to leave the evaluation framework intact.
D. Hints
Weights allow the search algorithm to compare different visu-alizations, but they do not offer any clues on how to improvethem. Since the evaluation engines have the specific knowledgeneeded to provide this information, they are also responsiblefor proposing possible improvements for each(Ai, Vi) they test.These suggestions are returned in the form of hints, a specificmodification toM together with an estimate of how muchM willimprove if the modification is applied. The lower the evaluationweight for a particular attribute-feature pair, the more hints theevaluation engine is likely to return.
Four types of modifications can be suggested within a hint:1) Feature swap:Swap featuresVi andVj (e.g. in a situation
where visual interference is occurring betweenVi andVj).2) Importance weight modify:Increase or decrease the impor-
tance weight of attributeAi by a set amount.3) Discretize:Bin Ai’s values into a fixed number of equal-
width intervals.4) Task remove:Remove a task a user has stated he may want
to perform onAi.A hint’s expected improvement weight is calculated directly fromthe penalty for the flaw it is meant to correct. For example, ahint by the orientation evaluation engine to reduce the numberof unique values from above the maximum allowed to belowthe maximum recommended would have an estimated weightimprovement of 0.25 (i.e. it will increasedomain wt from 0 to1, improving the overall evaluation weight by14 , see also Alg. 1).
E. Search Algorithm
Once hints are collected, they are bundled together to formhintchains. Not all combinations of hints are valid. Each evaluation
IEEE TRANSACTIONS ON VISUALIZATION AND COMPUTER GRAPHICS 5
Input : Attribute Ai mapped to orientationOutput : Evaluation weight, hints for (Ai,orientation)
if domain is continuousthen domainwt = 1.0;1
else if unique vals≤ max recommendthen domainwt = 1.0;2
else3
if unique vals> max allowthen domainwt = 0.0;4
else domainwt = 1.0 - ( unique vals / max allow );5
hint to discretize to max recommend values;6
forall lower salience features Fdo7
if unique vals≤ max recommend for Fthen8
hint to swap features toF;9
freq wt = 1.0;10
interferewt = 1.0;11
forall V ∈ (Color, Luminance) do12
if another A uses V && A’s importance< importance13
theninterferewt = 0.0;14
hint to swap features with attributeA;15
diff = | importance - A’s importance|;16
if diff < min importance diffthen17
hint to make importance -= diff;18
hint to makeA’s importance += diff;19
taskwt = 1.0;20
forall T ∈ (estimate/continuous, search/continuous) do21
if task and domain match Tthen22
if T is (estimate/continuous)then taskwt = 0.25;23
else if T is (search/continuous)then taskwt = 0.5;24
if importance< min importance wtthen25
hint to remove taskT;26
wt = ( domainwt + freq wt + interferewt + taskwt ) / 4.0;27
if wt < min release wtthen28
forall attributes A not mapped to any featuredo29
hint to release feature toA;30
return wt, hints31
Alg 1. Pseudo-code for the orientation evaluation engine
engine works independently to improve its own attribute-featurepair, so different hints can conflict with one another. For example,one hint might suggest discretizing attributeAi (discretize hint),while another might recommend swappingAi to use a differentvisual feature (feature swap hint). The basic rule for identifyingconflicting hints is straight-forward: a data attributeAi or visualfeatureVi can be modified by at most one hint in a chain. Hintchains that include conflicting hints are discarded.
Once valid hint chains forM are identified, they are insertedonto a priority queue ordered by the expected improvement inM ’s weight. The expected improvement is defined as the sum ofM ’s current weight plus the largest expected improvement in thechain (i.e. the expected improvement for the hint with the largestimprovement weight), together with a bonus for the length of thechain. Longer chains are favored over shorter ones, since thesehave a higher potential to improveM ’s overall evaluation weight.Moreover, a longer chain moves farther fromM ’s current positionin the search space, helping to escape from local maxima.
The search algorithm proceeds by removing the hint chain atthe top of the queue and applying it to the mappingM thatgenerated the chain’s hints. This produces a new visualizationM ′ that is likely to have a better evaluation weight thanM . IfViA has not seenM ′ previously, it is evaluated, generating newhints and hint chains that are added to the queue. This allows thesearch algorithm to restrict its efforts to small areas of the muchlarger search space of all possible visualizations. ViA focuses onvisualizations that are expected to have the highest evaluationweights. The search continues until: (1) the priority queue isempty; (2) a user-specified number of visualizations are evaluated;or (3) a user-specified period of time passes.
Once the search is complete, ViA presents the topk visualiza-tions. The mappings can be applied directly toD, allowing usersto view and explore their data with each candidate visualization.The ability to show the same dataset in different ways is one ofViA’s important strengths. Even when each proposed visualizationhas a high evaluation weight, displaying the data from differentperspectives will often highlight different areas of interest tothe user. ViA removes the need to manually construct multiplevisualizations, a task that can be difficult when both perceptualand dataset constraints must be considered. It also avoids thetendency of a visualization expert to design visualizations usingcommon procedures or templates, producing visualizations withsimilar structures and therefore potentially less power to displaythe data in significantly different ways.
IV. M IXED-INITIATIVE INTERACTION
Researchers in human-computer interaction have pursued nu-merous important goals. One area investigates intelligent agentsthat try to automatically identify and complete a user’s tasks. An-other studies interfaces for direct manipulation. A third approachintegrates these techniques, combining automated services anduser control to form mixed-initiative interaction [1].
Mixed-initiative interaction allows participants to contributetheir unique strengths towards solving a common goal [5], [10],[38]. The basic idea is that initiative (i.e. control) should shiftdepending on who is most qualified to solve the current stepof a problem. Humans have knowledge of high-level goals, andare guided by principles that are often difficult or impossible tofully automate. A computer excels at managing low-level detailsand performing repetitive tasks. Humans can formulate and plan,collect and evaluate relevant information, supply estimates foruncertain factors, and perform visual and spatial reasoning. Com-puters can rapidly conduct systematic searches, and manage andcommunicate large volumes of data. Mixed-initiative algorithmstry to minimize the number of explicit actions required of the user.They also focus on asking the user to perform high-value actions,where answers provide additional knowledge for automaticallyhandling future decisions.
A number of mixed-initiative systems have been presented inthe literature. Lookout extends Microsoft Outlook by scanningnew email messages and collaborating to schedule appointmentrequests [23]. TRAINS95 constructs optimal transportation routesin the presence of uncertainty (e.g. changing weather and trafficconditions, unexpected events, and so on) [11]. AIDE (Assistantfor Intelligent Data Exploration) applies AI planning techniques tohelp users analyze univariate and bivariate statistical relationships[51]. Design-A-Plant uses an animated pedagogical agent to teachbotanical anatomy and physiology to middle school students [31].
IEEE TRANSACTIONS ON VISUALIZATION AND COMPUTER GRAPHICS 6
One important consideration is how to manage uncertaintyabout a user’s goals during problem solving. A common solutionis to use Bayesian agents to model goals and construct utilitymeasures based on probabilistic relationships [22]. Combiningstatistical models of user goals with the expected utility of actionor inaction forms a critical component of a mixed-initiative system[23].
A. Mixed-Initiative Search
If a user’s initial inputs were fixed, or if ViA’s evaluationweights were insensitive to changes in these inputs, the abilityto support modifications as the search unfolds would not benecessary. Unfortunately, these assumptions do not hold. Manyof ViA’s hints (e.g. discretize, importance weight modify, or taskremove) require explicit changes to the user’s initial constraintsor to the data itself. These hints represent situations where ViAsuggests:If a change can be made to the format of the data orthe users’ choices about what they want to do with the data,thena significantly better visualization may be available. The questionbecomes, should ViA accept the change a hint recommends?
Certain considerations can be used to help with this decision.Larger changes to the data or the user’s inputs are less likelyto be allowed. The probability of a hint being accepted may behigher if its expected improvement weight is larger. Finally, theway a hint was managed in the past can provide clues aboutfuture decisions. For example, if ViA was previously told not todiscretize an attribute, new discretize requests are less likely tobe accepted.
More formally, consider a situation where the user has a desiredgoal stateG, and a hint suggests performing a given operationO
(e.g. discretizing an attribute, or changing its importance weight).One simple way to resolve the hint is to ask the user eachtime a change is desired. This often produces a long sequenceof requests that quickly lead to situations where users answerwithout significant consideration (e.g. always answering “Yes”or “No”). Allowing ViA to decide whether or not to applyOhas its own drawbacks. Even with sophisticated heuristics, ViAcannot correctly anticipate how its users want to proceed for everyoperation. A fully automatic approach does not allow ViA tobenefit from a user’s expertise about the data.
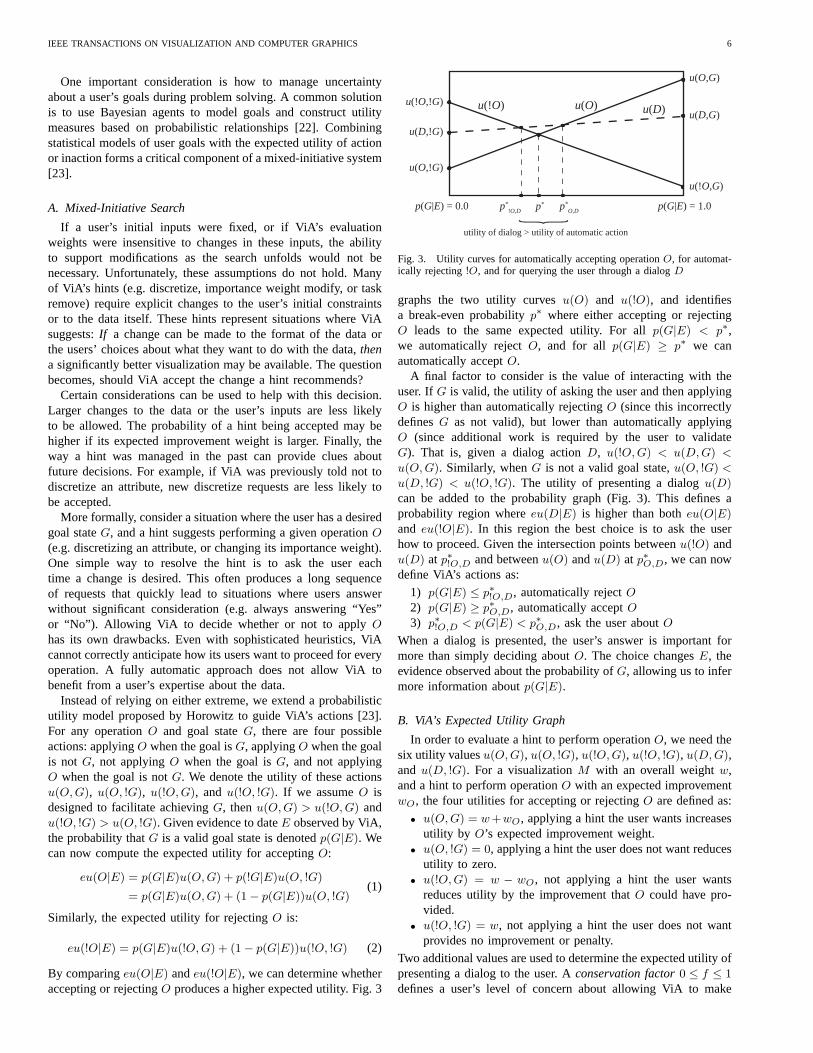
Instead of relying on either extreme, we extend a probabilisticutility model proposed by Horowitz to guide ViA’s actions [23].For any operationO and goal stateG, there are four possibleactions: applyingO when the goal isG, applyingO when the goalis not G, not applyingO when the goal isG, and not applyingO when the goal is notG. We denote the utility of these actionsu(O, G), u(O, !G), u(!O, G), and u(!O, !G). If we assumeO isdesigned to facilitate achievingG, thenu(O, G) > u(!O, G) andu(!O, !G) > u(O, !G). Given evidence to dateE observed by ViA,the probability thatG is a valid goal state is denotedp(G|E). Wecan now compute the expected utility for acceptingO:
eu(O|E) = p(G|E)u(O, G) + p(!G|E)u(O, !G)
= p(G|E)u(O, G) + (1 − p(G|E))u(O, !G)(1)
Similarly, the expected utility for rejectingO is:
eu(!O|E) = p(G|E)u(!O, G) + (1 − p(G|E))u(!O, !G) (2)
By comparingeu(O|E) andeu(!O|E), we can determine whetheraccepting or rejectingO produces a higher expected utility. Fig. 3
p(G|E) = 0.0
u(O,!G)
u(!O,!G)
u(D,!G)
u(O,G)
u(!O,G)
u(D,G)
p*!O,D
p*O,Dp* p(G|E) = 1.0{
utility of dialog > utility of automatic action
u(!O) u(O) u(D)
Fig. 3. Utility curves for automatically accepting operationO, for automat-ically rejecting!O, and for querying the user through a dialogD
graphs the two utility curvesu(O) and u(!O), and identifiesa break-even probabilityp∗ where either accepting or rejectingO leads to the same expected utility. For allp(G|E) < p∗,we automatically rejectO, and for all p(G|E) ≥ p∗ we canautomatically acceptO.
A final factor to consider is the value of interacting with theuser. IfG is valid, the utility of asking the user and then applyingO is higher than automatically rejectingO (since this incorrectlydefinesG as not valid), but lower than automatically applyingO (since additional work is required by the user to validateG). That is, given a dialog actionD, u(!O, G) < u(D, G) <
u(O, G). Similarly, whenG is not a valid goal state,u(O, !G) <
u(D, !G) < u(!O, !G). The utility of presenting a dialogu(D)
can be added to the probability graph (Fig. 3). This defines aprobability region whereeu(D|E) is higher than botheu(O|E)
and eu(!O|E). In this region the best choice is to ask the userhow to proceed. Given the intersection points betweenu(!O) andu(D) at p∗!O,D and betweenu(O) andu(D) at p∗O,D, we can nowdefine ViA’s actions as:
1) p(G|E) ≤ p∗!O,D, automatically rejectO2) p(G|E) ≥ p∗O,D, automatically acceptO3) p∗!O,D < p(G|E) < p∗O,D, ask the user aboutO
When a dialog is presented, the user’s answer is important formore than simply deciding aboutO. The choice changesE, theevidence observed about the probability ofG, allowing us to infermore information aboutp(G|E).
B. ViA’s Expected Utility Graph
In order to evaluate a hint to perform operationO, we need thesix utility valuesu(O, G), u(O, !G), u(!O, G), u(!O, !G), u(D, G),and u(D, !G). For a visualizationM with an overall weightw,and a hint to perform operationO with an expected improvementwO, the four utilities for accepting or rejectingO are defined as:
• u(O, G) = w+wO, applying a hint the user wants increasesutility by O’s expected improvement weight.
• u(O, !G) = 0, applying a hint the user does not want reducesutility to zero.
• u(!O, G) = w − wO, not applying a hint the user wantsreduces utility by the improvement thatO could have pro-vided.
• u(!O, !G) = w, not applying a hint the user does not wantprovides no improvement or penalty.
Two additional values are used to determine the expected utility ofpresenting a dialog to the user. Aconservation factor0 ≤ f ≤ 1
defines a user’s level of concern about allowing ViA to make
IEEE TRANSACTIONS ON VISUALIZATION AND COMPUTER GRAPHICS 7
p=0.0
p=1.0
impi=0.0 imp
i=1.0.3.2 .5 .6.4
(a)
p=0.0
1.0
di=0 5 d
i=u7
(b)
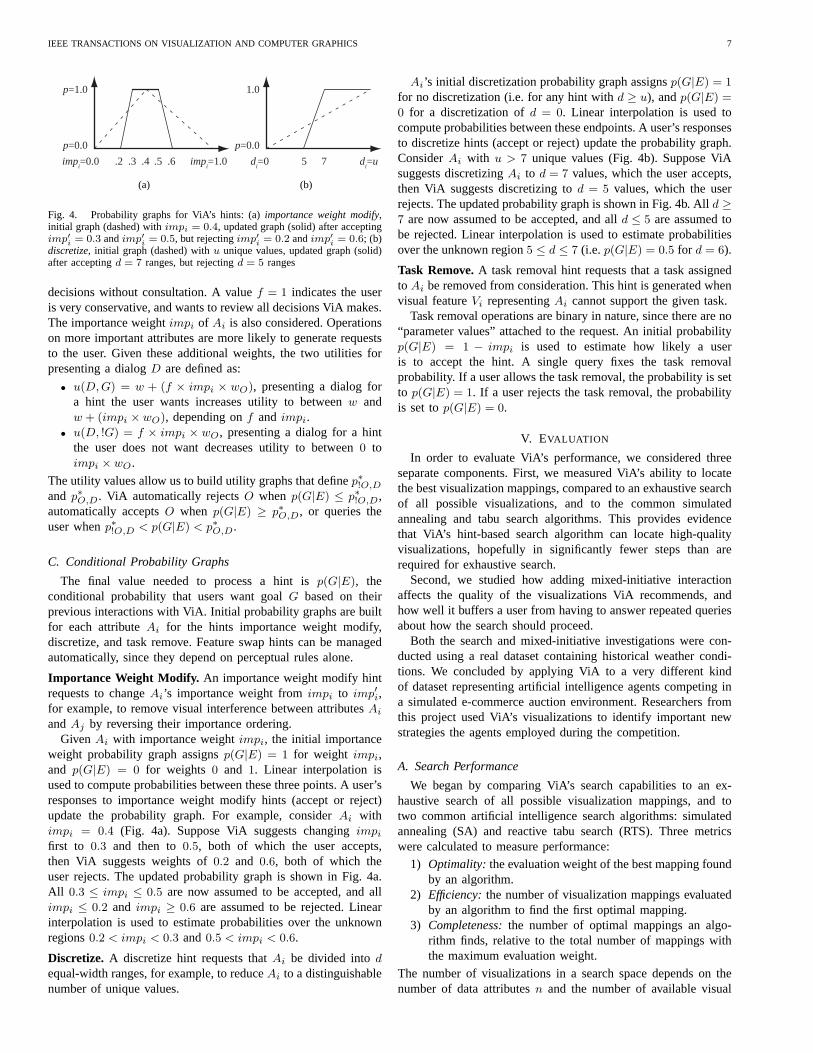
Fig. 4. Probability graphs for ViA’s hints: (a)importance weight modify,initial graph (dashed) withimpi = 0.4, updated graph (solid) after acceptingimp′i = 0.3 andimp′i = 0.5, but rejectingimp′i = 0.2 andimp′i = 0.6; (b)discretize, initial graph (dashed) withu unique values, updated graph (solid)after acceptingd = 7 ranges, but rejectingd = 5 ranges
decisions without consultation. A valuef = 1 indicates the useris very conservative, and wants to review all decisions ViA makes.The importance weightimpi of Ai is also considered. Operationson more important attributes are more likely to generate requeststo the user. Given these additional weights, the two utilities forpresenting a dialogD are defined as:
• u(D, G) = w + (f × impi × wO), presenting a dialog fora hint the user wants increases utility to betweenw andw + (impi × wO), depending onf and impi.
• u(D, !G) = f × impi × wO, presenting a dialog for a hintthe user does not want decreases utility to between0 toimpi × wO.
The utility values allow us to build utility graphs that definep∗!O,D
and p∗O,D. ViA automatically rejectsO when p(G|E) ≤ p∗!O,D,automatically acceptsO when p(G|E) ≥ p∗O,D, or queries theuser whenp∗!O,D < p(G|E) < p∗O,D.
C. Conditional Probability Graphs
The final value needed to process a hint isp(G|E), theconditional probability that users want goalG based on theirprevious interactions with ViA. Initial probability graphs are builtfor each attributeAi for the hints importance weight modify,discretize, and task remove. Feature swap hints can be managedautomatically, since they depend on perceptual rules alone.
Importance Weight Modify. An importance weight modify hintrequests to changeAi’s importance weight fromimpi to imp′i,for example, to remove visual interference between attributesAi
andAj by reversing their importance ordering.Given Ai with importance weightimpi, the initial importance
weight probability graph assignsp(G|E) = 1 for weight impi,and p(G|E) = 0 for weights 0 and 1. Linear interpolation isused to compute probabilities between these three points. A user’sresponses to importance weight modify hints (accept or reject)update the probability graph. For example, considerAi withimpi = 0.4 (Fig. 4a). Suppose ViA suggests changingimpi
first to 0.3 and then to0.5, both of which the user accepts,then ViA suggests weights of0.2 and 0.6, both of which theuser rejects. The updated probability graph is shown in Fig. 4a.All 0.3 ≤ impi ≤ 0.5 are now assumed to be accepted, and allimpi ≤ 0.2 and impi ≥ 0.6 are assumed to be rejected. Linearinterpolation is used to estimate probabilities over the unknownregions0.2 < impi < 0.3 and0.5 < impi < 0.6.
Discretize. A discretize hint requests thatAi be divided intod
equal-width ranges, for example, to reduceAi to a distinguishablenumber of unique values.
Ai’s initial discretization probability graph assignsp(G|E) = 1
for no discretization (i.e. for any hint withd ≥ u), andp(G|E) =
0 for a discretization ofd = 0. Linear interpolation is used tocompute probabilities between these endpoints. A user’s responsesto discretize hints (accept or reject) update the probability graph.ConsiderAi with u > 7 unique values (Fig. 4b). Suppose ViAsuggests discretizingAi to d = 7 values, which the user accepts,then ViA suggests discretizing tod = 5 values, which the userrejects. The updated probability graph is shown in Fig. 4b. Alld ≥7 are now assumed to be accepted, and alld ≤ 5 are assumed tobe rejected. Linear interpolation is used to estimate probabilitiesover the unknown region5 ≤ d ≤ 7 (i.e.p(G|E) = 0.5 for d = 6).
Task Remove.A task removal hint requests that a task assignedto Ai be removed from consideration. This hint is generated whenvisual featureVi representingAi cannot support the given task.
Task removal operations are binary in nature, since there are no“parameter values” attached to the request. An initial probabilityp(G|E) = 1 − impi is used to estimate how likely a useris to accept the hint. A single query fixes the task removalprobability. If a user allows the task removal, the probability is setto p(G|E) = 1. If a user rejects the task removal, the probabilityis set top(G|E) = 0.
V. EVALUATION
In order to evaluate ViA’s performance, we considered threeseparate components. First, we measured ViA’s ability to locatethe best visualization mappings, compared to an exhaustive searchof all possible visualizations, and to the common simulatedannealing and tabu search algorithms. This provides evidencethat ViA’s hint-based search algorithm can locate high-qualityvisualizations, hopefully in significantly fewer steps than arerequired for exhaustive search.
Second, we studied how adding mixed-initiative interactionaffects the quality of the visualizations ViA recommends, andhow well it buffers a user from having to answer repeated queriesabout how the search should proceed.
Both the search and mixed-initiative investigations were con-ducted using a real dataset containing historical weather condi-tions. We concluded by applying ViA to a very different kindof dataset representing artificial intelligence agents competing ina simulated e-commerce auction environment. Researchers fromthis project used ViA’s visualizations to identify important newstrategies the agents employed during the competition.
A. Search Performance
We began by comparing ViA’s search capabilities to an ex-haustive search of all possible visualization mappings, and totwo common artificial intelligence search algorithms: simulatedannealing (SA) and reactive tabu search (RTS). Three metricswere calculated to measure performance:
1) Optimality: the evaluation weight of the best mapping foundby an algorithm.
2) Efficiency:the number of visualization mappings evaluatedby an algorithm to find the first optimal mapping.
3) Completeness:the number of optimal mappings an algo-rithm finds, relative to the total number of mappings withthe maximum evaluation weight.
The number of visualizations in a search space depends on thenumber of data attributesn and the number of available visual
IEEE TRANSACTIONS ON VISUALIZATION AND COMPUTER GRAPHICS 8
TABLE I
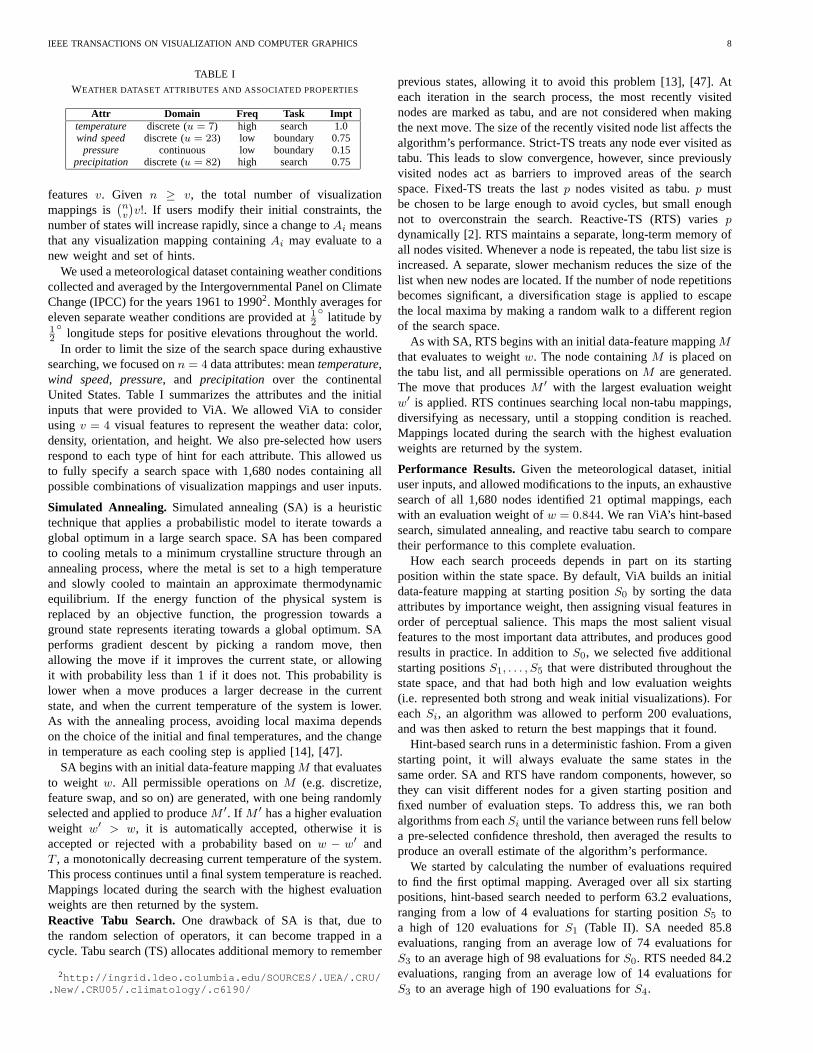
WEATHER DATASET ATTRIBUTES AND ASSOCIATED PROPERTIES
Attr Domain Freq Task Impttemperature discrete (u = 7) high search 1.0wind speed discrete (u = 23) low boundary 0.75
pressure continuous low boundary 0.15precipitation discrete (u = 82) high search 0.75
featuresv. Given n ≥ v, the total number of visualizationmappings is
(nv
)v!. If users modify their initial constraints, the
number of states will increase rapidly, since a change toAi meansthat any visualization mapping containingAi may evaluate to anew weight and set of hints.
We used a meteorological dataset containing weather conditionscollected and averaged by the Intergovernmental Panel on ClimateChange (IPCC) for the years 1961 to 19902. Monthly averages foreleven separate weather conditions are provided at1
2
◦latitude by
12
◦longitude steps for positive elevations throughout the world.
In order to limit the size of the search space during exhaustivesearching, we focused onn = 4 data attributes: meantemperature,wind speed, pressure, and precipitation over the continentalUnited States. Table I summarizes the attributes and the initialinputs that were provided to ViA. We allowed ViA to considerusing v = 4 visual features to represent the weather data: color,density, orientation, and height. We also pre-selected how usersrespond to each type of hint for each attribute. This allowed usto fully specify a search space with 1,680 nodes containing allpossible combinations of visualization mappings and user inputs.
Simulated Annealing. Simulated annealing (SA) is a heuristictechnique that applies a probabilistic model to iterate towards aglobal optimum in a large search space. SA has been comparedto cooling metals to a minimum crystalline structure through anannealing process, where the metal is set to a high temperatureand slowly cooled to maintain an approximate thermodynamicequilibrium. If the energy function of the physical system isreplaced by an objective function, the progression towards aground state represents iterating towards a global optimum. SAperforms gradient descent by picking a random move, thenallowing the move if it improves the current state, or allowingit with probability less than 1 if it does not. This probability islower when a move produces a larger decrease in the currentstate, and when the current temperature of the system is lower.As with the annealing process, avoiding local maxima dependson the choice of the initial and final temperatures, and the changein temperature as each cooling step is applied [14], [47].
SA begins with an initial data-feature mappingM that evaluatesto weight w. All permissible operations onM (e.g. discretize,feature swap, and so on) are generated, with one being randomlyselected and applied to produceM ′. If M ′ has a higher evaluationweight w′ > w, it is automatically accepted, otherwise it isaccepted or rejected with a probability based onw − w′ andT , a monotonically decreasing current temperature of the system.This process continues until a final system temperature is reached.Mappings located during the search with the highest evaluationweights are then returned by the system.Reactive Tabu Search.One drawback of SA is that, due tothe random selection of operators, it can become trapped in acycle. Tabu search (TS) allocates additional memory to remember
2http://ingrid.ldeo.columbia.edu/SOURCES/.UEA/.CRU/.New/.CRU05/.climatology/.c6190/
previous states, allowing it to avoid this problem [13], [47]. Ateach iteration in the search process, the most recently visitednodes are marked as tabu, and are not considered when makingthe next move. The size of the recently visited node list affects thealgorithm’s performance. Strict-TS treats any node ever visited astabu. This leads to slow convergence, however, since previouslyvisited nodes act as barriers to improved areas of the searchspace. Fixed-TS treats the lastp nodes visited as tabu.p mustbe chosen to be large enough to avoid cycles, but small enoughnot to overconstrain the search. Reactive-TS (RTS) variesp
dynamically [2]. RTS maintains a separate, long-term memory ofall nodes visited. Whenever a node is repeated, the tabu list size isincreased. A separate, slower mechanism reduces the size of thelist when new nodes are located. If the number of node repetitionsbecomes significant, a diversification stage is applied to escapethe local maxima by making a random walk to a different regionof the search space.
As with SA, RTS begins with an initial data-feature mappingM
that evaluates to weightw. The node containingM is placed onthe tabu list, and all permissible operations onM are generated.The move that producesM ′ with the largest evaluation weightw′ is applied. RTS continues searching local non-tabu mappings,diversifying as necessary, until a stopping condition is reached.Mappings located during the search with the highest evaluationweights are returned by the system.
Performance Results.Given the meteorological dataset, initialuser inputs, and allowed modifications to the inputs, an exhaustivesearch of all 1,680 nodes identified 21 optimal mappings, eachwith an evaluation weight ofw = 0.844. We ran ViA’s hint-basedsearch, simulated annealing, and reactive tabu search to comparetheir performance to this complete evaluation.
How each search proceeds depends in part on its startingposition within the state space. By default, ViA builds an initialdata-feature mapping at starting positionS0 by sorting the dataattributes by importance weight, then assigning visual features inorder of perceptual salience. This maps the most salient visualfeatures to the most important data attributes, and produces goodresults in practice. In addition toS0, we selected five additionalstarting positionsS1, . . . , S5 that were distributed throughout thestate space, and that had both high and low evaluation weights(i.e. represented both strong and weak initial visualizations). ForeachSi, an algorithm was allowed to perform 200 evaluations,and was then asked to return the best mappings that it found.
Hint-based search runs in a deterministic fashion. From a givenstarting point, it will always evaluate the same states in thesame order. SA and RTS have random components, however, sothey can visit different nodes for a given starting position andfixed number of evaluation steps. To address this, we ran bothalgorithms from eachSi until the variance between runs fell belowa pre-selected confidence threshold, then averaged the results toproduce an overall estimate of the algorithm’s performance.
We started by calculating the number of evaluations requiredto find the first optimal mapping. Averaged over all six startingpositions, hint-based search needed to perform 63.2 evaluations,ranging from a low of 4 evaluations for starting positionS5 toa high of 120 evaluations forS1 (Table II). SA needed 85.8evaluations, ranging from an average low of 74 evaluations forS3 to an average high of 98 evaluations forS0. RTS needed 84.2evaluations, ranging from an average low of 14 evaluations forS3 to an average high of 190 evaluations forS4.
IEEE TRANSACTIONS ON VISUALIZATION AND COMPUTER GRAPHICS 9
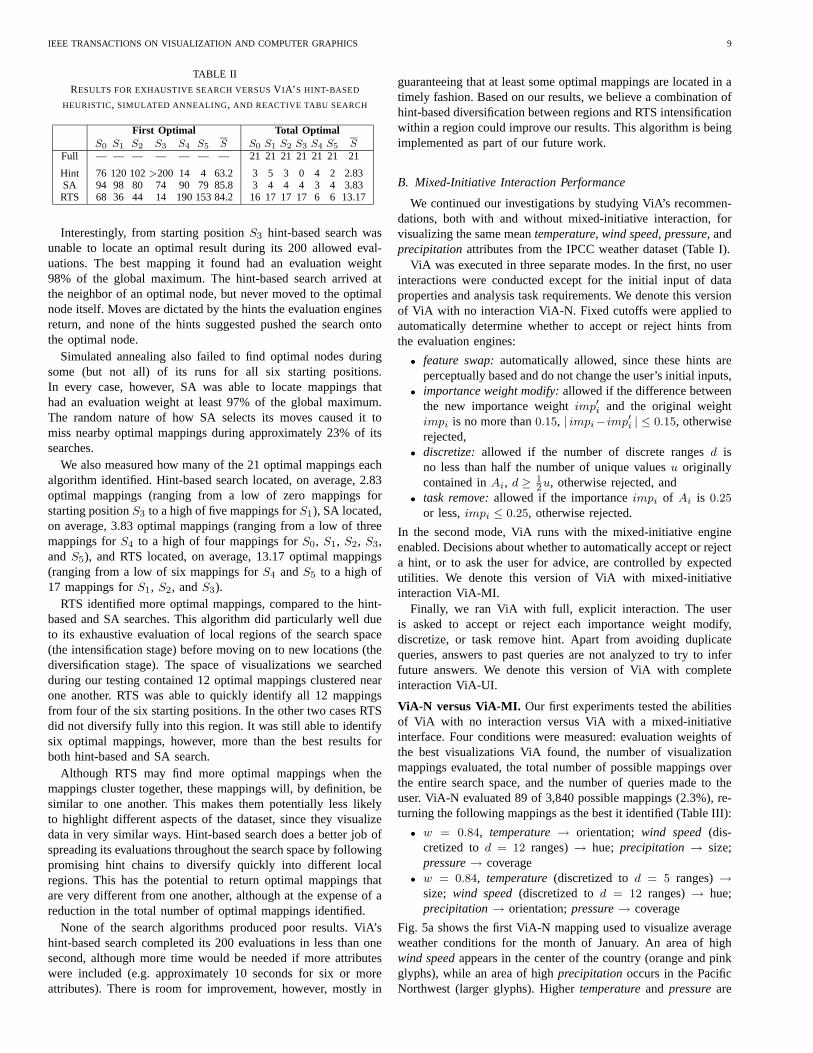
TABLE II
RESULTS FOR EXHAUSTIVE SEARCH VERSUSVIA’ S HINT-BASED
HEURISTIC, SIMULATED ANNEALING , AND REACTIVE TABU SEARCH
First Optimal Total OptimalS0 S1 S2 S3 S4 S5 S S0 S1 S2 S3 S4 S5 S
Full — — — — — — — 21 21 21 21 21 21 21
Hint 76 120 102>200 14 4 63.2 3 5 3 0 4 2 2.83SA 94 98 80 74 90 79 85.8 3 4 4 4 3 4 3.83RTS 68 36 44 14 190 153 84.2 16 17 17 17 6 6 13.17
Interestingly, from starting positionS3 hint-based search wasunable to locate an optimal result during its 200 allowed eval-uations. The best mapping it found had an evaluation weight98% of the global maximum. The hint-based search arrived atthe neighbor of an optimal node, but never moved to the optimalnode itself. Moves are dictated by the hints the evaluation enginesreturn, and none of the hints suggested pushed the search ontothe optimal node.
Simulated annealing also failed to find optimal nodes duringsome (but not all) of its runs for all six starting positions.In every case, however, SA was able to locate mappings thathad an evaluation weight at least 97% of the global maximum.The random nature of how SA selects its moves caused it tomiss nearby optimal mappings during approximately 23% of itssearches.
We also measured how many of the 21 optimal mappings eachalgorithm identified. Hint-based search located, on average, 2.83optimal mappings (ranging from a low of zero mappings forstarting positionS3 to a high of five mappings forS1), SA located,on average, 3.83 optimal mappings (ranging from a low of threemappings forS4 to a high of four mappings forS0, S1, S2, S3,and S5), and RTS located, on average, 13.17 optimal mappings(ranging from a low of six mappings forS4 andS5 to a high of17 mappings forS1, S2, andS3).
RTS identified more optimal mappings, compared to the hint-based and SA searches. This algorithm did particularly well dueto its exhaustive evaluation of local regions of the search space(the intensification stage) before moving on to new locations (thediversification stage). The space of visualizations we searchedduring our testing contained 12 optimal mappings clustered nearone another. RTS was able to quickly identify all 12 mappingsfrom four of the six starting positions. In the other two cases RTSdid not diversify fully into this region. It was still able to identifysix optimal mappings, however, more than the best results forboth hint-based and SA search.
Although RTS may find more optimal mappings when themappings cluster together, these mappings will, by definition, besimilar to one another. This makes them potentially less likelyto highlight different aspects of the dataset, since they visualizedata in very similar ways. Hint-based search does a better job ofspreading its evaluations throughout the search space by followingpromising hint chains to diversify quickly into different localregions. This has the potential to return optimal mappings thatare very different from one another, although at the expense of areduction in the total number of optimal mappings identified.
None of the search algorithms produced poor results. ViA’shint-based search completed its 200 evaluations in less than onesecond, although more time would be needed if more attributeswere included (e.g. approximately 10 seconds for six or moreattributes). There is room for improvement, however, mostly in
guaranteeing that at least some optimal mappings are located in atimely fashion. Based on our results, we believe a combination ofhint-based diversification between regions and RTS intensificationwithin a region could improve our results. This algorithm is beingimplemented as part of our future work.
B. Mixed-Initiative Interaction Performance
We continued our investigations by studying ViA’s recommen-dations, both with and without mixed-initiative interaction, forvisualizing the same meantemperature, wind speed, pressure, andprecipitationattributes from the IPCC weather dataset (Table I).
ViA was executed in three separate modes. In the first, no userinteractions were conducted except for the initial input of dataproperties and analysis task requirements. We denote this versionof ViA with no interaction ViA-N. Fixed cutoffs were applied toautomatically determine whether to accept or reject hints fromthe evaluation engines:
• feature swap:automatically allowed, since these hints areperceptually based and do not change the user’s initial inputs,
• importance weight modify:allowed if the difference betweenthe new importance weightimp′i and the original weightimpi is no more than0.15, | impi−imp′i | ≤ 0.15, otherwiserejected,
• discretize: allowed if the number of discrete rangesd isno less than half the number of unique valuesu originallycontained inAi, d ≥ 1
2u, otherwise rejected, and• task remove:allowed if the importanceimpi of Ai is 0.25
or less,impi ≤ 0.25, otherwise rejected.
In the second mode, ViA runs with the mixed-initiative engineenabled. Decisions about whether to automatically accept or rejecta hint, or to ask the user for advice, are controlled by expectedutilities. We denote this version of ViA with mixed-initiativeinteraction ViA-MI.
Finally, we ran ViA with full, explicit interaction. The useris asked to accept or reject each importance weight modify,discretize, or task remove hint. Apart from avoiding duplicatequeries, answers to past queries are not analyzed to try to inferfuture answers. We denote this version of ViA with completeinteraction ViA-UI.
ViA-N versus ViA-MI. Our first experiments tested the abilitiesof ViA with no interaction versus ViA with a mixed-initiativeinterface. Four conditions were measured: evaluation weights ofthe best visualizations ViA found, the number of visualizationmappings evaluated, the total number of possible mappings overthe entire search space, and the number of queries made to theuser. ViA-N evaluated 89 of 3,840 possible mappings (2.3%), re-turning the following mappings as the best it identified (Table III):
• w = 0.84, temperature→ orientation; wind speed(dis-cretized tod = 12 ranges)→ hue; precipitation → size;pressure→ coverage
• w = 0.84, temperature(discretized tod = 5 ranges)→size; wind speed(discretized tod = 12 ranges)→ hue;precipitation→ orientation;pressure→ coverage
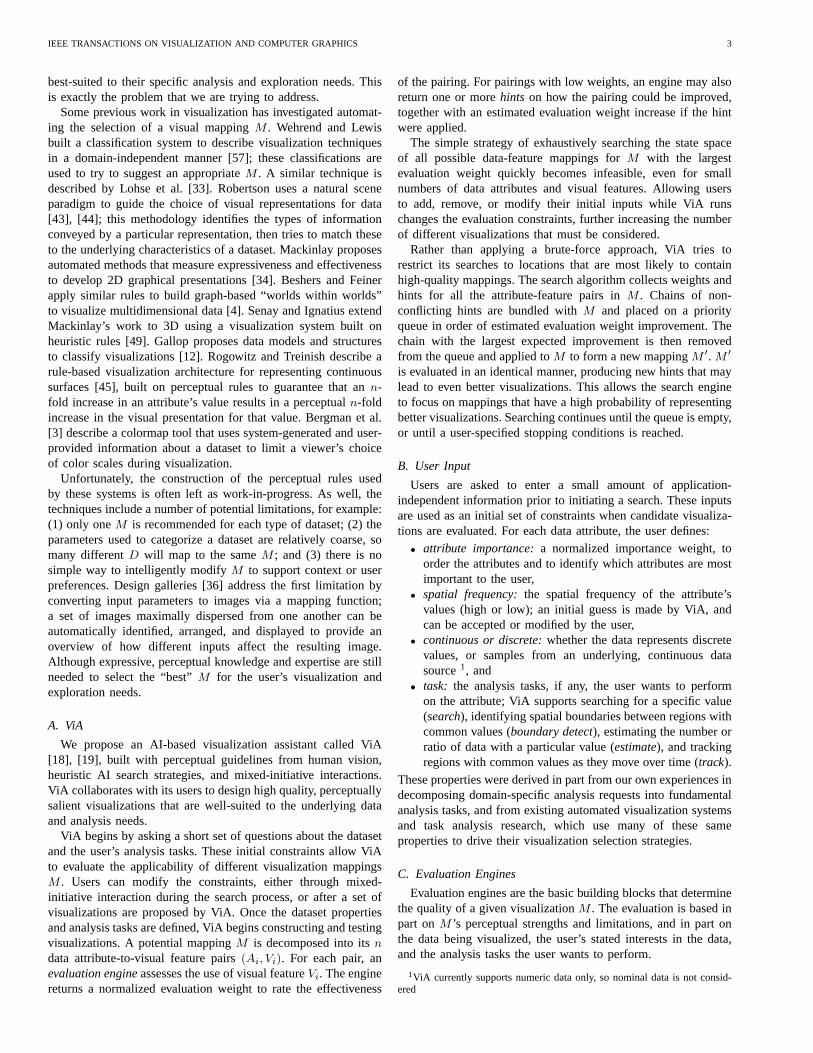
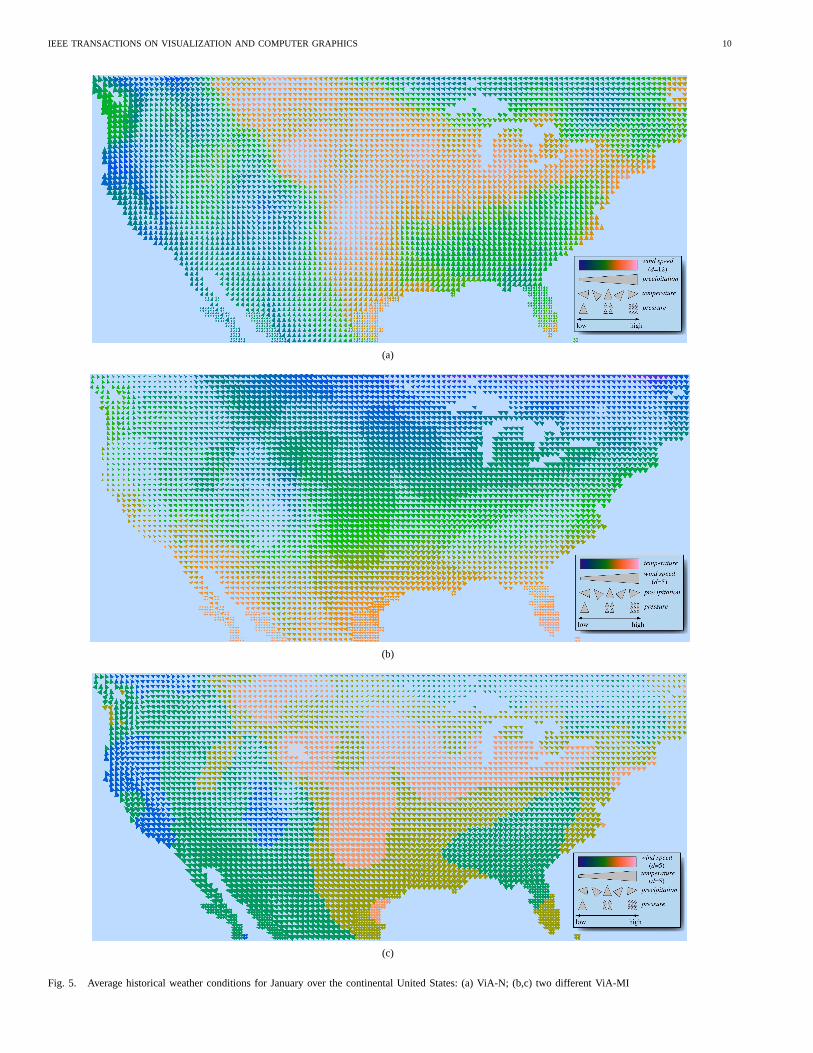
Fig. 5a shows the first ViA-N mapping used to visualize averageweather conditions for the month of January. An area of highwind speedappears in the center of the country (orange and pinkglyphs), while an area of highprecipitationoccurs in the PacificNorthwest (larger glyphs). Highertemperatureand pressureare
IEEE TRANSACTIONS ON VISUALIZATION AND COMPUTER GRAPHICS 10
(a)
(b)
(c)
Fig. 5. Average historical weather conditions for January over the continental United States: (a) ViA-N; (b,c) two different ViA-MI
IEEE TRANSACTIONS ON VISUALIZATION AND COMPUTER GRAPHICS 11
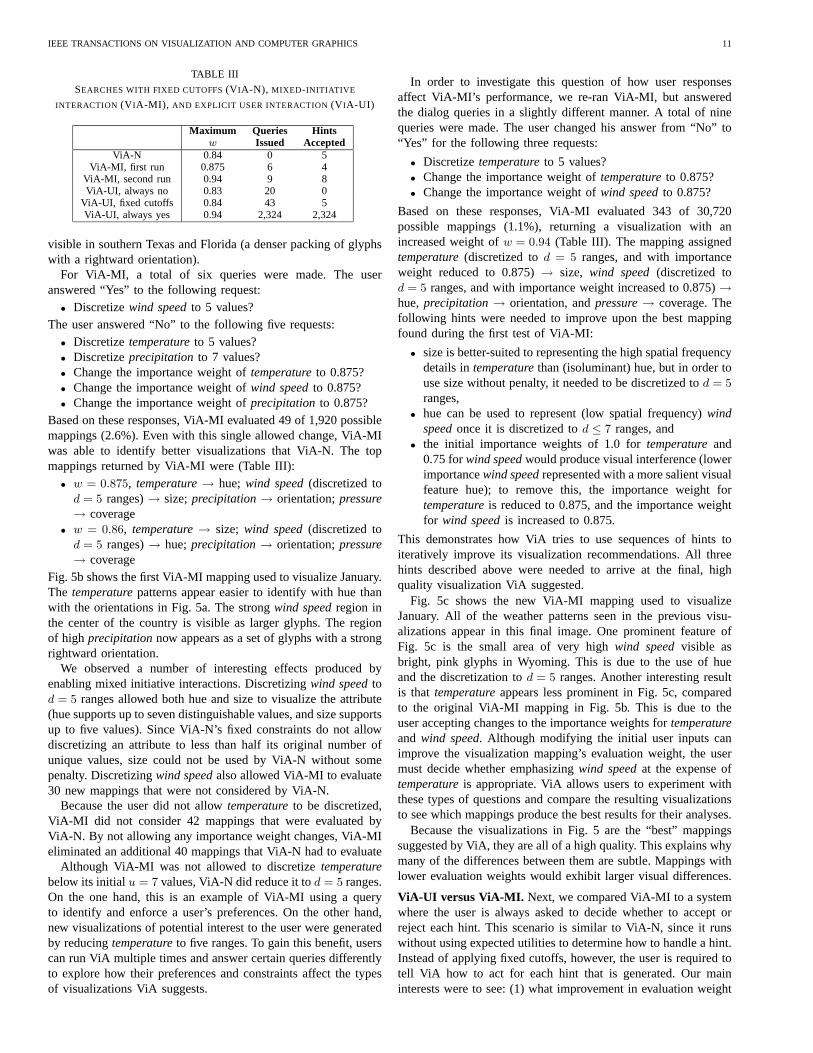
TABLE III
SEARCHES WITH FIXED CUTOFFS(VIA-N), MIXED -INITIATIVE
INTERACTION (VIA-MI), AND EXPLICIT USER INTERACTION(VIA-UI)
Maximum Queries Hintsw Issued Accepted
ViA-N 0.84 0 5ViA-MI, first run 0.875 6 4
ViA-MI, second run 0.94 9 8ViA-UI, always no 0.83 20 0
ViA-UI, fixed cutoffs 0.84 43 5ViA-UI, always yes 0.94 2,324 2,324
visible in southern Texas and Florida (a denser packing of glyphswith a rightward orientation).
For ViA-MI, a total of six queries were made. The useranswered “Yes” to the following request:
• Discretizewind speedto 5 values?The user answered “No” to the following five requests:
• Discretizetemperatureto 5 values?• Discretizeprecipitation to 7 values?• Change the importance weight oftemperatureto 0.875?• Change the importance weight ofwind speedto 0.875?• Change the importance weight ofprecipitation to 0.875?
Based on these responses, ViA-MI evaluated 49 of 1,920 possiblemappings (2.6%). Even with this single allowed change, ViA-MIwas able to identify better visualizations that ViA-N. The topmappings returned by ViA-MI were (Table III):
• w = 0.875, temperature→ hue; wind speed(discretized tod = 5 ranges)→ size;precipitation→ orientation;pressure→ coverage
• w = 0.86, temperature→ size; wind speed(discretized tod = 5 ranges)→ hue;precipitation→ orientation;pressure→ coverage
Fig. 5b shows the first ViA-MI mapping used to visualize January.The temperaturepatterns appear easier to identify with hue thanwith the orientations in Fig. 5a. The strongwind speedregion inthe center of the country is visible as larger glyphs. The regionof high precipitationnow appears as a set of glyphs with a strongrightward orientation.
We observed a number of interesting effects produced byenabling mixed initiative interactions. Discretizingwind speedtod = 5 ranges allowed both hue and size to visualize the attribute(hue supports up to seven distinguishable values, and size supportsup to five values). Since ViA-N’s fixed constraints do not allowdiscretizing an attribute to less than half its original number ofunique values, size could not be used by ViA-N without somepenalty. Discretizingwind speedalso allowed ViA-MI to evaluate30 new mappings that were not considered by ViA-N.
Because the user did not allowtemperatureto be discretized,ViA-MI did not consider 42 mappings that were evaluated byViA-N. By not allowing any importance weight changes, ViA-MIeliminated an additional 40 mappings that ViA-N had to evaluate
Although ViA-MI was not allowed to discretizetemperaturebelow its initialu = 7 values, ViA-N did reduce it tod = 5 ranges.On the one hand, this is an example of ViA-MI using a queryto identify and enforce a user’s preferences. On the other hand,new visualizations of potential interest to the user were generatedby reducingtemperatureto five ranges. To gain this benefit, userscan run ViA multiple times and answer certain queries differentlyto explore how their preferences and constraints affect the typesof visualizations ViA suggests.
In order to investigate this question of how user responsesaffect ViA-MI’s performance, we re-ran ViA-MI, but answeredthe dialog queries in a slightly different manner. A total of ninequeries were made. The user changed his answer from “No” to“Yes” for the following three requests:
• Discretizetemperatureto 5 values?• Change the importance weight oftemperatureto 0.875?• Change the importance weight ofwind speedto 0.875?
Based on these responses, ViA-MI evaluated 343 of 30,720possible mappings (1.1%), returning a visualization with anincreased weight ofw = 0.94 (Table III). The mapping assignedtemperature(discretized tod = 5 ranges, and with importanceweight reduced to 0.875)→ size, wind speed(discretized tod = 5 ranges, and with importance weight increased to 0.875)→hue,precipitation→ orientation, andpressure→ coverage. Thefollowing hints were needed to improve upon the best mappingfound during the first test of ViA-MI:
• size is better-suited to representing the high spatial frequencydetails intemperaturethan (isoluminant) hue, but in order touse size without penalty, it needed to be discretized tod = 5
ranges,• hue can be used to represent (low spatial frequency)wind
speedonce it is discretized tod ≤ 7 ranges, and• the initial importance weights of 1.0 fortemperatureand
0.75 forwind speedwould produce visual interference (lowerimportancewind speedrepresented with a more salient visualfeature hue); to remove this, the importance weight fortemperatureis reduced to 0.875, and the importance weightfor wind speedis increased to 0.875.
This demonstrates how ViA tries to use sequences of hints toiteratively improve its visualization recommendations. All threehints described above were needed to arrive at the final, highquality visualization ViA suggested.
Fig. 5c shows the new ViA-MI mapping used to visualizeJanuary. All of the weather patterns seen in the previous visu-alizations appear in this final image. One prominent feature ofFig. 5c is the small area of very highwind speedvisible asbright, pink glyphs in Wyoming. This is due to the use of hueand the discretization tod = 5 ranges. Another interesting resultis that temperatureappears less prominent in Fig. 5c, comparedto the original ViA-MI mapping in Fig. 5b. This is due to theuser accepting changes to the importance weights fortemperatureand wind speed. Although modifying the initial user inputs canimprove the visualization mapping’s evaluation weight, the usermust decide whether emphasizingwind speedat the expense oftemperatureis appropriate. ViA allows users to experiment withthese types of questions and compare the resulting visualizationsto see which mappings produce the best results for their analyses.
Because the visualizations in Fig. 5 are the “best” mappingssuggested by ViA, they are all of a high quality. This explains whymany of the differences between them are subtle. Mappings withlower evaluation weights would exhibit larger visual differences.
ViA-UI versus ViA-MI. Next, we compared ViA-MI to a systemwhere the user is always asked to decide whether to accept orreject each hint. This scenario is similar to ViA-N, since it runswithout using expected utilities to determine how to handle a hint.Instead of applying fixed cutoffs, however, the user is required totell ViA how to act for each hint that is generated. Our maininterests were to see: (1) what improvement in evaluation weight
IEEE TRANSACTIONS ON VISUALIZATION AND COMPUTER GRAPHICS 12
can we obtain by asking the user to control the hint selectionprocess; and (2) how well ViA-MI insulates the user, that is, howmany hints does ViA-MI manage automatically.
We did not want to force our users to answer the long sequencesof queries generated during this experiment. Instead, we executedViA-UI in three separate scenarios. In the first, we assumed theuser rejected every hint suggested by ViA. In the second, ViA-UImade answers identical to those made by the fixed constraints ofViA-N. In the final scenario, ViA-UI allowed all hints.
When every hint was rejected, the search space was kept small,resulting in 20 unique queries and a maximum visualizationweight of w = 0.83 (Table III). In the second scenario ViA-UI mimicked ViA-N, producing 43 unique queries. The bestvisualization had weightw = 0.84, identical to the ViA-Nscenario. In the final scenario, allowing every hint increased thesize of the search space dramatically, producing 2,324 uniquequeries. The weight for the best visualization wasw = 0.94,identical to ViA-MI’s second experiment.
These results suggest that mixed-initiative interaction offersimportant advantages over fixed constraints or full user control,by increasing the quality of the suggested visualizations whileprotecting the user from answering numerous queries. ViA makesrequests to relax the initial constraints, but focuses on situationswhere this knowledge could significantly improve the visual-izations being generated. ViA caches responses in probabilitygraphs to improve the likelihood of taking automatic actions forfuture hints. ViA also explains why a query is being made, andquantifies the expected improvement of accepting the proposedaction. Keeping the number of queries small and explaining thequery’s purpose and results motivates a user to fully consider ahint and answer knowledgeably about how to proceed.
A final point to recall is that, given the same visual features andperceptual guidelines, ViA cannot suggest visualizations that arebetter than the very best mapping hand-built by a visualizationexpert. ViA’s strength is its ability to rapidly identify visualiza-tions that are well-suited to a given dataset and analysis tasks,without requiring any visualization expertise from its users. Oursearch results demonstrate that ViA is faster and, in many cases,more effective than the typical manual process of designing high-quality visualizations.
C. E-Commerce Datasets
The first two studies highlight the advantages of ViA’s searchalgorithm and mixed-initiative interaction model. This ignores thequestion of whether the evaluation engines accurately identifythe strengths and weaknesses present in a visualization mapping.The rules used within each engine are based on results fromcontrolled psychophysical experiments, specifically to addressthis issue. Real-world validation is still needed to confirm ViA’spractical usefulness, however. To address this need, we conducteda final evaluation by visualizing intelligent agents competing inthe Trading Agent Competition3 (TAC) [18], [20]. The TACimplements different types of online auction rules to mimic awide variety of market games. Intelligent auction agents competewithin the TAC to study different buying and selling strategies.For example, during the first version of the TAC we visualized,agents were tasked to assemble travel packages consisting of:
• a round-trip flight to Boston,
3http://tac.eecs.umich.edu
TABLE IV
TAC ATTRIBUTES AND ASSOCIATED PROPERTIES
Attr Domain Freq Task Imptagent ID discrete (u = 8) high search 1.0
price continuous low boundary 0.5quantity discrete (u = 10) high estimate 0.5
• a hotel reservation during the trip, and• tickets to entertainment events during the trip.
All three products are traded in separate markets with differentauction rules. For example, hotel room auctions run as follows:
1) One economy and one luxury hotel offer sixteen roomsevery evening.
2) Each hotel-evening pair runs as a separate auction.3) An auction ends when the simulation ends, or a random
period of inactivity passes with no new bids.4) All rooms are sold at the sixteenth bid price (i.e. the sixteen
highest bids win, but they all pay the sixteenth bid price).
Other auctions run with slightly different rules. For airline tickets,one flight operates every day as a separate auction, with enoughseats to satisfy any number of customers and with prices rangingfrom $150 to $600, changing by±$10 every 20 to 30 seconds.For entertainment tickets, every agent receives an initial allotmentof tickets, which they buy and sell with other agents in a stockmarket fashion. As with hotels, a separate auction is held for eachevening-event combination.
We began by asking the TAC designers to identify the attributesto visualize. They chose thetime, auction ID, agent ID, price, andquantity for every bid made during the simulation. ViA does notsuggest spatial layout of information, so we consulted with theTAC designers to choosetime and auction ID to define a bid’sx and y-position on a two-dimensional grid. 3D tower glyphsthat can vary in their hue, luminance, height (size), density, andregularity of placement were used to represent the remainingattributes:agent ID, price,andquantity (Table IV).
After further discussion, we allowedquantity to be discretizedinto (as few as) three equal-width ranges.agent ID was notmodified, since viewers need to identify specific agents duringthe simulation. Finally, ViA was not allowed to change anyimportance weights or discard any analysis tasks.
Based on these restrictions, a total of nineteenM wereevaluated. The smaller number of attributes and visual features,together with the constraints on how mappings could be modified,kept this number low (without these constraints, ViA would haveevaluated 189 separateM ). A number of promisingM remained,for example:
• w = 0.862, agent ID→ color, price → height,quantity→density (discretized tod = 4 ranges)
• w = 0.787, agent ID→ color, price → density,quantity→height
Given these mappings, we chose a modified versionMf of thefirst mapping for the final visualizations. Instead of using densityto representquantity, Mf varies each tower’s width. This supportsa wider range ofquantityvalues, and it uncouplesquantity fromvertical density, allowing us to use this spatial property to showmultiple bids within a commontime andauction ID.
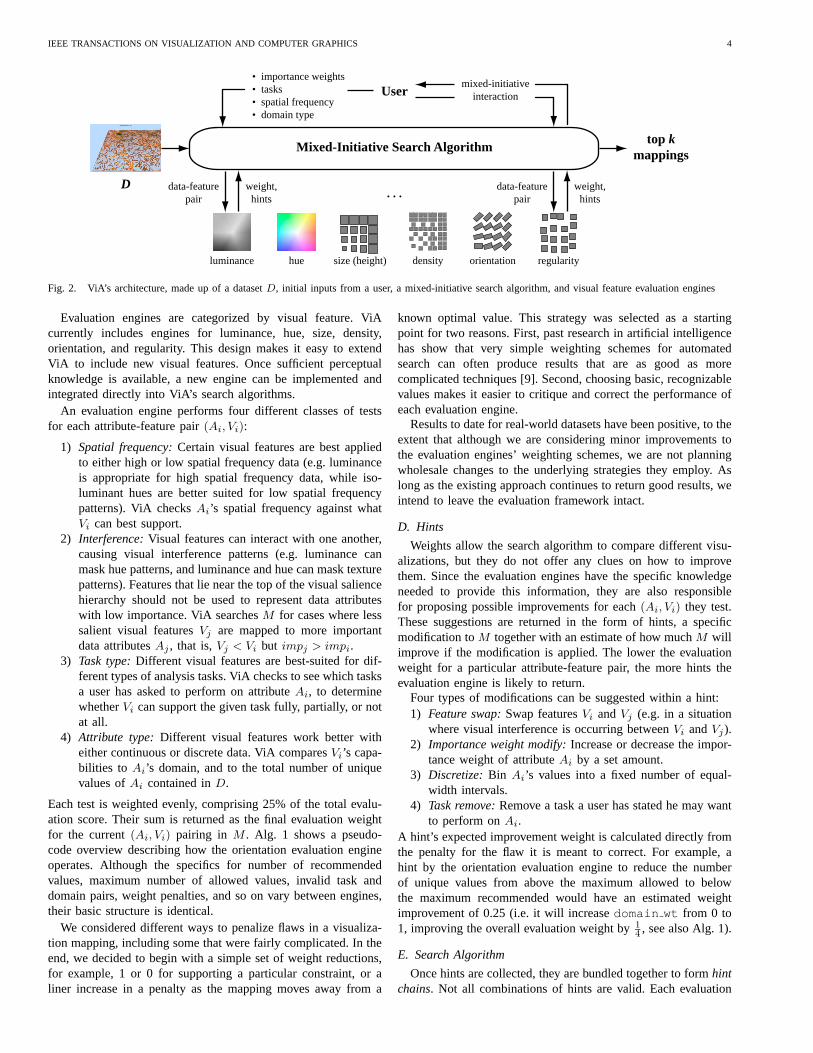
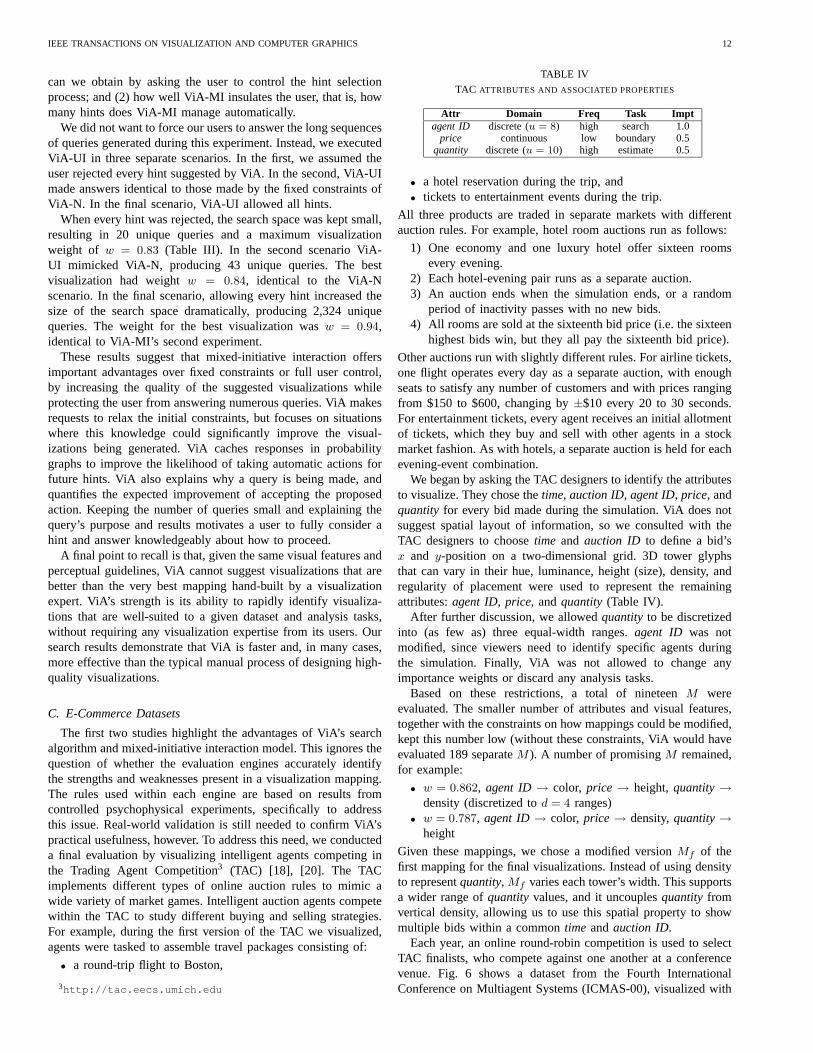
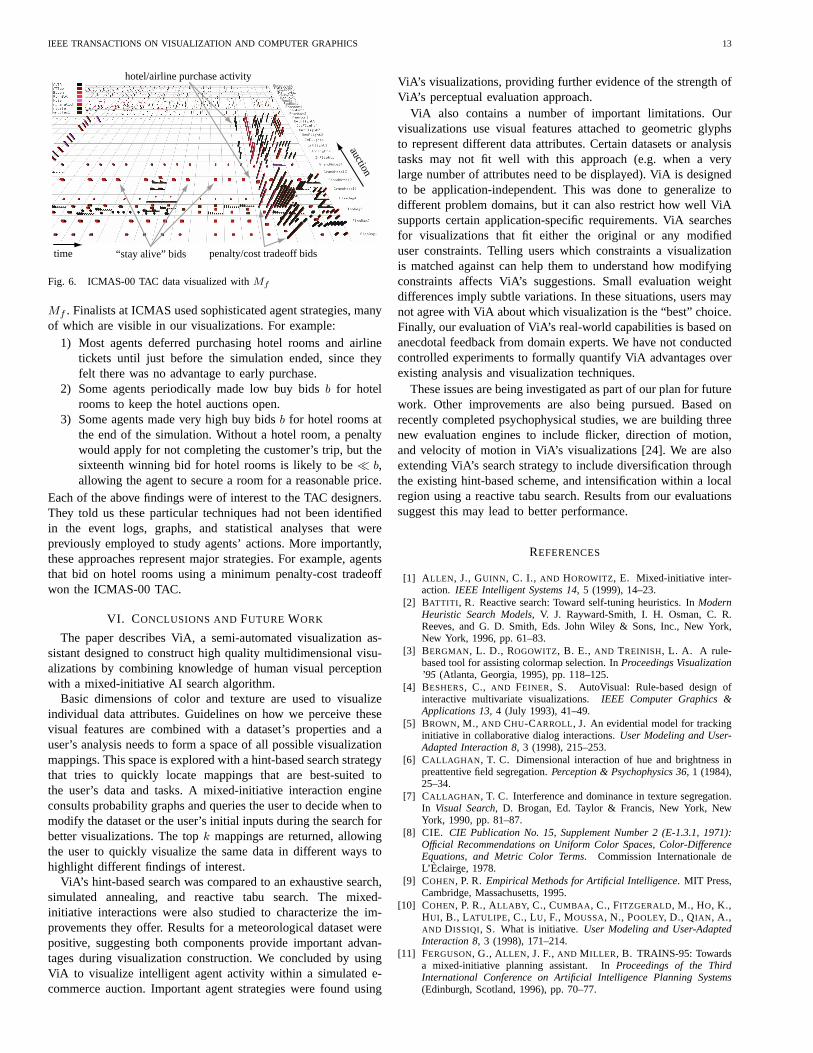
Each year, an online round-robin competition is used to selectTAC finalists, who compete against one another at a conferencevenue. Fig. 6 shows a dataset from the Fourth InternationalConference on Multiagent Systems (ICMAS-00), visualized with
IEEE TRANSACTIONS ON VISUALIZATION AND COMPUTER GRAPHICS 13
hotel/airline purchase activity
“stay alive” bidstime
auction
penalty/cost tradeoff bids
Fig. 6. ICMAS-00 TAC data visualized withMf
Mf . Finalists at ICMAS used sophisticated agent strategies, manyof which are visible in our visualizations. For example:
1) Most agents deferred purchasing hotel rooms and airlinetickets until just before the simulation ended, since theyfelt there was no advantage to early purchase.
2) Some agents periodically made low buy bidsb for hotelrooms to keep the hotel auctions open.
3) Some agents made very high buy bidsb for hotel rooms atthe end of the simulation. Without a hotel room, a penaltywould apply for not completing the customer’s trip, but thesixteenth winning bid for hotel rooms is likely to be� b,allowing the agent to secure a room for a reasonable price.
Each of the above findings were of interest to the TAC designers.They told us these particular techniques had not been identifiedin the event logs, graphs, and statistical analyses that werepreviously employed to study agents’ actions. More importantly,these approaches represent major strategies. For example, agentsthat bid on hotel rooms using a minimum penalty-cost tradeoffwon the ICMAS-00 TAC.
VI. CONCLUSIONS ANDFUTURE WORK
The paper describes ViA, a semi-automated visualization as-sistant designed to construct high quality multidimensional visu-alizations by combining knowledge of human visual perceptionwith a mixed-initiative AI search algorithm.
Basic dimensions of color and texture are used to visualizeindividual data attributes. Guidelines on how we perceive thesevisual features are combined with a dataset’s properties and auser’s analysis needs to form a space of all possible visualizationmappings. This space is explored with a hint-based search strategythat tries to quickly locate mappings that are best-suited tothe user’s data and tasks. A mixed-initiative interaction engineconsults probability graphs and queries the user to decide when tomodify the dataset or the user’s initial inputs during the search forbetter visualizations. The topk mappings are returned, allowingthe user to quickly visualize the same data in different ways tohighlight different findings of interest.
ViA’s hint-based search was compared to an exhaustive search,simulated annealing, and reactive tabu search. The mixed-initiative interactions were also studied to characterize the im-provements they offer. Results for a meteorological dataset werepositive, suggesting both components provide important advan-tages during visualization construction. We concluded by usingViA to visualize intelligent agent activity within a simulated e-commerce auction. Important agent strategies were found using
ViA’s visualizations, providing further evidence of the strength ofViA’s perceptual evaluation approach.
ViA also contains a number of important limitations. Ourvisualizations use visual features attached to geometric glyphsto represent different data attributes. Certain datasets or analysistasks may not fit well with this approach (e.g. when a verylarge number of attributes need to be displayed). ViA is designedto be application-independent. This was done to generalize todifferent problem domains, but it can also restrict how well ViAsupports certain application-specific requirements. ViA searchesfor visualizations that fit either the original or any modifieduser constraints. Telling users which constraints a visualizationis matched against can help them to understand how modifyingconstraints affects ViA’s suggestions. Small evaluation weightdifferences imply subtle variations. In these situations, users maynot agree with ViA about which visualization is the “best” choice.Finally, our evaluation of ViA’s real-world capabilities is based onanecdotal feedback from domain experts. We have not conductedcontrolled experiments to formally quantify ViA advantages overexisting analysis and visualization techniques.
These issues are being investigated as part of our plan for futurework. Other improvements are also being pursued. Based onrecently completed psychophysical studies, we are building threenew evaluation engines to include flicker, direction of motion,and velocity of motion in ViA’s visualizations [24]. We are alsoextending ViA’s search strategy to include diversification throughthe existing hint-based scheme, and intensification within a localregion using a reactive tabu search. Results from our evaluationssuggest this may lead to better performance.
REFERENCES
[1] A LLEN, J., GUINN, C. I., AND HOROWITZ, E. Mixed-initiative inter-action. IEEE Intelligent Systems 14, 5 (1999), 14–23.
[2] BATTITI , R. Reactive search: Toward self-tuning heuristics. InModernHeuristic Search Models, V. J. Rayward-Smith, I. H. Osman, C. R.Reeves, and G. D. Smith, Eds. John Wiley & Sons, Inc., New York,New York, 1996, pp. 61–83.
[3] BERGMAN, L. D., ROGOWITZ, B. E., AND TREINISH, L. A. A rule-based tool for assisting colormap selection. InProceedings Visualization’95 (Atlanta, Georgia, 1995), pp. 118–125.
[4] BESHERS, C., AND FEINER, S. AutoVisual: Rule-based design ofinteractive multivariate visualizations.IEEE Computer Graphics &Applications 13, 4 (July 1993), 41–49.
[5] BROWN, M., AND CHU-CARROLL, J. An evidential model for trackinginitiative in collaborative dialog interactions.User Modeling and User-Adapted Interaction 8, 3 (1998), 215–253.
[6] CALLAGHAN , T. C. Dimensional interaction of hue and brightness inpreattentive field segregation.Perception & Psychophysics 36, 1 (1984),25–34.
[7] CALLAGHAN , T. C. Interference and dominance in texture segregation.In Visual Search, D. Brogan, Ed. Taylor & Francis, New York, NewYork, 1990, pp. 81–87.
[8] CIE. CIE Publication No. 15, Supplement Number 2 (E-1.3.1, 1971):Official Recommendations on Uniform Color Spaces, Color-DifferenceEquations, and Metric Color Terms. Commission Internationale deL’ Eclairge, 1978.
[9] COHEN, P. R. Empirical Methods for Artificial Intelligence. MIT Press,Cambridge, Massachusetts, 1995.
[10] COHEN, P. R., ALLABY, C., CUMBAA , C., FITZGERALD, M., HO, K.,HUI, B., LATULIPE, C., LU, F., MOUSSA, N., POOLEY, D., QIAN , A.,AND DISSIQI, S. What is initiative.User Modeling and User-AdaptedInteraction 8, 3 (1998), 171–214.
[11] FERGUSON, G., ALLEN, J. F.,AND MILLER, B. TRAINS-95: Towardsa mixed-initiative planning assistant. InProceedings of the ThirdInternational Conference on Artificial Intelligence Planning Systems(Edinburgh, Scotland, 1996), pp. 70–77.
IEEE TRANSACTIONS ON VISUALIZATION AND COMPUTER GRAPHICS 14
[12] GALLOP, J. Underlying data models and structures for visualization. InScientific Visualization: Advances and Challenges, L. Rosenblum, Ed.Academic Press, San Diego, California, 1994, pp. 87–102.
[13] GLOVER, F., AND LAGUNA, M. Tabu search. InModern HeuristicTechniques for Combinatorial Problems, C. R. Reeves, Ed. BlackwellScientific Publishing, Oxford, UK, 1993, pp. 70–150.
[14] GRAY, P., HART, W., PAINTON, L., PHILLIPS, C., TRAHAN, M., AND
WAGNER, J. A survey of global optimization methods.http://www.cs.sandia.gov/opt/survey/main.html.1997 , 1997.
[15] HEALEY, C. G., BOOTH, K. S., AND ENNS, J. T. Harnessing preat-tentive processes for multivariate data visualization. InProceedingsGraphics Interface ’93(Toronto, Canada, 1993), pp. 107–117.
[16] HEALEY, C. G.,AND ENNS, J. T. Large datasets at a glance: Combiningtextures and colors in scientific visualization.IEEE Transactions onVisualization and Computer Graphics 5, 2 (1999), 145–167.
[17] HEALEY, C. G., ENNS, J. T., TATEOSIAN, L. G., AND REMPLE,M. Perceptually-based brush strokes for nonphotorealistic visualization.ACM Transactions on Graphics 23, 1 (2004), 64–96.
[18] HEALEY, C. G., ST. AMANT, R.,AND CHANG, J. Assisted visualizationof e-commerce auction agents. InProceedings Graphics Interface 2001(Ottawa, Canada, 2001), pp. 201–208.
[19] HEALEY, C. G., ST. AMANT, R., AND ELHADDAD , M. ViA: Aperceptual visualization assistant. In28th Workshop on AdvancedImagery Pattern Recognition (AIPR-99)(Washington, DC, 1999), pp. 1–11.
[20] HEALEY, C. G.,AND WURMAN, P. R. Visualizing market data.IEEEInternet Computing 5, 2 (2001), 88.
[21] HIBBARD, B., AND SANTEK, D. The VIS-5D system for easy inter-active visualization. InProceedings Visualization ’90(San Francisco,California, 1990), pp. 28–35.
[22] HOROWITZ, E. Uncertainty, action and interaction: In pursuit of mixed-initiative computing.IEEE Intelligent Systems 14, 5 (1990), 17–20.
[23] HOROWITZ, E. Principles of mixed initiative user interfaces. InProceedings SIGCHI ’99(Pittsburgh, Pennsylvania, 1999), pp. 159–166.
[24] HUBER, D. E., AND HEALEY, C. G. Visualizing data with motion.In Proceedings Visualization 2005(Minneapolis, Minnesota, 2005),pp. 527–534.
[25] INTERRANTE, V. Illustrating surface shape in volume data via principledirection-driven 3D line integral convolution. InSIGGRAPH 97 Con-ference Proceedings(Los Angeles, California, 1997), T. Whitted, Ed.,pp. 109–116.
[26] INTERRANTE, V. Harnessing natural textures for multivariate visualiza-tion. IEEE Computer Graphics & Applications 20, 6 (2000), 6–11.
[27] JOHNSON, C. R. Top scientific visualization research problems.IEEEComputer Graphics & Applications 24, 4 (2004), 13–17.
[28] JOHNSON, C. R., MOORHEAD, R., MUNZNER, T., PFSITER, H.,RHEINGANS, P., AND YOO, T. S. E. NIH/NSF Visualization ResearchChallenges Report. IEEE Press, Piscataway, New Jersey, 2006.
[29] JULESZ, B., GILBERT, E. N., AND SHEPP, L. A. Inability of humansto discriminate between visual textures that agree in second-orderstatistics—revisited.Perception 2(1973), 391–405.
[30] LAIDLAW , D. H., KIRBY, R. M., JACKSON, C. D., DAVIDSON, J. S.,MILLER, T. S., DA SILVA , M., WARREN, W. H., AND TARR, M. J.Comparing 2D vector field visualization methods: A user study.IEEETransactions on Visualization and Computer Graphics 11, 1 (2005), 59–70.
[31] LESTER, J. C., STONE, B. A., AND STELLING, G. D. Lifelikepedagogical agents for mixed-initiative problem solving in constructivistlearning environments.User Modeling and User-Adapted Interaction 9,1 (1999), 1–44.
[32] LEVKOWITZ, H., AND HERMAN, G. T. Color scales for image data.IEEE Computer Graphics & Applications 12, 1 (1992), 72–80.
[33] LOHSE, J., RUETER, H., BIOLSI, K., AND WALKER, N. Classifyingvisual knowledge representations: A foundation for visualization re-search. InProceedings Visualization ’90(San Francisco, California,1990), pp. 131–138.
[34] MACKINLAY , J. Automating the design of graphical presentations ofrelational information. ACM Transactions on Graphics 5, 2 (1986),110–141.
[35] MALIK , J., AND PERONA, P. Preattentive texture discrimination withearly vision mechanisms.Journal of the Optical Society of America A7, 5 (1990), 923–932.
[36] MARKS, J., ANDALMAN , B., BEARDSLEY, P. A., FREEMAN, W.,GIBSON, S., HODGINS, J.,AND KANG, T. Design galleries: A generalapproach to setting parameters for computer graphics and animation.In SIGGRAPH 97 Conference Proceedings(Los Angeles, California,1997), T. Whitted, Ed., pp. 389–400.
[37] MCCORMICK, B. H., DEFANTI , T. A., AND BROWN, M. D. Visualiza-tion in scientific computing.Computer Graphics 21, 6 (1987), 1–14.
[38] MILLER, B. Is explicit representation of initiative desirable? InWorkingNotes of AAAI 97 Spring Symposium on Mixed-Initiative Interaction(Stanford, California, 1997), pp. 105–110.
[39] MUNSELL, A. H. A Color Notation. Geo. H. Ellis Co., Boston,Massachusetts, 1905.
[40] RAO, A. R., AND LOHSE, G. L. Towards a texture naming system:Identifying relevant dimensions of texture. InProceedings Visualization’93 (San Jose, California, 1993), pp. 220–227.
[41] REED, T. R., AND HANS DU BUF, J. M. A review of recent texturesegmentation and feature extraction techniques.CVGIP: Image Under-standing 57, 3 (1993), 359–372.
[42] RHEINGANS, P., AND TEBBS, B. A tool for dynamic explorations ofcolor mappings.Computer Graphics 24, 2 (1990), 145–146.
[43] ROBERTSON, P. K. A methodology for scientific data visualisation:Choosing representations based on a natural scene paradigm. InPro-ceedings Visualization ’90(San Francisco, California, 1990), pp. 114–123.
[44] ROBERTSON, P. K., AND DE FERRARI, L. Systematic approaches tovisualization: Is a reference model needed? InScientific Visualization:Advances and Challenges, L. Rosenblum, Ed. Academic Press, SanDiego, California, 1994, pp. 239–250.
[45] ROGOWITZ, B. E.,AND TREINISH, L. A. An architecture for perceptualrule-based visualization. InProceedings Visualization ’93(San Jose,California, 1993), pp. 236–243.
[46] ROSENBLUM, L. J. Research issues in scientific visualization.IEEEComputer Graphics & Applications 14, 2 (1994), 61–85.
[47] RUSSELL, S. J.,AND NORVIG, P. Artificial Intelligence: A ModernApproach, 2nd Edition. Prentice-Hall, Inc., Upper Saddle River, NewJersey, 2003.
[48] SCHROEDER, W., MARTIN, K., AND LORENSEN, B. The VisualizationToolkit. Prentice-Hall, Inc., Upper Saddle River, New Jersey, 1998.
[49] SENAY, H., AND IGNATIUS, E. A knowledge-based system for visual-ization design.IEEE Computer Graphics & Applications 14, 6 (1994),36–47.
[50] SNOWDEN, R. J. Texture segregation and visual search: A comparisonof the effects of random variations along irrelevant dimensions.Journalof Experimental Psychology: Human Perception and Performance 24, 5(1998), 1354–1367.
[51] ST. AMANT, R., AND COHEN, P. R. Interaction with a mixed-initiativesystem for exploratory data analysis. InProceedings 2nd InternationalConference on Intelligent User Interfaces (IUI ’97)(Orlando, Florida,1997), pp. 15–22.
[52] TATEOSIAN, L. G., AND HEALEY, C. G. Engaging viewers withaesthetic visualizations. InProceedings 5th International SymposiumNon-Photorealistic Animation and Rendering (NPAR 2007)(San Diego,California, 2007), p. to appear.
[53] THOMAS, J. J.,AND COOK, K. A. Illuminating the Path: Research andDevelopment Agenda for Visual Analytics. IEEE Press, Piscataway, NewJersey, 2005.
[54] TRIESMAN, A. Search, similarity, and integration of features betweenand within dimensions.Journal of Experimental Psychology: HumanPerception & Performance 17, 3 (1991), 652–676.
[55] WARE, C. Color sequences for univariate maps: Theory, experiments,and principles.IEEE Computer Graphics & Applications 8, 5 (1988),41–49.
[56] WARE, C., AND KNIGHT, W. Using visual texture for informationdisplay. ACM Transactions on Graphics 14, 1 (1995), 3–20.
[57] WEHREND, S., AND LEWIS, C. A problem-oriented classificationof visualization techniques. InProceedings Visualization ’90(SanFrancisco, California, 1990), pp. 139–143.
[58] WEIGLE, C., EMIGH, W. G., LIU, G., TAYLOR, R. M., ENNS, J. T.,AND HEALEY, C. G. Oriented texture slivers: A technique for local valueestimation of multiple scalar fields. InProceedings Graphics Interface2000 (Montreal, Canada, 2000), pp. 163–170.
[59] WOLFE, J. M. Guided Search 2.0: A revised model of visual search.Psychonomic Bulletin & Review 1, 2 (1994), 202–238.
[60] WYSZECKI, G., AND STILES, W. S. Color Science: Concepts andMethods, Quantitative Data and Formulae, 2nd Edition. John Wiley& Sons, Inc., New York, New York, 1982.


![The role of explicit knowledge - Visual Analytics€¦ · Knowledge in Visualization wisdom knowledge information data [Ackoff, 1989] knowledge-assisted visualization [Chen M. et](https://img.pdfslide.us/doc/110x75/5f7d83be3136212e056f120b/the-role-of-explicit-knowledge-visual-analytics-knowledge-in-visualization-wisdom.jpg)