Embed Size (px)
Citation preview
1077-2626 (c) 2017 IEEE. Personal use is permitted, but republication/redistribution requires IEEE permission. See http://www.ieee.org/publications_standards/publications/rights/index.html for more information.
This article has been accepted for publication in a future issue of this journal, but has not been fully edited. Content may change prior to final publication. Citation information: DOI 10.1109/TVCG.2017.2723397, IEEETransactions on Visualization and Computer Graphics
IEEE TRANSACTIONS ON VISUALIZATION AND COMPUTER GRAPHICS, VOL. XX, NO. X, AUGUST 2016 1
Perceptual Biases in Font Sizeas a Data Encoding
Eric Alexander, Chih-Ching Chang, Mariana Shimabukuro,Steven Franconeri, Christopher Collins, Member, IEEE, and Michael Gleicher, Member, IEEE
Abstract—Many visualizations, including word clouds, cartographic labels, and word trees, encode data within the sizes of fonts. Whilefont size can be an intuitive dimension for the viewer, using it as an encoding can introduce factors that may bias the perception of theunderlying values. Viewers might conflate the size of a word’s font with a word’s length, the number of letters it contains, or with thelarger or smaller heights of particular characters (‘o’ vs. ‘p’ vs. ‘b’). We present a collection of empirical studies showing that suchfactors—which are irrelevant to the encoded values—can indeed influence comparative judgements of font size, though less thanconventional wisdom might suggest. We highlight the largest potential biases, and describe a strategy to mitigate them.
Index Terms—Text and document data, cognitive and perceptual skill, quantitative evaluation.
F
1 INTRODUCTION
W ITH the growing amount of textual data available to re-searchers, methods of visualizing such data are of increas-
ing importance. Text visualizations support analysts in many tasks,including forming a gist of a collection of documents, seeingtemporal trends, and finding important documents to read in detail.One common method for encoding data using text rendering is tovary the font size. The importance and impact of font size as anencoding can be seen in a wide variety of contexts, from wordcloud applications [1], [2], [3], to cartographic labeling [4], [5], toa number of different hierarchical visualization tools [6], [7].
However, there has been some question of how effectivepeople are at judging font size encodings [8]. Such concernsarise in part because there are many ways in which words varywith one another outside of font size. In particular, two wordswith the same font size can vary tremendously in their shape.Longer words with more letters take up more area on the screen.The glyphs for some letters are inherently taller or wider thanothers. Kerning and tracking can create diverse spacing betweencharacters. Differences in font would exacerbate these problems,but even the same font can be rendered differently depending onthe platform. Other potential factors that could skew perceptioninclude color, font weight, and a word’s semantic meaning [1],[3], [9], [10], [11].
We are interested in better understanding the ways in whichthese factors may bias font size perception. Such an understandingis important for knowing how much we can trust interpretations ofdata based on font size encodings. Measuring potential biases canalso give us a way of finding limits on the kinds of tasks for whichfont size can be used—and seeing whether or not there are ways
• E. Alexander is with Carleton College, Northfield, MN, 55057.E-mail: [email protected].
• C. Chang and M. Gleicher are with the University of Wisconsin-Madison,Madison, WI, 53706.E-mail: [chih-ching, gleicher]@cs.wisc.edu.
• M. Shimabukuro and C. Collins are with the University of Ontario Instituteof Technology, Oshawa, Ontario, L1H 7K4, Canada.E-mail: [marianaakemi.shimabukuro, christopher.collins]@uoit.ca.
• S. Franconeri is with Northwestern University, Evanston, IL, 60208.E-mail: [email protected].
Manuscript received April 19, 2005; revised August 26, 2015.
in which those limits can be stretched. Additionally, we can beginto tease apart the mechanisms that create those limits in a way thatmay inform the use of similar methods in different contexts.
In this paper, we focus specifically on the degree to which aword’s shape can affect impressions of its font size. We presentthe results from a series of crowdsourced experiments in whichparticipants were asked to judge font size within word cloud visu-alizations. In each experiment, we varied the words along one ofthe axes described above. We found that, in general, performancewas high enough to call into question some existing notions of thelimits of the encoding. However, there were conditions in whichparticipants’ perception of font size was biased. In particular, incases where some physical attribute of the word, such as width,disagreed with its font size, accuracy dropped dramatically formany participants.
Fortunately, this effect can be corrected for. We describe aproof-of-concept method for debiasing font size encodings thatuses colored tags sized proportionally to the data. We empiricallyshow that our debiasing efforts improve performance even in themost pathological cases.
The main contributions of this paper are:
• An evaluation of user accuracy when making comparativejudgements of font size encoding within a visualization,indicating that users may be better at making such judge-ments than conventional wisdom would suggest.
• A description of situations in which these judgements canbe biased by attributes of the words being shown.
• A proof-of-concept method for debiasing visualizations inthese situations using padded bounding boxes.
2 RELATED WORK
Font size has been used to encode data across a number ofvisualization types, and to support a variety of tasks. Investigationsof font size encoding have been largely focused on word cloudsand their overall effectiveness, whereas our work focuses on theperceptual task of comparing word sizes under a variety of real-world conditions.

1077-2626 (c) 2017 IEEE. Personal use is permitted, but republication/redistribution requires IEEE permission. See http://www.ieee.org/publications_standards/publications/rights/index.html for more information.
This article has been accepted for publication in a future issue of this journal, but has not been fully edited. Content may change prior to final publication. Citation information: DOI 10.1109/TVCG.2017.2723397, IEEETransactions on Visualization and Computer Graphics
IEEE TRANSACTIONS ON VISUALIZATION AND COMPUTER GRAPHICS, VOL. XX, NO. X, AUGUST 2016 2
Fig. 1. To test whether attributes of words can affect perception of their font size, we highlighted words within word clouds and asked participants tochoose the larger font. On the left, “zoo” has the larger font, but the length of “moreover” can bias participants toward choosing it as larger. On theright, “source” has the larger font, but the taller ascending and descending parts of “begged” can bias participants toward choosing it as larger.
The most familiar visualizations using font size encodingare tag clouds, more generally called word clouds. Word cloudsrepresent variables of interest (such as popularity) in the visualappearance of the keywords themselves—using text propertiessuch as font size, weight, or color [9]. One particularly popularexample of word clouds is Wordle, an online tool for creatingword clouds that encode word frequency information using fontsize [3]. Taking a cue from the popularity of word clouds, theWord Tree, which is an interactive form of the keyword-in-contexttechnique, uses font size to represent the number of times a wordor phrase appears [7].
Font size has also been used to encode data in cartographicvisualizations, in typographic and knowledge maps. A typographicmap represents streets using textual labels for street names whileencoding spatial data such as traffic density, crime rate, or de-mographic data into the font size [4], [12]. In contrast, Skupinuses font size to indicate semantic clustering, adding a semantichierarchy to his knowledge maps [5].
Rivadeneira et al. performed two experiments on word cloudeffectiveness [11]. In the first, the effects of font size, location, andproximity to the largest word were investigated. The experimentresults showed an effect of font size and position (upper-leftquadrant) on recall; meanwhile, proximity showed no effect. Inthe second experiment, the authors evaluated impression formationand memory by varying font size and layout (e.g., alphabeticalsorting, frequency sorting) of words in the cloud. Font size hada significant effect on recognition, but layout did not. However,the authors found that layout affected the accuracy of impressionformation. From this evaluation, the authors concluded that wordclouds are helpful for people to get a high-level understanding ofthe data, and for casual exploration without a specific target orgoal in mind.
A study by Bateman et al. investigated the visual influenceof word cloud visual properties (font size, tag area, tag width,font weight, number of characters, color, intensity and number ofpixels) for the task of selecting the 10 “most important tags” [9].Participants were asked to find the most attention-grabbing wordout of a word cloud. They report that the features exerting thegreatest visual influence on word clouds were font size, fontweight, saturation and color. However, the authors did not lookat user ability to accurately read data encoded with these features.
A study by Lohmann et al. [10] supports Bateman et al. [9]and Rivadeneira et al. [11] by reporting that words with larger
font sizes attract more attention and are easier to find. However,none of these studies identify the magnitude of this effect for real-world use, or strategies for mitigating the biases. This knowledgeis relevant because when encoding data into font size [4], [5], [7],[13] there is expectation from designers that people can perceivethe difference in size to correctly understand the encoded data.
3 EXPERIMENTAL TASK
There are many different documented tasks for which font sizeencodings have been used. These tasks include:
• Gist-forming: discerning the general meaning of a collec-tion of words, taking their relative importance as coded bytheir font size into account [1], [11], [14].
• Summary comparison: making sense of juxtaposed setsof words from different sources [15], [16].
• Word search: finding a particular word in a visualization[9], [10], [11].
• Retention: being able to recall a word from a particularvisualization, and to distinguish it from others [11].
• Value reading: reading a specific numerical value associ-ated with text [13].
• Order reading: comparing words to determine relativevalue [9], [11].
It has been shown that font size encodings are not the properdesign choice for a number of these tasks, most notably searchingand retention, where simple ordering can be much more effective[11]. In general, font size encodings are more frequently usedfor subjective, high-level tasks like gist-forming. However, it isdifficult to measure perceptual limitations with these tasks. For thisstudy, we were not interested in measuring participants’ cognitiveability to draw connections between groups of words, but rather inbetter understanding their perceptual abilities.
As such, in selecting a task for our experiments, we choseone that we believed would isolate the primitive sub-task ofdiscerning information represented in font size. Specifically, wefocused on a simple comparison task. We would highlight twowords within a visualization containing words of different sizesand ask subjects to choose the one with the larger font size.While value-level accuracy in judging font size seems unnecessaryfor many high-level interpretations, the ability to make accuraterelative judgements of represented data is important. Unless userscan reliably discern that words with higher values are bigger than

1077-2626 (c) 2017 IEEE. Personal use is permitted, but republication/redistribution requires IEEE permission. See http://www.ieee.org/publications_standards/publications/rights/index.html for more information.
This article has been accepted for publication in a future issue of this journal, but has not been fully edited. Content may change prior to final publication. Citation information: DOI 10.1109/TVCG.2017.2723397, IEEETransactions on Visualization and Computer Graphics
IEEE TRANSACTIONS ON VISUALIZATION AND COMPUTER GRAPHICS, VOL. XX, NO. X, AUGUST 2016 3
those with lower values, the relationships between data associatedwith these words will be distorted or lost. We believe that decentlyaccurate perception of relative size is a prerequisite even forsuch high-level tasks as gist-forming and summary comparison,in addition to the more obvious ones of order reading and valuereading. Therefore, though users in the wild are rarely faced with asingle pairwise comparison, we believed performance at this taskwould help us measure the ability to perform higher level tasksthat rely on the same perceptual abilities.
There were other tasks that we considered, as well. Onesolution might have been to ask participants to make an absolutejudgment of font size (e.g., 1.5mm), or to compare to a memorizedbaseline size (e.g., bigger than baseline). Although such tasks aresimple, their detachment from the context of real-world tasksmight have lead to idiosyncratic strategies, such as focusingattention on the height of a single letter instead making a holisticjudgement about a whole word. At the other extreme, anothersolution might have been to ask which word in an entire cloud hasthe biggest font, while systematically manipulating the distributionof font sizes within that cloud. However, this task presents manydegrees of freedom that make precise measurement more difficult.For example, it is not clear whether we should measure precisionas the difference between the biggest font versus the next biggest,of versus the algebraic or geometric mean of the distribution, orversus some other property of the distribution [17], [18], [19].We chose to use the pairwise comparison task in most of ourexperiments for the greater control it offered us. After havingexplored perceptual biases in this task, however, we still wanted tobe sure that what we had found was extensible to more real-worldsituations, and so we ran a set of experiments using the pick-the-biggest-word task, which showed similar results (see Section 7).
4 GENERAL EXPERIMENTAL DESIGN
As discussed in Section 3, we focused on comparative judgementsof size rather than exact ones. In particular, we focused onthe use of word clouds. Not only are these one of the mostcommon mediums for font size encodings, but they also present achallenging context for reading values, given the dense proximityof distracting words and the frequent lack of alignment to anyshared baseline for any pair of words.
4.1 Task Setup and MeasuresParticipants were first given instructions on the task, and read atutorial indicating the difference between a word’s font size andthe area it took up on the screen. Participants were instructed tocomplete the tasks as accurately as possible.
Across multiple experiments, we gave participants the fol-lowing task with different stimuli: Upon being shown a wordcloud in which two words were highlighted using a darker gray,participants were asked to click on the highlighted word that hadbeen given the larger font size. We were sure to fully explainthe distinction between font size and the general footprint of aword on the screen. While others have observed instances of usersmisinterpreting the meaning of font size encodings [3], we wereconcerned primarily with perceptual abilities, and so did not wantthere to be any confusion for participants.
For each task, we recorded which word the participant clicked,as well as the time it took. We measured time only to testfor fatigue effects (were tasks getting slower over time, or wasperformance decreasing)—our primary measure was accuracy. We
used analyses of variance (ANOVAs) to test for differences amongparticipant accuracies across conditions. Upon clicking a word, theparticipant was immediately presented with the next trial.
4.2 Factor AgreementIn each experiment, we tested a potentially biasing word factor tosee if it affected the perception of font size. These factors werefeatures of the words that vary based on the contents of the wordsthemselves, such as word length, rather than attributes of the fontthat could feasibly be controlled across the entire visualization. Tocheck for bias of a factor, we employed a method we have calledfactor agreement.
Factor agreement indicates whether the difference in the factorin question reinforces or opposes the difference in font size (seeFigure 2). For example, if the word within a given pair with thelarger font size also contains more letters, then we would say thatword length agrees with font size. However, if the word with thelarger font size contains fewer letters, we would say word lengthdisagrees with font size. If both words are the same length, thenthe word length factor is neutral. It is not necessarily the case thatany given factor’s agreement or disagreement will affect a user’sperception of font size, but if they do have an effect, we wouldexpect user accuracy to decrease in situations of disagreement.
4.3 StimuliStimuli for these experiments were all generated within a webbrowser. For early experiments, we created our own clouds usingthe D3 visualization library [20]. In later experiments, to createmore realistic scenarios, we used jQCloud [21], a word cloudlibrary that packs words more densely using a spiral layout. Withthe exception of Experiment HEIGHT3, in which we explicitlydecided to test a sans serif font (see Table 1), we used Times NewRoman for all of our stimuli.
The words used in each experiment were either English wordsor “pseudowords” (see Table 1). Pseudowords were constrainedstrings of random characters we created for greater control overthe character glyphs being used and to factor out any semanticweight. Precise characteristics of these pseudowords varied be-tween experiments (see Section 5). When building word cloudswith English words, we drew from the Corpus of ContemporaryAmerican English (COCA) [22]. We built a database that allowedus to query for words with specific attributes (e.g., length).
The two target words between which participants had tochoose varied in their font sizes and attributes from experimentto experiment. They were also joined by 40 distractor wordsin each stimulus, whose sizes were distributed across a normaldistribution. After some calibration through pilot studies, we keptthe difference in font size between the two target words relativelysmall. Accuracy was high enough in these conditions that testinglarger differences was deemed unnecessary.
One issue that came up during experimentation was howdifferent browsers perform subpixel-rendering. For non-integerfont sizes (e.g., 12.5px), modern browsers sometimes use differentrendering methods that can result in participants with differentmachines viewing slightly different sizes. However, as a between-subjects factor, browser differences should not affect the within-subjects factors that make up most of the factors in our ex-periments. Additionally, the experiments we chose to report inthe main body of the paper all used integer-value font sizes.However, it is worth noting that some of the between-subjects

1077-2626 (c) 2017 IEEE. Personal use is permitted, but republication/redistribution requires IEEE permission. See http://www.ieee.org/publications_standards/publications/rights/index.html for more information.
This article has been accepted for publication in a future issue of this journal, but has not been fully edited. Content may change prior to final publication. Citation information: DOI 10.1109/TVCG.2017.2723397, IEEETransactions on Visualization and Computer Graphics
IEEE TRANSACTIONS ON VISUALIZATION AND COMPUTER GRAPHICS, VOL. XX, NO. X, AUGUST 2016 4
Factor
hello hello hellosam world goodbye
help plot corncorn flop help
bigger font,
wider word
disagree
bigger font,
longer wordsame length
bigger font,
shorter word
bigger font,
shorter word
bigger font,
taller word
word length
word height
word width
agree neutral
Factor agreement
bigger font,
narrower word
same
"raw width"joyful
le�er
li�lehummed
li�erfillet
same
"raw height"
Fig. 2. In this figure, we show examples of the different conditions of factor agreement (see §4.2) for the three main factors of word shape thatwe tested: word length, word height, and word width. For height, we were concerned with the use of tall and short characters, rather than heightdifferences resulting from font size. Similarly, for word width, our primary concern was not the final width of the word in the stimulus, but rather theraw width—its width before any changes in font size had been applied. While “litter” is wider than “fillet” in the above figure, they are the same widthwhen written in the same font size.
Fig. 3. For many of our experiments, we used word clouds that webuilt using the D3 visualization library [20]. These clouds dispersedwords randomly throughout the two-dimensional space, restricted onlyby avoiding collisions with the borders and other words. Words wereeither drawn from the English words within COCA [22] or pseudowordscreated using random characters (as shown here).
effects described in the supplemental materials may be influencedby cross-browser differences.
4.4 Participants
Over 12 experiments, we recruited 301 participants using Ama-zon’s Mechanical Turk framework, restricted to native Englishspeakers residing in North America with at least a 95% approvalrating. These participants ranged in age from 18 to 65 (with a
mean of 33) and were made up of 172 males and 129 females. Wepaid participants either $1.00 or $2.00 for their time, dependingon the number of stimuli with which we presented them (whichvaried from 56 to 150).
It is worth noting that by using a crowdsourced framework, wesacrifice control over a number of environmental factors that couldaffect a participant’s perception. These include browser differences(as discussed above), along with things like viewing distance,lighting, etc. Such factors may have influenced differences be-tween participants, and may be worth investigating in future in-person studies. However, we believe we can rely on them beingrelatively consistent for individual participants, and therefore theyshould not affect the reported within-subjects factors.
To account for the varying levels of engagement often seenin participation in online studies, we followed acknowledgedbest practices to improve the reliability of our experimentaldata, including randomizing questions and manually checking for“click-through” behavior [23], [24]. Within each session, we alsoincluded “validation stimuli” with font size differences of a full10 pixels. These validation stimuli were used as engagementchecks to verify that participants had properly understood theinstructions and were giving earnest effort. These questions werenot considered in further analysis.
5 EXPLORING BIASING FACTORS
Over the course of our explorations, we ran over a dozen experi-ments involving hundreds of participants on Amazon’s MechanicalTurk. Rather than describe the results for every experiment indetail, we have organized the main results and takeaways fromeach experiment into Tables 1 and 2 and will discuss a subset ofthem in greater depth in this section. The remaining experimentsare described in full in the supplemental materials. We havestructured the experiments by the main factors that we tested forbias: word length, character height, and word width (shown inFigure 4).

1077-2626 (c) 2017 IEEE. Personal use is permitted, but republication/redistribution requires IEEE permission. See http://www.ieee.org/publications_standards/publications/rights/index.html for more information.
This article has been accepted for publication in a future issue of this journal, but has not been fully edited. Content may change prior to final publication. Citation information: DOI 10.1109/TVCG.2017.2723397, IEEETransactions on Visualization and Computer Graphics
IEEE TRANSACTIONS ON VISUALIZATION AND COMPUTER GRAPHICS, VOL. XX, NO. X, AUGUST 2016 5
Accuracy at min ∆ font sizeLabel E/P Effect of ∆
font sizePrimary bias
factor
Effect ofbias factoragreement
Additionalfactor agree neutral disagree
Notes
len1 P 3 word length† 3 - 0.860 0.879 0.753 Word length biases perception offont size
len2 P 3 word length† 3base font
size‡ 0.861 0.816 0.734 We see a greater bias at larger basefont (30px vs. 20px)
len3 P 3 word length† 3base font
size† 0.825 0.838 0.642 Tested wider variety of baselinefont sizes
len4 E 3 word length† 3 - 0.992 0.942 0.867 Bias still present with Englishwords and denser word clouds
height1 P 3 word height† 3 - 0.974 0.909 0.684 Character heights bias perceptionof font size
height2 P 3 word height† 3 - 0.929 0.810 0.529Proportional difference in font size
seems to matter more thanabsolute difference
height3 P 3 word height† 3 - 0.937 0.795 0.525 Bias still present when wordclouds use sans serif font
height4 P 3 word height† 3base font
size† 0.931 0.790 0.479 We see a greater bias at larger basefont (30px vs. 20px)
height5 P 3 word height† 3base font
size‡ 0.963 0.854 0.489 Accuracy hits ceiling between20-25% size difference
width1 E 3 word width† 3 - 0.975 - 0.909 Bias present when length is heldconstant and width varies
width2 E 7 word length† 7 - 0.982 - 0.982 No bias when width is heldconstant and length varies
box1 E 3 word width† 7 - 0.914 0.932 0.908 No bias with corrected-widthrectangular bounding boxes
big1 P 3 word length† 3number ofnear misses 0.888 0.826 0.658 Tested using “pick the biggest
word” task
big2 P 3 word length† 3number ofnear misses 0.811 - 0.562 Tested wider variety of length
differences† - within-subjects factor ‡ - between-subjects factor
TABLE 1An overview of the experiments we ran for this study. Each experiment compared at least two factors: the difference in font size between the twotarget words, and a potentially biasing factor that was a feature of the words’ shape. (Additional factors tested are described in the supplemental
materials.) Here, we report the effects of these factors and the effect size of factor agreement at the smallest difference in font size tested(generally a 5% difference). Experiments with a white background are described in Sections 5 and 6, while those with a gray background are
described in full in the supplemental materials. In column “E/P”, “E” indicates that English words were used and “P” indicates that “pseudowords”were used (see §4.3).
word width
exampledescendersbaseline
ascendersx-height
word length = 7 characters
shor
tword height ta
ll
Fig. 4. We looked for biasing effects on font size perception for threemain factors of word shape (shown here in blue): word length (§5.1),word height (§5.2), and word width (§5.3). For our experiments on height,words were broken down into two categories: “tall” words containingboth ascenders and descenders, and “short” words whose height wascontained between the font’s baseline and x-height.
5.1 Word Length
The first attribute we tested was word length: the number ofcharacters contained within a word. Longer words take up morespace, and have a larger area than shorter words of the samefont size, and even some shorter words with larger font sizes. Wepredicted that these differences in area could interfere with theability to perceptually distinguish words by pure font size alone.
We ran four total experiments using word length as a testfactor. In each one, we observed a significant effect in whichparticipant accuracy went down when word length disagreed withfont size. The details for these experiments can be found in Tables1 and 2, as well as the supplemental materials. We will describe
two of the most important experiments here.
5.1.1 Experiment LEN1Word length biases perception of font size
For our first experiment on word length, we presented participantswith word clouds of our own creation as described in Section 4.3(see Figure 3). To afford greater control in stimulus generation,we used words of random characters, excluding characters withascenders or descenders (e.g., “h” or “g”—see Figure 4) as wellas characters of abnormal width (e.g., “w” or “i”). We enforceda minimum distance between the two highlighted words, and en-sured that they shared no common horizontal or vertical baselinesthat would aid in comparison.
We tested two main factors: font size and word length. Bothwere examined using within-subject comparisons. Font size forthe first target word was either 20px, 21px, or 22px, while fontsize for the second word was either 20px or 22px. Length for bothtarget words alternated between 5 characters and 8 characters. Thefull combination of these factors created 24 conditions, of which16 had a “correct answer” (i.e., one of the words had a largerfont size), and 8 of which did not (i.e., the words were the samefont size). This allowed us to observe both instances of factoragreement and disagreement, as well as see which way peopleleaned at the extreme marginal case where the sizes were equal.
We tested 31 participants, each of whom saw 150 stimuli (6 pereach of the 24 conditions described above, as well as 6 engagement

1077-2626 (c) 2017 IEEE. Personal use is permitted, but republication/redistribution requires IEEE permission. See http://www.ieee.org/publications_standards/publications/rights/index.html for more information.
This article has been accepted for publication in a future issue of this journal, but has not been fully edited. Content may change prior to final publication. Citation information: DOI 10.1109/TVCG.2017.2723397, IEEETransactions on Visualization and Computer Graphics
IEEE TRANSACTIONS ON VISUALIZATION AND COMPUTER GRAPHICS, VOL. XX, NO. X, AUGUST 2016 6
Analysis of VarianceExperiment N Factors Conditions W/B df1 df2 F p-value
∆ font size w1: [20, 21, 22px], w2: [20, 22px] W 1 150 59.21 < 0.0001len1 31 word length agreement w1: [5, 8 chars], w2: [5, 8 chars] W 2 150 14.91 < 0.0001∆ font size [5, 10, 15, 20%] W 3 418 58.96 < 0.0001word length agreement w1: [4, 7, 10 chars], w2: [4, 7, 10 chars] W 2 418 12.13 < 0.0001len2 39base font size [20, 30px] B 1 37 7.98 0.008∆ font size [5, 10, 15, 20%] W 3 926 85.43 < 0.0001word length agreement w1: [5, 8 chars], w2: [5, 8 chars] W 2 926 31.60 < 0.0001len3 20base font size [20, 25, 30, 35px] W 3 926 8.57 < 0.0001∆ font size w1: [20px], w2: [21, 22, 23, 24px] W 3 269 7.84 < 0.0001len4 20 word length agreement w1: [5, 8 chars], w2: [5, 8 chars] W 2 269 14.32 < 0.0001∆ font size w1: [20, 21, 22px], w2: [20, 22px] W 1 155 55.31 < 0.0001height1 32 word height agreement w1: [tall, short], w2: [tall, short] W 2 155 71.22 < 0.0001∆ font size w1: [20, 22, 24px], w2: [21, 23px] W 5 323 45.88 < 0.0001height2 20 word height agreement w1: [tall, short], w2: [tall, short] W 2 323 83.90 < 0.0001∆ font size w1: [20, 22, 24px], w2: [21, 23px] W 5 323 59.42 < 0.0001height3 20 word height agreement w1: [tall, short], w2: [tall, short] W 2 323 36.10 < 0.0001∆ font size [5, 10, 15, 20%] W 3 448 59.81 < 0.0001word height agreement w1: [tall, short], w2: [tall, short] W 2 448 88.39 < 0.0001height4 20base font size [20, 30px] W 1 448 44.9 < 0.0001∆ font size [5, 10, 15, 20, 25%] W 4 546 94.39 < 0.0001word height agreement w1: [tall, short], w2: [tall, short] W 2 546 207.2 < 0.0001height5 40base font size [20, 30px] B 1 38 20.09 < 0.0001∆ font size w1: [20px], w2: [21, 22, 23, 24px] W 3 133 6.77 0.0003width1 20 word width agreement [+10px, -10px] W 1 133 11.33 0.001∆ font size w1: [20px], w2: [21, 22, 23, 24px] W 3 126 1.47 0.23width2 19 word length agreement [+3 chars, -3 chars] W 1 126 0.00 1.00∆ font size [5, 10, 15, 20%] W 3 209 10.88 < 0.0001box1 20 word width agreement [-20px, 0px, +20px] W 2 209 0.52 0.60∆ font size [5, 10, 15, 20%] W 3 414 5.82 0.0007word length agreement target: [5, 8 chars], near misses: [5, 8 chars] W 2 414 10.10 < 0.0001big1 19# near misses [1, 4] W 1 414 33.66 < 0.0001∆ font size [5, 10, 15, 20%] W 3 846 3.02 0.03word length agreement [-5, -3, -1, 1, 3, 5 chars] W 5 846 8.00 < 0.0001big2 19# near misses [1, 4] W 1 846 7.00 0.008
TABLE 2An overview of the statistical tests we ran for this study. For each experiment, we show the number of participants (N), the factors and their levels(specifying conditions for both target words—w1 and w2—where appropriate), whether the factors were treated as within- or between-subjects
factors, and the analyses of variance for each. Effect sizes can be seen in Table 1 and in the supplemental materials.
tests). While this initially seemed like a large number of stimuli,we saw no fatigue effects in any of our studies. Average time tocompletion was 5.8 minutes, and the comments we received fromparticipants were positive. We analyzed answers to questions witha correct answer and without a correct answer separately.
For data where there was a correct answer, we calculatedthe font size difference (1 or 2 px) and word length agreement(“agree,” “neutral,” or “disagree”) for each stimulus. We then rana two-way analysis of variance (ANOVA) to test for the effectof the font size difference and word length agreement. We sawmain effects for both font size difference (F(1,150) = 59.21,p < 0.0001) and word length agreement (F(2,150) = 14.91,p< 0.0001). Specifically, participant performance decreased whenthe difference in word length disagreed with the difference infont size, as well as when the difference in font size was smaller(see Figure 5). A post hoc test using Tukey’s HSD showed thatthe “disagree” condition was significantly different from both the“neutral” and “agree” condition, though the latter two were notstatistically distinguishable from one another.
For data where there was no correct answer, we tested to see ifthe rate at which participants picked the longer of the two wordswas significantly different from chance. Specifically, we calculatedthe rate at which each participant picked the longer of the twowords when the font sizes were the same (M = 0.59, SD = 0.17)and ran a two-tailed, paired Student’s t-test to compare these
sizeDiff agree neutral disagree
1px 0.860 0.879 0.753
2px 0.952 0.948 0.909
*
*
Fig. 5. This table shows the average participant accuracy for eachcombination of factors for experiment LEN1 (§5.1.1). A two-way ANOVAshowed significant main effects for both size difference and lengthagreement. A post hoc Tukey’s HSD test showed that the “disagree”condition (i.e., when the longer of the two words had the smaller fontsize) was significantly different from the “agree” and “neutral” cases,though the latter two were not distinguishable from one another.
values against an equally sized collection of values of 50%. Wefound that participants were significantly more likely to pick thelonger of the two words (t(30) = 2.99, p = 0.005), indicating thesame direction of bias as seen with the data with correct answers.
5.1.2 Experiment LEN4Biases still present with full English words
For this experiment, we wanted to test whether the effects that wehad seen using “fake” words and our relatively sparse word cloudswould still be present in a more realistic setting. Specifically, ratherthan generating random strings of characters for words, we used
1077-2626 (c) 2017 IEEE. Personal use is permitted, but republication/redistribution requires IEEE permission. See http://www.ieee.org/publications_standards/publications/rights/index.html for more information.
This article has been accepted for publication in a future issue of this journal, but has not been fully edited. Content may change prior to final publication. Citation information: DOI 10.1109/TVCG.2017.2723397, IEEETransactions on Visualization and Computer Graphics
IEEE TRANSACTIONS ON VISUALIZATION AND COMPUTER GRAPHICS, VOL. XX, NO. X, AUGUST 2016 7
sizeDiff agree neutral disagree
5% 0.992 0.942 0.867
10% 1.000 1.000 0.917
15% 0.992 0.992 0.992
20% 0.992 1.000 0.975
*
*
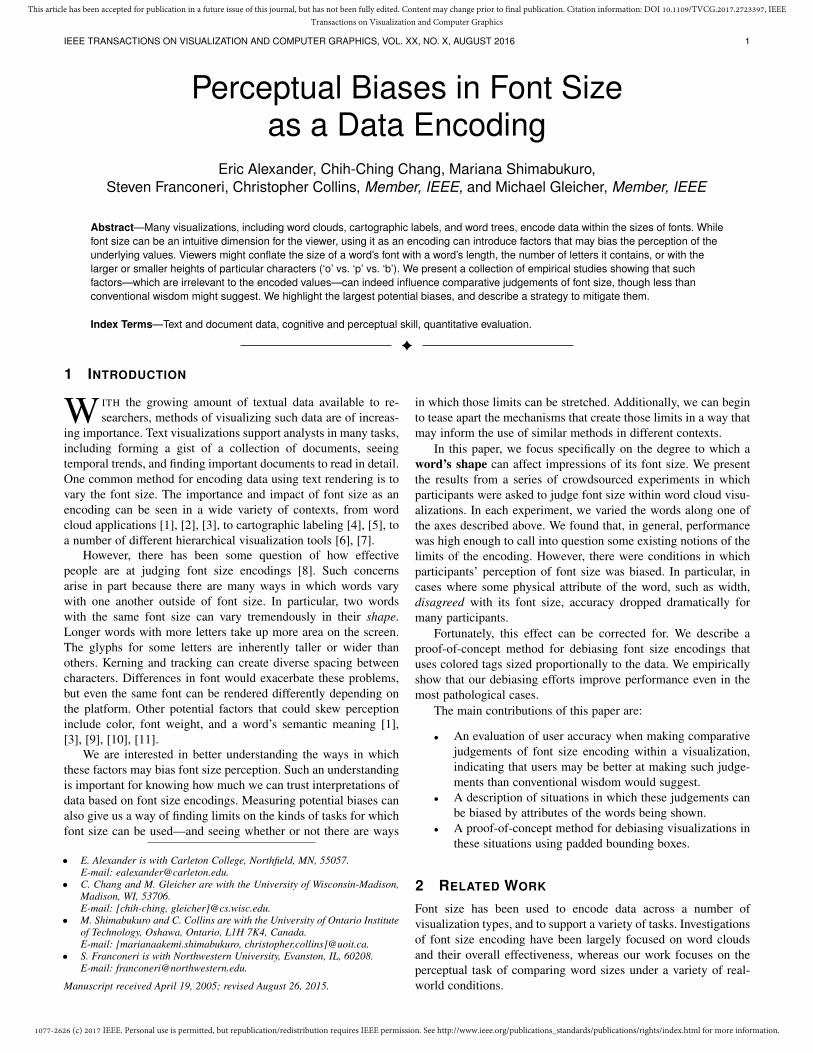
Fig. 6. This table shows the average participant accuracy for eachcombination of factors for experiment LEN4 (§5.1.2), in which we lookedfor a bias of length agreement within a more realistic collection of wordclouds. After a two-way ANOVA showed significant main effects for bothlength agreement and font size difference, post hoc tests showed thatthe “disagree” condition and the closest font size difference were the realdepartures from the rest of the conditions.
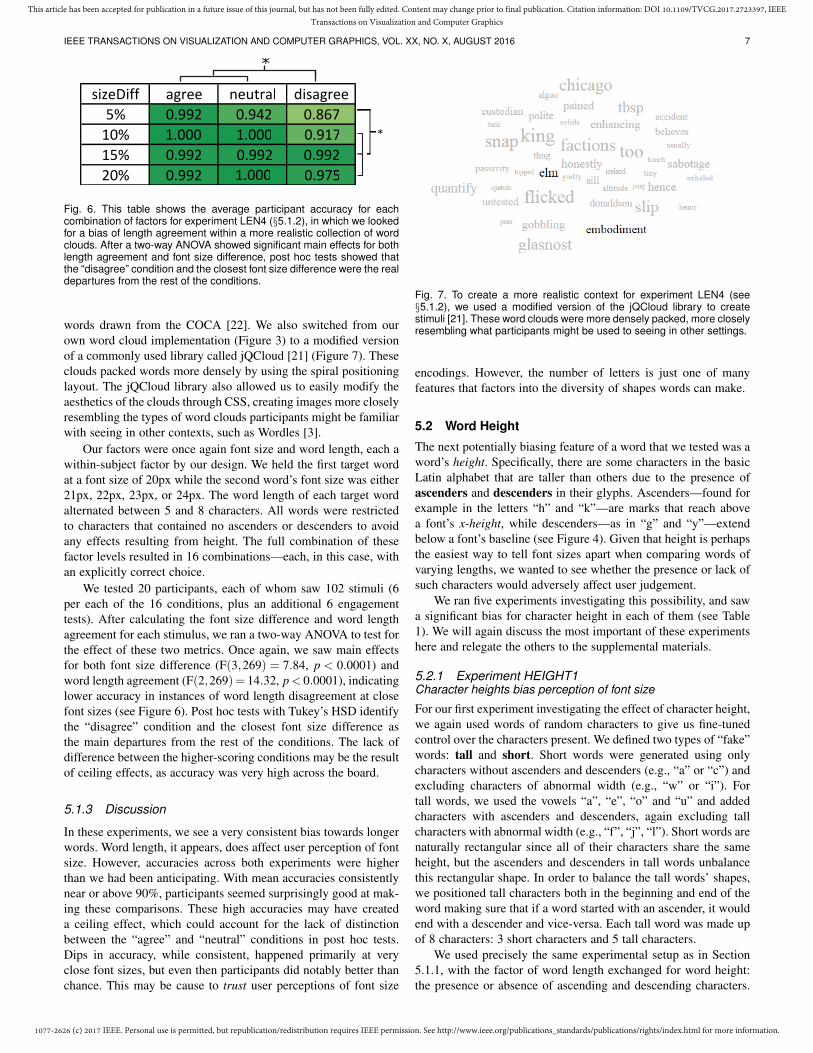
words drawn from the COCA [22]. We also switched from ourown word cloud implementation (Figure 3) to a modified versionof a commonly used library called jQCloud [21] (Figure 7). Theseclouds packed words more densely by using the spiral positioninglayout. The jQCloud library also allowed us to easily modify theaesthetics of the clouds through CSS, creating images more closelyresembling the types of word clouds participants might be familiarwith seeing in other contexts, such as Wordles [3].
Our factors were once again font size and word length, each awithin-subject factor by our design. We held the first target wordat a font size of 20px while the second word’s font size was either21px, 22px, 23px, or 24px. The word length of each target wordalternated between 5 and 8 characters. All words were restrictedto characters that contained no ascenders or descenders to avoidany effects resulting from height. The full combination of thesefactor levels resulted in 16 combinations—each, in this case, withan explicitly correct choice.
We tested 20 participants, each of whom saw 102 stimuli (6per each of the 16 conditions, plus an additional 6 engagementtests). After calculating the font size difference and word lengthagreement for each stimulus, we ran a two-way ANOVA to test forthe effect of these two metrics. Once again, we saw main effectsfor both font size difference (F(3,269) = 7.84, p < 0.0001) andword length agreement (F(2,269)= 14.32, p< 0.0001), indicatinglower accuracy in instances of word length disagreement at closefont sizes (see Figure 6). Post hoc tests with Tukey’s HSD identifythe “disagree” condition and the closest font size difference asthe main departures from the rest of the conditions. The lack ofdifference between the higher-scoring conditions may be the resultof ceiling effects, as accuracy was very high across the board.
5.1.3 Discussion
In these experiments, we see a very consistent bias towards longerwords. Word length, it appears, does affect user perception of fontsize. However, accuracies across both experiments were higherthan we had been anticipating. With mean accuracies consistentlynear or above 90%, participants seemed surprisingly good at mak-ing these comparisons. These high accuracies may have createda ceiling effect, which could account for the lack of distinctionbetween the “agree” and “neutral” conditions in post hoc tests.Dips in accuracy, while consistent, happened primarily at veryclose font sizes, but even then participants did notably better thanchance. This may be cause to trust user perceptions of font size
Fig. 7. To create a more realistic context for experiment LEN4 (see§5.1.2), we used a modified version of the jQCloud library to createstimuli [21]. These word clouds were more densely packed, more closelyresembling what participants might be used to seeing in other settings.
encodings. However, the number of letters is just one of manyfeatures that factors into the diversity of shapes words can make.
5.2 Word Height
The next potentially biasing feature of a word that we tested was aword’s height. Specifically, there are some characters in the basicLatin alphabet that are taller than others due to the presence ofascenders and descenders in their glyphs. Ascenders—found forexample in the letters “h” and “k”—are marks that reach abovea font’s x-height, while descenders—as in “g” and “y”—extendbelow a font’s baseline (see Figure 4). Given that height is perhapsthe easiest way to tell font sizes apart when comparing words ofvarying lengths, we wanted to see whether the presence or lack ofsuch characters would adversely affect user judgement.
We ran five experiments investigating this possibility, and sawa significant bias for character height in each of them (see Table1). We will again discuss the most important of these experimentshere and relegate the others to the supplemental materials.
5.2.1 Experiment HEIGHT1Character heights bias perception of font size
For our first experiment investigating the effect of character height,we again used words of random characters to give us fine-tunedcontrol over the characters present. We defined two types of “fake”words: tall and short. Short words were generated using onlycharacters without ascenders and descenders (e.g., “a” or “c”) andexcluding characters of abnormal width (e.g., “w” or “i”). Fortall words, we used the vowels “a”, “e”, “o” and “u” and addedcharacters with ascenders and descenders, again excluding tallcharacters with abnormal width (e.g., “f”, “j”, “l”). Short words arenaturally rectangular since all of their characters share the sameheight, but the ascenders and descenders in tall words unbalancethis rectangular shape. In order to balance the tall words’ shapes,we positioned tall characters both in the beginning and end of theword making sure that if a word started with an ascender, it wouldend with a descender and vice-versa. Each tall word was made upof 8 characters: 3 short characters and 5 tall characters.
We used precisely the same experimental setup as in Section5.1.1, with the factor of word length exchanged for word height:the presence or absence of ascending and descending characters.

1077-2626 (c) 2017 IEEE. Personal use is permitted, but republication/redistribution requires IEEE permission. See http://www.ieee.org/publications_standards/publications/rights/index.html for more information.
This article has been accepted for publication in a future issue of this journal, but has not been fully edited. Content may change prior to final publication. Citation information: DOI 10.1109/TVCG.2017.2723397, IEEETransactions on Visualization and Computer Graphics
IEEE TRANSACTIONS ON VISUALIZATION AND COMPUTER GRAPHICS, VOL. XX, NO. X, AUGUST 2016 8
sizeDiff agree neutral disagree
1px 0.974 0.909 0.684
2px 1.000 0.965 0.932
** *
*
Fig. 8. This table shows the average participant accuracy for eachcombination of experimental factors for experiment HEIGHT1 (§5.2.1).A two-way ANOVA showed main effects for both word height agreementand font size difference. Post hoc analysis using Tukey’s HSD showedthat all experimental conditions were statistically distinguishable fromone another. Most notably, accuracy is lowest for the “disagree” conditionwith the closest difference in font size.
This meant that the first target word again varied between sizes of20px, 21px, and 22px while the second word varied between 20pxand 22px as both words alternated back and forth between the talland short words. Of the 24 conditions created by combining thesefactors, 16 had a difference of font size (and therefore a “correct”answer) while 8 did not. We analyzed the data for stimuli with acorrect answer and stimuli without one separately.
For data where there was a correct answer, we calculatedthe font size difference (1 or 2 px) and word height agreement(“agree,” “neutral,” or “disagree”) for each stimulus. We thenran a two-way ANOVA to look for effects of these metrics onparticipant accuracy. We saw significant main effects for bothheight agreement (F(2,155) = 71.22, p < 0.0001) and font sizedifference (F(1,155) = 55.31, p < 0.0001). These effects wentin the same direction as seen in Section 5.1 with word length:accuracy dropped when character height disagreed with font sizeand when the font sizes were particularly close (see Figure 8). Posthoc tests with Tukey’s HSD showed all pairwise combinations ofconditions to be statistically significant.
For data without a correct answer, we calculated the rate atwhich each participant picked the tall word when presented withtwo words of the same font size (M = 0.67, SD = 0.07) andcompared these values to a collection of 50% values with a two-tailed, paired Student’s t-test. We saw that participants chose thetaller of the two words at a significantly higher rate than chance(t(31) = 12.91, p < 0.0001).
5.2.2 DiscussionLike word length, character height seems to create a consistentbias on participant perception of font size. In fact, the bias forcharacter height seems to be more pronounced, with accuracy inthe worst cases dropping to levels not much better than chance(see Table 1). However, instances of these height differencesare relatively rare in English. The list of words we used fromCOCA [22] has in total 25,859 eligible words after removingduplicates and words containing numerals and punctuation. Ofthese, only 870 fit our definition of “short” words—approximately3.3% of eligible words. As such, the extreme comparison of tall toshort words would likely not happen often in the wild. However,there are less extreme comparisons—words containing only a fewascenders or descenders, words containing only one or the other,etc.—that may be more common and still exhibit this bias.
5.3 Word WidthAfter running our tests on word height, we decided to look forthe the effect of a different factor: word width. In our height
experiments, we held length constant and attempted to control forwidth by excluding characters of abnormally small or large width(as described in Section 5.2.1). However, there were still smalldifferences in glyph widths even outside of those characters, whichcreated variance in width from word to word, even within thesame length conditions. In a post hoc test, we computed a widthagreement metric for each stimulus from experiment HEIGHT2indicating whether the difference in width went in the same direc-tion as the difference in font size. It was only for stimuli with thesmallest font size difference that we saw any width disagreement,given that we had attempted to make widths neutral. We ran a two-way ANOVA looking for an effect of width agreement, specificallyon the stimuli in the closest font difference case. The effect wesaw was significant (F(2,38) = 13.73,p < 0.0001). Accuracy inthe disagree condition (M = 0.523, SD = 0.18) was substantiallylower than accuracy in the agree condition (M = 0.82, SD = 0.10).
This led us to an interesting question. We knew that longerwords created a bias for font size perception, as described inSection 5.1, but we did not know why. Was this bias the resultof longer words taking up more space, and therefore a functionof width, or were participants actually making a numerosityjudgement about the letters? We hypothesized that the main factorin this effect was width rather than length, thinking that words—especially real ones—are read more or less as a whole, rather thanletter by letter [25]. To test this hypothesis, we ran two additionalexperiments to isolate the effects of width and length.
5.3.1 Experiment WIDTH1Bias present when width varies but not length
In our first of these experiments, we wanted to see whetherword width biased font size perception even when the number ofcharacters and character height were held constant. Varying widthbut not length put a tight constraint upon the words we were able touse; differences between character widths are small, and so wordsthat differ substantially in one factor but not the other are rare.For our stimuli, we chose a collection of pairs of words that wereeach 8 characters long, but differed in raw width by 10 pixels.We defined “raw width” to be a word’s width computed at a fontsize of 20px, so that we could have a measure of width differencesthat was separate from our font size factor. We also made sure thateach pair of words shared the same character height.
Our two factors for this experiment were width agreement andfont size difference. For each stimulus, one of the target wordshad a font size of 20px, while the other was either 21px, 22px,23px, or 24px. For the width agreement factor, the larger of thetwo words either had a raw width that was 10 pixels greater thanthe smaller word (“agree”) or 10 pixels less than the smaller word(“disagree”). Four font size differences combined with two levelsof width agreement gave us 8 conditions, each of which had a“correct” answer.
We tested 20 participants, each of whom saw 56 stimuli (6 pereach of the 8 conditions, as well as 6 engagement tests). Aftercalculating the font size difference and width agreement of eachstimulus, we ran a two-way ANOVA to test for the effects ofthe two factors on participant accuracy. We saw main effects forboth width agreement (F(1,133) = 11.33, p= 0.001) and font sizedifference (F(3,133) = 6.77, p = 0.0003) indicating a drop off inaccuracy for width disagreement at close font sizes (see Figure9). While a post hoc Tukey’s HSD test only showed the smallestsize difference condition to be statistically distinguishable, this

1077-2626 (c) 2017 IEEE. Personal use is permitted, but republication/redistribution requires IEEE permission. See http://www.ieee.org/publications_standards/publications/rights/index.html for more information.
This article has been accepted for publication in a future issue of this journal, but has not been fully edited. Content may change prior to final publication. Citation information: DOI 10.1109/TVCG.2017.2723397, IEEETransactions on Visualization and Computer Graphics
IEEE TRANSACTIONS ON VISUALIZATION AND COMPUTER GRAPHICS, VOL. XX, NO. X, AUGUST 2016 9
*
sizeDiff
5% 0.975 0.909
10% 1.000 0.992
15% 0.992 0.992
20% 1.000 0.983
agree disagree
*
Fig. 9. This table shows the average participant accuracy for eachcombination of experimental factors for experiment WIDTH1 (§5.3.1).In this experiment, target words had a difference of 10 pixels in rawwidth (i.e., their width at the same font size). In the “agree” condition, thiswidth difference was in the same direction as the difference in font size,while it was in the opposite direction for the “disagree” condition. A two-way ANOVA showed significant main effects for both width agreementand font size difference. Only the lowest size difference was statisticallydistinguishable in post hoc tests, perhaps due to ceiling effects given thevery high overall accuracy.
may have been due to ceiling effects, given the very high accuracyacross all other conditions.
5.3.2 Experiment WIDTH2Bias not present when length varies but not widthIn the second of these experiments, we wanted to see whether thenumber of letters in a word had any effect on font size perceptionoutside of the correlated factor of width difference. For our stimuli,we chose pairs of words that had the same raw width (describedin Section 5.3.1) but differed by 3 letters in length. Of the wordswe had available from which to choose, this was the largest lengthdifference that provided us with enough pairs. Each pair of wordsshared the same character height, as well.
Our two factors for this experiment were length agreementand font size difference. Once again, one of the two target wordsin each stimulus had a font size of 20px, while the other waseither 21px, 22px, 23px, or 24px. For the length agreement factor,the larger of the two words had either 3 more characters than thesmaller word (“agree”) or 3 fewer characters than the smaller word(“disagree”). Four font size differences combined with two levelsof length agreement gave us 8 conditions, each of which had a“correct” answer.
We tested 19 participants, each of whom again saw 56 stimuli.After computing the font size difference and length agreement ofeach stimulus, we ran a two-way ANOVA to test for the effects ofthese factors on participant accuracy. This time, we saw no maineffects for either font size difference (F(3,126) = 1.47, p = 0.23)or length agreement (F(1,126) = 0.00, p = 1.00). Accuracy wasquite high across all conditions (see Figure 10). This seems toindicate that any bias created by number of letters alone is notstrong enough to register without also varying the stronger factorof word width.
5.3.3 DiscussionThe restriction of varying only one of width and length meant thatwe were not able to test very large differences in either factor. Assuch, we did not expect to see a vary large effect size for eitherexperiment. However, from these results, we feel we can concludethat width is the more important factor to consider when worryingabout bias. Length may matter in some extreme cases, but westretched the degree to which length can vary without width to thelimits of the English language, and still saw no effect. Practically,therefore, width seems the more relevant concern.
agreesizeDiff
5% 0.982 0.982
10% 1.000 0.991
15% 0.991 1.000
20% 0.982 1.000
disagree
Fig. 10. This table shows the average participant accuracy for eachcombination of experimental factors for experiment WIDTH2 (§5.3.2).In this experiment, target words had a difference of 3 characters in theirlength (going with or against the direction of the difference in font size inthe “agree” and “disagree” conditions, respectively). A two-way ANOVAshowed no significant main effects for either factor, and accuracy wasvery high across the board.
6 DEBIASING WITH RECTANGLES
In Section 5, we show that there are multiple ways in which aword’s shape can bias interpretation of its font size. Dependingon the task a designer intends a user to undertake, the effect ofthis bias may not be large enough to warrant much intervention—a possibility we discuss further in Section 8. However, for tasksprecise enough to be concerned by these effects, the next questionis what we can do as designers to mitigate this bias.
One potential method for this debiasing effort was inspiredby the work of Correll et al. debiasing area discrepancies intagged text [26]. In this work, the authors determined that userssuffered from an area bias when making numerosity judgementsof words tagged with colored backgrounds. Specifically, when thenumber of words disagreed with the area of the colored back-grounds, accuracy dropped dramatically. However, they were ableto counteract this bias by adjusting the area of the backgroundsfor underrepresented words.
We suspected that such a technique could be useful for thebiases we observed in font size encodings. By enclosing individ-ual words in filled bounding boxes, we can create a redundantencoding for font size that may alleviate the issue of diverse wordshapes. These bounding boxes would also give us a glyph whoseproportions we can adjust without fearing any change in legibility.
As such, we decided upon the following potential debiasingtechnique: We would surround each word with a padded bound-ing box. These boxes would contain the full height of any potentialcharacter, going from the ascender line to the descender line (seeFigure 4). The width of each box would be adjusted such thatthey all shared the same raw width—which is to say, they wouldbe equal in width if they all contained words of the same fontsize. With such padding, the difference in rectangle width andheight would always agree with the font size difference for anytwo words, creating a more reliable and readable indication thanthe word alone. We ran an experiment to test whether this strategywould help increase user accuracy in cases of factor disagreement.
6.1 Experiment BOX1Can debias encoding with rectangular highlights
To test our debiasing technique, we ran an experiment with asimilar design to that described in experiment LEN4 (described inSection 5.1.2). The factors for our stimuli were font size difference(which varied in increments of 5, 10, 15, and 20% from a basefont of 20px) and word length (which alternated between 5 and8 characters for each word). For this experiment, we also ensuredthat whenever the two target words were the same length, they also

1077-2626 (c) 2017 IEEE. Personal use is permitted, but republication/redistribution requires IEEE permission. See http://www.ieee.org/publications_standards/publications/rights/index.html for more information.
This article has been accepted for publication in a future issue of this journal, but has not been fully edited. Content may change prior to final publication. Citation information: DOI 10.1109/TVCG.2017.2723397, IEEETransactions on Visualization and Computer Graphics
IEEE TRANSACTIONS ON VISUALIZATION AND COMPUTER GRAPHICS, VOL. XX, NO. X, AUGUST 2016 10
Fig. 11. By containing each word in a color-filled bounding box andpadding the sides of each bounding box such that their widths wereproportional to their font sizes, we were able to eliminate the effect ofwidth disagreement.
sizeDiff neutral
5% 0.914 0.932 0.908
10% 0.983 0.992 0.933
15% 0.983 0.971 0.992
20% 0.992 0.996 0.983
agree disagree
*
Fig. 12. This table shows the average participant accuracy for eachcombination of experimental factors for experiment BOX1 (§6.1). In thisexperiment, words were given padded bounding boxes (as in Figure 11)in an attempt to mitigate the bias created by disagreement in word width.While a two-way ANOVA showed there to be a significant main effectof size difference on accuracy, no main effect was seen on word widthagreement—indicating that padded bounding boxes may be a viable wayof debiasing font size perception.
had the same raw width, and when they were not the same length,they had a difference in raw width of 20 pixels. These factor levelscreated 16 conditions, each of which had a “correct” answer.
Rather than showing participants a pure word cloud, we placedpadded bounding boxes around each word (see Figure 11). Thesebounding boxes were padded on either side such that the rectanglefor each word had the same raw width before any differencesin font size had been applied. Participants were instructed inthe tutorial that the rectangles containing the words were sizedproportionally to the words’ font sizes.
We tested 20 participants, each of whom saw 102 stimuli (6for each of the 16 conditions, plus an additional 6 engagementchecks). After computing the length/width agreement and fontsize difference of each stimuli, we ran a two-way ANOVA totest for the effects of these factors on participant accuracy. Whilewe found a significant main effect for font size difference asbefore (F(3,209) = 10.88, p < 0.001), we saw no effect oflength/width agreement (F(2,209) = 0.52, p = 0.60). Even in thetypical worst case—conditions with factor disagreement and thesmallest difference in font size—participants scored over 90%accuracy (see Figure 12). To this degree, it seems that the paddedbounding boxes were successful at mitigating the bias introducedby length/width disagreement.
This technique of debiasing font size encodings is primarily aproof-of-concept. Aesthetically, word clouds like the one in Figure
Fig. 13. For experiments BIG1 (§7.1) and BIG2 (§7.2), participants werepresented with word clouds of pseudowords and asked to pick the onewith the biggest font size. In this example, “zoav” is the correct answer,with four near misses that are of longer length.
11 are inferior to more standard layouts, and aesthetics can be animportant factor to an encoding’s utility [27]. It may be possibleto create more aesthetic approaches, perhaps using other wordfeatures like font weight or tracking. At any rate, this shows thatthe effects of word shape on font size perception are possible tocorrect for.
7 ALTERNATE TASK
A possible critique of this work is that our experimental task (pickthe bigger of two highlighted words) does not necessarily reflecthow font size encodings are used in the wild. Our reason forusing this task was that it acts as a “visual primitive” for broader,more general tasks (see Section 3). It is not our intention to saythat people routinely have to perform the act of comparing twowords within a word cloud, but rather that the more high-level,interpretation-based tasks that people do perform rely upon thislow-level perceptual ability.
Nonetheless, we wanted to confirm that the bias that we sawwithin the compare-two-words task was not specific to this preciseexperimental setup. In a further set of experiments, we looked forthe same bias using a different task: finding the single biggestword within a cloud. While we believe that this task relies uponthe same perceptual abilities as the comparison task, it is in someways closer to how word clouds are used in practice. Picking outthe biggest word (or words) from a visualization that uses font sizeto encode values is similar to the higher level task of asking whatthe data encoded by the visualization is “about.”
To give us control over the gap in font size between targetwords similar to what we had in our previous experiments, weintroduced a concept called near misses. Near misses are wordsthat are almost as large as the biggest font size word, but notquite (see Figure 13). Explicitly controlling the near misses ineach stimulus allowed us to evaluate multiple font size differencesbetween the biggest word and the next biggest. It also gave us anew factor: the number of near misses.
Our general hypotheses for the pick-the-biggest task werethat participant accuracy would be worse in instances of factordisagreement (as in our previous experiments), and that this effect

1077-2626 (c) 2017 IEEE. Personal use is permitted, but republication/redistribution requires IEEE permission. See http://www.ieee.org/publications_standards/publications/rights/index.html for more information.
This article has been accepted for publication in a future issue of this journal, but has not been fully edited. Content may change prior to final publication. Citation information: DOI 10.1109/TVCG.2017.2723397, IEEETransactions on Visualization and Computer Graphics
IEEE TRANSACTIONS ON VISUALIZATION AND COMPUTER GRAPHICS, VOL. XX, NO. X, AUGUST 2016 11
would be more pronounced in stimuli that contained more nearmisses to distract the participant.
7.1 Experiment BIG1Bias still present in “pick the biggest” task
In our first experiment making use of the pick-the-biggest task,we sought to examine potential bias due to word length agreementor disagreement. We created a set of stimuli of word clouds madeup of pseudowords (see Section 4.3). As before, stimuli contained40 distractor words, in this case limited to font sizes below 40px.Stimuli then contained either 1 or 4 near miss words which weregiven a font size of 40px. Finally, each stimulus contained atarget word (the “correct” choice) with a font size defined by apercentage increment above that of the near misses (either 5, 10,15, or 20% bigger).
The factors for this experiment were font size difference (5,10, 15, or 20%), target word length (5 or 8 letters), near missword length (5 or 8 letters), and number of near misses (1 or 4).Each factor was varied within participants. The full combinationof these factor levels resulted in 32 conditions. We tested 19participants, once again recruited through Amazon MechanicalTurk, each of whom saw 134 stimuli (4 per each of the 32conditions, plus an additional 6 engagement tests with a font sizedifference of 50%). After calculating font size difference and wordlength agreement for each stimulus, we ran a two-way ANOVAto test for the effect of the three metrics (including number ofnear misses). We saw main effects for all three factors: fontsize difference (F(3,414) = 5.82, p = 0.0007), length agreement(F(2,414) = 10.10, p < 0.0001), and number of near misses(F(1,414) = 33.66, p < 0.0001), indicating lower accuracy ininstances of word length disagreement, more near misses, andcloser font sizes (see Figure 14).
Our hypothesis that we would still see a biasing effect of lengthdisagreement using a different task was confirmed. Interestingly,accuracies seemed to drop off even more when participants wereperforming the pick-the-biggest task than when they were per-forming the pairwise comparison task (see Figure 14). However,participants still achieved greater than 50% accuracy in eachcondition, performing better than chance.
7.2 Experiment BIG2Wider variety of sizes in “pick the biggest” task
For a second experiment using the pick-the-biggest task, we wereinterested in whether the magnitude of the word length agreementor disagreement was relevant to the bias created—that is, would in-stances of greater disagreement hurt accuracy more than instancesof small disagreement. We created a design that was similar tothat described in Section 7.1, but with different levels for the wordlength disagreement factor. Rather than only considering words of5 or 8 characters, we considered word length differences of 1, 3,and 5 characters in both the “agree” and “disagree” directions, fora total of 6 levels for this factor. We hypothesized that instances oflarge disagreement (e.g., 5 characters) would show lower accuracythan instances of small disagreement (e.g., 1 character).
We tested 19 participants on Amazon Mechanical Turk, eachof whom saw 150 stimuli (3 per each of the 48 combinations offactors with an additional 6 engagement checks). We ran a two-way ANOVA to test for the effects of the three metrics, and againsaw main effects for all three: font size difference (F(3,846) =3.02, p = 0.03), length difference (F(5,846) = 8.00, p < 0.0001),
sizeDiff agree neutral disagree
5% 0.947 0.908 0.750
10% 0.974 0.9805 0.895
15% 0.987 0.974 0.908
20% 0.987 0.987 0.934# of near misses = 1
sizeDiff agree same disagree
5% 0.829 0.743 0.566
10% 0.908 0.9145 0.776
15% 0.961 0.967 0.973
20% 1.000 0.987 1.000
# of near misses = 4
*
*
*
*
*
Fig. 14. This table shows the average participant accuracy for eachcombination of experimental factors for experiment BIG1 (§7.1). In thisexperiment, participants were asked to select the word with the largestfont size. They were presented with word clouds containing a singleword bigger than the rest (the “target” word) along with either 1 or 4“near misses.” A two-way ANOVA showed there to be a significant maineffect for both the font size difference between the target and the nearmisses, for word length agreement, and for the number of near misses.
and number of near misses (F(1,846) = 7.00, p< 0.008)—each inthe same direction as seen previously. We also noted, as expected,that accuracies were lowest in instances of largest disagreementand highest in instances of largest agreement (see Figure 15).
7.3 DiscussionThe main takeaway from these two additional experiments is thatthe biasing effect of factor disagreement is not isolated specificallyto the task of pairwise comparison, but can also be seen in atask that specifically tries to draw the user’s attention to the most“important” word in the visualization. The detrimental effect ofmore “near misses” seems to perhaps indicate that while peopleare generally able to perform pairwise comparisons, needing toperform multiple of these can cause them to miss smaller words.However, performance is still better than chance in all but the mostpathological cases.
8 FULL DISCUSSION
Results from other experiments not described above are laid out inthe supplemental materials. In those experiments, we looked for anumber of extra details and effects. We compared performance atdifferent base font sizes. We tested to see if the results were thesame with a sans serif font (which they were). We looked for asize difference ceiling past which participant accuracy maxed out(which proved to be between 20-25% size difference). Consistentacross each experiment were the same things we saw in eachof the experiments described in Sections 5, 6, and 7: decreasedperformance with factor disagreement at close size differences. Itis worth noting that this effect is not simply the result of partic-ipants focusing on area rather than font size. Consider examples

1077-2626 (c) 2017 IEEE. Personal use is permitted, but republication/redistribution requires IEEE permission. See http://www.ieee.org/publications_standards/publications/rights/index.html for more information.
This article has been accepted for publication in a future issue of this journal, but has not been fully edited. Content may change prior to final publication. Citation information: DOI 10.1109/TVCG.2017.2723397, IEEETransactions on Visualization and Computer Graphics
IEEE TRANSACTIONS ON VISUALIZATION AND COMPUTER GRAPHICS, VOL. XX, NO. X, AUGUST 2016 12
Acc
ura
cy
Size Difference (%)
5 10 15 20
1.0
0.9
0.8
0.7
0.6
0.5
0.4
0.3
0.2
0.1
0.0
Length Difference (chars)
5 (disagree)
3 (disagree)
1 (disagree)
1 (agree)
3 (agree)
5 (agree)
Fig. 15. This graph shows the average participant accuracy for combinations of experimental factors in experiment BIG2 (§7.2). In this experiment,participants were tasked with picking the word with the largest font size as in §7.1. We tested a wider variety of length differences, and saw thatperformance was generally lowest in cases of large disagreement and highest in cases of large agreement. These values are averaged across twolevels of the “number of near misses” factor. Error bars represent a 95% confidence interval.
from our length disagreement experiments. While we observeddecreased accuracy when a word with a 1-pixel-larger font sizewas significantly shorter than the other target, increasing the fontsize difference by a mere pixel resulted in very high accuracy—even though the difference in area disagreement created by thischange in font size would be minimal.
Clearly, perceptions of font size can be biased by these factors.The relevant question for a designer is how much this bias willaffect their end users, and whether it is worth designing around it.The effects that we saw occurred at very close differences in fontsize, and even then participants performed better than chance. Itmay be that our experimental setup artificially enhanced perfor-mance past what we would see in the wild—perhaps by havingusers focus in on two individual words out of many. Nonetheless,the consistently high accuracy that we saw across so many trialsand conditions was remarkable. Despite the fact that font sizeencodings are rarely used for tasks requiring pixel-level accuracy,our findings seem to suggest that they may be more suitable forsuch tasks than previously thought. Given the particular utilityof the font size encoding for textual data, expanding its potentialuses could have significant impact. An important future directionof this work, therefore, will be to continue testing the limits of thisperception in real-world applications.
While thorough investigation of these phenomena in morerealistic contexts will be important for applying this work, it isalso important to understand the psychophysical mechanism(s)responsible for the observed effects. Perceptual-level study of whythis bias exists could help us predict whether effects might bebetter or worse in other viewing conditions, visualization contexts,or using different kinds of data. It may be useful for such futurework to take the form of in-person studies for more precise mea-surement and better data gathering. This could also help validateour crowdsourced results in a more controlled environment.
Our debiasing attempts are a proof-of-concept, and show thatit is possible to correct for the effects of factor disagreement inthe event that a designer expects careful reading and comparisonof their encodings. We believe there are more aesthetic ways of
making these corrections, and are interested in exploring themfurther. Font weight, for instance, may interact with font size inways that we could exploit in our encodings. Possible candidatesfor other methods include typeface modifications such as kerning,widths of individual letter glyphs, or even exploring the use ofmonospaced typeface (where all the characters have the samewidth causing words that have the same length to be the samewidth as well). Ultimately, whether or not debiasing is evennecessary depends on how the encoding will be used in practice.
While we looked for biasing effects of a number of featuresrelated to a word’s content—including length, width, characterheight, and font (see the supplemental materials)—there are morefeatures that could be examined. These include color, font weight,and a word’s semantic weight or meaning. Also, while we believethat the pairwise comparison and pick-the-biggest tasks allow us toget down to the perceptual primitives of higher level tasks, we areinterested in testing a wider variety of tasks to better understandfont size encodings in real world contexts.
9 CONCLUSION
We have explored the effects of different word shapes on theperception of data encoded through font size. Across multipleexperiments, we have shown that the factors of word length,character height, and word width can all have a negative impacton one’s ability to judge comparative font sizes, particularlywhen they differ in the opposite direction from the font sizesbeing compared (“disagreement”). These biases are consistent, butsurprisingly small in their effects, possibly indicating that suchencodings are better suited to higher accuracy tasks than previ-ously expected. We have shown in a proof-of-concept design thatcorrecting for them is possible by adjusting the visual encoding.
ACKNOWLEDGMENTS
This work was supported in part by NSF awards IIS-1162037 andIIS-1162067, a grant from the Andrew W. Mellon Foundation, andfunding from NSERC and the Canada Research Chairs program.
1077-2626 (c) 2017 IEEE. Personal use is permitted, but republication/redistribution requires IEEE permission. See http://www.ieee.org/publications_standards/publications/rights/index.html for more information.
This article has been accepted for publication in a future issue of this journal, but has not been fully edited. Content may change prior to final publication. Citation information: DOI 10.1109/TVCG.2017.2723397, IEEETransactions on Visualization and Computer Graphics
IEEE TRANSACTIONS ON VISUALIZATION AND COMPUTER GRAPHICS, VOL. XX, NO. X, AUGUST 2016 13
REFERENCES
[1] B. Y. Kuo, T. Hentrich, B. M. Good, and M. D. Wilkinson, “Tagclouds for summarizing web search results,” in Proceedings of the 16thinternational conference on World Wide Web. ACM, 2007, pp. 1203–1204.
[2] C. Trattner, D. Helic, and M. Strohmaier, “Tag clouds,” in Encyclopediaof Social Network Analysis and Mining. Springer, 2014, pp. 2103–2107.
[3] F. B. Viegas, M. Wattenberg, and J. Feinberg, “Participatory visualizationwith wordle,” Visualization and Computer Graphics, IEEE Transactionson, vol. 15, no. 6, pp. 1137–1144, 2009.
[4] S. Afzal, R. Maciejewski, Y. Jang, N. Elmqvist, and D. S. Ebert, “Spatialtext visualization using automatic typographic maps,” IEEE Transactionson Visualization & Computer Graphics, vol. 18, no. 12, pp. 2556–2564,2012.
[5] A. Skupin, “The world of geography: Visualizing a knowledge domainwith cartographic means,” Proceedings of the National Academy ofSciences, vol. 101, no. suppl 1, pp. 5274–5278, 2004.
[6] R. Brath and E. Banissi, “Evaluating lossiness and fidelity in informationvisualization,” in IS&T/SPIE Electronic Imaging. International Societyfor Optics and Photonics, 2015, pp. 93 970H–93 970H.
[7] M. Wattenberg and F. B. Viegas, “The word tree, an interactive visualconcordance,” Visualization and Computer Graphics, IEEE Transactionson, vol. 14, no. 6, pp. 1221–1228, 2008.
[8] M. A. Hearst and D. Rosner, “Tag clouds: Data analysistool or social signaller?” in Proceedings of the 41st AnnualHawaii International Conference on System Sciences (HICSS2008). IEEE, jan 2008, pp. 160–160. [Online]. Available: http://dl.acm.org/citation.cfm?id=1334515.1334989
[9] S. Bateman, C. Gutwin, and M. Nacenta, “Seeing things in the clouds:The effect of visual features on tag cloud selections,” in Proceedings ofthe Nineteenth ACM Conference on Hypertext and Hypermedia. ACM,2008, pp. 193–202.
[10] S. Lohmann, J. Ziegler, and L. Tetzlaff, “Comparison of tag cloudlayouts: Task-related performance and visual exploration,” in Human-Computer Interaction–INTERACT 2009. Springer, 2009, pp. 392–404.
[11] A. W. Rivadeneira, D. M. Gruen, M. J. Muller, and D. R. Millen,“Getting our head in the clouds: toward evaluation studies of tagclouds,”in Proceedings of the SIGCHI conference on Human factors in computingsystems. ACM, 2007, pp. 995–998.
[12] A. Maps, “Typographic maps,” http://www.axismaps.com/, 2015.[13] M. Nacenta, U. Hinrichs, and S. Carpendale, “Fatfonts: combining
the symbolic and visual aspects of numbers,” in Proceedings of theInternational Working Conference on Advanced Visual Interfaces. ACM,2012, pp. 407–414.
[14] E. Alexander and M. Gleicher, “Assessing topic representations for gist-forming,” in Proceedings of the International Working Conference onAdvanced Visual Interfaces. ACM, 2016, in press.
[15] B. Alper, H. Yang, E. Haber, and E. Kandogan, “Opinionblocks: Visual-izing consumer reviews,” in Proc. of the IEEE Workshop on InteractiveVisual Text Analytics for Decision Making, 2011.
[16] C. Collins, F. B. Viegas, and M. Wattenberg, “Parallel tag clouds toexplore and analyze facted text corpora,” in Proc. of the IEEE Symp. onVisual Analytics Science and Technology (VAST), 2009.
[17] J. Haberman and D. Whitney, “Ensemble perception: Summarizing thescene and broadening the limits of visual processing,” From perceptionto consciousness: Searching with Anne Treisman, pp. 339–349, 2012.
[18] J. Ross and D. C. Burr, “Vision senses number directly,” Journal ofVision, vol. 10, no. 2, pp. 10–10, 2010.
[19] D. A. Szafir, S. Haroz, M. Gleicher, and S. Franconeri, “Four types ofensemble coding in data visualizations,” Journal of vision, vol. 16, no. 5,pp. 11–11, 2016.
[20] M. Bostock, V. Ogievetsky, and J. Heer, “D3 data-driven documents,”Visualization and Computer Graphics, IEEE Transactions on, vol. 17,no. 12, pp. 2301–2309, 2011.
[21] L. Ongaro, “jQCloud: jQuery plugin for drawing neat word clouds thatactually look like clouds,” https://github.com/lucaong/jQCloud, 2014.
[22] M. Davies, “Word frequency data from the corpus of contemporaryamerican english (COCA),” http://www.wordfrequency.info, 2011.
[23] A. Kittur, E. Chi, and B. Suh, “Crowdsourcing user studies with mechan-ical turk,” in Proceedings of ACM CHI. ACM, 2008, pp. 453–456.
[24] W. Mason and S. Suri, “Conducting behavioral research on amazonsmechanical turk,” Behavior research methods, pp. 1–23, 2011.
[25] L. R. Haber, R. N. Haber, and K. R. Furlin, “Word length and word shapeas sources of information in reading,” Reading Research Quarterly, pp.165–189, 1983.
[26] M. Correll, E. Alexander, and M. Gleicher, “Quantity estimationin visualizations of tagged text,” in Proceedings of the 2013 ACMannual conference on Human Factors in Computing Systems, ser.CHI ’13. ACM, May 2013, pp. 2697–2706. [Online]. Available:http://graphics.cs.wisc.edu/Papers/2013/CAG13
[27] T. van der Geest and R. van Dongelen, “What is beautiful is useful-visualappeal and expected information quality,” in Professional Communica-tion Conference, 2009. IPCC 2009. IEEE International. IEEE, 2009,pp. 1–5.
Eric Alexander Biography omitted for submis-sion.
Chih-Ching Chang Biography omitted for sub-mission.
Mariana Shimabukuro Biography omitted forsubmission.
Steven Franconeri Biography omitted for sub-mission.

1077-2626 (c) 2017 IEEE. Personal use is permitted, but republication/redistribution requires IEEE permission. See http://www.ieee.org/publications_standards/publications/rights/index.html for more information.
This article has been accepted for publication in a future issue of this journal, but has not been fully edited. Content may change prior to final publication. Citation information: DOI 10.1109/TVCG.2017.2723397, IEEETransactions on Visualization and Computer Graphics
IEEE TRANSACTIONS ON VISUALIZATION AND COMPUTER GRAPHICS, VOL. XX, NO. X, AUGUST 2016 14
Chritopher Collins Biography omitted for sub-mission.
Michael Gleicher Biography omitted for submis-sion.