Embed Size (px)
Citation preview
IEEE TRANSACTIONS ON ULTRASONICS, FERROELECTRICS, AND FREQUENCY CONTROL, VOL. 65, NO. 6, JUNE 2018 1007
A Method for Stereological Determination of theStructure Function From Histological Sections
of Isotropic Scattering MediaAiguo Han , Member, IEEE
Abstract— The frequency-dependent ultrasonic backscattercoefficient (BSC) from tissues, a fundamental parameter esti-mated by quantitative ultrasound (QUS) techniques, containsmicrostructure information useful for tissue characterization.To extract the microstructure information from the BSC, the tis-sue under investigation is often modeled as a collection ofdiscrete scatterers embedded in a homogeneous background.From a discrete scatterer point of view, the BSC is dependenton not only the properties of individual scatterers relative to thebackground but also the scatterer spatial arrangement [describedby the structure function (SF)]. Recently, the 2-D SF wascomputed from histological tissue sections, and was shown to berelated to the volumetric SF extracted from QUS measurements.In this paper, a stereological method is proposed to extractthe volumetric (3-D) SF from 2-D histological tissue sections.Simulations and experimental cell pellet biophantom studies wereconducted to evaluate the proposed method. Simulation resultsverified the proposed method. Experimental results showed thatthe volumetric SF extracted using the proposed method had asignificantly better agreement with the QUS-extracted SF thandid the 2-D SF extracted in the previous study. The proposedstereological approach provides a useful tool for predicting theSF from histology.
Index Terms— Acoustic scattering, backscatter coefficient(BSC), stereology, structure function (SF).
I. INTRODUCTION
QUANTITATIVE ultrasound (QUS) techniques have beeninvestigated for tissue characterization in many organs
such as the eye [1], [2], prostate [3], kidney [4], heart [5], [6],blood [7], [8], breast [9]–[12], liver [13], and lymphnodes [14], and for various applications such as apoptosisdetection [15], [16], breast cancer characterization [17] andtreatment monitoring [18], liver steatosis detection [19]–[21],and preterm birth prediction [22].
One of the QUS approaches utilizes signal processingstrategies to estimate the frequency-dependent ultrasonicbackscatter coefficient (BSC) from the radio frequency echodata. The system- and operator-independent BSC containstissue microstructure information that is unavailable from the
Manuscript received January 30, 2018; accepted March 18, 2018. Dateof publication March 21, 2018; date of current version June 1, 2018.This work was supported by the National Institutes of Health under GrantR37EB002641 and Grant R01DK106419.
The author is with the Bioacoustics Research Laboratory, Departmentof Electrical and Computer Engineering, University of Illinois, Urbana, IL61801 USA (e-mail: [email protected]).
Digital Object Identifier 10.1109/TUFFC.2018.2818071
conventional gray-scale B-mode ultrasound images. A model-based approach can be used to extract such informationfrom the BSC. Understanding the ultrasonic scattering mech-anism(s) in biological tissues is thus essential for accuratelymodeling the BSC and improving the sensitivity and specificityof QUS techniques.
The tissue under investigation is often modeled as thecollection of discrete scatterers embedded in a homogeneousbackground. Under the discrete scatterer assumption, the BSCis dependent on the properties of individual scatterers relativeto the background, modeled by the form factor [23]. The BSCis also dependent on the spatial arrangement of the scatterersbecause of phase interference, described by the structurefunction (SF) as a factor in the BSC expression [24], [25].The form factor has been extensively studied. Various formfactor models (e.g., fluid sphere [23], Gaussian [23], sphericalshell [23], and concentric spheres [10], [26], [27]) have beendeveloped and applied to biological tissues. These modelsyield tissue microstructure parameters such as the effectivescatterer diameter and effective acoustic concentration that aresensitive to various disease conditions. In contrast, the SF hasnot been sufficiently studied in the context of ultrasonic scat-tering from tissues. The SF is related to the squared modulus ofthe Fourier transform of scatterer positions. It approaches unityif the scatterer positions are independent with each other, andshows a frequency-dependent interference pattern when thescatterer positions are correlated, for instance, when the scat-terer concentration is high, or when scatterers are arranged inspecial patterns. Originally developed in statistical mechanics,the SF was first introduced in the field of acoustic scatteringby Twersky [24], [28], and first implemented for describingbiological scatterers by Fontaine et al. [25]. Subsequent studieshave shown that the SF has a strong effect on scattering inaggregated red blood cells [29]–[32], cell apoptosis [33], [34],concentrated tissue-mimicking phantoms [35], concentratedcell pellet biophantoms [27], [36]–[38], and various solidtumors [39]–[41].
Recently, the 2-D SF was calculated from histologicalsections, and was shown to be related to the volumetric SFextracted from QUS measurements [41]. Estimating the SFfrom histology was pursued for several reasons. First, estimat-ing the SF from histology has theoretical values of elucidatingthe ultrasonic scattering mechanism(s) in biological media,because the histology-derived and QUS-derived SFs can be
0885-3010 © 2018 IEEE. Personal use is permitted, but republication/redistribution requires IEEE permission.See ht.tp://ww.w.ieee.org/publications_standards/publications/rights/index.html for more information.
1008 IEEE TRANSACTIONS ON ULTRASONICS, FERROELECTRICS, AND FREQUENCY CONTROL, VOL. 65, NO. 6, JUNE 2018
directly compared. Second, it provides a basis to developanalytical SF models for various tissue types. Third, it providesa research tool to predict whether QUS-derived SF is sensitiveto a disease condition by analyzing the clinically availablehematoxylin and eosin (H&E)-stained histology.
While [41] demonstrated the correlation between histology-derived and QUS-derived SFs, the agreement between the twowas not perfect. Indeed, the histology-derived SF was 2-D,whereas the QUS-derived SF was volumetric (3-D). A criticalquestion to be answered is whether it is possible to derive thevolumetric SF from 2-D histological sections and (if possible)how the performance of the histology-derived volumetric SFcompares with that of the simple 2-D SF.
To answer this question, a stereological method is proposedherein to extract the volumetric SF from 2-D histological tissuesections. The proposed method derives the 3-D SF from a 2-Dcross section by utilizing the relationship between SF and paircorrelation function and the stereological relationship between2-D and 3-D pair correlation functions. The 3-D SF is derivedfrom the 3-D pair correlation function that is derived fromthe 2-D pair correlation function calculated from a 2-D pointdistribution. Simulations and experimental cell pellet studiesare also discussed to evaluate the proposed method.
The rest of this paper is organized as follows. The the-oretical background is introduced in Section II. Section IIIdescribes the proposed method in detail. Section IV presentsthe simulation that verifies the proposed method. Section Vapplies the proposed method to cell pellet biophantom dataand discusses the method. Section VI concludes this paper.
II. THEORY
A. Backscatter Coefficient
When a plane wave of unit amplitude is incident on ascattering volume V that contains N discrete scatterers, the far-field response behaves as a spherical wave [23]
ps(r) = eikr
R
N∑
j=1
� j (K)eiK·r j (1)
where ps(r) is the scattered acoustic pressure at position r,R = |r|, r j is the position of the j th scatterer, and k isthe propagation constant (k = ω/c where ω is the angularfrequency and c is the propagation speed). The factor � j (K)is the complex scattering amplitude of the j th scatterer,and K is the scattering vector with the magnitude given by|K| = 2k sin(θ/2), where θ is the scattering angle (θ = πfor backscattering). � j is dependent on the properties ofindividual scatterers relative to the background.
The differential cross section per unit volume σd (i.e.,the power scattered into a unit solid angle observed far fromthe scattering volume divided by the product of the incidentintensity and the scattering volume) may be expressed as
σd (K) = R2 Is
V I0= 1
V
∣∣∣∣∣∣
N∑
j=1
� j (K)eiK·r j
∣∣∣∣∣∣
2
(2)
where Is and I0 denote the scattering intensity and incidentintensity, respectively.
BSC is defined as the differential cross section per unitvolume in the backscattering direction (|K| = 2k).
B. Structure Function
If the scatterers are spatially uncorrelated, the phaseterms eiK·r j in (2) are also uncorrelated. The differential crosssection per unit volume for this case is expressed as
σd,incoherent(K) = 1
V
N∑
j=1
|� j (K)|2. (3)
If the scatterers are spatially correlated and the scatteringamplitudes � j (K) are identical for all the scatterers, then (2)may be simplified as
σd (K) = n̄|� j (K)|2 1
N
⎛
⎝N∑
j=1
eiK·r j
⎞
⎠
⎛
⎝N∑
j=1
e−iK·r j
⎞
⎠ (4)
where n̄ = N/V is the number density of the scatterers.Dividing (4) by (3) yields the SF
S(K)= 1
N
⎛
⎝N∑
j=1
eiK·r j
⎞
⎠
⎛
⎝N∑
j=1
e−iK·r j
⎞
⎠= 1
N
∣∣∣∣∣∣
N∑
j=1
e−iK·r j
∣∣∣∣∣∣
2
.
(5)
An SF of unity corresponds to uncorrelated random scattererpositioning, and SF values above unity mean constructiveinterferences, whereas values below unity mean destructiveinterferences due to the scatterer positioning.
C. Pair Correlation Function
In statistical mechanics, the pair correlation function g(r),also called radial distribution function, describes the statisti-cal distribution of a system of particles (or scatterers). Paircorrelation function of a system of particles is a measure ofthe probability to find a particle in a shell of thickness dr atthe distance r away from a given reference particle, relativeto that for an ideal gas (where particle positions are assumedto be uncorrelated with each other).
Pair correlation function is introduced herein because it isrelated to the SF by [24]
S(K) = 1 + n̄∫
[g(r) − 1]e−iK·rdr. (6-a)
For 2-D and 3-D isotropic cases, (6-a) can be expressed as
SA(2k) = 1 + 2π n̄ A
∫ ∞
0[gA(r) − 1]r J0(2kr)dr (6-b)
and
SV (2k) = 1 + 4π n̄V
∫ ∞
0[gV (r) − 1] r2 sin(2kr)
2krdr (6-c)
respectively, where the subscripts A and V represent 2-D(area) and 3-D (volume) quantities, respectively, n̄ A is the 2-Dnumber density (number of section disks per unit area), n̄V isthe 3-D number density (number of particles per unit volume),and J0 is the zeroth-order Bessel function of the first kind.
HAN: METHOD FOR STEREOLOGICAL DETERMINATION OF SF FROM HISTOLOGICAL SECTIONS 1009
D. Stereology
Quantitative stereology attempts to characterize 3-D featuresof the microstructure using 2-D cross sections of materi-als or tissues. The mathematical foundations of quantitativestereology can be found in [42].
For an isotropic distribution of nonoverlapping spheres, therelationship between the area (2-D) pair correlation functiongA(r) and the volumetric (3-D) pair correlation functiongV (r) can be expressed in the form of Hanisch’s integralequation [43], [44]
gA(r) =∫ ∞
0fV (x, t)gV (
√r2 + x2)dx for r ≥ 0 (7-a)
where
fV (x, t) = 2
(dV + t)2 ×∫ ∞
0(1 − DV ([|x − u| − t]+))
× (1 − DV ([x + u − t]+))du
for x ≥ 0 (7-b)
where [x]+ = max{x, 0}, dV is the mean sphere diameter, DV
is the cumulative density distribution of the sphere diameter,and t is the section thickness.
For the special case of monodisperse spheres, (7) is simpli-fied to
gA(r) = 2
(dV + t)2
∫ dV +t
0(dV + t − x)gV (
√r2 + x2)dx
for r ≥ 0. (8)
III. PROPOSED STEREOLOGICAL METHOD
A. Overview of the Proposed Method
Following the theories reviewed in Section II, a four-stepstereological method is proposed to extract the volumetricSF from histological sections, under the assumption that thescatterers are nonoverlapping and spherical in shape, and the3-D spatial distribution is isotropic.
Step 1: Process the histological image by applying shrinkagecorrection and fitting circles to the scatterers on the image.
Step 2: Calculate the 2-D pair correlation function using thefitted circle centers.
Step 3: Estimate the 3-D pair correlation function from the2-D pair correlation function by numerically solving Hanisch’sintegral equation.
Step 4: Calculate the 3-D SF from the 3-D pair correlationfunction using (6-c).
The details are explained step by step in the remaining ofSection III.
B. Histological Image Processing
A typical procedure to obtain histological images involvesfixing the biological material (e.g., tissue) with some fixa-tive (e.g., buffered formalin) for a certain period of time,embedding the fixed sample in paraffin, sectioning the paraffin-embedded sample, mounting the tissue sections on glass slides,and staining the tissue section (typically with H&E). Thefixing step introduces tissue shrinkage. For instance, neutral-buffered formalin fixation has been shown to reduce the
linear dimension of the cells, nuclei, and whole tissue byapproximately 10% compared to fresh samples [45], [46]. Thisshrinkage effect may be corrected by applying a shrinkagefactor that is appropriate for the types of fixative and tissueunder investigation.
In addition to shrinkage correction, a critical step in his-tological imaging processing is to fit circles to hypotheticalscatterers on the histological image. The fitted circle centersare needed for 2-D pair correlation calculation in Step 2, andthe fitted circle diameters will be used for sphere diameterestimation that is needed in Step 3.
The scatterer of interest is determined case by case. In cellpellet biophantoms (cells embedded in bovine plasma andthrombin clot [26]) and solid tumors, the scatterer of interestcan be the cell nuclei or whole cells. If there is more thanone candidate scatterer, then each candidate can be evaluatedseparately. In this case, the proposed method may also serve asa tool for identifying the scatterers from multiple candidates.
There are various circle fitting algorithms available in imageprocessing, and the Hough transform is a practical methodfor finding circles. The Hough transform circle finding isimplemented in the MATLAB library function “imfindcircles”,which is used in this paper.
C. 2-D Pair Correlation Function Estimation
The 2-D pair correlation function gA(r) is estimated usingthe algorithm described in [47] and briefly summarized asfollows. The algorithm starts with choosing a distance stepsize dr that is small enough to avoid blurring any importantstructure in the pair correlation function curve while largeenough to avoid counting too few scatterers in every step.For each distance r at which gA(r) is to be calculated, eachscatterer center is chosen in turn as a reference point. Thenumber of centers that are at a distance between r and r + draway from the reference center is counted, and averaged forall the reference centers. This number is then normalized by2πrdr (the area of the ring), and divided by the averagenumber of centers per unit area. For reference centers near theimage edge, the circle of some radius r may extend outsidethe image. This edge effect is correctly accounted for bydetermining how much angular extent of the circle lies withinthe image.
D. 3-D Pair Correlation Function Estimation
The 3-D pair correlation function is estimated from the2-D pair correlation function by solving Hanisch’s integralequation. A stereological estimation of the sphere size isneeded before Hanisch’s integral equation can be solved. Themean sphere diameter dV is a parameter in (7) and (8), andthe sphere diameter distribution DV appears in (7).
If the planar section has zero thickness, a simple stereolog-ical estimator for the mean sphere diameter dV is [44]
d̂V = Nπ
2
/ N∑
i=1
1
di(9)
1010 IEEE TRANSACTIONS ON ULTRASONICS, FERROELECTRICS, AND FREQUENCY CONTROL, VOL. 65, NO. 6, JUNE 2018
where di is the diameter of the i th disk measured from a planarsection, N is the total number of disks on the planar section.
If the section thickness is nonzero, the mean sphere diam-eter dV is estimated as follows. The moments of the spherediameter distribution are related to the moments of the diskdiameter distribution by [48]
n̄V τi = n̄ A
∞∑
k=0
pikσi+k
tk+1 , i = 0, 1, . . . (10)
where τi is the i th order moment of the sphere diameterdistribution (i.e., τ0 = 1, τ1 = dV ), σi+k is the (i + k)th ordermoment of the disk diameter distribution measured from 2-Dsections, t is the section thickness, and the coefficients pik aredefined by
pi,0 = 1
pi,k = (−1)kk∏
j=1
[1
2�
(i + j + 1
2
)�
(1
2
)
/�
(i + j + 2
2
)], k = 1, 2, . . .
where � is the gamma function. Applying the moment rela-tionship (10) for i = 0 and i = 1 yields an estimator for themean sphere diameter for the case of nonzero thickness
d̂V =∞∑
k=0
p1kσ1+k
tk+1
/ ∞∑
k=0
p0kσk
tk+1 . (11)
Equations (10) and (11) are used in the simulation study(Section IV) for t = 0 and 3 μm, respectively. Equation (11) isused in the biophantom study (Section V) for the histologicalsections with t = 3 μm.
There are no simple estimators available for the spherediameter distribution function DV , although model-basedmethods are available to estimate the sphere diameter dis-tribution by assuming various distribution models [44], [48].A monodisperse distribution is used in this paper for sim-plicity. Although the cell or nucleus diameter has a finitedistribution, the distribution is considered narrow enough tobe modeled as a monodisperse distribution for the purposesof solving Hanisch’s integral equation, as verified by thesimulation study discussed in Section IV.
Hanisch’s integral equation is solved numerically. Thenumerical solution under the zero thickness condition wasdescribed in [49]. The numerical solution for a nonzerothickness is derived as follows. Making a change of variablesz = (r2 + x2)1/2 to (7-a) and assuming that the functiongV (z) remains sufficiently constant over some small interval[z − δz/2, z + δz/2], the integral equation (7-a) is changed tothe matrix equation
gA(r) = 2
(dV + t)2
∑
z≥r
gV (z)I (z, r) (12)
where
I (z, r) =∫ z2
z1
fV (z, t)du
z1 ={√
(z − δz/2)2 − r2, (z − δz/2)2 > r2
0, otherwise
z2 ={√
(z + δz/2)2 − r2, (z + δz/2)2 > r2
0, otherwise.(13)
The integral I (z, r) is dependent on the sphere diameterdistribution. For the special case of identical sphere diameters,we have
I (z, r) = (min{z2, zmax} − min{z1, zmax})×[dV +t−0.5(min{z2, zmax}+min{z1, zmax})] (14)
and
zmax =√
(dV + t)2 + r2. (15)
The matrix equation (12) has desirable numerical properties.The matrix I (z, r) is upper triangular, and is also stronglydiagonal for large values of r , which makes the numericalsolution practical.
E. Volumetric Structure Function Estimation
The 3-D SF is calculated through (6-c) using the 3-D paircorrelation function estimated in Step 3. The 3-D numberdensity n̄V in (6-c) needs to be estimated prior to using (6-c).The 3-D number density n̄V is related to the 2-D numberdensity n̄ A by [44]
n̄V = n̄ A/(dV + t) (16)
where the 2-D number density n̄ A is estimated through circlefitting in Step 1 and dV is estimated using (10) (zero thick-ness) or (11) (nonzero thickness).
IV. SIMULATIONS
A. Simulation Overview
Simulations were performed to evaluate the proposedmethod under various sphere diameters and diameter dis-tribution widths, and with zero and nonzero section thick-nesses. The simulations also serve the purpose of assessingthe monodisperse distribution approximation used to solveHanisch’s equation for spheres having a distribution similarto that of cells and nuclei. Also, the robustness of the modelis studied through simulation.
The overall idea of the simulation study was to computa-tionally generate a 3-D distribution of nonoverlapping spheres,calculate the volumetric SF from the 3-D distribution as theground truth, estimate 2-D SF and 3-D SF from 2-D slices ofthe 3-D volume, and compare the estimated 2-D and 3-D SFswith ground truth.

HAN: METHOD FOR STEREOLOGICAL DETERMINATION OF SF FROM HISTOLOGICAL SECTIONS 1011
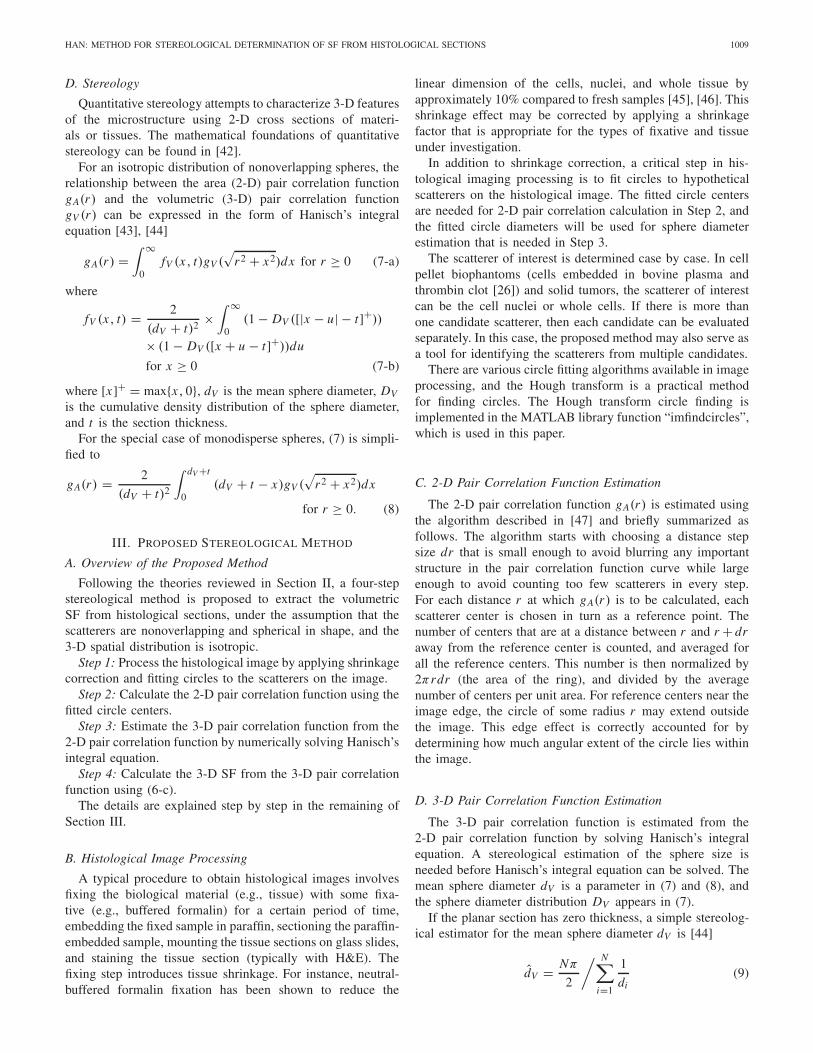
Fig. 1. (a) Probability density functions of the four simulated sphere radius distributions. (b) Simulated 3-D volume of spheres (a = 6.7 μm, z = 51.9) witha volume fraction 60%. The direction of the z-axis is indicated by the arrow. (c) 2-D slice of zero thickness generated from the 3-D volume shown in (b).
B. Simulation Methods
The radii of the simulated spheres followed a �-distribution,with a probability density function
fz(x) = 1
z!(
z + 1
a
)z+1
x ze− (z+1)xa (17)
where a is the mean radius and z is a parameter inverselyrelated to the distribution width (a larger z corresponding to anarrower distribution). Four size distributions were simulated[Fig. 1(a)]: 1) a = 6.7 μm, z = 51.9; 2) a = 7.3 μm,z = 65.8; 3) a = 8.9 μm, z = 31.9; and 4) a = 6.7 μm,z = 25.
The spheres were randomly distributed in a cube of agiven size 400 μm × 400 μm × 400 μm [Fig. 1(b)]. Thevolume fraction of the spheres was 60%. The random spherepacking algorithm used was a modified forced-biased algo-rithm that is suitable for the high-volume fraction genera-tion [41]. No sphere overlapping was allowed. The periodicboundary condition was used. Ten slices of the same thickness(0 or 3 μm) perpendicular to the z-axis of the simulated cubewere picked. Each slice was then a distribution of polydispersedisks [Fig. 1(c)].
The ground truth 3-D SF was calculated from the sim-ulated cube using (5). The 2-D SF was calculated fromeach of the slices using (5). Then the proposed stereologicalmethod was applied to each slice to yield a 3-D SF esti-mate. A monodisperse distribution was assumed when solvingHanisch’s equation.
C. Simulation Results and Discussion
The disks on the simulated 2-D slice [Fig. 1(c)] appear tohave a greater size distribution than those of the spheres in thecube [Fig. 1(b)]. A small fraction of disks have radii close to0 because of the slicing effect.
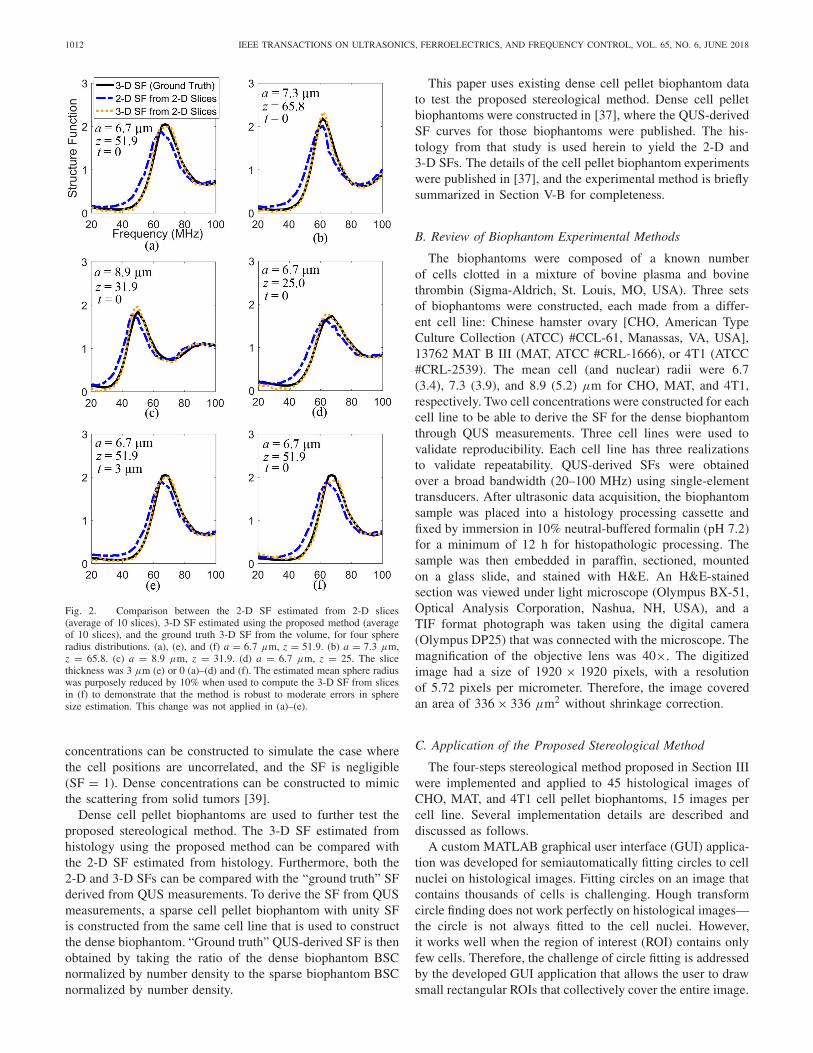
The 3-D SF estimated from the slices using the proposedmethod agreed well with the ground truth calculated directlyfrom the volume for all the four simulated mean sphereradii and sphere radius distributions [Fig. 2(a)–(d)] when theslice thickness was zero, although the agreement for narrowerradius distributions [Fig. 2(a) and (b)] was slightly better than
for wider distributions [Fig. 2(c) and (d)]. The agreementwas not affected when the slice thickness was changed from0 to 3 μm [Fig. 2(e), compared with Fig. 2(a)]. Furthermore,the agreement remained when the estimated mean sphereradius used to solve Hanisch’s equation was purposely reducedby 10% [Fig. 2(f), compared with Fig. 2(a)], demonstratingthat the proposed stereological method is not sensitive to errorsin sphere size estimation.
In contrast, the 2-D SF estimated from the slices didnot agree as well with the ground truth 3-D SF. The 2-D SF appeared to be shifted toward the lower frequencyend compared to the ground truth, which demonstrates thefundamental difference between the 2-D and 3-D cases.
The simulation results also demonstrated that the monodis-perse sphere assumption was acceptable when used to solveHanisch’s equation for spheres having a distribution similar tothat of cells and nuclei. Using the monodisperse assumption,the 3-D SF derived from 2-D slices performed noticeablybetter than the 2-D SF in terms of agreement to the ground-truth 3-D SF. [Note: Both 3-D SF curves are extremely closecompared to the 2-D curve in Fig. 2(a)–(f).]
The 3-D SF computed using the stereological method cap-tures the structure information within a spatial scale limitedby the maximum distance (rmax) for which the pair correlationfunction was computed, because the last step of computing the3-D SF involves integrating (from 0 to ∞) a term containinggV (r) − 1 using (6-c). The estimated 3-D SF is unreliable forfrequencies lower than c/rmax if gV (r)−1 does not vanish forr > rmax. The maximum distance rmax used herein was 84 μm,which corresponds to a frequency of 18.3 MHz. Therefore,the frequency range starts from 20 MHz in Fig. 2.
V. CELL PELLET BIOPHANTOM RESULTS
AND DISCUSSION
A. Overview
The cell pellet biophantom [26] is a useful tool to studyultrasonic scattering theories including the SF. Cell pelletbiophantoms were constructed by embedding a known numberof cells to a bovine plasma and thrombin clot. The concentra-tion of the cell pellet biophantoms can be controlled. Sparse
1012 IEEE TRANSACTIONS ON ULTRASONICS, FERROELECTRICS, AND FREQUENCY CONTROL, VOL. 65, NO. 6, JUNE 2018
Fig. 2. Comparison between the 2-D SF estimated from 2-D slices(average of 10 slices), 3-D SF estimated using the proposed method (averageof 10 slices), and the ground truth 3-D SF from the volume, for four sphereradius distributions. (a), (e), and (f) a = 6.7 μm, z = 51.9. (b) a = 7.3 μm,z = 65.8. (c) a = 8.9 μm, z = 31.9. (d) a = 6.7 μm, z = 25. The slicethickness was 3 μm (e) or 0 (a)–(d) and (f). The estimated mean sphere radiuswas purposely reduced by 10% when used to compute the 3-D SF from slicesin (f) to demonstrate that the method is robust to moderate errors in spheresize estimation. This change was not applied in (a)–(e).
concentrations can be constructed to simulate the case wherethe cell positions are uncorrelated, and the SF is negligible(SF = 1). Dense concentrations can be constructed to mimicthe scattering from solid tumors [39].
Dense cell pellet biophantoms are used to further test theproposed stereological method. The 3-D SF estimated fromhistology using the proposed method can be compared withthe 2-D SF estimated from histology. Furthermore, both the2-D and 3-D SFs can be compared with the “ground truth” SFderived from QUS measurements. To derive the SF from QUSmeasurements, a sparse cell pellet biophantom with unity SFis constructed from the same cell line that is used to constructthe dense biophantom. “Ground truth” QUS-derived SF is thenobtained by taking the ratio of the dense biophantom BSCnormalized by number density to the sparse biophantom BSCnormalized by number density.
This paper uses existing dense cell pellet biophantom datato test the proposed stereological method. Dense cell pelletbiophantoms were constructed in [37], where the QUS-derivedSF curves for those biophantoms were published. The his-tology from that study is used herein to yield the 2-D and3-D SFs. The details of the cell pellet biophantom experimentswere published in [37], and the experimental method is brieflysummarized in Section V-B for completeness.
B. Review of Biophantom Experimental Methods
The biophantoms were composed of a known numberof cells clotted in a mixture of bovine plasma and bovinethrombin (Sigma-Aldrich, St. Louis, MO, USA). Three setsof biophantoms were constructed, each made from a differ-ent cell line: Chinese hamster ovary [CHO, American TypeCulture Collection (ATCC) #CCL-61, Manassas, VA, USA],13762 MAT B III (MAT, ATCC #CRL-1666), or 4T1 (ATCC#CRL-2539). The mean cell (and nuclear) radii were 6.7(3.4), 7.3 (3.9), and 8.9 (5.2) μm for CHO, MAT, and 4T1,respectively. Two cell concentrations were constructed for eachcell line to be able to derive the SF for the dense biophantomthrough QUS measurements. Three cell lines were used tovalidate reproducibility. Each cell line has three realizationsto validate repeatability. QUS-derived SFs were obtainedover a broad bandwidth (20–100 MHz) using single-elementtransducers. After ultrasonic data acquisition, the biophantomsample was placed into a histology processing cassette andfixed by immersion in 10% neutral-buffered formalin (pH 7.2)for a minimum of 12 h for histopathologic processing. Thesample was then embedded in paraffin, sectioned, mountedon a glass slide, and stained with H&E. An H&E-stainedsection was viewed under light microscope (Olympus BX-51,Optical Analysis Corporation, Nashua, NH, USA), and aTIF format photograph was taken using the digital camera(Olympus DP25) that was connected with the microscope. Themagnification of the objective lens was 40×. The digitizedimage had a size of 1920 × 1920 pixels, with a resolutionof 5.72 pixels per micrometer. Therefore, the image coveredan area of 336 × 336 μm2 without shrinkage correction.
C. Application of the Proposed Stereological Method
The four-steps stereological method proposed in Section IIIwere implemented and applied to 45 histological images ofCHO, MAT, and 4T1 cell pellet biophantoms, 15 images percell line. Several implementation details are described anddiscussed as follows.
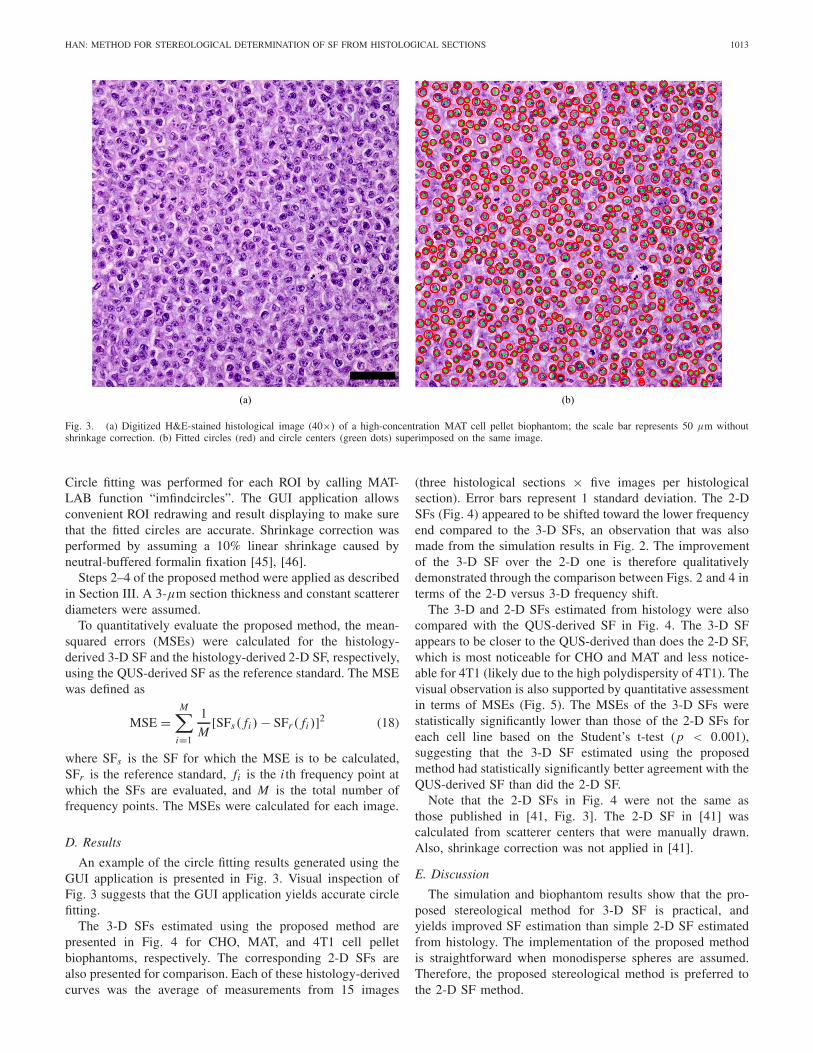
A custom MATLAB graphical user interface (GUI) applica-tion was developed for semiautomatically fitting circles to cellnuclei on histological images. Fitting circles on an image thatcontains thousands of cells is challenging. Hough transformcircle finding does not work perfectly on histological images—the circle is not always fitted to the cell nuclei. However,it works well when the region of interest (ROI) contains onlyfew cells. Therefore, the challenge of circle fitting is addressedby the developed GUI application that allows the user to drawsmall rectangular ROIs that collectively cover the entire image.
HAN: METHOD FOR STEREOLOGICAL DETERMINATION OF SF FROM HISTOLOGICAL SECTIONS 1013
Fig. 3. (a) Digitized H&E-stained histological image (40×) of a high-concentration MAT cell pellet biophantom; the scale bar represents 50 μm withoutshrinkage correction. (b) Fitted circles (red) and circle centers (green dots) superimposed on the same image.
Circle fitting was performed for each ROI by calling MAT-LAB function “imfindcircles”. The GUI application allowsconvenient ROI redrawing and result displaying to make surethat the fitted circles are accurate. Shrinkage correction wasperformed by assuming a 10% linear shrinkage caused byneutral-buffered formalin fixation [45], [46].
Steps 2–4 of the proposed method were applied as describedin Section III. A 3-μm section thickness and constant scattererdiameters were assumed.
To quantitatively evaluate the proposed method, the mean-squared errors (MSEs) were calculated for the histology-derived 3-D SF and the histology-derived 2-D SF, respectively,using the QUS-derived SF as the reference standard. The MSEwas defined as
MSE =M∑
i=1
1
M[SFs( fi ) − SFr ( fi )]2 (18)
where SFs is the SF for which the MSE is to be calculated,SFr is the reference standard, fi is the i th frequency point atwhich the SFs are evaluated, and M is the total number offrequency points. The MSEs were calculated for each image.
D. Results
An example of the circle fitting results generated using theGUI application is presented in Fig. 3. Visual inspection ofFig. 3 suggests that the GUI application yields accurate circlefitting.
The 3-D SFs estimated using the proposed method arepresented in Fig. 4 for CHO, MAT, and 4T1 cell pelletbiophantoms, respectively. The corresponding 2-D SFs arealso presented for comparison. Each of these histology-derivedcurves was the average of measurements from 15 images
(three histological sections × five images per histologicalsection). Error bars represent 1 standard deviation. The 2-DSFs (Fig. 4) appeared to be shifted toward the lower frequencyend compared to the 3-D SFs, an observation that was alsomade from the simulation results in Fig. 2. The improvementof the 3-D SF over the 2-D one is therefore qualitativelydemonstrated through the comparison between Figs. 2 and 4 interms of the 2-D versus 3-D frequency shift.
The 3-D and 2-D SFs estimated from histology were alsocompared with the QUS-derived SF in Fig. 4. The 3-D SFappears to be closer to the QUS-derived than does the 2-D SF,which is most noticeable for CHO and MAT and less notice-able for 4T1 (likely due to the high polydispersity of 4T1). Thevisual observation is also supported by quantitative assessmentin terms of MSEs (Fig. 5). The MSEs of the 3-D SFs werestatistically significantly lower than those of the 2-D SFs foreach cell line based on the Student’s t-test (p < 0.001),suggesting that the 3-D SF estimated using the proposedmethod had statistically significantly better agreement with theQUS-derived SF than did the 2-D SF.
Note that the 2-D SFs in Fig. 4 were not the same asthose published in [41, Fig. 3]. The 2-D SF in [41] wascalculated from scatterer centers that were manually drawn.Also, shrinkage correction was not applied in [41].
E. Discussion
The simulation and biophantom results show that the pro-posed stereological method for 3-D SF is practical, andyields improved SF estimation than simple 2-D SF estimatedfrom histology. The implementation of the proposed methodis straightforward when monodisperse spheres are assumed.Therefore, the proposed stereological method is preferred tothe 2-D SF method.

1014 IEEE TRANSACTIONS ON ULTRASONICS, FERROELECTRICS, AND FREQUENCY CONTROL, VOL. 65, NO. 6, JUNE 2018
Fig. 4. Comparison between QUS-derived SF (dashed line), the 2-D SF(solid line with squares) estimated from histology, and 3-D SF (solid line withdiamonds) estimated using the proposed method from histology for (a) CHO,(b) MAT, and (c) 4T1 cell pellet biophantoms. Each histology-estimated curverepresents the average result obtained from 15 histological images obtainedfrom three histological sections (five images per section). Error bars representone standard deviation. The QUS-derived SFs were previously published [37].
Isotropic distribution and monodisperse spheres are theprimary assumptions for the implementation of the proposedmethod. The isotropic assumption appears to be appropriatefor the cell pellet biophantoms (Fig. 3) studied herein. Also,
Fig. 5. MSEs of the histology-derived 3-D SFs and 2-D SFs relative to theQUS-derived SF for CHO, MAT, and 4T1 cell pellet biophantoms. The MSEsof the 3-D SFs were statistically significantly lower than those of the 2-D SFsfor all the cell lines.
the isotropic assumption holds for the microstructure of abroad range of tissue types such as the liver and solidtumors. However, there are also tissues that exhibit anisotropy,for instance, muscles. The proposed stereological method isnot applicable for those tissues. New stereological methodsare needed for anisotropic media to take into account thedirectional dependence of the underlying scatterer distribution.
The monodisperse sphere assumption was tested throughsimulations. This assumption appears to be reasonable for pur-poses of implementing the proposed method for the applicationof biological cells. Alternatively, the proposed method mayalso be implemented by assuming a distribution (e.g., lognor-mal distribution) of the sphere size; such an implementationis more sophisticated than the monodisperse implementation,and is not exploited in this paper because the monodisperseassumption was shown by simulation to be close enough.
The thickness of the tissue sections was 3 μm. The sectionthickness parameter used in the proposed method should bethe minimum of the light microscope imaging system’s depthof correlation [50] and the tissue section physical thickness.The depth of focus was calculated to be much greater thanthe tissue section thickness; hence a 3-μm thickness wasappropriate.
The SFs involved in the biophantom study were analyzedbased on the nuclei identified by the circle detection algorithm.The SFs based on the whole cells were not evaluated. The cellcenter and the nuclear center of the same cell are close but notnecessarily identical. Therefore, the 3-D SF calculated basedon the nuclei should be close to, but not necessarily identicalto, that calculated based on whole cells. It will be interestingto evaluate the SFs based on whole cells in the future studiesusing more advanced automatic cell segmentation algorithms.
The proposed stereological method may be useful in anumber of applications. In the QUS context, the method isuseful for elucidating the scattering mechanism(s) and iden-tifying the primary scattering sites responsible for scattering.For instance, the SF can be calculated separately for multiple-candidate scattering sites to decide which one agrees withthe QUS measures. With widely available H&E-stained tissuesections for various diseases, the proposed method can alsobe used to predict the SFs of different disease conditions,thereby predicting whether QUS would be sensitive to such
HAN: METHOD FOR STEREOLOGICAL DETERMINATION OF SF FROM HISTOLOGICAL SECTIONS 1015
conditions. Also, these histology-derived SFs provide a basisto develop analytical SF models. Last, the proposed method isnot limited to acoustic scattering. It is also applicable to othermodalities, for example, electromagnetic scattering includinglight scattering.
Although the proposed method improves the accuracy of SFestimation from histology, the agreement between the resulting3-D SF and the QUS-derived SF is still not perfect. Futurestudies may be carried out to investigate such a difference inorder to improve the understanding of ultrasonic scattering intissues. Another direction for the future studies would be toapply the proposed method to various disease conditions toimprove the QUS diagnostic ability using the SF.
VI. CONCLUSION
The proposed stereological method is feasible for estimatingthe 3-D SF from histology. The proposed method yields amore accurate SF estimate. The 3-D SF estimated using theproposed method has a closer agreement with the QUS-derivedSF than does the 2-D SF. The stereological method will beuseful for improving the understanding of ultrasonic scatteringin tissues and for exploring the diagnostic capability of SFusing histology.
ACKNOWLEDGMENT
The author would like to thank J. R. Kelly for fabricatingthe cell pellets, and Prof. W. D. O’Brien, Jr., Ph.D., for helpfuldiscussions and critical review of this paper.
REFERENCES
[1] E. J. Feleppa, F. L. Lizzi, D. J. Coleman, and M. M. Yaremko, “Diag-nostic spectrum analysis in ophthalmology: A physical perspective,”Ultrasound Med. Biol., vol. 12, no. 8, pp. 623–631, 1986.
[2] D. J. Coleman et al., “Noninvasive in vivo detection of prognostic indi-cators for high-risk uveal melanoma: Ultrasound parameter imaging,”Ophthalmology, vol. 111, no. 3, pp. 558–564, Mar. 2004.
[3] E. J. Feleppa et al., “Typing of prostate tissue by ultrasonic spectrumanalysis,” IEEE Trans. Ultrason., Ferroelect., Freq. Control, vol. 43,no. 4, pp. 609–619, Jul. 1996.
[4] M. F. Insana, T. J. Hall, J. G. Wood, and Z.-Y. Yan, “Renal ultrasoundusing parametric imaging techniques to detect changes in microstructureand function,” Invest. Radiol., vol. 28, no. 8, pp. 720–725, 1993.
[5] J. G. Miller et al., “Myocardial tissue characterization: An approachbased on quantitative backscatter and attenuation,” in Proc. Ultrason.Symp., Oct./Nov. 1983, pp. 782–793.
[6] P. K. Tamirisa, M. R. Holland, J. G. Miller, and J. E. Pérez, “Ultrasonictissue characterization: Review of an approach to assess hypertrophicmyocardium,” Echocardiography, vol. 18, no. 7, pp. 593–597, 2001.
[7] L. Y. L. Mo and R. S. C. Cobbold, “Theoretical models of ultrasonicscattering in blood,” in Ultrasonic Scattering in Biological Tissues,K. K. Shung and G. A. Thieme, Eds. Boca Raton, FL, USA:CRC Press, 1993, pp. 125–170.
[8] F. T. H. Yu, É. Franceschini, B. Chayer, J. K. Armstrong,H. J. Meiselman, and G. Cloutier, “Ultrasonic parametric imagingof erythrocyte aggregation using the structure factor size estimator,”Biorheology, vol. 46, no. 4, pp. 343–363, 2009.
[9] M. L. Oelze, W. D. O’Brien, Jr., J. P. Blue, and J. F. Zachary,“Differentiation and characterization of rat mammary fibroadenomas and4T1 mouse carcinomas using quantitative ultrasound imaging,” IEEETrans. Med. Imag., vol. 23, no. 6, pp. 764–771, Jun. 2004.
[10] M. L. Oelze and W. D. O’Brien, Jr., “Application of three scatteringmodels to characterization of solid tumors in mice,” Ultrason. Imag.,vol. 28, no. 2, pp. 83–96, 2006.
[11] L. A. Wirtzfeld et al., “Techniques and evaluation from a cross-platformimaging comparison of quantitative ultrasound parameters in an in vivorodent fibroadenoma model,” IEEE Trans. Ultrason., Ferroelect., Freq.Control, vol. 60, no. 7, pp. 1386–1400, Jul. 2013.
[12] L. A. Wirtzfeld et al., “Quantitative ultrasound comparison of MATand 4T1 mammary tumors in mice and rats across multiple imag-ing systems,” J. Ultrasound Med., vol. 34, no. 8, pp. 1373–1383,2015.
[13] B. S. Garra, M. F. Insana, T. H. Shawker, R. F. Wagner, M. Bradford,and M. Russell, “Quantitative ultrasonic detection and classification ofdiffuse liver disease. Comparison with human observer performance,”Invest. Radiol., vol. 24, no. 3, pp. 196–203, 1989.
[14] J. Mamou et al., “Three-dimensional high-frequency backscatter andenvelope quantification of cancerous human lymph nodes,” UltrasoundMed. Biol., vol. 37, no. 3, pp. 345–357, 2011.
[15] M. C. Kolios, G. J. Czarnota, M. Lee, J. W. Hunt, andM. D. Sherar, “Ultrasonic spectral parameter characterization of apop-tosis,” Ultrasound Med. Biol., vol. 28, no. 5, pp. 589–597, May 2002.
[16] B. Banihashemi, R. Vlad, B. Debeljevic, A. Giles, M. C. Kolios, andG. J. Czarnota, “Ultrasound imaging of apoptosis in tumor response:Novel preclinical monitoring of photodynamic therapy effects,” CancerRes., vol. 68, no. 20, pp. 8590–8596, 2008.
[17] H. Tadayyon, A. Sadeghi-Naini, L. Wirtzfeld, F. C. Wright, andG. Czarnota, “Quantitative ultrasound characterization of locallyadvanced breast cancer by estimation of its scatterer properties,” Med.Phys., vol. 41, no. 1, p. 012903, 2014.
[18] A. Sadeghi-Naini et al., “Quantitative ultrasound evaluation of tumorcell death response in locally advanced breast cancer patients receivingchemotherapy,” Clin. Cancer Res., vol. 19, no. 8, pp. 2163–2174, 2013.
[19] A. Han, J. W. Erdman, D. G. Simpson, M. P. Andre, andW. D. O’Brien, “Early detection of fatty liver disease in mice viaquantitative ultrasound,” in Proc. IEEE Int. Ultrason. Symp., Sep. 2014,pp. 2363–2366.
[20] M. P. Andre et al., “Accurate diagnosis of nonalcoholic fatty liver diseasein human participants via quantitative ultrasound,” in Proc. IEEE Int.Ultrason. Symp., Sep. 2014, pp. 2375–2377.
[21] S. C. Lin et al., “Noninvasive diagnosis of nonalcoholic fatty liverdisease and quantification of liver fat using a new quantitative ultrasoundtechnique,” Clin. Gastroenterol. Hepatol., vol. 13, no. 7, pp. 1337–1345,Jul. 2015.
[22] B. L. McFarlin et al., “Beyond cervical length: A pilot study of ultra-sonic attenuation for early detection of preterm birth risk,” UltrasoundMed. Biol., vol. 41, no. 11, pp. 3023–3029, 2015.
[23] M. F. Insana, R. F. Wagner, D. G. Brown, and T. J. Hall, “Describingsmall-scale structure in random media using pulse-echo ultrasound,”J. Acoust. Soc. Amer., vol. 87, no. 1, pp. 179–192, 1990.
[24] V. Twersky, “Low-frequency scattering by correlated distributions ofrandomly oriented particles,” J. Acoust. Soc. Amer., vol. 81, no. 5,pp. 1609–1618, 1987.
[25] I. Fontaine, M. Bertrand, and G. Cloutier, “A system-based approachto modeling the ultrasound signal backscattered by red blood cells,”Biophys. J., vol. 77, no. 5, pp. 2387–2399, Nov. 1999.
[26] M. Teisseire, A. Han, R. Abuhabsah, J. P. Blue, Jr., S. Sarwate, andW. D. O’Brien, Jr., “Ultrasonic backscatter coefficient quantitative esti-mates from Chinese hamster ovary cell pellet biophantoms,” J. Acoust.Soc. Amer., vol. 128, no. 5, pp. 3175–3180, 2010.
[27] A. Han, R. Abuhabsah, J. P. Blue, Jr, S. Sarwate, andW. D. O’Brien, Jr., “Ultrasonic backscatter coefficient quantitativeestimates from high-concentration Chinese hamster ovary cell pelletbiophantoms,” J. Acoust. Soc. Amer., vol. 130, no. 6, pp. 4139–4147,2011.
[28] V. Twersky, “Low-frequency scattering by mixtures of correlated non-spherical particles,” J. Acoust. Soc. Amer., vol. 84, no. 1, pp. 409–415,1988.
[29] E. Franceschini, R. K. Saha, and G. Cloutier, “Comparison of threescattering models for ultrasound blood characterization,” IEEE Trans.Ultrason., Ferroelect., Freq. Control, vol. 60, no. 11, pp. 2321–2334,Nov. 2013.
[30] D. Savéry and G. Cloutier, “A point process approach to assess thefrequency dependence of ultrasound backscattering by aggregating redblood cells,” J. Acoust. Soc. Amer., vol. 110, no. 6, pp. 3252–3262,2001.
[31] D. Savery and G. Cloutier, “Effect of red cell clustering and anisotropyon ultrasound blood backscatter: A Monte Carlo study,” IEEE Trans.Ultrason., Ferroelect., Freq. Control, vol. 52, no. 1, pp. 94–103,Jan. 2005.
1016 IEEE TRANSACTIONS ON ULTRASONICS, FERROELECTRICS, AND FREQUENCY CONTROL, VOL. 65, NO. 6, JUNE 2018
[32] R. K. Saha and G. Cloutier, “Monte Carlo study on ultrasound backscat-tering by three-dimensional distributions of red blood cells,” Phys.Rev. E, Stat. Phys. Plasmas Fluids Relat. Interdiscip. Top., vol. 78, no. 6,p. 61919, 2008.
[33] J. W. Hunt, A. E. Worthington, A. Xuan, M. C. Kolios, G. J. Czarnota,and M. D. Sherar, “A model based upon pseudo regular spacing of cellscombined with the randomisation of the nuclei can explain the signif-icant changes in high-frequency ultrasound signals during apoptosis,”Ultrasound Med. Biol., vol. 28, no. 2, pp. 217–226, 2002.
[34] R. M. Vlad, R. K. Saha, N. M. Alajez, S. Ranieri, G. J. Czarnota, andM. C. Kolios, “An increase in cellular size variance contributes to theincrease in ultrasound backscatter during cell death,” Ultrasound Med.Biol., vol. 36, no. 9, pp. 1546–1558, 2010.
[35] E. Franceschini and R. Guillermin, “Experimental assessment offour ultrasound scattering models for characterizing concentratedtissue-mimicking phantoms,” J. Acoust. Soc. Amer., vol. 132, no. 6,pp. 3735–3747, 2012.
[36] E. Franceschini, R. Guillermin, F. Tourniaire, S. Roffino, E. Lamy, andJ.-F. Landrier, “Structure factor model for understanding the measuredbackscatter coefficients from concentrated cell pellet biophantoms,”J. Acoust. Soc. Amer., vol. 135, no. 6, pp. 3620–3631, 2014.
[37] A. Han and W. D. O’Brien, Jr., “Structure function for high-concentration biophantoms of polydisperse scatterer sizes,” IEEE Trans.Ultrason., Ferroelect., Freq. Control, vol. 62, no. 2, pp. 303–318,Feb. 2015.
[38] E. Franceschini, R. de Monchy, and J. Mamou, “Quantitative character-ization of tissue microstructure in concentrated cell pellet biophantomsbased on the structure factor model,” IEEE Trans. Ultrason., Ferroelect.,Freq. Control, vol. 63, no. 9, pp. 1321–1334, Sep. 2016.
[39] A. Han, R. Abuhabsah, R. J. Miller, S. Sarwate, andW. D. O’Brien, Jr., “The measurement of ultrasound backscatteringfrom cell pellet biophantoms and tumors ex vivo,” J. Acoust. Soc. Amer.,vol. 134, no. 1, pp. 686–693, 2013.
[40] P. Muleki-Seya et al., “High-frequency quantitative ultrasound spec-troscopy of excised canine livers and mouse tumors using the structurefactor model,” IEEE Trans. Ultrason., Ferroelect., Freq. Control, vol. 63,no. 9, pp. 1335–1350, Sep. 2016.
[41] A. Han and W. D. O’Brien, Jr., “Structure function estimated fromhistological tissue sections,” IEEE Trans. Ultrason., Ferroelect., Freq.Control, vol. 63, no. 9, pp. 1296–1305, Sep. 2016.
[42] E. E. Underwood, “The mathematical foundations of quantitative stere-ology,” in Stereology and Quantitative Metallography. Philadelphia, PA,USA: ASTM, 1972.
[43] K.-H. Hanisch, “On stereological estimation of second-order charac-teristics and of the hard-core distance of systems of sphere centres,”Biometrical J., vol. 25, no. 8, pp. 731–743, 1983.
[44] S. N. Chiu, D. Stoyan, W. S. Kendall, and J. Mecke, Stochastic Geometryand Its Applications, 3rd ed. Hoboken, NJ, USA: Wiley, 2013.
[45] K. F. A. Ross, “Cell shrinkage caused by fixatives and paraffin-waxembedding in ordinary cytological preparations,” J. Microscopical Sci.,vol. 94, no. 26, pp. 125–139, 1953.
[46] T. Tran et al., “Correcting the shrinkage effects of formalin fixa-tion and tissue processing for renal tumors: Toward standardizationof pathological reporting of tumor size,” J. Cancer, vol. 6, no. 8,pp. 759–766, 2015.
[47] J. C. Crocker and D. G. Grier, “Methods of digital video microscopy forcolloidal studies,” J. Colloid Interface Sci., vol. 179, no. 1, pp. 298–310,Apr. 1996.
[48] J. Ohser and F. Mücklich, Statistical Analysis of Microstructures inMaterials Science. Hoboken, NJ, USA: Wiley, 2000.
[49] L. M. Zurk, L. Tsang, J. Shi, and R. E. Davis, “Electromagneticscattering calculated from pair distribution functions retrieved fromplanar snow sections,” IEEE Trans. Geosci. Remote Sens., vol. 35, no. 6,pp. 1419–1428, Nov. 1997.
[50] C. D. Meinhart, S. T. Wereley, and M. H. B. Gray, “Volume illuminationfor two-dimensional particle image velocimetry,” Meas. Sci. Technol.,vol. 11, no. 6, pp. 809–814, 2000.
Aiguo Han (S’13–M’15) was born in Jiangsu,China, in 1986. He received the B.S. degree inacoustics from Nanjing University, Nanjing, China,in 2008, and the M.S. and Ph.D. degrees in electricaland computer engineering from the University ofIllinois at Urbana–Champaign, Urbana, IL, USA,in 2011 and 2014, respectively.
Since 2015, he has been a Postdoctoral ResearchAssociate with the University of Illinois at Urbana–Champaign. His research interests include ultrasonicwave propagation in heterogeneous media, biomed-
ical ultrasound imaging and quantitative ultrasound, and signal processing andmachine learning techniques for ultrasonic tissue characterization.
Dr. Han is a member of the Acoustical Society of America and the AmericanInstitute of Ultrasound in Medicine. He was a recipient of the New InvestigatorBasic Science Award of the 2016 AIUM Annual Convention.


![70 201780217 ( 91 ) 4. : Lizzi Center for Biomedical ...6. (1/2 2007, Rohrbach 2016] & 250 MHz Barker E [Misaridis 2005]) & 2018 3 10 IEEE (UFFC) IEEE IUS (International Ultrasonics](https://img.pdfslide.us/doc/110x75/6045dead2d61b079a1099704/70-201780217-91-4-lizzi-center-for-biomedical-6-12-2007-rohrbach.jpg)


![IEEE TRANSACTIONS ON ULTRASONICS, FERROELECTRICS, …grus/publications/BochudRus11_tuffc.pdfcharacterization. I. ... [32] and to measure acoustic nonlinearity in trabecular bone [33]](https://img.pdfslide.us/doc/110x75/60f81ad1aada31696f07b5af/ieee-transactions-on-ultrasonics-ferroelectrics-gruspublicationsbochudrus11tuffcpdf.jpg)