Embed Size (px)
Citation preview

IEEE TRANSACTIONS ON SOFTWARE ENGINEERING, VOL. X, NO. Y, MONTH YEAR 1
Stressing Search with Scenarios for FlexibleSolutions to Real-Time Task Allocation Problems
Paul Emberson, Iain Bate, Member, IEEE
Abstract —One of the most important properties of a good software engineering process and of the design of the software it produces isrobustness to changing requirements. Scenario-based analysis is a popular method for improving the flexibility of software architectures.This paper demonstrates a search-based technique for automating scenario-based analysis in the software architecture deploymentview. Specifically, a novel parallel simulated annealing search algorithm is applied to the real-time task allocation problem to findbaseline solutions which require a minimal number of changes in order to meet the requirements of potential upgrade scenarios.Another simulated annealing based search is used for finding a solution which is similar to an existing baseline when new requirementsarise. Solutions generated using a variety of scenarios are judged by how well they respond to different system requirements changes.The evaluation is performed on a set of problems with a controlled set of different characteristics.
Index Terms —maintainability, extensibility, heuristics, search, scheduling, scenarios
✦
1 INTRODUCTION
A RCHITECTURE design choices in software-basedsystems development can have a significant effect
on the quality attributes of the system such as perfor-mance and maintainability [1]. Good software architec-ture design involves modelling it from more than oneview. The focus of this paper is the mapping of softwaretasks to a hardware platform for real-time systems whichis associated with the transition from the process view tothe physical / deployment view [2] of an architecture. Theseviews are further explained by figure 1. The process viewdefines the tasks and the dependencies between them. Itis only when a mapping of this software to the physicalhardware platform is chosen that the non-functionalproperties of the system become fully apparent [2]. Inparticular, software modules which are independent ofeach other in the logical view can still have timinginteractions between corresponding run-time tasks. Witha system using a system wide shared message bus, as infigure 1, there is the potential for small changes to atasks’ schedule to ripple throughout the system.
It is desirable for each iteration of a design to beclosely related to the previous one on the assumptionthat the original design was not fundamentally flawed.Reasons for this include:
• maintaining documentation and the understandingengineers have of the system [3]
• containing changes may lower the cost of testingand re-certification of safety critical systems [4],which “dwarfs hardware costs” [5]
• changes to an interface between third-party compo-nents at the time of integration is expensive [6]
Along with understandability and testability, the mod-
• Paul Emberson and Iain Bate are with the Department of ComputerScience, University of York, York, YO10 5DD, U.K.E-mail: {paul.emberson,iain.bate}@cs.york.ac.uk
Manuscript received September 01, 2008; revised ...
ifiability of an architecture is one of the key qualitiesfor determining architecture maintainability [7]. Muchof the work on creating flexible software architectureshas focused on scenario-based analysis methods [8], [9].These methods rely on applying potential requirementschanges onto an existing architecture model and viewingthe responses of metrics for qualities such as perfor-mance or dependability. Modifiability is the most preva-lent architectural quality targeted for evaluation andimprovement by software architecture analysis methods.Even when modifiability cannot be measured directly,the effect of a change scenario on other measurablequalities gives an indication of how difficult it will beto make the change. Therefore, a combination of changescenarios and one or more quality metrics, which aren’ta direct measure of flexibility, can give insights into themodifiability of the architecture.
Within real-time system design, the assignment oftasks to processing units and the construction of a suit-able schedule is called a task allocation problem. It hasbeen identified as one of the most important architec-tural problems in automotive software engineering [10].The problem also involves assigning messages to com-munication buses with tasks and messages collectivelyreferred to as schedulable objects. There are well definedquantitative real-time system models which can calculatea response when a scenario is applied to a possiblesolution. This makes task allocation a good target forautomated scenario-based analysis. Depending on therequirements of the system, the response metrics usedcould include missed deadlines, jitter, volume of net-work traffic, and load balancing between processors.
The direction of recent research in task allocation hasbeen towards finding solutions which not only meethard timing requirements but are also of a high qualitywith respect to other attributes such as reliability [11],[12] and flexibility [13]. This work addresses flexibility

2 IEEE TRANSACTIONS ON SOFTWARE ENGINEERING, VOL. X, NO. Y, MONTH YEAR
(a) Process view
(b) Deployment view
Fig. 1. Process and deployment architecture views
by applying scenarios to solutions within a search-basedtask allocation framework. The emphasis on improving adiverse range of non-functional requirements with auto-mated optimisation and, in particular, search techniquescoincides with other work in the field of Search BasedSoftware Engineering (SBSE) [14]. Harman has statedthat the robustness of solutions is an important area offuture research in SBSE [15]. The work in this paperaddresses this concern for the task allocation problem.The algorithms also have the potential to be applied toother scheduling problems in the field of SBSE such assoftware project management [16].
There are three main contributions made in this paper.The first is a parallel simulated annealing algorithmwhich searches for solutions for both the current problemto be solved and one or more change scenarios. In par-ticular, it has been designed to remove platform depen-dent variance and repeatability issues which can causeproblems when doing experimentation whilst still takingadvantage of modern multicore platforms. The secondcontribution is an investigation into how different stylesof scenarios enhance the flexibility of problems with dif-fering characteristics. This demonstrates the additionalinsight that search-based software engineering combined
with systematic experimental method can bring to aproblem. It is important not to give the impression thatan algorithm can be taken off the shelf and provide totalautomation without any additional effort. The algorithmwill require configuration of its parameters and mustbe considered within the wider software engineeringprocess. The third contribution of this work is the processused to configure the algorithm, its use in the initialdevelopment of a flexible baseline solution and then howit can evolve this solution during maintenance.
The structure of the remainder of this paper is asfollows. Section 2 presents related work in the areas ofscenario-based architecture evaluation and real-time taskallocation. Section 3 describes the step-by-step processused to configure the algorithm and generate solutions atdifferent stages of the software engineering process. Thesections following this carry out this process. Section 4describes how the set of test cases was generated andhow the search algorithms were configured to meet thevarying demands of different problems. Section 5 pro-poses and evaluates an algorithm for finding solutionsin the vicinity of an existing solution. Section 6 utilisesresults from sections 4 and 5 in constructing the algo-rithm for generating flexible solutions with scenarios.Conclusions are given in section 7.
2 RELATED WORK
Scenarios form a core part of software architecture analy-sis. An early method is the Scenario Architecture Analy-sis Method (SAAM) [8] which measures modifiability bycounting how many and by how much components areaffected by a scenario. An equivalent metric is used insection 6 for assessing how flexible a generated solutionis. A survey of architecture analysis methods [17] showsthat a large proportion of the work concentrates on thesocial and organisational issues involved in generatingscenarios and undertaking architecture analysis as partof a wider development process. These issues are alsorelevant to the generation of scenarios for automatedmethods but are outside the scope of this paper.
Task allocation is an NP-hard problem and muchresearch has looked at how to solve increasingly largeand more complex problems using a variety of opti-misation techniques. Some examples include simulatedannealing [11], [18], [19], solving via conversion to a SATproblem [20], branch and bound [21], particle swarmoptimisation [12] and constraint programming [22]. Di-rect performance comparisons between these works isdifficult since the underlying system model and schedu-lability analysis varies between studies.
Whilst conversion to another class of problem suchas SAT opens up the use of many high-quality off theshelf optimisation tools, it also requires the extra stepof converting the objective function and constraints toa suitable form. For the purposes of this work, meta-heuristic search has the advantage of being able to buildimplementations of timing analysis and other quality

EMBERSON et al.: STRESSING SEARCH WITH SCENARIOS FOR FLEXIBLE SOLUTIONS TO REAL-TIME TASK ALLOCATION PROBLEMS 3
metrics into the objective function with little additionalwork. The chosen algorithm for TOAST (Task Orderingand Allocation Search Tool), described in sections 4 to 6,is based upon simulated annealing [23] which has aproven track record in task allocation.
In all previous work on task allocation, there has beenlittle attention paid to the affects of different problemcharacteristics, such as the ratio of tasks to processors,on the performance of optimisation methods and theflexibility of the solutions generated. Most experimentsare limited to variations in problem size based on thenumber of tasks and processors [11]. Yin et al. [12]acknowledge that the level of inter-communication be-tween tasks, referred to as task interaction density, is animportant factor. Extrapolation of results outside of theclass of problems experimented upon without a goodunderstanding of their characteristics is an issue notjust within the field of task allocation or even SBSE butthroughout many areas of experimental research withheuristics [24], [25]. This work pays close attention tothese criticisms.
An alternative to scenario-based analysis for improv-ing flexibility at the architecture level is sensitivity anal-ysis. For real-time systems, the limits of the attributesof the system such as task execution time are foundusing binary search. Racu et al. [6] also take an SBSEapproach by combining sensitivity analysis with a multi-objective search optimisation framework. They currentlyonly adjust priority levels of tasks and assume the allo-cation is already defined. Each sensitivity calculation iseffectively evaluating a scenario for particular values ofobject attributes several times over and is computation-ally expensive. Scenario-based analysis selects a smallernumber of possible changes. The overall computationalcost of sensitivity analysis will depend on whether it isapplied to each individual object or for larger groupsof objects. The TOAST tool includes a coarse grainedsensitivity analysis across all objects but primarily asa heuristic to guide the search towards schedulablesolutions rather than as an aid to flexibility.
This work is an evolution of previous work by thesame authors. Initial work [13] with the same aims ofimproving flexibility in real-time system design used analgorithm that was inferior both in terms of performanceand solution quality. A new parallel simulated annealingalgorithm was presented in a paper on finding taskallocations for systems with multiple modes [26] whichhas a similar problem formulation to finding allocationsfor multiple scenarios. Further improvements to thealgorithm are introduced in this paper. Specifically, a sec-ond step which required running further searches basedon the solutions from each thread has been eliminatedby exchanging more information between threads whilstthey are running. Furthermore, a new synchronisationmechanism ensures repeatability of experiments andensures variations in results are not affected by the oper-ating system environment. Neither the process of config-uring the algorithm for different problem characteristics
nor the relationship between problem characteristics andflexibility has been investigated in any of the authors’previous work.
3 EXPERIMENTAL PROCESS
The technical aspects of this paper are described in threeparts:
1) the creation of problems and configuration of thesearch algorithm to solve them,
2) an evaluation of an algorithm for minimising dif-ferences between previous and new solutions,
3) the creation of an algorithm for generating moreflexible solutions through the use of scenarios.
These are described over the course of sections 4, 5 and 6respectively. In order to facilitate understanding, this sec-tion gives a broad overview of the process and explainssome key concepts and terminology used throughout therest of this paper.
3.1 Terminology
The meanings of some key phrases as used in the contextof this paper are given below.
A schedulable object is a task or a message. A scheduleris a processor or communications bus.
A system specification is a set of schedulable objects andschedulers along with their attributes such as task worstcase execution time, message size and communicationbus speeds.
A (system) configuration is a table of assignments ofschedulable objects to schedulers as well as an assign-ment of priorities to schedulable objects which definestheir schedule.
A task allocation problem is the problem of finding aconfiguration for a given system specification in orderto meet some criteria. A solution to a task allocationproblem is any such configuration.
A scenario is a system specification for a hypotheticalsituation which would change the system requirements.
A system upgrade or actual specification change is achange to the original system specification which isactually needed at this point in time — unlike a scenario,which is a prediction of changes in the future.
A baseline configuration is a configuration created atsome time in the past. This is usually mentioned in thecontext of a system upgrade to emphasise the differencebetween the new configuration which is needed to meetthe system upgrade specification and the configurationalready in existence.
A problem characteristic is any quantifiable measure-ment that gives information about a problem specifica-tion. Examples include the number of tasks and the ratioof messages to tasks.
A problem class is a group of problems related by thevalues of one or more problem characteristics.
A cost function is a term for an objective function usedin a problem where the aim is to minimise the value ofthe objective function, i.e. to minimise the cost value.

4 IEEE TRANSACTIONS ON SOFTWARE ENGINEERING, VOL. X, NO. Y, MONTH YEAR
In the case of the TOAST tool used for the evaluationsin this paper, the cost is calculated as a weighted sumof the values of other functions. For example, the pro-portion of missed deadlines and object sensitivity. Eachof these functions is a cost function component or costcomponent. The weight associated with each cost functioncomponent is a cost component weighting.
An algorithm parameter is any parameter which affectsthe behaviour of the search algorithm other than costcomponent weightings. For example, the cooling rateused in simulated annealing.
Parameter tuning is the activity of finding algorithmparameter values and cost component weightings whichare good at solving at problems in a particular class.
3.2 Process
There is an important distinction between the experi-mental process used to decide whether, for example,one scenario causes the search to generate more flexiblesolutions than another scenario and the practical steps anengineer would use to generate a flexible baseline con-figuration. With the former, experimental rigour needs tobe emphasised though sensible compromises sometimesneed to be made due to limitations in available computeresources and time. For a practitioner, this rigour is lessimportant than achieving acceptable results. However,tuning of the algorithm at each stage of the process asset out below is important in generating high quality so-lutions. A process which includes these additional stepsshould be more robust to differences between problemswhen compared to a process which only involves therunning of the algorithm.
The key to any good experimental method is control-ling sources of unwanted variance [27] so that they donot mask or distort the effect caused by the factor of in-terest. For experiments with heuristic search algorithmswhich have a deterministic objective function, variancein the response can be caused by any of the following:
1) differences in algorithm parameters and cost com-ponent weightings or use of a different algorithm
2) differences in the environment in which the algo-rithm is run which can affect decisions within thealgorithm or the response it gives
3) seed values used to initialise pseudo-random num-ber generators
4) solving different problems
Two types of experiment are performed in this paper.The first are parameter tuning experiments where valuesfor the first type of factor are chosen and the factorsneed to be controlled. The other investigates the effectsof different problems and scenarios on the ability togenerate a flexible baseline. In this situation, the partic-ular problems are chosen and the first three sources ofvariance need to be controlled.
The algorithm and its parameters are predeterminedby source code and input data and so are easy to control.Environmental differences which affect response include:
• the interaction with other processes and / or pro-cessor speeds if the response is time dependent
• scheduling decisions made by the operating sys-tem which can affect asynchronous parallel algo-rithms [28] especially when running on a hetero-geneous platform
In this work both of these issues are avoided; responsesare based on the number of cost function evaluations andthe parallel algorithm in section 6 uses a synchronouscommunications mechanism to ensure repeatability.
The effect of using different random number seedsis a source of nuisance variance [27] which cannot beeliminated but can be managed with the use of repeti-tions. Previous work has suggested that finding goodalgorithm parameters which reduce the mean searchrunning time can also reduce its variance [29]. This iscorroborated by results in section 4.
Managing variance due to different problems is anexercise in deciding which characteristics should be usedto classify problems in the context of the selected algo-rithm and its parameters. If the characteristics used toclassify problems are not sufficiently specific then therewill be too much variance between results for problemsin the same class for the classification to be useful.This has to be balanced with the reduced practicality ofusing problem classes which are too small [25]. In thiswork, four problem characteristics are considered and,in section 4.4, all possible pairs are tested to see whichclassification has the biggest impact on performance.
A step by step overview to clarify the experimentalprocess is now given. The section of this paper whichcovers each step is given in parentheses.
1) Select classes of problem to be studied and generateexample problems. (Section 4.2)
2) Tune algorithm parameters and cost componentweightings for different classes of problem. Oncethe search is configured, generate three solutionsfor each problem. These will act as a control forevaluating increases in flexibility when scenariosare used. (Section 4.4)
3) Generate changes to problem specifications whichwill act as system upgrades to test flexibility. (Sec-tion 5.2.1)
4) Evaluation of algorithms and parameters for min-imising change. Using baselines generated in step2, try to find solutions to system upgrades gen-erated in step 3 which have as few differences aspossible from the baselines. (Section 5.2)
5) Generate scenarios for evaluation. (Section 6.2)6) Using method developed in step 4, evaluate the
baselines generated with scenarios with each otherand also with the baselines generated in step 2. Ifthe requirements of an upgrade specification canbe met with fewer changes, the baseline is said tobe more flexible. (Section 6.3)

EMBERSON et al.: STRESSING SEARCH WITH SCENARIOS FOR FLEXIBLE SOLUTIONS TO REAL-TIME TASK ALLOCATION PROBLEMS 5
4 PROBLEM SELECTION
4.1 System Model
The real-time system model is described here in suffi-cient detail to comprehend the issues surrounding thegeneration of example task allocation problems. For amore in depth description readers are referred to thework on distributed scheduling analysis by Palencia andHarbour [30] which is used to calculate response times.
Tasks send messages to one another which createsdependencies between tasks. The structure of these de-pendencies take the form of directed acyclic graphs withtasks represented as nodes and messages representedas edges. Each independent task graph is a transaction.Within the system specification, each task is assigned aworst case execution time (WCET) and a period. Theutilisation of a task is its WCET divided by its period.The total system utilisation is the sum of all task utilisa-tions. Each task also has a deadline. Timing requirementsare specified in terms of calculated response times beingless than or equal to deadlines. In this work, deadlinesare set equal to periods. Messages have a maximum sizeattribute. When a message is assigned to a communica-tions bus, a worst case communication time is calculatedbased on the speed and latency characteristics of the bus.All messages and tasks within the same transaction havethe same period.
The hardware model consists of a number of pro-cessors connected together with communications buses.A bus is attached to each processor for messages sentbetween tasks on the same processor. The attributes ofthese buses can be set to simulate what in reality maybe an alternative mechanism such as shared memorycommunication. As discussed in section 3 the aim isto understand the effects of a small number of charac-teristics and control others. For this reason rather thantechnical ones, the example hardware platform is fairlyconservative. All processors are connected together witha single broadcast network and are homogeneous inthe sense that a task’s WCET does not depend on theprocessor it is allocated to.
4.2 Test Case Generation
A test case generator tool is used to generate systemspecifications whose characteristics are dependent uponparameters given to the tool. The number of tasks is usedas a unit of size for the problem. Where relevant, otherparameters are specified as proportions of the number oftasks. The number of processors is calculated from thetasks per processor parameter. The number of messagessent between tasks is set by the messages per taskparameter. Tasks are randomly grouped into transactionsaccording to the tasks per transaction parameter.
Periods for each transaction are chosen from a givenrange such that different orders of magnitude are sam-pled from with equal probability as suggested by Daviset al. [31]. They are rounded to a whole value with agranularity of 1/10 of the lower limit of the period range.
TABLE 1Varied problem characteristics
ProblemSpecification
Utilisationper proc.
Tasksper proc.
Messagesper task
Max period/ min period
01 40 5 1 10 (5.90)02 65 5 1 10 (5.00)03 40 8 1 10 (2.3)04 65 8 1 10 (6.4)05 40 5 2 10 (5.9)06 65 5 2 10 (8.6)07 40 8 2 10 (9.6)08 65 8 2 10 (6.0)09 40 5 1 1000 (30.8)10 65 5 1 1000 (62.0)11 40 8 1 1000 (39.3)12 65 8 1 1000 (81.3)13 40 5 2 1000 (110.6)14 65 5 2 1000 (367.8)15 40 8 2 1000 (14.9)16 65 8 2 1000 (127.2)
TABLE 2Fixed problem characteristics
Characteristic Fixed Value
number of tasks 40
processor connectivity 1 (single broadcast network)
network bandwidth 2048
network latency 0
message size 30000
tasks per transaction25% ∗ 40 = 10 tasks (implies4 transactions)
transaction length 40% ∗ 10 = 4
WCETs are set so that the overall utilisation per pro-cessor meets a value set by a parameter to the problemgeneration tool and utilisation is distributed evenly be-tween transactions.
The final stage of system generation is to connecttasks together with messages to form the task graphsfor each transaction. A parameter, which is specified asa percentage as the number of tasks in a transaction,decides the average transaction length defined as thelongest path through the task graph. Another parametersets the ratio of messages to tasks.
For the experiments conducted in this paper, 16 prob-lems were generated using all combinations of fourproblem characteristics set at two different levels. Thesecharacteristics and their values are shown in table 1. Thecharacteristic shown in the final column is the upperlimit of the range of periods divided by the lower limit.The ranges used were [1000, 10000] and [1000, 1000000].The values given in parentheses is the actual maximumperiod value divided by the minimum period within thatparticular test case. The levels of utilisation leave scopefor system upgrades which increase utilisation in laterexperiments.
Table 2 gives a list of problem characteristics which areset at fixed values for all problems. The size of problem

6 IEEE TRANSACTIONS ON SOFTWARE ENGINEERING, VOL. X, NO. Y, MONTH YEAR
TABLE 3Number of unscheduled objects with random search
Problem Tasks Mess. Total Problem Tasks Mess. Total
01 5 0 5 09 2 0 202 17 5 22 10 9 0 903 1 0 1 11 4 0 404 9 0 9 12 8 1 905 5 2 7 13 10 10 2006 18 13 31 14 16 19 3507 6 6 12 15 10 2 1208 13 9 22 16 15 8 23
in terms of the number of tasks, messages and processorsis similar to that used by Zheng et al. in an evaluationof a subsystem of an experimental vehicle [32].
4.3 Search Algorithm
4.3.1 Random SearchFor a quick assessment of problem complexities, a ran-dom search was performed. Each run of the searchtried 400000 random solutions and stored the solutionwith the lowest number objects not scheduled. For eachproblem, the best result from three repetitions is shownin table 3. No solution met all constraints but the numberof unscheduled objects gives a crude estimate of prob-lem difficulty. The results suggest that problems withhigher utilisation and more messages per task are morechallenging.
4.3.2 Simulated AnnealingTo find solutions which meet all requirements, a guidedsearch is needed. The algorithm used is simulated an-nealing [23]. Pseudo-code for this algorithm is listed infigure 2. At each iteration step, ssize configurations aresampled from the neighbourhood. The configuration inthe sample with the lowest cost is then put forwardto the simulated annealing acceptance criteria. The al-gorithm has three configurable algorithm parameters:the initial temperature, sample size and the numberof inner loop iterations. The cooling factor is fixed at0.99 but the rate of cooling can be changed via theinner loop iterations parameter. The stopping conditionfunction depends on the needs of each experiment. Theneighbourhood of a solution is the union of the set ofall single task and message reallocations and the set ofpriority reorderings which change the priority of a singletask or message to a new slot position.
The other parameters which need to be tuned are thecost component weightings. The list of cost componentfunctions are given in table 4. The full formulae anddetails of these functions are given in previous work [33].The purpose of each is now briefly described.
• g1 is a function which gives the proportion of dead-lines missed. When this reaches 0, it shows that thesolution meets all timing requirements.
• g2 penalises tasks which need to communicate butare assigned to separate clusters of processors. For
input: init ; /* the initial solution */input: ssize ; /* sample size parameter */input: inittemp ; /* initial temperature */input: maxinner ; /* inner loop iterations */input: stop ; /* stopping condition function */begin
curconf = init; bestconf = init;curcost = costfn(curconf) ;bestcost = curcost;repeat
i = 0 ;repeat
(newconf, newcost) = samplenei(curconf, ssize) ;if newcost < bestcost then
bestconf = newconf; bestcost = newcost;endif randuniform() < exp(-(newcost - curcost)/ t) then
curconf = newconf; curcost = newcost;endi = i + 1 ;
until i == maxinner or stop() ;t = t * 0.99 ;
until stop() ;end
Fig. 2. Simulated annealing algorithm
all the test problems in this work, all processors areinterconnected so it will always evaluate to 0 but isincluded for consistency with previous work.
• g3 penalises any task or message which is allocatedin such a way so as not to be able to receive its inputor send its output. This could happen if a message isassigned to the intra-processor bus for the processorthe source task is allocated to but the destinationtask is on a different processor.
• g4 checks for any schedulable objects involved in thesame transaction but whose priority ordering doesnot match their precedence ordering.
• g5 performs sensitivity analysis on the execu-tion/communication times of tasks and messages.
• g6 measures the variance in utilisation between pro-cessors. Reducing this improves the balance of loadbetween processors.
• g7 is a metric for whether schedulable objects in-volved in the same transaction are allocated tothe same schedulers. This reduces communicationoverheads.
• g8 has a similar purpose as g7 but concentrates onpairs of tasks which are adjacent to each other in atransaction.
• g9 adds a penalty for any schedulers which are morethan 100% utilised since no feasible solution caninclude such a configuration.
All cost function components produce a value in therange [0, 1]. The weighted sum of these component val-ues is normalised using the sum of the weights so that allcost function values are also in the range [0, 1]. This is im-portant in reducing interactions between weightings andalgorithm parameters which makes parameter settingeasier. In particular, the temperature based acceptancecriteria which uses the absolute change in cost valuewould not be affected if all cost component weightings

EMBERSON et al.: STRESSING SEARCH WITH SCENARIOS FOR FLEXIBLE SOLUTIONS TO REAL-TIME TASK ALLOCATION PROBLEMS 7
TABLE 4Cost function components
Function(as in [33])
Name
g1 Missed Deadlinesg2 Unreachable Tasksg3 Unconnected input / outputg4 Incompatible Priority/Precedence Orderg5 All object sensitivityg6 Processor load balanceg7 Transaction object groupingg8 Separated communicating tasksg9 Over utilised schedulers
were multiplied through by a constant.These component functions are designed to act as
good heuristics for particular classes of problem. Forexample, grouping objects in the same transaction to-gether will generally create a good solution. However,for situations where this is not possible, weighting thiscomponent too highly will severely reduce performance.
4.4 Parameter Tuning
The cost component weightings and search algorithmparameters must be tuned to work with the set of testcase problems described in section 4.2. The reasons fortuning parameters is twofold. Firstly, it will improve per-formance so experiments can be run in less time. Moreimportantly, optimising the search algorithm accordingto different problem characteristics should reduce thevariance between runs and reduce the likelihood of thealgorithm failing to find a solution when one exists.
In this work, the cost component weightings andsearch algorithm parameters are tuned separately. Thismakes the total number of experiments, which has anexponential relationship with the number of parame-ters, more manageable. It is a potentially sub-optimalapproach since there is no guarantee that the two pa-rameter sets are independent. The aim, however, is tofind a set of parameters which performs well across theproblem test set and optimality is not a requirement.
The method used for tuning parameters is the same asdescribed by Poulding et al. [29] who also gives furtherreferences on experimental methodology. The methodcan be condensed into three stages:
1) run experiments with different input levels,2) use regression techniques to create a model which
maps the input levels to the response variable,3) use optimisation to find the inputs which minimise
the response according to the generated model.
The model of the algorithm behaviour is an approxi-mation based on interpolating between parameter levelsused in experiments. It can also be inaccurate by over-fitting to effects caused by sources of nuisance variance.Nevertheless, it will systematically and efficiently find agood design point in the parameter space [29] to whichsmall adjustments can be made if necessary.
4.4.1 Tuning Component Weightings
Since the cost function is normalised, they can sum toany constant value which is chosen arbitrarily at 30000for these experiments. A suitable experimental designwhere relative proportions rather than absolute valuesneed to be found is a mixture model simplex latticedesign [29]. Using this design for each of the 9 factorsat 3 levels requires 165 runs per problem. To cover all16 problems with 3 repetitions for each combination ofweightings requires 7920 runs. Within each repetitionof the experiment each factor level will be assessed 55times, counteracting sources of nuisance variance suchas different random seed values. With each experimenthaving the potential to run for several hours if noacceptable solution is found, the White Rose Grid atYork [34] was utilised connected to other clusters ofcomputers using BOINC [35].
The stopping condition for these experiments waswhen all timing requirements were met (g1 = 0) orthe maximum number of evaluations, set to 300000, wasreached. This value, known as a censoring level, is chosento balance having a high number of successful runs,which improves the accuracy of the fitted model, andthe time required to complete. The search algorithmparameters were set to values found by trial-and-errorin preliminary work. Initial temperature was set to 0.003,sample size to 1 and max inner loop iterations to 5000.The response variable was the number of evaluationsrecorded when the search stopped. A model was createdusing survival regression based techniques which takeaccount of runs which terminate without finding a validsolution. Inputs which minimised the value of this modelwere found using LINDO Optimization [36] software.
Since the aim is to take account of problem charac-teristics, as well as generating a model to best fit dataacross all 16 problems, the problems were classified indifferent ways using all possible combinations of two ofthe four problem characteristics. For each of these sixclassification schemes, a model was fitted to each of thefour groupings within it and minimised. The mean ofthe minimal response estimated by the model was usedas a guide to the quality of the classification scheme.The classification scheme which gave the best responsewas to form problem groups by their utilisation perprocessor and tasks per processor characteristics. Boththe weightings found by fitting a model over all 16problems and those found by classifying the problemswere tested by running the search algorithm with the ap-propriate weightings with 3 repetitions on each problem.For these 48 runs, the maximum number of evaluationswas increased to 400000 to reduce failed runs and thesearch algorithm parameters were left as before.
The results of these tests are shown in table 5. For thesingle set of weightings 10 runs failed to find a solutionwithin the allowed number of evaluations so a precisevalue for the mean cannot be calculated. The secondline of the table shows that using separate weightings
8 IEEE TRANSACTIONS ON SOFTWARE ENGINEERING, VOL. X, NO. Y, MONTH YEAR
TABLE 5Tuned parameter tests
ParametersMeanEvaluations
Failures
Single weightings set > 100945 10
Classified weightings 51137 0
As above with specificweights for prob. 06, prob. 14
36416 0
TABLE 6Problem dependent component weightings
Problem(s) g1 g2 g3 g4 g5 g6 g7 g8 g9
01,05,09,13 16434 3 3 4173 3 3 9375 3 302,10 14578 3 3 2840 5199 3335 3 4036 303,07,11,15 16264 3 3 5030 3 3 8688 3 304,08,12,16 16413 3 3 4630 3 3 8939 3 306 12000 3 7364 3 4076 2605 3 2446 150014 17773 3 3000 3 2513 3 3 3804 2898
for different problem classes substantially improved theperformance of the algorithm.
These tests showed that two problems, 06 and 14, wereneeding an order of magnitude more evaluations to findsolutions for. These problems both have a combinationof high processor utilisation, low number of tasks perprocessor and a high message to task ratio. The fact thatproblems with only two of these characteristics appearto be substantially easier is an example of the insightthat can be gained from systematic experimentation withsearch algorithms. After reviewing the data used to fitthe models for these two problems it was found thatfrom the 990 runs covering these two problems, only1 run found a solution within the censoring level. Toget a more varied response for different weightings, aconstrained mixture model was used so that only inputswhere the weighting for missed deadlines was greaterthan 12000 were considered. This experiment had 271successful runs from the 990. The final row of table 5shows the results from this experiment and that themean number of evaluations was further reduced.
The final table of weightings to be used for futureexperiments is given in table 6. A look at this table showsthat the results are sensible. Component weightings forcomponent g1, upon which a stopping criterion is based,has consistently high values and weightings for g2,which was noted in section 4.3.2 not to be useful forthese problems, has the lowest permitted value.
4.4.2 Tuning Algorithm Parameters
Once component weights had been decided, the othersearch algorithm parameters could be tuned. A full fac-torial experimental design was performed for the threeparameters at 3 levels for all problems, again with 3repetitions. This lead to a further 33
∗ 16 ∗ 3 = 1296experimental runs. The results of fitting and optimisingthe model gave an initial temperature of 0.001, with 500
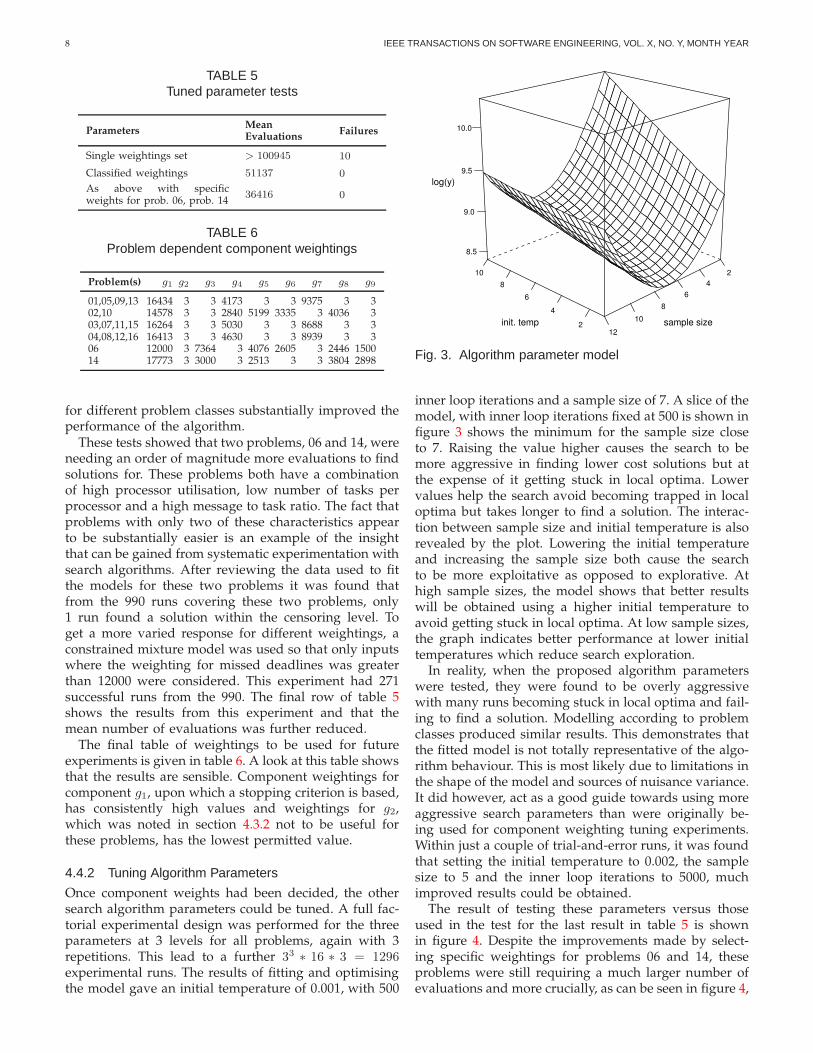
Fig. 3. Algorithm parameter model
inner loop iterations and a sample size of 7. A slice of themodel, with inner loop iterations fixed at 500 is shown infigure 3 shows the minimum for the sample size closeto 7. Raising the value higher causes the search to bemore aggressive in finding lower cost solutions but atthe expense of it getting stuck in local optima. Lowervalues help the search avoid becoming trapped in localoptima but takes longer to find a solution. The interac-tion between sample size and initial temperature is alsorevealed by the plot. Lowering the initial temperatureand increasing the sample size both cause the searchto be more exploitative as opposed to explorative. Athigh sample sizes, the model shows that better resultswill be obtained using a higher initial temperature toavoid getting stuck in local optima. At low sample sizes,the graph indicates better performance at lower initialtemperatures which reduce search exploration.
In reality, when the proposed algorithm parameterswere tested, they were found to be overly aggressivewith many runs becoming stuck in local optima and fail-ing to find a solution. Modelling according to problemclasses produced similar results. This demonstrates thatthe fitted model is not totally representative of the algo-rithm behaviour. This is most likely due to limitations inthe shape of the model and sources of nuisance variance.It did however, act as a good guide towards using moreaggressive search parameters than were originally be-ing used for component weighting tuning experiments.Within just a couple of trial-and-error runs, it was foundthat setting the initial temperature to 0.002, the samplesize to 5 and the inner loop iterations to 5000, muchimproved results could be obtained.
The result of testing these parameters versus thoseused in the test for the last result in table 5 is shownin figure 4. Despite the improvements made by select-ing specific weightings for problems 06 and 14, theseproblems were still requiring a much larger number ofevaluations and more crucially, as can be seen in figure 4,

EMBERSON et al.: STRESSING SEARCH WITH SCENARIOS FOR FLEXIBLE SOLUTIONS TO REAL-TIME TASK ALLOCATION PROBLEMS 9
Fig. 4. Original vs tuned algorithm parameters
a much larger degree of variance between repetitions.By tuning the search algorithm parameters, both thenumber of evaluations and variance between repetitionswas dramatically reduced. The only compromise was anincrease in variance between repetitions for problem 15though the mean number of evaluations for this prob-lem still decreased. The mean number of evaluationsrequired over all 48 test runs was reduced by over 73%from 36416 to 9567.
5 MINIMISING CHANGES TO SOLUTIONS
This section presents the algorithm used for findinga solution that is similar to a baseline yet still meetsthe needs of an upgrade specification. The flexibilityof a particular baseline will be measured in terms ofthe number of modifications required to transform thebaseline into the solution found by this algorithm fordifferent upgrade specifications.
5.1 Configuration Difference Cost Components
Two additional cost function components are introducedto penalise solutions which are further away from a base-line. They use metrics for measuring allocation changesand priority changes, for which full formulae can befound in previous work [26]. Each one takes two con-figurations as inputs and outputs a value indicating thedifference between them.
• gtac is the component used to measure task alloca-tion changes. It is a measure of the proportion oftasks which are not allocated to same processor inboth configurations.
• gtpc is the component used to measure task prioritychanges. It only has non-zero values for tasks whichare allocated to the same processor in both con-figurations since comparing priorities on differentprocessors has no meaning. Only changes to orderrather than absolute priority value are penalisedsince a relabelling of priorities which maintain thesame order will have no effect on the schedule.
These two components can be combined into an over-all measure of change using a normalised weighted sumsuch as that given below.
gmod =10 · gtac + gtpc
11(1)
The cost a priority change incurs versus the cost ofan allocation change will depend on the motivationfor reducing change and how these costs relate to realworld financial costs. Since a priority change value fora particular task is non-zero only if its allocation is thesame, allocation changes should have a higher weightingelse the search may favour different allocations to reducethe priority change metric. The 10 to 1 ratio used aboveis suitable to demonstrate the use of this function.
5.1.1 Combining With Timing Constraint ComponentsThe cost function that was used throughout section 4 isrelabelled as gsched and then this value is combined withthe result of gmod, defined in equation (1), to producean overall cost value. Grouping components together toform these higher level components simplifies balancingthe effects of components which guide the search to-wards solutions which meet timing constraints and thosecomponents which penalise changes.
Influenced by the importance of component g1 in find-ing solutions which meet all schedulability constraints,the following equation was proposed to balance the twosets of components.
f =wschedgsched + (1 − g1)
bgmod
wsched + (1 − g1)b(2)
where wsched changes the balance between meetingschedulability requirements and the need to reduce thenumber of modifications. As the proportion of objectswith missed deadlines, g1, decreases, more emphasis isput on minimising change. The value of b alters the biastowards the constraints.
5.2 Algorithm Evaluation
Experiments were conducted to evaluate the perfor-mance of a search algorithm using (2) as a cost function.The steps taken were:
1) Generate upgrade specifications to use as a test set2) Ensure existing parameters are suitable for finding
solutions to upgrade specifications and a solutioncan be found for each one
3) Evaluate values for the parameters wsched and b inequation (2) for their ability to find solutions withminimal changes from a baseline.
5.2.1 Upgrade Specification Generation
The upgrades which were generated were limited to util-isation increases where the increase was spread evenlybetween transactions. The levels of utilisation increaseare given in table 7. Initially the utilisation increasesused were the same for all problems. However, when

10 IEEE TRANSACTIONS ON SOFTWARE ENGINEERING, VOL. X, NO. Y, MONTH YEAR
TABLE 7Utilisation increase levels
UtilisationIncrease Level
Actual Utilisation Increase
Low StartingUtilisation
High StartingUtilisation
1 4% 2%2 8% 4%3 12% 6%4 16% 8%5 20% 10%
large utilisation increases were applied to some problemswhich already had a higher starting utilisation, it was notpossible to find solutions for the upgrade specifications.Therefore, smaller utilisation increases were made for theupgrade specifications associated with problems havinga higher initial utilisation as listed in table 1. For eachutilisation increase level and each problem, 3 separateupgrades were generated to be used for repetitions inlater experiments. There were 5 ∗ 16 ∗ 3 = 240 upgradespecifications generated in total.
5.2.2 Upgrade ValidationUpgrade specifications were checked to be feasible bysearching for a solution to each of them without regardfor any existing baseline. The cost component weightingsused were taken from the results for higher utilisationproblems in table 6. Given the additional challengeposed by the utilisation increases, the sample size wasreduced from 5 to 3 to allow the search to be more explo-rative. These weightings and parameters were successfulin solving all of the upgrade specifications.
As a reference for future experiments, the solutionsfound while checking the feasibility of upgrade specifica-tions in section 5.2.1 had a mean proportion of allocationchanges from their baselines of 0.842. Given that thereare be several valid solutions for each problem, this highvalue is not surprising.
5.2.3 Parameter EvaluationAn evaluation was performed for a range of values ofwsched with b = 0 and with b = 40. Experiments withb = 0 are labelled as “fixed” since the balance betweenschedulability constraints and minimising change be-tween solutions does not change throughout the courseof the search. Experiments with b = 40 are labelledas “adaptive”. The problem to be solved is to find avalue for wsched such that the solution which the searchproduces has as few modifications as possible but withall schedulability requirements met.
For all experiments where modifications from a base-line needed to be reduced, the search algorithm uses thebaseline as an initial solution. For the experiments in thissection, the solutions generated from the final set of testsdescribed in section 4.4 were used as baselines. Since theupgraded specifications have much in common with theoriginal problem specifications, the previous baseline is
TABLE 8Failures for different weighting levels
wsched Fixed (b = 0) Adaptive (b = 40)
2.5 36 255 14 1120 6 340 5 480 2 2200 2 2
Fig. 5. Comparison of methods for solved problems only
often a good partial solution with many schedulabilityconstraints already met. Rather than allow the search tobe over explorative, parameters were modified so thatit would perform a thorough search near the baseline.The sample size was maintained at 3 but the initialtemperature was dropped to 0.001. The stopping criteriawere set so that 300000 evaluations were performed orthe search stopped immediately if the initial solution metall schedulability requirements with 0 modifications.
The weightings used were the same as those in theinitial experiment which checked the solvability of theupgrade specifications but with one important change:the weighting for component g1 which penalises misseddeadlines was increased for the following reasons. Com-ponents g2, . . . , g9 are aimed at guiding the search to-wards a solution which meets all timing constraints(g1 = 0). However, even after all timing constraints aremet, they continue to be in tension with cost componentsfor minimising change making this objective harder toachieve. Since the search problem is made easier by us-ing a baseline configurations as starting point, the utilityof these guiding components is reduced. Increasing theweighting of g1 by a factor of 6 reduced their influenceby a suitable amount.
The number of times that a schedulable solution wasnot found for the fixed and adaptive weighting methodsare shown in table 8. There was a common subset of200 problems solved in every experiment. A comparisonof the number of allocation changes required for eachmethod applied to this subset is shown in figure 5. This

EMBERSON et al.: STRESSING SEARCH WITH SCENARIOS FOR FLEXIBLE SOLUTIONS TO REAL-TIME TASK ALLOCATION PROBLEMS 11
Fig. 6. Comparison of methods including all problems
graph shows that at low to medium values of wsched
the performance is nearly identical. However, whenweightings are set to favour schedulability over changemore strongly, the fixed weighting method outperformsthe adaptive method. As the value of wsched increases,the number of changes increase. This is because, evenwhen solutions with fewer changes exist, if there is littlepull towards the original baseline, the search will tend tomove away until it finds a solution with all constraintsmet and become trapped in this good local optimum.
To be able to compare the flexibility of baselines infuture experiments the results from table 8 and fig-ure 5 need to be combined. This raises the questionof how to treat a failed result. It is known from thevalidation experiment described in section 5.2.2 that asolution exists for all upgrade specifications. However,each failure indicates that the search was not able tofind a solution near the given baseline. One possibilityis to substitute the result for the number of changesbetween the baseline and the solution found in theexperiment in section 5.2.2. However, this is a somewhatarbitrary data point and using these solutions comparedto an alternative set of solutions could have a significantimpact on results. Instead, a value of 1 which is theworst case proportion of allocation changes was used.The results of treating failures in this way are shown infigure 6. At low values of wsched, the adaptive methodperforms better since it appears to be more robust atfinding a schedulable solution with small amounts ofchange when weightings are set strongly in favour ofreducing modifications. However as the value of wsched
increases, it becomes easier for the search to find schedu-lable solutions and the fixed weighting method achievesbetter results.
Figure 6 shows that the best compromise of havingfew failed results and minimising change occurs whenwsched is 5. A more in depth analysis of the two methodswas performed for this value. From the 240 runs, afeasible solution was found by both methods 224 times.The number of allocation changes differed on only 17
TABLE 9Selected wsched values
Problem wsched Problem wsched
01 2.5 09 2.502 20 10 503 2.5 11 2.504 2.5 12 2.505 2.5 13 2.506 2.5 14 2007 5 15 2.508 2.5 16 2.5
of these 224 runs and the mean proportion of changeswas 0.0087 for both methods so there is little to separatethem on this basis. When failures are included, the meanproportion of allocation changes for the fixed methodis 0.0671 and 0.0563 for the adaptive method. A pairedWilcox exact test of these two sets of data returned a p-value was 0.370. This means that, when wsched is 5, thenull hypothesis that these two methods are equivalentcannot be rejected. As a comparison, for a wsched valueof 2.5, at which point both methods performed worse,the p-value from the equivalent test was 0.02244. Inthis situation, the null hypothesis can be rejected at the95% confidence level, so the evidence that the adaptivemethod provides benefit is stronger.
Finally, this raises the question of which values ofwsched to use and with which algorithm. Although exper-iments such as those run here can suggest values to beused as a starting point, it is recommended that valuesshould be determined on a case by case basis for realworld use since much will depend on the baseline. Sinceinvalid solutions will be rejected in this case, there is noreason not to use the simpler fixed weighting method.For the purposes of experimentation, however, whichtests many baselines over several problems, values werederived from these results which provided the best guideavailable. Some failed runs were expected in the resultsand so the adaptive method is preferred. Assuming thatbaselines generated using scenarios will be at least asflexible as one generated arbitrarily, low values of wsched
were favoured apart from for problems which had a highproportion of failures. The selected values are given intable 9. The results corresponding to these values usingthe adaptive method produce a mean allocation changevalue of 0.036. This is a further improvement on selectinga wsched value of 5 for all experiments which produceda mean of 0.0563 as previously stated.
6 SEARCHING WITH SCENARIOS
The search algorithm for generating baseline solutions,presented in section 6.1, is based on the assumption thatif a solution for a problem specification meets all ornearly all of the requirements of a scenario, the solutionproduced will be more flexible with respect to changesof a similar nature to the scenario. This assumption istested in sections 6.2 and 6.3.

12 IEEE TRANSACTIONS ON SOFTWARE ENGINEERING, VOL. X, NO. Y, MONTH YEAR
Fig. 7. Solution representation for multi-problem search
6.1 Flexible Baseline Algorithm
6.1.1 Requirements
The functional and non-functional requirements drivingthe design of the flexible baseline algorithm are moti-vated by the needs of the broader process outlined insection 3. These are:
1) to allow there to be differences between solutionsproduced for each scenario and the problem spec-ification and possibly for a valid solution to ascenario to never be found
2) to minimise the differences between the final solu-tions for each of the input specifications
3) to be scalable in terms of the additional computa-tion required for evaluating multiple scenarios
4) to produce repeatable results for a fixed set of in-puts (including a random number generator seed)
The first requirement was accomplished by assigningthe main problem specification and each of the sce-nario specifications to separate instances of the searchprocedure. This means that multiple solutions can beproduced and if one search fails to find a solution, otherswill not automatically fail. Minimisation of the differ-ences between solutions is performed by exchangingdetails of the best solution found so far between each in-stance of the search and trying to pull solutions towardseach other. The third requirement is attained by runningeach of these search procedures in parallel. This allowsthe algorithm to scale as long as the hardware plat-form provides sufficient processing cores for the numberof scenarios used. To be able to reproduce results, asynchronisation mechanism overlays the parallel searchthreads so that the sequence of interactions between thesearches does not depend on the time at which thoseinteractions occur. This mechanism is described later inthis section.
6.1.2 Representation And Cost Evaluation
Figure 7 shows the representation of the solution whichwould be held by three search threads, labelled A, Band C, solving three specifications, i.e. the main prob-lem specification and two scenarios. Each search thread
operates on a section of the solution specific to itsspecification. The other parts of the solution are filledwith the best solutions found by other search threadsfor their section of the solution. The global best solutionis a configuration made up of the best solutions foundfor each specification. This is the solution returned bythe search when all search threads have terminated.
The cost function used by each search thread operateson the whole of its locally stored solution, not just thepart pertaining to the specification it has been assignedto. Within each thread, the schedulability of each systemand differences between each section of the configurationare assessed using equation (2) from section 5.2 and thenthe mean is taken across all systems to obtain a finalcost value. By penalising solutions with more differencesbetween configurations each search is encouraged to findsolutions similar to the others.
As with work in the previous section the correctbalance of achieving schedulable solutions and minimis-ing change must be found. In this case the differencebetween solutions for each specification rather than thedifference to a fixed baseline is being reduced. The sce-narios act as a stress on the solution to the main problemand the emphasis on minimising change is less criticalthan before. With reference to equation (2), a value of 10was chosen for wsched parameter and b is set to 40 onceagain. On a small number of occasions, this emphasison obtaining similar solutions was too great to meet alltiming requirements of the main problem specificationand the baseline was regenerated with wsched set to 40.
6.1.3 Synchronisation MechanismThe strategy for synchronising threads is to exchangeinformation whenever a search thread finds a solutionbetter than the currently held global best solution. For agiven set of inputs, a search will find its first improve-ment on the initial solution after the same number ofevaluations on every run. Therefore, this can be used asa basis for creating a repeatable sequence of interactions.
When each search thread is first spawned from themain application, each thread locally stores a copy ofall its state variables which can affect the decisions ittakes. For simulated annealing, this includes the currenttemperature and inner loop count. In order to achieverepeatability, the state of the pseudo-random numbergenerator must also be controlled. The implementationin TOAST uses a separate instance of the MersenneTwister [37] in each thread. These are seeded by the mainapplication when each thread is initialised.
The steps taken to synchronise the searches are bestexplained by way of the example shown in figure 8. Atthe top of the diagram, the searches have just passeda synchronisation point, which could be the start ofthe search. The next synchronisation point is based onwhich search finds a solution better than the globalbest solution in the fewest evaluations since the lastsynchronisation point. If more than one search finds abetter solution after the same number of evaluations,

EMBERSON et al.: STRESSING SEARCH WITH SCENARIOS FOR FLEXIBLE SOLUTIONS TO REAL-TIME TASK ALLOCATION PROBLEMS 13
Fig. 8. Synchronisation mechanism
then the one with the lower cost is preferred. After this,ties are broken based on a deterministic ordering of thesearch threads. Figure 8 shows the following steps.
1) After 10 seconds, search A finds a new best solutionand sets a global data flag requesting synchronisa-tion. It now waits for other searches to reach thesame number of evaluations.
2) Just after 10 seconds searches B and C read thissynchronisation request. Search B hasn’t performedenough evaluations and continues. Search C is pastthe synchronisation point so stops and waits.
3) After 20 seconds, search B still hasn’t reached thesynchronisation point but has found a new bestsolution. It sets the synchronisation point to a lowernumber of evaluations. All searches are now at orpast the synchronisation point. Search B is the onlysearch exactly at the synchronisation point so itupdates the global best with its solution. It thenmakes a copy of its local state. The other searchesrestore their local state from the last copy made. Bsets a flag indicating synchronisation is completeand continues.
4) Searches A and C continue using the new bestsolution found by B as their starting point.
An additional optimisation which has been found togreatly improve performance is to try the solution forone specification on another. Since scenarios are usu-ally a modified version of the original problem, highquality solutions are often common to both problems.After each synchronisation, instead of sampling from theusual neighbourhood of solutions, the algorithm usesthe sections of the configuration for other specificationsas its possible next steps. For example, thread A wouldevaluate solutions for B and C on its own portion of theconfiguration. These can be accepted or rejected usingthe usual simulated annealing acceptance criteria.
6.2 Scenario Generation
Scenarios were generated in a random but controlledway so that the tasks which were modified were differ-ent to the tasks changed in the upgrade specificationsdescribed in 5.2.1. The flexibility of baselines gener-ated with scenarios was assessed using these upgrade
TABLE 10Scenarios
Scenario Num scenarios%age taskschanged
Utilisationincrease
noscen no scenarios used – –scen1 1 scenario 40% 4%scen2 1 scenario 40% 11%scen3 1 scenario 40% 18%scen4 1 scenario 40% 25%scen5 1 scenario 20% 25%scen6 1 scenario 60% 25%scen7 3 scenarios 40% 11%
specifications and the techniques developed throughoutsection 5. The characteristics of the scenarios are shownin table 10. Each row of the table corresponds to thescenarios used for generating a set of 3 baselines.
The scenario labels have the following meanings.noscen corresponds to the results from the previoussection where baselines were generated without the useof scenarios. Scenarios scen1, . . . , scen4 were generatedby randomly selecting an equal number of tasks fromeach transaction so that, in total, 40% of the systems’tasks were changed to achieve a range of different utili-sation increase levels. Certain problems were selected forfurther evaluation with scenarios scen5, scen6 and scen7.Scenarios scen5 and scen6 change different proportionsof tasks and scen7 uses three separate scenarios, eachgenerated in the same manner as scen2.
6.3 Scenario Evaluation Results
The same weightings which were used to generate pre-vious baselines, i.e. those tuned for the characteristicsof each problem and listed in table 6, are also used togenerate baselines with scenarios.
Results showing the combined flexibility of all base-lines generated with the first four scenarios and withoutany scenarios are shown in figure 9. The first point ofnote is that the baselines generated without any scenarioperforms better than may be expected. This can be ex-plained by the fact that the parameters used to minimisechange between a baseline solution and one for theupgrade specifications were specifically tuned for these

14 IEEE TRANSACTIONS ON SOFTWARE ENGINEERING, VOL. X, NO. Y, MONTH YEAR
Fig. 9. Changes required to meet upgrade requirements
baselines in section 5.2.3. This puts the new baselinesgenerated with scenarios at a slight disadvantage. Forthe other solutions, increasing the size of utilisationincrease in the scenario gradually improves the flexibilityof the system. The shading in each bar in figure 9 showsthe proportion of the number of changes attributed toeach upgrade. For scen4, nearly all allocation changes forupgrades with lower level utilisation increases have beeneliminated and allocation changes required for higherlevel utilisation increases have been reduced.
Figure 10 breaks down the results of figure 9 byproblem characteristic. This shows a very clear pattern.The problems which have the least flexible solutions byfar are those with a high utilisation and a low number oftasks per processor. In a problem with a lower numberof tasks per processor, each task is using a larger chunkof utilisation on average and so it is more difficult tofully utilise the available resources of each processor.One problem in particular requires more changes butthere is insufficient data within a single cell to drawconclusions with respect to its characteristics.
As was described in section 5.1, priority changes canonly be compared once allocation changes have beenremoved. Figure 11 shows the priority changes requiredto meet the upgrade specifications but only for the12 systems which were shown in figure 10 to havenegligible allocation changes. This graph once againshows that using scenarios which stress the solution withlarger utilisation increases reduce the number of changesrequired to perform an upgrade.
For the four systems which had a high per proces-sor utilisation and low number of tasks per processor,further baselines were created using scenarios describedin the final three rows of table 10. The flexibility ofthe baselines generated for just these four systems iscompared in figure 12. Scenario scen5 increased utili-sation per processor by the same amount as scen4 butconcentrated the change amongst fewer tasks. In general,if it were known which tasks would change, then amore targeted scenario makes sense but for the style
of upgrade tested here, these scenarios do not performwell. Scenario scen6 does the opposite, spreading theutilisation increase over a larger number of tasks. Thisstyle of scenario actually generates the most flexiblebaselines for these upgrades showing that diluting theutilisation increase over more tasks does not have anegative effect. Finally, scen7 represents a combinationof 3 scenarios each with the same characteristics asscen2. It has been shown that increasing the amount ofstress a scenario applies via a larger utilisation increaseimproves flexibility. An alternative way of increasing thestress is to use multiple scenarios with smaller utilisationincreases. A comparison between baselines generatedwith scen2 and scen7 validates this statement.
7 CONCLUSION
The task allocation problem is an important part of thearchitecture selection process for distributed real-timesystems and affects the system’s flexibility with regardto requirements changes and upgrades. A three stageprocess was given for generating flexible solutions totask allocation problems and then taking advantage ofthe flexibility. The first two stages, used during systemdesign, were tuning the algorithm for the problems ofinterest and generating baseline solutions using scenar-ios to enhance flexibility. The third stage, upgrading thebaseline with as few changes as possible, is used duringthe maintenance part of an engineering process.
A simulated annealing based search algorithm wastuned for a set of problems. It was found that classifyingproblems according to certain characteristics can greatlyimprove algorithm performance. The best characteristicsfor classifying problems were found to be the utilisationper processor and tasks per processor.
The method of generating baselines used a parallelsearch algorithm where threads collaborated to producesimilar solutions for a current problem specification andpotential upgrade scenarios. By using a synchronisationmechanism based on the thread which found a newbest solution with the fewest evaluations since the lastsynchronisation point, experiments could be conductedin a repeatable manner on a variety of platforms.
The use of scenarios was found to allow upgradesto be performed with fewer changes to baselines eventhough the predicted changes were different from theupgrades tested. This was true of all problems evaluated.Using single scenarios which contained larger changesor multiple scenarios with smaller changes enhancedflexibility more than a single scenario with made onlya small change to the original problem.
Four problem characteristics were studied throughoutthis paper. It was found that problems with a combina-tion of high processor utilisation, a low number of tasksper processor and a high message to task ratio requiredthe most effort to solve efficiently. In terms of produc-ing flexible baseline solutions, the interaction betweenprocessor utilisation and number of tasks per processor

EMBERSON et al.: STRESSING SEARCH WITH SCENARIOS FOR FLEXIBLE SOLUTIONS TO REAL-TIME TASK ALLOCATION PROBLEMS 15
Fig. 10. Changes required for upgrades for each problem class
Fig. 11. Priority changes required for upgrades
characteristics proved to be the most challenging. Therange of task periods within a system was the leastimportant of the four characteristics.
ACKNOWLEDGMENTS
This work is funded by the Software Engineering ByAutomated Search (SEBASE) program, EPSRC Grant
Fig. 12. Results of additional scenario evaluations
EP/D050618/1. We would also like to thank SimonPoulding for his advice on experimental methods.

16 IEEE TRANSACTIONS ON SOFTWARE ENGINEERING, VOL. X, NO. Y, MONTH YEAR
REFERENCES
[1] L. J. Bass, M. Klein, and F. Bachmann, “Quality attribute designprimitives and the attribute driven design method,” in PFE ’01:Revised Papers from the 4th International Workshop on SoftwareProduct-Family Engineering, 2002, pp. 169–186.
[2] P. Kruchten, “The 4+1 view model of architecture,” IEEE Softw.,vol. 12, no. 6, pp. 42–50, 1995.
[3] A. Jansen and J. Bosch, “Software architecture as a set of archi-tectural design decisions,” in WICSA ’05: Proceedings of the 5thWorking IEEE/IFIP Conference on Software Architecture (WICSA’05),2005, pp. 109–120.
[4] P. Koopman, “Embedded system design issues (the rest of thestory),” in ICCD ’96: Proceedings of the 1996 International Conferenceon Computer Design, VLSI in Computers and Processors. IEEEComputer Society, 1996.
[5] L. Sha, “Real-time virtual machines for avionics software portingand development,” in Real-Time and Embedded Computing Systemsand Applications, 2004, vol. 2968, pp. 123–135.
[6] R. Racu, A. Hamann, and R. Ernst, “Automotive system optimiza-tion using sensitivity analysis,” in Embedded System Design: Topics,Techniques and Trends, 2007, vol. 231, pp. 57–70.
[7] B. W. Boehm, J. R. Brown, and M. Lipow, “Quantitative evaluationof software quality,” in ICSE ’76: Proceedings of the 2nd InternationalConference on Software engineering, 1976, pp. 592–605.
[8] R. Kazman, L. J. Bass, M. Webb, and G. D. Abowd, “SAAM: Amethod for analyzing the properties of software architectures,” inInternational Conference on Software Engineering, 1994, pp. 81–90.
[9] R. Kazman, M. Klein, and P. Clements, “Evaluating software ar-chitectures for real-time systems,” Annals of Software Engineering,vol. 7, no. 1-4, pp. 71–93, 1999.
[10] A. Sangiovanni-Vincentelli and M. Di Natale, “Embedded systemdesign for automotive applications,” IEEE Computer, vol. 40,no. 10, pp. 42–51, 2007.
[11] G. Attiya and Y. Hamam, “Task allocation for maximizing relia-bility of distributed systems: A simulated annealing approach,”Journal of Parallel and Distributed Computing, vol. 66, no. 10, pp.1259–1266, October 2006.
[12] P.-Y. Yin, S.-S. Yu, P.-P. Wang, and Y.-T. Wang, “Multi-objectivetask allocation in distributed computing systems by hybrid par-ticle swarm optimization,” Applied Mathematics and Computation,vol. 184, no. 2, pp. 407–420, January 2007.
[13] I. Bate and P. Emberson, “Incorporating scenarios and heuristicsto improve flexibility in real-time embedded systems,” in RTAS’06: Proceedings of the 12th IEEE Real-Time and Embedded Technologyand Applications Symposium, 2006, pp. 221–230.
[14] J. Clark, J. J. Dolado, M. Harman, R. Hierons, B. Jones, Lumkin,S. Mancoridis, K. Rees, M. Roper, and M. Shepperd, “Reformu-lating software engineering as a search problem,” IEE Proceedings- Software, vol. 150, no. 3, pp. 161–175, June 2003.
[15] M. Harman, “The current state and future of search based soft-ware engineering,” FOSE ’07: Proceedings of Future of SoftwareEngineering, pp. 342–357, 2007.
[16] E. Alba and F. J. Chicano, “Software project management withGAs,” Information Sciences, vol. 177, no. 11, pp. 2380–2401, June2007.
[17] M. A. Babar, L. Zhu, and R. Jeffery, “A framework for classifyingand comparing software architecture evaluation methods,” inASWEC ’04: Proceedings of the 2004 Australian Software EngineeringConference, 2004, pp. 309–318.
[18] K. Tindell, A. Burns, and A. Wellings, “Allocating hard real-timetasks: An NP-hard problem made easy,” Real-Time Systems, vol. 4,no. 2, pp. 145–165, 1992.
[19] J. Beck and D. Siewiorek, “Simulated annealing applied to multi-computer task allocation and processor specification,” in Proceed-ings of the 8th IEEE Symposium on Parallel and Distributed Processing,1996, pp. 232–239.
[20] A. Metzner and C. Herde, “RTSAT– an optimal and efficient ap-proach to the task allocation problem in distributed architectures,”in RTSS ’06: Proceedings of the 27th IEEE International Real-TimeSystems Symposium, 2006, pp. 147–158.
[21] D. T. Peng, K. Shin, and T. Abdelzaher, “Assignment and schedul-ing communicating periodic tasks in distributed real-time sys-tems,” Software Engineering, vol. 23, no. 12, pp. 745–758, 1997.
[22] P.-E. Hladik, H. Cambazard, A.-M. Deplanche, and N. Jussien,“Solving a real-time allocation problem with constraint program-
ming,” Journal of Systems and Software, vol. 81, no. 1, pp. 132–149,January 2008.
[23] S. Kirkpatrick, C. Gelatt, and M. Vecchi, “Optimization by simu-lated annealing,” Science, vol. 220, no. 4598, pp. 671–680, 1983.
[24] J. N. Hooker, “Testing heuristics: We have it all wrong,” Journalof Heuristics, vol. 1, pp. 33–42, 1995.
[25] A. E. Eiben and M. Jelasity, “A critical note on experimentalresearch methodology in ec,” in CEC ’02: Proceedings of the 2002Congress on Evolutionary Computation, 2002, pp. 582–587.
[26] P. Emberson and I. Bate, “Minimising task migration and prioritychanges in mode transitions,” in RTAS ’07: Proceedings of the 13thReal Time and Embedded Technology and Applications Symposium,2007, pp. 158–167.
[27] D. C. Montgomery, Design and Analysis of Experiments, 6th ed.Wiley, December 2004.
[28] E. Alba and J. M. Troya, “Analyzing synchronous and asyn-chronous parallel distributed genetic algorithms,” Future Gener-ation Computer Systems, vol. 17, no. 4, pp. 451–465, January 2000.
[29] S. Poulding, P. Emberson, I. Bate, and J. Clark, “An efficientexperimental methodology for configuring search-based designalgorithms,” in Proceedings of 10th IEEE High Assurance SystemEngineering Symposium, 2007, pp. 53–62.
[30] J. Palencia and M. G. Harbour, “Schedulability analysis for taskswith static and dynamic offsets,” in Proceedings of the IEEE Real-Time Systems Symposium, 1998, pp. 26–37.
[31] R. I. Davis, A. Zabos, and A. Burns, “Efficient exact schedulabilitytests for fixed priority real-time systems,” IEEE Trans. Comput.,vol. 57, no. 9, pp. 1261–1276, 2008.
[32] W. Zheng, Q. Zhu, M. Di Natale, and A. S. Vincentelli, “Defini-tion of task allocation and priority assignment in hard real-timedistributed systems,” in Proceedings of 28th IEEE International Real-Time Systems Symposium (RTSS 2007), 2007, pp. 161–170.
[33] P. Emberson and I. Bate, “Extending a task allocation algorithmfor graceful degradation of real-time distributed embedded sys-tems,” in RTSS ’08: Proceedings of the 29th IEEE International Real-Time Systems Symposium, December 2008, accepted to appear.
[34] “White Rose Grid at York,” http://www.wrg.york.ac.uk, accessedAugust, 2008.
[35] “Berkeley Open Infrastructure for Network Computing,”http://boinc.berkeley.edu/, accessed August, 2008.
[36] “LINDO Systems,” http://www.lindo.com/, accessed August,2008.
[37] M. Matsumoto and T. Nishimura, “Mersenne twister: a 623-dimensionally equidistributed uniform pseudo-random numbergenerator,” ACM Trans. Model. Comput. Simul., vol. 8, no. 1, pp.3–30, January 1998.
Paul Emberson is a research associate in theReal-Time Systems group at the University ofYork. His research interests include local searchmethods, software engineering processes andsoftware architecture analysis. He previouslyworked as a professional software engineer inthe field of mobile telecommunications.
Iain Bate is a lecturer in Real-Time Systems. Hisresearch interests include scheduling and timinganalysis, design and analysis of safety-criticalsystems, and systems engineering. He is theEditor-in-Chief of the Journal of Systems Archi-tecture, a frequent member of programme com-mittees for distinguished international confer-ences, and a member of the Scientific AdvisoryBoard for the Progress research centre at Mal-adarlen University, Sweden, which specialises inComponent-Based Software Engineering.
![7 0 –7 () - emf.ipgg.nsc.ruemf.ipgg.nsc.ru/work/conf99/r2_3.pdfjheh]bq_kdh]h h[_ki_q_gby ba]hlh\e_gb_ fZd_lZ ijb[hjZ b _]h bkiu - lZgby < gZklhys_c jZ[hl_ ijb\h^blky j_r_gb_ aZ^Zqb](https://img.pdfslide.us/doc/110x75/5dd091f9d6be591ccb61a19a/7-0-a7-emfipggnscruemfipggnscruworkconf99r23pdfjhehbqkdhh-hkiqgby.jpg)


![Zgb - derev-grad.ru · 2014. 2. 13. · =HKL 14202-69 =jmiiZ = 19 IhklZgh\e_gb_f Dhfbl_lZ klZg^Zjlh\ , f_j b baf_jbl_evguo ijb[hjh\ ijb Kh\_l_ Fbgbkljh\ KKKJ hl 7 n_\jZey 1969 ]](https://img.pdfslide.us/doc/110x75/613201f3dfd10f4dd73a2b50/zgb-derev-gradru-2014-2-13-hkl-14202-69-jmiiz-19-ihklzghegbf-dhfbllz.jpg)


![IJB Thinks #23 The Time Machine [2014/2015]](https://img.pdfslide.us/doc/110x75/568ca9621a28ab186d9d4476/ijb-thinks-23-the-time-machine-20142015.jpg)