Embed Size (px)
Citation preview

This article has been accepted for inclusion in a future issue of this journal. Content is final as presented, with the exception of pagination.
IEEE TRANSACTIONS ON SMART GRID 1
Dynamic Network Rating for Low CarbonDistribution Network Operation—A U.K.
ApplicationJin Yang, Member, IEEE, Xuefeng Bai, Dani Strickland, Lee Jenkins, and Andrew M. Cross, Member, IEEE
Abstract—Dynamic asset rating (DAR) is one of the num-ber of techniques that could be used to facilitate low carbonelectricity network operation. Previous work has looked atthis technique from an asset perspective. This paper focuses,instead, from a network perspective by proposing a dynamicnetwork rating (DNR) approach. The models available for usewith DAR are discussed and compared using measured loadand weather data from a trial network area within MiltonKeynes in the central area of the U.K. This paper then usesthe most appropriate model to investigate, through a networkcase study, the potential gains in dynamic rating comparedto static rating for the different network assets—transformers,overhead lines, and cables. This will inform the network oper-ator of the potential DNR gains on an 11-kV network withall assets present and highlight the limiting assets within eachseason.
Index Terms—Asset life management, distribution network,dynamic asset rating (DAR), dynamic network rating (DNR),low carbon network operation.
NOMENCLATURE
I Currents (A).K Current ratios (actual value/rated value).R Transformer loss ratios (rated loss/no-load loss).Re Cable electrical resistance (�).Rt Cable thermal resistance (m2K/W).T Temperatures (◦C).�T Temperature rises (K).Wd Cable dielectric loss (W).λ Cable loss ratios.τ Time constants.a, soil Ambient and soil value subscripts.c Conductor value subscript.hs, o Hot-spot and oil value subscript.r Rated value subscript.s Steady-state value subscript.OHL Overhead line.TX Transformer.UGC Underground cable.
Manuscript received February 14, 2014; accepted December 16, 2014.Paper no. TSG-00103-2014.
The authors are with the School of Engineering and Applied Science, AstonUniversity, Birmingham B4 7ET, U.K. (e-mail: [email protected]).
Color versions of one or more of the figures in this paper are availableonline at http://ieeexplore.ieee.org.
Digital Object Identifier 10.1109/TSG.2015.2389711
I. INTRODUCTION
THE COST and limited flexibility of traditional approachesto 11-kV network reinforcement threaten to constrain
the uptake of low carbon technologies. In the U.K., toenable distribution network operators (DNOs) to develop newapproaches, office of gas, and electricity markets (Ofgem)(a U.K. national regulatory authority) has released £500 m offunding—low carbon network fund [1] for DNOs to trial inno-vative techniques and share the learning with the rest of theindustry. Project flexible approaches to low carbon optimizednetworks (FALCON) [2] is funded via this Ofgem initiativeto DNO western power distribution plc. (WPD), and aims tofacilitate the uptake of low carbon technologies by deliver-ing faster and cheaper connections to the 11-kV network byreducing traditional reinforcement requirements. The trial willprovide learning on the use of real-time data to inform networkplanning rather than traditional indicators such as total demandand engineering guidelines. The learning obtained throughoutthe project will be shared with other DNOs and the widerindustry.
One of the techniques under study is the dynamic asset rat-ing (DAR) for transformers, overhead lines, and cables withina network to help with asset life management. The techniquelooks to maximize network loading. The increased passage ofcurrent through an asset increases its losses, namely the cop-per loss, which manifests itself as heat. The heat generatedcan have notable effects if the asset is allowed to exceed themanufacturers’ recommended thermal rating. Once the ther-mal rating has been exceeded degradation of the insulation(for transformers and cables), or reduced safety clearance (foroverhead lines) occurs resulting in possible failure. Therefore,thermal ampacity (maximum current that can pass through anasset before the temperature limits are reached) needs to beobtained by monitoring or estimating conductor temperaturesand comparing with temperature limits to ensure no breachwhich may lead to additional degradation. Monitored environ-mental and loading data will be used to calculate “real-time”asset loading, allowing for higher ampacity for limited periodsrather than the current “static rating” current used by DNOs.With the benefit of on-line weather monitoring, the dynamicrating, or ampacity can be calculated. This process is alsoknown as dynamic thermal rating.
Research and practical tests have been carried out on DARfor individual assets such as transformers, overhead lines, andcables as described in Section II. This paper builds on that
1949-3053 c© 2015 IEEE. Translations and content mining are permitted for academic research only. Personal use is also permitted, but republication/redistribution requires IEEE permission. See http://www.ieee.org/publications_standards/publications/rights/index.html for more information.

This article has been accepted for inclusion in a future issue of this journal. Content is final as presented, with the exception of pagination.
2 IEEE TRANSACTIONS ON SMART GRID
work to look at the application of DAR modeling of a dynamicnetwork rating (DNR) containing all of these asset types. Thisprocess is novel in terms of managing the rating of a net-work as a whole compared to managing on an asset-by-assetbasis. This type of network management lends itself to futureintegration with automatic load transfer techniques to alter thelocation of the load to optimize the network based on theDNR. This paper is organized as follows. Asset DAR tech-niques are discussed and compared in Section II. In Section III,the concept of DNR is proposed. Using FALCON project trialarea data, simulations have been carried out to calculate theDNR over the period of a year in Section IV. Findings andpotential application issues are presented in the conclusion inSection V.
II. DAR
The attentions around DAR for transmission systemscan be tracked back to the 1980s [3]. The main aim ofa real-time application is to take advantage of environmen-tal impacts, e.g., low-ambient temperatures to load an assetabove its nameplate/static rating without causing excessiveoverheating [4]. This is particularly useful in meeting peakwinter U.K. demand. Condition monitoring should be under-taken with sensors, online monitoring, and intelligent tools, tomaximize and safely utilize the potential benefits. However,the challenges for applications to distribution systems are lackof weather data, equipment for thermal state monitoring, devel-oping fit-for-purpose thermal models, and lack of asset specificdata where old asset test certificates have been lost or param-eters have changed with time. The models are the basis forthe dynamic rating calculations and important for the networkrating assessment.
A. Transformer DAR
Power transformers are generally the most expensive com-ponents in distribution networks. Cost savings and deferredreplacement of transformers subject to loading constraintscould be achieved if transformers can be operated beyond theirnameplate ratings for certain periods. Other published workto date has focused on dealing with overloading, i.e., load-ing above the nameplate rating [5], or highly fluctuating loadprofiles, such as for wind turbine transformers [6].
The practice of using transformer DAR is to comprehendthe thermal effects that oil and winding temperatures haveon the life of insulation. The highest winding temperatureknown as the hot-spot temperature is located around the wind-ings but difficult to locate and is a function of transformerdesign and cooling functionality, ambient air temperature, oiltemperature, winding losses amongst others. This makes thehot-spot temperature difficult to measure with any degree ofcertainty. Although direct measurement methods have alreadybeen proposed [7], they can only be applied to newly builtunits, for which the manufacturer installed limited number oftechnically advanced measuring facilities (for instance sensorswith fiber-optic cables). Therefore, the hot-spot temperaturemay only be computed for most applications. An implemen-tation of transformer DAR in distribution networks in New
Zealand was reported in 2012 [8]. This was based on imple-menting the International Electrotechnical Commission (IEC)model described below with limited validation using a wind-ing temperature indicator. This is a good example of an assetrating implementation primarily for short-term overloadingapplications.
1) Modeling: The industrial standards model transformerthermal responses by estimating the hot-spot temperature ofwindings. This is generically represented by top-oil tempera-ture rise and hot-spot temperature rise on top of the ambienttemperature
Ths = To + �Ths = Ta + �To + �Ths (1)
where T denotes temperatures, �T denotes temperature risessubscript o refers to oil values, subscript hs refers to hot-spotvalues, and a refers to ambient values.
Based on the hot-spot temperature models, consumptionof transformer life (loss of this paper insulation life, unitvalue at 98 ◦C for nonthermally upgraded paper; 110 ◦C forthermally upgraded paper) can be estimated. In this paper,models were compared from the international guides for load-ing mineral-oil-immersed transformers: IEEE C57.91 [9], andIEC 60076-7 [10]. In terms of mathematical models, all thesemodels consider using exponential function (for both the top-oil and winding hot-spot temperatures) for transients betweeninitial and ultimate temperatures. In IEC 60076-7, a double-exponential model is proposed to improve the calculationaccuracy. In particular, for IEC 60076-7, it is mentioned thatthe exponential model is primarily designed for “step increasefollowed by a step decrease and so on.” The IEC 60076-7also presented a differential equation model, which is fit-for-purpose for real-time application. The models were pro-grammed into standard form to put in MATLAB as shown
dTo
dt= − 1
k11τoTo + 1
k11τoTa
+ 1
k11τo�Tor
(1 + K2R
1 + R
)x
(2)
d�Ths1
dt= − 1
k22τw�Ths1 + 1
k22τwk21Ky�Tor (3)
d�Ths2
dt= −k22
τo�Ths2 + k22
τo(k21 − 1) Ky�Tor (4)
where K is the load factor (load current/rated current),subscript r refers to rated values. Other factors used withinthe formula, e.g., x, y, k11, k21, and k22 have been deter-mined empirically and can be found in the IEC 60076-7document [10].
A comparison example between the models is shown inFig. 1 to compare the models and validate the coding. Thisshows the hot-spot temperature for a week’s worth of data withthe highest yearly temperature, where “IEC exp” and “IEC dif”denote IEC exponential and differential models, respectively.The differences between models are within 5 ◦C. This is withinthe error range of 10 ◦C from experimental results of oil tem-perature measurement and model calculation in [11]. IEC difis the most conservative model which gives the highest tem-peratures. Therefore, this model was chosen to as the basis forthe DNR modeling.
This article has been accepted for inclusion in a future issue of this journal. Content is final as presented, with the exception of pagination.
YANG et al.: DNR FOR LOW CARBON DISTRIBUTION NETWORK OPERATION—A U.K. APPLICATION 3
Fig. 1. Hot-spot temperature calculation with different models (7 days).
B. Overhead Line DAR
The static ratings of overhead lines have been calculatedin standard energy networks association (ENA) (the U.K.and Ireland energy network regulator) engineering recommen-dation (ER) P27 [12] to ensure that conductor temperatureremains within set tolerances. To ensure public safety, esti-mates of seasonal weather have been used to set the staticratings in the DNO network design manual [13]. In most cases,the thermal limit is defined by ground clearance (sag of theconductor) (not thermal degradation of insulation or conduc-tor melt temperatures as in cables or other equipment). In theU.K., for distribution systems built prior to 1970, the electricitysupply regulations limited the rated temperature of overheadlines to 50 ◦C. Some more recent lines have been limitedto higher temperatures (up to 75 ◦C) due to the introduc-tion of lighter conductors with higher strength/weight ratios.ENA ER P27 gives ratings at 50 ◦C, 65 ◦C, and 75 ◦C. Othereffects of conductor temperature include: 1) the possibility ofgrease melt; 2) effect on joints; and 3) conductor annealingresulting in loss of mechanical strength of aluminum overheadlines [14], [15].
1) Modeling: There are three well-known standards propos-ing models to be used for determining the rating of bareoverhead line conductors: IEC/TR 61597, IEEE 738-1993,and International Council on Large Electric Systems (CIGRE)working group 22.12. A comparison of the output of each ofthe models has been reported [16]. For network dynamic rat-ings, the CIGRE model has been used as recommended byIEC and widely used in the U.K. Both the differential andexponential models [17] were considered.
The thermal steady-states are defined by consideringheat balance of heat gain from joule, magnetic, solar, andcorona heating; heat loss from convective, radiative, and evap-orative cooling [17]. Then, transients between steady-states areestimated by exponential functions
Heating Tc = T(ult)s −
(T(ult)
s − T(ini)s
)e− t
τheating (5)
Cooling Tc = T(ini)s
P1
[P2 + (P1 − P2)e
− tτcooling
](6)
where T denotes temperatures, subscript c refers to conduc-tor transient values, subscript s refers to steady-state values,
superscript ini, ult refers to initial and ultimate steady-statevalues of current calculation step. P1 and P2 are the heatingpowers before and after the cooling period. τ heating and τ coolingare the time-varying heating and cooling time constants [17].The code was validated against the Alstom P341 relay [18]data and the static rating under the same conditions.
C. Underground Cable DAR
The static calculated current ratings of underground cablesare based on the temperature rise of the cable insulation (90 ◦Cfor polymeric insulation and 65 ◦C or 75 ◦C for this paper).To avoid insulation breakdown leading to cable failure, a staticsummer and winter current rating and a cyclic summer andwinter rating are employed by the ENA ER P17 [19]. Thesevalues are de-rated when the cable is ducted or in close prox-imity to other cables. The ratings contained within P17 arelimited to a fixed number of cable types and are typically cal-culated using average values for soil characteristics, taking thethermal resistivity of soil as a set seasonal value. Although thisis fine for a generalized case that will fit the large majorityof cables on the U.K. distribution network, it does not allowthe full realization of individual cables full current carryingcapability.
1) Modeling: Industrial models of underground powercable are detailed in IEC 60853-1 (cyclic and emergency rat-ings of cables) [20] and IEC 60287-1 (calculation of cablerating) [21]. The model used within this paper was based onthe equations in [21] for the case where drying out of the soildoes not occur or the cables are in air. The permissible currentrating of an ac cable can be derived from the expression forthe temperature rise above ambient temperature
�T =(
I2Re + 1
2Wd
)Rt1 +
[I2Re (1 + λ1) + Wd
]nRt2
+[I2Re (1 + λ1 + λ2) + Wd
]n (Rt3 + Rt4) (7)
where �T is the conductor temperature rise above ambient,I is the current in one conductor, Re is the ac electrical resis-tance per length at maximum operating temperature, Wd isthe dielectric loss per unit length. Rt1 is the thermal resistancebetween conductor and sheath, Rt2 is the thermal resistancebetween sheath and armor, Rt3 and Rt4 are the thermal resis-tances of the external serving and the surface to surroundingmedium, n is the number of load carrying conductors, and λ1is the ratio of losses in the metal sheath to conductor losseswhile λ2 is the ratio of losses in the armoring to conductorlosses.
A finite element model using the finite element methodmagnetics (FEMM) v4.2 program was used to validate therating computed in the MATLAB model and the DNO spec-ified rating as the cable type was not explicitly mentionedin ENA ER P17. This was done by comparing conduc-tor temperature for a fixed current at fixed temperature andsoil conditions. Fig. 2 shows the finite element model ofa ducted paper insulated corrugated aluminum sheath (PICAS)185 mm2 cable and the external temperature of the conductorunder a 230 A sustained rated current at 15 ◦C soil tempera-ture and 0.8 Km/W soil resistivity which produces an external

This article has been accepted for inclusion in a future issue of this journal. Content is final as presented, with the exception of pagination.
4 IEEE TRANSACTIONS ON SMART GRID
Fig. 2. FEMM plot of 11-kV PICAS 185 mm2 ducted cable.
conductor temperature of 70 ◦C to tie up with the rating usedin the MATLAB DAR analysis.
The cables were analyzed as both ducted (to take intoaccount possible road crossings) and un-ducted to explore thedifference in network dynamic rating. However, the cableswere assumed to be ungrouped. Grouping of cables furtherreduces the rating and it is important for a network oper-ator to know in advance if the cables are grouped prior toimplementing DAR.
III. DNR
As far as the authors are aware there has only been oneindustrial application of DAR in distribution systems carriedout in the U.K. in the past five years [22]–[25]. The fieldtrial of each asset is on a section of 33-kV Scottish powerenergy networks considering connection of an offshore windfarm (each asset was analyzed separately). Alstom developedthe P341 relay as part of that project in an attempt to monitorindividual assets [18] and part of the larger FALCON projectwill look to test the accuracy of this device against measuredasset temperature and the thermal models.
Michiorri et al. [26] discussed system ratings consideringdistributed generation accommodation. Although all types ofassets were included in this literature, the network dynamicrating was not identified or analyzed. In this paper, the maxi-mum dynamic loading of an 11-kV network has been studied.Moreover, not only are asset ratings considered but theseare compared to determine network rating within a networkanalysis tool. A DNR approach is proposed as shown in Fig. 3.
For each asset, MATLAB models in Section II wasimplemented to carry out component thermal analysis. Withpredicted load, environmental, operational data, and limitconstraint requirements of either specified temperature or loss-of-life the models were used to calculate maximum dynamicrating. The DAR results along with predicted load data andcircuit data were fed into the network model, where load flowanalysis, and asset constraint analysis were carried out for bothstatic and DAR constraints. This process is iterated until all thetime intervals of a year (or a specified period) have been gonethrough for the predicted load profile. For each time inter-val iteration, the maximum network loading at the primary atwhich an asset reaches its static rating compared to its DAR is
Fig. 3. Overview of the proposed DNR process.
Fig. 4. Network rating calculation example.
recorded. Then, the total network rating (defined as the totalcurrent through the primary transformers at constant voltage)is recorded as the DNR at this time point. The outcome ofDNR will be the network ratings over the whole period witha list of the constrained assets.
The process is further explained with the example in Fig. 4;for the first time slot (iteration 1), the original load distribu-tion along the two feeder lines is 67% (1000 kW) and 33%(500 kW) each. This load condition is scaled-up until one ofthe asset hits its rating limit, i.e., line 1 in red which hasa rating of 3.5 MW (scaling factor of 3.5). Therefore, thetotal substation load is 5.25 MW, which is defined as the

This article has been accepted for inclusion in a future issue of this journal. Content is final as presented, with the exception of pagination.
YANG et al.: DNR FOR LOW CARBON DISTRIBUTION NETWORK OPERATION—A U.K. APPLICATION 5
Fig. 5. Trial network schematic with DAR assets highlighted.
static network rating at this time period. For the next timeslot (iteration 2), the feeder load and the load distribution aredifferent, 60% (840 kW) and 40% (560 kW) for lines 1 and 2,respectively. If the load is scaled-up until line 1 hits its ratingof 3.5 MW again (scaling factor 4.17) then the total substationload is 5.83 MW, which is the new static network rating atthis time slot. To calculate the dynamic rating, not only doesthe load distribution of the feeders change, but the rating ofthe line (or other assets) also changes.
IV. DAR/DNR SIMULATION RESULTS AND DISCUSSION
A. Project Trial Area and Assets
The trial network considered in this paper is from anarea within Milton Keynes. The test network covers six differ-ent asset types starting at Newport Pagnell substation: primaryground mounted 33 kV/11 kV transformers, 11 kV overheadconductors, two types of 11 kV underground cables and twotypes of distribution transformers. The network schematic isshown in Fig. 5 with the DAR assets highlighted.
Feeder load data from 2012 along with an estimated sec-ondary load split provided by the DNO was used withcorresponding weather data from the Met Office. MATLAB(R2011a) was used to implement the algorithms of the var-ious DAR models. IPSA 2.3 is then used to undertake thenetwork analysis. DNR is implemented by Python scripting inIPSA to input DAR results from MATLAB.
B. Transformer DAR
The primary transformers of the network are at NewportPagnell substation. They are 33 kV/11 kV-12/19/24 MVA
Fig. 6. Example of dynamic rating for unit loss-of-life operation (110 ◦Climit) with OFAF cooling for 2 days in February 2012.
Fig. 7. Primary transformer dynamic rating limits under ONAN cooling forunit loss-of-life operation (110 ◦C limit).
transformers, with cooling type oil natural air natu-ral (ONAN)/oil forced air forced (OFAF). The rating ofthe transformer is dependent on the cooling adopted. Fromtheir test certificate, the rated current is 209.9 A primary,602.5 A secondary for ONAN cooling, and 332.4 A pri-mary and 953.9 A secondary OFAF cooling. No-load loss:6610 W (at 0.8 pf regulation), full-load loss: 71052 W ontap 9, 68537 W on tap 1 and 77045 W on tap 17.
Standards typically state that 110 ◦C is the unit life windingtemperature for thermally upgraded paper. This means that thewinding temperature can reach 110 ◦C without there beingany noticeable additional loss-of-life. Using this informationin conjunction with the IEC differential model, the maximumload current in conjunction with the weather conditions fora time step period has been used to determine the maximumloading on the transformer compared to the static rating forONAN and OFAF cooling applied constantly. Fig. 6 showstwo days in February 2012 that have extreme temperatures toindicate the degree of variation in the DAR over the courseof the day and the variability over a month. The maximumand minimum dynamic rating for each month is then shownin Figs. 7 and 8, which show the scope of dynamic rating forthe two cooling types for each month compared to the staticrating.
Investigating the effect of continuous loading at 19 MVAcompared to a dynamic rating (with temperature hot-spot limit

This article has been accepted for inclusion in a future issue of this journal. Content is final as presented, with the exception of pagination.
6 IEEE TRANSACTIONS ON SMART GRID
Fig. 8. Primary transformer dynamic rating limits under OFAF cooling forunit loss-of-life operation (110 ◦C limit).
set to 110 ◦C) shows that there is scope to run at up to20% higher continuous current in the winter months. However,under high ambient temperature conditions this dynamic rat-ing may also reduce in the summer months. Peak load in 2012occurred in February, and modeled dynamic ratings indicateda good margin due to low temperatures. Due to the thermalcapacity of the system an increased dynamic overload on thetransformer could be applied for several hours. Based on mod-eling of continuous load and looking closer at the data, ona month-by-month data (both with and without forced cooling)gives an idea as to where gains in dynamic rating may beobtained. January to May and October to December offergains in dynamic rating on some if not all of the days ofthe month.
As the ambient temperature increases there is a much moremarked effect on the shape of the modeled temperature curvefrom March to October to mimic the ambient temperaturevariation. This suggests a slight advantage at morning loadpick up, but no advantage at peak load period. However, thecurves from this analysis for June to September suggest that noadditional increase in dynamic rating is likely even at night andin fact there may even be a drop in the static rating required.
C. Overhead Line DAR
The section of overhead line in Way8 feeder to AmwayTongwell was analyzed as part of the network. This line isan aluminum-conductor steel-reinforced Dingo line with crosssectional area of 150 mm2. The static rating of the line insummer is 382 A. One of the key points to note is that thedata for wind speed and solar radiation is of poor granu-larity and was provided by the MET office as wind speed(mean and peak value) each 24 h period and the solar radi-ation was given as a total daily amount of energy receivedover a meter square area. To deal with this in the modeling,the wind speed was set to the constant mean value and thesolar radiation was assumed to fall over an 8 h period in earlyafternoon (so that the impact of solar radiation at peak loadcould be assessed with a value that approximates to a typicalpeak summer day). This reduces the accuracy of the modelingfor a particular 30-min period in time. However, the valuesaveraged over time will be representative.
Fig. 9 is an example of how the calculated dynamic rat-ing of the line changes for different weather conditions by
Fig. 9. Example of overhead line (OHL) dynamic rating with weatherconditions for 2 days in July 2012.
Fig. 10. OHL dynamic ratings with weather conditions including the effectof wind angle.
comparing two different days in July, 2nd and 24th. July 2ndis an unseasonably chilly day with a 9-knott wind and lowamount of solar radiation. July 24th is a hot sunny day witha 7-knott wind. Within Fig. 8 a number of points can be noted:point ➀ on the graph (overnight) shows an instant in timewhen the solar radiation is zero for both days and the ambienttemperature is equal. At this point, the difference in dynamicrating is a function of the wind speed. July 2nd which hasa higher wind speed to cool the line therefore has a greaterdynamic capacity (difference of 120 A) as shown by point➁ on the curve. At point ➂ on the graph, the ambient tem-perature of July 24th is 5 ◦C greater than that of July 2nd.Point ➃ on the graph shows that the difference in dynamicrating between the two curves has increased to 170 A. Atpoint ➄ on the graph, the ambient temperature and solar radi-ation on July 24th is higher than July 2nd. This acts to alter thedifference in dynamic capacity between the two curves evenfurther as shown at point ➅ where the range is now 250 A.The DAR for the overhead line on July 24th approaches thestatic rating as ambient conditions approach the nominal con-ditions used in the calculating the static summer rating. Thereis a significant variation in dynamic capacity over the courseof a day and during a month. Fig. 10 shows a monthly plot ofdynamic ratings compared to static ratings including the effectof wind angle on this margin.
This article has been accepted for inclusion in a future issue of this journal. Content is final as presented, with the exception of pagination.
YANG et al.: DNR FOR LOW CARBON DISTRIBUTION NETWORK OPERATION—A U.K. APPLICATION 7
Fig. 11. DAR of the underground cable (UGC) (type 1).
Fig. 12. DAR of the UGC (type 2).
The time constants on the overhead lines are in the order of10 min. This means that the line will quickly reach a steady-state condition within a 30-min time period. However, it alsomeans that variations over a small time scale will impactampacity but may not be recorded if 30-min averages areused. Wind angle can have a key effect on the cooling ofthe line. Along the length of the line, it is likely that the windangle will vary considerably. A value of 45◦ is usually cho-sen and this value (in the absence of solar power) used inthe IEC models with the P27 fixed ambient temperature andwind speed gives the same static rating as the DNO networkdesign manual [13]. Ampacity of the line over the period ofa year is very varied. Within the modeling undertaken, thereappears to be good ampacity gains on both a daily and a sea-sonal basis. Within the course of a 24 h period, the ampacityis higher overnight time reflecting the lower ambient temper-atures. On a seasonal basis, there appears to be a gain in thewinter months. However, on hot sunny days with low windspeed in the summer months, a reduction in ampacity mayalso be necessary.
D. Underground Cable DAR
There are two types of underground cables in this paper—these are 11-kV 3 core sector shaped aluminum conduc-tor, paper insulated corrugated aluminum sheath (Al-PICAS)cables with cross-sectional areas of 300 mm2 (type 1) and185 mm2 (type 2), respectively. The time constant relatingto the change in soil temperature is significantly higher than24 h, and therefore the daily soil temperature and the DAR ofthe cables can be assumed to be fixed over each 24 h period.
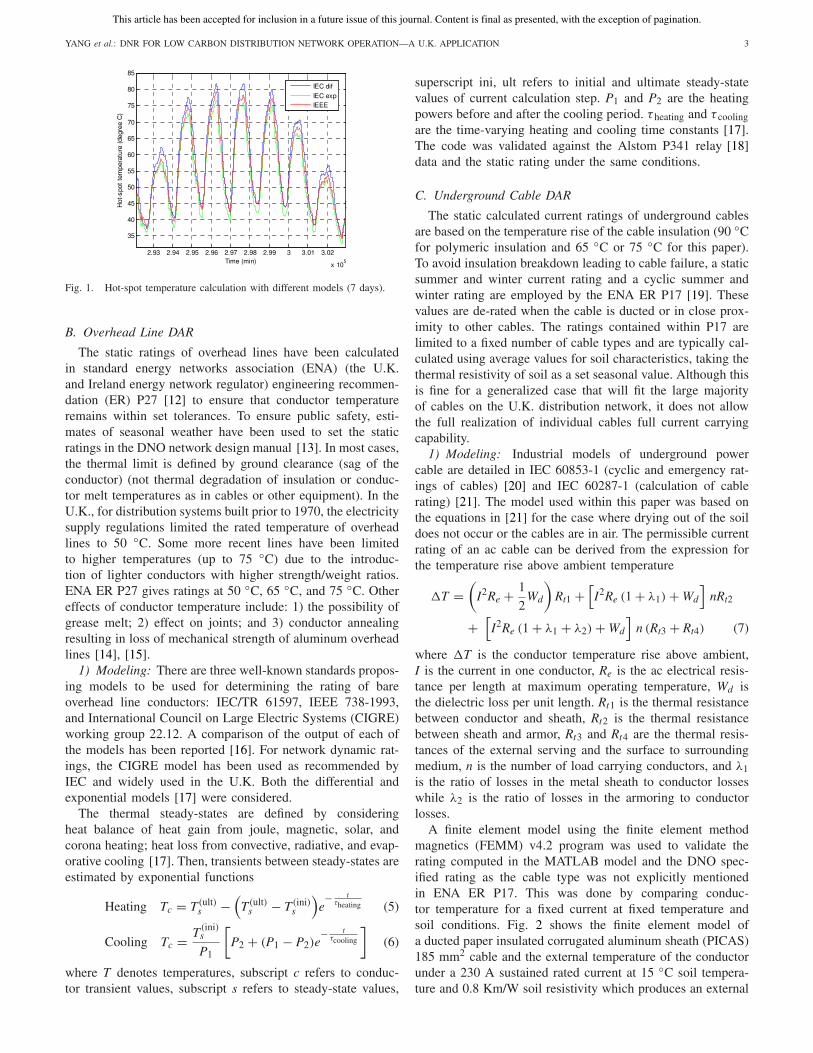
TABLE IDNR SCENARIO STUDIES
TABLE IICONSTRAINT ASSET VALUES
Fig. 13. DNR of the circuit under scenario (a) (OFAF cooling, un-ductedcable, wind angle 45◦).
The effect of this long time constant is apparent when thedynamic and static ratings for sustained current are comparedin Figs. 11 and 12. There are clearly areas where dynamicrating is above the cyclic rating which show where benefitmay be obtained. However, a reduction in rating may also beneeded if conditions are extreme (if the soil temperature isgreater than the seasonal static value).
E. DNR
The following DNR scenario studies were undertaken asshown in Table I over the period of a year to determinethe constraining asset on the network and how the networkloading compares to the static ratings. These have beendesigned to fully explore the effect of: UGC ducted/un-ducted,

This article has been accepted for inclusion in a future issue of this journal. Content is final as presented, with the exception of pagination.
8 IEEE TRANSACTIONS ON SMART GRID
Fig. 14. DNR of the circuit under scenario (b) (OFAF cooling, un-ductedcable, wind angle 0◦).
Fig. 15. DNR of the circuit under scenario (b) for a week in July to showthe effect of low wind angle and high solar radiation on OHL rating as aconstraint.
with/without distribution transformers, primary transformerOFAF/ONAN, OHL wind angle variation where data uncer-tainty exists. All the constraining assets have been allocateda number which allows them to be tracked in the followinggraphs. Table II shows which number refers to which asset.
Fig. 13 shows the static and DNR over the course of a yearunder scenario (a). The static rating is largely constrained bythe primary transformers in winter and by the undergroundcable from the primary feeder (type 1) in the summer months.The dynamic rating is similarly constrained but there are cleargains in rating during winter and spring when the static rat-ing of the transformer is mostly lower than the dynamic rating(as per Figs. 7 and 8). However, in summer, the dynamic rat-ing is lower than the static rating because the constraint is tiedto the type 1 cable and from Fig. 11 the soil temperature ishigher than that used to calculate the static value resulting ina reduction in dynamic rating.
Unfortunately, a wind direction measurement was unavail-able during 2012. The value of wind angle delta used toproduced Fig. 13 was set to 45◦ which is a common valueused within the standards. However, the worst case scenarioexists when the wind angle is equal to 0◦ in which case there is
Fig. 16. DNR of the circuit under scenario (c) (OFAF cooling, ducted cable,wind angle 45◦).
Fig. 17. DNR of the circuit under scenario (d) (OFAF cooling, ducted cable,wind angle 45◦ with distribution transformers).
no wind cooling effect in the network. Fig. 14 shows the effecton the DNR when a wind angle of 0◦ is used to generate thedynamic rating. As can be seen, there are now times within theyear where the network can also be constrained by the windangle (asset constraint value is 3). However, a closer look atthis shows that the asset is only constrained by the wind anglewhen this coincides with a period of solar radiation as shownin Fig. 15.
A cable within a duct has a lower rating than a direct laidcable. Fig. 16 shows the effect of the cable being laid ina duct. Comparing this to Fig. 13 (the un-ducted case), itshows that the cable is now the main constraint in the net-work, as opposed to the primary transformer, especially in thesummer months. The dynamic rating of the cable offers gainsto network dynamic rating in the winter and spring but not thesummer or autumn. The overall network rating is reduced byup to 20% compared to when the cable is not ducted.
The distribution transformer model requires more informa-tion than readily available, e.g., weight of oil and no-loadlosses. Therefore, typical industrial values have been usedwhich adds uncertainty into the calculation. Fig. 17 showsthe impact on the network of including the ratings of typicaldistribution transformers into the calculations. It is apparent

This article has been accepted for inclusion in a future issue of this journal. Content is final as presented, with the exception of pagination.
YANG et al.: DNR FOR LOW CARBON DISTRIBUTION NETWORK OPERATION—A U.K. APPLICATION 9
Fig. 18. DNR of the circuit under scenario (d) for a week in July to showthe effect of distribution transformer as a constraint.
Fig. 19. DNR of the circuit under scenario (e) (ONAN cooling, ducted cable,wind angle 45◦).
TABLE IIIMEAN AND STANDARD DEVIATION VALUES OF SEASONAL STATIC AND
DYNAMIC RATINGS
that there is a drop in network dynamic rating compared toFig. 13. This indicates that the least monitored part of the net-work in terms of past research potentially offers the biggestnetwork constraint.
Fig. 18 shows a close-up of a week in the summer, wherethe constraint is switching between two different distribution
Fig. 20. Summary of the constraining assets under each scenario.
transformers. The reason the network loading values are notconstant for a constant static rating of transformer is becausethe load at each substation is varying with respect to time andif a substation takes a higher proportion of the current then ithas less available capacity.
A last issue which could potentially affect the DNR isthe issue of primary transformer cooling (all distributiontransformers on this network are ONAN). If there are issueswith the cooling, then the primary transformer will need torun under ONAN as shown in Fig. 19. This, then, becomesthe constraining asset for the majority of the year, especiallyin summer when the dynamic rating may be less than the staticrating (see Fig. 7). This results in a DNR decrease of arounda third compared to Fig. 13.
A summary of mean and standard deviation values of sea-sonal static and dynamic ratings is shown in Table III which

This article has been accepted for inclusion in a future issue of this journal. Content is final as presented, with the exception of pagination.
10 IEEE TRANSACTIONS ON SMART GRID
gives an indication of average gains/losses in network load-ing between static and dynamic ratings. During winter andspring, all the dynamic mean values are higher than thoseof using static ratings. The highest mean value increase fromstatic to dynamic can be up to 188 A. This is for scenario (d) inwinter when low ambient temperature is advantageous for theoperation of constraining distribution transformers. However,during summer and autumn, most of the dynamic mean val-ues are very close and may even be slightly lower than thestatic values. The highest mean value decrease from dynamicto static can be up to 123 A. This is for scenario (e) in summerwhen the primary transformers are operating at highest ambi-ent temperatures but with ONAN cooling only. For almost allthe cases, the standard deviation values of dynamic ratings arehigher than those of static ratings. This is reasonable as morevarying factors are considered for each DAR hence the higherresult fluctuation.
V. CONCLUSION
A new DNR approach has been presented which looksin detail at the DNR using results from DAR calculations.Fig. 20 shows charts to summarize the percentage of timeeach asset is constrained under each of the scenarios studied.From these charts, it can be seen that the constraining networkasset types are similar between static and DARs. Within thisnetwork, there are only a small number of assets which set theloading limit of the network. For example, there are 23 assetsin the network of the type that can be monitored; however, theresults show that of these assets it is only necessary to monitorup to five of these in order to understand the dynamic ratingof the network.
The most constrained asset appears to be a couple of dis-tribution transformers. In practice, the increase of load ina network would result an increased number of distributionsubstations/transformers rather than simply increasing the loadon existing units. Another significant asset in the network isthe primary transformers, even with cooling present, the pri-mary transformer can be the main constraint within the wintermonths. The cable closest to the substation which carries thehighest load has been found to be the constraining asset withinthe summer and autumn months. However, a low wind angleand wind speed on a sunny day could worsen this networkrating.
To summarize, the dynamic rating offers clear gains to net-work operators in terms of network loading in the wintermonths (when peak loading occurs) but may be lower thanthe static rating on hot sunny days. It is also not necessaryto monitor every asset within a network and careful use ofmodeling can point toward monitoring those assets that offerthe biggest constraints.
ACKNOWLEDGMENT
The authors would like to thank C. S. Harrap and WPDplc. for their support to realize the production of this paper.They also would like to thank L. Baker and U. Afzal for theirediting and graph-plotting work.
REFERENCES
[1] Ofgem. (Feb. 2014). Low Carbon Networks Fund. [Online].Available: http://www.ofgem.gov.uk/electricity/distribution-networks/network-innovation/low-carbon-networks-fund
[2] Western Power Distribution. (Feb. 2014). FALCON. [Online]. Available:http://westernpowerinnovation.co.uk/Falcon.aspx
[3] B. D. Lahoti and D. E. Flowers, “Evaluation of transformer loadingabove nameplate rating,” IEEE Trans. Power App. Syst., vol. PAS-100,no. 4, pp. 1989–1998, Apr. 1981.
[4] M. F. Lachman, P. J. Griffin, W. Walter, and A. Wilson, “Real-time dynamic loading and thermal diagnostic of power transformers,”IEEE Trans. Power Del., vol. 18, no. 1, pp. 142–148, Jan. 2003.
[5] J. A. Jardini, J. L. P. Brittes, L. C. Magrini, M. A. Bini, and J. Yasuoka,“Power transformer temperature evaluation for overloading conditions,”IEEE Trans. Power Del., vol. 20, no. 1, pp. 179–184, Jan. 2005.
[6] J. McCarthy, “Analysis of transformer ratings in a wind farmenvironment,” M.E. thesis, Dept. Sustain. Elect. Energy Syst., DublinInst. Technol., Dublin, Ireland, 2010.
[7] Working Group 09 of Study Committee 12, “Direct measurement of thehot-spot temperature of transformers,” CIGRE Doc. Ref. 096, pp. 17–21,1995.
[8] T. S. Jalal, N. Rashid, and B. van Vliet, “Implementation of dynamictransformer rating in a distribution network,” in Proc. IEEE Int.Conf. Power Syst. Technol. (POWERCON), Auckland, New Zealand,Nov. 2012, pp. 1–5.
[9] IEEE Guide for Loading Mineral-Oil-Immersed Transformers andStep-Voltage Regulators, IEEE Standard C57.91-2011, Mar. 2012.
[10] Power Transformers—Part 7: Loading Guide for Oil-Immersed PowerTransformers, BS IEC Standard 60076-7:2005, Dec. 2010.
[11] R. Vilaithong, S. Tenbohlen, and T. Stirl, “Investigation of differenttop oil temperature models for on-line monitoring system of powertransformer,” in Proc. IEEE Int. Conf. Cond. Monitor. Diagn. (CMD),Changwon, Korea, Apr. 2006, pp. 1–6.
[12] Current Rating Guide for High Voltage Overhead Lines Operating inthe U.K. Distribution System, IEEE Standard ENA ER P27, 1986.
[13] Network Design Manual, Version 7.7, E. On Central Netw., Coventry,U.K., Dec. 2006.
[14] CIGRE 299—Guide for Selection of Weather Parameters for BareOverhead Conductor Ratings, Working Group B2.12, Aug. 2006.
[15] 425—Increasing Capacity of Overhead Transmission Lines-Needs andSolutions, Working Group B2/C1.19, Aug. 2010.
[16] A. Michiorri, “Power system real-time thermal rating estimation,”Ph.D. dissertation, Dept. Eng. Comput. Sci., Durham Univ., Durham,U.K., 2010.
[17] Thermal Behaviour of Overhead Conductors, CIGRE WorkingGroup 22.12, Aug. 2012.
[18] (Feb. 2014). MiCOM Alstom P341. [Online]. Available: http://www.alstom.com/grid/products-and-services/Substation-automation-system/protection-relays/MiCOM-Alstom-P341/
[19] Current Ratings for Distribution Cables, Part 3: Ratings for 11 kV and33 kV Cables Having Extruded Insulation, IEEE Standard ENA ER P17,2004.
[20] Calculation of the Cyclic and Emergency Current Rating of Cables,Part 1: Cyclic Rating Factor for Cables Up to and Including 18/30 (36)kV, IEEE Standard IEC 60853-1, 1985.
[21] Calculation of the Current Rating, Part 1: Current RatingEquations (100% Load Factor) and Calculation of Losses, IEEEStandard IEC 60287-1, 2006.
[22] D. Roberts, P. Taylor, and A. Michiorri, “Dynamic thermal ratingfor increasing network capacity and delaying network reinforcements,”in Proc. IET-CIRED Sem. SmartGrids Distrib., Frankfurt, Germany,Jun. 2008, pp. 1–4.
[23] H. T. Yip et al., “Dynamic thermal rating and active control forimproved distribution network utilisation,” in Proc. 10th IET Int. Conf.Develop. Power Syst. Protect. (DPSP) Manage. Change, Manchester,U.K., Mar./Apr. 2010, pp. 1–5.
[24] G. J. Lloyd, R. G. Bouchet, L. Zou, and C. An, “Real-time thermal ratingand active control improved distribution network utilisation,” in Proc. 47thInt. Univ. Power Eng. Conf. (UPEC), London, U.K., Sep. 2012, pp. 1–6.
[25] G. Lloyd, R. G. Bouchet, C. An, L. Zou, and S. Hosseini, “Real-time thermal rating and active control improved distribution networkutilisation,” in Proc. 22nd Int. Conf. Exhibit. Elect. Distrib. (CIRED),Stockholm, Sweden, Jun. 2013, pp. 1–4.
[26] A. Michiorri, P. C. Taylor, S. C. E. Jupe, and C. J. Berry, “Investigationinto the influence of environmental conditions on power system ratings,”Proc. Inst. Mech. Eng. A, J. Power Energy, vol. 223, no. 7, pp. 743–757,Nov. 2009.

This article has been accepted for inclusion in a future issue of this journal. Content is final as presented, with the exception of pagination.
YANG et al.: DNR FOR LOW CARBON DISTRIBUTION NETWORK OPERATION—A U.K. APPLICATION 11
Jin Yang (S’08–M’11) was born in Liaoning, China.He received the B.E. and M.Sc. degrees fromNorth China Electric Power University, Baoding,China, in 2003 and 2006, respectively, and the Ph.D.degree from the University of Glasgow, Glasgow,U.K., in 2011, all in electrical engineering.
He is currently a Lecturer with the School ofEngineering and Applied Science, Aston University,Birmingham, U.K. His current research interestsinclude operations and optimization of power trans-mission and distribution networks, protection of
renewable power generation systems, and smart grid technologies.
Xuefeng Bai received the B.E., M.E., and Ph.D. degrees from the HarbinInstitute of Technology, Harbin, China, in 1996, 1998, and 2002, respectively,all in electrical engineering.
His current research interests include smart grid technologies, distributionnetwork optimization and control, and power system stability analysis.
Dani Strickland received the B.Eng. degree in elec-trical and electronic engineering from Heriot WattUniversity, Edinburgh, U.K., and the Ph.D. degreein electrical engineering from Cambridge University,Cambridge, U.K., 1991 and 1995, respectively.
She is currently a Lecturer with Aston University,Birmingham, U.K. She was with Eon, SheffieldUniversity, Sheffield, U.K., and Rolls Royce FuelCells PLC, Derby, U.K.
Lee Jenkins received the M.Sc. degree in electri-cal power distribution from Newcastle University,Newcastle, U.K., in 2009. He is currently pur-suing the Ph.D. degree from Aston University,Birmingham, U.K.
From 1999 to 2003, he was a Modern Apprenticewith LG Electronics, Newport South Wales,Newport, U.K. He was a Maintenance Electricianwith the National Health Service (NHS), NorthGlamorgan NHS Trust, Merthyr Tydfil, U.K. until2005. From 2005 to 2006, he was an Electrical
Engineer with British Power International, Essex, U.K. From 2006 to 2014,he was an Electrical Engineer with Sterling Power Utilities, West Midlands,U.K. Between 2009 and 2014, he joined Aston University as a Lecturerin the Power Systems and Power Electronics Group, School of Electrical,Electronic, and Power Engineering. His current research interests includedynamic thermal ratings of underground power cables.
Andrew M. Cross (M’05) received the B.Sc.degree from Leeds University, Leeds, U.K., in1985, and the M.Sc. and Ph.D. degrees from theUniversity of Birmingham, Birmingham, U.K.,in 1997 and 2002, respectively, all in electricalengineering.
From 1985 to 1989, he was a Design andDevelopment Engineer with GEC IndustrialControls, Kidsgrove, U.K. From 1989 to 1997,he was a Research Engineer with the MagneticsDivision, Ultra Electronics, Rugeley, Staffordshire,
U.K. From 2001 to 2004, he was a Research Fellow with the Universityof Birmingham. From 2004 to 2008, he was a Lecturer with ManchesterUniversity, Manchester, U.K. Since 2008, he has been a Lecturer withthe Power Systems and Power Electronics Group, School of Electrical,Electronic, and Power Engineering, Aston University, Birmingham. Hiscurrent research interests include high-frequency power converters, powerquality and modeling, simulation, and control of power electronic systems.