Embed Size (px)
Citation preview
IEEE TRANSACTIONS ON INFORMATION FORENSICS AND SECURITY, VOL. 4, NO. 4, DECEMBER 2009 849
Benchmarking Quality-Dependent and Cost-SensitiveScore-Level Multimodal Biometric Fusion
AlgorithmsNorman Poh, Thirimachos Bourlai, Josef Kittler, Lorene Allano, Fernando Alonso-Fernandez, Onkar Ambekar,
John Baker, Bernadette Dorizzi, Omolara Fatukasi, Julian Fierrez, Harald Ganster, Javier Ortega-Garcia,Donald Maurer, Albert Ali Salah, Tobias Scheidat, and Claus Vielhauer
Abstract—Automatically verifying the identity of a person bymeans of biometrics (e.g., face and fingerprint) is an importantapplication in our day-to-day activities such as accessing bankingservices and security control in airports. To increase the systemreliability, several biometric devices are often used. Such a com-bined system is known as a multimodal biometric system. This
Manuscript received August 02, 2008; revised May 26, 2009. First publishedOctober 20, 2009; current version published November 18, 2009. This workwas supported by the European Union under the following projects: BioSe-cure (www.biosecure.info) and Mobio (www.mobioproject.org). The partici-pating teams were supported by their respective national fund bodies: the DutchBSIK/BRICKS project and the Spanish project TEC2006-13141-C03-03. Thework of N. Poh was supported by the Swiss National Science Foundation underAdvanced Researcher Fellowship PA0022_121477. The work of F. Alonso-Fer-nandez was supported by Consejeria de Educacion de la Comunidad de Madridand Fondo Social Europeo. The work of J. Fierrez was supported by a MarieCurie fellowship from the European Commission. The associate editor coor-dinating the review of this manuscript and approving it for publication wasProf. Davide Maltoni.
N. Poh, J. Kittler, and O. Fatukasi are with the Centre for Vision, Speechand Signal Processing, School of Electronics and Physical Sciences, Universityof Surrey, Guildford, GU2 7XH, Surrey, U.K. (e-mail: [email protected];[email protected]; [email protected]).
T. Bourlai is with the Biometrics Center, Lane Department of ComputerScience and Electrical Engineering, College of Engineering and MineralResources, West Virginia University, Morgantown, WV 26506-6109 USA(e-mail: [email protected]).
L. Allano was with Institut Telecom, Telecom and Management SudParis,91011 Evry, France. She is currently with CEA LIST, CEA saclay-PC 72–91191Gif-sur-Yvette Cedex, France (e-mail: [email protected]).
F. Alonso-Fernandez, J. Fierrez, and J. Ortega-Garcia are with BiometricRecognition Group – ATVS, Escuela Politecnica Superior, Universidad Au-tonoma de Madrid, 28049 Madrid, Spain (e-mail: [email protected]; [email protected]; [email protected]).
O. Ambekar is with CentrumWiskunde and Informatica (CWI), 1098 XG,Amsterdam, The Netherlands.
J. Baker and D. Maurer are with the Applied Physics Laboratory, Johns Hop-kins University, Laurel, MD 20723 USA (e-mail: [email protected];[email protected]).
B. Dorizzi is with the Electronics and Physics Department, Institut Telecom,Telecom and Management SudParis, 91011 Evry, France (e-mail: [email protected]).
H. Ganster is with the Institute of Digital Image Processing, Joanneum Re-search, Graz 8010, Austria.
A. A. Salah is with the ISLA-ISIS, University of Amsterdam, 1098 XG Am-sterdam, The Netherlands.
T. Scheida is with Applied/Media Informatics, IT Security, Department ofInformatics and Media, Brandenburg University of Applied Sciences, D-14770Brandenburg an der Havel, Germany.
C. Vielhauer is with Research Group Multimedia and Security, Departmentof Technical and Business Information Systems, Faculty of Computer Science,Otto-von-Guericke-University of Magdeburg, D-39106 Magdeburg, Germany(e-mail: [email protected]).
Color versions of one or more of the figures in this paper are available onlineat http://ieeexplore.ieee.org.
Digital Object Identifier 10.1109/TIFS.2009.2034885
paper reports a benchmarking study carried out within the frame-work of the BioSecure DS2 (Access Control) evaluation campaignorganized by the University of Surrey, involving face, fingerprint,and iris biometrics for person authentication, targeting the appli-cation of physical access control in a medium-size establishmentwith some 500 persons. While multimodal biometrics is a well-in-vestigated subject in the literature, there exists no benchmark fora fusion algorithm comparison. Working towards this goal, we de-signed two sets of experiments: quality-dependent and cost-sensi-tive evaluation. The quality-dependent evaluation aims at assessinghow well fusion algorithms can perform under changing qualityof raw biometric images principally due to change of devices. Thecost-sensitive evaluation, on the other hand, investigates how wella fusion algorithm can perform given restricted computation andin the presence of software and hardware failures, resulting in er-rors such as failure-to-acquire and failure-to-match. Since multiplecapturing devices are available, a fusion algorithm should be ableto handle this nonideal but nevertheless realistic scenario. In bothevaluations, each fusion algorithm is provided with scores fromeach biometric comparison subsystem as well as the quality mea-sures of both the template and the query data. The response to thecall of the evaluation campaign proved very encouraging, with thesubmission of 22 fusion systems. To the best of our knowledge, thiscampaign is the first attempt to benchmark quality-based multi-modal fusion algorithms. In the presence of changing image qualitywhich may be due to a change of acquisition devices and/or devicecapturing configurations, we observe that the top performing fu-sion algorithms are those that exploit automatically derived qualitymeasurements. Our evaluation also suggests that while using all theavailable biometric sensors can definitely increase the fusion per-formance, this comes at the expense of increased cost in terms ofacquisition time, computation time, the physical cost of hardware,and its maintenance cost. As demonstrated in our experiments, apromising solution which minimizes the composite cost is sequen-tial fusion, where a fusion algorithm sequentially uses match scoresuntil a desired confidence is reached, or until all the match scoresare exhausted, before outputting the final combined score.
Index Terms—Biometric database, cost-sensitive fusion, multi-modal biometric authentication, quality-based fusion.
I. INTRODUCTION
A. Multimodal Biometric Systems
I N order to improve confidence in verifying the identity ofindividuals seeking access to physical or virtual locations,
both government and commercial organizations are imple-menting more secure personal identification (ID) systems.Designing a highly secure and accurate personal identificationsystem has always been a central goal in the security business.This challenge can be met by resorting to multimodal biometric
1556-6013/$26.00 © 2009 IEEE
Authorized licensed use limited to: Univ Autonoma de Madrid. Downloaded on December 14, 2009 at 10:56 from IEEE Xplore. Restrictions apply.
850 IEEE TRANSACTIONS ON INFORMATION FORENSICS AND SECURITY, VOL. 4, NO. 4, DECEMBER 2009
systems [1]–[3] with the aim of increasing the security aswell as identification performance. The multimodal biometricsaproach can be extended by explicitly considering the samplequality of the input biometric signals and weighting the variouspieces of evidence based on objective measures of quality of thebiometric traits. This formulation of the multimodal biometricsfusion problem is called quality-based fusion. It is a researchtopic of increasing importance.
B. State-of-the-Art in Quality-Based Fusion
The first known work on quality-based multimodal biomet-rics is [4], which presented the problem under a frameworkof Bayesian statistics. The result was an Expert Conciliationscheme including weighting factors not only for the relative ac-curacy of the experts but also for the confidence of the expertsregarding the scores for particular input samples. The idea ofrelating sample confidence values to actual quality measures ofthe input biometric signals was also introduced in that work, butnevertheless not experimentally studied, under the same frame-work, until [5]. The first experimental study on quality-basedfusion was limited to the use of a chimeric bimodal database(where biometric traits of different persons are combined toform a virtual identity), with the use of quality measures man-ually generated by a human expert. A follow-up work by thesame researchers overcame the experimental limitation and pro-vided a more realistic experimental setup to show the benefits ofincorporating quality-based information in standard fusion ap-proaches based on discriminative [6], and generative learning[7].
The concept of confidence of matching scores was consid-ered in [8]. In that work, the authors demonstrated the merit ofusing measures of confidence in fusion. This research line wasfurther developed in [9], where confidence measures based onthe margin between impostor and client score distributions weredeveloped.
Another research direction in quality-based fusion reportedin the literature is based on clustering [10]. In this work, qualitymeasures obtained directly from the input biometric signalswere used to fuzzify the scores provided by the different com-ponent biometric systems. The authors demonstrated that fuzzyversions of k-means and vector quantization including thequality measures tended to outperform the standard nonfuzzyclustering methods. This work, to the best of our knowledge,is the first one reporting experimental results of quality-basedfusion.
A more recent effort in quality-based fusion was reported in[11], where the authors developed a scheme based on polyno-mial functions. Quality measures were introduced in the opti-mization problem for training the polynomials as weights in theregularization term.
Other recent advances in quality-based fusion for multimodalbiometrics are based on the following concepts: logistic regres-sion with quality measures as features [12], Bayesian credence[13], Bayesian belief networks with quality measures as inputs[14], and joint score and quality classifiers using the likelihoodratio test [15], [16].
C. Motivation
The motivation for carrying out this study is as follows.
1) The need for benchmarking quality-based fusion: Whilethere are quite a few papers on quality-based fusion, e.g.,[4]–[6], [12], [13], and [16], to the best of our knowledge,there exists no benchmark database on which these algo-rithms can be compared and on which real progress can bemeasured. Note that although the existence of multimodalcorpora is a necessary prerequisite of benchmarking mul-timodal and multialgorithmic (i.e., employing different al-gorithms on the same biometric data) fusion algorithms, itis not sufficient. For instance, it is not straightforward tocompare two fusion algorithms in the case where each al-gorithm relies on its own set of biometric subsystems. Thisis because an observed improvement of a particular fusionalgorithm may be due to the superior performance of itsbiometric subsystems rather than the merits of the fusionprocess itself. There is, therefore, a need for benchmarkingfusion algorithms on a common ground, e.g., using thesame biometric match scores for the score-level fusion, orsome common features for the feature-level fusion.
2) The cost implications: While using more biometric devicesand/or samples can increase the system performance, asdemonstrated in [1], [17], [18] (and references therein) andelsewhere in the literature, such improvement often comesat the expense of acquiring more data, and, therefore, in-curring more processing time, and adding the cost of hard-ware and its maintenance. All these aspects add up to muchhigher global operating costs. In this study, the abstractconcept of cost is formally defined and is used to assessmultimodal biometric fusion against such cost.
3) System robustness: We expect that using more biometricsystems/devices can increase the robustness of the com-bined system against spurious verification errors (falseacceptance and false rejection) of any single subsystem/de-vice, e.g., [1] and references therein. In addition, such acombined multimodal system can also robustly handlesoftware or operational failures such as failure-to-extractor failure-to-match, or even hardware failure (completebreakdown), resulting in invalid or missing match scores.The latter property has not been thoroughly investigated.
D. Cost-Sensitive and Quality-Based Fusion EvaluationCampaign
The above aspirations have been addressed by designing abenchmark database and organizing an evaluation campaignusing the database. Seven teams participated in our evaluation,and altogether, they submitted 22 fusion algorithms.
The campaign was divided into two parts: quality-dependentevaluation and cost-sensitive evaluation. The first challenge wasto evaluate quality-dependent fusion algorithms whereas thesecond involved evaluating conventional fusion algorithms. Inboth cases, we considered also the possibility of investigatingtwo further subproblems. The first one involved client-specificor user-dependent fusion where one can train a fusion classifierthat is tailored to each identity claim (see, e.g., [19] and [20] fora more comprehensive survey). The second was concerned withhandling missing information. For instance, when one or morebiometric subsystems are not operational due to failure-to-ac-quire or failure-to-match a biometric sample, we require thefusion system to be able to output a combined score. This isfeasible because the subsystem match scores contain redundant
Authorized licensed use limited to: Univ Autonoma de Madrid. Downloaded on December 14, 2009 at 10:56 from IEEE Xplore. Restrictions apply.
POH et al.: BENCHMARKING QUALITY-DEPENDENT AND COST-SENSITIVE SCORE-LEVEL ALGORITHMS 851
information (i.e., each can be seen as a support for the samehypothesis although their actual values may be in differentranges).
An obvious disadvantage of score-level fusion is that, byusing only scores, a lot of precious nonclass discriminatoryinformation is lost, e.g., the quality of raw biometric signal.Here are two examples: a person’s face can change drasticallywith illness, diet, or age, as well as with the application ofcosmetics, a change in hair color or style, or a sun tan; and aperson’s voice can differ significantly with congestion causedby a cold. This information is nonclass discriminatory becauseit cannot be used to distinguish different individuals. Qualitymeasures are expected to provide measurements designed tocapture these changes in ways that could usefully be exploitedin the fusion process. In this sense, quality measures shouldin theory compensate for the loss of information without sac-rificing the practical advantage offered by score-level fusion.In practice, however, tapping the quality information, whichis nonclass discriminatory in nature, in order to improve theclassification performance, is not a trivial problem.
In a cost-sensitive evaluation scheme, one considers a fu-sion task as an optimization problem whose goal is to achievethe highest performance (as a function of false acceptance andfalse rejection decisions) at a desired minimum cost. We referto “cost” as the price paid for acquiring and processing infor-mation, e.g., requesting samples from the same device or usingmore biometric devices (which entails longer processing time).In this situation, a decision can be made even if not all thesubsystem match scores are observed. Therefore, the proposedcost-based evaluation effectively considers the redundancy ofmultimodal or multialgorithmic information. This subject hasnot been adequately addressed in the literature on multimodalbiometrics such as [1], [17], and [18] because in the work, it isassumed that all the match scores are available.
E. Contributions
The contribution of this paper is multifold.1) Benchmark for multimodal biometric quality-based fusion:
Thanks to the participation of seven teams, the BioSecuremultimodal biometric evaluation campaign received 22 fu-sion systems for comparison. To the best of our knowledge,this is the first time such a comparison has been carried out.
2) Cost-sensitive and robustness evaluation: We formally in-troduce the problem of cost-sensitive evaluation of multi-modal fusion algorithms. Normally, the common assump-tion behind multimodal biometric fusion is that all matchscores are observed. However, in reality, as match scoresand quality measurements are generated, failures to extractor to match can occur. Such failures are common especiallywhen biometric templates and query samples are acquiredusing different devices.
3) Sequential fusion: This novel approach takes match scoresinto account sequentially until a desired level of confidenceis reached, or until all the match scores are exhausted. Thealgorithm is ideally suited to minimize the cost of multi-modal biometrics by dynamically controlling the numberof matching performed.
4) A benchmark database of multimodal biometric score andquality measures: The data sets used to benchmark fu-sion algorithms have been made publicly available at http://
face.ee.surrey.ac.uk/fusion. The most similar effort to ourattempt is the XM2VTS score-level fusion benchmark dataset [21]. However, the latter does not contain any qualitymeasures for each biometric modality.
F. Paper Organization
The paper is organized as follows: Section II categorizes andsummarizes the submitted classifiers. The BioSecure DS2 dataset (with score and quality measures) is detailed in Section III.Section IV explains the two evaluation protocols. The results ofthe evaluation can be found in Section V. This is followed byconclusions in Section VI.
II. BRIEF DESCRIPTION OF SUBMITTED SYSTEMS
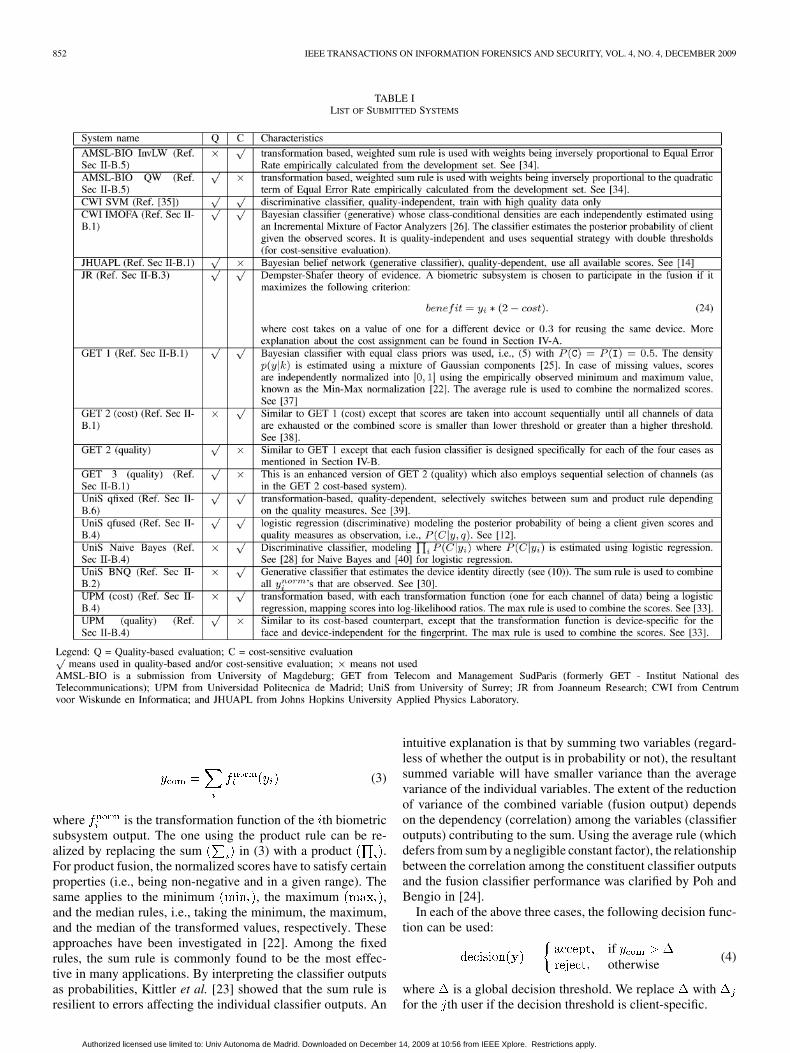
This evaluation involves 22 submissions of fusion systemsfrom seven sites. We will begin by introducing a common nota-tion and then describing the submitted fusion algorithms usingthis notation. A complete list of the systems is shown in Table I.
A. Classifier Categorization and Notation
Let be the output of the th biometric sub-system and let there be biometric subsystem outputs, i.e.,
. For simplicity, we denote ,where the symbol “ ” is the matrix transpose operator. Themost commonly used fusion classifier in the literature takes thefollowing form:
(1)
where is a combined score. We shall refer to this clas-sifier throughout this report as a conventional fusion classifier.
If the function takes into consideration the signal quality,then is considered a quality-dependent fusion classifier. Letthe signal quality of the th biometric subsystem be representedby a vector of measurements, � . Note that differentbiometric subsystems may have a different number of qualitymeasures . For simplicity, we denote as a concatenation ofall ’s, i.e., . The function in this casetakes the following form:
(2)
Any fusion classifier can be categorized into one of the twoforms just mentioned.
The function can be a generative or a discriminative classi-fier. In the former case, class-dependent densities are first es-timated and decisions are taken using the Bayes rule or theDempster–Shafer theory. In the latter, the decision boundary isdirectly estimated. A common characteristic of both types ofclassifiers is that the dependency among observations (scores orquality measures) is considered.
There exists also another approach that we will refer to as thetransformation-based approach [22] which constructs a fusionclassifier in two stages. In the first stage, the match scores ofeach biometric subsystem are independently transformed into acomparable range, e.g., in the range . In the second stage,the resulting normalized scores of all biometric subsystems arecombined using a fixed rule such as sum or product [23]. Thetransformation-based fusion classifier based on the sum rule, forinstance, has the following form:
Authorized licensed use limited to: Univ Autonoma de Madrid. Downloaded on December 14, 2009 at 10:56 from IEEE Xplore. Restrictions apply.
852 IEEE TRANSACTIONS ON INFORMATION FORENSICS AND SECURITY, VOL. 4, NO. 4, DECEMBER 2009
TABLE ILIST OF SUBMITTED SYSTEMS
(3)
where is the transformation function of the th biometricsubsystem output. The one using the product rule can be re-alized by replacing the sum in (3) with a product .For product fusion, the normalized scores have to satisfy certainproperties (i.e., being non-negative and in a given range). Thesame applies to the minimum , the maximum ,and the median rules, i.e., taking the minimum, the maximum,and the median of the transformed values, respectively. Theseapproaches have been investigated in [22]. Among the fixedrules, the sum rule is commonly found to be the most effec-tive in many applications. By interpreting the classifier outputsas probabilities, Kittler et al. [23] showed that the sum rule isresilient to errors affecting the individual classifier outputs. An
intuitive explanation is that by summing two variables (regard-less of whether the output is in probability or not), the resultantsummed variable will have smaller variance than the averagevariance of the individual variables. The extent of the reductionof variance of the combined variable (fusion output) dependson the dependency (correlation) among the variables (classifieroutputs) contributing to the sum. Using the average rule (whichdefers from sum by a negligible constant factor), the relationshipbetween the correlation among the constituent classifier outputsand the fusion classifier performance was clarified by Poh andBengio in [24].
In each of the above three cases, the following decision func-tion can be used:
ifotherwise
(4)
where is a global decision threshold. We replace withfor the th user if the decision threshold is client-specific.
Authorized licensed use limited to: Univ Autonoma de Madrid. Downloaded on December 14, 2009 at 10:56 from IEEE Xplore. Restrictions apply.
POH et al.: BENCHMARKING QUALITY-DEPENDENT AND COST-SENSITIVE SCORE-LEVEL ALGORITHMS 853
In some of our discussions, it will be convenient not to dis-tinguish between the conventional and quality dependent fu-sion classifiers. This will be achieved by using common nota-tion. In particular, for the conventional classifier, this can befurther described by the feature vector , which is defined as
, where is a vector of biometric subsystem outputsdependent on the th biometric modality. The feature vector of aquality-dependent fusion classifier, on the other hand, will takethe input instead. Following the same conventionas before, we will write as a concatenation of all ’s, i.e.,
.In the discussion that follows, we will elaborate several forms
of used in our evaluation. We will, however, not discuss thealgorithms in great detail but instead we shall attempt to cap-ture the key intuitive ideas behind the methods. For details, theinterested reader should refer to the relevant citations.
B. Submitted Systems
1) Generative Classifier Estimating the Posterior Proba-bility: For the generative classifier, one can infer the probability(or posterior probability) of being a client using the followingBayes rule:
(5)
where is the density of , or a likelihood function condi-tioned on the class label which is either client or impostor, i.e.,
, and is the prior class probability. Being a prob-ability, is in the range . This classifier is also knownas a Bayes classifier. The Bayes optimal decision threshold asdefined in (4) is .
Referring to Table I, the fusion classifier GET-1 andCWI-IMOFA are of this form. In GET-1, the likelihoodfunction was estimated using a mixture of Gaussiancomponents, or a Gaussian mixture model (GMM) [25], i.e.,
(6)
where the th component class-conditional (denoted by ) meanvector is and its covariance matrix is . There arecomponents for each .
In CWI-IMOFA, a mixture of factor analyzers [26] was usedinstead. While the density estimated can also be written as in(6), the number of parameters needed is effectively smaller. Thisis because a factor analyzer assumes that a small number oflow-dimensional latent variables (factors) cause the correla-tion that is gauged by the th component conditioned on class .Dropping the superscript for notational economy (since eachterm is conditioned on the class ), each factor analyzer com-ponent can be described by
(7)
is called the factor loading matrix (for component ). Thismatrix characterizes the dependency of data points on eachfactor. is the Gaussian noise and is assumed to be distributed
, where is a diagonal matrix, interpreted as sensornoise common to all components. When is -dimensional,
is , whereas with factors, is .
If there are missing observations in , one can still calculatethe marginal distribution of the observed features by marginal-izing away the missing features. For a Gaussian mixture dis-tribution, calculating its marginal distribution can be achievedefficiently by manipulating the Gaussian mean and covariancematrices [27], thereby, dispensing with the need for explicit in-tegration. Such an approach is implemented by the organizer(UniS), referred to as the GMM-Bayes classifier.
In contrast to UniS’s GMM-Bayes classifier, the GET-1, 2,and 3 submissions did not deal with the missing observationusing Gaussian marginals. Instead, whenever there is a missingobservation, GET’s GMM-Bayes systems compute the fusedscore using a transformation-based strategy. First, each systemoutput is normalized to the range of using the empiri-cally observed minimum and maximum value (Min–Max nor-malization) [22]. Then, the average rule is used to combinethe normalized scores. Such a strategy works because the out-puts of the transformation-based fusion approach and that ofthe GMM-Bayes classifier are in the same range, i.e., , al-though only the latter case can be interpreted as probability.
The CWI-IMOFA submission dealt with the missing valuesby replacing them with their corresponding median values. Theauthors found experimentally (on the development set) that thisdid not affect the generalization performance significantly.
2) Generative Classifier Using the Log-Likelihood RatioTest: An alternative generative approach based on the log-like-lihood ratio test, which relies on the Neyman–Pearson lemma[28], takes the following form:
(8)
Its associated decision threshold [as in (4)] is optimal when
In practice, the output is a real (positive or negative)number in the range of hundreds or thousands.
Adopting the Naive Bayes strategy, (8) can be computed as
(9)
where we defined
We shall now deal with two cases: conventional fusion where, and quality-based fusion where . In the
first case, the function is . This is a one-to-one map-ping function (for each modality), therefore, a possible functionfor [see (3)]. This can be seen as a transfor-mation-based approach with the fusion operator being the sumrule. Such a Naive Bayes classifier was provided by UniS.
The second (quality-dependent) case has been reported in theliterature [29]. Note that the observation vectorhas dimensions. This increased dimensionality, especiallyin the case (due to ), can possibly pose a potential
Authorized licensed use limited to: Univ Autonoma de Madrid. Downloaded on December 14, 2009 at 10:56 from IEEE Xplore. Restrictions apply.
854 IEEE TRANSACTIONS ON INFORMATION FORENSICS AND SECURITY, VOL. 4, NO. 4, DECEMBER 2009
estimation problem, i.e., modeling the increased number of di-mensions may be less effective as it is usually not supported bythe required exponential increase in the number of training sam-ples (in the worst case). In fact, there is only a fixed number oftraining samples to design a fusion classifier.
Apart from the baseline Naive Bayes fusion, the UniSsubmission also includes a version that considers the qualitymeasures in its density estimation but does not suffer fromthe above-mentioned increased dimensionality of thespace. The model used here assumes that the biometric sub-system outputs and the quality measures are conditionallyindependent given the quality state, represented by . The au-thors defined a quality state to be a cluster of quality measuresthat are “similar” to each other [16]. The rationale of this modelis that data belonging to the same cluster of quality measureswill share the same characteristic. Therefore, it is sensible toconstruct a fusion strategy for each cluster of data (of similarquality). The consequence of this is that the complexity of thefusion classifier now is no longer directly dependent on thedimension of the quality measures , but is dependent on thenumber of clusters. In their submitted implementation, theseclusters are found using a GMM model (6), but constrainedto be between one and three (as a means to control the modelcomplexity). The GMM parameters are estimated using theexpectation maximization (EM) algorithm. For each of thebiometric subsystem outputs , the following quality-basednormalization output is computed:
(10)
where denotes a cluster of quality measures. The sum overall the quality states of is necessary since the quality state isa hidden variable; only and are observed. Note that thedimensionality involved in estimating is effectivelyone since is one-dimensional and is a discrete variable. Thepartitioning function refers to the posteriorprobability that belongs to the cluster . This term is alsoknown as responsibility in the GMM literature [25].
There are at least three possible ways of clustering the qualitymeasures:
• In the first approach, one divides the quality measures ac-cording to the device which was used to collect the bio-metric samples (from which the quality measures havebeen derived). If there are devices, there will beclusters of quality measures. In this case, we say that theclusters are device-dependent. This approach was firstreported in [30].
• The second approach can be considered a further refine-ment of the first approach. Since there is no guarantee thatthe quality is consistent over all devices, it may be desir-able to further find the natural clustering that exists for eachdevice-dependent cluster of quality measures. For the caseof a single device, such a study was reported in [16] wherein order to combine several face experts (hence intramodalfusion), a separate fusion strategy was devised for eachcluster of quality measures.
• The third approach would consider finding a natural clus-tering of quality measures in a device independent manner.
The UniS submission in Table I is based on the first approach.Since the device is known during training (but not duringtesting), instead of using EM to infer the quality state, thequality state is probabilistically estimated, i.e., isestimated using a supervised approach. In the implementationof (10), the following Bayesian classifier (with equal classpriors) was used:
(11)
where the device-specific density of quality measures,(for a given ), was modeled using a GMM.
Note that the three procedures mentioned above, i.e., (9) (in-cluding both the conventional and quality-based fusion) and(10), output for that are directly combinedusing the sum rule (9). Hence, if a particular subsystem failsto output any score observation, the corresponding terms in thesum will be missing, hence not contributing to the final output.
The submission by JHUAPL can be interpreted as a realiza-tion of (9) (except that was not used) and is very similar to(10) which involves estimating the density . Insteadof clustering using EM, the authors binned the data to com-pute a histogram. The binning process can only work for scalarquality measures but not for a vector of quality measures. Inorder to generalize to the latter case, one must resort to the clus-tering approach.
3) Generative Classifier Using the Dempster–Shafer Theory:The Dempster–Shafer theory of evidence [31] attempts to reflectuncertainty of information sources by degrees of belief. The in-formation sources, or frames of discernment, in our case, referto the class labels . While in the Bayesian theory,these two events are disjoint, in the Dempster–Shafer theory,one considers all possible combinations, i.e., � �
, noting that information sources, unlikeevents in the usual probability interpretation, are not necessarilydisjoint. However, similar to probability, only one unit of massis distributed among all the possible information sources. Let
be the function that assigns a mass to the infor-mation source . The function is subject to the followingconstraints:
(12)
A new mass assignment is then combined with themass distribution derived from all previous informationsources using Dempster’s Rule of Combination, i.e., (13). Theresult of this task is a new distribution, , that incorporatesthe joint information provided by the sources selected up to thismoment
(13)
where
Authorized licensed use limited to: Univ Autonoma de Madrid. Downloaded on December 14, 2009 at 10:56 from IEEE Xplore. Restrictions apply.
POH et al.: BENCHMARKING QUALITY-DEPENDENT AND COST-SENSITIVE SCORE-LEVEL ALGORITHMS 855
(14)
Note that the sum in (13) iterates over all the information sourcescontaining . The conflict term is a normalizing factor anddisplays the conflict between the new evidence and the actualknowledge.
After selecting one information source (i.e., one biometricscore value), the mass distribution is derived in the followingway. The score value is interpreted as a percentage of certaintythat the claimed identity is true, and thus assigned to the set(client or genuine user). Another portion of mass is assigned tothe set containing the whole frame of discernment (15)
(15)
noting that are normalized into the range . The combinedscores can be expressed by
(16)
where is the mass distribution defined according to (15), anddenotes the application of Dempster’s rule of combination
(13) for all selected biometric subsystem outputs. Note thatwith missing observation will not participate in the Dempster’srule of combination. This operation is analogous to the sum rulein probability, i.e., (9).
This submission was provided by JR (see Table I).4) Discriminative Classifier Using Linear Logistic Regres-
sion: LR is defined as:
(17)
where
(18)
where ’s are elements in . The weight parameters areoptimized using gradient ascent to maximize the likelihood ofthe training data given the LR model [32]. It can be shown thatthe following relationship is true:
(19)
We shall introduce the Naive Bayes version of logistic re-gression. This can be done by replacing in (18) with , re-calling that represents the modality-dependent observation(which can be score alone, or score augmented with the qualitymeasures derived from the same modality). By using the NaiveBayes assumption, one can combine for of differentmodality in the following way:
(20)
The submission from UPM used a version of LR in a way thatincorporates the quality measures [33]. The fundamental idea isto design a device-dependent score-normalization strategy viaLR for each device. During inference, the acquisition device isinferred so that the score is normalized according to the inferreddevice. The resulting normalized match scores are combinedusing (20). In this context, the term in (20) contains only thescore and the quality measurement is not used.
The device-dependent normalization procedure is defined by
(21)
where is the function shown in (18) except that one suchfunction is created for each cluster of device-dependent quality
. Among all the possible states of (one such being associ-ated with a device), the chosen is selected so as to maximize
, the posterior probability of given the quality vector
The “UniS qfuse” submission [12] is based on the logisticregression shown in (17) except that the vector is a reducedsecond-order polynomial expansion between the score vector
and the quality measures , i.e., ,where is known as a tensor product whose output is a singlecolumn vector. According to this operator, each element inis multiplied with each element in . Note that the proposedmethod does not take into consideration nor
in order to keep the number of parameters to be estimatedsmall, while at the same time allowing the model to gauge theinteraction between scores and quality measures. The final inputto the logistic regression is . In so doing, onealso avoids the need to model the unnecessary interaction amongelements in and , i.e., , where are indexesof different subsystem outputs.
5) Error-Based Fusion Classifier: The submission byAMSL-BIO InvLW attempts to combine subsystem outputsbased on their authentication performance on the developmentset. The fusion score is constructed as a linear combination ofmatching scores, i.e.,
where is known as a score normalization proce-dure and is the weight associated to the th subsystem subjectto the constraint .
The following linear weight is used for each th subsystem[34]
if
otherwise
(22)
where and is the equal error rate (EER) ofthe th subsystem measured on the development score set. Thefirst condition ensures the subsystem whose weight is smallerthan (recalling that is the number of subsystems) willnot contribute to the final score because its output is consid-ered insufficiently useful. In order to deal with missing matching
Authorized licensed use limited to: Univ Autonoma de Madrid. Downloaded on December 14, 2009 at 10:56 from IEEE Xplore. Restrictions apply.
856 IEEE TRANSACTIONS ON INFORMATION FORENSICS AND SECURITY, VOL. 4, NO. 4, DECEMBER 2009
scores, mean values of impostor and genuine score distributionsare calculated. A missed score is replaced with the average ofthese two values.
6) UniS: Fixed Rule Quality Dependent Fusion Classifier:The subsystem outputs are divided into two groups: those ofhigher quality and those of lower quality. Let us denote thesetwo groups by and , where and
are indexes of the subsystem outputs. The ideais that one combines the groups of similar quality (high or low)using the sum rule whereas among the groups of different scoresusing the product rule. The justification is that scores of differentquality tend to disagree, implying higher independence and sothe product rule may be more effective in this case. Similarly,scores of similar quality (high or low) tend to agree with eachother, implying higher dependence and so the sum rule may bemore effective. The resulting combined scores can be written as:
if and
ifif .
(23)The last two cases take care of the situation where one group orthe other is not observed. A score is considered of high quality ifits corresponding quality measure is higher than , where
is a quality measure, is the average of and is itsstandard deviation.
In case of an array of quality measures, the quality measuresare normalized using the Min–Max normalization, and the av-erage is computed to represent the quality measure for a sample.
7) Other Classifiers: The list of classifiers covered here is notmeant to be exhaustive, but considers only the submitted sys-tems. Another submitted fusion classifier is CWI-SVM’s sup-port vector machine (SVM), a discussion of which can be foundin [35]. SVM has also been used elsewhere in the literature forbiometric fusion, e.g., [36]. Finally, a general survey of fusionclassifiers can be found in [1].
C. Sequential Fusion
Sequential fusion is a fusion strategy where the match scoresto be combined are considered sequentially, until a certain levelof confidence is reached, or all the match scores are exhausted.The motivation is that for most access attempts (samples), a veryfew match scores are needed to reach a high level of confidence.In contrast, samples that are classified with low confidence arethose that are found near the decision boundary and are neces-sarily sparse. Since significantly fewer number of match scoresare needed, on average, for each access attempt, the overall costis expected to be lower.
Among the submitted systems, only CWI-IMOFA andGET-2 (cost) adopt sequential fusion strategies. In both sys-tems, the training of the system remains the same. However,during testing, different strategies are used. Both rely on anupper and a lower threshold, corresponding to the desiredlevels of confidence to accept a client and to reject an impostor,respectively.
For the CWI-IMOFA method, the modalities are consideredin the following order: face, iris, fingerprint. The following de-cision strategies are adopted:
• If the face or the iris is present, do not take the fingerprintsinto account at all.
• If the posterior probability of observing a genuine user ishigher than the upper threshold, at any time, output thatprobability and do not consider the rest of the modalities.
• If the posterior probability of observing a genuine user islower than a percentage of the threshold (5% in the sub-mitted version), output that probability and do not considerthe rest of the modalities.
For the GET-2 systems, the following strategy was adopted.The face modality is used first. If a decision cannot be made,iris or fingerprint is then used depending on the face score andquality measures. Then, if a decision is not possible with thetwo match scores (and their associated quality measures), a thirdscore is used and so on until the eight scores (and their associ-ated quality measures) are exhausted [37].
III. BIOSECURE DS2 DATA SET AND REFERENCE SYSTEMS
A. BioSecure Database as a Test Bed
In order to realize the cost-sensitive and quality-based fusionevaluations mentioned in Section I-D, we constructed a data-base with scores as well as quality measures for each accessusing the BioSecure multimodal biometric database.1 Since theinput to all fusion algorithms is the same, they can be comparedon equal grounds. To date, there exists no similar test bed suit-able for quality-dependent fusion algorithms nor cost-sensitiveevaluation. A similar work in this direction is [21]. However, thematch scores were not supplemented by quality measures.
The BioSecure database was collected with the aim to inte-grate multidisciplinary research efforts in biometric-based iden-tity authentication. Application examples of such an investiga-tion are to meet the trust and security requirements for buildingaccess systems using a desktop-based or a mobile-based plat-form, as well as applications over the Internet such as tele-working and Web or remote-banking services. As far as data col-lection is concerned, three scenarios have been identified, eachsimulating the use of biometrics in remote-access authenticationvia the Internet (termed the “Internet” scenario), physical accesscontrol (the “desktop” scenario), and authentication via mobiledevices (the “mobile” scenario). While the desktop scenario isused here, the proposed two evaluation schemes can equally beapplied to the remaining two data sets.
The desktop scenario data set contains the following bio-metric modalities: signature, face, audio–video (PINs, digits,phrases), still face, iris, hand, and fingerprint. However, onlystill face, iris, and fingerprint are used for the evaluationschemes proposed here. This data set is collected from sixEuropean sites (only four are being used at the writing of thisreport). Although the data acquisition process is supervised, thelevel of supervision is extremely different from site to site.
This database contains two sessions of data separated byabout a one-month interval. In each session, for each subject,two biometric samples are acquired per modality per device,hence resulting in four samples per modality per device (andper person) over the two sessions. There are several devicesfor the same biometric modality. The forgery data collectedsimulate PIN-reply attacks and imitation of dynamic signature(with several minutes of practice and with the knowledge ofthe signature dynamics). The volunteers are selected to have
1Available: http://biometrics.it-sudparis.eu/BMEC2007
Authorized licensed use limited to: Univ Autonoma de Madrid. Downloaded on December 14, 2009 at 10:56 from IEEE Xplore. Restrictions apply.
POH et al.: BENCHMARKING QUALITY-DEPENDENT AND COST-SENSITIVE SCORE-LEVEL ALGORITHMS 857
TABLE IILIST OF 24 CHANNELS OF MATCH SCORES) GENERATED FROM THE BIOSECURE DS2 DATABASE
both genders in somewhat equal proportions of ages with thefollowing distribution: 2/3 in the range 18–40 of age and 1/3above 40.
Table II presents the 24 channels of data available. A channelof data is composed of the following quadruples: biometric trait,the acquisition device of a template, the acquisition device of aquery sample, and matching algorithm. When the acquisitiondevice used to prepare a template (during enrollment) is dif-ferent from the one used to acquire a query sample, the matchingis called cross-device matching, and the opposite is called same-device matching. There are 17 channels of data available underthe same-device matching. For example, a left index finger-print acquired using an optical fingerprint sensor is considereda channel of data. Using the notation presented in Table II, thischannel of data is referred to as “fo5.” The 17 channels of data,presented in order are , , , , , , ,
, , , , , , , , , and . These 17channels of data are all that is available to perform matching ofdata acquired using the same biometric device. The cross-devicematching can only be performed on the face biometric and thesix fingerprints (hence seven channels of data) because for eachof these channels of data, two devices were available. Thesechannels of data are prefixed with “x” (for “cross-device”). Weonly considered the scenario where the template data is acquiredwith a high-quality device whereas the query data is acquiredwith one of lower quality (post-determined by judging from theverification performance of the devices).
While there are 24 channels, we need only three referencesystems, corresponding to the three chosen biometric modali-ties, i.e., face, fingerprint, and iris. We also need three piecesof software to extract their respective quality measures directlyfrom the acquired images. Table III lists the reference systems ofthe three biometric modalities as well as their respective qualitymeasures.
Among the 14 quality measures extracted, six are face-relatedquality measures (hence relying on a face detector), i.e., facedetection reliability, spatial resolution between the eyes, pres-ence of glasses, rotation in plane, rotation in depth and degreeto which the face presentation is frontal. The remaining eightmeasures are general purpose image quality measures as definedby the MPEG standards. These quality measures were obtainedusing the Omniperception proprietary Affinity SDK.
TABLE IIIREFERENCE SYSTEMS AND QUALITY MEASURES ASSOCIATED WITH EACH TO
BIOMETRIC MODALITY
There is only a single fingerprint quality measure and it isbased on the implementation found in [41]. It is an averagefingerprint gradient computed over local image patches. Whentoo much pressure is applied during fingerprint acquisition, theresulting fingerprint image usually has low contrast. Conse-quently, a minutia-based fingerprint matcher (which is the casefor the NIST fingerprint system) is likely to under-perform withthis type of image. The converse is also true for high contrastand clear fingerprint images.
Three iris quality measures are used. The first one, i.e., texturerichness measure, is obtained by a weighted sum of the mag-nitudes of Mexican hat wavelet coefficients as implemented in[42]. The other two quality measures are functions of estimatediris and pupil circles. The first one is the difference betweeniris diameter and pupil diameter. If this difference is small, theiris area to be matched will be small, hence implying that thematch scores may not be reliable. The second measure is therelative proportion of the mask diminishing the usable iris areafor matching. A mask is needed to prevent matching on areascontaining eyelashes and specular lights, for instance. Unfortu-nately, due to bad iris segmentation, and possibly suboptimalthreshold to distinguish eyelashes from iris, our iris system isfar from the performance claimed for Daugman’s implementa-tion [43].
Authorized licensed use limited to: Univ Autonoma de Madrid. Downloaded on December 14, 2009 at 10:56 from IEEE Xplore. Restrictions apply.
858 IEEE TRANSACTIONS ON INFORMATION FORENSICS AND SECURITY, VOL. 4, NO. 4, DECEMBER 2009
IV. EVALUATION PROTOCOL
The objective of an evaluation protocol is to provide a meansto partition the development (or training) and the evaluation(test) data sets in such a way that fusion algorithms can be com-pared on equal grounds, avoiding optimistic performance biasof the test result.
The current release of the desktop scenario contains 333 per-sons. A newer version, yet to be released, contains some 500persons. For each person, four samples per channel of data areavailable. The first sample of the first session is used to builda biometric template. The second sample of the first session isused as a query to generate a genuine user match score of the firstsession whereas the two samples of the second session are usedin a similar way to generate two genuine user match scores. Atemplate is the data sample used to represent the claimed iden-tity whereas a query is the sample with which the template iscompared. The impostor scores are produced by comparing allfour samples originating from another population of persons ex-cluding the reference users.
It is important to distinguish two data sets, i.e., the develop-ment and the evaluation sets. The development set is used foralgorithm development, e.g., finding the optimal parameters ofan algorithm, including setting the global or client specific deci-sion threshold. An important distinction between the two sets isthat the population of users in these data sets are disjoint. Thisensures that the performance assessment is unbiased. There are51 genuine users in the development set and 156 in the evalua-tion set. These two sets of users constitute the 207 users avail-able in the database. The remaining 126 subjects are consideredas an external population of users who serve as zero-effort im-postors.
The development impostor score set consists of two score setsof equal size, each having 103 4 samples, i.e., 103 personsand each contributes 4 samples. These two score sets were usedin conjunction with the first- and second-session genuine matchscores, respectively. This design ensures that the impostors usedin Sessions 1 and 2 are not the same. For instance, when traininga fusion algorithm, Session 1 data can be used to learn the pa-rameters of the fusion classifier and Session 2 data can be usedas a validation data set. Such a characteristic is important for al-gorithm development.
The evaluation impostor score set also further consists of twodata sets, each having 51 and 126 subjects set apart as zero-effortimpostors, used for Session 1 and Session 2 data, respectively.Note that the 51 “impostor subjects” of the Session 1 evalua-tion set are actually genuine users in the development data set.This does not contribute any systematic bias when measuringthe performance because the genuine users are disjoint in boththe development and evaluation data set. The motivation forusing two different impostor populations in the evaluation datasets for Sessions 1 and 2 again is to avoid systematic and opti-mistic bias in assessing client-specific fusion classifiers trainedon the Session 1 data. Unlike the common fusion classifiers re-ported in the literature [1] (and references therein), client-spe-cific fusion classifiers adapt themselves to each genuine user orclaimed identity. Under our experimental design, these classi-fiers can further use the Session 1 evaluation data for trainingbut must use the Session 2 evaluation data for assessing the per-formance. Having two different sets of impostors will thus avoid
TABLE IVEXPERIMENTAL PROTOCOL FOLLOWED IN ORDER TO GENERATE
MATCH SCORES FROM THE BIOSECURE DS2 DATABASE.����� � Sessions 1 AND 2
the situation where a fusion classifier is tested on impostor dataon which it has already been trained to distinguish the impos-tors.
Table IV shows the partitioning of the genuine user and im-postor score sets of the development and evaluation data. Theexact number of accesses differs from that listed in this tablebecause of missing observations caused by the failure of thesegmentation process or other stages of the biometric authen-tication system. The experimental protocol involves minimalmanual intervention. In the event of any failure, a default scoreof “ 999” is outputted. Similarly, a failure to extract qualitymeasures will result in a vector containing a series of “ 999.”
Although the desktop scenario involves supervised data ac-quisition, the level of supervision differs from one collectionsite to another. As a result, there exists a site-dependent bias interms of performance and this bias is readily observable fromthe captured images for face and fingerprint biometrics.
In Sections IV-A–C, we shall explain the two evaluationschemes.
A. Cost-Sensitive Evaluation
The cost-sensitive evaluation was designed with two goals:1) to assess the robustness of a fusion algorithm when
some match scores and/or quality measures are notpresent; this is typically due to failure-to-acquire and/orfailure-to-match;
2) to test how well a fusion algorithm can perform with min-imal computation and hardware cost.
Note that a “cost” can also be associated with the time to ac-quire/process a biometric sample. Hence, longer time implieshigher cost, and vice versa.
Assigning a cost to a channel of data is a very subjective issue.In this study, we adopt the following rules of thumb:
1) If a device is used at least once, a fusion algorithm will becharged a unit cost, although we are aware that in reality,different devices may have different cost. This choice isclearly device and task dependent.
2) The subsequent use of the same device will be charged 0.3of a unit in view of the fact that the same hardware is beingreused.
3) A device is considered used if a fusion algorithm acquiresa sample for subsequent processing, i.e., to extract qualitymeasures and/or to obtain a match score. This is regard-less of whether the resulting match score will actually con-tribute to the final combined score.
Authorized licensed use limited to: Univ Autonoma de Madrid. Downloaded on December 14, 2009 at 10:56 from IEEE Xplore. Restrictions apply.
POH et al.: BENCHMARKING QUALITY-DEPENDENT AND COST-SENSITIVE SCORE-LEVEL ALGORITHMS 859
Through the cost-sensitive evaluation, the design of a fusionalgorithm becomes more challenging because the task now isto maximize the recognition performance while minimizing thecost associated to the device usage. In this respect, there existstwo strategies to solve this problem, which can be termed asa fixed parallel and a sequential approach. A fixed parallel so-lution preselects a set of channels and use them for all accessrequests. A sequential solution, on the other hand, may use dif-ferent channels for different access requests. The sequence ofsystems used is determined dynamically.
B. Cross-Device Quality-Dependent Evaluation
The goal of this evaluation experiment is to assess the abilityof a fusion algorithm to select the more reliable channels ofdata, given quality measures derived from biometric data. Thetask is made more challenging with cross-device matching, i.e.,a matching can occur between a biometric template acquiredusing one device and a query biometric data acquired using an-other device. In our case, the template data is always acquiredusing a high quality device (giving better verification perfor-mance) and the query data may be acquired using a high ora low-quality device. Note that cross device matching occursonly in the latter case. The channels of data considered are faceand the three right fingerprints, denoted as , , , and
. In case of cross device matching, these channels are de-noted as , , , and . The development set con-sisting of scores and quality measures corresponding to all eightchannels were distributed to the participants. The (sequestered)evaluation set, on the other hand, contains only four channels ofdata as a result of mixing (face taken with a digitalcamera/webcam) and for all (op-tical/thermal fingerprint sensor for three fingers; see descriptionin Table II). These four channels of data can be any of the fol-lowing combinations:
1) —no device mismatch;2) —device mismatch for the fin-
gerprint sensor;3) —device mismatch for the face
sensor;4) —device mismatch for both the
face and fingerprint sensors.A fusion algorithm does not know from which device a bio-metric sample was acquired since the identity of the device is un-known. This is a realistic scenario because as a biometric tech-nology is deployed, it may be replaced by a newer device. Fur-thermore, its configuration may change, resulting in its acquiredquery biometric data being significantly different from the pre-viously stored template data. This fusion problem is challengingbecause each of the four combinations require a different fusionstrategy in order to achieve the optimal result.
C. Simulation of Failure-to-Acquire and Failure-to-MatchScenarios
For each of the above-mentioned two evaluation schemes,we also introduce a variation of the problem in order to simu-late failure-to-acquire and failure-to-match scenarios. The mo-tivation is to evaluate the robustness of a multimodal biometricsystem with respect to both types of failures. In principal, a mul-timodal system contains redundant subsystems, each of whichproduces a hypothesis regarding the authenticity of an identity
claim. However, to our knowledge, such redundancy has neverbeen formally evaluated.
In order to simulate the failures, one can assume that theyare device- and subject-dependent; device- and subject-indepen-dent; device-dependent but subject-independent; and, device-in-dependent but subject-dependent. Among these four cases, weopted for the one that are both device- and subject-independent,i.e., the failures can happen randomly and spontaneously. This isactually a more difficult scenario among the four, as the failuresare completely unpredictable. If they were, one could devise thefollowing solutions: replace a particular device that is malfunc-tioning in the device-dependent case, or recommend a user touse a different biometric modality in the subject-dependent case.If a fusion algorithm can withstand our chosen scenario, the re-maining three scenarios can, therefore, be solved easily. Basedon this rationale, we shall focus on the device- and subject-in-dependent case.
We shall introduce missing values only on the evaluation dataset, and not the development data set. The reason is that the de-velopment data set is often better controlled. The missing valuesare introduced for each of the genuine or impostor match scoresseparately as follows: Let be a matrix of scores of sam-ples by dimensions (corresponding to all the columns ofmatch scores from devices: face, 6 fingers, and 1 iris). The totalnumber of elements in is . Missing values were grad-ually introduced by replacing observed values with “ 999”(the dummy value denoting missing value) in such a way thatall the elements in the matrix have equal probability of beingdeleted. We varied such that the ratio of was 10%,20%, 30%, and 40% and that the subsequent subset always con-tained missing values of its precedent subset.
V. EXPERIMENTAL RESULTS
Two types of errors can occur in biometric authentication:false acceptance and false rejection. Both errors are quantifiedby their respective error rates: false acceptance rate (FAR) andfalse rejection rate (FRR). These rates are obtained by countingthe respective event (false acceptance or rejection) for a giventhreshold. We use two derived indicators from these two mea-sures, namely, EER and half total error rate (HTER). EER isdefined as the operating point where FAR is equal to FRR, andthere is only one unique threshold (by means of interpolatingthe FAR and FRR curves, if necessary) satisfying this condi-tion. This rate is calculated by counting the number of false ac-ceptance (resp. false rejection) instances when the claimant isan impostor (resp. a genuine user/client/enrollee) normalized bythe total number of impostor (resp. client) accesses. HTER, onthe other hand, is the average of FAR and FRR. In all the eval-uations, the particular threshold leading to the reported HTERis supplied by the participants. This threshold was determinedby satisfying the EER constraint (FAR equals FRR) on the de-velopment data set. Hence, although a fusion system may have avery low EER, due to badly estimated threshold, its HTER valuecan still be relatively very high.
Sections V-A–C present the results of the two evaluationschemes.
A. Cost-Sensitive Evaluation
In the cost-sensitive evaluation, the submitted fusion systemscan be divided into three types: fixed static fusion, exhaustive
Authorized licensed use limited to: Univ Autonoma de Madrid. Downloaded on December 14, 2009 at 10:56 from IEEE Xplore. Restrictions apply.
860 IEEE TRANSACTIONS ON INFORMATION FORENSICS AND SECURITY, VOL. 4, NO. 4, DECEMBER 2009
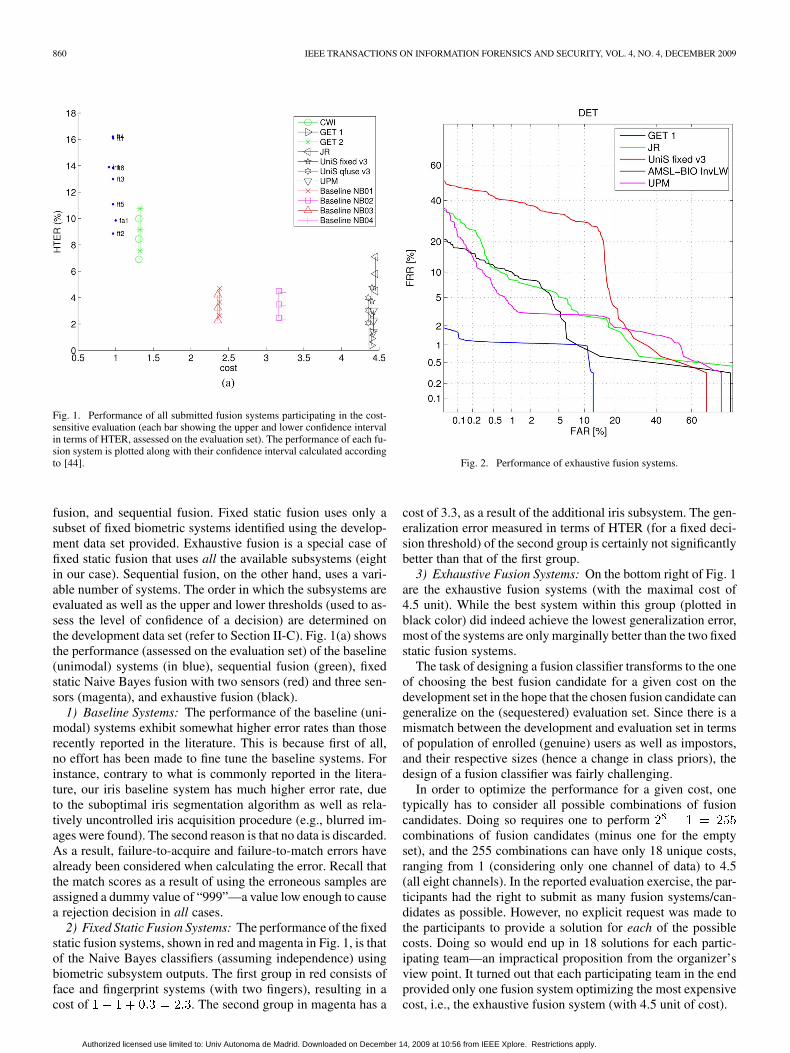
Fig. 1. Performance of all submitted fusion systems participating in the cost-sensitive evaluation (each bar showing the upper and lower confidence intervalin terms of HTER, assessed on the evaluation set). The performance of each fu-sion system is plotted along with their confidence interval calculated accordingto [44].
fusion, and sequential fusion. Fixed static fusion uses only asubset of fixed biometric systems identified using the develop-ment data set provided. Exhaustive fusion is a special case offixed static fusion that uses all the available subsystems (eightin our case). Sequential fusion, on the other hand, uses a vari-able number of systems. The order in which the subsystems areevaluated as well as the upper and lower thresholds (used to as-sess the level of confidence of a decision) are determined onthe development data set (refer to Section II-C). Fig. 1(a) showsthe performance (assessed on the evaluation set) of the baseline(unimodal) systems (in blue), sequential fusion (green), fixedstatic Naive Bayes fusion with two sensors (red) and three sen-sors (magenta), and exhaustive fusion (black).
1) Baseline Systems: The performance of the baseline (uni-modal) systems exhibit somewhat higher error rates than thoserecently reported in the literature. This is because first of all,no effort has been made to fine tune the baseline systems. Forinstance, contrary to what is commonly reported in the litera-ture, our iris baseline system has much higher error rate, dueto the suboptimal iris segmentation algorithm as well as rela-tively uncontrolled iris acquisition procedure (e.g., blurred im-ages were found). The second reason is that no data is discarded.As a result, failure-to-acquire and failure-to-match errors havealready been considered when calculating the error. Recall thatthe match scores as a result of using the erroneous samples areassigned a dummy value of “999”—a value low enough to causea rejection decision in all cases.
2) Fixed Static Fusion Systems: The performance of the fixedstatic fusion systems, shown in red and magenta in Fig. 1, is thatof the Naive Bayes classifiers (assuming independence) usingbiometric subsystem outputs. The first group in red consists offace and fingerprint systems (with two fingers), resulting in acost of . The second group in magenta has a
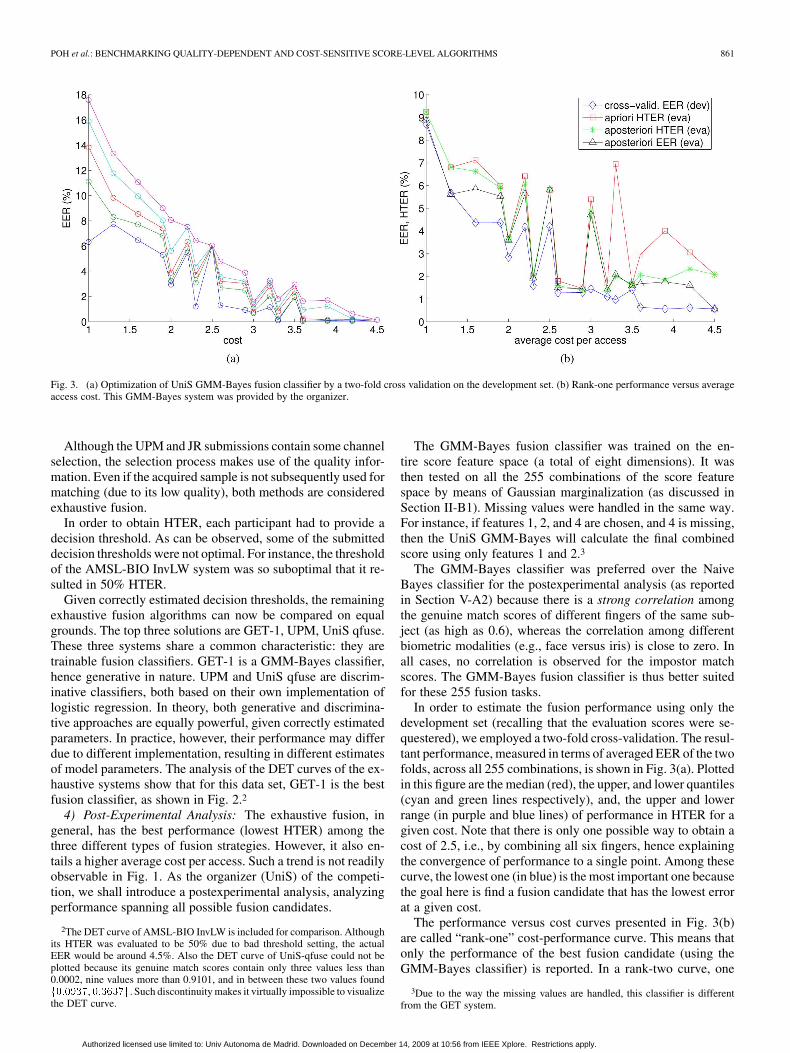
Fig. 2. Performance of exhaustive fusion systems.
cost of 3.3, as a result of the additional iris subsystem. The gen-eralization error measured in terms of HTER (for a fixed deci-sion threshold) of the second group is certainly not significantlybetter than that of the first group.
3) Exhaustive Fusion Systems: On the bottom right of Fig. 1are the exhaustive fusion systems (with the maximal cost of4.5 unit). While the best system within this group (plotted inblack color) did indeed achieve the lowest generalization error,most of the systems are only marginally better than the two fixedstatic fusion systems.
The task of designing a fusion classifier transforms to the oneof choosing the best fusion candidate for a given cost on thedevelopment set in the hope that the chosen fusion candidate cangeneralize on the (sequestered) evaluation set. Since there is amismatch between the development and evaluation set in termsof population of enrolled (genuine) users as well as impostors,and their respective sizes (hence a change in class priors), thedesign of a fusion classifier was fairly challenging.
In order to optimize the performance for a given cost, onetypically has to consider all possible combinations of fusioncandidates. Doing so requires one to performcombinations of fusion candidates (minus one for the emptyset), and the 255 combinations can have only 18 unique costs,ranging from 1 (considering only one channel of data) to 4.5(all eight channels). In the reported evaluation exercise, the par-ticipants had the right to submit as many fusion systems/can-didates as possible. However, no explicit request was made tothe participants to provide a solution for each of the possiblecosts. Doing so would end up in 18 solutions for each partic-ipating team—an impractical proposition from the organizer’sview point. It turned out that each participating team in the endprovided only one fusion system optimizing the most expensivecost, i.e., the exhaustive fusion system (with 4.5 unit of cost).
Authorized licensed use limited to: Univ Autonoma de Madrid. Downloaded on December 14, 2009 at 10:56 from IEEE Xplore. Restrictions apply.
POH et al.: BENCHMARKING QUALITY-DEPENDENT AND COST-SENSITIVE SCORE-LEVEL ALGORITHMS 861
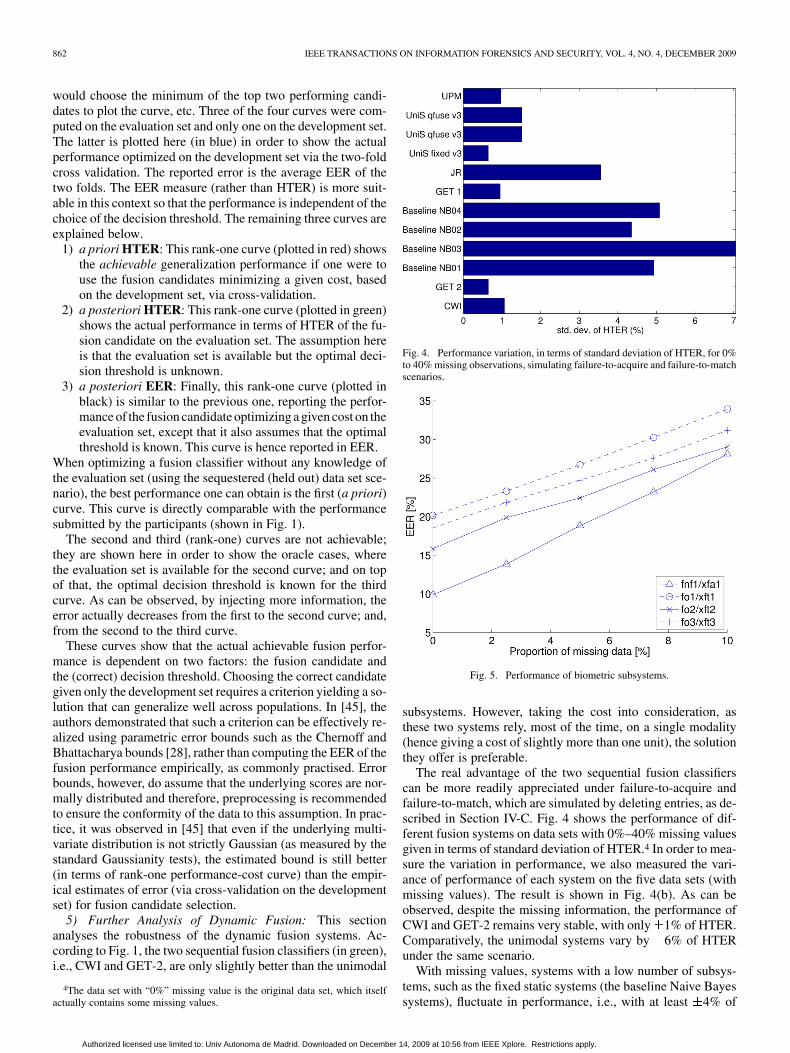
Fig. 3. (a) Optimization of UniS GMM-Bayes fusion classifier by a two-fold cross validation on the development set. (b) Rank-one performance versus averageaccess cost. This GMM-Bayes system was provided by the organizer.
Although the UPM and JR submissions contain some channelselection, the selection process makes use of the quality infor-mation. Even if the acquired sample is not subsequently used formatching (due to its low quality), both methods are consideredexhaustive fusion.
In order to obtain HTER, each participant had to provide adecision threshold. As can be observed, some of the submitteddecision thresholds were not optimal. For instance, the thresholdof the AMSL-BIO InvLW system was so suboptimal that it re-sulted in 50% HTER.
Given correctly estimated decision thresholds, the remainingexhaustive fusion algorithms can now be compared on equalgrounds. The top three solutions are GET-1, UPM, UniS qfuse.These three systems share a common characteristic: they aretrainable fusion classifiers. GET-1 is a GMM-Bayes classifier,hence generative in nature. UPM and UniS qfuse are discrim-inative classifiers, both based on their own implementation oflogistic regression. In theory, both generative and discrimina-tive approaches are equally powerful, given correctly estimatedparameters. In practice, however, their performance may differdue to different implementation, resulting in different estimatesof model parameters. The analysis of the DET curves of the ex-haustive systems show that for this data set, GET-1 is the bestfusion classifier, as shown in Fig. 2.2
4) Post-Experimental Analysis: The exhaustive fusion, ingeneral, has the best performance (lowest HTER) among thethree different types of fusion strategies. However, it also en-tails a higher average cost per access. Such a trend is not readilyobservable in Fig. 1. As the organizer (UniS) of the competi-tion, we shall introduce a postexperimental analysis, analyzingperformance spanning all possible fusion candidates.
2The DET curve of AMSL-BIO InvLW is included for comparison. Althoughits HTER was evaluated to be 50% due to bad threshold setting, the actualEER would be around 4.5%. Also the DET curve of UniS-qfuse could not beplotted because its genuine match scores contain only three values less than0.0002, nine values more than 0.9101, and in between these two values found�������� �������. Such discontinuity makes it virtually impossible to visualizethe DET curve.
The GMM-Bayes fusion classifier was trained on the en-tire score feature space (a total of eight dimensions). It wasthen tested on all the 255 combinations of the score featurespace by means of Gaussian marginalization (as discussed inSection II-B1). Missing values were handled in the same way.For instance, if features 1, 2, and 4 are chosen, and 4 is missing,then the UniS GMM-Bayes will calculate the final combinedscore using only features 1 and 2.3
The GMM-Bayes classifier was preferred over the NaiveBayes classifier for the postexperimental analysis (as reportedin Section V-A2) because there is a strong correlation amongthe genuine match scores of different fingers of the same sub-ject (as high as 0.6), whereas the correlation among differentbiometric modalities (e.g., face versus iris) is close to zero. Inall cases, no correlation is observed for the impostor matchscores. The GMM-Bayes fusion classifier is thus better suitedfor these 255 fusion tasks.
In order to estimate the fusion performance using only thedevelopment set (recalling that the evaluation scores were se-questered), we employed a two-fold cross-validation. The resul-tant performance, measured in terms of averaged EER of the twofolds, across all 255 combinations, is shown in Fig. 3(a). Plottedin this figure are the median (red), the upper, and lower quantiles(cyan and green lines respectively), and, the upper and lowerrange (in purple and blue lines) of performance in HTER for agiven cost. Note that there is only one possible way to obtain acost of 2.5, i.e., by combining all six fingers, hence explainingthe convergence of performance to a single point. Among thesecurve, the lowest one (in blue) is the most important one becausethe goal here is find a fusion candidate that has the lowest errorat a given cost.
The performance versus cost curves presented in Fig. 3(b)are called “rank-one” cost-performance curve. This means thatonly the performance of the best fusion candidate (using theGMM-Bayes classifier) is reported. In a rank-two curve, one
3Due to the way the missing values are handled, this classifier is differentfrom the GET system.
Authorized licensed use limited to: Univ Autonoma de Madrid. Downloaded on December 14, 2009 at 10:56 from IEEE Xplore. Restrictions apply.
862 IEEE TRANSACTIONS ON INFORMATION FORENSICS AND SECURITY, VOL. 4, NO. 4, DECEMBER 2009
would choose the minimum of the top two performing candi-dates to plot the curve, etc. Three of the four curves were com-puted on the evaluation set and only one on the development set.The latter is plotted here (in blue) in order to show the actualperformance optimized on the development set via the two-foldcross validation. The reported error is the average EER of thetwo folds. The EER measure (rather than HTER) is more suit-able in this context so that the performance is independent of thechoice of the decision threshold. The remaining three curves areexplained below.
1) a priori HTER: This rank-one curve (plotted in red) showsthe achievable generalization performance if one were touse the fusion candidates minimizing a given cost, basedon the development set, via cross-validation.
2) a posteriori HTER: This rank-one curve (plotted in green)shows the actual performance in terms of HTER of the fu-sion candidate on the evaluation set. The assumption hereis that the evaluation set is available but the optimal deci-sion threshold is unknown.
3) a posteriori EER: Finally, this rank-one curve (plotted inblack) is similar to the previous one, reporting the perfor-mance of the fusion candidate optimizing a given cost on theevaluation set, except that it also assumes that the optimalthreshold is known. This curve is hence reported in EER.
When optimizing a fusion classifier without any knowledge ofthe evaluation set (using the sequestered (held out) data set sce-nario), the best performance one can obtain is the first (a priori)curve. This curve is directly comparable with the performancesubmitted by the participants (shown in Fig. 1).
The second and third (rank-one) curves are not achievable;they are shown here in order to show the oracle cases, wherethe evaluation set is available for the second curve; and on topof that, the optimal decision threshold is known for the thirdcurve. As can be observed, by injecting more information, theerror actually decreases from the first to the second curve; and,from the second to the third curve.
These curves show that the actual achievable fusion perfor-mance is dependent on two factors: the fusion candidate andthe (correct) decision threshold. Choosing the correct candidategiven only the development set requires a criterion yielding a so-lution that can generalize well across populations. In [45], theauthors demonstrated that such a criterion can be effectively re-alized using parametric error bounds such as the Chernoff andBhattacharya bounds [28], rather than computing the EER of thefusion performance empirically, as commonly practised. Errorbounds, however, do assume that the underlying scores are nor-mally distributed and therefore, preprocessing is recommendedto ensure the conformity of the data to this assumption. In prac-tice, it was observed in [45] that even if the underlying multi-variate distribution is not strictly Gaussian (as measured by thestandard Gaussianity tests), the estimated bound is still better(in terms of rank-one performance-cost curve) than the empir-ical estimates of error (via cross-validation on the developmentset) for fusion candidate selection.
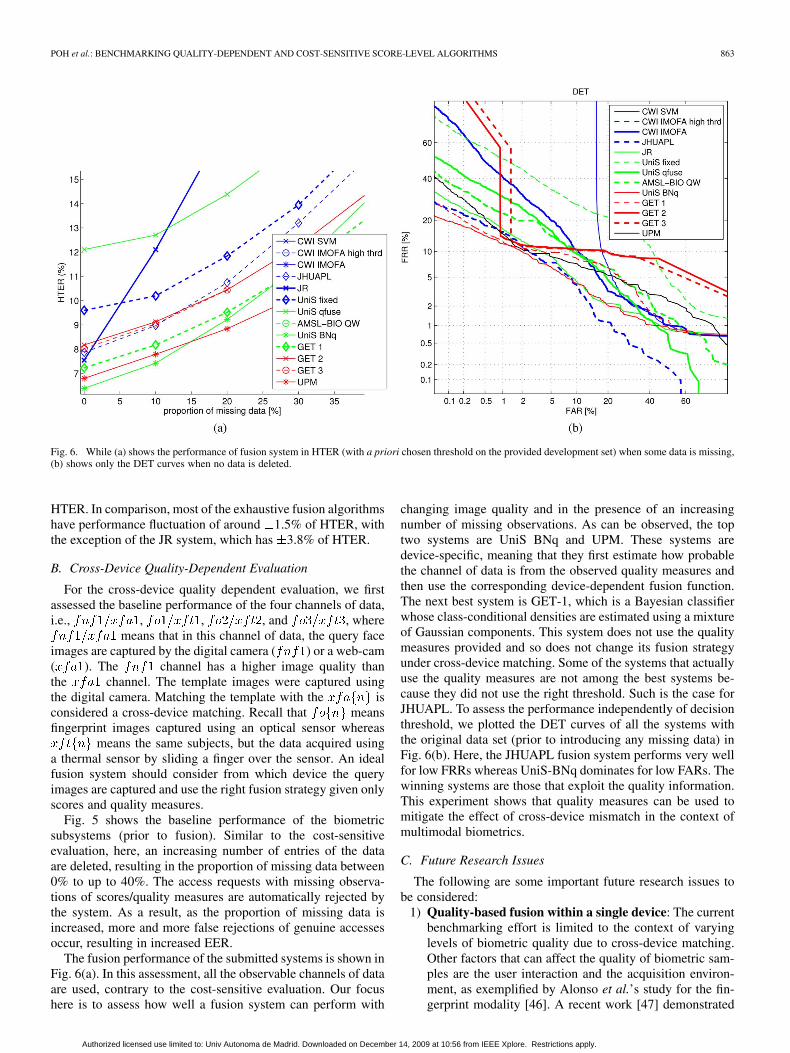
5) Further Analysis of Dynamic Fusion: This sectionanalyses the robustness of the dynamic fusion systems. Ac-cording to Fig. 1, the two sequential fusion classifiers (in green),i.e., CWI and GET-2, are only slightly better than the unimodal
4The data set with “0%” missing value is the original data set, which itselfactually contains some missing values.
Fig. 4. Performance variation, in terms of standard deviation of HTER, for 0%to 40% missing observations, simulating failure-to-acquire and failure-to-matchscenarios.
Fig. 5. Performance of biometric subsystems.
subsystems. However, taking the cost into consideration, asthese two systems rely, most of the time, on a single modality(hence giving a cost of slightly more than one unit), the solutionthey offer is preferable.
The real advantage of the two sequential fusion classifierscan be more readily appreciated under failure-to-acquire andfailure-to-match, which are simulated by deleting entries, as de-scribed in Section IV-C. Fig. 4 shows the performance of dif-ferent fusion systems on data sets with 0%–40% missing valuesgiven in terms of standard deviation of HTER.4 In order to mea-sure the variation in performance, we also measured the vari-ance of performance of each system on the five data sets (withmissing values). The result is shown in Fig. 4(b). As can beobserved, despite the missing information, the performance ofCWI and GET-2 remains very stable, with only 1% of HTER.Comparatively, the unimodal systems vary by 6% of HTERunder the same scenario.
With missing values, systems with a low number of subsys-tems, such as the fixed static systems (the baseline Naive Bayessystems), fluctuate in performance, i.e., with at least 4% of
Authorized licensed use limited to: Univ Autonoma de Madrid. Downloaded on December 14, 2009 at 10:56 from IEEE Xplore. Restrictions apply.
POH et al.: BENCHMARKING QUALITY-DEPENDENT AND COST-SENSITIVE SCORE-LEVEL ALGORITHMS 863
Fig. 6. While (a) shows the performance of fusion system in HTER (with a priori chosen threshold on the provided development set) when some data is missing,(b) shows only the DET curves when no data is deleted.
HTER. In comparison, most of the exhaustive fusion algorithmshave performance fluctuation of around 1.5% of HTER, withthe exception of the JR system, which has 3.8% of HTER.
B. Cross-Device Quality-Dependent Evaluation
For the cross-device quality dependent evaluation, we firstassessed the baseline performance of the four channels of data,i.e., , , , and , where
means that in this channel of data, the query faceimages are captured by the digital camera ( ) or a web-cam( ). The channel has a higher image quality thanthe channel. The template images were captured usingthe digital camera. Matching the template with the isconsidered a cross-device matching. Recall that meansfingerprint images captured using an optical sensor whereas
means the same subjects, but the data acquired usinga thermal sensor by sliding a finger over the sensor. An idealfusion system should consider from which device the queryimages are captured and use the right fusion strategy given onlyscores and quality measures.
Fig. 5 shows the baseline performance of the biometricsubsystems (prior to fusion). Similar to the cost-sensitiveevaluation, here, an increasing number of entries of the dataare deleted, resulting in the proportion of missing data between0% to up to 40%. The access requests with missing observa-tions of scores/quality measures are automatically rejected bythe system. As a result, as the proportion of missing data isincreased, more and more false rejections of genuine accessesoccur, resulting in increased EER.
The fusion performance of the submitted systems is shown inFig. 6(a). In this assessment, all the observable channels of dataare used, contrary to the cost-sensitive evaluation. Our focushere is to assess how well a fusion system can perform with
changing image quality and in the presence of an increasingnumber of missing observations. As can be observed, the toptwo systems are UniS BNq and UPM. These systems aredevice-specific, meaning that they first estimate how probablethe channel of data is from the observed quality measures andthen use the corresponding device-dependent fusion function.The next best system is GET-1, which is a Bayesian classifierwhose class-conditional densities are estimated using a mixtureof Gaussian components. This system does not use the qualitymeasures provided and so does not change its fusion strategyunder cross-device matching. Some of the systems that actuallyuse the quality measures are not among the best systems be-cause they did not use the right threshold. Such is the case forJHUAPL. To assess the performance independently of decisionthreshold, we plotted the DET curves of all the systems withthe original data set (prior to introducing any missing data) inFig. 6(b). Here, the JHUAPL fusion system performs very wellfor low FRRs whereas UniS-BNq dominates for low FARs. Thewinning systems are those that exploit the quality information.This experiment shows that quality measures can be used tomitigate the effect of cross-device mismatch in the context ofmultimodal biometrics.
C. Future Research Issues
The following are some important future research issues tobe considered:
1) Quality-based fusion within a single device: The currentbenchmarking effort is limited to the context of varyinglevels of biometric quality due to cross-device matching.Other factors that can affect the quality of biometric sam-ples are the user interaction and the acquisition environ-ment, as exemplified by Alonso et al.’s study for the fin-gerprint modality [46]. A recent work [47] demonstrated
Authorized licensed use limited to: Univ Autonoma de Madrid. Downloaded on December 14, 2009 at 10:56 from IEEE Xplore. Restrictions apply.
864 IEEE TRANSACTIONS ON INFORMATION FORENSICS AND SECURITY, VOL. 4, NO. 4, DECEMBER 2009
that, indeed, exploiting the quality variation within a singledevice, as well as the variation between devices can im-prove the generalization performance under cross devicematching much more significantly
2) More quality measures: The current data set is limited inthe number of quality measures available. A direct exten-sion is to introduce more quality measures, especially thefingerprint ones, e.g., [46]
3) Sequential fusion: The potential of sequential fusion hasnot been fully explored. The current strategy to select thenext most informative fusion candidate is very heuristic.Furthermore, a principled method for the selection of theupper and lower thresholds (determined by the level of de-sired confidence) is also needed.
VI. CONCLUSION
The BioSecure DS2 multimodal evaluation campaign aimedat assessing fusion algorithms under restricted computationalresources, possible hardware failures, and changing imagequality. For the purpose of evaluation, a data set consistingof match scores and quality measures was carefully designedin order to benchmark multimodal fusion algorithms. Thisdata set was constructed for the application of physical accesscontrol of a medium-sized establishment (from some 300 to500 users). This campaign gathered 22 fusion algorithms, allevaluated using the same generated data set. The evaluatedfusion algorithms are very diverse, including generative clas-sifiers, e.g., Bayesian belief network, Bayesian classifiers, andDempster–Shafer theory of evidence; discriminative classifiers,e.g., SVMs and logistic regression; and transformation-basedclassifier combiners (where biometric subsystem outputs arenormalized individually and then combined using fixed fusionrules such as sum or product).
Our findings suggest that, while using all the available bio-metric sensors can definitely increase the fusion performance,such benefit comes at the expense of acquisition time, compu-tation time, and the cost associated with installing the physicalhardware and its maintenance cost. A promising solution whichdoes not increase this compounded cost is sequential fusion, asdemonstrated in our experiments. A sequential fusion strategyonly outputs the final combined match score as soon as suffi-cient confidence is attained, or when all the match scores avail-able are exhausted. It saves computational cost because for mostaccess requests, only a few biometric subsystems are needed. Inthe presence of changing image quality, which may be due tochange of acquisition devices and/or device capturing configu-rations, we observe that the top performing fusion algorithmsare those that exploit the automatically extracted biometric traitquality measures in order to identify the most probable bio-metric device from which the query biometric data was derived.
REFERENCES
[1] A. Ross, K. Nandakumar, and A. K. Jain, Handbook of Multibiomet-rics. New York: Springer Verlag, 2006.
[2] C. Sanderson, “Automatic Person Verification Using Speech and FaceInformation,” Ph.D. thesis, Griffith University, Queensland, Australia,2002.
[3] K. Nandakumar, “Integration of M]ultiple Cues in Biometric Systems,”Ph.D. thesis, Michigan State University, East Lansing, MI, 2005.
[4] E. S. Bigun, J. Bigun, B. Duc, and S. Fischer, “Expert conciliation formultimodal person authentication systems using Bayesian statistics,” in1st Int. Conf. Audio- and Video-Based Biometric Person Authentication(AVBPA 1997), Crans-Montana, 1997, pp. 291–300.
[5] J. Bigun, J. Fierrez-Aguilar, J. Ortega-Garcia, and J. Gonzalez-Ro-driguez, “Multimodal biometric authentication using quality signals inmobile communnications,” in 12th Int. Conf. Image Analysis and Pro-cessing, Mantova, 2003, pp. 2–13.
[6] J. Fierrez-Aguilar, J. Ortega-Garcia, J. Gonzalez-Rodriguez, and J.Bigun, “Discriminative multimodal biometric authentication basedon quality measures,” Pattern Recognit., vol. 38, no. 5, pp. 777–779,2005.
[7] H. Fronthaler, K. Kollreider, J. Bigun, J. Fierrez, F. Alonso-Fer-nandez, J. Ortega-Garcia, and J. Gonzalez-Rodriguez, “Fingerprintimage-quality estimation and its application to multialgorithm verifi-cation,” IEEE Trans. Inf. Forensics Security, vol. 3, no. 2, pp. 331–338,Jun. 2008.
[8] S. Bengio, C. Marcel, S. Marcel, and J. Mariéthoz, “Confidence mea-sures for multimodal identity verification,” Inf. Fusion, vol. 3, no. 4,pp. 267–276, 2002.
[9] N. Poh and S. Bengio, “Improving fusion with margin-derived confi-dence in biometric authentication tasks,” in LNCS 3546, 5th Int. Conf.Audio- and Video-Based Biometric Person Authentication (AVBPA2005), New York, 2005, pp. 474–483.
[10] V. Chatzis, A. G. Bors, and I. Pitas, “Multimodal decision-level fusionfor person authentication,” IEEE Trans. Syst., Man, Cybern. A, Syst.Humans, vol. 29, no. 6, pp. 674–680, Nov. 1999.
[11] K.-A. Toh, W.-Y. Yau, E. Lim, L. Chen, and C.-H. Ng, “Fusion of aux-iliary information for multimodal biometric authentication,” in LNCS3072, Int. Conf. Biometric Authentication (ICBA), Hong Kong, 2004,pp. 678–685.
[12] J. Kittler, N. Poh, O. Fatukasi, K. Messer, K. Kryszczuk, and J. R. Dry-gajlo, “Quality dependent fusion of intramodal and multimodal bio-metric experts,” in Proc. SPIE Defense and Security Symp., Workshopon Biometric Technology for Human Identification, 2007, vol. 6539,pp. 653903.1–653903.14.
[13] K. Kryszczuk and A. Drygajlo, “Credence estimation and error pre-diction in biometric identity verification,” Signal Process., vol. 88, pp.916–925, 2008.
[14] D. E. Maurer and J. P. Baker, “Fusing multimodal biometrics withquality estimates via a Bayesian belief network,” Pattern Recognit., vol.41, no. 3, pp. 821–832, 2007.
[15] K. Nandakumar, Y. Chen, S. C. Dass, and A. K. Jain, “Likelihood ratio-based biometric score fusion,” IEEE Trans. Pattern Anal. Mach. Intell.,vol. 30, no. 2, pp. 342–347, Feb. 2008.
[16] N. Poh, G. Heusch, and J. Kittler, “On combination of face authen-tication experts by a mixture of quality dependent fusion classifiers,”in LNCS 4472, Multiple Classifiers System (MCS), Prague, 2007, pp.344–356.
[17] N. Poh and S. Bengio, “Non-linear variance reduction techniques inbiometric authentication,” in Workshop on Multimodal User Authenti-cation (MMUA 2003), Santa Barbara, CA, 2003, pp. 123–130.
[18] R. Snelick, U. Uludag, A. Mink, M. Indovina, and A. Jain, “Largescale evaluation of multimodal biometric authentication using state-of-the-art systems,” IEEE Trans. Pattern Anal. Mach. Intell., vol. 27, no.3, pp. 450–455, Mar. 2005.
[19] A. Jain and A. Ross, “Learning user-specific parameters in multibio-metric system,” in Proc. Int. Conf. Image Processing (ICIP 2002), NewYork, 2002, pp. 57–70.
[20] N. Poh and J. Kittler, “Incorporating model-specific score distributionin speaker verification systems,” IEEE Trans. Audio, Speech LanguageProcess., vol. 16, no. 3, pp. 594–606, Mar. 2008.
[21] N. Poh and S. Bengio, “Database, protocol and tools for evaluatingscore-level fusion algorithms in biometric authentication,” PatternRecognit., vol. 39, no. 2, pp. 223–233, Feb. 2005.
[22] A. Jain, K. Nandakumar, and A. Ross, “Score normalisation in mul-timodal biometric systems,” Pattern Recognit., vol. 38, no. 12, pp.2270–2285, 2005.
[23] J. Kittler, M. Hatef, R. P. W. Duin, and J. Matas, “On combining clas-sifiers,” IEEE Trans. Pattern Anal. Mach. Intell., vol. 20, no. 3, pp.226–239, Mar. 1998.
[24] N. Poh and S. Bengio, “How do correlation and variance of base-ex-perts affect fusion in biometric authentication tasks?,” IEEE Trans.Signal Process., vol. 53, no. 11, pp. 4384–4396, Nov. 2005.
[25] C. Bishop, Neural Networks for Pattern Recognition. London, U.K.:Oxford Univ. Press, 1999.
Authorized licensed use limited to: Univ Autonoma de Madrid. Downloaded on December 14, 2009 at 10:56 from IEEE Xplore. Restrictions apply.
POH et al.: BENCHMARKING QUALITY-DEPENDENT AND COST-SENSITIVE SCORE-LEVEL ALGORITHMS 865
[26] A. A. Salah and E. Alpaydın, “Incremental mixtures of factor analy-sers,” in Proc. 17th Int. Conf. Pattern Recognition (ICPR’04), 2004,vol. 1–01, pp. 276–279.
[27] A. C. Morris, M. P. Cooke, and P. D. Green, “Some solutions tothe missing features problem in data classification with applicationto noise robust automatic speech recognition,” in IEEE Int. Conf.Acoustics, Speech, and Signal Processing (ICASSP), Seattle, WA,1998, pp. 737–740.
[28] R. O. Duda, P. E. Hart, and D. G. Stork, Pattern Classification andScene Analysis. New York: Wiley, 2001.
[29] S. Dass, K. Nandakumar, and A. Jain, “A principled approach to scorelevel fusion in multimodal biometric systems,” in 5th Int. Conf. Audio-and Video-Based Biometric Person Authentication (AVBPA 2005), NewYork, 2005, pp. 1049–1058.
[30] N. Poh, T. Bourlai, and J. Kittler, “Improving biometric device inter-operability by likelihood ratio-based quality dependent score normal-ization,” in IEEE Conf. Biometrics: Theory, Applications and Systems,Washington, D.C., 2007, pp. 1–5.
[31] A. P. Dempster, “A generalization of Bayesian inference,” J. RoyalStatist. Soc., ser. B, vol. 30, pp. 205–247, 1968.
[32] A. J. Dobson, An Introduction to Generalized Linear Models. BocaRaton, FL: CRC Press, 1990.
[33] F. Alonso-Fernandez, J. Fierrez, D. Ramos, and J. Ortega-Garcia,“Dealing with sensor interoperability in multi-biometrics: The UPMexperience at the biosecure multimodal evaluation 2007,” in Proc.SPIE 6944, 2008, DOI: 10.1117/12.779676, 69440J.
[34] T. Scheidat, C. Vielhauer, and J. Dittmann, “Distance-level fusionstrategies for online signature verification,” in Proc. IEEE Int. Conf.Multimedia and Expo (ICME), 2005, vol. 0, pp. 1294–1297, ISBN:0-7803-9331-7.
[35] V. N. Vapnik, Statistical Learning Theory. Springer: New York,1998.
[36] M. Vatsa, R. Singh, A. Ross, and A. Noore, “Likelihood ratio in a SVMframework: Fusing linear and non-linear face classifiers,” in IEEEComputer Society Conf. Computer Vision and Pattern RecognitionWorkshops, 2008 (CVPRW ’08) , Jun. 2008, pp. 1–6.
[37] L. Allano, A. C. Morris, H. Sellahewa, S. Garcia-Salicetti, J. S. J. Ko-reman, B. Ly-Van, D. Wu, and B. Dorizzi, “Non intrusive multi-bio-metrics on a mobile device: A comparison of fusion techniques,” inProc. SPIE: Biometric Techniques for Human Identification III, 2006.
[38] L. Allano, S. Garcia-Salicetti, and B. Dorizzi, “An adaptive multi-bio-metric incremental fusion strategy in the context of BMEC 2007,” inICARCV, 2008.
[39] O. Fatukasi, J. Kittler, and N. Poh, “Quality controlled multimodal fu-sion of biometric experts,” in 12th Iberoamerican Congress on Pat-tern Recognition CIARP, Viña del Mar-Valparaiso, Chile, 2007, pp.881–890.
[40] T. Hastie, R. Tibshirani, and J. Friedman, The Elements of StatisticalLearning. New York: Springer-Verlag, 2001.
[41] Y. Chen, S. C. Dass, and A. K. Jain, “Fingerprint quality indexes forpredicting authentication performance,” in LNCS 3546, 5th Int. Conf.Audio- and Video-Based Biometric Person Authentication (AVBPA2005), New York, 2005, pp. 160–170.
[42] Y. Chen, S. Dass, and A. Jain, “Localized iris image quality using 2-Dwavelets,” in Proc. Int. Conf. Biometrics (ICB), Hong Kong, 2006, pp.373–381.
[43] J. Daugman, How Iris Recognition Works. Norwell, MA: Kluwer,1999, ch. 6.
[44] S. Bengio and J. Marithoz, “The expected performance curve: Anew assessment measure for person authentication,” in The Speakerand Language Recognition Workshop (Odyssey), Toledo, 2004, pp.279–284.
[45] N. Poh and J. Kittler, “On using error bounds to optimize cost-sensitivemultimodal biometric authentication,” in Proc. 19th Int. Conf. PatternRecognition (ICPR), Tampa, FL, 2008, pp. 1–4 [Online]. Available:http://ieeexplore.ieee.org/xpl/freeabs_all.jsp?arnumber=4761115
[46] F. Alonso-Fernandez, J. Fierrez, J. Ortega-Garcia, J. Gonzalez-Ro-driguez, H. Fronthaler, K. Kollreider, and J. Bigun, “A comparativestudy of fingerprint image-quality estimation methods,” IEEE Trans.Inf. Forensics Security, vol. 2, no. 4, pp. 734–743, Dec. 2007.
[47] N. Poh and J. Kittler, “A family of methods for quality-based mul-timodal biometric fusion using generative classifiers,” in IEEE 10thInt. Conf. Control, Automation, Robotics and Vision (ICARCV), Hanoi,2008.
Norman Poh received the Ph.D. degree in computerscience from the Swiss Federal Institute of Tech-nology in Lausanne (EPFL), Switzerland, in 2006.
He benefitted from two successive personalresearch funding grants from the Swiss NSF(2006–2010) to investigate adaptive learning ofmultiple classifier systems at the Centre of Vision,Speech and Signal Processing (CVSSP), Universityof Surrey (UniS). He is also a work-package leader inthe EU-funded Mobile Biometry (MOBIO) projectat UniS.
Thirimachos Bourlai received the Ph.D. degreein electrical and computer engineering from theUniversity of Surrey, U.K., in 2006. There he con-tinued working with Prof. J. Kittler as a postdoctoralresearcher until August 2007.
He then worked as a Research Fellow in a jointproject between the University of Houston and theMethodist Hospital, TX. Since February 2009 he is aVisiting Research Assistant Professor at the Biomet-rics Center, West Virginia University. His areas of ex-pertise are image processing, pattern recognition, and
biometrics.
Josef Kittler graduated from the University of Cam-bridge in electrical engineering in 1971, where healso received the Ph.D. degree in pattern recognition,in 1974, and the Sc.D. degree, in 1991.
Since 1986, he is a Professor in charge of theCentre for Vision Speech and Signal Processing,University of Surrey, U.K. He published more than200 papers, coauthored a book, and is a memberof the Editorial Boards of various IEEE Transac-tions. His current research interests include patternrecognition, neural networks, image processing, and
computer vision.
Lorene Allano received the Ph.D. degree in com-puter science from the Institut National des Télécom-munications, France, in 2009, for her work on multi-biometrics.
She then moved to Commissariatà L’énergieAtomique, France (CEA) within the LaboratoireIntelligence Multi-capteurs et Apprentissage (LIMALaboratory). Her areas of expertise are multipleclassifier systems, pattern recognition, data mining,and biometrics.
Fernando Alonso-Fernandez received the M.S.degree (with distinction) and the Ph.D. degree (cumlaude), both in electrical engineering, from theUniversidad Politecnica de Madrid (UPM), Spain, in2003 and 2008, respectively.
He is currently the recipient of a Juan de la Ciervapostdoctoral fellowship of the Spanish Ministry ofInnovation and Science. He has published severaljournal and conference papers and he is activelyinvolved in European projects focused on biometrics.He has participated in the development of several
systems for a number of biometric evaluations and he has been an invitedresearcher in several research laboratories across Europe.
Authorized licensed use limited to: Univ Autonoma de Madrid. Downloaded on December 14, 2009 at 10:56 from IEEE Xplore. Restrictions apply.
866 IEEE TRANSACTIONS ON INFORMATION FORENSICS AND SECURITY, VOL. 4, NO. 4, DECEMBER 2009
Onkar Ambekar received the B.E. degree in instru-mentation from B.A.M. University, India, in 2000,and the M.S. degree in sensor system technologyfrom the University of Applied Sciences in Karl-sruhe, Germany, in 2004. He is currently workingtoward the Ph.D. degree at the CWI Institute inAmsterdam.
He has worked in Germany and Austria on objectdetection and tracking for vehicle guidance, andholds a patent in this area.
John Baker received the M.S.E.E. degree from Johns Hopkins University in1994.
He is a member of the Johns Hopkins University Applied Physics Labora-tory, where he is engaged in research and development of biometric sensing andfusion methods.
Bernadette Dorizzi received the Ph.D. degree(Thèse d’état) in theoretical physics from the Uni-versity of Orsay (Paris XI-France) in 1983.
She is Professor at TELECOM & ManagementSudParis (Institut TELECOM) since September1989, and head of the Electronics and PhysicsDepartment since 1995, where she is in charge ofthe Intermedia (Interaction for Multimedia) researchteam. She is coordinator of the BioSecure Associa-tion.
Omolara Fatukasi received the Ph.D. degree in electrical and computer engi-neering from the University of Surrey, U.K.
Her areas of expertise are in multimodal biometric fusion and pattern recog-nition.
Julian Fierrez received the Ph.D. degree in telecom-munications engineering from the Universidad Po-litecnica de Madrid, Spain, in 2006.
Since 2002, he is affiliated with Universidad Au-tonoma de Madrid in Spain, where he currently holdsa Marie Curie Postdoctoral Fellowship, part of whichhas been spent as a visiting researcher at MichiganState University in the U.S.
Harald Ganster received the Ph.D. degree with dis-tinction in technical mathematics from the Universityof Technology Graz, Austria, in 1999.
He is currently with the Institute of Digital ImageProcessing at Joanneum Research in Graz and is re-sponsible for the field of biometrics.
Javier Ortega-Garcia received the Ph.D. degree(cum laude) in electrical engineering from Univer-sidad Politecnica de Madrid, Spain, in 1996.
He is founder and codirector of the BiometricRecognition Group—ATVS. He is currently aFull Professor at the Escuela Politecnica Superior,Universidad Autonoma de Madrid. His researchinterests are focused on biometrics signal processing.He has published over 150 international contribu-tions, including book chapters, refereed journal andconference papers. He has chaired “Odyssey-04,
The Speaker Recognition Workshop,” cosponsored by ISCA and IEEE, andcochaired “ICB-09, the 3rd IAPR International Conference on Biometrics.
Donald Maurer received the Ph.D. degree in mathematics from California In-stitute of Technology in 1969.
He is a member of the Johns Hopkins University Applied Physics Laboratory,where he develops algorithms for sensor data fusion and target discrimination.
Albert Ali Salah received the Ph.D. degree at thePerceptual Intelligence Laboratory of Bogaziçi Uni-versity.
He is currently with Intelligent Systems Labora-tory Amsterdam (ISLA), at the University of Am-sterdam. His research interests are biologically in-spired models of learning and vision, with applica-tions to pattern recognition, biometrics, and ambientintelligence. With his work on facial feature localiza-tion, he received the inaugural EBF European Bio-metrics Research Award in 2006.
Tobias Scheidat received the M.Sc. degree in Com-puter Science in 2005 from the Otto-von-Guericke-University Magdeburg, Germany.
Since 2003, he works in the Biometric ResearchGroup of the Advanced Multimedia and SecurityLaboratory (AMSL) at Otto-von-Guericke Univer-sity Magdeburg. In addition to online handwriting,his research interests are focused on multibio-metric fusion, biometric hashing, the evaluationof biometric systems, and meta data in context ofbiometrics.
Claus Vielhauer received both the M.Sc. and Ph.D.degrees from Technical University Darmstadt.
is a full professor (2007) for IT Security atBrandenburg University of Applied Sciences andthe leader of the biometric research group at theAdvanced Multimedia and Security Laboratory atOtto-von-Guericke University Magdeburg (2003).Formerly, has been a member of the MultimediaCommunications Laboratory Research Group ofProf. R. Steinmetz, Technical University Darmstadt.His main research interests cover the areas of IT
and media security and forensics, biometrics and human–computer interactionand he has been performing research and management in numerous EU- andnon-EU-funded research projects such as BioSecure.
Authorized licensed use limited to: Univ Autonoma de Madrid. Downloaded on December 14, 2009 at 10:56 from IEEE Xplore. Restrictions apply.


![Benchmarking desktop and mobile handwriting across COTS ...atvs.ii.uam.es/fierrez/files/2017_PLOSONE_eBioSign_Tolosana.pdf · MyIDEA* [27] 2005 104 (approx.) 3 18 18 Wacom Intuos2](https://img.pdfslide.us/doc/110x75/5f215cd0a5c05a28c56c09c5/benchmarking-desktop-and-mobile-handwriting-across-cots-atvsiiuamesfierrezfiles2017plosoneebiosign.jpg)