Embed Size (px)
Citation preview
IEEE TRANSACTIONS ON INDUSTRIAL INFORMATICS, VOL. 5, NO. 4, NOVEMBER 2009 483
Fuzzy Spectral and Spatial Feature Integrationfor Classification of Nonferrous Materials in
Hyperspectral DataArtzai Picón, Ovidiu Ghita, Paul F. Whelan, Senior Member, IEEE, and Pedro M. Iriondo
Abstract—Hyperspectral data allows the construction of moreelaborate models to sample the properties of the nonferrous ma-terials than the standard RGB color representation. In this paper,the nonferrous waste materials are studied as they cannot be sortedby classical procedures due to their color, weight and shape sim-ilarities. The experimental results presented in this paper revealthat factors such as the various levels of oxidization of the wastematerials and the slight differences in their chemical compositionpreclude the use of the spectral features in a simplistic manner forrobust material classification. To address these problems, the pro-posed FUSSER (FUzzy Spectral and Spatial classifiER) algorithmdetailed in this paper merges the spectral and spatial features toobtain a combined feature vector that is able to better sample theproperties of the nonferrous materials than the single pixel spectralfeatures when applied to the construction of multivariate Gaussiandistributions. This approach allows the implementation of statis-tical region merging techniques in order to increase the perfor-mance of the classification process. To achieve an efficient imple-mentation, the dimensionality of the hyperspectral data is reducedby constructing bio-inspired spectral fuzzy sets that minimize theamount of redundant information contained in adjacent hyper-spectral bands. The experimental results indicate that the proposedalgorithm increased the overall classification rate from 44% usingRGB data up to 98% when the spectral-spatial features are usedfor nonferrous material classification.
Index Terms—Hyperspectral image processing, image classifica-tion, spectral fuzzy sets.
I. INTRODUCTION
N OWADAYS, sustainable development has become one ofthe most important paradigms of the contemporary soci-
eties since a large amount of electrical and electronic equipmentis being designed, manufactured and retired. Thus, the
Manuscript received April 27, 2009; revised June 22, 2009; accepted Au-gust 19, 2009. First published September 15, 2009; current version publishedNovember 06, 2009. This work was supported in part by the Etortek Programof the Basque Government. Part of this work was carried out while A. Picónwas a Visiting Researcher at the Centre for Image Processing and Analysis(CIPA), Dublin City University, from February 2007 to February 2008. Paperno. TII-09-04-0057.R1.
A. Picón is with the Infotech Unit, Tecnalia Research Corporation, Zamudio,Bizkaia 48170, Spain (e-mail: [email protected]).
O. Ghita and P. F. Whelan are with the Centre for Image Processing and Anal-ysis, School of Electronic Engineering, Dublin City University, Ireland (e-mail:[email protected]; [email protected]).
P. M. Iriondo is with the Department of Automatic Control and Systems En-gineering, ETSI of Bilbao, University of the Basque Country UPV-EHU, Spain(e-mail: [email protected]).
Color versions of one or more of the figures in this paper are available onlineat http://ieeexplore.ieee.org.
Digital Object Identifier 10.1109/TII.2009.2031238
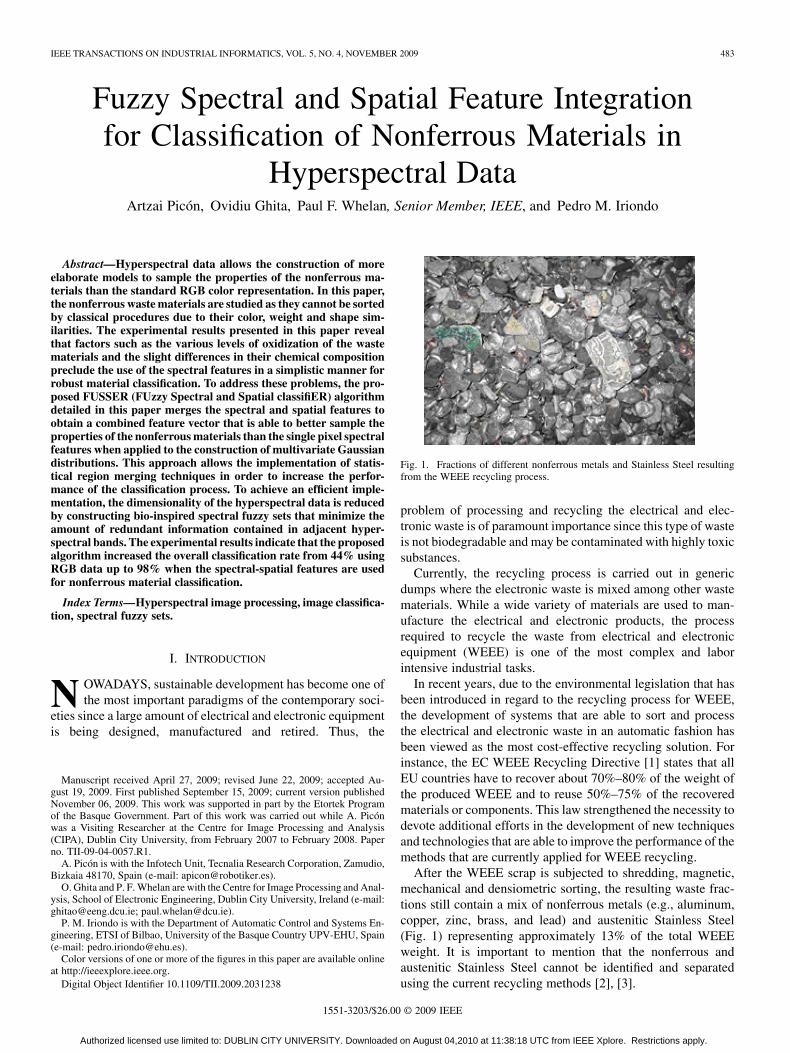
Fig. 1. Fractions of different nonferrous metals and Stainless Steel resultingfrom the WEEE recycling process.
problem of processing and recycling the electrical and elec-tronic waste is of paramount importance since this type of wasteis not biodegradable and may be contaminated with highly toxicsubstances.
Currently, the recycling process is carried out in genericdumps where the electronic waste is mixed among other wastematerials. While a wide variety of materials are used to man-ufacture the electrical and electronic products, the processrequired to recycle the waste from electrical and electronicequipment (WEEE) is one of the most complex and laborintensive industrial tasks.
In recent years, due to the environmental legislation that hasbeen introduced in regard to the recycling process for WEEE,the development of systems that are able to sort and processthe electrical and electronic waste in an automatic fashion hasbeen viewed as the most cost-effective recycling solution. Forinstance, the EC WEEE Recycling Directive [1] states that allEU countries have to recover about 70%–80% of the weight ofthe produced WEEE and to reuse 50%–75% of the recoveredmaterials or components. This law strengthened the necessity todevote additional efforts in the development of new techniquesand technologies that are able to improve the performance of themethods that are currently applied for WEEE recycling.
After the WEEE scrap is subjected to shredding, magnetic,mechanical and densiometric sorting, the resulting waste frac-tions still contain a mix of nonferrous metals (e.g., aluminum,copper, zinc, brass, and lead) and austenitic Stainless Steel(Fig. 1) representing approximately 13% of the total WEEEweight. It is important to mention that the nonferrous andaustenitic Stainless Steel cannot be identified and separatedusing the current recycling methods [2], [3].
1551-3203/$26.00 © 2009 IEEE
Authorized licensed use limited to: DUBLIN CITY UNIVERSITY. Downloaded on August 04,2010 at 11:38:18 UTC from IEEE Xplore. Restrictions apply.
484 IEEE TRANSACTIONS ON INDUSTRIAL INFORMATICS, VOL. 5, NO. 4, NOVEMBER 2009
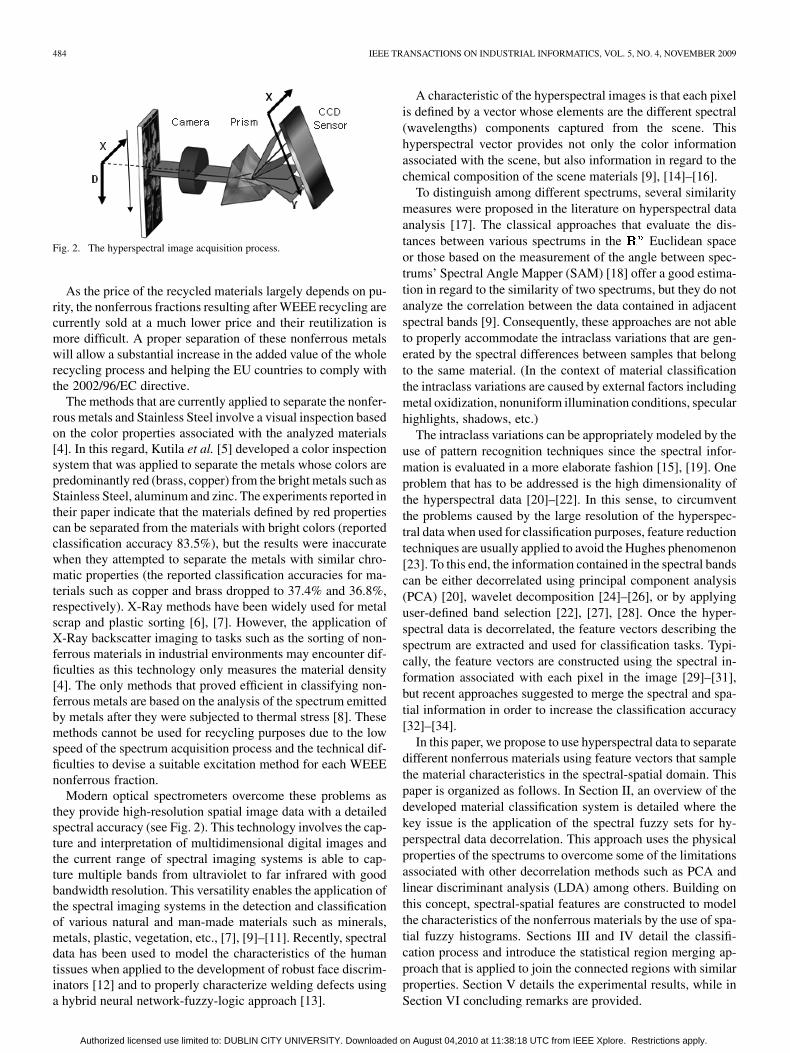
Fig. 2. The hyperspectral image acquisition process.
As the price of the recycled materials largely depends on pu-rity, the nonferrous fractions resulting after WEEE recycling arecurrently sold at a much lower price and their reutilization ismore difficult. A proper separation of these nonferrous metalswill allow a substantial increase in the added value of the wholerecycling process and helping the EU countries to comply withthe 2002/96/EC directive.
The methods that are currently applied to separate the nonfer-rous metals and Stainless Steel involve a visual inspection basedon the color properties associated with the analyzed materials[4]. In this regard, Kutila et al. [5] developed a color inspectionsystem that was applied to separate the metals whose colors arepredominantly red (brass, copper) from the bright metals such asStainless Steel, aluminum and zinc. The experiments reported intheir paper indicate that the materials defined by red propertiescan be separated from the materials with bright colors (reportedclassification accuracy 83.5%), but the results were inaccuratewhen they attempted to separate the metals with similar chro-matic properties (the reported classification accuracies for ma-terials such as copper and brass dropped to 37.4% and 36.8%,respectively). X-Ray methods have been widely used for metalscrap and plastic sorting [6], [7]. However, the application ofX-Ray backscatter imaging to tasks such as the sorting of non-ferrous materials in industrial environments may encounter dif-ficulties as this technology only measures the material density[4]. The only methods that proved efficient in classifying non-ferrous metals are based on the analysis of the spectrum emittedby metals after they were subjected to thermal stress [8]. Thesemethods cannot be used for recycling purposes due to the lowspeed of the spectrum acquisition process and the technical dif-ficulties to devise a suitable excitation method for each WEEEnonferrous fraction.
Modern optical spectrometers overcome these problems asthey provide high-resolution spatial image data with a detailedspectral accuracy (see Fig. 2). This technology involves the cap-ture and interpretation of multidimensional digital images andthe current range of spectral imaging systems is able to cap-ture multiple bands from ultraviolet to far infrared with goodbandwidth resolution. This versatility enables the application ofthe spectral imaging systems in the detection and classificationof various natural and man-made materials such as minerals,metals, plastic, vegetation, etc., [7], [9]–[11]. Recently, spectraldata has been used to model the characteristics of the humantissues when applied to the development of robust face discrim-inators [12] and to properly characterize welding defects usinga hybrid neural network-fuzzy-logic approach [13].
A characteristic of the hyperspectral images is that each pixelis defined by a vector whose elements are the different spectral(wavelengths) components captured from the scene. Thishyperspectral vector provides not only the color informationassociated with the scene, but also information in regard to thechemical composition of the scene materials [9], [14]–[16].
To distinguish among different spectrums, several similaritymeasures were proposed in the literature on hyperspectral dataanalysis [17]. The classical approaches that evaluate the dis-tances between various spectrums in the Euclidean spaceor those based on the measurement of the angle between spec-trums’ Spectral Angle Mapper (SAM) [18] offer a good estima-tion in regard to the similarity of two spectrums, but they do notanalyze the correlation between the data contained in adjacentspectral bands [9]. Consequently, these approaches are not ableto properly accommodate the intraclass variations that are gen-erated by the spectral differences between samples that belongto the same material. (In the context of material classificationthe intraclass variations are caused by external factors includingmetal oxidization, nonuniform illumination conditions, specularhighlights, shadows, etc.)
The intraclass variations can be appropriately modeled by theuse of pattern recognition techniques since the spectral infor-mation is evaluated in a more elaborate fashion [15], [19]. Oneproblem that has to be addressed is the high dimensionality ofthe hyperspectral data [20]–[22]. In this sense, to circumventthe problems caused by the large resolution of the hyperspec-tral data when used for classification purposes, feature reductiontechniques are usually applied to avoid the Hughes phenomenon[23]. To this end, the information contained in the spectral bandscan be either decorrelated using principal component analysis(PCA) [20], wavelet decomposition [24]–[26], or by applyinguser-defined band selection [22], [27], [28]. Once the hyper-spectral data is decorrelated, the feature vectors describing thespectrum are extracted and used for classification tasks. Typi-cally, the feature vectors are constructed using the spectral in-formation associated with each pixel in the image [29]–[31],but recent approaches suggested to merge the spectral and spa-tial information in order to increase the classification accuracy[32]–[34].
In this paper, we propose to use hyperspectral data to separatedifferent nonferrous materials using feature vectors that samplethe material characteristics in the spectral-spatial domain. Thispaper is organized as follows. In Section II, an overview of thedeveloped material classification system is detailed where thekey issue is the application of the spectral fuzzy sets for hy-perspectral data decorrelation. This approach uses the physicalproperties of the spectrums to overcome some of the limitationsassociated with other decorrelation methods such as PCA andlinear discriminant analysis (LDA) among others. Building onthis concept, spectral-spatial features are constructed to modelthe characteristics of the nonferrous materials by the use of spa-tial fuzzy histograms. Sections III and IV detail the classifi-cation process and introduce the statistical region merging ap-proach that is applied to join the connected regions with similarproperties. Section V details the experimental results, while inSection VI concluding remarks are provided.
Authorized licensed use limited to: DUBLIN CITY UNIVERSITY. Downloaded on August 04,2010 at 11:38:18 UTC from IEEE Xplore. Restrictions apply.
PICÓN et al.: FUZZY SPECTRAL AND SPATIAL FEATURE INTEGRATION FOR CLASSIFICATION OF NONFERROUS MATERIALS 485
II. SYSTEM OVERVIEW
This section outlines the complete procedure that has been de-veloped to extract the feature vectors from the acquired spectralimages. Also, in this section, we explain how the spectral-spa-tial features are used for nonferrous material classification.
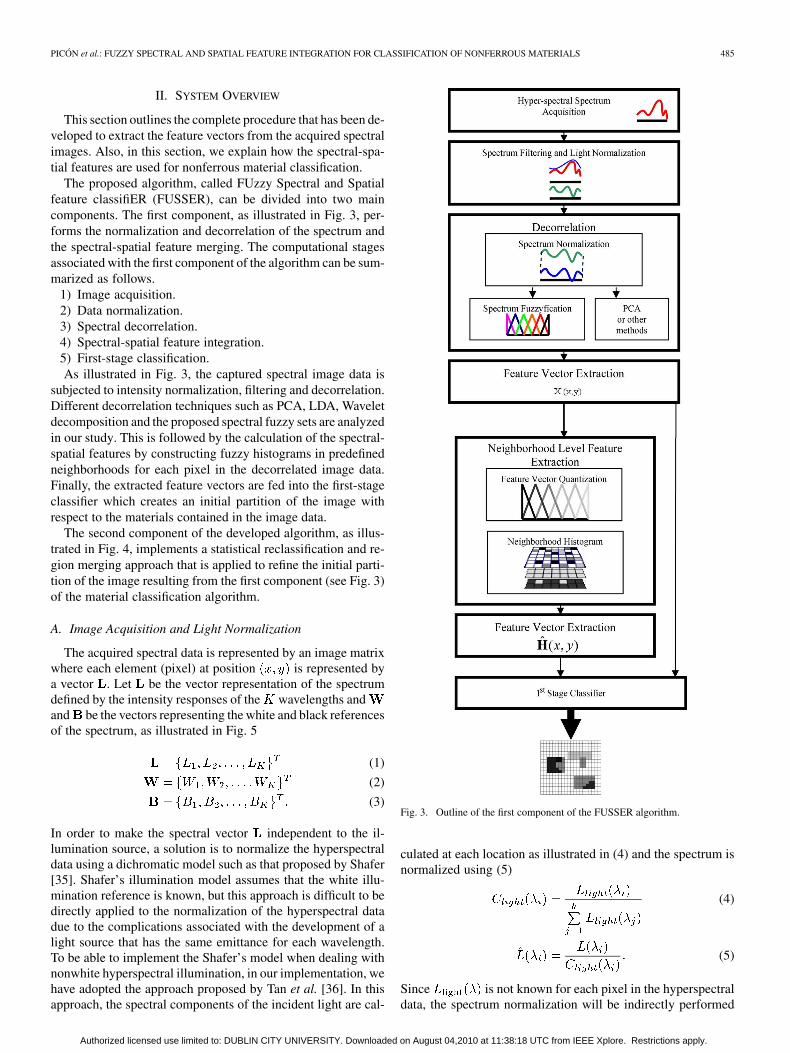
The proposed algorithm, called FUzzy Spectral and Spatialfeature classifiER (FUSSER), can be divided into two maincomponents. The first component, as illustrated in Fig. 3, per-forms the normalization and decorrelation of the spectrum andthe spectral-spatial feature merging. The computational stagesassociated with the first component of the algorithm can be sum-marized as follows.
1) Image acquisition.2) Data normalization.3) Spectral decorrelation.4) Spectral-spatial feature integration.5) First-stage classification.As illustrated in Fig. 3, the captured spectral image data is
subjected to intensity normalization, filtering and decorrelation.Different decorrelation techniques such as PCA, LDA, Waveletdecomposition and the proposed spectral fuzzy sets are analyzedin our study. This is followed by the calculation of the spectral-spatial features by constructing fuzzy histograms in predefinedneighborhoods for each pixel in the decorrelated image data.Finally, the extracted feature vectors are fed into the first-stageclassifier which creates an initial partition of the image withrespect to the materials contained in the image data.
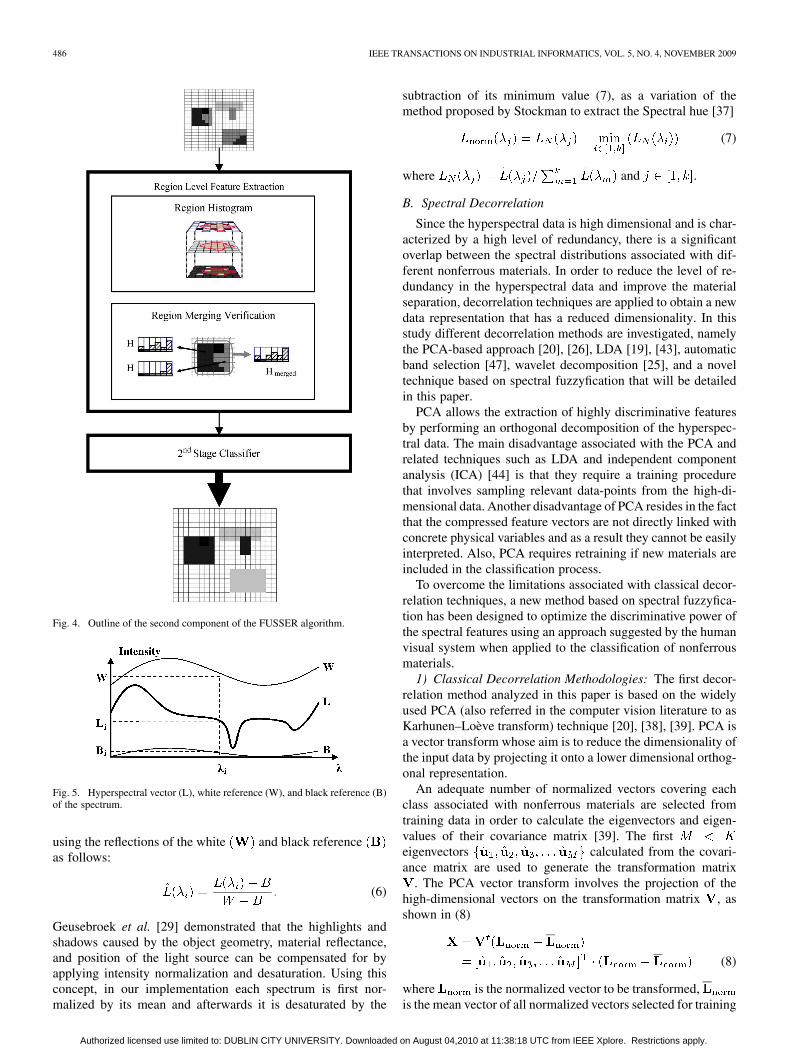
The second component of the developed algorithm, as illus-trated in Fig. 4, implements a statistical reclassification and re-gion merging approach that is applied to refine the initial parti-tion of the image resulting from the first component (see Fig. 3)of the material classification algorithm.
A. Image Acquisition and Light Normalization
The acquired spectral data is represented by an image matrixwhere each element (pixel) at position is represented bya vector . Let be the vector representation of the spectrumdefined by the intensity responses of the wavelengths andand be the vectors representing the white and black referencesof the spectrum, as illustrated in Fig. 5
(1)
(2)
(3)
In order to make the spectral vector independent to the il-lumination source, a solution is to normalize the hyperspectraldata using a dichromatic model such as that proposed by Shafer[35]. Shafer’s illumination model assumes that the white illu-mination reference is known, but this approach is difficult to bedirectly applied to the normalization of the hyperspectral datadue to the complications associated with the development of alight source that has the same emittance for each wavelength.To be able to implement the Shafer’s model when dealing withnonwhite hyperspectral illumination, in our implementation, wehave adopted the approach proposed by Tan et al. [36]. In thisapproach, the spectral components of the incident light are cal-
Fig. 3. Outline of the first component of the FUSSER algorithm.
culated at each location as illustrated in (4) and the spectrum isnormalized using (5)
(4)
(5)
Since is not known for each pixel in the hyperspectraldata, the spectrum normalization will be indirectly performed
Authorized licensed use limited to: DUBLIN CITY UNIVERSITY. Downloaded on August 04,2010 at 11:38:18 UTC from IEEE Xplore. Restrictions apply.
486 IEEE TRANSACTIONS ON INDUSTRIAL INFORMATICS, VOL. 5, NO. 4, NOVEMBER 2009
Fig. 4. Outline of the second component of the FUSSER algorithm.
Fig. 5. Hyperspectral vector (L), white reference (W), and black reference (B)of the spectrum.
using the reflections of the white and black referenceas follows:
(6)
Geusebroek et al. [29] demonstrated that the highlights andshadows caused by the object geometry, material reflectance,and position of the light source can be compensated for byapplying intensity normalization and desaturation. Using thisconcept, in our implementation each spectrum is first nor-malized by its mean and afterwards it is desaturated by the
subtraction of its minimum value (7), as a variation of themethod proposed by Stockman to extract the Spectral hue [37]
(7)
where and .
B. Spectral Decorrelation
Since the hyperspectral data is high dimensional and is char-acterized by a high level of redundancy, there is a significantoverlap between the spectral distributions associated with dif-ferent nonferrous materials. In order to reduce the level of re-dundancy in the hyperspectral data and improve the materialseparation, decorrelation techniques are applied to obtain a newdata representation that has a reduced dimensionality. In thisstudy different decorrelation methods are investigated, namelythe PCA-based approach [20], [26], LDA [19], [43], automaticband selection [47], wavelet decomposition [25], and a noveltechnique based on spectral fuzzyfication that will be detailedin this paper.
PCA allows the extraction of highly discriminative featuresby performing an orthogonal decomposition of the hyperspec-tral data. The main disadvantage associated with the PCA andrelated techniques such as LDA and independent componentanalysis (ICA) [44] is that they require a training procedurethat involves sampling relevant data-points from the high-di-mensional data. Another disadvantage of PCA resides in the factthat the compressed feature vectors are not directly linked withconcrete physical variables and as a result they cannot be easilyinterpreted. Also, PCA requires retraining if new materials areincluded in the classification process.
To overcome the limitations associated with classical decor-relation techniques, a new method based on spectral fuzzyfica-tion has been designed to optimize the discriminative power ofthe spectral features using an approach suggested by the humanvisual system when applied to the classification of nonferrousmaterials.
1) Classical Decorrelation Methodologies: The first decor-relation method analyzed in this paper is based on the widelyused PCA (also referred in the computer vision literature to asKarhunen–Loève transform) technique [20], [38], [39]. PCA isa vector transform whose aim is to reduce the dimensionality ofthe input data by projecting it onto a lower dimensional orthog-onal representation.
An adequate number of normalized vectors covering eachclass associated with nonferrous materials are selected fromtraining data in order to calculate the eigenvectors and eigen-values of their covariance matrix [39]. The firsteigenvectors calculated from the covari-ance matrix are used to generate the transformation matrix
. The PCA vector transform involves the projection of thehigh-dimensional vectors on the transformation matrix , asshown in (8)
(8)
where is the normalized vector to be transformed,is the mean vector of all normalized vectors selected for training
Authorized licensed use limited to: DUBLIN CITY UNIVERSITY. Downloaded on August 04,2010 at 11:38:18 UTC from IEEE Xplore. Restrictions apply.
PICÓN et al.: FUZZY SPECTRAL AND SPATIAL FEATURE INTEGRATION FOR CLASSIFICATION OF NONFERROUS MATERIALS 487
and is the eigenmatrix defined by the first eigenvectorscalculated from the covariance matrix of the training vectors.
After the application of the PCA transformation, the spectrumis represented by vectors in the orthogonal PCA space. Thisrepresentation offers a decorrelated and compressed version ofthe original hyperspectral data that can be efficiently used forclassification tasks. For comparative purposes, in this paper, wealso included the LDA, Wavelet and automatic band selectiontechniques to assess their performance when applied for datadecorrelation.
2) Spectral Fuzzy Sets: The method proposed in this paperto decorrelate the hyperspectral data is based on the knowledgethat the adjacent wavelengths of the spectrum are more cor-related than the distant wavelengths. This observation is jus-tified since for most solid materials the spectral informationvaries smoothly over successive spectral wavelengths [46]. Con-sequently, the spectral characteristics associated with nonfer-rous materials are sampled by groups of adjacent spectral bandsrather than unique spectral bands. To model this property, theintensity values for each wavelength have to take into accountthe values of the adjacent wavelengths. This can be obtained bydividing the spectrum in separate groups to attain the desiredspectral selectivity. To avoid the problems caused by a crispdivision of the spectrum, in this paper a method based on thespectrum fuzzyfication is proposed. This involves the separationof the hyperspectral data into a number of fuzzy groups whereeach group covers a range of wavelengths and the contributionof each wavelength is modeled by a membership function.
Let be the normalized components of the spectrumas defined in (7) and be the number of fuzzy sets in which thespectrum will be divided. A membership function is defined foreach of the fuzzy sets to characterize the membership for anywavelength in the spectrum to its related fuzzy set. For the sakeof simplicity, in this implementation, triangular shaped mem-bership functions are used (for a systematic approach in regardto the construction of the fuzzy rules the reader is directed to[41], [42]). In this way, the membership value for each point ofthe spectrum is defined by a triangular function that is definedas follows:
otherwise(9)
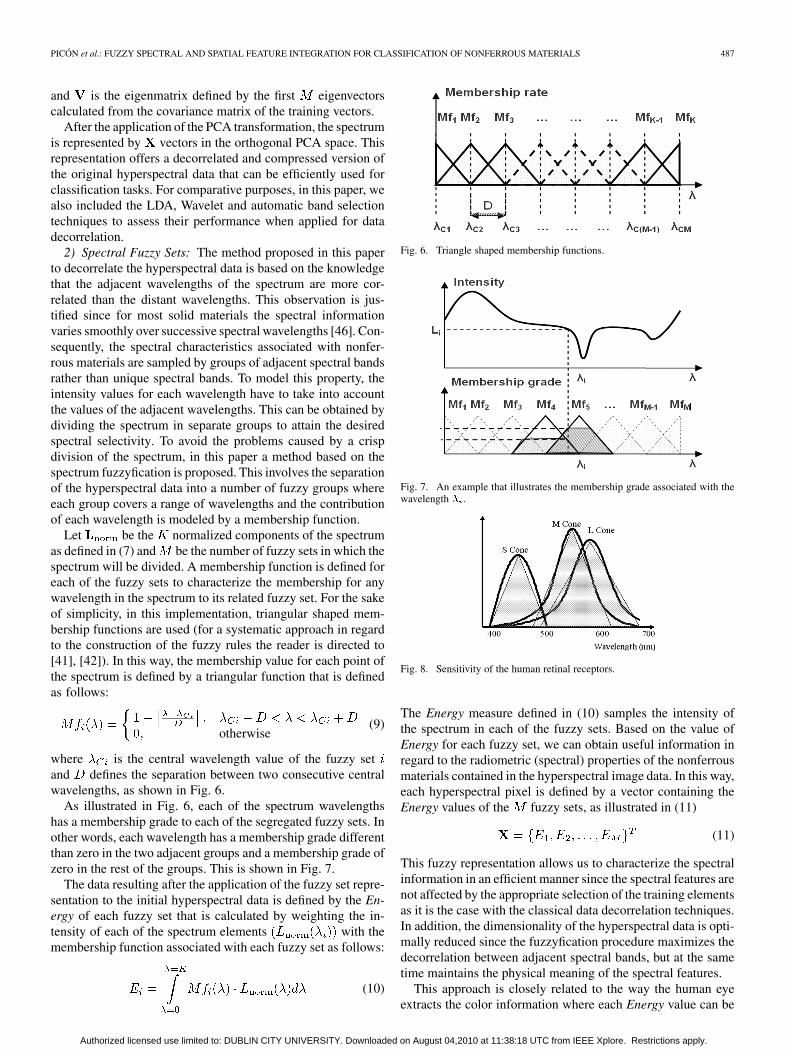
where is the central wavelength value of the fuzzy setand defines the separation between two consecutive centralwavelengths, as shown in Fig. 6.
As illustrated in Fig. 6, each of the spectrum wavelengthshas a membership grade to each of the segregated fuzzy sets. Inother words, each wavelength has a membership grade differentthan zero in the two adjacent groups and a membership grade ofzero in the rest of the groups. This is shown in Fig. 7.
The data resulting after the application of the fuzzy set repre-sentation to the initial hyperspectral data is defined by the En-ergy of each fuzzy set that is calculated by weighting the in-tensity of each of the spectrum elements with themembership function associated with each fuzzy set as follows:
(10)
Fig. 6. Triangle shaped membership functions.
Fig. 7. An example that illustrates the membership grade associated with thewavelength � .
Fig. 8. Sensitivity of the human retinal receptors.
The Energy measure defined in (10) samples the intensity ofthe spectrum in each of the fuzzy sets. Based on the value ofEnergy for each fuzzy set, we can obtain useful information inregard to the radiometric (spectral) properties of the nonferrousmaterials contained in the hyperspectral image data. In this way,each hyperspectral pixel is defined by a vector containing theEnergy values of the fuzzy sets, as illustrated in (11)
(11)
This fuzzy representation allows us to characterize the spectralinformation in an efficient manner since the spectral features arenot affected by the appropriate selection of the training elementsas it is the case with the classical data decorrelation techniques.In addition, the dimensionality of the hyperspectral data is opti-mally reduced since the fuzzyfication procedure maximizes thedecorrelation between adjacent spectral bands, but at the sametime maintains the physical meaning of the spectral features.
This approach is closely related to the way the human eyeextracts the color information where each Energy value can be
Authorized licensed use limited to: DUBLIN CITY UNIVERSITY. Downloaded on August 04,2010 at 11:38:18 UTC from IEEE Xplore. Restrictions apply.
488 IEEE TRANSACTIONS ON INDUSTRIAL INFORMATICS, VOL. 5, NO. 4, NOVEMBER 2009
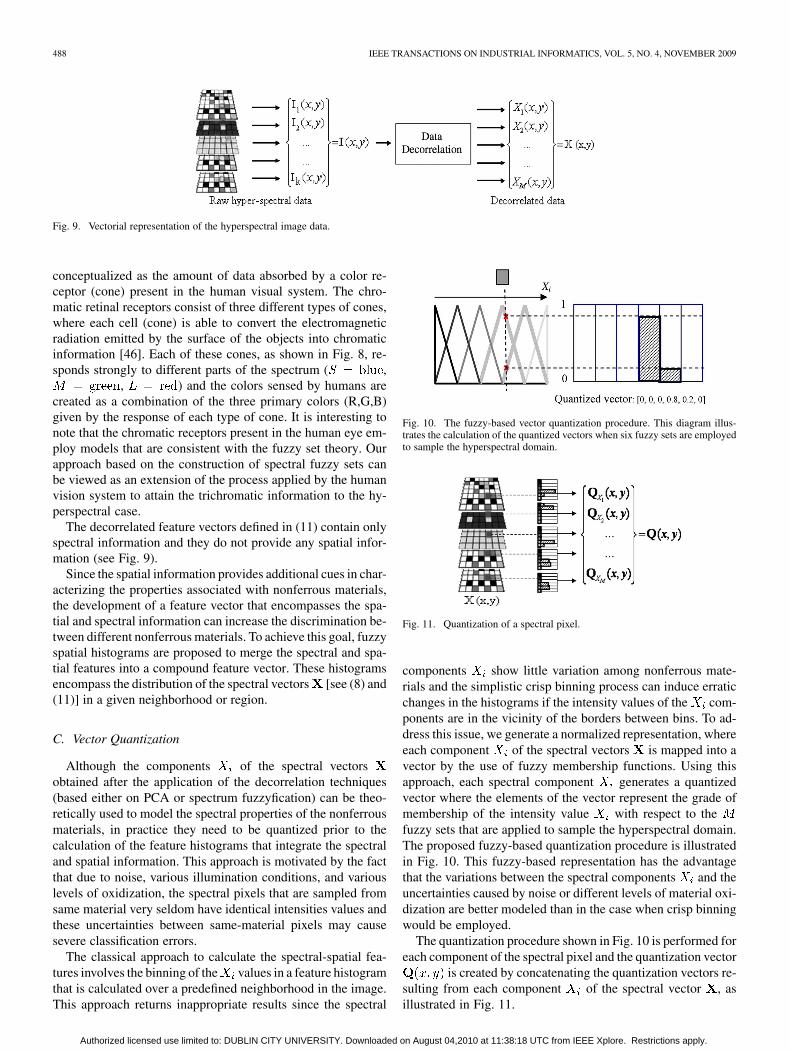
Fig. 9. Vectorial representation of the hyperspectral image data.
conceptualized as the amount of data absorbed by a color re-ceptor (cone) present in the human visual system. The chro-matic retinal receptors consist of three different types of cones,where each cell (cone) is able to convert the electromagneticradiation emitted by the surface of the objects into chromaticinformation [46]. Each of these cones, as shown in Fig. 8, re-sponds strongly to different parts of the spectrum ( ,
, ) and the colors sensed by humans arecreated as a combination of the three primary colors (R,G,B)given by the response of each type of cone. It is interesting tonote that the chromatic receptors present in the human eye em-ploy models that are consistent with the fuzzy set theory. Ourapproach based on the construction of spectral fuzzy sets canbe viewed as an extension of the process applied by the humanvision system to attain the trichromatic information to the hy-perspectral case.
The decorrelated feature vectors defined in (11) contain onlyspectral information and they do not provide any spatial infor-mation (see Fig. 9).
Since the spatial information provides additional cues in char-acterizing the properties associated with nonferrous materials,the development of a feature vector that encompasses the spa-tial and spectral information can increase the discrimination be-tween different nonferrous materials. To achieve this goal, fuzzyspatial histograms are proposed to merge the spectral and spa-tial features into a compound feature vector. These histogramsencompass the distribution of the spectral vectors [see (8) and(11)] in a given neighborhood or region.
C. Vector Quantization
Although the components of the spectral vectorsobtained after the application of the decorrelation techniques(based either on PCA or spectrum fuzzyfication) can be theo-retically used to model the spectral properties of the nonferrousmaterials, in practice they need to be quantized prior to thecalculation of the feature histograms that integrate the spectraland spatial information. This approach is motivated by the factthat due to noise, various illumination conditions, and variouslevels of oxidization, the spectral pixels that are sampled fromsame material very seldom have identical intensities values andthese uncertainties between same-material pixels may causesevere classification errors.
The classical approach to calculate the spectral-spatial fea-tures involves the binning of the values in a feature histogramthat is calculated over a predefined neighborhood in the image.This approach returns inappropriate results since the spectral
Fig. 10. The fuzzy-based vector quantization procedure. This diagram illus-trates the calculation of the quantized vectors when six fuzzy sets are employedto sample the hyperspectral domain.
Fig. 11. Quantization of a spectral pixel.
components show little variation among nonferrous mate-rials and the simplistic crisp binning process can induce erraticchanges in the histograms if the intensity values of the com-ponents are in the vicinity of the borders between bins. To ad-dress this issue, we generate a normalized representation, whereeach component of the spectral vectors is mapped into avector by the use of fuzzy membership functions. Using thisapproach, each spectral component generates a quantizedvector where the elements of the vector represent the grade ofmembership of the intensity value with respect to thefuzzy sets that are applied to sample the hyperspectral domain.The proposed fuzzy-based quantization procedure is illustratedin Fig. 10. This fuzzy-based representation has the advantagethat the variations between the spectral components and theuncertainties caused by noise or different levels of material oxi-dization are better modeled than in the case when crisp binningwould be employed.
The quantization procedure shown in Fig. 10 is performed foreach component of the spectral pixel and the quantization vector
is created by concatenating the quantization vectors re-sulting from each component of the spectral vector , asillustrated in Fig. 11.
Authorized licensed use limited to: DUBLIN CITY UNIVERSITY. Downloaded on August 04,2010 at 11:38:18 UTC from IEEE Xplore. Restrictions apply.
PICÓN et al.: FUZZY SPECTRAL AND SPATIAL FEATURE INTEGRATION FOR CLASSIFICATION OF NONFERROUS MATERIALS 489
D. Spectral-Spatial Features Integration
To construct the spectral-spatial histogram we need to definea neighborhood around each spectral pixel. In this way, a fuzzyhistogram is computed using the quantized vectors that arecalculated, as illustrated in Fig. 11, for all spectral pixels con-tained in the neighborhood
(12)
The histogram shown in (12) encodes the spatial dis-tribution for each spectral component inside the selectedneighborhood (size ) and the spectral characteristics asso-ciated with nonferrous materials are captured by the histogram’sshape.
It is useful to note that (12) generates the same result as in thecase when the fuzzy histogram is calculated for each channel
independently and the resulting spectral histograms are con-catenated into a single vector. However, the implementation de-scribed in (12) has the advantage that allows the calculation ofthe histograms for different sized neighborhoods by just per-forming additive operations. This property is very useful for ourimplementation since the compound descriptor characterizingtwo regions would be the same as the sum of the descriptorsthat are calculated for each region individually. This opens thepossibility of real-time implementation for the region mergingprocedure that will be detailed in Section IV.
III. CLASSIFICATION PROCEDURE
In the previous section, the procedure that is applied to obtainthe feature vectors that encompass the spectral and spatial fea-tures has been detailed. The histogram vector shown in (12) de-fines the distribution of the spectral information in a predefinedneighborhood around the pixel and is used as input forclassification. In our implementation, the multivariate Gaussianclassifier is proposed to perform the material classification sincethe Gaussian distributions approximate well the dispersion ofthe spectral-spatial feature vectors within each class of nonfer-rous materials.
A Gaussian model for each material is created where andare the mean vector and the covariance matrix of the modeled
class
(13)The classification stage is carried out by checking each spec-tral-spatial vector calculated for each pixel in the imageagainst the normalized distributions that define each materialclass. Each pixel in the decorrelated hyperspectral image is la-beled to the class that achieves the minimum matching cost.
IV. REGION MERGING
The aim of the first-stage classification is to label each pixelin the image with respect to the nonferrous material classes.Our investigations revealed that due to interclass overlap somepixels are misclassified. The errors in classification were mostly
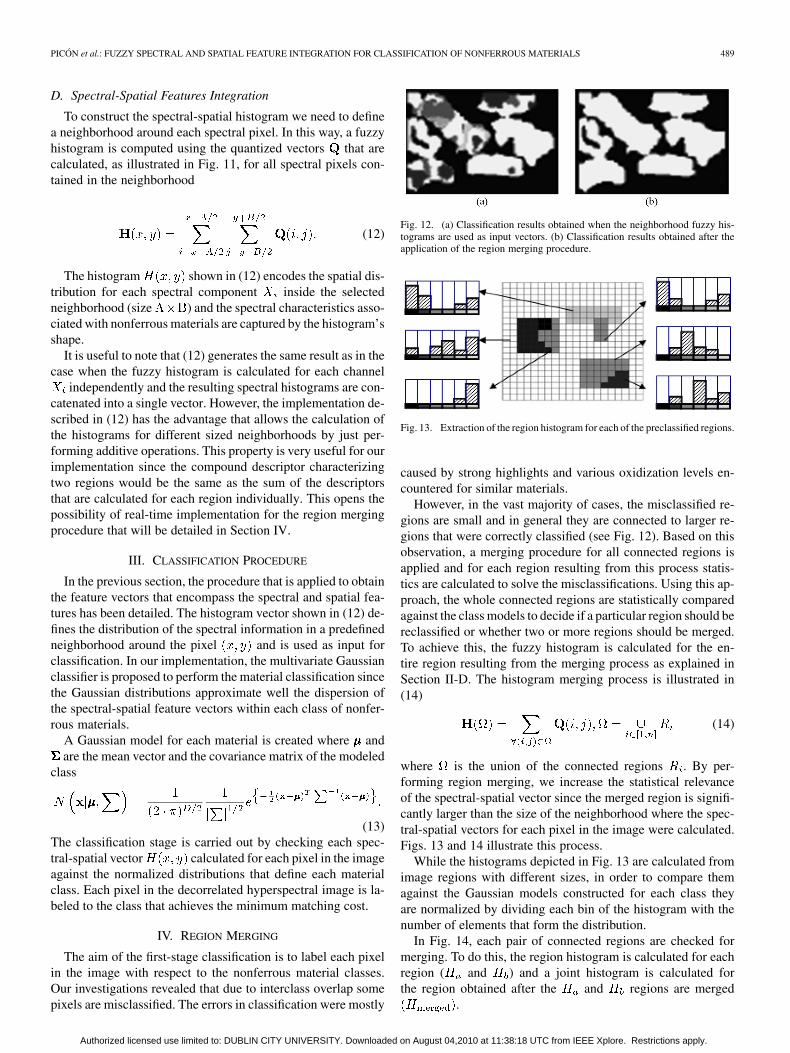
Fig. 12. (a) Classification results obtained when the neighborhood fuzzy his-tograms are used as input vectors. (b) Classification results obtained after theapplication of the region merging procedure.
Fig. 13. Extraction of the region histogram for each of the preclassified regions.
caused by strong highlights and various oxidization levels en-countered for similar materials.
However, in the vast majority of cases, the misclassified re-gions are small and in general they are connected to larger re-gions that were correctly classified (see Fig. 12). Based on thisobservation, a merging procedure for all connected regions isapplied and for each region resulting from this process statis-tics are calculated to solve the misclassifications. Using this ap-proach, the whole connected regions are statistically comparedagainst the class models to decide if a particular region should bereclassified or whether two or more regions should be merged.To achieve this, the fuzzy histogram is calculated for the en-tire region resulting from the merging process as explained inSection II-D. The histogram merging process is illustrated in(14)
(14)
where is the union of the connected regions . By per-forming region merging, we increase the statistical relevanceof the spectral-spatial vector since the merged region is signifi-cantly larger than the size of the neighborhood where the spec-tral-spatial vectors for each pixel in the image were calculated.Figs. 13 and 14 illustrate this process.
While the histograms depicted in Fig. 13 are calculated fromimage regions with different sizes, in order to compare themagainst the Gaussian models constructed for each class theyare normalized by dividing each bin of the histogram with thenumber of elements that form the distribution.
In Fig. 14, each pair of connected regions are checked formerging. To do this, the region histogram is calculated for eachregion ( and ) and a joint histogram is calculated forthe region obtained after the and regions are merged
.
Authorized licensed use limited to: DUBLIN CITY UNIVERSITY. Downloaded on August 04,2010 at 11:38:18 UTC from IEEE Xplore. Restrictions apply.
490 IEEE TRANSACTIONS ON INDUSTRIAL INFORMATICS, VOL. 5, NO. 4, NOVEMBER 2009
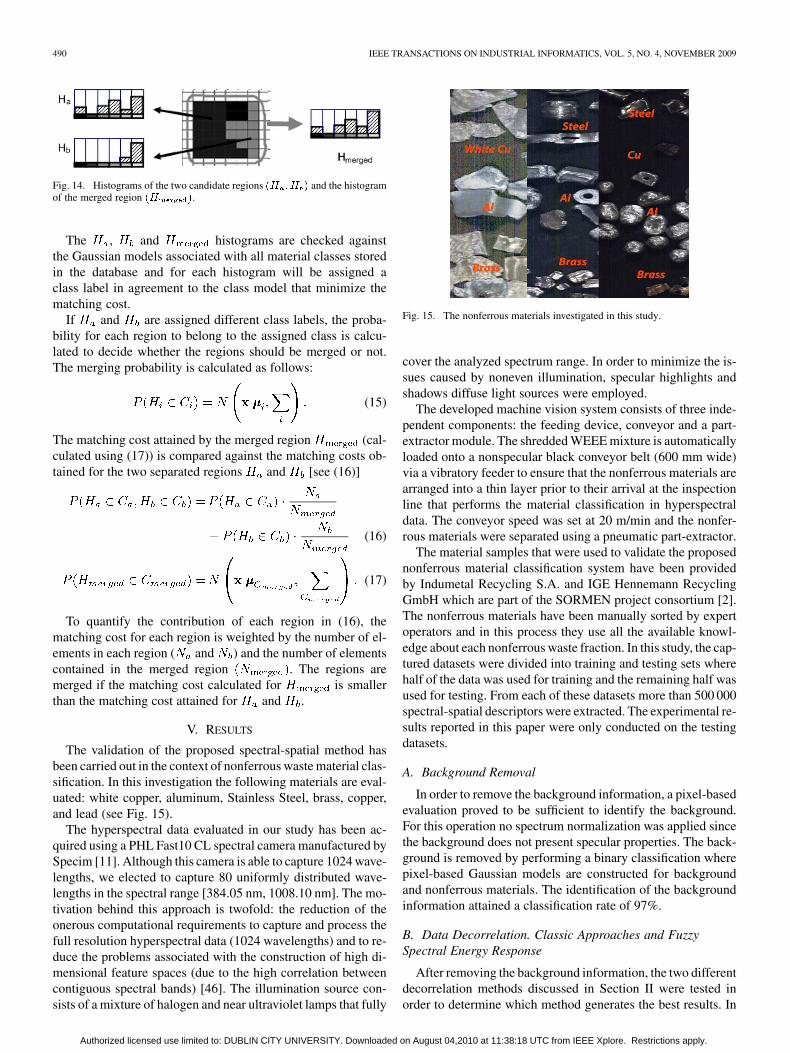
Fig. 14. Histograms of the two candidate regions �� �� � and the histogramof the merged region �� �.
The , and histograms are checked againstthe Gaussian models associated with all material classes storedin the database and for each histogram will be assigned aclass label in agreement to the class model that minimize thematching cost.
If and are assigned different class labels, the proba-bility for each region to belong to the assigned class is calcu-lated to decide whether the regions should be merged or not.The merging probability is calculated as follows:
(15)
The matching cost attained by the merged region (cal-culated using (17)) is compared against the matching costs ob-tained for the two separated regions and [see (16)]
(16)
(17)
To quantify the contribution of each region in (16), thematching cost for each region is weighted by the number of el-ements in each region ( and ) and the number of elementscontained in the merged region . The regions aremerged if the matching cost calculated for is smallerthan the matching cost attained for and .
V. RESULTS
The validation of the proposed spectral-spatial method hasbeen carried out in the context of nonferrous waste material clas-sification. In this investigation the following materials are eval-uated: white copper, aluminum, Stainless Steel, brass, copper,and lead (see Fig. 15).
The hyperspectral data evaluated in our study has been ac-quired using a PHL Fast10 CL spectral camera manufactured bySpecim [11]. Although this camera is able to capture 1024 wave-lengths, we elected to capture 80 uniformly distributed wave-lengths in the spectral range [384.05 nm, 1008.10 nm]. The mo-tivation behind this approach is twofold: the reduction of theonerous computational requirements to capture and process thefull resolution hyperspectral data (1024 wavelengths) and to re-duce the problems associated with the construction of high di-mensional feature spaces (due to the high correlation betweencontiguous spectral bands) [46]. The illumination source con-sists of a mixture of halogen and near ultraviolet lamps that fully
Fig. 15. The nonferrous materials investigated in this study.
cover the analyzed spectrum range. In order to minimize the is-sues caused by noneven illumination, specular highlights andshadows diffuse light sources were employed.
The developed machine vision system consists of three inde-pendent components: the feeding device, conveyor and a part-extractor module. The shredded WEEE mixture is automaticallyloaded onto a nonspecular black conveyor belt (600 mm wide)via a vibratory feeder to ensure that the nonferrous materials arearranged into a thin layer prior to their arrival at the inspectionline that performs the material classification in hyperspectraldata. The conveyor speed was set at 20 m/min and the nonfer-rous materials were separated using a pneumatic part-extractor.
The material samples that were used to validate the proposednonferrous material classification system have been providedby Indumetal Recycling S.A. and IGE Hennemann RecyclingGmbH which are part of the SORMEN project consortium [2].The nonferrous materials have been manually sorted by expertoperators and in this process they use all the available knowl-edge about each nonferrous waste fraction. In this study, the cap-tured datasets were divided into training and testing sets wherehalf of the data was used for training and the remaining half wasused for testing. From each of these datasets more than 500 000spectral-spatial descriptors were extracted. The experimental re-sults reported in this paper were only conducted on the testingdatasets.
A. Background Removal
In order to remove the background information, a pixel-basedevaluation proved to be sufficient to identify the background.For this operation no spectrum normalization was applied sincethe background does not present specular properties. The back-ground is removed by performing a binary classification wherepixel-based Gaussian models are constructed for backgroundand nonferrous materials. The identification of the backgroundinformation attained a classification rate of 97%.
B. Data Decorrelation. Classic Approaches and FuzzySpectral Energy Response
After removing the background information, the two differentdecorrelation methods discussed in Section II were tested inorder to determine which method generates the best results. In
Authorized licensed use limited to: DUBLIN CITY UNIVERSITY. Downloaded on August 04,2010 at 11:38:18 UTC from IEEE Xplore. Restrictions apply.
PICÓN et al.: FUZZY SPECTRAL AND SPATIAL FEATURE INTEGRATION FOR CLASSIFICATION OF NONFERROUS MATERIALS 491
TABLE I(a)CLASSIFICATION RESULTS USING SINGLE PIXEL SPECTRAL FEATURES
TABLE I(b)CLASSIFICATION RESULTS USING SINGLE PIXEL SPECTRAL FEATURES.
AUTOMATIC BAND SELECTION (FLOATING SEARCH METHOD) AND
UNPROCESSED (RAW) SPECTRAL DATA
this regard, one of the goals of this investigation was to calcu-late the optimal number of PCA components and the optimalnumber of fuzzy sets. The experimental results are depicted inTable I(a). In this evaluation, the classification has been carriedout at pixel-level (using single-pixel spectral features). The datadepicted in Table I(a) indicates that the best results are obtainedwhen the number of fuzzy sets is selected in the range 8 to 24.Similar results were obtained when the PCA technique has beenemployed to decorrelate the original hyperspectral data. Theexperimental results shown in Table I(a) reveal that the RGBdata is not sufficient to accurately capture the characteristics as-sociated with nonferrous materials. In our experiments, whenthe RGB data was applied for material classification, the cor-rect recognition rate was only 43.83%. The experimental re-sults depicted in Table I(a) indicate that the application of thedata decorrelation techniques is opportune as the classificationresults obtained for decorrelated data (number of features 2)are higher than the results obtained for original hyperspectraldata (80 spectral wavelengths)—see the result shown in the lastcolumn of Table I(b). For comparative purposes, additional clas-sification results obtained for other decorrelation schemes suchas Wavelet decomposition [25], LDA [see Table I(a)], and au-tomatic band selection based on floating search method (FSM)[47] [see Table I(b)] are included.
The experimental results depicted in Tables I(a) and I(b) re-veal that the spectrum fuzzyfication and the classical data decor-relation methods (PCA, LDA, Wavelet and automatic band se-lection) produced promising results when applied to the decor-relation of hyperspectral data. However, in our experiments theproposed fuzzy sets outperformed these techniques and at thesame time our approach avoids the complications associatedwith the training procedure required by classic data decorrela-tion methods that were analyzed in this study. For these reasons,
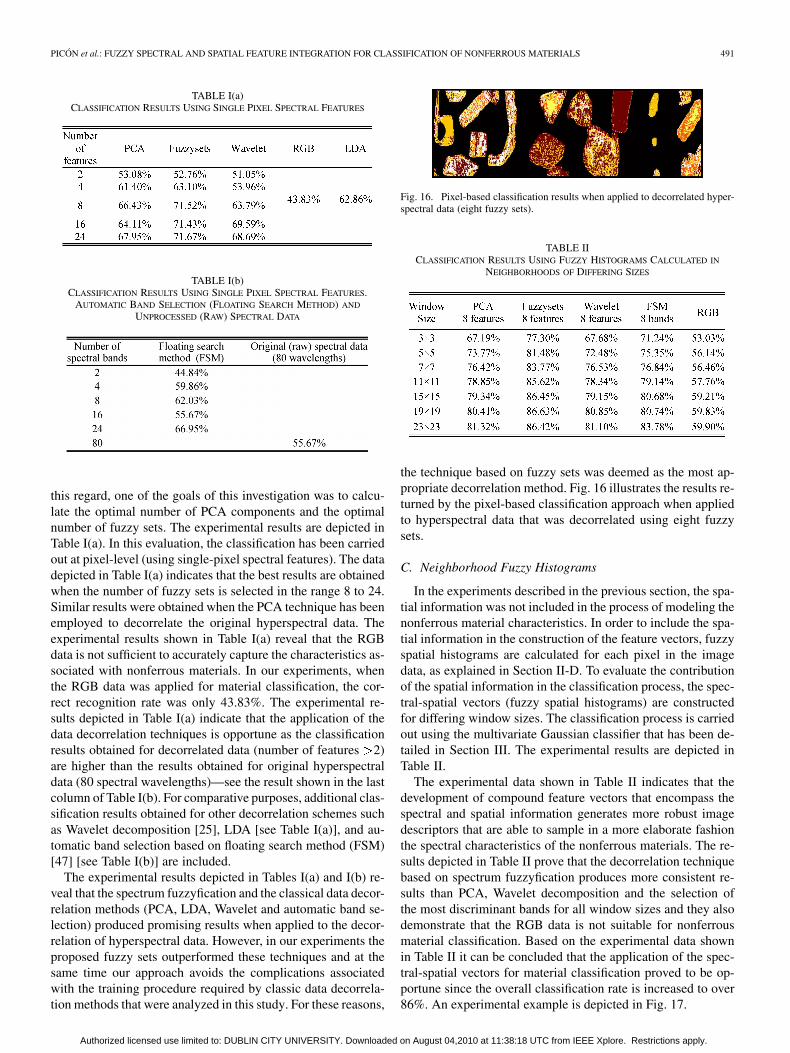
Fig. 16. Pixel-based classification results when applied to decorrelated hyper-spectral data (eight fuzzy sets).
TABLE IICLASSIFICATION RESULTS USING FUZZY HISTOGRAMS CALCULATED IN
NEIGHBORHOODS OF DIFFERING SIZES
the technique based on fuzzy sets was deemed as the most ap-propriate decorrelation method. Fig. 16 illustrates the results re-turned by the pixel-based classification approach when appliedto hyperspectral data that was decorrelated using eight fuzzysets.
C. Neighborhood Fuzzy Histograms
In the experiments described in the previous section, the spa-tial information was not included in the process of modeling thenonferrous material characteristics. In order to include the spa-tial information in the construction of the feature vectors, fuzzyspatial histograms are calculated for each pixel in the imagedata, as explained in Section II-D. To evaluate the contributionof the spatial information in the classification process, the spec-tral-spatial vectors (fuzzy spatial histograms) are constructedfor differing window sizes. The classification process is carriedout using the multivariate Gaussian classifier that has been de-tailed in Section III. The experimental results are depicted inTable II.
The experimental data shown in Table II indicates that thedevelopment of compound feature vectors that encompass thespectral and spatial information generates more robust imagedescriptors that are able to sample in a more elaborate fashionthe spectral characteristics of the nonferrous materials. The re-sults depicted in Table II prove that the decorrelation techniquebased on spectrum fuzzyfication produces more consistent re-sults than PCA, Wavelet decomposition and the selection ofthe most discriminant bands for all window sizes and they alsodemonstrate that the RGB data is not suitable for nonferrousmaterial classification. Based on the experimental data shownin Table II it can be concluded that the application of the spec-tral-spatial vectors for material classification proved to be op-portune since the overall classification rate is increased to over86%. An experimental example is depicted in Fig. 17.
Authorized licensed use limited to: DUBLIN CITY UNIVERSITY. Downloaded on August 04,2010 at 11:38:18 UTC from IEEE Xplore. Restrictions apply.
492 IEEE TRANSACTIONS ON INDUSTRIAL INFORMATICS, VOL. 5, NO. 4, NOVEMBER 2009
Fig. 17. Classification results using spectral-spatial feature vectors.
TABLE IIICLASSIFICATION RESULTS AFTER REGION MERGING
TABLE IVCONFUSION MATRIX CALCULATED FOR ALL NONFERROUS MATERIAL CLASSES
(PROPOSED REGION-BASED CLASSIFICATION APPROACH)
Overall 98.36%.
D. Region Merging
The regions identified after the application of the neigh-borhood (spectral-spatial) histograms (see Section V-C) aresubjected to reclassification using the procedure discussedin Section IV. In this process for each connected regionthe merging cost is evaluated using the (15) and (16) andthe merging decisions are based on the minimization of thematching cost criterion. The experimental results shown inTable III indicate that optimal results are obtained whenthe spectral-spatial histograms are calculated in a 7 7neighborhood.
The results depicted in Table III show that the application ofthe region merging process reduced to a great extent the level ofmisclassified regions.
The confusion matrix (Table IV) constructed for all materialsevaluated in this study reveals that most errors are caused by the
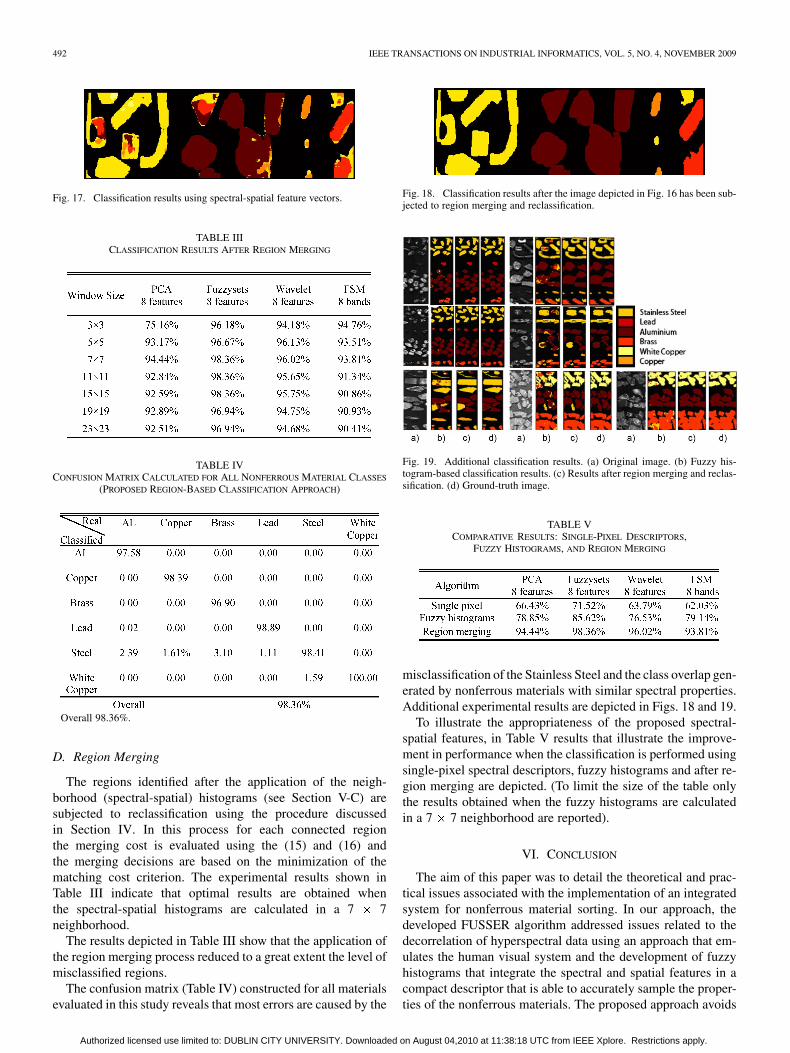
Fig. 18. Classification results after the image depicted in Fig. 16 has been sub-jected to region merging and reclassification.
Fig. 19. Additional classification results. (a) Original image. (b) Fuzzy his-togram-based classification results. (c) Results after region merging and reclas-sification. (d) Ground-truth image.
TABLE VCOMPARATIVE RESULTS: SINGLE-PIXEL DESCRIPTORS,
FUZZY HISTOGRAMS, AND REGION MERGING
misclassification of the Stainless Steel and the class overlap gen-erated by nonferrous materials with similar spectral properties.Additional experimental results are depicted in Figs. 18 and 19.
To illustrate the appropriateness of the proposed spectral-spatial features, in Table V results that illustrate the improve-ment in performance when the classification is performed usingsingle-pixel spectral descriptors, fuzzy histograms and after re-gion merging are depicted. (To limit the size of the table onlythe results obtained when the fuzzy histograms are calculatedin a 7 7 neighborhood are reported).
VI. CONCLUSION
The aim of this paper was to detail the theoretical and prac-tical issues associated with the implementation of an integratedsystem for nonferrous material sorting. In our approach, thedeveloped FUSSER algorithm addressed issues related to thedecorrelation of hyperspectral data using an approach that em-ulates the human visual system and the development of fuzzyhistograms that integrate the spectral and spatial features in acompact descriptor that is able to accurately sample the proper-ties of the nonferrous materials. The proposed approach avoids
Authorized licensed use limited to: DUBLIN CITY UNIVERSITY. Downloaded on August 04,2010 at 11:38:18 UTC from IEEE Xplore. Restrictions apply.
PICÓN et al.: FUZZY SPECTRAL AND SPATIAL FEATURE INTEGRATION FOR CLASSIFICATION OF NONFERROUS MATERIALS 493
the requirement of complex and subjective training proceduresand at the same time allows the construction of elaborate statis-tical models that can be applied for robust nonferrous materialclassification. To further improve the classification results, wehave devised a region merging postprocessing scheme that isapplied to reclassify the connected regions in agreement withthe minimization of a matching cost criterion.
In this study, a large number of experiments have been con-ducted to evaluate the efficiency of the proposed system. Inthis regard, the experimental data reported in this paper indi-cates that the unprocessed (raw) hyperspectral information isnot suitable to accurately capture the characteristics of the non-ferrous materials. Our experiments revealed that significant im-provements are obtained when the material classification is per-formed on decorrelated hyperspectral data. Another key issuerelated to the implementation of the material-sorting algorithmdescribed in this paper resides in the integration of the spatialand spectral features in a compact image descriptor. The exper-imental data clearly demonstrate that considerably improved re-sults are obtained when the characteristics of the analyzed non-ferrous materials are modeled using the proposed fuzzy spectralhistograms to achieve spatial feature integration. The nonfer-rous material classification (FUSSER) algorithm attained over98% correct classification when applied to the identificationof the WEEE scraps containing six different nonferrous mate-rials (white copper, aluminum, Stainless Steel, brass, copper andlead).
The experimental results indicate that most errors are causedby the misclassification of the Stainless Steel. To reduce therate of misclassification associated with this material, futurework will be concentrated on the development of multiresolu-tion classification schemes that will be applied to increase thediscriminative power of the proposed spectral-spatial features.Additional future work will also explore the feasibility of im-plementing the proposed classification algorithm on a hardwareplatform in order to achieve the computational speed requiredfor real-time operation and to investigate the application of mul-tiple narrowband illumination arrangements to improve the dis-crimination between the Stainless Steel and the other nonferrousmaterials with similar spectral properties.
ACKNOWLEDGMENT
We would like to thank Robotiker-Tecnalia, Specim, andSORMEN Project Consortium for providing the data and thenonferrous materials that have been used in the validation ofthe proposed algorithm.
REFERENCES
[1] Directive 2002/96/EC of the European Parliament and of the Councilof 27 January 2003, “Waste electrical and electronic equipment(WEEE)”—Joint declaration of the European Parliament, the Counciland the Commission relating to Article 9.
[2] SORMEN, “Innovative separation method for nonferrous metal wastefrom electric and electronic equipment (WEEE) based on multi- andhyper-spectral identification project,” Sixth Framework ProgrammeHorizontal Research Activities Involving SMES Co-Operative Re-search, 2006. [Online]. Available: http://www.sormen.org/
[3] A. Bereciartua and J. Echazarra, “Sistema basado en identificaciónmultiespectral para la separación de metales no férricos en WEEE enlogísitica inversa,” in Proc. 1er Congreso de Logística y Gestión de laCadena de Suministro, 2007, (electronic proceedings).
[4] D. B. Spencer, “The high-speed identification and sorting of nonferrousscrap,” J. Minerals, Metals and Materials Society, vol. 57, no. 4, pp.46–51, 2005.
[5] M. Kutila, J. Viitanen, and A. Vattulainen, “Scrap metal sorting withcolour vision and inductive sensor array,” in Proc. Comput. Intell. Mod-elling, Control, Autom., Vienna, Austria, 2005, pp. 725–729.
[6] E. J. Sommer, C. E. Ross, and D. B. Spencer, “Method and apparatusfor sorting materials according to relative composition,” U.S. Patent7,099,433, 2006.
[7] D. A. Wahab, A. Hussain, E. Scavino, M. Mustafa, and H. Basri, “De-velopment of a prototype automated sorting system for plastic recy-cling,” Amer. J. Appl. Sci., vol. 3, no. 7, pp. 1924–1928, 2006.
[8] A. J. Gesing, “ELVs: How they fit in the global material recyclingsystem and with technologies developed for production or recycling ofother products and materials,” in Proc. 6th Int. Automobile RecyclingCongress, Amsterdam, The Netherlands, 2006.
[9] C. I. Chang, Hyperspectral Imaging: Techniques for Spectral Detectionand Classification. Norwell, MA: Kluwer, 2003, 0-306-47483-5.
[10] B. Tso and R. C. Olsen, “Scene classification using combined spectral,textural and contextual information,” in Proc. SPIE, ATMHUI X, 2004,pp. 135–146.
[11] Specim Spectral Imaging Ltd. [Online]. Available: http://www.specim.fi/
[12] Z. Pan, G. Healey, M. Prasad, and B. Tromberg, “Face recognition inhyperspectral images,” IEEE Trans. Pattern Anal. Mach. Intell., vol.25, no. 12, pp. 1552–1560, 2003.
[13] D. Naso, B. Turchiano, and P. Pantaleo, “A fuzzy-logic based opticalsensor for online weld defect-detection,” IEEE Trans. Ind. Inform., vol.1, no. 4, pp. 259–273, 2005.
[14] , H. Grahn and P. Geladi, Eds., Techniques and Applicationsof Hyperspectral Image Analysis. New York: Wiley, 2007, 10:0-470-01086-X.
[15] D. Slater and G. Healey, “Material classification for 3D objects inaerial hyperspectral images,” in Proc. IEEE Computer Society Conf.Comput. Vision and Pattern Recognition (CVPR’99), 1999, vol. 2, pp.2262–2267.
[16] G. Healey and D. Slater, “Models and methods for automated materialidentification in hyperspectral imagery acquired under unknown illu-mination and atmospheric conditions,” IEEE Trans. Geosci. RemoteSensing, vol. 37, no. 6, pp. 2706–2717, 1999.
[17] N. Keshava, “Distance metrics and band selection in hyperspectralprocessing with application to material classification and spectrallibraries,” IEEE Trans. Geosci. Remote Sensing, vol. 42, no. 7, pp.1552–1565, 2004.
[18] C. Willis, “Hyperspectral image classification with limited trainingdata samples using feature subspaces,” in Proc. SPIE Algorithmsand Technologies for Multispectral, Hyperspectral and UltraspectralImagery X, 2004, vol. 5425, no. 1, pp. 170–181.
[19] G. Acciani, G. Brunetti, and G. Fornarelli, “Application of neural net-works in optical inspection and classification of solder joints in sur-face mount technology,” IEEE Trans. Ind. Inform., vol. 2, no. 3, pp.200–209, 2006.
[20] B. K. Feather, S. A. Fulkerson, J. H. Jones, R. A. Reed, M. Simmons,D. Swann, W. E. Taylor, and L. S. Bernstein, “Compression techniquefor plume hyperspectral images,” in Proc. SPIE Algorithms and Tech-nologies for Multispectral, Hyperspectral and Ultraspectral ImageryXI, 2005, vol. 5806, no. 1, pp. 66–77.
[21] C. Y. Kuan and G. Healey, “Band selection for recognition using mo-ment invariants,” in Proc. SPIE Algorithms and Technologies for Multi-spectral, Hyperspectral and Ultraspectral Imagery XI, 2005, vol. 5806,no. 1, pp. 122–130.
[22] S. Perkins, K. Edlund, D. Esch-Mosher, D. Eads, N. Harvey, and S.Brumby, “Genie Pro: Robust image classification using shape, textureand spectral information,” in Proc. SPIE Algorithms and Technologiesfor Multispectral, Hyperspectral and Ultraspectral Imagery XI, 2005,pp. 139–148.
[23] D. Manolakis and D. Marden, “Dimensionality reduction of hyperspec-tral imaging data using local principal component transforms,” in Proc.SPIE Algorithms and Technologies for Multispectral, Hyperspectraland Ultraspectral Imagery X, 2004, vol. 5425, no. 1, pp. 393–401.
Authorized licensed use limited to: DUBLIN CITY UNIVERSITY. Downloaded on August 04,2010 at 11:38:18 UTC from IEEE Xplore. Restrictions apply.
494 IEEE TRANSACTIONS ON INDUSTRIAL INFORMATICS, VOL. 5, NO. 4, NOVEMBER 2009
[24] P. Tatzer, M. Wolf, and T. Panner, “Industrial application for inlinematerial sorting using hyperspectral imaging in the NIR range,” Real-Time Imaging, vol. 11, no. 2, pp. 99–107, 2005, Spectral Imaging II.
[25] P. Kempeneers, S. De Backer, W. Debruyn, P. Coppin, and P. Sche-unders, “Generic wavelet-based hyperspectral classification applied tovegetation stress detection,” IEEE Trans. Geosci. Remote Sensing, vol.43, no. 3, pp. 610–614, 2005.
[26] J. Wang and C. I. Chang, “Independent component analysis-baseddimensionality reduction with applications in hyperspectral imageanalysis,” IEEE Trans. Geosci. Remote Sensing, vol. 44, no. 6, pp.1586–1600, 2006.
[27] H. Kwon, S. Z. Der, N. M. Nasrabadi, and H. Moon, “Use of hyper-spectral imagery for material classification in outdoor scenes,” in Proc.SPIE Series, Algorithms, Devices, and Systems for Optical InformationProcessing III, Denver, CO, 1999, vol. 3804, pp. 104–115.
[28] B. Guo, R. I. Damper, S. R. Gunn, and J. D. B. Nelson, “A fast separa-bility based feature-selection method for high-remotely sensed imageclassification,” Pattern Recogn., vol. 41, pp. 1653–1662, 2008.
[29] J. M. Geusebroek, R. Boomgaard, A. W. M. Smeulders, and H. Geerts,“Color invariance,” IEEE Trans. Pattern Anal. Mach. Intell., vol. 23,no. 12, pp. 1338–1350, 2001.
[30] D. Manolakis, C. Siracusa, and G. Shaw, “Hyperspectral subpixeltarget detection using the linear mixing model,” IEEE Trans. Geosci.Remote Sensing, vol. 39, no. 7, pp. 1392–1409, 2001.
[31] J. Broadwater and R. Chellappa, “Hybrid detectors for subpixel tar-gets,” IEEE Trans. Pattern Anal. Mach. Intell., vol. 29, no. 11, pp.1891–1903, 2007.
[32] G. Mercier and M. Lennon, “On the characterization of hyperspec-tral texture,” in Proc. IEEE Int. Geosci. Remote Sensing Symp.(IGARSS’02), 2002, vol. 5, pp. 2584–2586.
[33] G. Rellier, X. Descombes, J. Zerubia, and F. Falzon, “A Gauss-Markovmodel for hyperspectral texture analysis of urban areas,” in Proc. 16thInt. Conf. Pattern Recogn. (ICPR’02), 2002, vol. 1, pp. 692–695.
[34] B. Ramakrishna, J. Wang, C. Chang, A. Plaza, H. Ren, C. C. Chang,J. L. Jensen, and J. O. Jensen, “Spectral/spatial hyperspectral imagecompression in conjunction with virtual dimensionality,” in Proc. SPIEAlgorithms and Technologies for Multispectral, Hyperspectral and Ul-traspectral Imagery XI, 2005, vol. 5806, no. 1, pp. 772–781.
[35] S. Shafer, “Using color to separate reflection components,” Color Re-search and Applications, vol. 10, pp. 210–218, 1985.
[36] R. T. Tan, K. Nishino, and K. Ikeuchi, “Separating reflection compo-nents based on chromaticity and noise analysis,” IEEE Trans. PatternAnal. Mach. Intell., vol. 26, no. 10, pp. 1373–1379, 2004.
[37] H. Stockman and T. Gevers, “Detection and classification of hyper-spectral edges,” in Proc. 10th British Mach. Vision Conf. (BMVC),1999, pp. 643–651.
[38] , A. Gorban, B. Kegl, D. Wunsch, and A. Zinovyev, Eds., PrincipalManifolds for Data Visualization and Dimension Reduction. NewYork: Springer, 2007, vol. 58, LNCS, 978-3-540-73749-0.
[39] C. M. Bishop, Pattern Recognition and Machine Learning. NewYork: Springer, 2006, 10: 0-387-31073-8.
[40] H. Kwon and N. M. Nasrabadi, “Kernel matched subspace detectorsfor hyperspectral target detection,” IEEE Trans. Pattern Anal. Mach.,vol. 28, no. 2, pp. 178–194, 2006.
[41] S. Abe and M. S. Lan, “A method for fuzzy rules extraction directlyfrom numerical data and its application to pattern classification,” IEEETrans. Fuzzy Syst., vol. 3, no. 1, pp. 18–28, 1995.
[42] M. R. Emami, I. B. Turksen, and A. Goldenberg, “Development of afuzzy systematic methodology of fuzzy logic modeling,” IEEE Trans.Fuzzy Syst., vol. 6, no. 3, pp. 346–361, 1998.
[43] A. M. Martinez and A. C. Kak, “PCA versus LDA,” IEEE Trans. Pat-tern Anal. Mach. Intell., vol. 23, no. 2, pp. 228–233, 2001.
[44] P. Comon, “Independent component analysis: A new concept?,” SignalProcessing, vol. 36, no. 3, pp. 287–314, 1994.
[45] C. I. Chang, Hyperspectral Data Exploitation: Theory and Applica-tions. New York: Wiley, 2007, p. 227.
[46] S. J. Sangwine and R. E. N. Horne, The Colour Image ProcessingHandbook. New York: Springer, 1998, 0412806207.
[47] P. Pudil, J. Novovicova, and J. Kittler, “Floating search methods in fea-ture selection,” Pattern Recogn. Lett., vol. 15, no. 11, pp. 1119–1125,1994.
Artzai Picón received the M.Eng. degree in indus-trial engineering, the M.Res. degree in automaticselectronics and control, and the Ph.D. degrees fromthe University of the Basque Country, Spain, in2002, 2005, and 2009, respectively.
During the period 2000–2002, he collaboratedwith the Computer Image Processing Group (GTI2),Department of Systems Engineering and Automatics.Since then, he has been working as a Researcherfor the Tecnalia Research Corporation, where hehas been involved in over 30 research projects.
His research interests include image classification and segmentation and theapplication of these technologies to industrial tasks.
Dr. PicónIn received the Best M.Eng. Final Project Award from AccentureCompany for the implementation of a facial recognition system in 2002 and theONCE International Research and Development Award in New Technologiesfor The Blind and Visually Impaired in 2006.
Ovidiu Ghita received the BE. and M.E. degrees inelectrical engineering from Transilvania UniversityBrasov, Romania, and the Ph.D. degree from DublinCity University, Dublin, Ireland.
From 1994 to 1996, he was an Assistant Lec-turer in the Department of Electrical Engineering,Transilvania University. Since then he has been amember of the Vision Systems Group, Dublin CityUniversity (DCU) and currently holds a positionof DCU-Research Fellow. He has authored andcoauthored over 70 peer-reviewed research papers in
areas of instrumentation, range acquisition, machine vision, texture analysis,and medical imaging.
Paul F. Whelan (S’84–M’85–SM’01) received theB.Eng. (Hons) degree from National Institute ofHigher Education Dublin (NIHED), Dublin, Ireland,the M.Eng. degree from the University of Limerick,Limerick, Ireland, and the Ph.D. in computer visionfrom the University of Wales (Cardiff University),Cardiff, U.K.
From 1985 to 1990, he was employed by Industrialand Scientific Imaging, Ltd., and later Westinghouse(WESL), where he was involved in the research anddevelopment of high-speed computer vision systems.
He was appointed to the School of Electronic Engineering, Dublin City Univer-sity (DCU) in 1990 and is currently a Professor of Computer Vision (PersonalChair). He founded the Vision Systems Group in 1990 and the Centre for ImageProcessing and Analysis in 2006 and currently serves as its Director. As well aspublishing over 150 peer reviewed papers, he has coauthored two monographsand coedited three books. His research interests include image segmentation,and its associated quantitative analysis with applications in computer/machinevision and medical imaging.
Prof. Whelan is a Fellow of IET, Chartered Engineer, and a member of IAPR.He served as a member of the governing board (1998–2007) of the InternationalAssociation for Pattern Recognition (IAPR), a member of the International Fed-eration of Classification Societies (IFCS) council, and President of the IrishPattern Recognition and Classification Society (IPRCS) (1998–2007). He is aHEA-PRTLI (RINCE, NBIP) funded principal investigator.
Pedro M. Iriondo received the degree in industrialengineering in 1981. He received the Ph.D. degree inindustrial engineering—electronics and control engi-neering from the University of the Basque CountryUPV-EHU, Spain, in 2001.
In 1981, he began his professional activity workingin different companies. In 1986, he founded the com-pany Adicorp dedicated to the research, integration,and development of industrial vision systems. Since1989, he has been an Assistant Professor with theDepartment of Automatic Control and Systems En-
gineering, ETSI of Bilbao, University of the Basque Country UPV-EHU. Cur-rently, he is the Assistant Director of the School of Engineering of Bilbao re-sponsible for relations with private companies. His research interest is focusedin the fields of image processing, face detection and recognition, image trans-mission and stochastic systems.
Authorized licensed use limited to: DUBLIN CITY UNIVERSITY. Downloaded on August 04,2010 at 11:38:18 UTC from IEEE Xplore. Restrictions apply.