Embed Size (px)
Citation preview
IEEE TRANSACTIONS ON IMAGE PROCESSING, VOL. 14, NO. 8, AUGUST 2005 1159
Three-Dimensional Surface ReconstructionFrom Multistatic SAR Images
Brian D. Rigling, Member, IEEE, and Randolph L. Moses, Senior Member, IEEE
Abstract—This paper discusses reconstruction of three-di-mensional surfaces from multiple bistatic synthetic apertureradar (SAR) images. Techniques for surface reconstruction frommultiple monostatic SAR images already exist, including interfer-ometric processing and stereo SAR. We generalize these methodsto obtain algorithms for bistatic interferometric SAR and bistaticstereo SAR. We also propose a framework for predicting theperformance of our multistatic stereo SAR algorithm, and, fromthis framework, we suggest a metric for use in planning strategicdeployment of multistatic assets.
Index Terms—Bistatic, ground map, surface reconstruction, syn-thetic aperture radar (SAR), three-dimensional (3-D).
I. INTRODUCTION
RECENT developments in unmanned aerial vehicle (UAV)technology is spurring new interest in the fields of bistatic
and multistatic synthetic aperture radar (SAR) [1]–[8]. A low-cost UAV may be teamed with a high-power transmitter at a safestandoff distance to conduct passive ground surveillance usingbistatic SAR. Receiving platforms may also exploit illuminatorsof opportunity including overpassing satellites and local com-mercial broadcasters.
Several authors have considered bistatic SAR image forma-tion (see, e.g., [9]–[12]). Soumekh [11], [13] suggests usingmultiple receiving platforms with a single transmitting platformto form a multistatic system. A multistatic system can be used toform a set of bistatic images. Additionally, the multiple bistaticimages can be coherently or incoherently combined to form athree-dimensional (3-D) reconstruction of the imaged scene.
Earlier works involving multiple monostatic apertures haveillustrated methods for height estimation, including interfero-metric SAR [14]–[16] and stereo SAR [17], [18]. Interfero-metric SAR typically involves coherent processing of a pair ofimages formed from data collected by two separate antennas onthe same data collection platform and has proven to be effectiveat forming topographic ground maps of smoothly varying ter-rain. Stereo SAR requires two or more images formed by plat-forms separated in aspect angle. Height estimates are obtainedby measuring the layover differences between the images [19],[20]. High-resolution SAR systems that are becoming availablewill improve the performance of both algorithms in estimating
Manuscript received October 27, 2003; revised August 17, 2004. The asso-ciate editor coordinating the review of this manuscript and approving it for pub-lication was Dr. Til Aach.
B. D. Rigling is with the Department of Electrical Engineering, Wright StateUniversity, Dayton, OH 45435-0001 USA (e-mail: [email protected]).
R. L. Moses is with the Department of Electrical and Computer Engi-neering, The Ohio State University, Columbus, OH 43210, USA (e-mail:[email protected]).
Digital Object Identifier 10.1109/TIP.2005.851690
the height of complex target substructures. As we will show,monostatic stereo techniques can be generalized for applicationto images created by a multistatic system, incorporating mul-tiple transmitting and receiving platforms, and interferometrictechniques may be applied to a pair of bistatic SAR images,formed by a receiver equipped with two or more antennas.
This paper develops the theory required for performing 3-Dsurface reconstruction using a multistatic SAR system. We de-rive the theory necessary for interferometric processing of twobistatic SAR images to obtain height estimates, and we pro-pose an algorithm which implements stereo processing of twoor more bistatic images. Our results generalize existing mono-static SAR algorithms. We provide a framework for predictingthe performance of the stereo SAR algorithm, and based on thisframework, we propose strategies for coordinating the receivingplatforms used in a multistatic system.
An outline of the paper is as follows. In Section II, we stateour model for bistatic phase history data collection and bistaticSAR image formation. Based on these models, we illustrate how3-D point scatterers are projected into a two-dimensional (2-D)bistatic SAR image. This projection is commonly known as lay-over. In Section III, we derive and demonstrate interferometricprocessing of a pair of registered bistatic SAR images. In Sec-tion IV, we generalize monostatic stereo SAR processing to de-velop an algorithm which estimates the heights of surfaces in ascene, based on the difference in layover between two bistaticimages formed at different look angles. In Section V, we ex-tend the stereo SAR concept to consider more than two bistaticapertures, and we provide a framework for predicting the per-formance of this algorithm. Our performance prediction frame-work allows us to suggest strategies for coordinating multistaticSAR systems. Finally, in Section VI, we state our conclusionsand outline areas of future work.
II. BISTATIC PHASE HISTORY DATA
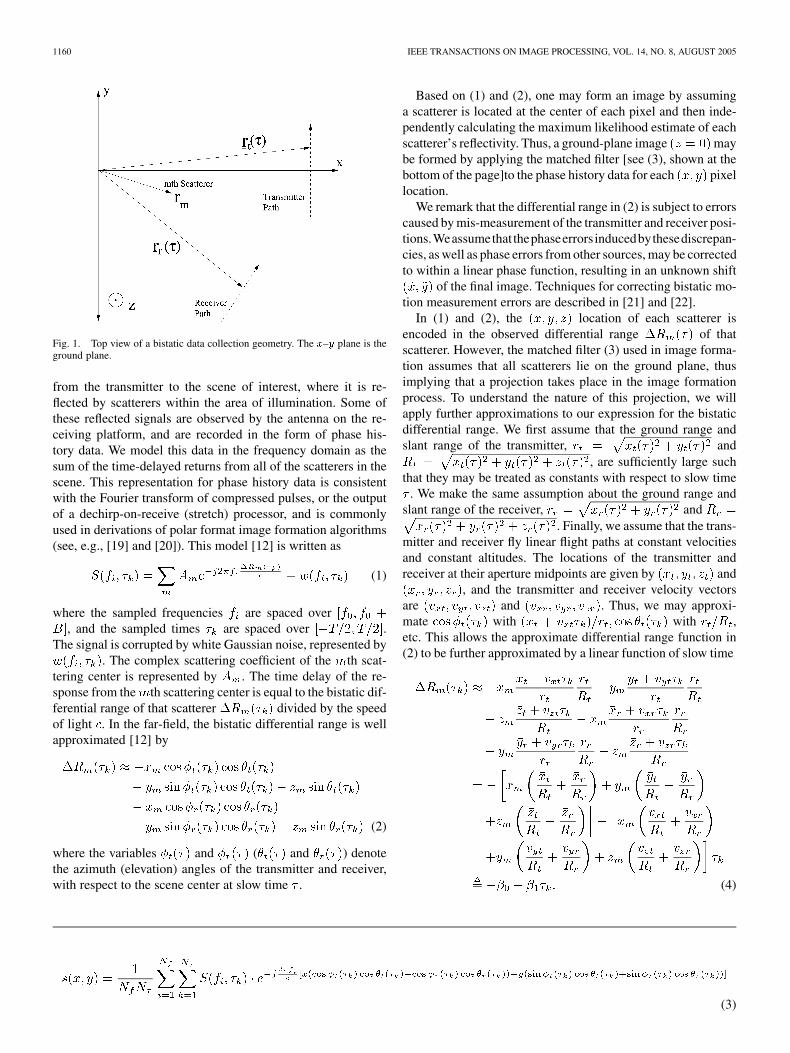
Consider the bistatic SAR data collection geometry shown inFig. 1. The center of the scene to be imaged is located at theorigin of coordinates, and the ground plane is the – plane.A scatterer within that scene is located at .At a given time , the location of the transmitter is
, and the location of the receiver is.
As the transmitter moves along its flight path, the radiatingantenna periodically transmits pulses of energy in the directionof the scene center. We assume that transmitted pulses have uni-form power over the frequency range , where
and represent the initial frequency and bandwidth of thetransmitted pulse, respectively. Each transmitted pulse travels
1057-7149/$20.00 © 2005 IEEE
1160 IEEE TRANSACTIONS ON IMAGE PROCESSING, VOL. 14, NO. 8, AUGUST 2005
Fig. 1. Top view of a bistatic data collection geometry. The x–y plane is theground plane.
from the transmitter to the scene of interest, where it is re-flected by scatterers within the area of illumination. Some ofthese reflected signals are observed by the antenna on the re-ceiving platform, and are recorded in the form of phase his-tory data. We model this data in the frequency domain as thesum of the time-delayed returns from all of the scatterers in thescene. This representation for phase history data is consistentwith the Fourier transform of compressed pulses, or the outputof a dechirp-on-receive (stretch) processor, and is commonlyused in derivations of polar format image formation algorithms(see, e.g., [19] and [20]). This model [12] is written as
(1)
where the sampled frequencies are spaced over, and the sampled times are spaced over .
The signal is corrupted by white Gaussian noise, represented by. The complex scattering coefficient of the th scat-
tering center is represented by . The time delay of the re-sponse from the th scattering center is equal to the bistatic dif-ferential range of that scatterer divided by the speedof light . In the far-field, the bistatic differential range is wellapproximated [12] by
(2)
where the variables and ( and ) denotethe azimuth (elevation) angles of the transmitter and receiver,with respect to the scene center at slow time .
Based on (1) and (2), one may form an image by assuminga scatterer is located at the center of each pixel and then inde-pendently calculating the maximum likelihood estimate of eachscatterer’s reflectivity. Thus, a ground-plane image maybe formed by applying the matched filter [see (3), shown at thebottom of the page]to the phase history data for each pixellocation.
We remark that the differential range in (2) is subject to errorscaused by mis-measurement of the transmitter and receiver posi-tions.Weassumethat thephaseerrors inducedbythesediscrepan-cies, as well as phase errors from other sources, may be correctedto within a linear phase function, resulting in an unknown shift
of the final image. Techniques for correcting bistatic mo-tion measurement errors are described in [21] and [22].
In (1) and (2), the location of each scatterer isencoded in the observed differential range of thatscatterer. However, the matched filter (3) used in image forma-tion assumes that all scatterers lie on the ground plane, thusimplying that a projection takes place in the image formationprocess. To understand the nature of this projection, we willapply further approximations to our expression for the bistaticdifferential range. We first assume that the ground range andslant range of the transmitter, and
, are sufficiently large suchthat they may be treated as constants with respect to slow time
. We make the same assumption about the ground range andslant range of the receiver, and
. Finally, we assume that the trans-mitter and receiver fly linear flight paths at constant velocitiesand constant altitudes. The locations of the transmitter andreceiver at their aperture midpoints are given by and
, and the transmitter and receiver velocity vectorsare and . Thus, we may approxi-mate with with ,etc. This allows the approximate differential range function in(2) to be further approximated by a linear function of slow time
(4)
(3)
RIGLING AND MOSES: THREE-DIMENSIONAL SURFACE RECONSTRUCTION FROM MULTISTATIC SAR IMAGES 1161
Equation (4) describes a transformation which relates thelinear approximation of the differential range
to the actual location of a scatterer in the scene.This transformation may be written as
(5)
In contrast, the image formation process implicitly assumes thatscatterers are located on the ground plane , and, thus,defines a transformation
(6)
relating the linear approximation of the differential range to anpixel location. It is at this approximate pixel location
that a point response will appear, corresponding tothe original scatterer located at . Thus, using (5)and (6), we define the linear operation that projects 3-D pointscatterers into a 2-D image as
(7)
Note that if , thenand scatterers project vertically onto a ground-plane image. TheSAR imaging phenomenon represented by the projection opera-tion in (7), wherein 3-D scattering center locations are projectedinto the 2-D SAR image, is commonly known as layover [19],[20]. Equation (7) forms the basis of both the interferometric andthe stereo height estimation techniques developed in the nexttwo sections.
III. BISTATIC INTERFEROMETRIC SAR
A. Theory
We now consider a bistatic interferometric system involving atransmitting platform and a single receiving platform equippedwith two physically separated receiving antennas. This allowsformation of two coherent bistatic SAR images, one from thephase history data from each receiving antenna. The differencesbetween these two images, caused by the physical separation ofthe receiving antennas, allows height estimation to be accom-plished interferometrically. Given the geometric configurationof the bistatic system, we can compute the projection matricesfor the two bistatic apertures; then, the ideal layover in eachimage due to a scatterer height of 1 m is
(8)
where and are defined for each of the two receiveantennas using (5) and (6). To examine the effect of layoveron images formed via matched filtering, we first rewrite (3)as
(9)
where we have factored out a constant phase shift correspondingto the center frequency of our collected data. The spacing be-tween frequency samples is given by , and the 2-D differentialrange function is given by (2) with . The en-velope of the imaged point scatterer is represented by ,and its phase is given by whereis the differential range at the midpoint of the synthetic aperture
.We now make a narrow-band assumption about our data, as-
suming that our frequency samples are close to the center fre-quency and that our samples in slow time areclose to . Using (4), (8), and (9), we may then approx-imate the effect of layover on each ground-plane bistatic SARimage as
(10)
(11)
where the response of the th scatterer is assumed to bedominant at . Equations (10) and (11) show that theprincipal effects of a nonzero height are to shift the envelope
to the laid over position and to shift the image phaseat that position. Given a sufficiently small separation betweenthe two receiving antennas, we now make the followingassumptions.
1) is small relative to the image resolution.2) is small relative to the image resolution.3)
.4) and .
These assumption are analogous to those used in monostaticIFSAR. The product of the first image and the complex
1162 IEEE TRANSACTIONS ON IMAGE PROCESSING, VOL. 14, NO. 8, AUGUST 2005
conjugate of the second image may, thus, be approximatedas
(12)
where . Examining the phase of
(13)
we see that the height of the dominant scatterer in an imagedpixel may be estimated as
(14)
Thus, interferometric height estimates may be computed fromtwo bistatic SAR images by computing the complex productof (12), taking the phase of this product and inserting it into(14). The maximum and minimum unambiguous heights may becalculated by substituting into (14). Note thatthe above result is derived based on a point scatterer assumption.Scintillation and decorrelation effects, which are not modeledhere, are a significant source of height estimation inaccuracy. Athorough discussion of these topics may be found in [19], [23],and [24].
B. Algorithm
Interferometric SAR processing begins by forming twobistatic SAR images, one from each of the receive antennas.These images may in general suffer from differing geo-loca-tion errors, thus requiring image registration to be applied inpost-processing. A constant false alarm rate detector [25] isthen applied to both images. For each pixel whose amplitudeexceeds the detection threshold, the complex product of (12)is computed, and the phase resulting from this product is usedin (14) to compute a height estimate for a scatterer which haslaid over into that pixel. Given a height estimate, we may alsoestimate the true location of a scatterer by removing theshift due to layover using (7) and (8). Specifically, if a scattereris observed in the first image at and has estimatedheight , then the true location of that scatterer maythen be computed as
(15)
This calculation is commonly known as ortho-rectification.Equation (15) represents a bistatic generalization of corre-sponding monostatic ortho-rectification equations found in,e.g., [19] and [20].
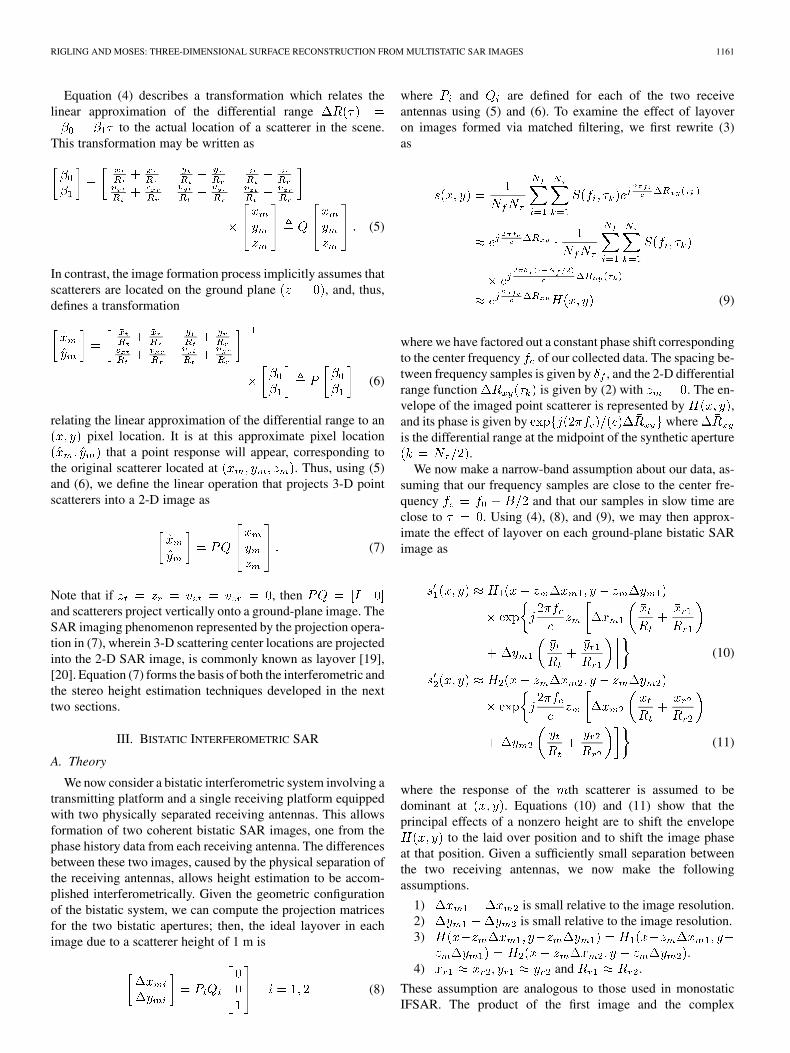
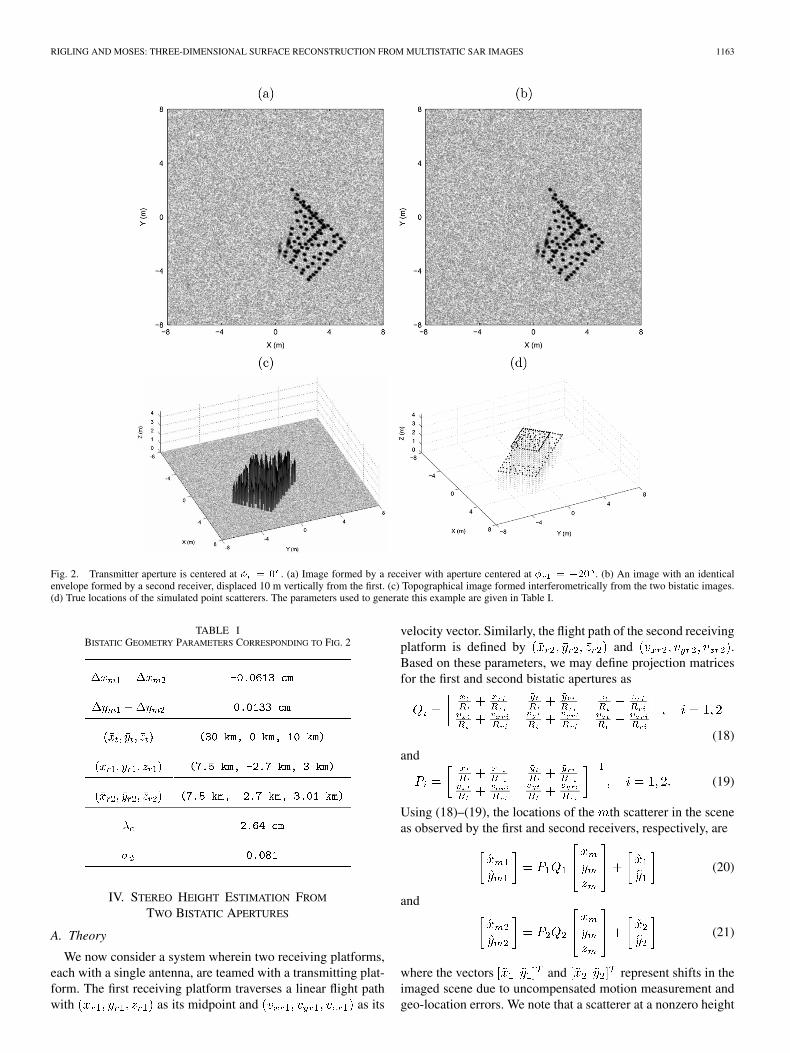
To demonstrate, we generated two images of a scene illumi-nated by a transmitter with a flight path centered on and or-thogonal to the positive axis. A simulated receiving platformwas located at an azimuth angle of and observedthe scene at broadside with two antenna. The two receiving an-tenna were given a vertical separation of 10 m. Fig. 2(a) and (b)shows the two bistatic images formed from each receiving an-tenna; their magnitudes are nearly identical, in keeping with as-sumptions (A-1)–(A-4) above, and differences in their phasesencode scatterer height. All of the scattering centers shown wereequal in amplitude, and they were scaled prior to addition ofwhite Gaussian noise in order to yield a peak signal-to-noiseratio (SNR) of 30 dB. The above algorithm was used to coher-ently process the two images in Fig. 2(a) and (b) to yield heightestimates for each point scatterer in the scene. The parametersused in this example are given in Table I. Fusing these heightestimates with one of the original images yields the 3-D recon-struction shown in Fig. 2(c). The true locations of the simulatedpoint scatterers are shown in Fig. 2(d). Note that Fig. 2(c) givesheight estimates only at the point scatterer locations, due to thepixel-by-pixel processing of IFSAR, and does not give the sur-face effect that we will see in stereo processing.
C. Performance
The accuracy of interferometric height estimates is typicallypredicted by assuming an uncertainty in the phase of (12). Here,we assume that this uncertainty, written as
(16)
is dependent on the sum of two components. The first term cor-responds to the phase noise induced in each image by the mea-surement noise represented in (1) by . Thesecond term models the phase scintillation observed in SARimages with slightly different look angles. It is expected thatwill decrease as Fourier resolution improves. This is based onthe assumption that phase scintillation is due in some degree tothe interference of multiple scatterers within a resolution cell.The RMS height estimation accuracy expected, given a phaseuncertainty of , is simply
(17)
The images of Fig. 2(a) and (b) contain point scatterers witha signal-to-noise ratio of 30 dB. For each pixel with an SNRabove 20 dB, we compared the estimated height of that pixel inFig. 2(c) to the actual scatterer height, yielding an RMS heightestimation accuracy of 30.6 cm. Inserting the parameters shownin Table I into (17) predicts an accuracy of centime-ters, where has been assumed to be zero. In practice, both thesimulated and predicted performance would be worsened by theeffects of scintillation and image decorrelation.
RIGLING AND MOSES: THREE-DIMENSIONAL SURFACE RECONSTRUCTION FROM MULTISTATIC SAR IMAGES 1163
Fig. 2. Transmitter aperture is centered at � = 0 . (a) Image formed by a receiver with aperture centered at � = �20 . (b) An image with an identicalenvelope formed by a second receiver, displaced 10 m vertically from the first. (c) Topographical image formed interferometrically from the two bistatic images.(d) True locations of the simulated point scatterers. The parameters used to generate this example are given in Table I.
TABLE IBISTATIC GEOMETRY PARAMETERS CORRESPONDING TO FIG. 2
IV. STEREO HEIGHT ESTIMATION FROM
TWO BISTATIC APERTURES
A. Theory
We now consider a system wherein two receiving platforms,each with a single antenna, are teamed with a transmitting plat-form. The first receiving platform traverses a linear flight pathwith as its midpoint and as its
velocity vector. Similarly, the flight path of the second receivingplatform is defined by and .Based on these parameters, we may define projection matricesfor the first and second bistatic apertures as
(18)
and
(19)
Using (18)–(19), the locations of the th scatterer in the sceneas observed by the first and second receivers, respectively, are
(20)
and
(21)
where the vectors and represent shifts in theimaged scene due to uncompensated motion measurement andgeo-location errors. We note that a scatterer at a nonzero height
1164 IEEE TRANSACTIONS ON IMAGE PROCESSING, VOL. 14, NO. 8, AUGUST 2005
will project differently into the two 2-D images formed fromthe two bistatic apertures, due to the difference in their layovergeometries and their individual platform motion measurementerrors. By measuring the difference in this projection, we mayestimate a height for that scatterer. We represent the layoveroffset of the th scatterer with
(22)
where is the registration error induced between the two im-ages due to their differing motion measurement errors. Further-more, we do not assume coherency of the image phases for thederivation below, and, in practice, it would be difficult, but notimpossible, to maintain image phase coherence across two dif-ferent platforms.
From (22), we may compute a height estimate for the thscattering center as
(23)
The lack of perfect geolocation prevents us from recovering anabsolute estimate of . However, all of the scatterers in thescene will suffer from the same height estimate offset . Thisimplies that relative height measurements, between two scat-tering centers, may still be meaningful. Given a point of refer-ence with a known height, the offset may be removed toyield absolute height estimates for each scatterer in the scene.
B. Algorithm
We will now describe an algorithm for performing multi-static stereo SAR height estimation. This implementation facestwo impediments. First, it is possible that multiple scatterersof different heights may layover into the same image location,thus complicating one’s ability to make accurate observations.Second, scatterers observed in the two images must be correctlyassociated, and adding to this difficulty, some scatterers may bevisible in one image but not the other. To circumvent these com-plications, we make the following standard assumptions.
B1) Scatterers lie on a surface that is smoothlyvarying, such that multiple scatterers do not layoverinto the same image location.
B2) This surface is locally flat.B3) Multiple scatterers on a locally flat area of this sur-
face may be correctly associated by cross correlationof subimages extracted from the two bistatic images.
Though integral to stereo height estimation algorithms, theseassumptions do not always hold in practice, and when violated,some performance loss may result.
Our algorithm for multistatic SAR stereo height estimation isa standard stereo matching technique based on cross correlation,which we briefly describe below. Two bistatic SAR images areformed on the same pixel grid. Given these two images, we firstapply a constant false alarm rate detector [25] to the first imageto obtain the pixel locations of strong scatterer returns. We thenapply a peak finding algorithm, such that out of a cluster of ad-jacent detections only the pixel with the largest magnitude isreturned. This effectively reduces the complexity of the algo-rithm by limiting the number of detected pixels correspondingto each point scatterer response in the image.
We now iterate through the list of peak detections and at-tempt to find the shift in location between each detection in thefirst image and the corresponding return in the second image.To do this, we extract a square subimage, centered about thecurrent peak detection, from the first image, and we extract alarger square subimage, centered about the same pixel location,from the second image. The subimage taken from the first imageshould be large enough to possess distinct features, which willsufficiently differentiate it from other areas of the scene. Thesize of the second subimage is determined by the size of thefirst subimage, the maximum shift expected due to layover dif-ferences, and the maximum shift expected due to geo-locationerrors. We now compute the 2-D cross correlation of the mag-nitudes of the two subimages. By extracting the location of thepeak cross correlation, we obtain the relative shift between thetwo subimages. After determining relative shifts for all of thepeak detections, we compute height estimates using (23) andorthorectify using (15).
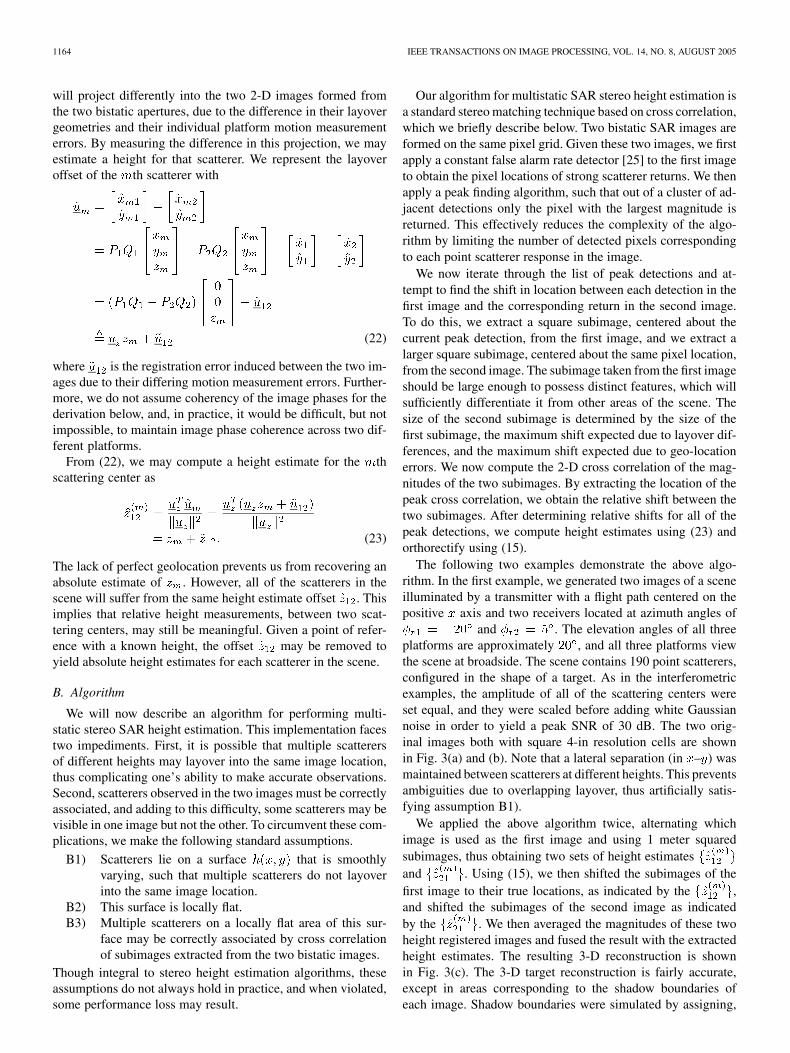
The following two examples demonstrate the above algo-rithm. In the first example, we generated two images of a sceneilluminated by a transmitter with a flight path centered on thepositive axis and two receivers located at azimuth angles of
and . The elevation angles of all threeplatforms are approximately , and all three platforms viewthe scene at broadside. The scene contains 190 point scatterers,configured in the shape of a target. As in the interferometricexamples, the amplitude of all of the scattering centers wereset equal, and they were scaled before adding white Gaussiannoise in order to yield a peak SNR of 30 dB. The two orig-inal images both with square 4-in resolution cells are shownin Fig. 3(a) and (b). Note that a lateral separation (in – ) wasmaintained between scatterers at different heights. This preventsambiguities due to overlapping layover, thus artificially satis-fying assumption B1).
We applied the above algorithm twice, alternating whichimage is used as the first image and using 1 meter squaredsubimages, thus obtaining two sets of height estimatesand . Using (15), we then shifted the subimages of thefirst image to their true locations, as indicated by the ,and shifted the subimages of the second image as indicatedby the . We then averaged the magnitudes of these twoheight registered images and fused the result with the extractedheight estimates. The resulting 3-D reconstruction is shownin Fig. 3(c). The 3-D target reconstruction is fairly accurate,except in areas corresponding to the shadow boundaries ofeach image. Shadow boundaries were simulated by assigning,
RIGLING AND MOSES: THREE-DIMENSIONAL SURFACE RECONSTRUCTION FROM MULTISTATIC SAR IMAGES 1165
Fig. 3. Transmitter aperture is centered at � = 0 . (a) Image formed by a receiver with aperture centered at � = �20 . (b) Image formed by a receiver withaperture centered at � = 5 . (c) Three-dimensional surface reconstruction formed from (a) and (b). Lateral separation between scatterers at different heightsprevents ambiguous height estimates.
on a pulse-by-pulse basis, an amplitude of 1 to scatterers withazimuth angles
(24)
within of the transmitter and receiver look angles, and byassigning an amplitude of 0 to all other scattering centers.
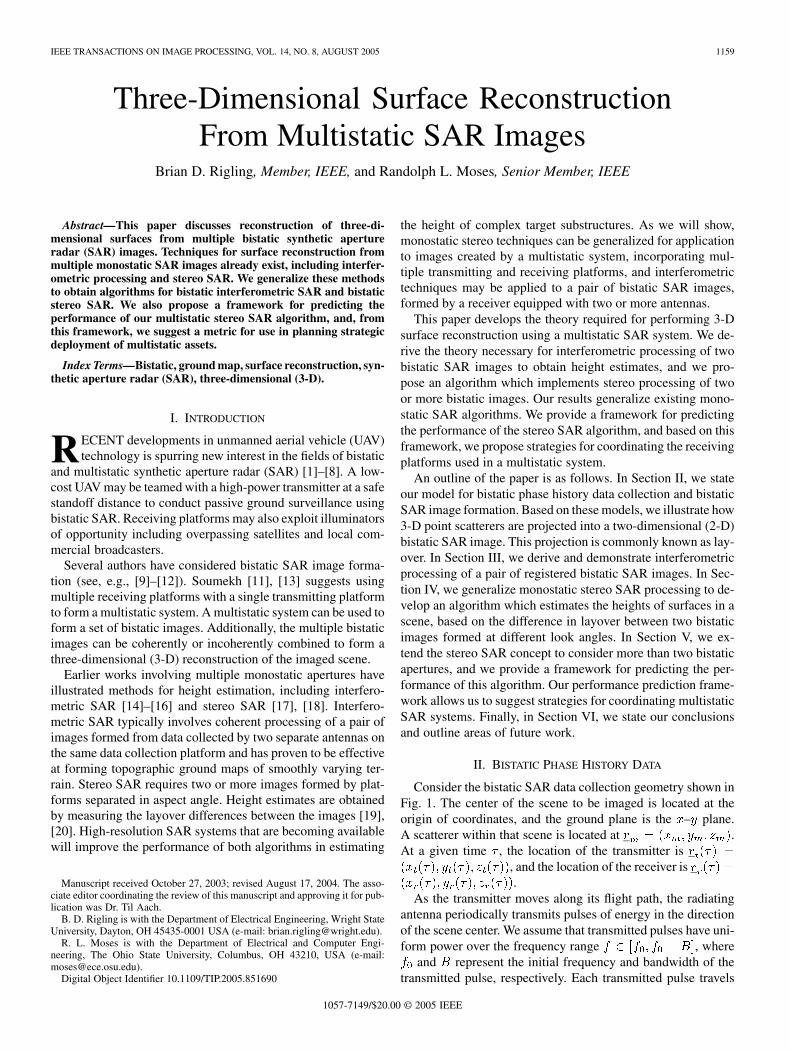
In the second example, the same data collection geometry wasimplemented, but the simulated scattering centers were arrayedin a tighter configuration in - . The second set of example im-ages is shown in Fig. 4(a) and (b), where geometry and scattererconfiguration used for the image shown in Fig. 4(a) is identicalto that which was used for Fig. 2(a). Stereo processing of theseimages gives the 3-D reconstruction shown in Fig. 4(c). One
may observe that regions containing scatterers laid over fromboth simulated heights are subject to greater variance in theirheight estimates. The accuracy of this reconstruction is lowerthan that of Fig. 3, but the 3-D shape of the object is still recog-nizable.
C. Performance
The accuracy of stereo height estimates depends on the geo-metric configuration of the transmit and receive platforms andalso depends on the accuracy of the relative shift estimates be-tween the extracted subimages. Image resolution, scatterer scin-tillation, subimage decorrelation, and interpolation accuracy allaffect the accuracy of the cross correlation. If one assumes thatthe shift estimates have Gaussian errors with zero means

1166 IEEE TRANSACTIONS ON IMAGE PROCESSING, VOL. 14, NO. 8, AUGUST 2005
Fig. 4. Transmitter aperture is centered at � = 0 . (a) Image formed by a receiver with aperture centered at � = �20 . (b) Image formed by a receiverwith aperture centered at � = 5 . (c) Three-dimensional surface reconstruction formed from (a) and (b). Tightly spaced scatterers lay over onto the same imageregions, thus hindering stereo height estimation.
and covariance , then, from (23), the variance of the relativeheight estimate is
(25)
where the unknown offset due to geolocation errors has beenomitted. The strong dependence on imaging geometry is em-bodied in the term in the denominator. The transmitterand receiver viewing angles determine the norm of , whichis equal to the layover offset between two images of a scattererwith 1-m height, is defined in (22). The variance of the shift es-timate errors (the diagonal elements of ) will decrease withimproved resolution and will increase with increasing clutterand noise powers in the image. The covariance can bewritten as
(26)
where is the variance of shift estimates in the direction,and is the variance of shift estimates in the direction.The unit vectors and correspond to nominal range andazimuth directions, such that and are related to rangeand azimuth resolution values. In images with square resolutioncells, will be diagonal.
To test the above assertions, we synthesized multi-static phase history data for the return from a singlepoint scatterer. The transmitting platform was located at
, and the two receiving platforms were lo-cated at and ,respectively. All three platforms viewed the scene at broadside.
In each of the 200 Monte Carlo simulations, two bistatic SARimages were formed, one corresponding to the phase historydata from each receiver. Within each image, a point scattererwas randomly placed, and white Gaussian noise, commensu-
RIGLING AND MOSES: THREE-DIMENSIONAL SURFACE RECONSTRUCTION FROM MULTISTATIC SAR IMAGES 1167
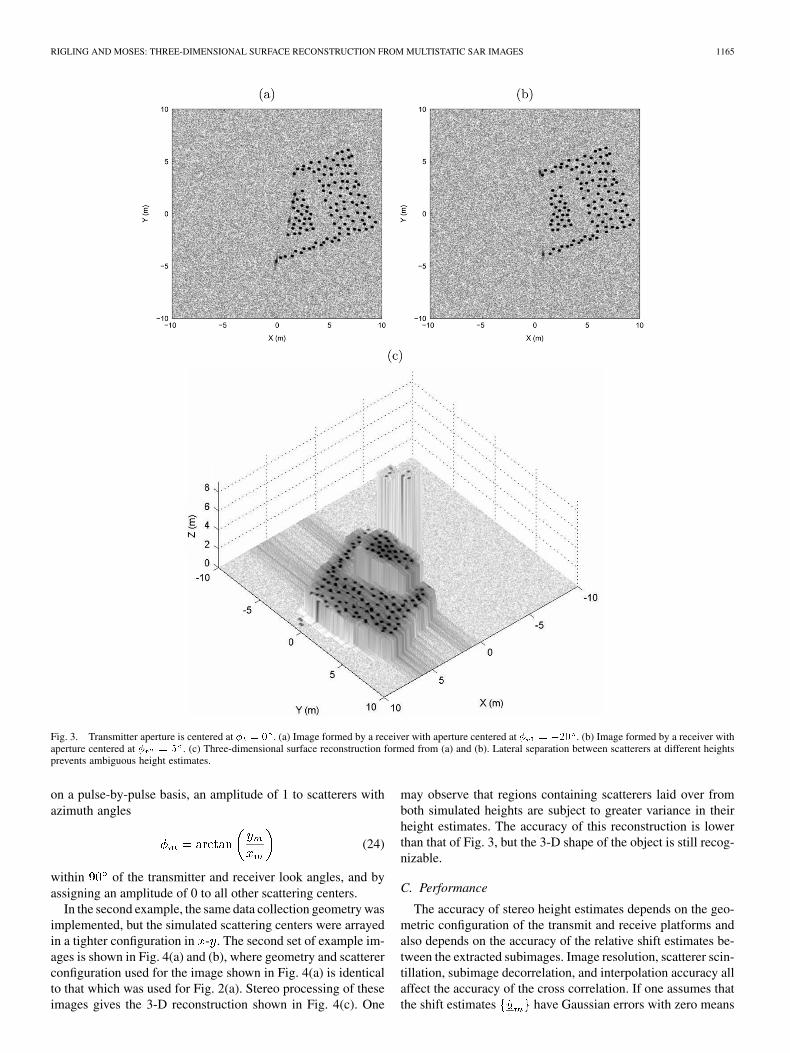
Fig. 5. (a) Predicted RMS accuracy of stereo height estimates (dotted lines) and observed RMS accuracy (solid lines) for a single, isolated point scatterer. Tworadar image resolutions are considered. (b) Observed RMS height error for the example in Fig. 3, for various SNR values.
rate with the SNR under study, was added. The relative shift ofthe scatterer between images was then estimated and subtractedfrom the actual shift, to yield a shift estimate error. After allMonte Carlo simulations for a particular SNR and resolutionhad been completed, the ensemble of shift estimate errors wasused to compute an estimate of in (26), which was theninput to (25) to obtain an estimate of . This value predictsthe variance of height estimates from a pair of bistatic SAR im-ages with a given SNR, a given resolution, and the describedgeometric configuration. Simulations were performed at SNRsranging from 15-30 dB, and with 4-in (0.1 m) and 12-in (0.3 m)square Fourier resolution cells.
Fig. 5(a) (without the thick line) compares the com-puted via simulation to the accuracy predicted by an approxi-mated Cramér–Rao lower bound (CRLB) [26]. The CRLB is awell-documented means for computing optimal achievable per-formance of unbiased estimators. The CRLB for a parametricmodel gives the minimum variance that an unbiased estimatorof that model can achieve in the presence of additive noise undera given distribution. The details involved in deriving our approx-imation of the CRLB are given in the Appendix. For moderateSNR, the algorithm provides performance close to the CRLB.At low SNR, the algorithm deviates from the CRLB because ofestimation errors in the correlation peak finding process. At highSNR, the deviation in algorithm performance is due to bias er-rors that result from using simple interpolation methods and im-ages that are less than twice over sampled; generation of highlyover-sampled images, and use of better interpolation methodsin the peak-finding algorithm, would reduce the bias, at the ex-pense of greater computational complexity.
Fig. 5(b) shows the RMS height accuracy values using thescenario from Fig. 3, but with differing SNR values. At eachSNR, the RMS height error is computed over all of the detectedscattering centers in the image. These results are not directlycomparable to the simulation errors or bounds in Fig. 5(a), be-cause, in this case, we have multiple scattering centers in eachsubimage. However, the observed performance for this complexscene has RMS height errors that are close to the CRLB predic-tion and simulation. We hypothesize that the lower RMS errorat low SNR [compared to the CRLB in Fig. 5(a)] is due to a
boosted SNR in some subimages, resulting from multiple scat-tering centers in the same subimage. At higher SNR, we hypoth-esize that the higher RMS values in Fig. 5(b) are caused by inter-ference between the multiple scattering centers in a subimage.Note that the results presented here represent a lower boundon predicted performance, as the simulated scene contained asingle point scatterer.
V. COORDINATION STRATEGIES FOR MULTISTATIC SAR
The performance prediction framework developed inSection IV may be extended to consider the availability of morethan two bistatic apertures. As each aperture will result in ascene shifted by that aperture’s motion measurement errors,these geo-location errors add a new layer of complexity tothe problem. Thus, for the remainder of our discussion, wewill assume that all of the multistatic images produced by oursystem are perfectly registered; therefore, the shift observedbetween subimages from different apertures is solely due tothe layover differences between those apertures. In Section IV,we demonstrated that the accuracy of stereo height estimatesfrom a pair of bistatic apertures is dependent on the variance ofrelative shift estimates, via in (25).
Note that in (25) is inversely proportional to , in-dicating that adding geometric diversity to increase the norm of
will enhance the quality of height estimates. However, thevariance expressed in (25) is based solely on the geometry ofthe respective bistatic apertures. It does not take into accountvariations in the visibility of scatterers in the scene and otherscintillation effects. By viewing a given target from two bistaticlook angles separated greatly enough in azimuth, one would nat-urally expect that the resultant images would be largely decorre-lated, and, thus, it would be impossible to accurately measure arelative shift. Therefore, we propose a quality measure definedas
(27)
where the quality of the height estimates obtained from theth and th images improves as increases. The function
1168 IEEE TRANSACTIONS ON IMAGE PROCESSING, VOL. 14, NO. 8, AUGUST 2005
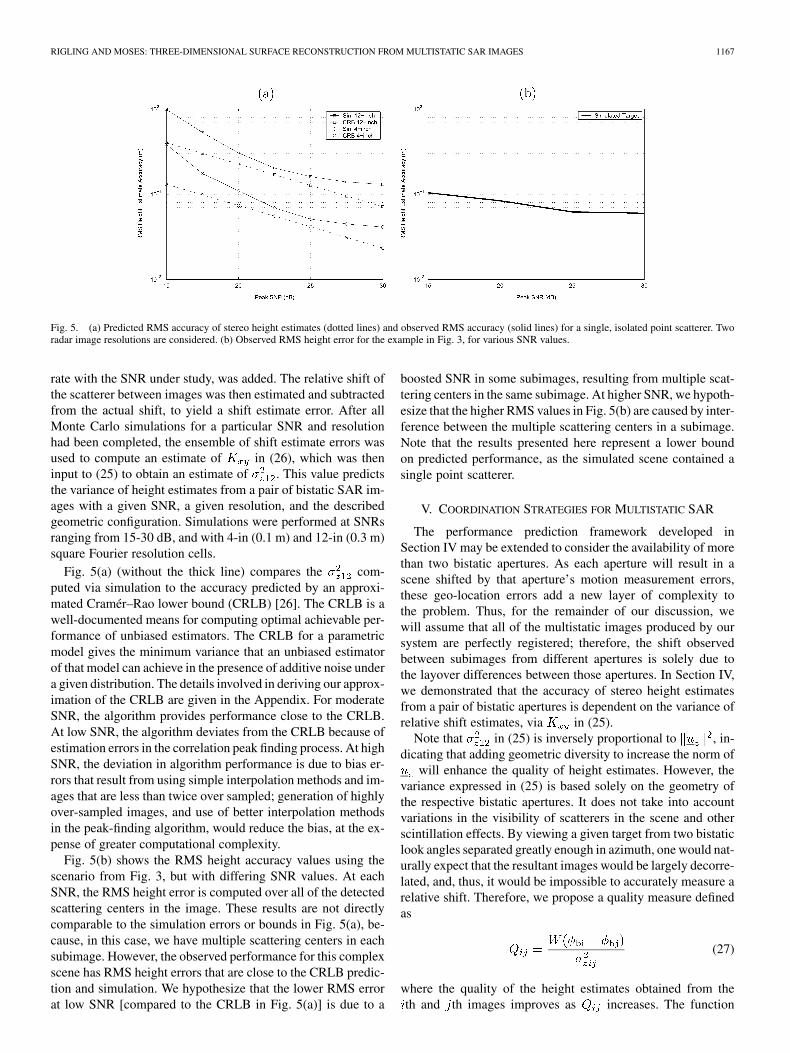
Fig. 6. (a) Height estimation quality of a two receiver multistatic system with transmitter at � = 0 azimuth and first receiver at � = �10 azimuth, as afunction of the location of the second receiver. (b) Positioning the second receiver at � = �40 or � = 20 gives the best predicted height estimation quality.
models the degree to which images formed fromtwo given bistatic look angles are correlated. The variablesand are the bistatic look angles of the th and th apertures.Zebker and Villasenor propose a triangular model for imagedecorrelation in [27]
(28)
In our experiments, we found that the above model and aGaussian model, which is more easily implemented in simula-tion software and gives a more intuitive result
(29)
behaved similarly.The quality metric given in (27) may also be applied to multi-
static scenarios involving more than a pair of bistatic apertures.Before evaluating the accuracy of height estimates from suchmultistatic systems, we must define a means of estimation. Onesimple method of computing a height estimate from multistaticmeasurements is to first compute a height estimate from each ofthe possible pairings of apertures and then to linearly combinethese estimates. The number of possible pairings in a system
consisting of apertures is . Based on the parame-
ters of each pair of apertures, one may use the methods of Sec-tion IV to compute a height estimate from the th and thapertures and to compute a variance for that estimate. Alinear estimator of the true height, given independent estimates,may then be calculated as
(30)
and the quality of this aggregate estimate is computed as
(31)
In actuality, the estimates will be correlated to some de-gree, depending on the azimuth spacing of the bistatic apertures.This implies (31) will function as an upper bound on the achiev-able height estimate quality.
Using (31) as a metric for predicted performance, withdefined by (25), we may propose strategies for coor-
dinating multistatic systems. We first consider an examplerequiring placement of a second receiver, given the locationof the transmitter and the first receiver, such that the heightestimation quality is maximized. We assume a Gaussiandecorrelation model, as in (29), with a spread of .The transmitter is located at , and the first receiver islocated at . The transmitter and receivers view thescene at broadside, and the elevation angles of the receiversand the transmitter are fixed at . Fig. 6(a) shows the heightestimation quality, computed using (27), as a function of theazimuth location of the second receiver. As one might expect,the height estimation accuracy at first improves as the receiverseparation increases; however, the scene decorrelation modeleventually begins to dominate and worsens the predictedperformance. As shown in Fig. 6(b), positioning the secondreceiver at or gives the best predictedheight estimation quality.
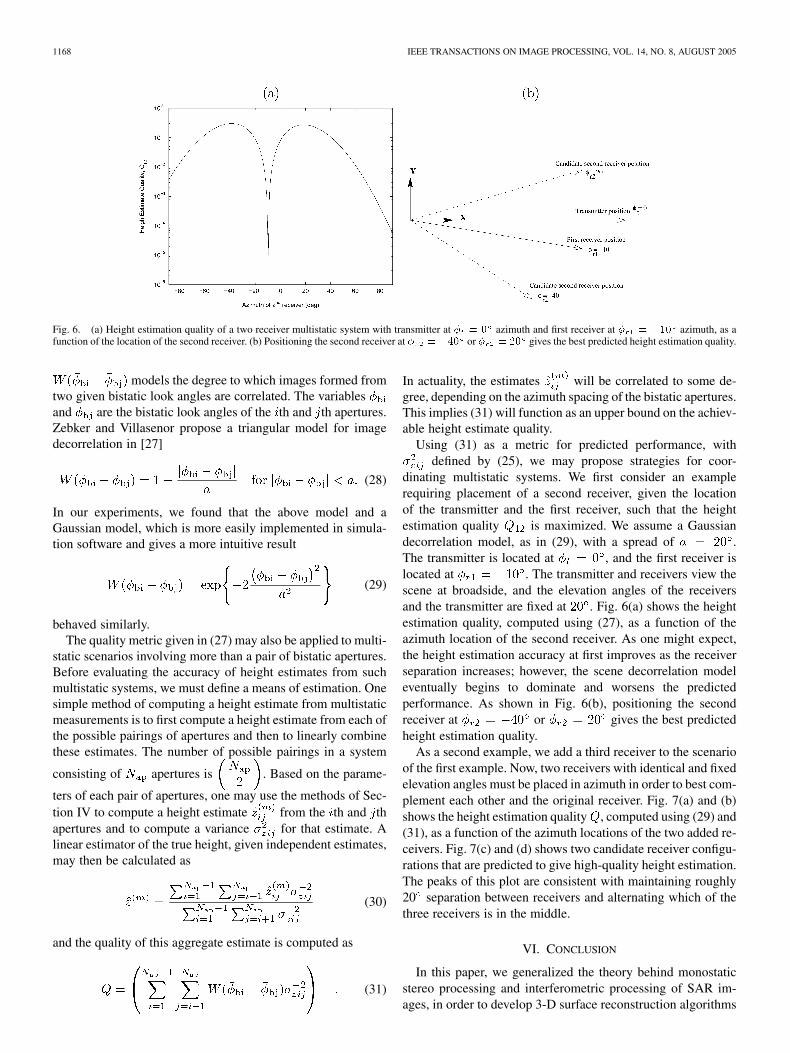
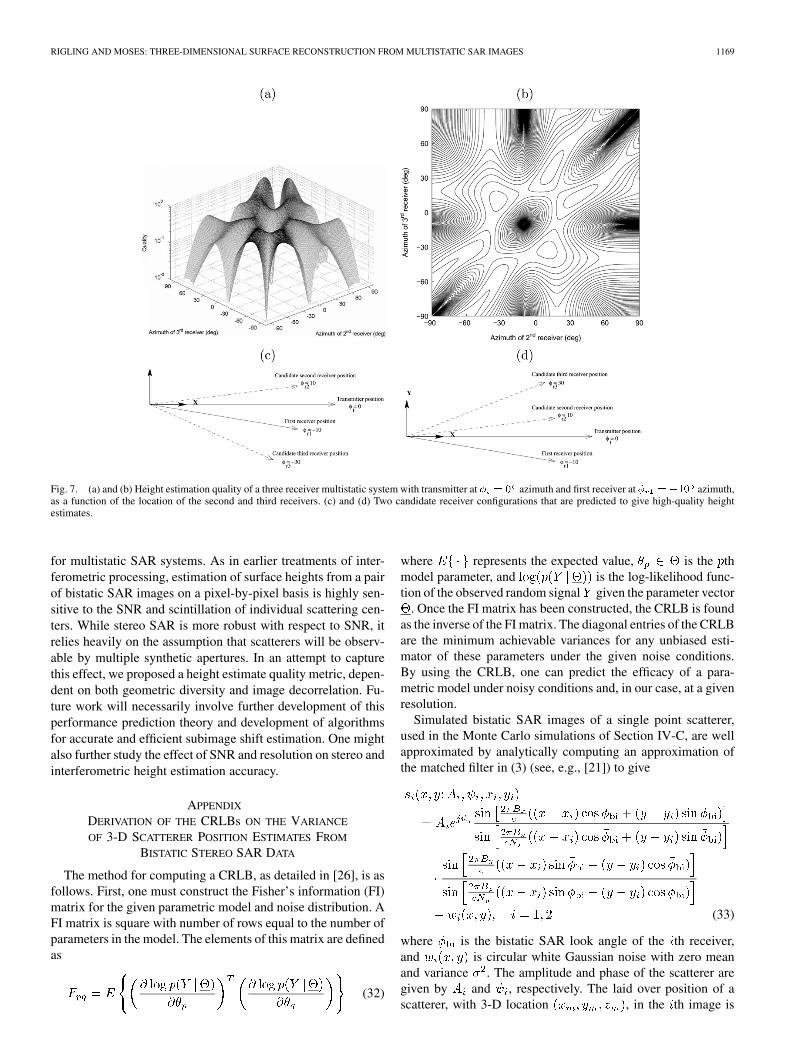
As a second example, we add a third receiver to the scenarioof the first example. Now, two receivers with identical and fixedelevation angles must be placed in azimuth in order to best com-plement each other and the original receiver. Fig. 7(a) and (b)shows the height estimation quality , computed using (29) and(31), as a function of the azimuth locations of the two added re-ceivers. Fig. 7(c) and (d) shows two candidate receiver configu-rations that are predicted to give high-quality height estimation.The peaks of this plot are consistent with maintaining roughly20 separation between receivers and alternating which of thethree receivers is in the middle.
VI. CONCLUSION
In this paper, we generalized the theory behind monostaticstereo processing and interferometric processing of SAR im-ages, in order to develop 3-D surface reconstruction algorithms
RIGLING AND MOSES: THREE-DIMENSIONAL SURFACE RECONSTRUCTION FROM MULTISTATIC SAR IMAGES 1169
Fig. 7. (a) and (b) Height estimation quality of a three receiver multistatic system with transmitter at � = 0 azimuth and first receiver at � = �10 azimuth,as a function of the location of the second and third receivers. (c) and (d) Two candidate receiver configurations that are predicted to give high-quality heightestimates.
for multistatic SAR systems. As in earlier treatments of inter-ferometric processing, estimation of surface heights from a pairof bistatic SAR images on a pixel-by-pixel basis is highly sen-sitive to the SNR and scintillation of individual scattering cen-ters. While stereo SAR is more robust with respect to SNR, itrelies heavily on the assumption that scatterers will be observ-able by multiple synthetic apertures. In an attempt to capturethis effect, we proposed a height estimate quality metric, depen-dent on both geometric diversity and image decorrelation. Fu-ture work will necessarily involve further development of thisperformance prediction theory and development of algorithmsfor accurate and efficient subimage shift estimation. One mightalso further study the effect of SNR and resolution on stereo andinterferometric height estimation accuracy.
APPENDIX
DERIVATION OF THE CRLBs ON THE VARIANCE
OF 3-D SCATTERER POSITION ESTIMATES FROM
BISTATIC STEREO SAR DATA
The method for computing a CRLB, as detailed in [26], is asfollows. First, one must construct the Fisher’s information (FI)matrix for the given parametric model and noise distribution. AFI matrix is square with number of rows equal to the number ofparameters in the model. The elements of this matrix are definedas
(32)
where represents the expected value, is the thmodel parameter, and is the log-likelihood func-tion of the observed random signal given the parameter vector
. Once the FI matrix has been constructed, the CRLB is foundas the inverse of the FI matrix. The diagonal entries of the CRLBare the minimum achievable variances for any unbiased esti-mator of these parameters under the given noise conditions.By using the CRLB, one can predict the efficacy of a para-metric model under noisy conditions and, in our case, at a givenresolution.
Simulated bistatic SAR images of a single point scatterer,used in the Monte Carlo simulations of Section IV-C, are wellapproximated by analytically computing an approximation ofthe matched filter in (3) (see, e.g., [21]) to give
(33)
where is the bistatic SAR look angle of the th receiver,and is circular white Gaussian noise with zero meanand variance . The amplitude and phase of the scatterer aregiven by and , respectively. The laid over position of ascatterer, with 3-D location , in the th image is
1170 IEEE TRANSACTIONS ON IMAGE PROCESSING, VOL. 14, NO. 8, AUGUST 2005
. The image is assumed to besupported by spatial frequency data in and with andsamples over bandwidths and , respectively. The ampli-tude of (33) has a Rician distribution, which is intractable forCRLB analysis. However, at high SNR, a Rician distribution[28] is well approximated by a Gaussian. This allows approxi-mation of the amplitude of (33) with
(34)
where is assumed to be white Gaussian with zero meanand variance .
We now wish to compute a lower bound on thevariance of estimates of the parameters
from the aggregate data set. For convenience, we
define the dummy variable , andwe reformat the data such that and are one-dimensionalvectors of length . Thus, the likelihood functionfor is
(35)
and the log-likelihood function is
(36)
where is a noisy realization of the signal with mean andvariance of on each frequency sample. Taking the deriva-tives of our log-likelihood function with respect to
yields
(37)
which can be computed for each element of . Next, we com-pute each entry of the Fisher matrix
(38)
The derivatives for the model of (34) with respect tomay be computed analytically or numer-
ically. Finally, the CRLB of our parameter set is defined to be
the inverse of the Fisher matrix, ; the lower boundon the variance of each parameter is given by the correspondingdiagonal element of , such that .
REFERENCES
[1] L. Cazzani et al., “A ground based parasitic SAR experiment,” in Proc.IEEE IGARSS, vol. 3, 1999, pp. 1525–1527.
[2] H. M. Jones, “Predicted properties of bistatic satellite images,” in Proc.IEEE Nat. Radar Conf., Apr. 1993, pp. 286–291.
[3] G. P. Cardillo, “On the use of the gradient to determine bistatic SARresolution,” in Proc. Antennas Propagation Soc. Int. Symp., vol. 2, May1990, pp. 1032–1035.
[4] Y. Wu and D. C. Munson, “Wide-angle ISAR passive imaging usingsmoothed pseudo Wigner-Ville distribution,” in Proc. IEEE RadarConf., 2001, pp. 363–368.
[5] J. Detlefsen, “Application of multistatic radar principles to shortrangeimaging,” Proc. Inst. Elect. Eng., vol. 133, no. 7, pp. 658–663, Dec.1986.
[6] C. Mikhail, K. Kurt, and N. David, “Bistatic synthetic aperture radarwith noncooperative LEOS based transmitter,” in Proc. IEEE Int. Geo-science and Remote Sensing Symp., vol. 2, 2000, pp. 861–862.
[7] A. M. Horne and G. Yates, “Bistatic synthetic aperture radar,” Proc. IEERadar, pp. 6–10, Oct. 2002.
[8] M. Lowe, “Algorithms for high resolution bistatic SAR,” Proc. IEERadar, pp. 512–515, Oct. 2002.
[9] O. Arikan and D. C. Munson, “A tomographic formulation of bistaticsynthetic aperture radar,” in Proc. ComCon, Oct. 1988, p. 418.
[10] A. D. M. Garvin and M. R. Inggs, “Use of synthetic aperture andstepped-frequency continuous wave processing to obtain radar images,”in Proc. South African Symp. Communications and Signal Processing,1991, pp. 32–35.
[11] M. Soumekh, “Bistatic synthetic aperture radar inversion with applica-tion in dynamic object imaging,” IEEE Trans. Signal Process., vol. 39,no. 9, pp. 2044–2055, Sep. 1991.
[12] B. D. Rigling and R. L. Moses, “Polar format algorithm for bistaticSAR,” IEEE Trans. Aerosp. Electron. Syst., to be published.
[13] M. Soumekh, “Multistatic echo imaging in remote sensing and di-agnostic medicine,” presented at the 6th Multidimensional SignalProcessing Workshop, 1989.
[14] L. C. Graham, “Synthetic interferometer radar for topographic map-ping,” Proc. IEEE, vol. 62, no. 6, pp. 763–768, Jun. 1974.
[15] H. Zebker and R. Goldstein, “Topographic mapping from interfero-metric SAR observations,” J. Geophys. Res., vol. 91, pp. 4993–4999,1986.
[16] A. K. Gabriel and R. M. Goldstein, “Crossed orbit interferometry:Theory and experimental results from SIR-B,” Int. J. Remote Sens., vol.9, pp. 857–872, 1988.
[17] M. D. Desai, “Spotlight mode SAR stereo technique for height compu-tation,” IEEE Trans. Image Process., vol. 6, no. 12, pp. 1400–1411, Dec.1997.
[18] C. V. Jakowatz Jr., D. E. Wahl, and P. A. Thompson, “Threedimen-sional SAR imaging using cross-track coherent stereo collections,” inProc. 31st Asilomar Conf. Signals, Systems, Computers, vol. 2, 1997,pp. 1199–1203.
[19] W. G. Carrara, R. S. Goodman, and R. M. Majewski, Spotlight Syn-thetic Aperture Radar: Signal Processing Algorithms. Norwood, MA:Artech House, 1995.
[20] C. V. Jakowatz, D. E. Wahl, and P. H. Eichel, Spotlight-Mode SyntheticAperture Radar: A Signal Processing Approach. Boston, MA: Kluwer,1996.
[21] B. Rigling, “Signal processing strategies for bistatic synthetic Aper-ture radar,” Ph.D. dissertation, Dept. Elect. Eng., The Ohio State Univ.,Columbus, 2003.
[22] B. D. Rigling and R. L. Moses, “Motion measurement errors and auto-focus in bistatic SAR,” IEEE Trans. Image Process., to be published.
[23] E. Rodriguez and J. M. Martin, “Theory and design of interferometricsynthetic aperture radars,” Proc. Inst. Elect. Eng., vol. 139, no. 2, pp.147–159, Apr. 1992.
[24] D. Just and R. Bamler, “Phase statistics of interferograms with appli-cations to synthetic aperture radar,” Appl. Opt., vol. 33, no. 20, pp.4361–4368, Jul. 1994.
[25] G. Minkler and J. Minkler, CFAR: The Principles of Automatic RadarDetection in Clutter. Baltimore, MD: Magellan, 1990.
[26] H. L. Van Trees, Detection, Estimation, and Modulation Theory Part I.New York: Wiley, 1968.
RIGLING AND MOSES: THREE-DIMENSIONAL SURFACE RECONSTRUCTION FROM MULTISTATIC SAR IMAGES 1171
[27] H. A. Zebker and J. Villasenor, “Decorrelation in interferometric radarechoes,” IEEE Trans. Geosci. Remote Sens., vol. 30, no. 5, pp. 950–959,Sep. 1992.
[28] H. Stark and J. W. Woods, Probability, Random Processes, and Esti-mation Theory for Engineers. Upper Saddle River, NJ: Prentice-Hall,1994.
Brian D. Rigling (S’00–M’03) received the B.S. de-gree in physics-computer science from the Univer-sity of Dayton, Dayton, OH, in 1998 and the M.S.and Ph.D. degrees in electrical engineering from TheOhio State University, Columbus, in 2000 and 2003,respectively.
Since July 2004, he has been with the Departmentof Electrical Engineering, Wright State University,Dayton, where he is currently an Assistant Professor.From 2000 to 2004, he was a Radar Systems En-gineer for Northrop Grumman Electronic Systems,
Baltimore, MD. His research interests are in sensor signal processing andsystem engineering, array processing, autofocus, parametric modeling, andestimation.
Randolph L. Moses (S’78–M’85–SM’90) receivedthe B.S., M.S., and Ph.D. degrees in electrical engi-neering from Virginia Polytechnic Institute and StateUniversity, Blacksburg, in 1979, 1980, and 1984, re-spectively.
Since 1985, he has been with the Department ofElectrical Engineering, The Ohio State University,Columbus, where he is currently a Professor. Duringthe summer of 1983, he was a Summer FacultyResearch Fellow, Rome Air Development Center,Rome, NY. From 1984 to 1985, he was a NATO
Postdoctoral Fellow, Eindhoven University of Technology, Eindhoven, TheNetherlands. From 1994 to 1995, he was on sabbatical leave at Uppsala Univer-sity, Uppsala, Sweden, and from 2002 to 2003, he was on sabbatical leave at theAir Force Research Laboratory, Dayton, OH, and at the Massachusetts Instituteof Technology, Cambridge. He is the coauthor, with P. Stoica, of Introduction toSpectral Analysis (Upper Saddle River, NJ: Prentice-Hall, 1997). His researchinterests are in stochastic signal processing and include parametric estimation,array signal processing, sensor networks, and radar imaging.
Dr. Moses is a member of Eta Kappa Nu, Tau Beta Pi, Phi Kappa Phi, andSigma Xi. He served as an Associate Editor for the IEEE TRANSACTIONS ON
SIGNAL PROCESSING from 2001 to 2004, and he served on the IEEE Signal Pro-cessing Society Technical Committee on Statistical Signal and Array Processingfrom 1991 to 1994.