Embed Size (px)
Citation preview
1
Modeling and Detection of Camouflaging WormWei Yu, Xun Wang, Prasad Calyam, Dong Xuan, and Wei Zhao
Abstract—Active worms pose major security threats to the Internet. This is due to the ability of active worms to propagate in anautomated fashion as they continuously compromise computers on the Internet. Active worms evolve during their propagation and thuspose great challenges to defend against them. In this paper, we investigate a new class of active worms, referred to as CamouflagingWorm (C-Worm in short). The C-Worm is different from traditional worms because of its ability to intelligently manipulate its scantraffic volume over time. Thereby, the C-Worm camouflages its propagation from existing worm detection systems based on analyzingthe propagation traffic generated by worms. We analyze characteristics of the C-Worm and conduct a comprehensive comparisonbetween its traffic and non-worm traffic (background traffic). We observe that these two types of traffic are barely distinguishable inthe time domain. However, their distinction is clear in the frequency domain, due to the recurring manipulative nature of the C-Worm.Motivated by our observations, we design a novel spectrum-based scheme to detect the C-Worm. Our scheme uses the Power SpectralDensity (PSD) distribution of the scan traffic volume and its corresponding Spectral Flatness Measure (SFM) to distinguish the C-Wormtraffic from background traffic. Using a comprehensive set of detection metrics and real-world traces as background traffic, we conductextensive performance evaluations on our proposed spectrum-based detection scheme. The performance data clearly demonstratesthat our scheme can effectively detect the C-Worm propagation. Furthermore, we show the generality of our spectrum-based schemein effectively detecting not only the C-Worm, but traditional worms as well.
Index Terms—Worm, Camouflage, Anomaly Detection.
✦
1 INTRODUCTIONAn active worm refers to a malicious software program thatpropagates itself on the Internet to infect other computers. Thepropagation of the worm is based on exploiting vulnerabilitiesof computers on the Internet. Many real-world worms havecaused notable damage on the Internet. These worms include“Code-Red” worm in 2001 [1], “Slammer” worm in 2003 [2],and “Witty”/“Sasser” worms in 2004 [3]. Many active wormsare used to infect a large number of computers and recruitthem as bots or zombies, which are networked together to formbotnets [4]. These botnets can be used to: (a) launch massiveDistributed Denial-of-Service (DDoS) attacks that disrupt theInternet utilities [5], (b) access confidential information thatcan be misused [6] through large scale traffic sniffing, keylogging, identity theft etc, (c) destroy data that has a highmonetary value [7], and (d) distribute large-scale unsolicitedadvertisement emails (as spam) or software (as malware).There is evidence showing that infected computers are beingrented out as “Botnets” for creating an entire black-marketindustry for renting, trading, and managing “owned” com-puters, leading to economic incentives for attackers [4], [8],[9]. Researchers also showed possibility of “super-botnets,”networks of independent botnets that can be coordinated for
• Wei Yu is with the Department of Computer and Information Sciences,Towson University, Towson, MD 21252. E-mail: [email protected].
• Xun Wang is with Cisco Systems Inc, San Jose, CA 95134.Email: [email protected]
• Prasad Calyam is with OARnet, The Ohio State University, Columbus, OH43210. Email: [email protected].
• Dong Xuan is with the Dept. of Computer Science and Engineering,The Ohio State University, Columbus, OH 43210. Email: [email protected].
• Wei Zhao is with Department of Computer and Information Science,University of Macau, Macau, China. E-mail: [email protected].
attacks of unprecedented scale [10]. For an adversary, super-botnets would also be extremely versatile and resistant tocountermeasures.
Due to the substantial damage caused by worms in thepast years, there have been significant efforts on developingdetection and defense mechanisms against worms. A network-based worm detection system plays a major role by moni-toring, collecting, and analyzing the scan traffic (messages toidentify vulnerable computers) generated during worm attacks.In this system, the detection is commonly based on the self-propagating behavior of worms that can be described asfollows: after a worm-infected computer identifies and infectsa vulnerable computer on the Internet, this newly infectedcomputer1 will automatically and continuously scan several IPaddresses to identify and infect other vulnerable computers. Assuch, numerous existing detection schemes are based on a tacitassumption that each worm-infected computer keeps scanningthe Internet and propagates itself at the highest possible speed.Furthermore, it has been shown that the worm scan trafficvolume and the number of worm-infected computers exhibitexponentially increasing patterns [2], [11], [12], [13], [14].
Nevertheless, the attackers are crafting attack strategies thatintend to defeat existing worm detection systems. In particular,‘stealth’ is one attack strategy used by a recently-discoveredactive worm called “Atak” worm [15] and the “self-stopping”worm [16] circumvent detection by hibernating (i.e., stoppropagating) with a pre-determined period. Worm might alsouse the evasive scan [17] and traffic morphing technique tohide the detection [18].
This worm attempts to remain hidden by sleeping (suspend-ing scans) when it suspects it is under detection. Worms that
1. In this paper, we interchangeably use the terms - worm-infected computerand worm instance.
Digital Object Indentifier 10.1109/TDSC.2010.13 1545-5971/10/$26.00 © 2010 IEEE
IEEE TRANSACTIONS ON DEPEDABLE AND SECURE COMPUTINGThis article has been accepted for publication in a future issue of this journal, but has not been fully edited. Content may change prior to final publication.
Authorized licensed use limited to: Universidade de Macau. Downloaded on July 16,2010 at 02:00:53 UTC from IEEE Xplore. Restrictions apply.
IEEE TRANSACTIONS ON DEPENDABLE AND SECURE COMPUTING ,VOL. 8, NO. 3, MAY-JUNE 2011
2
adopt such smart attack strategies could exhibit overall scantraffic patterns different from those of traditional worms. Sincethe existing worm detection schemes will not be able to detectsuch scan traffic patterns, it is very important to understandsuch smart-worms and develop new countermeasures to defendagainst them.
In this paper, we conduct a systematic study on a newclass of such smart-worms denoted as Camouflaging Worm (C-Worm in short). The C-Worm has a self-propagating behaviorsimilar to traditional worms, i.e., it intends to rapidly infectas many vulnerable computers as possible. However, the C-Worm is quite different from traditional worms in which itcamouflages any noticeable trends in the number of infectedcomputers over time. The camouflage is achieved by manip-ulating the scan traffic volume of worm-infected computers.Such a manipulation of the scan traffic volume prevents exhibi-tion of any exponentially increasing trends or even crossing ofthresholds that are tracked by existing detection schemes [19],[20], [21]. We note that the propagation controlling natureof the C-Worm (and similar smart-worms, such as “Atak”)cause a slow down in the propagation speed. However, bycarefully controlling its scan rate, the C-Worm can: (a) stillachieve its ultimate goal of infecting as many computers aspossible before being detected, and (b) position itself to launchsubsequent attacks [4], [5], [6], [7].
We comprehensively analyze the propagation model of theC-Worm and corresponding scan traffic in both time andfrequency domains. We observe that although the C-Wormscan traffic shows no noticeable trends in the time domain,it demonstrates a distinct pattern in the frequency domain.Specifically, there is an obvious concentration within a narrowrange of frequencies. This concentration within a narrowrange of frequencies is inevitable since the C-Worm adaptsto the dynamics of the Internet in a recurring manner formanipulating and controlling its overall scan traffic volume.The above recurring manipulations involve steady increase,followed by a decrease in the scan traffic volume, such thatthe changes do not manifest as any trends in the time domainor such that the scan traffic volume does not cross thresholdsthat could reveal the C-Worm propagation.
Based on the above observation, we adopt frequency domainanalysis techniques and develop a detection scheme againstwide-spreading of the C-Worm. Particularly, we develop anovel spectrum-based detection scheme that uses the PowerSpectral Density (PSD) distribution of scan traffic volume inthe frequency domain and its corresponding Spectral FlatnessMeasure (SFM) to distinguish the C-Worm traffic from non-worm traffic (background traffic). Our frequency domain anal-ysis studies use the real-world Internet traffic traces (Shieldlogs dataset) provided by SANs Internet Storm Center (ISC)[22], [23]2. Our results reveal that non-worm traffic (e.g.,port-scan traffic for port 80, 135 and 8080) has relativelylarger SFM values for their PSD distributions. Whereas, theC-Worm traffic shows comparatively smaller SFM value forits respective PSD distribution.
2. ISC monitors and collects port-scan traffic data from around 1 million IPaddresses spanning several thousands of organizations in different geograph-ical regions.
Furthermore, we demonstrate the effectiveness of ourspectrum-based detection scheme in comparison with existingworm detection schemes. We define several new metrics.Maximal Infection Ratio (MIR) is the one to quantify theinfection damage caused by a worm before being detected.Other metrics include Detection Time (DT) and DetectionRate (DR). Our evaluation data clearly demonstrate that ourspectrum-based detection scheme achieves much better detec-tion performance against the C-Worm propagation comparedwith existing detection schemes. Our evaluation also showsthat our spectrum-based detection scheme is general enoughto be used for effective detection of traditional worms as well.
The remainder of the paper is organized as follows. InSection 2, we introduce the background and review the relatedwork. In Section 3, we introduce the propagation model ofthe C-Worm. We present our spectrum-based detection schemeagainst the C-Worm in Section 4. The performance evaluationresults of our spectrum-based detection scheme is provided inSection 5. We conclude this paper in Section 6.
2 BACKGROUND AND RELATED WORK
2.1 Active WormsActive worms are similar to biological viruses in terms of theirinfectous and self-propagating nature. They identify vulnerablecomputers, infect them and the worm-infected computerspropagate the infection further to other vulnerable computers.In order to understand worm behavior, we first need to modelit. With this understanding, effective detection and defenseschemes could be developed to mitigate the impact of theworms. For this reason, tremendous research effort has focusedon this area [12], [24], [14], [25], [16].
Active worms use various scan mechanisms to propagatethemselves efficiently. The basic form of active worms can becategorized as having the Pure Random Scan (PRS) nature. Inthe PRS form, a worm-infected computer continuously scansa set of random Internet IP addresses to find new vulnerablecomputers. Other worms propagate themselves more effec-tively than PRS worms using various methods, e.g., networkport scanning, email, file sharing, Peer-to-Peer (P2P) networks,and Instant Messaging (IM) [26], [27]. In addition, worms usedifferent scan strategies during different stages of propagation.In order to increase propagation efficiency, they use a localnetwork or hitlist to infect previously identified vulnerablecomputers at the initial stage of propagation [12], [28]. Theymay also use DNS, network topology and routing informationto identify active computers instead of randomly scanning IPaddresses [11], [21], [27], [29]. They split the target IP addressspace during propagation in order to avoid duplicate scans[21]. Li et al. [30] studied a divide-conquer scanning techniquethat could potentially spread faster and stealthier than atraditional random-scanning worm. Ha et al. [31] formulatedthe problem of finding a fast and resilient propagation topologyand propagation schedule for Flash worms. Yang et al. [32]studied the worm propagation over the sensor networks.
Different from the above worms, which attempt to acceleratethe propagation with new scan schemes, the Camouflaging
IEEE TRANSACTIONS ON DEPEDABLE AND SECURE COMPUTINGThis article has been accepted for publication in a future issue of this journal, but has not been fully edited. Content may change prior to final publication.
Authorized licensed use limited to: Universidade de Macau. Downloaded on July 16,2010 at 02:00:53 UTC from IEEE Xplore. Restrictions apply.
IEEE TRANSACTIONS ON DEPENDABLE AND SECURE COMPUTING ,VOL. 8, NO. 3, MAY-JUNE 2011
3
Worm (C-Worm) studied in this paper aims to elude the de-tection by the worm defense system during worm propagation.Closely related, but orthogonal to our work, are the evolvedactive worms that are polymorphic [33], [34] in nature. Poly-morphic worms are able to change their binary representationor signature as part of their propagation process. This canbe achieved with self-encryption mechanisms or semantics-preserving code manipulation techniques. The C-Worm alsoshares some similarity with stealthy port-scan attacks. Suchattacks try to find out available services in a target system,while avoiding detection [35], [36]. It is accomplished bydecreasing the port scan rate, hiding the origin of attackers,etc. Due to the nature of self-propagation, the C-Worm mustuse more complex mechanisms to manipulate the scan trafficvolume over time in order to avoid detection.
2.2 Worm DetectionWorm detection has been intensively studied in the past andcan be generally classified into two categories: “host-based”detection and “network-based” detection. Host-based detectionsystems detect worms by monitoring, collecting, and analyzingworm behaviors on end-hosts. Since worms are maliciousprograms that execute on these computers, analyzing thebehavior of worm executables plays an important role in host-based detection systems. Many detection schemes fall underthis category [37], [38]. In contrast, network-based detectionsystems detect worms primarily by monitoring, collecting,and analyzing the scan traffic (messages to identify vulner-able computers) generated by worm attacks. Many detectionschemes fall under this category [19], [20], [21], [39], [40].Ideally, security vulnerabilities must be prevented to beginwith, a problem which must addressed by the programminglanguage community. However, while vulnerabilities exist andpose threats of large-scale damage, it is critical to also focuson network-based detection, as this paper does, to detect wide-spreading worms.
In order to rapidly and accurately detect Internet-widelarge scale propagation of active worms, it is imperative tomonitor and analyze the traffic in multiple locations overthe Internet to detect suspicious traffic generated by worms.The widely adopted worm detection framework consists ofmultiple distributed monitors and a worm detection centerthat controls the former [23], [41]. This framework is welladopted and similar to other existing worm detection systems,such as the Cyber center for disease controller [11], Internetmotion sensor [42], SANS ISC (Internet Storm Center) [23],Internet sink [41], and network telescope [43]. The monitorsare distributed across the Internet and can be deployed at end-hosts, router, or firewalls etc. Each monitor passively recordsirregular port-scan traffic, such as connection attempts to arange of void IP addresses (IP addresses not being used) andrestricted service ports. Periodically, the monitors send trafficlogs to the detection center. The detection center analyzes thetraffic logs and determines whether or not there are suspiciousscans to restricted ports or to invalid IP addresses.
Network-based detection schemes commonly analyze thecollected scanning traffic data by applying certain decision
rules for detecting the worm propagation. For example,Venkataraman et al. and Wu et al. in [20], [21] proposedschemes to examine statistics of scan traffic volume, Zou etal. presented a trend-based detection scheme to examine theexponential increase pattern of scan traffic [19], Lakhina et al.in [40] proposed schemes to examine other features of scantraffic, such as the distribution of destination addresses. Otherworks study worms that attempt to take on new patterns toavoid detection [39].
Besides the above detection schemes that are based onthe global scan traffic monitor by detecting traffic anoma-lous behavior, there are other worm detection and defenseschemes such as sequential hypothesis testing for detectingworm-infected computers [44], payload-based worm signaturedetection [34], [45]. In addition, Cai et al. in [46] presentedboth theoretical modeling and experimental results on a col-laborative worm signature generation system that employsdistributed fingerprint filtering and aggregation and multipleedge networks. Dantu et al. in [47] presented a state-spacefeedback control model that detects and control the spreadof these viruses or worms by measuring the velocity of thenumber of new connections an infected computer makes.Despite the different approaches described above, we believethat detecting widely scanning anomaly behavior continues tobe a useful weapon against worms, and that in practice multi-faceted defence has advantages.
3 MODELING OF THE C-WORM3.1 C-WormThe C-Worm camouflages its propagation by controlling scantraffic volume during its propagation. The simplest way tomanipulate scan traffic volume is to randomly change thenumber of worm instances conducting port-scans.
As other alternatives, a worm attacker may use an open-loopcontrol (non-feedback) mechanism by choosing a randomizedand time related pattern for the scanning and infection in orderto avoid being detected. Nevertheless, the open-loop controlapproach raises some issues of the invisibility of the attack.First, as we know, worm propagation over the Internet canbe considered a dynamic system. When an attacker launchesworm propagation, it is vey challenging for the attacker toknow the accurate parameters for worm propagation dynamicsover the Internet. Given the inaccurate knowledge of wormpropagation over the Internet, the open-loop control systemwill not be able to stabilize the scan traffic. This is a knownresult from control system theory [48]. Consequently, theoverall worm scan traffic volume in the open-loop controlsystem will expose a much higher probability to show anincreasing trend with the progress of worm propagation. Asmore and more computers get infected, they, in turn, takepart in scanning other computers. Hence, we consider the C-worm as a worst case attacking scenario that uses a closed-loop control for regulating the propagation speed based on thefeedback propagation status.
In order to effectively evade detection, the overall scantraffic for the C-Worm should be comparatively slow andvariant enough to not show any notable increasing trends over
IEEE TRANSACTIONS ON DEPEDABLE AND SECURE COMPUTINGThis article has been accepted for publication in a future issue of this journal, but has not been fully edited. Content may change prior to final publication.
Authorized licensed use limited to: Universidade de Macau. Downloaded on July 16,2010 at 02:00:53 UTC from IEEE Xplore. Restrictions apply.
IEEE TRANSACTIONS ON DEPENDABLE AND SECURE COMPUTING ,VOL. 8, NO. 3, MAY-JUNE 2011
4
time. On the other hand, a very slow propagation of the C-Worm is also not desirable, since it delays rapid infectiondamage to the Internet. Hence, the C-Worm needs to adjust itspropagation so that it is neither too fast to be easily detected,nor too slow to delay rapid damage on the Internet.
To regulate the C-Worm scan traffic volume, we introducea control parameter called attack probability P (t) for eachworm-infected computer. P (t) is the probability that a C-Worm instance participates in the worm propagation (i.e.,scans and infects other computers) at time t. Our C-Wormmodel with the control parameter P (t) is generic. P (t) = 1represents the cases for traditional worms, where all worminstances actively participate in the propagation. For the C-Worm, P (t) needs not be a constant value and can be set asa time varying function.
In order to achieve its camouflaging behavior, the C-Wormneeds to obtain an appropriate P (t) to manipulate its scantraffic. Specifically, the C-Worm will regulate its overall scantraffic volume such that: (a) it is similar to non-worm scantraffic in terms of the scan traffic volume over time, (b) itdoes not exhibit any notable trends, such as an exponentiallyincreasing pattern or any mono-increasing pattern even whenthe number of infected hosts increases (exponentially) overtime, and (c) the average value of the overall scan trafficvolume is sufficient to make the C-Worm propagate fastenough to cause rapid damage on the Internet3.
We assume that a worm attacker intends to manipulatescan traffic volume so that the number of worm instancesparticipating in the worm propagation follow a random distri-bution with mean MC . This MC can be regulated in a randomfashion during worm propagation in order to camouflage thepropagation of C-Worm. Correspondingly, the worm instancesneed to adjust their attack probability P (t) in order to ensurethat the total number of worm instances launching the scansis approximately MC .
To regulate MC , it is obvious that P (t) must be decreasedover time since M(t) keeps increasing during the wormpropagation. We can express P (t) using a simple functionas follows: P (t) = min( MC
M(t), 1), where M(t) represents the
estimation of M(t) at time t. From the above expression, weknow that the C-Worm needs to obtain the value of M(t) (asclose to M(t) as possible) in order to generate an effectiveP (t). Here, we discuss one approach for the C-Worm toestimate M(t). The basic idea is as follows: A C-Worm couldestimate the percentage of computers that have already beeninfected over the total number of IP addresses as well as M(t),through checking a scan attempt as a new hit (i.e., hittingan uninfected vulnerable computer) or a duplicate hit (i.e.,hitting an already infected vulnerable computer). This methodrequires each worm instance (i.e., infected computer) to bemarked indicating that this computer has been infected. Thus,when a worm instance (for example, computer A) scans oneinfected computer (for example, computer B), then computer Awill detect such a mark, thereby becoming aware that computer
3. Note that if chooses P (t) below a certain (very low) level, otherhuman-scale countermeasures (e.g., signature-based virus detection, machinequarantine) may become effective to disrupt the propagation.
B has been infected. Through validating such marks duringthe propagation, a C-Worm infected computer can estimateM(t). Appendix A discusses one alternative how the C-Worm could estimate M(t) to obtain M(t) as the propagationproceeds. There are other approaches to achieve this goal, suchas incorporating the Peer-to-Peer techniques to disseminateinformation through secured IRC channels [49], [50].
3.2 Propagation Model of the C-WormTo analyze the C-Worm, we adopt the epidemic dynamicmodel for disease propagation, which has been extensivelyused for worm propagation modeling [2], [12]. Based onexisting results [2], [12], this model matches the dynamicsof real worm propagation over the Internet quite well. For thisreason, similar to other publications, we adopt this model inour paper as well. Since our investigated C-Worm is a novelattack, we modified the original Epidemic dynamic formulato model the propagation of the C-Worm by introducing theP (t) - the attack probability that a worm-infected computerparticipates in worm propagation at time t. We note that thereis a wide scope to notably improve our modified model inthe future to reflect several characteristics that are relevant inreal-world practice.
Particularly, the epidemic dynamic model assumes that anygiven computer is in one of the following states: immune,vulnerable, or infected. An immune computer is one thatcannot be infected by a worm; a vulnerable computer is onethat has the potential of being infected by a worm; an infectedcomputer is one that has been infected by a worm. The simpleepidemic model for a finite population of traditional PRSworms can be expressed as4,
dM(t)
dt= β ·M(t) · [N −M(t)], (1)
where M(t) is the number of infected computers at time t;N(= T · P1 · P2) is the number of vulnerable computers onthe Internet; T is the total number of IP addresses on theInternet; P1 is the ratio of the total number of computers on theInternet over T ; P2 is the ratio of total number of vulnerablecomputers on the Internet over the total number of computerson the Internet; β = S/V is called the pairwise infection rate[51]; S is the scan rate defined as the number of scans thatan infected computer can launch in a given time interval. Weassume that at t = 0, there are M(0) computers being initiallyinfected and N−M(0) computers being susceptible to furtherworm infection.
The C-Worm has a different propagation model comparedto traditional PRS worms because of its P (t) parameter.Consequently, Formula (1) needs to be rewritten as,
dM(t)
dt= β ·M(t) · P (t) · [N −M(t)]. (2)
Recall that P (t) = MC
M(t), M(t) is the estimation of M(t) at
time t, and assuming that M(t) = (1 + ε) ·M(t), where ε is
4. We would like to remark that we use the PRS worms to compare C-Worm performance, but our work can be easily extended to compare withother worm scan techniques, such as hitlist.
IEEE TRANSACTIONS ON DEPEDABLE AND SECURE COMPUTINGThis article has been accepted for publication in a future issue of this journal, but has not been fully edited. Content may change prior to final publication.
Authorized licensed use limited to: Universidade de Macau. Downloaded on July 16,2010 at 02:00:53 UTC from IEEE Xplore. Restrictions apply.
IEEE TRANSACTIONS ON DEPENDABLE AND SECURE COMPUTING ,VOL. 8, NO. 3, MAY-JUNE 2011
5
the estimation error, the Formula (2) can be rewritten as,
dM(t)
dt=
β · MC
1 + ε(t)· [N −M(t)]. (3)
With Formula (3), we can derive the propagation model
for the C-Worm as M(t) = N − e−β·MC1+ε
(t)·t(N − M(0)),where M(0) is the number of infected computers at time0. Assume that the worm detection system can monitor Pm
(Pm ∈ [0, 1]) of the whole Internet IP address space. Withoutloss of generality, the probability that at least one scan from aworm-infected computer (it generates S scans in unit timeon average) will be observed by the detection system is1 − (1 − Pm)P (t)·S . We define that MA(t) is the number ofworm instances that have been observed by the worm detectionsystem at time t, then there are M(t) −MA(t) unobservedinfected instances at time t. At the worm propagation earlystage, M(t)−MA(t) �M(t). The expected number of newlyobserved infected instances at t + δ (where δ is the intervalof monitoring) is (M(t) −MA(t)) · [1 − (1 − Pm)P (t)·S ] �M(i)[1 − (1 − Pm)P (t)·S ]. Thus, we have MA(t + δ) =MA(t)+M(t)[1−(1−Pm)P (t)·S ]. Using simple mathematicalmanipulations, the number of worm instances observed by theworm detection system at time t is,
MA(t) = P (t) ·M(t) · Pm =Pm · MC
1 + ε(t). (4)
3.3 Effectiveness of the C-Worm
We now demonstrate the effectiveness of the C-Worm in evad-ing worm detection through controlling P (t). Given randomselection of Mc, we generate three C-Worm attacks (viz., C-Worm 1, C-Worm 2 and C-Worm 3) that are characterizedby different selections of mean and variance magnitudesfor MC . In our simulations, we assume that the scan rateof the traditional PRS worm follow a normal distributionSn = N(40, 40) (note that if the scan rate generated by abovedistribution is less than 0 , we set the scan rate as 0). We alsoset the total number of vulnerable computers on the Internetas 360,000, which is the total number of infected computersin “Code-Red” worm incident [1].
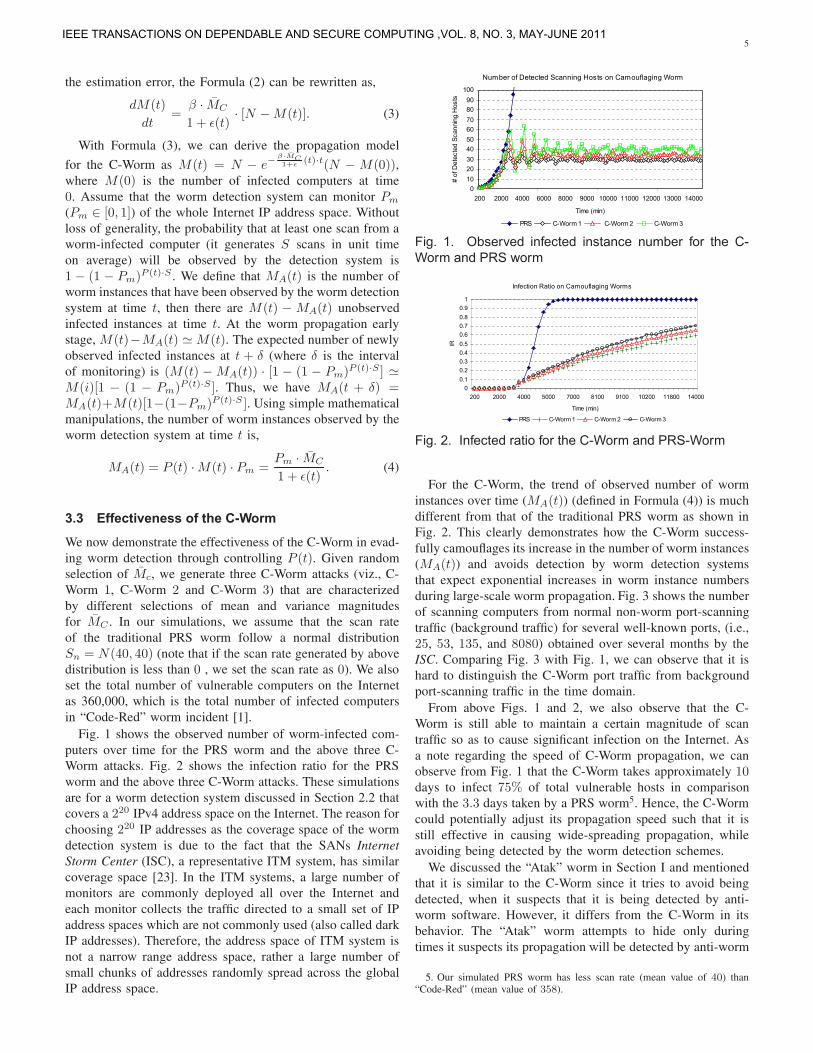
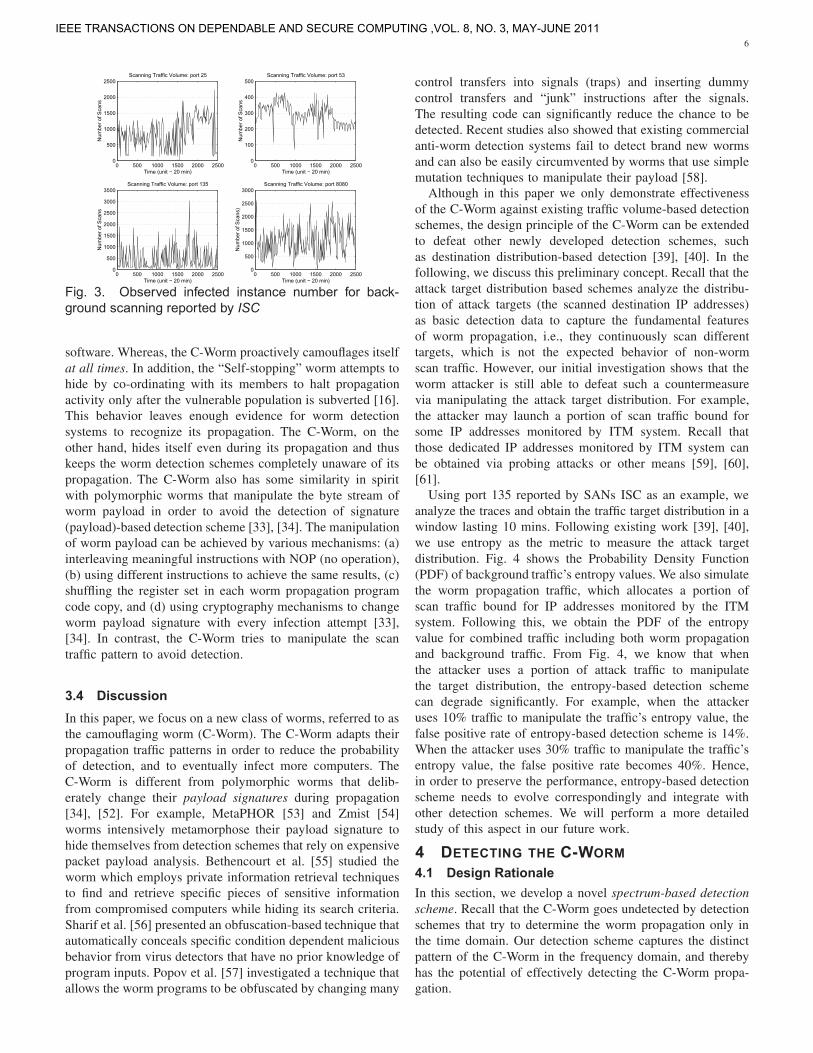
Fig. 1 shows the observed number of worm-infected com-puters over time for the PRS worm and the above three C-Worm attacks. Fig. 2 shows the infection ratio for the PRSworm and the above three C-Worm attacks. These simulationsare for a worm detection system discussed in Section 2.2 thatcovers a 220 IPv4 address space on the Internet. The reason forchoosing 220 IP addresses as the coverage space of the wormdetection system is due to the fact that the SANs InternetStorm Center (ISC), a representative ITM system, has similarcoverage space [23]. In the ITM systems, a large number ofmonitors are commonly deployed all over the Internet andeach monitor collects the traffic directed to a small set of IPaddress spaces which are not commonly used (also called darkIP addresses). Therefore, the address space of ITM system isnot a narrow range address space, rather a large number ofsmall chunks of addresses randomly spread across the globalIP address space.
Number of Detected Scanning Hosts on Camouflaging Worm
0102030405060708090
100
200 2000 4000 6000 8000 9000 10000 11000 12000 13000 14000
Time (min)
# of
Det
ecte
d Sc
anni
ng H
osts
PRS C-Worm 1 C-Worm 2 C-Worm 3
Fig. 1. Observed infected instance number for the C-Worm and PRS worm
Infection Ratio on Camouflaging Worms
00.10.20.30.40.50.60.70.80.9
1
200 2000 4000 5000 7000 8100 9100 10200 11800 14000
Time (min)
IR
PRS C-Worm 1 C-Worm 2 C-Worm 3
Fig. 2. Infected ratio for the C-Worm and PRS-Worm
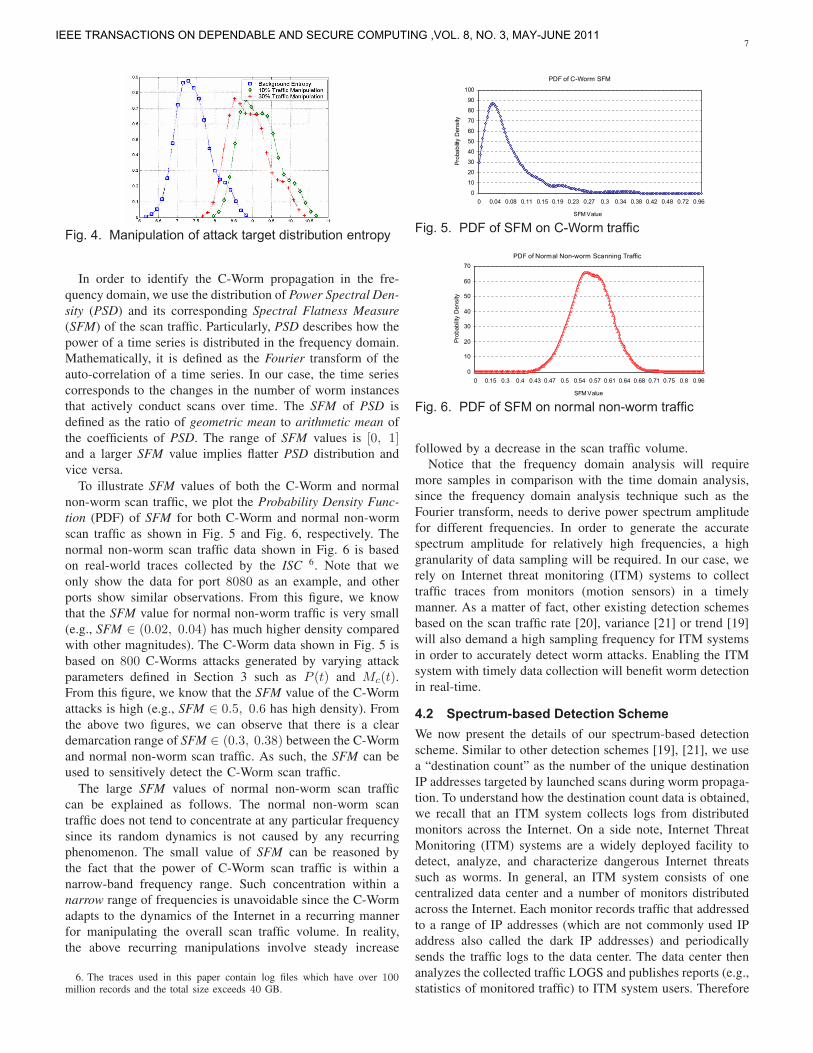
For the C-Worm, the trend of observed number of worminstances over time (MA(t)) (defined in Formula (4)) is muchdifferent from that of the traditional PRS worm as shown inFig. 2. This clearly demonstrates how the C-Worm success-fully camouflages its increase in the number of worm instances(MA(t)) and avoids detection by worm detection systemsthat expect exponential increases in worm instance numbersduring large-scale worm propagation. Fig. 3 shows the numberof scanning computers from normal non-worm port-scanningtraffic (background traffic) for several well-known ports, (i.e.,25, 53, 135, and 8080) obtained over several months by theISC. Comparing Fig. 3 with Fig. 1, we can observe that it ishard to distinguish the C-Worm port traffic from backgroundport-scanning traffic in the time domain.
From above Figs. 1 and 2, we also observe that the C-Worm is still able to maintain a certain magnitude of scantraffic so as to cause significant infection on the Internet. Asa note regarding the speed of C-Worm propagation, we canobserve from Fig. 1 that the C-Worm takes approximately 10days to infect 75% of total vulnerable hosts in comparisonwith the 3.3 days taken by a PRS worm5. Hence, the C-Wormcould potentially adjust its propagation speed such that it isstill effective in causing wide-spreading propagation, whileavoiding being detected by the worm detection schemes.
We discussed the “Atak” worm in Section I and mentionedthat it is similar to the C-Worm since it tries to avoid beingdetected, when it suspects that it is being detected by anti-worm software. However, it differs from the C-Worm in itsbehavior. The “Atak” worm attempts to hide only duringtimes it suspects its propagation will be detected by anti-worm
5. Our simulated PRS worm has less scan rate (mean value of 40) than“Code-Red” (mean value of 358).
IEEE TRANSACTIONS ON DEPEDABLE AND SECURE COMPUTINGThis article has been accepted for publication in a future issue of this journal, but has not been fully edited. Content may change prior to final publication.
Authorized licensed use limited to: Universidade de Macau. Downloaded on July 16,2010 at 02:00:53 UTC from IEEE Xplore. Restrictions apply.
IEEE TRANSACTIONS ON DEPENDABLE AND SECURE COMPUTING ,VOL. 8, NO. 3, MAY-JUNE 2011
6
0 500 1000 1500 2000 25000
500
1000
1500
2000
2500Scanning Traffic Volume: port 25
Time (unit − 20 min)
Num
ber o
f Sca
ns
0 500 1000 1500 2000 25000
100
200
300
400
500Scanning Traffic Volume: port 53
Time (unit − 20 min)
Num
ber o
f Sca
ns
0 500 1000 1500 2000 25000
500
1000
1500
2000
2500
3000
3500Scanning Traffic Volume: port 135
Time (unit − 20 min)
Num
ber o
f Sca
ns
0 500 1000 1500 2000 25000
500
1000
1500
2000
2500
3000Scanning Traffic Volume: port 8080
Time (unit − 20 min)
Num
ber o
f Sca
ns)
Fig. 3. Observed infected instance number for back-ground scanning reported by ISC
software. Whereas, the C-Worm proactively camouflages itselfat all times. In addition, the “Self-stopping” worm attempts tohide by co-ordinating with its members to halt propagationactivity only after the vulnerable population is subverted [16].This behavior leaves enough evidence for worm detectionsystems to recognize its propagation. The C-Worm, on theother hand, hides itself even during its propagation and thuskeeps the worm detection schemes completely unaware of itspropagation. The C-Worm also has some similarity in spiritwith polymorphic worms that manipulate the byte stream ofworm payload in order to avoid the detection of signature(payload)-based detection scheme [33], [34]. The manipulationof worm payload can be achieved by various mechanisms: (a)interleaving meaningful instructions with NOP (no operation),(b) using different instructions to achieve the same results, (c)shuffling the register set in each worm propagation programcode copy, and (d) using cryptography mechanisms to changeworm payload signature with every infection attempt [33],[34]. In contrast, the C-Worm tries to manipulate the scantraffic pattern to avoid detection.
3.4 DiscussionIn this paper, we focus on a new class of worms, referred to asthe camouflaging worm (C-Worm). The C-Worm adapts theirpropagation traffic patterns in order to reduce the probabilityof detection, and to eventually infect more computers. TheC-Worm is different from polymorphic worms that delib-erately change their payload signatures during propagation[34], [52]. For example, MetaPHOR [53] and Zmist [54]worms intensively metamorphose their payload signature tohide themselves from detection schemes that rely on expensivepacket payload analysis. Bethencourt et al. [55] studied theworm which employs private information retrieval techniquesto find and retrieve specific pieces of sensitive informationfrom compromised computers while hiding its search criteria.Sharif et al. [56] presented an obfuscation-based technique thatautomatically conceals specific condition dependent maliciousbehavior from virus detectors that have no prior knowledge ofprogram inputs. Popov et al. [57] investigated a technique thatallows the worm programs to be obfuscated by changing many
control transfers into signals (traps) and inserting dummycontrol transfers and “junk” instructions after the signals.The resulting code can significantly reduce the chance to bedetected. Recent studies also showed that existing commercialanti-worm detection systems fail to detect brand new wormsand can also be easily circumvented by worms that use simplemutation techniques to manipulate their payload [58].
Although in this paper we only demonstrate effectivenessof the C-Worm against existing traffic volume-based detectionschemes, the design principle of the C-Worm can be extendedto defeat other newly developed detection schemes, suchas destination distribution-based detection [39], [40]. In thefollowing, we discuss this preliminary concept. Recall that theattack target distribution based schemes analyze the distribu-tion of attack targets (the scanned destination IP addresses)as basic detection data to capture the fundamental featuresof worm propagation, i.e., they continuously scan differenttargets, which is not the expected behavior of non-wormscan traffic. However, our initial investigation shows that theworm attacker is still able to defeat such a countermeasurevia manipulating the attack target distribution. For example,the attacker may launch a portion of scan traffic bound forsome IP addresses monitored by ITM system. Recall thatthose dedicated IP addresses monitored by ITM system canbe obtained via probing attacks or other means [59], [60],[61].
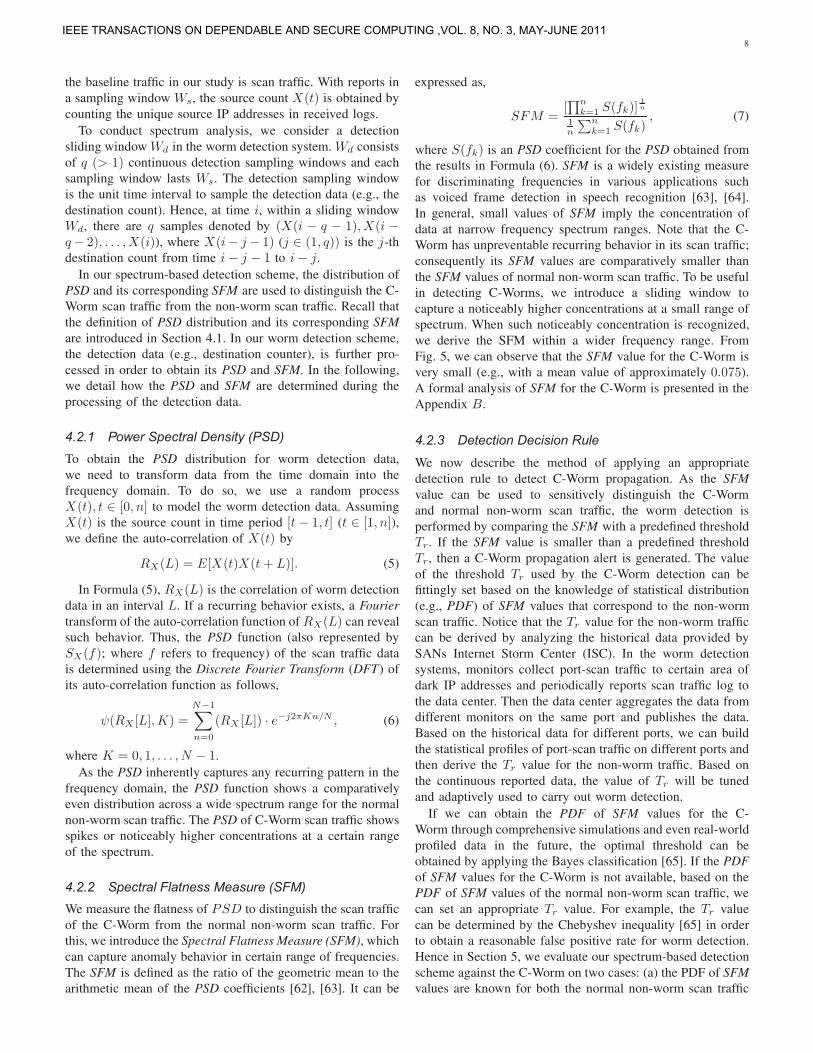
Using port 135 reported by SANs ISC as an example, weanalyze the traces and obtain the traffic target distribution in awindow lasting 10 mins. Following existing work [39], [40],we use entropy as the metric to measure the attack targetdistribution. Fig. 4 shows the Probability Density Function(PDF) of background traffic’s entropy values. We also simulatethe worm propagation traffic, which allocates a portion ofscan traffic bound for IP addresses monitored by the ITMsystem. Following this, we obtain the PDF of the entropyvalue for combined traffic including both worm propagationand background traffic. From Fig. 4, we know that whenthe attacker uses a portion of attack traffic to manipulatethe target distribution, the entropy-based detection schemecan degrade significantly. For example, when the attackeruses 10% traffic to manipulate the traffic’s entropy value, thefalse positive rate of entropy-based detection scheme is 14%.When the attacker uses 30% traffic to manipulate the traffic’sentropy value, the false positive rate becomes 40%. Hence,in order to preserve the performance, entropy-based detectionscheme needs to evolve correspondingly and integrate withother detection schemes. We will perform a more detailedstudy of this aspect in our future work.
4 DETECTING THE C-WORM4.1 Design RationaleIn this section, we develop a novel spectrum-based detectionscheme. Recall that the C-Worm goes undetected by detectionschemes that try to determine the worm propagation only inthe time domain. Our detection scheme captures the distinctpattern of the C-Worm in the frequency domain, and therebyhas the potential of effectively detecting the C-Worm propa-gation.
IEEE TRANSACTIONS ON DEPEDABLE AND SECURE COMPUTINGThis article has been accepted for publication in a future issue of this journal, but has not been fully edited. Content may change prior to final publication.
Authorized licensed use limited to: Universidade de Macau. Downloaded on July 16,2010 at 02:00:53 UTC from IEEE Xplore. Restrictions apply.
IEEE TRANSACTIONS ON DEPENDABLE AND SECURE COMPUTING ,VOL. 8, NO. 3, MAY-JUNE 2011
7
Fig. 4. Manipulation of attack target distribution entropy
In order to identify the C-Worm propagation in the fre-quency domain, we use the distribution of Power Spectral Den-sity (PSD) and its corresponding Spectral Flatness Measure(SFM) of the scan traffic. Particularly, PSD describes how thepower of a time series is distributed in the frequency domain.Mathematically, it is defined as the Fourier transform of theauto-correlation of a time series. In our case, the time seriescorresponds to the changes in the number of worm instancesthat actively conduct scans over time. The SFM of PSD isdefined as the ratio of geometric mean to arithmetic mean ofthe coefficients of PSD. The range of SFM values is [0, 1]and a larger SFM value implies flatter PSD distribution andvice versa.
To illustrate SFM values of both the C-Worm and normalnon-worm scan traffic, we plot the Probability Density Func-tion (PDF) of SFM for both C-Worm and normal non-wormscan traffic as shown in Fig. 5 and Fig. 6, respectively. Thenormal non-worm scan traffic data shown in Fig. 6 is basedon real-world traces collected by the ISC 6. Note that weonly show the data for port 8080 as an example, and otherports show similar observations. From this figure, we knowthat the SFM value for normal non-worm traffic is very small(e.g., SFM ∈ (0.02, 0.04) has much higher density comparedwith other magnitudes). The C-Worm data shown in Fig. 5 isbased on 800 C-Worms attacks generated by varying attackparameters defined in Section 3 such as P (t) and Mc(t).From this figure, we know that the SFM value of the C-Wormattacks is high (e.g., SFM ∈ 0.5, 0.6 has high density). Fromthe above two figures, we can observe that there is a cleardemarcation range of SFM ∈ (0.3, 0.38) between the C-Wormand normal non-worm scan traffic. As such, the SFM can beused to sensitively detect the C-Worm scan traffic.
The large SFM values of normal non-worm scan trafficcan be explained as follows. The normal non-worm scantraffic does not tend to concentrate at any particular frequencysince its random dynamics is not caused by any recurringphenomenon. The small value of SFM can be reasoned bythe fact that the power of C-Worm scan traffic is within anarrow-band frequency range. Such concentration within anarrow range of frequencies is unavoidable since the C-Wormadapts to the dynamics of the Internet in a recurring mannerfor manipulating the overall scan traffic volume. In reality,the above recurring manipulations involve steady increase
6. The traces used in this paper contain log files which have over 100million records and the total size exceeds 40 GB.
PDF of C-Worm SFM
0
10
20
30
40
50
60
70
80
90
100
0 0.04 0.08 0.11 0.15 0.19 0.23 0.27 0.3 0.34 0.38 0.42 0.48 0.72 0.96
SFM Value
Prob
abilit
y D
ensi
ty
Fig. 5. PDF of SFM on C-Worm traffic
PDF of Normal Non-worm Scanning Traffic
0
10
20
30
40
50
60
70
0 0.15 0.3 0.4 0.43 0.47 0.5 0.54 0.57 0.61 0.64 0.68 0.71 0.75 0.8 0.96
SFM Value
Prob
abilit
y D
ensi
ty
Fig. 6. PDF of SFM on normal non-worm traffic
followed by a decrease in the scan traffic volume.Notice that the frequency domain analysis will require
more samples in comparison with the time domain analysis,since the frequency domain analysis technique such as theFourier transform, needs to derive power spectrum amplitudefor different frequencies. In order to generate the accuratespectrum amplitude for relatively high frequencies, a highgranularity of data sampling will be required. In our case, werely on Internet threat monitoring (ITM) systems to collecttraffic traces from monitors (motion sensors) in a timelymanner. As a matter of fact, other existing detection schemesbased on the scan traffic rate [20], variance [21] or trend [19]will also demand a high sampling frequency for ITM systemsin order to accurately detect worm attacks. Enabling the ITMsystem with timely data collection will benefit worm detectionin real-time.
4.2 Spectrum-based Detection SchemeWe now present the details of our spectrum-based detectionscheme. Similar to other detection schemes [19], [21], we usea “destination count” as the number of the unique destinationIP addresses targeted by launched scans during worm propaga-tion. To understand how the destination count data is obtained,we recall that an ITM system collects logs from distributedmonitors across the Internet. On a side note, Internet ThreatMonitoring (ITM) systems are a widely deployed facility todetect, analyze, and characterize dangerous Internet threatssuch as worms. In general, an ITM system consists of onecentralized data center and a number of monitors distributedacross the Internet. Each monitor records traffic that addressedto a range of IP addresses (which are not commonly used IPaddress also called the dark IP addresses) and periodicallysends the traffic logs to the data center. The data center thenanalyzes the collected traffic LOGS and publishes reports (e.g.,statistics of monitored traffic) to ITM system users. Therefore
IEEE TRANSACTIONS ON DEPEDABLE AND SECURE COMPUTINGThis article has been accepted for publication in a future issue of this journal, but has not been fully edited. Content may change prior to final publication.
Authorized licensed use limited to: Universidade de Macau. Downloaded on July 16,2010 at 02:00:53 UTC from IEEE Xplore. Restrictions apply.
IEEE TRANSACTIONS ON DEPENDABLE AND SECURE COMPUTING ,VOL. 8, NO. 3, MAY-JUNE 2011
8
the baseline traffic in our study is scan traffic. With reports ina sampling window Ws, the source count X(t) is obtained bycounting the unique source IP addresses in received logs.
To conduct spectrum analysis, we consider a detectionsliding window Wd in the worm detection system. Wd consistsof q (> 1) continuous detection sampling windows and eachsampling window lasts Ws. The detection sampling windowis the unit time interval to sample the detection data (e.g., thedestination count). Hence, at time i, within a sliding windowWd, there are q samples denoted by (X(i − q − 1), X(i −q− 2), . . . , X(i)), where X(i− j − 1) (j ∈ (1, q)) is the j-thdestination count from time i− j − 1 to i− j.
In our spectrum-based detection scheme, the distribution ofPSD and its corresponding SFM are used to distinguish the C-Worm scan traffic from the non-worm scan traffic. Recall thatthe definition of PSD distribution and its corresponding SFMare introduced in Section 4.1. In our worm detection scheme,the detection data (e.g., destination counter), is further pro-cessed in order to obtain its PSD and SFM. In the following,we detail how the PSD and SFM are determined during theprocessing of the detection data.
4.2.1 Power Spectral Density (PSD)To obtain the PSD distribution for worm detection data,we need to transform data from the time domain into thefrequency domain. To do so, we use a random processX(t), t ∈ [0, n] to model the worm detection data. AssumingX(t) is the source count in time period [t− 1, t] (t ∈ [1, n]),we define the auto-correlation of X(t) by
RX(L) = E[X(t)X(t+ L)]. (5)
In Formula (5), RX(L) is the correlation of worm detectiondata in an interval L. If a recurring behavior exists, a Fouriertransform of the auto-correlation function of RX(L) can revealsuch behavior. Thus, the PSD function (also represented bySX(f); where f refers to frequency) of the scan traffic datais determined using the Discrete Fourier Transform (DFT) ofits auto-correlation function as follows,
ψ(RX [L], K) =
N−1∑
n=0
(RX [L]) · e−j2πKn/N , (6)
where K = 0, 1, . . . , N − 1.As the PSD inherently captures any recurring pattern in the
frequency domain, the PSD function shows a comparativelyeven distribution across a wide spectrum range for the normalnon-worm scan traffic. The PSD of C-Worm scan traffic showsspikes or noticeably higher concentrations at a certain rangeof the spectrum.
4.2.2 Spectral Flatness Measure (SFM)We measure the flatness of PSD to distinguish the scan trafficof the C-Worm from the normal non-worm scan traffic. Forthis, we introduce the Spectral Flatness Measure (SFM), whichcan capture anomaly behavior in certain range of frequencies.The SFM is defined as the ratio of the geometric mean to thearithmetic mean of the PSD coefficients [62], [63]. It can be
expressed as,
SFM =[∏n
k=1 S(fk)]1n
1n
∑nk=1 S(fk)
, (7)
where S(fk) is an PSD coefficient for the PSD obtained fromthe results in Formula (6). SFM is a widely existing measurefor discriminating frequencies in various applications suchas voiced frame detection in speech recognition [63], [64].In general, small values of SFM imply the concentration ofdata at narrow frequency spectrum ranges. Note that the C-Worm has unpreventable recurring behavior in its scan traffic;consequently its SFM values are comparatively smaller thanthe SFM values of normal non-worm scan traffic. To be usefulin detecting C-Worms, we introduce a sliding window tocapture a noticeably higher concentrations at a small range ofspectrum. When such noticeably concentration is recognized,we derive the SFM within a wider frequency range. FromFig. 5, we can observe that the SFM value for the C-Worm isvery small (e.g., with a mean value of approximately 0.075).A formal analysis of SFM for the C-Worm is presented in theAppendix B.
4.2.3 Detection Decision Rule
We now describe the method of applying an appropriatedetection rule to detect C-Worm propagation. As the SFMvalue can be used to sensitively distinguish the C-Wormand normal non-worm scan traffic, the worm detection isperformed by comparing the SFM with a predefined thresholdTr. If the SFM value is smaller than a predefined thresholdTr, then a C-Worm propagation alert is generated. The valueof the threshold Tr used by the C-Worm detection can befittingly set based on the knowledge of statistical distribution(e.g., PDF) of SFM values that correspond to the non-wormscan traffic. Notice that the Tr value for the non-worm trafficcan be derived by analyzing the historical data provided bySANs Internet Storm Center (ISC). In the worm detectionsystems, monitors collect port-scan traffic to certain area ofdark IP addresses and periodically reports scan traffic log tothe data center. Then the data center aggregates the data fromdifferent monitors on the same port and publishes the data.Based on the historical data for different ports, we can buildthe statistical profiles of port-scan traffic on different ports andthen derive the Tr value for the non-worm traffic. Based onthe continuous reported data, the value of Tr will be tunedand adaptively used to carry out worm detection.
If we can obtain the PDF of SFM values for the C-Worm through comprehensive simulations and even real-worldprofiled data in the future, the optimal threshold can beobtained by applying the Bayes classification [65]. If the PDFof SFM values for the C-Worm is not available, based on thePDF of SFM values of the normal non-worm scan traffic, wecan set an appropriate Tr value. For example, the Tr valuecan be determined by the Chebyshev inequality [65] in orderto obtain a reasonable false positive rate for worm detection.Hence in Section 5, we evaluate our spectrum-based detectionscheme against the C-Worm on two cases: (a) the PDF of SFMvalues are known for both the normal non-worm scan traffic
IEEE TRANSACTIONS ON DEPEDABLE AND SECURE COMPUTINGThis article has been accepted for publication in a future issue of this journal, but has not been fully edited. Content may change prior to final publication.
Authorized licensed use limited to: Universidade de Macau. Downloaded on July 16,2010 at 02:00:53 UTC from IEEE Xplore. Restrictions apply.
IEEE TRANSACTIONS ON DEPENDABLE AND SECURE COMPUTING ,VOL. 8, NO. 3, MAY-JUNE 2011
9
and the C-Worm scan traffic, (b) the PDF of SFM values isonly known for the normal non-worm scan traffic.
In addition, our spectrum-based scheme is also generic fordetecting the PRS worms. This is due to the fact that propa-gation traffic of PRS worms has an exponentially increasingpattern. Thus, in the propagation traffic of PRS worms, thePSD values in the low frequency range are much highercompared with other frequency ranges. A formal analysis ofSFM for the PRS worm is presented in Appendix C.
Notice that even if the C-Worm monitors the port-scantraffic report, it will be hard for the C-Worm to make theSFM similar to the background traffic. This can be reasonedby two factors. First, the low value of SFM is mainly caused bythe closed-loop control nature of C-worm. The concentrationwithin a narrow range of frequencies is unavoidable since theC-Worm adapts to the dynamics of the Internet in a recurringmanner for manipulating the overall scan traffic volume. Basedon our analysis, the non-worm traffic on a port is rather randomand its SFM has a flat pattern. That means that the non-wormtraffic on the port distributes similar power across differentfrequencies. Second, as we indicated in other responses, with-out introducing the closed-loop control, it will be difficult forthe attacker to hide the irregularity of worm propagation trafficin the time domain. When the worm attacks incorporate theclosed-loop control mechanism to camouflage their traffic, itwill expose a relative small value of SFM. Hence, integratingour spectrum-based detection with existing traffic rate-basedanomaly detection in the time domain, we can force the wormattacker into a dilemma: if the worm attacker does not use theclosed-loop control, the existing traffic rate-based detectionscheme will be able to detect the worm; if the worm attackeradopt the closed-loop control, it will cause the relatively smallSFM due to the process of closed-loop control. This makesthe worm attack to be detected by our spectrum-based schemealong with other existing traffic-rate based detection schemes.
5 PERFORMANCE EVALUATIONIn this section, we report our evaluation results that illustratethe effectiveness of our spectrum-based detection schemeagainst both the C-Worm and the PRS worm in comparisonwith existing representative detection schemes for detectingwide-spreading worms. In addition, we also take into consid-eration destination distribution based detection schemes andevaluate their performance against the C-Worm.
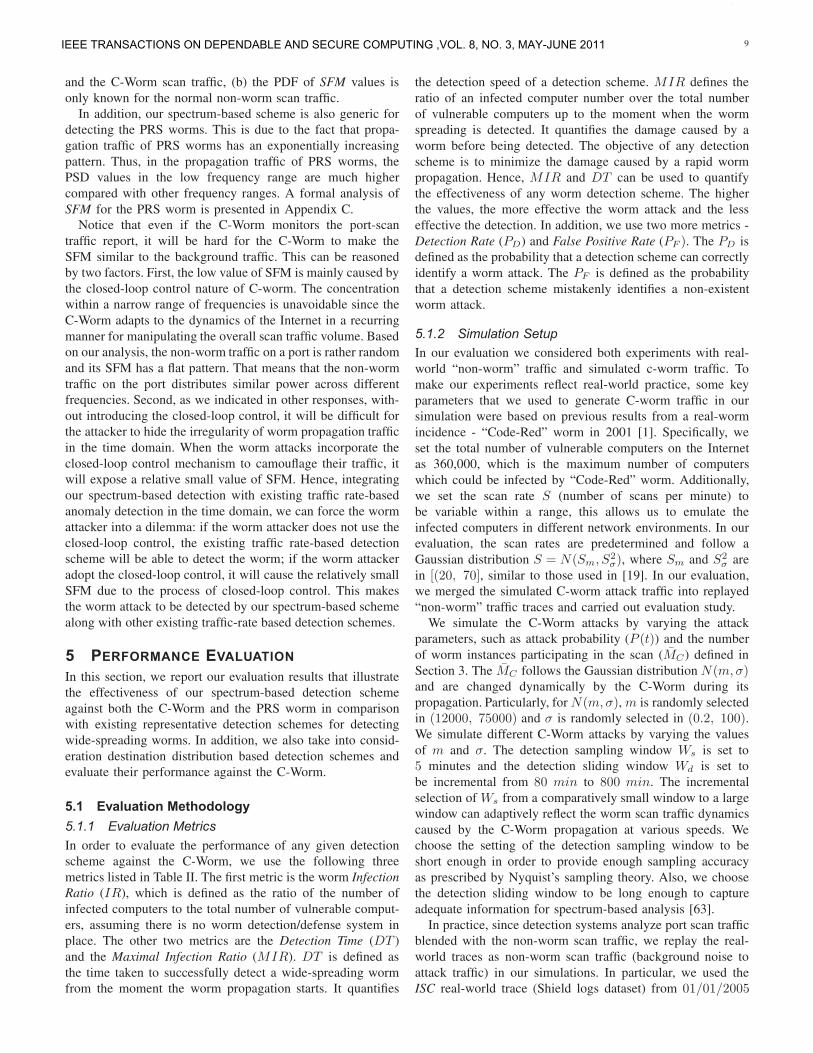
5.1 Evaluation Methodology5.1.1 Evaluation MetricsIn order to evaluate the performance of any given detectionscheme against the C-Worm, we use the following threemetrics listed in Table II. The first metric is the worm InfectionRatio (IR), which is defined as the ratio of the number ofinfected computers to the total number of vulnerable comput-ers, assuming there is no worm detection/defense system inplace. The other two metrics are the Detection Time (DT )and the Maximal Infection Ratio (MIR). DT is defined asthe time taken to successfully detect a wide-spreading wormfrom the moment the worm propagation starts. It quantifies
the detection speed of a detection scheme. MIR defines theratio of an infected computer number over the total numberof vulnerable computers up to the moment when the wormspreading is detected. It quantifies the damage caused by aworm before being detected. The objective of any detectionscheme is to minimize the damage caused by a rapid wormpropagation. Hence, MIR and DT can be used to quantifythe effectiveness of any worm detection scheme. The higherthe values, the more effective the worm attack and the lesseffective the detection. In addition, we use two more metrics -Detection Rate (PD) and False Positive Rate (PF ). The PD isdefined as the probability that a detection scheme can correctlyidentify a worm attack. The PF is defined as the probabilitythat a detection scheme mistakenly identifies a non-existentworm attack.
5.1.2 Simulation SetupIn our evaluation we considered both experiments with real-world “non-worm” traffic and simulated c-worm traffic. Tomake our experiments reflect real-world practice, some keyparameters that we used to generate C-worm traffic in oursimulation were based on previous results from a real-wormincidence - “Code-Red” worm in 2001 [1]. Specifically, weset the total number of vulnerable computers on the Internetas 360,000, which is the maximum number of computerswhich could be infected by “Code-Red” worm. Additionally,we set the scan rate S (number of scans per minute) tobe variable within a range, this allows us to emulate theinfected computers in different network environments. In ourevaluation, the scan rates are predetermined and follow aGaussian distribution S = N(Sm, S2
σ), where Sm and S2σ are
in [(20, 70], similar to those used in [19]. In our evaluation,we merged the simulated C-worm attack traffic into replayed“non-worm” traffic traces and carried out evaluation study.
We simulate the C-Worm attacks by varying the attackparameters, such as attack probability (P (t)) and the numberof worm instances participating in the scan (MC) defined inSection 3. The MC follows the Gaussian distribution N(m,σ)and are changed dynamically by the C-Worm during itspropagation. Particularly, for N(m,σ), m is randomly selectedin (12000, 75000) and σ is randomly selected in (0.2, 100).We simulate different C-Worm attacks by varying the valuesof m and σ. The detection sampling window Ws is set to5 minutes and the detection sliding window Wd is set tobe incremental from 80 min to 800 min. The incrementalselection of Ws from a comparatively small window to a largewindow can adaptively reflect the worm scan traffic dynamicscaused by the C-Worm propagation at various speeds. Wechoose the setting of the detection sampling window to beshort enough in order to provide enough sampling accuracyas prescribed by Nyquist’s sampling theory. Also, we choosethe detection sliding window to be long enough to captureadequate information for spectrum-based analysis [63].
In practice, since detection systems analyze port scan trafficblended with the non-worm scan traffic, we replay the real-world traces as non-worm scan traffic (background noise toattack traffic) in our simulations. In particular, we used theISC real-world trace (Shield logs dataset) from 01/01/2005
IEEE TRANSACTIONS ON DEPEDABLE AND SECURE COMPUTINGThis article has been accepted for publication in a future issue of this journal, but has not been fully edited. Content may change prior to final publication.
Authorized licensed use limited to: Universidade de Macau. Downloaded on July 16,2010 at 02:00:53 UTC from IEEE Xplore. Restrictions apply.
IEEE TRANSACTIONS ON DEPENDABLE AND SECURE COMPUTING ,VOL. 8, NO. 3, MAY-JUNE 2011
10
TABLE 1Evaluation Metrics
Notation Definition
Infection Ratio (IR) Ratio of worm-infection over time without the presence of detection/defense systemMaximal Infection Ratio (MIR) Ratio of worm infection at the moment that worm is being detectedDetection time (DT ) Time taken to successfully detect a wide-spreading worm from its birth
to 01/15/2005. Note that SANs ISC, maintained by the SANsInstitute, have gained popularity among the Internet securitycommunity in recent years. ISC collects firewall and Intrusiondetection system logs, which indicate port-scan trends fromapproximately 2000 organizations that monitor up to 1 millionIP addresses. We choose the scan traffic logs for port 8080 asan example for profiling the non-worm scan traffic.
In order to provide the creditability of such data, we did thefollowing effort before using the data in our experiments. First,we had the 15 days traces from 01/01/2005 to 01/15/2005provided by SANs ISC. We checked with the SANs websiteand found that there were no worm attack incidents withinthose 15 days. Second, we obtained the statistical profile oftraffic traces, including the mean value and standard deviationof traffic rates. Based on the statistical profile, we set athreshold which is the summary of mean value and four timesthat of the standard derivation, and filtered out some datawhich had unusual large values. Third, we conducted ourevaluation 15 times based on data randomly combined withdifferent dates. The results we showed in the paper are themean values of experimental results from different rounds.
5.2 Performance of Detection SchemesWe evaluate our proposed spectrum-based detection scheme bycomparing its performance with three existing representativetraffic volume-based detection schemes. The first scheme isthe volume mean-based (MEAN) detection scheme which usesmean of scan traffic to detect worm propagation [20]; thesecond scheme is the trend-based (TREND) detection schemewhich uses the increasing trend of scan traffic to detect wormpropagation [19]; and the third scheme is the victim numbervariance based (VAR) detection scheme which uses the vari-ance of the scan traffic to detect worm propagation [21].
We define our spectrum-based detection scheme as SPEC.We evaluate two types of SPEC: one has no knowledge ofany C-Worm attacks or C-Worm scan traffic (denoted bySPEC(W)) and the other has knowledge of C-Worm attacksthrough an off-line training process (denoted by SPEC). Forthe off-line training, we use 1000 worm attacks that includeboth the C-Worm (800 C-Worm attacks) and PRS worms(200 PRS worm attacks). For fairness, we set the detectionparameters for our SPEC scheme and the other three detectionschemes, so that all detection schemes achieve a similar falsepositive rate (PF ) below 1%.
In the following subsections, we first evaluate the perfor-mance of our spectrum-based detection scheme in the contextof detecting C-Worm attacks. We then evaluate the perfor-mance of our spectrum-based detection scheme in the contextof detecting traditional PRS worms, followed by performance
comparison between traffic volume based detection and trafficdistribution based detection.
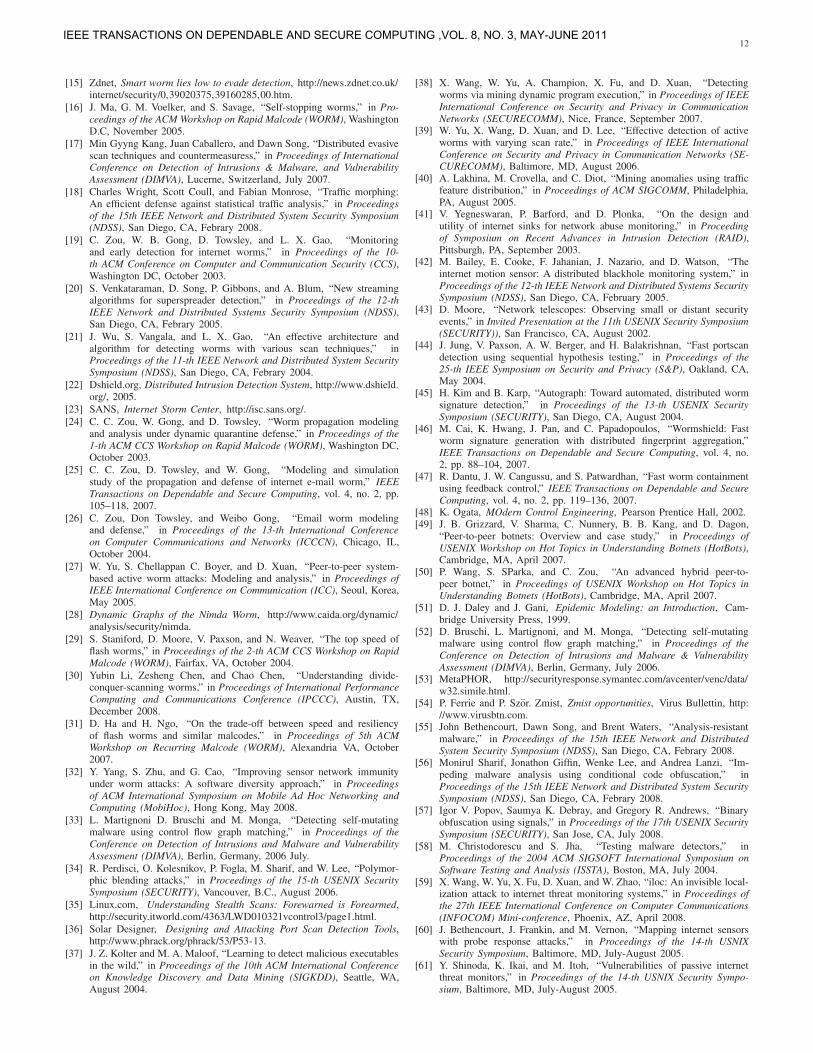
5.2.1 Detection Performance for C-Worm AttacksTable 2 shows the detection results of different detectionschemes against the C-Worm. The results have been averagedover 500 C-Worm attacks. From this table, we can observethat existing detection schemes are not able to effectivelydetect the C-Worm and their detection rate (PD) values aresignificantly lower in comparison with our spectrum-baseddetection schemes (SPEC and SPEC(W)). For example, SPECachieves the detection rate of 99%, which is at least 3-4times more accurate than detection schemes such as VAR andMEAN that achieve detection rate values of only 48% and14%, respectively.
Our SPEC and SPEC(W) detection schemes also achievegood detection time (DT ) performance in addition to the highdetection rate values indicated above. In contrast, the detectiontime of existing detection schemes have relatively largervalues. As a consequence of the detection time values, we cansee that the C-Worm propagation is effectively contained bySPEC and SPEC(W), as demonstrated by the lower values ofmaximal infection ratio (MIR) for the SPEC and SPEC(W).Since the detection rate values for the existing detectionschemes are relatively small, obtaining low values of MIRfor those schemes are not as significant as those for SPECand SPEC(W). Furthermore, we can notice that the detectionperformance of the SPEC(W) is worse than the SPEC. This isbecause the SPEC(W) lacks off-line training knowledge for theC-Worm scan traffic. Nonetheless, the SPEC(W) still performsmuch better than existing detection schemes.
5.2.2 Detection Performance for Traditional PRSWormsWe evaluate the detection performance of different detectionschemes for traditional PRS worm attacks. The detection per-formance results have been averaged over 500 PRS worm at-tacks. We observe that both our SPEC and SPEC(W) schemesachieve 100% detection rate (PD) while detecting traditionalPRS worms in comparison with the existing worm detectionschemes that have been specifically designed for detecting thetraditional PRS worms.
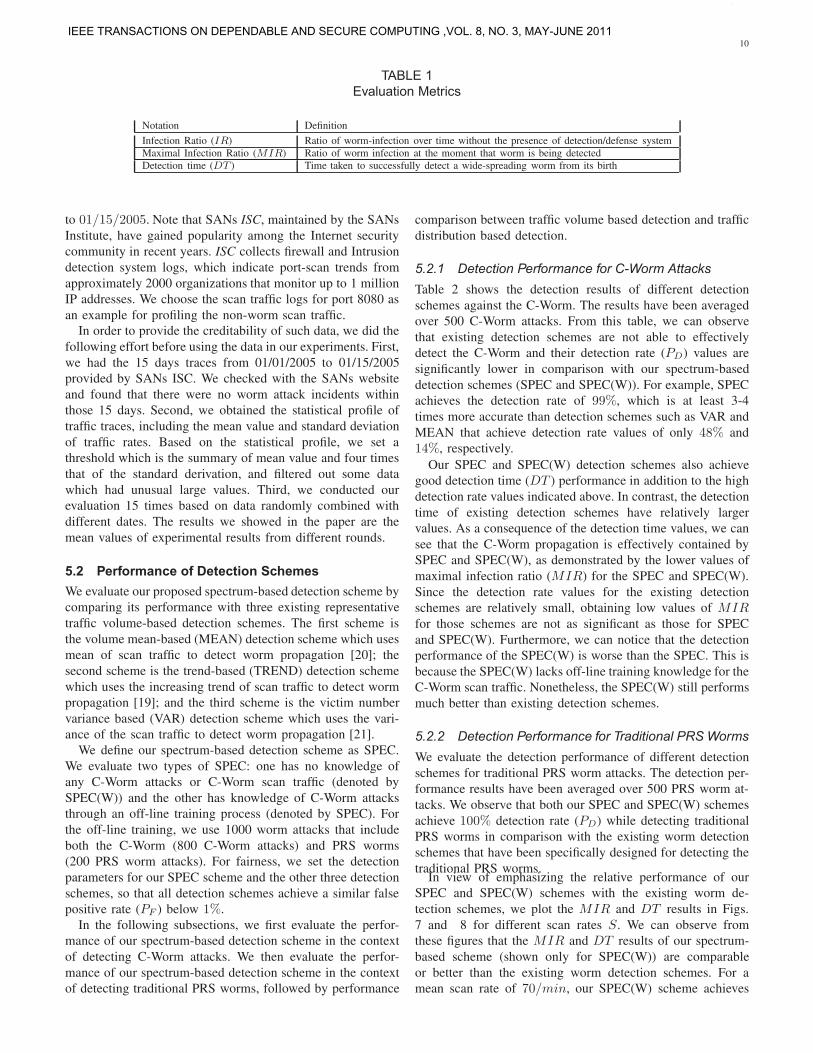
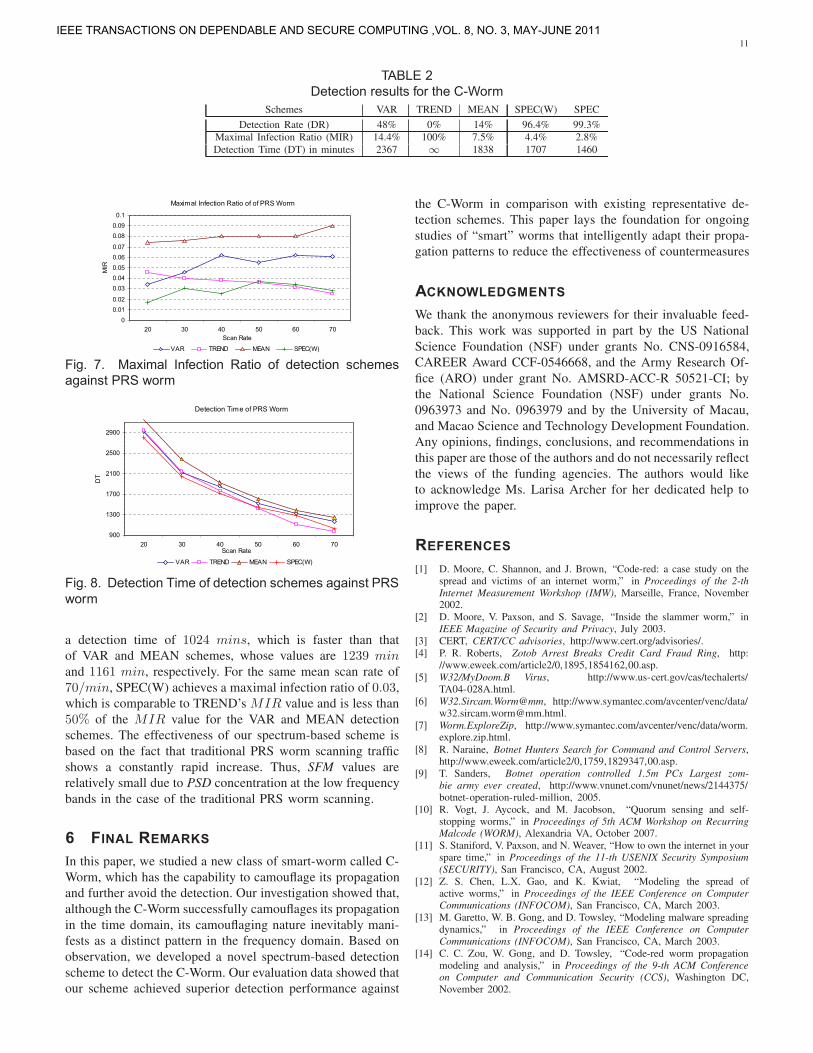
In view of emphasizing the relative performance of ourSPEC and SPEC(W) schemes with the existing worm de-tection schemes, we plot the MIR and DT results in Figs.7 and 8 for different scan rates S. We can observe fromthese figures that the MIR and DT results of our spectrum-based scheme (shown only for SPEC(W)) are comparableor better than the existing worm detection schemes. For amean scan rate of 70/min, our SPEC(W) scheme achieves
IEEE TRANSACTIONS ON DEPEDABLE AND SECURE COMPUTINGThis article has been accepted for publication in a future issue of this journal, but has not been fully edited. Content may change prior to final publication.
Authorized licensed use limited to: Universidade de Macau. Downloaded on July 16,2010 at 02:00:53 UTC from IEEE Xplore. Restrictions apply.
IEEE TRANSACTIONS ON DEPENDABLE AND SECURE COMPUTING ,VOL. 8, NO. 3, MAY-JUNE 2011
11
TABLE 2Detection results for the C-Worm
Schemes VAR TREND MEAN SPEC(W) SPEC
Detection Rate (DR) 48% 0% 14% 96.4% 99.3%Maximal Infection Ratio (MIR) 14.4% 100% 7.5% 4.4% 2.8%Detection Time (DT) in minutes 2367 ∞ 1838 1707 1460
Maximal Infection Ratio of of PRS Worm
00.010.02
0.030.040.050.060.07
0.080.090.1
20 30 40 50 60 70Scan Rate
MIR
VAR TREND MEAN SPEC(W)
Fig. 7. Maximal Infection Ratio of detection schemesagainst PRS worm
Detection Time of PRS Worm
900
1300
1700
2100
2500
2900
20 30 40 50 60 70Scan Rate
DT
VAR TREND MEAN SPEC(W)
Fig. 8. Detection Time of detection schemes against PRSworm
a detection time of 1024 mins, which is faster than thatof VAR and MEAN schemes, whose values are 1239 minand 1161 min, respectively. For the same mean scan rate of70/min, SPEC(W) achieves a maximal infection ratio of 0.03,which is comparable to TREND’s MIR value and is less than50% of the MIR value for the VAR and MEAN detectionschemes. The effectiveness of our spectrum-based scheme isbased on the fact that traditional PRS worm scanning trafficshows a constantly rapid increase. Thus, SFM values arerelatively small due to PSD concentration at the low frequencybands in the case of the traditional PRS worm scanning.
6 FINAL REMARKSIn this paper, we studied a new class of smart-worm called C-Worm, which has the capability to camouflage its propagationand further avoid the detection. Our investigation showed that,although the C-Worm successfully camouflages its propagationin the time domain, its camouflaging nature inevitably mani-fests as a distinct pattern in the frequency domain. Based onobservation, we developed a novel spectrum-based detectionscheme to detect the C-Worm. Our evaluation data showed thatour scheme achieved superior detection performance against
the C-Worm in comparison with existing representative de-tection schemes. This paper lays the foundation for ongoingstudies of “smart” worms that intelligently adapt their propa-gation patterns to reduce the effectiveness of countermeasures
ACKNOWLEDGMENTSWe thank the anonymous reviewers for their invaluable feed-back. This work was supported in part by the US NationalScience Foundation (NSF) under grants No. CNS-0916584,CAREER Award CCF-0546668, and the Army Research Of-fice (ARO) under grant No. AMSRD-ACC-R 50521-CI; bythe National Science Foundation (NSF) under grants No.0963973 and No. 0963979 and by the University of Macau,and Macao Science and Technology Development Foundation.Any opinions, findings, conclusions, and recommendations inthis paper are those of the authors and do not necessarily reflectthe views of the funding agencies. The authors would liketo acknowledge Ms. Larisa Archer for her dedicated help toimprove the paper.
REFERENCES[1] D. Moore, C. Shannon, and J. Brown, “Code-red: a case study on the
spread and victims of an internet worm,” in Proceedings of the 2-thInternet Measurement Workshop (IMW), Marseille, France, November2002.
[2] D. Moore, V. Paxson, and S. Savage, “Inside the slammer worm,” inIEEE Magazine of Security and Privacy, July 2003.
[3] CERT, CERT/CC advisories, http://www.cert.org/advisories/.[4] P. R. Roberts, Zotob Arrest Breaks Credit Card Fraud Ring, http:
//www.eweek.com/article2/0,1895,1854162,00.asp.[5] W32/MyDoom.B Virus, http://www.us-cert.gov/cas/techalerts/
TA04-028A.html.[6] W32.Sircam.Worm@mm, http://www.symantec.com/avcenter/venc/data/
[email protected].[7] Worm.ExploreZip, http://www.symantec.com/avcenter/venc/data/worm.
explore.zip.html.[8] R. Naraine, Botnet Hunters Search for Command and Control Servers,
http://www.eweek.com/article2/0,1759,1829347,00.asp.[9] T. Sanders, Botnet operation controlled 1.5m PCs Largest zom-
bie army ever created, http://www.vnunet.com/vnunet/news/2144375/botnet-operation-ruled-million, 2005.
[10] R. Vogt, J. Aycock, and M. Jacobson, “Quorum sensing and self-stopping worms,” in Proceedings of 5th ACM Workshop on RecurringMalcode (WORM), Alexandria VA, October 2007.
[11] S. Staniford, V. Paxson, and N. Weaver, “How to own the internet in yourspare time,” in Proceedings of the 11-th USENIX Security Symposium(SECURITY), San Francisco, CA, August 2002.
[12] Z. S. Chen, L.X. Gao, and K. Kwiat, “Modeling the spread ofactive worms,” in Proceedings of the IEEE Conference on ComputerCommunications (INFOCOM), San Francisco, CA, March 2003.
[13] M. Garetto, W. B. Gong, and D. Towsley, “Modeling malware spreadingdynamics,” in Proceedings of the IEEE Conference on ComputerCommunications (INFOCOM), San Francisco, CA, March 2003.
[14] C. C. Zou, W. Gong, and D. Towsley, “Code-red worm propagationmodeling and analysis,” in Proceedings of the 9-th ACM Conferenceon Computer and Communication Security (CCS), Washington DC,November 2002.
IEEE TRANSACTIONS ON DEPEDABLE AND SECURE COMPUTINGThis article has been accepted for publication in a future issue of this journal, but has not been fully edited. Content may change prior to final publication.
Authorized licensed use limited to: Universidade de Macau. Downloaded on July 16,2010 at 02:00:53 UTC from IEEE Xplore. Restrictions apply.
IEEE TRANSACTIONS ON DEPENDABLE AND SECURE COMPUTING ,VOL. 8, NO. 3, MAY-JUNE 2011
12
[15] Zdnet, Smart worm lies low to evade detection, http://news.zdnet.co.uk/internet/security/0,39020375,39160285,00.htm.
[16] J. Ma, G. M. Voelker, and S. Savage, “Self-stopping worms,” in Pro-ceedings of the ACM Workshop on Rapid Malcode (WORM), WashingtonD.C, November 2005.
[17] Min Gyyng Kang, Juan Caballero, and Dawn Song, “Distributed evasivescan techniques and countermeasuress,” in Proceedings of InternationalConference on Detection of Intrusions & Malware, and VulnerabilityAssessment (DIMVA), Lucerne, Switzerland, July 2007.
[18] Charles Wright, Scott Coull, and Fabian Monrose, “Traffic morphing:An efficient defense against statistical traffic analysis,” in Proceedingsof the 15th IEEE Network and Distributed System Security Symposium(NDSS), San Diego, CA, Febrary 2008.
[19] C. Zou, W. B. Gong, D. Towsley, and L. X. Gao, “Monitoringand early detection for internet worms,” in Proceedings of the 10-th ACM Conference on Computer and Communication Security (CCS),Washington DC, October 2003.
[20] S. Venkataraman, D. Song, P. Gibbons, and A. Blum, “New streamingalgorithms for superspreader detection,” in Proceedings of the 12-thIEEE Network and Distributed Systems Security Symposium (NDSS),San Diego, CA, Febrary 2005.
[21] J. Wu, S. Vangala, and L. X. Gao, “An effective architecture andalgorithm for detecting worms with various scan techniques,” inProceedings of the 11-th IEEE Network and Distributed System SecuritySymposium (NDSS), San Diego, CA, Febrary 2004.
[22] Dshield.org, Distributed Intrusion Detection System, http://www.dshield.org/, 2005.
[23] SANS, Internet Storm Center, http://isc.sans.org/.[24] C. C. Zou, W. Gong, and D. Towsley, “Worm propagation modeling
and analysis under dynamic quarantine defense,” in Proceedings of the1-th ACM CCS Workshop on Rapid Malcode (WORM), Washington DC,October 2003.
[25] C. C. Zou, D. Towsley, and W. Gong, “Modeling and simulationstudy of the propagation and defense of internet e-mail worm,” IEEETransactions on Dependable and Secure Computing, vol. 4, no. 2, pp.105–118, 2007.
[26] C. Zou, Don Towsley, and Weibo Gong, “Email worm modelingand defense,” in Proceedings of the 13-th International Conferenceon Computer Communications and Networks (ICCCN), Chicago, IL,October 2004.
[27] W. Yu, S. Chellappan C. Boyer, and D. Xuan, “Peer-to-peer system-based active worm attacks: Modeling and analysis,” in Proceedings ofIEEE International Conference on Communication (ICC), Seoul, Korea,May 2005.
[28] Dynamic Graphs of the Nimda Worm, http://www.caida.org/dynamic/analysis/security/nimda.
[29] S. Staniford, D. Moore, V. Paxson, and N. Weaver, “The top speed offlash worms,” in Proceedings of the 2-th ACM CCS Workshop on RapidMalcode (WORM), Fairfax, VA, October 2004.
[30] Yubin Li, Zesheng Chen, and Chao Chen, “Understanding divide-conquer-scanning worms,” in Proceedings of International PerformanceComputing and Communications Conference (IPCCC), Austin, TX,December 2008.
[31] D. Ha and H. Ngo, “On the trade-off between speed and resiliencyof flash worms and similar malcodes,” in Proceedings of 5th ACMWorkshop on Recurring Malcode (WORM), Alexandria VA, October2007.
[32] Y. Yang, S. Zhu, and G. Cao, “Improving sensor network immunityunder worm attacks: A software diversity approach,” in Proceedingsof ACM International Symposium on Mobile Ad Hoc Networking andComputing (MobiHoc), Hong Kong, May 2008.
[33] L. Martignoni D. Bruschi and M. Monga, “Detecting self-mutatingmalware using control flow graph matching,” in Proceedings of theConference on Detection of Intrusions and Malware and VulnerabilityAssessment (DIMVA), Berlin, Germany, 2006 July.
[34] R. Perdisci, O. Kolesnikov, P. Fogla, M. Sharif, and W. Lee, “Polymor-phic blending attacks,” in Proceedings of the 15-th USENIX SecuritySymposium (SECURITY), Vancouver, B.C., August 2006.
[35] Linux.com, Understanding Stealth Scans: Forewarned is Forearmed,http://security.itworld.com/4363/LWD010321vcontrol3/page1.html.
[36] Solar Designer, Designing and Attacking Port Scan Detection Tools,http://www.phrack.org/phrack/53/P53-13.
[37] J. Z. Kolter and M. A. Maloof, “Learning to detect malicious executablesin the wild,” in Proceedings of the 10th ACM International Conferenceon Knowledge Discovery and Data Mining (SIGKDD), Seattle, WA,August 2004.
[38] X. Wang, W. Yu, A. Champion, X. Fu, and D. Xuan, “Detectingworms via mining dynamic program execution,” in Proceedings of IEEEInternational Conference on Security and Privacy in CommunicationNetworks (SECURECOMM), Nice, France, September 2007.
[39] W. Yu, X. Wang, D. Xuan, and D. Lee, “Effective detection of activeworms with varying scan rate,” in Proceedings of IEEE InternationalConference on Security and Privacy in Communication Networks (SE-CURECOMM), Baltimore, MD, August 2006.
[40] A. Lakhina, M. Crovella, and C. Diot, “Mining anomalies using trafficfeature distribution,” in Proceedings of ACM SIGCOMM, Philadelphia,PA, August 2005.
[41] V. Yegneswaran, P. Barford, and D. Plonka, “On the design andutility of internet sinks for network abuse monitoring,” in Proceedingof Symposium on Recent Advances in Intrusion Detection (RAID),Pittsburgh, PA, September 2003.
[42] M. Bailey, E. Cooke, F. Jahanian, J. Nazario, and D. Watson, “Theinternet motion sensor: A distributed blackhole monitoring system,” inProceedings of the 12-th IEEE Network and Distributed Systems SecuritySymposium (NDSS), San Diego, CA, February 2005.
[43] D. Moore, “Network telescopes: Observing small or distant securityevents,” in Invited Presentation at the 11th USENIX Security Symposium(SECURITY)), San Francisco, CA, August 2002.
[44] J. Jung, V. Paxson, A. W. Berger, and H. Balakrishnan, “Fast portscandetection using sequential hypothesis testing,” in Proceedings of the25-th IEEE Symposium on Security and Privacy (S&P), Oakland, CA,May 2004.
[45] H. Kim and B. Karp, “Autograph: Toward automated, distributed wormsignature detection,” in Proceedings of the 13-th USENIX SecuritySymposium (SECURITY), San Diego, CA, August 2004.
[46] M. Cai, K. Hwang, J. Pan, and C. Papadopoulos, “Wormshield: Fastworm signature generation with distributed fingerprint aggregation,”IEEE Transactions on Dependable and Secure Computing, vol. 4, no.2, pp. 88–104, 2007.
[47] R. Dantu, J. W. Cangussu, and S. Patwardhan, “Fast worm containmentusing feedback control,” IEEE Transactions on Dependable and SecureComputing, vol. 4, no. 2, pp. 119–136, 2007.
[48] K. Ogata, MOdern Control Engineering, Pearson Prentice Hall, 2002.[49] J. B. Grizzard, V. Sharma, C. Nunnery, B. B. Kang, and D. Dagon,
“Peer-to-peer botnets: Overview and case study,” in Proceedings ofUSENIX Workshop on Hot Topics in Understanding Botnets (HotBots),Cambridge, MA, April 2007.
[50] P. Wang, S. SParka, and C. Zou, “An advanced hybrid peer-to-peer botnet,” in Proceedings of USENIX Workshop on Hot Topics inUnderstanding Botnets (HotBots), Cambridge, MA, April 2007.
[51] D. J. Daley and J. Gani, Epidemic Modeling: an Introduction, Cam-bridge University Press, 1999.
[52] D. Bruschi, L. Martignoni, and M. Monga, “Detecting self-mutatingmalware using control flow graph matching,” in Proceedings of theConference on Detection of Intrusions and Malware & VulnerabilityAssessment (DIMVA), Berlin, Germany, July 2006.
[53] MetaPHOR, http://securityresponse.symantec.com/avcenter/venc/data/w32.simile.html.
[54] P. Ferrie and P. Szor. Zmist, Zmist opportunities, Virus Bullettin, http://www.virusbtn.com.
[55] John Bethencourt, Dawn Song, and Brent Waters, “Analysis-resistantmalware,” in Proceedings of the 15th IEEE Network and DistributedSystem Security Symposium (NDSS), San Diego, CA, Febrary 2008.
[56] Monirul Sharif, Jonathon Giffin, Wenke Lee, and Andrea Lanzi, “Im-peding malware analysis using conditional code obfuscation,” inProceedings of the 15th IEEE Network and Distributed System SecuritySymposium (NDSS), San Diego, CA, Febrary 2008.
[57] Igor V. Popov, Saumya K. Debray, and Gregory R. Andrews, “Binaryobfuscation using signals,” in Proceedings of the 17th USENIX SecuritySymposium (SECURITY), San Jose, CA, July 2008.
[58] M. Christodorescu and S. Jha, “Testing malware detectors,” inProceedings of the 2004 ACM SIGSOFT International Symposium onSoftware Testing and Analysis (ISSTA), Boston, MA, July 2004.
[59] X. Wang, W. Yu, X. Fu, D. Xuan, and W. Zhao, “iloc: An invisible local-ization attack to internet threat monitoring systems,” in Proceedings ofthe 27th IEEE International Conference on Computer Communications(INFOCOM) Mini-conference, Phoenix, AZ, April 2008.
[60] J. Bethencourt, J. Frankin, and M. Vernon, “Mapping internet sensorswith probe response attacks,” in Proceedings of the 14-th USNIXSecurity Symposium, Baltimore, MD, July-August 2005.
[61] Y. Shinoda, K. Ikai, and M. Itoh, “Vulnerabilities of passive internetthreat monitors,” in Proceedings of the 14-th USNIX Security Sympo-sium, Baltimore, MD, July-August 2005.
IEEE TRANSACTIONS ON DEPEDABLE AND SECURE COMPUTINGThis article has been accepted for publication in a future issue of this journal, but has not been fully edited. Content may change prior to final publication.
Authorized licensed use limited to: Universidade de Macau. Downloaded on July 16,2010 at 02:00:53 UTC from IEEE Xplore. Restrictions apply.
IEEE TRANSACTIONS ON DEPENDABLE AND SECURE COMPUTING ,VOL. 8, NO. 3, MAY-JUNE 2011
13
[62] S. Soundararajan and D. L. Wang, “A schema-based model for phonemicrestoration,” Tech. Report, OSU-CISRC-1/04-TR03, Department ofComputer Science and Engineering, The Ohio State University, January2004.
[63] N. S. Jayant and P. Noll, Digital Coding of Waveforms, Prentice-Hall,1984.
[64] R. E. Yantorno, K. R. Krishnamachari, J. M. Lovekin, D. S. Benincasa,and S. J. Wenndt, “The spectral autocorrelation peak valley ratio (sapvr)- a usable speech measure employed as a co-channel detection system,”in Proceedings of IEEE International Workshop on Intelligent SignalProcessing (WISP), Budapest, Hungary, May 2001.
[65] S. Theodoridis and K. Koutroumbas, Pattern Recognition, SecondEdition, Elsevier Science, 2003.
APPENDIXAppendix A: Estimation ofM(t)
We now discuss how the C-Worm can estimate M(t) (numberof worm instances or infected computers) during run-time (i.e,during C-Worm propagation). While there are many possibleways to estimate M(t), we only discuss one approach the C-Worm could use based on the limited network and computingresources available during its propagation. There are otherapproaches, such as incorporating the Peer-to-Peer techniquesto disseminate information through secured IRC channels [49],[50]. Actually, a worm could take advantage of the knowledgethat an infection attempt was a new hit (reaching a previouslyuninfected vulnerable computer) and duplicate hit (reaching apreviously infected vulnerable computer).
To estimate M(t), we use an approach that is similar innature to the approach used by the “self-stopping” wormsthat do not require a global overlay control network [16] forrealizing their behavior in practice. We call our approach toestimate M(t) as the Distributed Co-ordination method. In thismethod, there is no centralized co-ordination between the C-Worm instances to obtain feedback information about the valueof M(t). The distributed co-ordination requires each C-Worminfected computer to be marked with a watermark indicatingthat the C-Worm infection code has already been installedon the scanned host as with “Code-Red” worms. Thus, whenan already infected computer (say for example, host A) scansanother infected computer (say for example, computer B), thencomputer A will detect the watermark and know that computerB has already been infected. By scanning vulnerable computersand obtaining the watermarks information during the scanning,a C-Worm instance can estimate M(t) at run-time as follows.
Let us assume that T , which refers to the whole InternetIP address space, is the C-Worm scanning target space. Inthis scanning target space, assume we have the case whereH(t) number of scans in time t resulted in K(t) numberof infected computers indicated by presence of watermarks(identified by duplicate hits). We model the number of infectedcomputers indicated by watermarks during the scanning pro-cess as binomial process. Then H(t) scanning tries and eachscanning try has successful probability M(t)
T to be indicatedby watermarks, where M(t) is the estimated M(t) at timet. Thus K(t) = H(t) · M(t)
T . With the above equation, wehave M(t) = T ·K(t)
H(t) . Note that the above watermarking-basedmethod might lack the accuracy for the worm propagator totrack the accurate status of worm propagation. Nevertheless,this approach can provide a rough estimation for the worm
propagation status and can be integrated with other strategiesto improve the accuracy of tracking worm propagation status.
Appendix B: SFM of the C-WormWe present a formal analysis of SFM for the C-Worm asfollows: Let the observation Z1 be given by Z1 = X1 + Y1,where X1 is the random variable representing the C-Wormscanning traffic (e.g., volume, destination counter) in onesampling window and Y1 is the random variable representingthe background scanning traffic (e.g., volume, source counter)in one sampling window. We define X = X1−E[X1], whereE[X1] is the mean value of X1 and Y = Y − E[Y1]. Thus,we have Z = X + Y , where X and Y are independent zero-mean random variables. We assume that the total frequency iswithin the −W ≤ f ≤W range.
Based on the observations in Section 4.1, we approximatelyrepresent Y1(t) by white Gaussian noise, which is widelyused in modeling wide-band noise in communication systems.Thus, Y can be approximately represented by a Gaussian whitenoise with zero mean and a variance of σ. Thus, in the totalfrequency band limited within the range ∈ [−W ≤ f ≤ W ],the PSD of Y is SY (f) = σ shows that Y has a constantpower spectrum and each frequency has the average powervalue σ.
Considering the fact that all C-Worm instances adopt asimilar control mechanism strategy to manipulate the overallscanning traffic volume, we explained how a distinct trendcan be noticed in the frequency domain, i.e., the trend beinga concentration in the scanning traffic frequency of the C-Worm within a narrow range of frequencies. Assume that C-Worm scanning traffic counter is referred as m (denoted byfk, where k = 1, . . . ,m and m < W ) in the total (narrow-band) frequency range. Without loss of generality, X(t) is ap-proximately represented by X(t) =
∑2mk=1 ak cos(2πfkt+ θ),
where θ is uniformly distributed in the interval [0, 2π]) andak is uniformly distributed in the interval [−l, l]. Based onthe relationship among autocorrelation, mean, and autoconva-riance, we have RX(τ) = CX(t1, t2) + E[X(t1)]E[X(t2)],where τ = t2 − t1, E[X(t1)] = E[X(t2)] = 0, andCX(t1, t2) = E[(X(t1) − EX(t1))(X(t2) − EX(t2))] isthe auto-covariance of a random process X(t). Thus, itis easy to verify that RX(τ) =
∑mk=1[
ak2
2 cos(2πfkτ)].Thus, the PSD of X(t) can be represented by SX(f) =∑k=m
k=1 [ak2
4 δ(f − fk) +ak
2
4 δ(f + fk)]. As X(t) and Y (t)are independent random process (SY (f) = σ), we haveSZ(f) =
∑k=mk=1 [ak
2
4 δ(f − fk) +ak
2
4 δ(f + fk)] + σ.
Define ak2δ(fk)4σ = R(� 1), SZ(f) can be rewritten
by SZ(f) = σ{∑k=m
k=1 [Rδ(f − fk) +Rδ(f + fk)] + 1}and the SFM of Z(t) can be represented by SZ(f) =
σ2W−2mRσ2m1
2W
12W
[2mσR+σ(2W−2m)]= R
mW
mW
(R−1)+1 . We can rewrite SZ(f)
in above formula as the function of R as F (x) = xt
t(x−1)+1 ,
where x = R, t = mW < 1. As F ′(x) = txt−1(x−1)(t−1)
[t(x−1)+1]2 < 0,the function SZ(f) is a decreasing function of x (= R) and itis observable that R1 = ak
24δ(f)σ + 1� 1 (due to the Dirac’s
δ function property), SZ(f)→ 0. Thus, the SFM of C-Wormis close to 0.
IEEE TRANSACTIONS ON DEPEDABLE AND SECURE COMPUTINGThis article has been accepted for publication in a future issue of this journal, but has not been fully edited. Content may change prior to final publication.
Authorized licensed use limited to: Universidade de Macau. Downloaded on July 16,2010 at 02:00:53 UTC from IEEE Xplore. Restrictions apply.
IEEE TRANSACTIONS ON DEPENDABLE AND SECURE COMPUTING ,VOL. 8, NO. 3, MAY-JUNE 2011
14
Appendix C: SFM of PRS WormIn the following, we conduct analysis on the spectrum-baseddetection scheme to detection PRS worms. Let the input fordetection data Z1 in one sample window be given by Z1 =X1 + Y1, where X1 is the random variable representing theattack traffic (e.g., scan volume) for PRS worms and Y1 isthe random variable representing the background traffic (e.g.,scan volume). We define X = X1 − E[X1], where E[X1] isthe mean value of X1. We also define Y = Y1−E[Y1], whereE[Y1] is the mean value of Y1. Thus, we have Z = X + Y ,where X and Y are independent zero-mean random variables.We assume the overall frequency is within −W ≤ F ≤ Wrange. Similarly, we approximately represent Y1(t) by whiteGaussian noise. Thus, Y can be approximately represented bya white noise with zero mean and a standard derivation of σ.Thus, in the frequency band limited within [−W ≤ F ≤W ],the PSD of Y is SY (F ) = σ, which shows that frequencyY ∈ [−W, W ] has a constant power spectrum. Based on theSFM definition, it is easy to observe that SFM of Y is closeto 1.
According to PRS worm propagation dynamics in For-mula (1), the result is M(t) � eβ·N ·t at the early stageof worm propagation. As β · N · t � 1 at the early stage,M(t) � 1+β ·N · t. Follow the similar procedure, the PSD ofX = f(t)−E(f(t)) can be represented by SX(F ) = β·N · 1
F 2 ,where F ∈ [−W,W ]. Thus, the PSD of Z is β ·N · 1
F 2 + σ.According to Formula (7), we can observe that the value ofSFM for PRS worms is close to 0. It indicates that spectrum-based scheme can detect the PRS worm propagation at theearly stage as well.
Wei Yu Dr. Wei Yu is an assistant professorin the Department of Computer and Informa-tion Sciences, Towson University, Towson, MD21252. Before that, He worked for Cisco Sys-tems Inc. for almost nine years. He receivedthe BS degree in Electrical Engineering fromNanjing University of Technology in 1992, theMS degree in Electrical Engineering from TongjiUniversity in 1995, and the PhD degree in com-puter engineering from Texas A&M University in2008. His research interests include cyber space
security, computer network, and distributed systems.
Xun Wang Dr. Xun Wang received the BS andMS in computer engineering from The EastChina Normal University, Shanghai, China, in1999 and 2002, and the PhD degree in Com-puter Science and Engineering from The OhioState University in 2007. He has been workingfor Cisco Systems, Inc. since 2007. His researchinterests include network security, overlay net-works, and wireless sensor networks.
Prasad Calyam Dr. Prasad Calyam receivedthe BS degree in Electrical and ElectronicsEngineering from Bangalore University, India,and the MS and Ph.D. degrees in Electricaland Computer Engineering from The Ohio StateUniversity, in 1999, 2002, and 2007 respec-tively. He is currently a Senior Systems Devel-oper/Engineer at the Ohio Supercomputer Cen-ter, The Ohio State University. His current re-search interests include multimedia networking,cyber security, cyber infrastructure systems, and
network management.
Dong Xuan Dr. Dong Xuan received the BSand MS degrees in electronic engineering fromShanghai Jiao Tong University (SJTU), China, in1990 and 1993, and the PhD degree in computerengineering from Texas A&M University in 2001.Currently, he is an associate professor in the De-partment of Computer Science and Engineering,The Ohio State University. He was on the facultyof Electronic Engineering at SJTU from 1993 to1997. In 1997, he worked as a visiting researchscholar in the Department of Computer Science,
City University of Hong Kong. From 1998 to 2001, he was a researchassistant/associate in Real-Time Systems Group of the Departmentof Computer Science, Texas A&M University. He is a recipient of theUS National Science Foundation (NSF) CAREER award. His researchinterests include distributed computing, computer networks and cyberspace security.
Wei Zhao Dr. Wei Zhao is currently the Rectorof the University of Macau. Before joining theUniversity of Macau, he served as the Dean ofthe School of Science at Rensselaer PolytechnicInstitute. Between 2005 and 2006, he served asthe director for the Division of Computer andNetwork Systems in the US National ScienceFoundation when he was on leave from TexasA&M University, where he served as Senior As-sociate Vice President for Research and Profes-sor of Computer Science. He was the founding
director of the Texas A&M Center for Information Security and Assur-ance, which has been recognized as a Center of Academic Excellencein Information Assurance Education by the National Security Agency.Dr. Zhao completed his undergraduate program in physics at ShaanxiNormal University, Xian, China, in 1977. He received the MS and PhDdegrees in Computer and Information Sciences at the University ofMassachusetts at Amherst in 1983 and 1986, respectively. Since then,he has served as a faculty member at Amherst College, the Universityof Adelaide, and Texas A&M University. As an elected IEEE fellow, WeiZhao has made significant contributions in distributed computing, real-time systems, computer networks, and cyber space security.
IEEE TRANSACTIONS ON DEPEDABLE AND SECURE COMPUTINGThis article has been accepted for publication in a future issue of this journal, but has not been fully edited. Content may change prior to final publication.
Authorized licensed use limited to: Universidade de Macau. Downloaded on July 16,2010 at 02:00:53 UTC from IEEE Xplore. Restrictions apply.
IEEE TRANSACTIONS ON DEPENDABLE AND SECURE COMPUTING ,VOL. 8, NO. 3, MAY-JUNE 2011