Embed Size (px)
Citation preview
IEEE TRANSACTIONS ON CYBERNETICS, VOL. 46, NO. 10, OCTOBER 2016 2265
Automated GPR Rebar Analysis for RoboticBridge Deck Evaluation
Parneet Kaur, Kristin J. Dana, Francisco A. Romero, and Nenad Gucunski
Abstract—Ground penetrating radar (GPR) is used to evalu-ate deterioration of reinforced concrete bridge decks based onmeasuring signal attenuation from embedded rebar. The existingmethods for obtaining deterioration maps from GPR data oftenrequire manual interaction and offsite processing. In this paper,a novel algorithm is presented for automated rebar detection andanalysis. We test the process with comprehensive measurementsobtained using a novel state-of-the-art robotic bridge inspec-tion system equipped with GPR sensors. The algorithm achievesrobust performance by integrating machine learning classifica-tion using image-based gradient features and robust curve fittingof the rebar hyperbolic signature. The approach avoids edgedetection, thresholding, and template matching that require man-ual tuning and are known to perform poorly in the presence ofnoise and outliers. The detected hyperbolic signatures of rebarswithin the bridge deck are used to generate deterioration mapsof the bridge deck. The results of the rebar region detector arecompared quantitatively with several methods of image-basedclassification and a significant performance advantage is demon-strated. High rates of accuracy are reported on real data thatincludes thousands of individual hyperbolic rebar signatures fromthree real bridge decks.
Index Terms—Automatic rebar detection, depth correction,ground penetrating radar (GPR), histogram of oriented gra-dients (HOG), hyperbolic signature, machine learning, patternrecognition, robotic bridge inspection, robust curve fitting, sup-port vector machines (SVM).
I. INTRODUCTION
BRIDGES deteriorate with time due to factors like aging,changing weather conditions, increased traffic load and
use of de-icing salts. Reinforced concrete (RC) bridges havesteel bars, called rebars, which are embedded within the decksfor structural strength (Fig. 1). Rebars are prone to cor-rosion due to moisture and chloride ions from the use of
Manuscript received March 25, 2014; revised March 12, 2015 andJune 23, 2015; accepted August 17, 2015. Date of publication October 26,2015; date of current version September 14, 2016. This work was supportedby the Federal Highway Administration’s Long Term Bridge PerformanceProgram at Rutgers Center for Advanced Infrastructure and Transportation.This paper was recommended by Associate Editor Y. Tan.
P. Kaur and K. J. Dana are with the Department of Electrical andComputer Engineering, Rutgers University, Piscataway, NJ 08854 USA(e-mail: [email protected]; [email protected]).
F. A. Romero is with Romero NDT&E, LLC, Glen Gardner, NJ 08826USA (e-mail: [email protected]).
N. Gucunski is with the Center for Advanced Infrastructure andTechnology, Rutgers University, Piscataway, NJ 08854 USA (e-mail:[email protected]).
The dataset for the Warren County Bridge, NJ is available at:https://github.com/kjdana/automated_rebar_analysis_dataset.
Color versions of one or more of the figures in this paper are availableonline at http://ieeexplore.ieee.org.
Digital Object Identifier 10.1109/TCYB.2015.2474747
Fig. 1. Top row: example result of automatic detection of underground rebarsusing our algorithm. The peak amplitude near the hyperbolic signature ismarked and an area of possible deterioration is evident. Bottom row: exposedrebar where corrosion has occurred over time due to moisture and chlorideions. GPR is used to analyze rebar integrity without excavation.
deicing salts. Measures are taken to prevent rebar corrosionby applying resistant coating, incorporating inhibitors in con-crete and providing adequate concrete cover [1]. However,these measures only delay the process. Moreover, once pas-sive protection around rebars is compromised, acceleratedcorrosion can take place. By the time the effect of rebardamage is visible on the surface of bridge deck in form ofcracks accompanied by rust stains, extensive deterioration hasalready taken place. Since rebars are embedded and not acces-sible to physical measurement at the surface, obtaining anaccurate condition assessment of deteriorated areas can bechallenging.
Traditional methods like half-cell potential test, chain drag,and coring are labor intensive and require access to the bareconcrete surface or drilled holes [2], [3]. On the other hand,employing nondestructive test (NDT) methods is less laborintensive and facilitates faster data collection. Ground penetrat-ing radar (GPR) is one of the most widely used NDT methodsfor detecting subsurface anomalies in concrete cover [4]–[6].In bridge surveys, GPR is used to measure concrete thickness,estimate relative water moisture content variation and markor map rebar locations, as well as to provide corrosion-based
2168-2267 c© 2015 IEEE. Personal use is permitted, but republication/redistribution requires IEEE permission.See http://www.ieee.org/publications_standards/publications/rights/index.html for more information.

2266 IEEE TRANSACTIONS ON CYBERNETICS, VOL. 46, NO. 10, OCTOBER 2016
Fig. 2. GPR data for rebar inspection are acquired by a novel robotic systemfor automated bridge inspection: robotics assisted bridge inspection tool.
condition assessments of RC decks. The information capturedby GPR can be represented as high quality images that canbe analyzed directly using pattern recognition and machinelearning methods. Recent methods for robotic bridge deckscanning [7] provides densely sampled and repeatable bridgemeasurements. Densely sampled measurements can also beobtained with mobile trailers [8] and wheeled carts equippedwith GPR sensors [9].
Many of the existing methods for processing GPR datarequire manual input and are suitable primarily for interactiveoffsite analysis [10]. With the advent of robotic and mobilebridge scanning, measurement sets are large and there is aneed for on-site data analytics. Semi-automated analysis meth-ods requiring manual input is prohibitively time-consumingand cumbersome for large datasets. Data acquisition is readilyachievable with mechanical robotics, fast sensors, and portablestorage devices; however, extracting knowledge from vastmeasurements in an efficient manner is still a challenge. Thispaper provides a novel method for automatic detection andlocalization of rebars from GPR data for deterioration analysis.The approach is tested using measurements from a state-of-the-art robotic bridge scanner [7] as shown in Fig. 2. Thealgorithm is designed and evaluated for rebar detection onlarge regions of real bridge decks and provides demonstrableadvantages over prior methods for GPR rebar detection. Wetest the process with comprehensive measurements at the fol-lowing three bridge decks: 1) U.S. Route 15 James MadisonHighway, Haymarket, VA; 2) 150 Municipal Dr. Bloomsbury,Warren County, NJ; and 3) Slab section at Rutgers University,Livingston Campus, New Brunswick, NJ.
A. Background and Related Work
In much of the literature, GPR sensor output can be treatedas images which exhibit a hyperbolic signature as discussed indetail in Section II. The image-based approach is less compu-tationally intensive than the inverse scattering problem [11]because pattern analysis is done for a local region of thebridge deck. An intuitive approach used often in [12]–[16] is to
Fig. 3. Top row: GPR-scan from a real bridge. Bottom row: edge information.Notice the edges do not trace the perceived hyperbola and are susceptible tonoise and other artifacts.
use edge detection, or thresholding on local extrema of inten-sity, to preprocess the image and isolate potential hyperbolaregions. Edge detection has well known limitations includingpoor performance in the presence of noise and image blurring.Additionally, the thresholding typically requires one or moremanually selected parameters that must be tuned to a givendataset. An example of the problems of edge detection inpreprocessing is illustrated in Fig. 3.
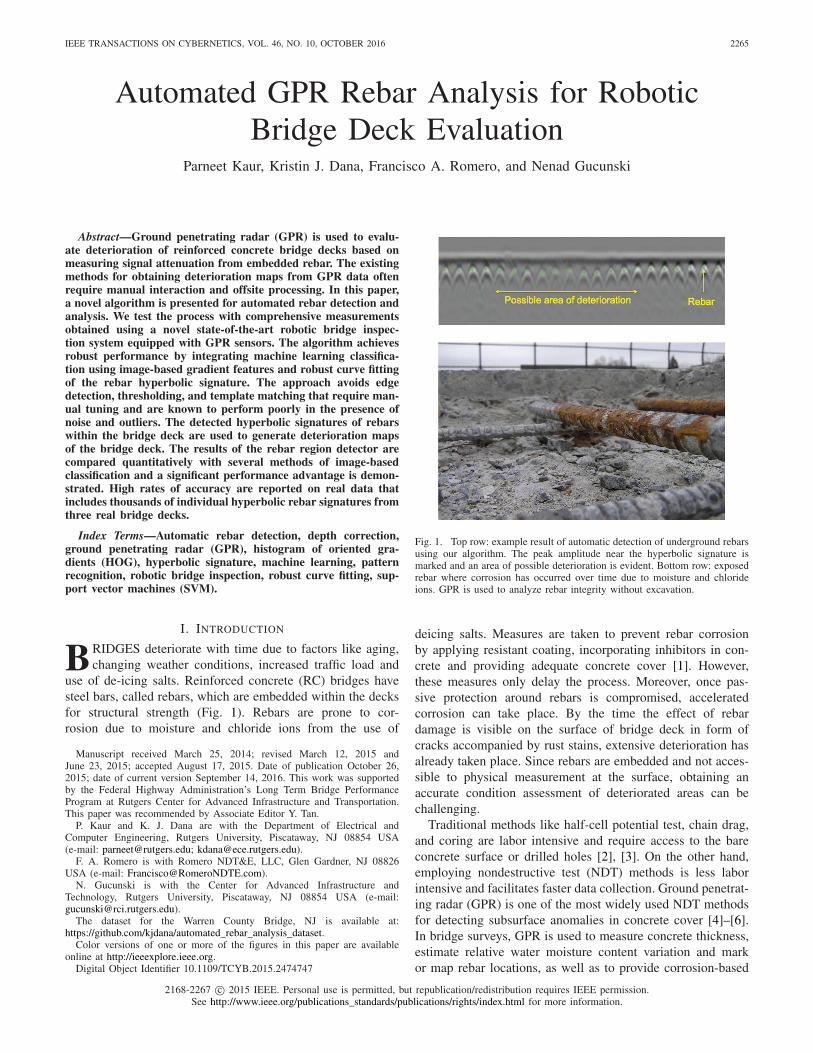
Another simple approach to detect rebar regions that hasbeen used in prior work is template matching with normal-ized cross-correlation as the matching criterion for invarianceto intensity changes [9], [17], [18]. Template matching as amain step or a preprocessing step has significant limitations.In particular, the appearance of the hyperbola can vary frombridge to bridge due to variation in concrete type, rebar depthand noise. Additionally, a threshold must be chosen manu-ally by experimentation. Methods such as [17] use templatematching as a preprocessing step, followed by a hyperboliccurve fitting using partial differential equations. As shown inFig. 4, template matching can cause many missing and falsedetections.
Edge detection, thresholding, and template matching are notappropriate for robust performance in large real-world datasets.These issues have been well studied in the computer visionliterature and modern methods incorporate machine learn-ing. Specifically, supervised learning yields high-classificationaccuracy by using a training phase with labeled examplesto eliminate the need for parameter tuning. For automatedGPR rebar detection, the machine learning method of neuralnetworks has been applied [14], [15], [19]–[21]. These meth-ods [14], [15], [19] use edge detection as a preprocessor andtherefore have the same general limitations with respect tonoise and parameter tuning that compromise edge detectors.Singh and Nene [21] showed promise using neural nets inthe classification stage, but the results are limited to a sin-gle GPR image with four hyperbolas. Trapezoidal cropping ofthe image region before neural net classification is performedin [20], and hyperbolic regions can be detected. However, nocurve fitting is provided and the hyperbola apex is coarselylocalized by pixel evaluation in the fixed trapezoidal region.Another approach in automated rebar classification uses sup-port vector machines (SVM) [22], [23]. Prior work in SVM
KAUR et al.: AUTOMATED GPR REBAR ANALYSIS FOR ROBOTIC BRIDGE DECK EVALUATION 2267
Fig. 4. Template matching with normalized cross-correlation results in manymissing and false detections.
rebar detection [24] shows good results albeit with syntheticdata. Unfortunately, a thresholding step is used to binarize theimage, creating a fragile image representation that dependsstrongly on parameter selection. While our method alsouses SVM, we do not require a thresholding step and thereforeavoid the manually defined threshold parameter.
Curve fitting is an important component in identifying truehyperbolic signatures and locating them precisely. This local-ization is important so that the amplitude data at the true peakcan be recorded and compared over time to detect deterio-ration. Examples of prior work that include hyperbolic curvefitting include [12], [17], [25]; however, edge detection is usedas a preprocessing step in [12] and results for only one hyper-bolic signature is given in [25]. Template matching is thepreprocessing step in [17]. Furthermore, no region of inter-est detection is included and no outliers are handled in thecurve fitting algorithm.
In much of the prior literature, results are shown on eitherfew examples, synthetic data, or simulated real data. Forexample, the approach in [14] successfully detects rebars byfinding overlapping sections of hyperbolic edges on GPR scansobtained from an emulsion analogue tank simulating concreteproperties. The concrete specimens have small physical dimen-sions (300 × 1200 mm with 16 mm diameter rebar) and do notexhibit the same appearance variability as real-bridge rebars.In general, the problems of edge detection, thresholding andtemplate matching become evident when the data moves tolarge sets and real data. Since no prior work shows the com-piled results on thousands of hyperbola signatures, our testingframework is the most extensive to date.
Machine learning methods that require training should bearranged with training data and test data from different geo-graphic locations. With this approach, the system can betrained once and used subsequently at other locations with-out training or parameter tuning. This concept of mutuallyexclusive bridge decks is essential for assuring that the classi-fication algorithm generalizes, but is not generally addressedin the prior work. Our methods represent a new paradigm inon-site data analytics using robotic data collection followedby automated rebar detection, localization, and evaluation.
In literature, the use of GPR scans for assessing rebarintegrity has been validated by extracting rebar samples (cores)from the concrete bridge decks [26]. The cores are extractedfrom representative deteriorated and nondeteriorated loca-tions based on the deterioration map obtained from analyzingGPR scans. The deterioration levels of the cores extracted
from these locations are in agreement with those indicatedby the deterioration maps. This establishes that the analy-sis of hyperbolic signatures in the GPR scans reveals areaswith corrosion-induced rebar deterioration. Apart with thecorrosion, variation in the depth of the rebars in a bridgedeck also decreases the signal strength (amplitude). So, itis important to apply a procedure depth-correction to mini-mize the effect of rebar depth such that the overall amplitudevariation in the entire bridge deck is only indicative of corro-sion. For the validation of rebar analysis using the proposedmethods, we compare the deterioration maps obtained usingour automated algorithm and Geophysical Survey SystemsInc. (GSSI) RADAN software [27], which involves manualinteraction for localizing hyperbolic signatures. Traditionally,depth-correction is applied manually on the maps obtained bythe RADAN software.
Our rebar analysis algorithm as depicted in Fig. 8, is nota trivial combination of existing parts, but rather each com-ponent has been carefully designed and tested for robustperformance on rebars that vary in appearance due to differ-ences in their structural properties. In order to evaluate variousalgorithm possibilities, the classification component has beenevaluated with a suite of possible pattern matching methodsincluding edges, intensity histograms, template matching, andthe histogram of oriented gradients (HOG). A comparison ofthese methodologies for rebar detection as shown in Table Vhas not been addressed in prior work.
In summary, we present the first algorithm for GPR rebardetection that advances the state-of-the art with the followingkey contributions: 1) machine learning classification to firstdetect rebar regions requiring no thresholding or edge detec-tion; 2) robust curve fitting that can handle outliers and localizerebars within the region; and 3) a demonstration of results on alarge set of real-bridge deck data (mutually exclusive from thetraining set) collected with a robotic bridge inspection system.
II. IMAGE FORMATION WITH GROUND
PENETRATING RADAR
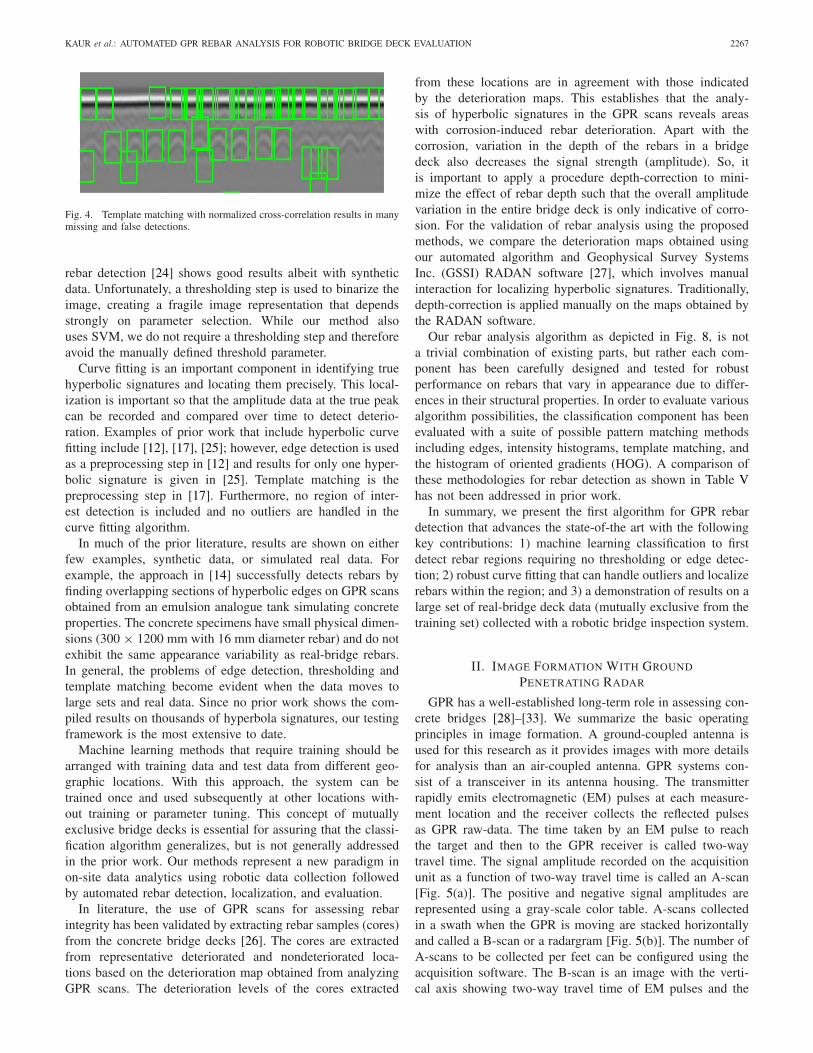
GPR has a well-established long-term role in assessing con-crete bridges [28]–[33]. We summarize the basic operatingprinciples in image formation. A ground-coupled antenna isused for this research as it provides images with more detailsfor analysis than an air-coupled antenna. GPR systems con-sist of a transceiver in its antenna housing. The transmitterrapidly emits electromagnetic (EM) pulses at each measure-ment location and the receiver collects the reflected pulsesas GPR raw-data. The time taken by an EM pulse to reachthe target and then to the GPR receiver is called two-waytravel time. The signal amplitude recorded on the acquisitionunit as a function of two-way travel time is called an A-scan[Fig. 5(a)]. The positive and negative signal amplitudes arerepresented using a gray-scale color table. A-scans collectedin a swath when the GPR is moving are stacked horizontallyand called a B-scan or a radargram [Fig. 5(b)]. The number ofA-scans to be collected per feet can be configured using theacquisition software. The B-scan is an image with the verti-cal axis showing two-way travel time of EM pulses and the
2268 IEEE TRANSACTIONS ON CYBERNETICS, VOL. 46, NO. 10, OCTOBER 2016
Fig. 5. (a) A-scan recorded by acquisition software at each measurementlocation. (b) A-scans collected in a swath when the GPR is moving are stackedhorizontally and called a B-scan or a radargram.
horizontal axis representing the scan count or distance. Fig. 6illustrates the data collection on a bridge and correspondingB-scans for each swath.
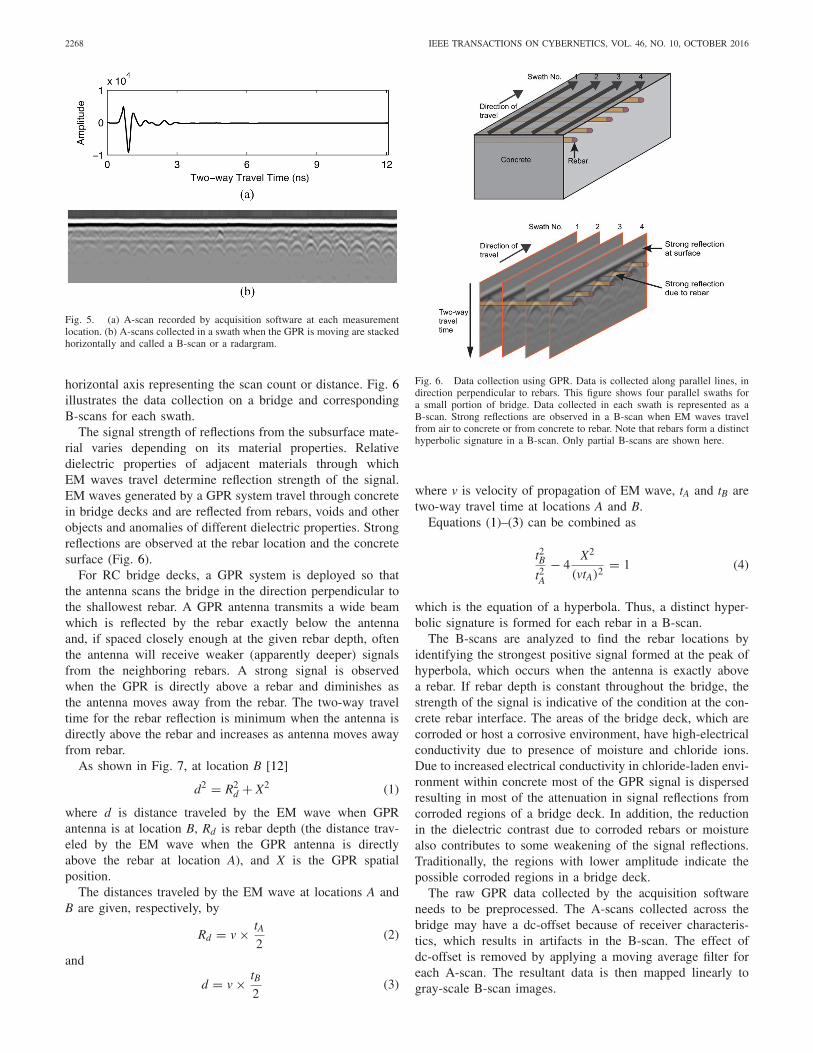
The signal strength of reflections from the subsurface mate-rial varies depending on its material properties. Relativedielectric properties of adjacent materials through whichEM waves travel determine reflection strength of the signal.EM waves generated by a GPR system travel through concretein bridge decks and are reflected from rebars, voids and otherobjects and anomalies of different dielectric properties. Strongreflections are observed at the rebar location and the concretesurface (Fig. 6).
For RC bridge decks, a GPR system is deployed so thatthe antenna scans the bridge in the direction perpendicular tothe shallowest rebar. A GPR antenna transmits a wide beamwhich is reflected by the rebar exactly below the antennaand, if spaced closely enough at the given rebar depth, oftenthe antenna will receive weaker (apparently deeper) signalsfrom the neighboring rebars. A strong signal is observedwhen the GPR is directly above a rebar and diminishes asthe antenna moves away from the rebar. The two-way traveltime for the rebar reflection is minimum when the antenna isdirectly above the rebar and increases as antenna moves awayfrom rebar.
As shown in Fig. 7, at location B [12]
d2 = R2d + X2 (1)
where d is distance traveled by the EM wave when GPRantenna is at location B, Rd is rebar depth (the distance trav-eled by the EM wave when the GPR antenna is directlyabove the rebar at location A), and X is the GPR spatialposition.
The distances traveled by the EM wave at locations A andB are given, respectively, by
Rd = v × tA2
(2)
and
d = v × tB2
(3)
Fig. 6. Data collection using GPR. Data is collected along parallel lines, indirection perpendicular to rebars. This figure shows four parallel swaths fora small portion of bridge. Data collected in each swath is represented as aB-scan. Strong reflections are observed in a B-scan when EM waves travelfrom air to concrete or from concrete to rebar. Note that rebars form a distincthyperbolic signature in a B-scan. Only partial B-scans are shown here.
where v is velocity of propagation of EM wave, tA and tB aretwo-way travel time at locations A and B.
Equations (1)–(3) can be combined as
t2Bt2A
− 4X2
(vtA)2= 1 (4)
which is the equation of a hyperbola. Thus, a distinct hyper-bolic signature is formed for each rebar in a B-scan.
The B-scans are analyzed to find the rebar locations byidentifying the strongest positive signal formed at the peak ofhyperbola, which occurs when the antenna is exactly abovea rebar. If rebar depth is constant throughout the bridge, thestrength of the signal is indicative of the condition at the con-crete rebar interface. The areas of the bridge deck, which arecorroded or host a corrosive environment, have high-electricalconductivity due to presence of moisture and chloride ions.Due to increased electrical conductivity in chloride-laden envi-ronment within concrete most of the GPR signal is dispersedresulting in most of the attenuation in signal reflections fromcorroded regions of a bridge deck. In addition, the reductionin the dielectric contrast due to corroded rebars or moisturealso contributes to some weakening of the signal reflections.Traditionally, the regions with lower amplitude indicate thepossible corroded regions in a bridge deck.
The raw GPR data collected by the acquisition softwareneeds to be preprocessed. The A-scans collected across thebridge may have a dc-offset because of receiver characteris-tics, which results in artifacts in the B-scan. The effect ofdc-offset is removed by applying a moving average filter foreach A-scan. The resultant data is then mapped linearly togray-scale B-scan images.
KAUR et al.: AUTOMATED GPR REBAR ANALYSIS FOR ROBOTIC BRIDGE DECK EVALUATION 2269
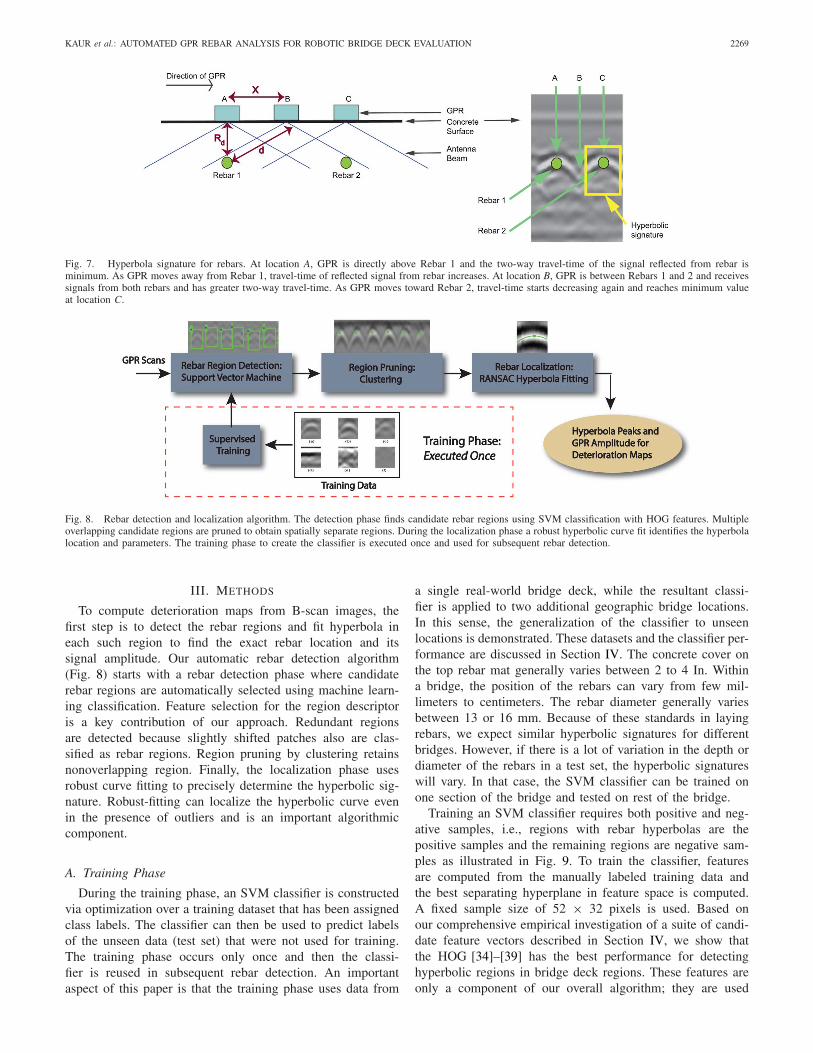
Fig. 7. Hyperbola signature for rebars. At location A, GPR is directly above Rebar 1 and the two-way travel-time of the signal reflected from rebar isminimum. As GPR moves away from Rebar 1, travel-time of reflected signal from rebar increases. At location B, GPR is between Rebars 1 and 2 and receivessignals from both rebars and has greater two-way travel-time. As GPR moves toward Rebar 2, travel-time starts decreasing again and reaches minimum valueat location C.
Fig. 8. Rebar detection and localization algorithm. The detection phase finds candidate rebar regions using SVM classification with HOG features. Multipleoverlapping candidate regions are pruned to obtain spatially separate regions. During the localization phase a robust hyperbolic curve fit identifies the hyperbolalocation and parameters. The training phase to create the classifier is executed once and used for subsequent rebar detection.
III. METHODS
To compute deterioration maps from B-scan images, thefirst step is to detect the rebar regions and fit hyperbola ineach such region to find the exact rebar location and itssignal amplitude. Our automatic rebar detection algorithm(Fig. 8) starts with a rebar detection phase where candidaterebar regions are automatically selected using machine learn-ing classification. Feature selection for the region descriptoris a key contribution of our approach. Redundant regionsare detected because slightly shifted patches also are clas-sified as rebar regions. Region pruning by clustering retainsnonoverlapping region. Finally, the localization phase usesrobust curve fitting to precisely determine the hyperbolic sig-nature. Robust-fitting can localize the hyperbolic curve evenin the presence of outliers and is an important algorithmiccomponent.
A. Training Phase
During the training phase, an SVM classifier is constructedvia optimization over a training dataset that has been assignedclass labels. The classifier can then be used to predict labelsof the unseen data (test set) that were not used for training.The training phase occurs only once and then the classi-fier is reused in subsequent rebar detection. An importantaspect of this paper is that the training phase uses data from
a single real-world bridge deck, while the resultant classi-fier is applied to two additional geographic bridge locations.In this sense, the generalization of the classifier to unseenlocations is demonstrated. These datasets and the classifier per-formance are discussed in Section IV. The concrete cover onthe top rebar mat generally varies between 2 to 4 In. Withina bridge, the position of the rebars can vary from few mil-limeters to centimeters. The rebar diameter generally variesbetween 13 or 16 mm. Because of these standards in layingrebars, we expect similar hyperbolic signatures for differentbridges. However, if there is a lot of variation in the depth ordiameter of the rebars in a test set, the hyperbolic signatureswill vary. In that case, the SVM classifier can be trained onone section of the bridge and tested on rest of the bridge.
Training an SVM classifier requires both positive and neg-ative samples, i.e., regions with rebar hyperbolas are thepositive samples and the remaining regions are negative sam-ples as illustrated in Fig. 9. To train the classifier, featuresare computed from the manually labeled training data andthe best separating hyperplane in feature space is computed.A fixed sample size of 52 × 32 pixels is used. Based onour comprehensive empirical investigation of a suite of candi-date feature vectors described in Section IV, we show thatthe HOG [34]–[39] has the best performance for detectinghyperbolic regions in bridge deck regions. These features areonly a component of our overall algorithm; they are used
2270 IEEE TRANSACTIONS ON CYBERNETICS, VOL. 46, NO. 10, OCTOBER 2016
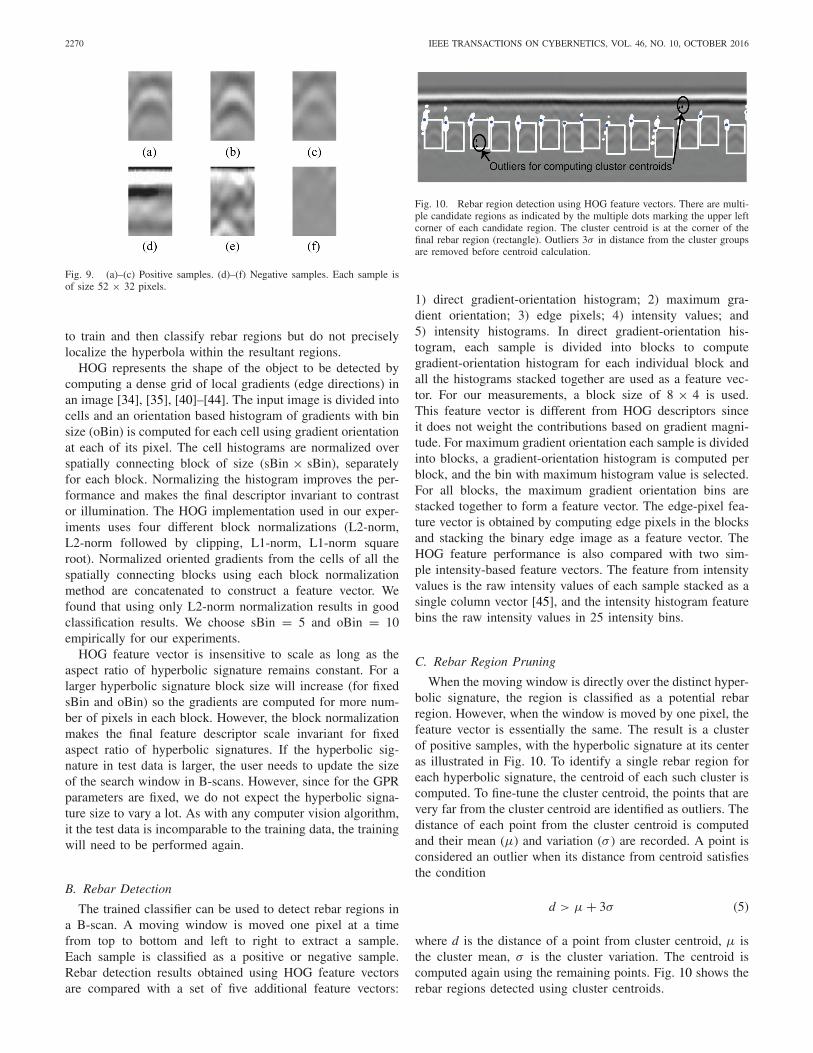
Fig. 9. (a)–(c) Positive samples. (d)–(f) Negative samples. Each sample isof size 52 × 32 pixels.
to train and then classify rebar regions but do not preciselylocalize the hyperbola within the resultant regions.
HOG represents the shape of the object to be detected bycomputing a dense grid of local gradients (edge directions) inan image [34], [35], [40]–[44]. The input image is divided intocells and an orientation based histogram of gradients with binsize (oBin) is computed for each cell using gradient orientationat each of its pixel. The cell histograms are normalized overspatially connecting block of size (sBin × sBin), separatelyfor each block. Normalizing the histogram improves the per-formance and makes the final descriptor invariant to contrastor illumination. The HOG implementation used in our exper-iments uses four different block normalizations (L2-norm,L2-norm followed by clipping, L1-norm, L1-norm squareroot). Normalized oriented gradients from the cells of all thespatially connecting blocks using each block normalizationmethod are concatenated to construct a feature vector. Wefound that using only L2-norm normalization results in goodclassification results. We choose sBin = 5 and oBin = 10empirically for our experiments.
HOG feature vector is insensitive to scale as long as theaspect ratio of hyperbolic signature remains constant. For alarger hyperbolic signature block size will increase (for fixedsBin and oBin) so the gradients are computed for more num-ber of pixels in each block. However, the block normalizationmakes the final feature descriptor scale invariant for fixedaspect ratio of hyperbolic signatures. If the hyperbolic sig-nature in test data is larger, the user needs to update the sizeof the search window in B-scans. However, since for the GPRparameters are fixed, we do not expect the hyperbolic signa-ture size to vary a lot. As with any computer vision algorithm,it the test data is incomparable to the training data, the trainingwill need to be performed again.
B. Rebar Detection
The trained classifier can be used to detect rebar regions ina B-scan. A moving window is moved one pixel at a timefrom top to bottom and left to right to extract a sample.Each sample is classified as a positive or negative sample.Rebar detection results obtained using HOG feature vectorsare compared with a set of five additional feature vectors:
Fig. 10. Rebar region detection using HOG feature vectors. There are multi-ple candidate regions as indicated by the multiple dots marking the upper leftcorner of each candidate region. The cluster centroid is at the corner of thefinal rebar region (rectangle). Outliers 3σ in distance from the cluster groupsare removed before centroid calculation.
1) direct gradient-orientation histogram; 2) maximum gra-dient orientation; 3) edge pixels; 4) intensity values; and5) intensity histograms. In direct gradient-orientation his-togram, each sample is divided into blocks to computegradient-orientation histogram for each individual block andall the histograms stacked together are used as a feature vec-tor. For our measurements, a block size of 8 × 4 is used.This feature vector is different from HOG descriptors sinceit does not weight the contributions based on gradient magni-tude. For maximum gradient orientation each sample is dividedinto blocks, a gradient-orientation histogram is computed perblock, and the bin with maximum histogram value is selected.For all blocks, the maximum gradient orientation bins arestacked together to form a feature vector. The edge-pixel fea-ture vector is obtained by computing edge pixels in the blocksand stacking the binary edge image as a feature vector. TheHOG feature performance is also compared with two sim-ple intensity-based feature vectors. The feature from intensityvalues is the raw intensity values of each sample stacked as asingle column vector [45], and the intensity histogram featurebins the raw intensity values in 25 intensity bins.
C. Rebar Region Pruning
When the moving window is directly over the distinct hyper-bolic signature, the region is classified as a potential rebarregion. However, when the window is moved by one pixel, thefeature vector is essentially the same. The result is a clusterof positive samples, with the hyperbolic signature at its centeras illustrated in Fig. 10. To identify a single rebar region foreach hyperbolic signature, the centroid of each such cluster iscomputed. To fine-tune the cluster centroid, the points that arevery far from the cluster centroid are identified as outliers. Thedistance of each point from the cluster centroid is computedand their mean (μ) and variation (σ ) are recorded. A point isconsidered an outlier when its distance from centroid satisfiesthe condition
d > μ + 3σ (5)
where d is the distance of a point from cluster centroid, μ isthe cluster mean, σ is the cluster variation. The centroid iscomputed again using the remaining points. Fig. 10 shows therebar regions detected using cluster centroids.
KAUR et al.: AUTOMATED GPR REBAR ANALYSIS FOR ROBOTIC BRIDGE DECK EVALUATION 2271
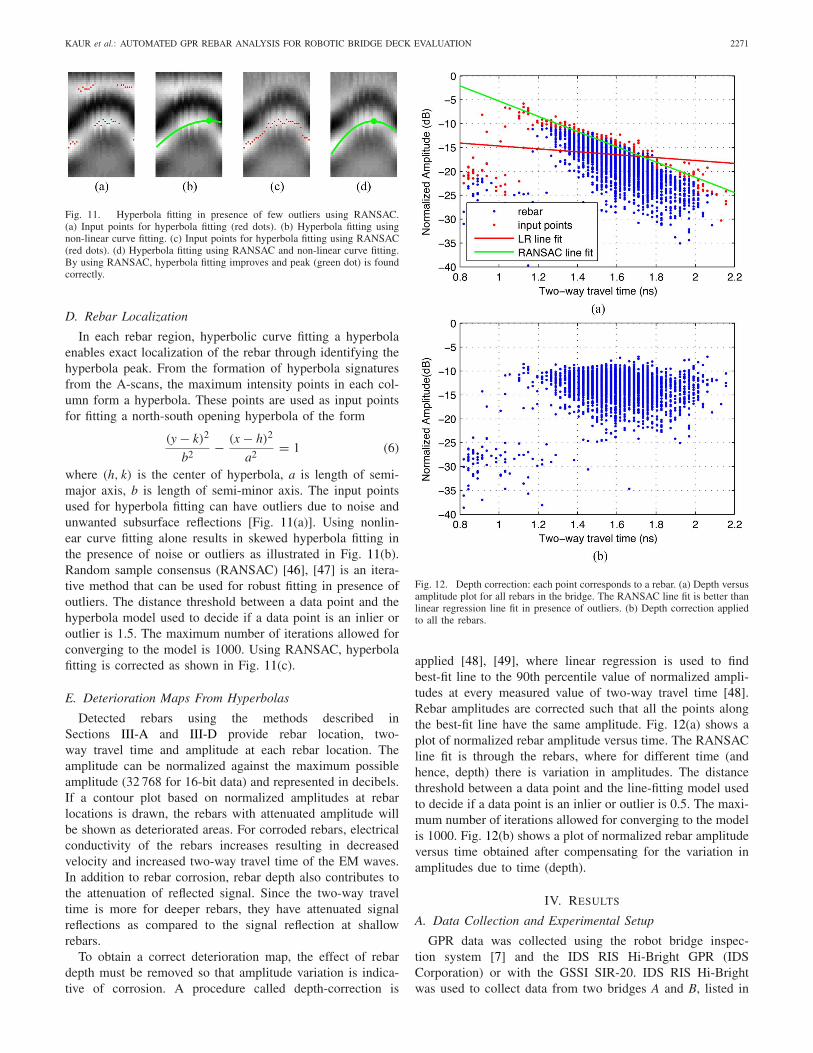
Fig. 11. Hyperbola fitting in presence of few outliers using RANSAC.(a) Input points for hyperbola fitting (red dots). (b) Hyperbola fitting usingnon-linear curve fitting. (c) Input points for hyperbola fitting using RANSAC(red dots). (d) Hyperbola fitting using RANSAC and non-linear curve fitting.By using RANSAC, hyperbola fitting improves and peak (green dot) is foundcorrectly.
D. Rebar Localization
In each rebar region, hyperbolic curve fitting a hyperbolaenables exact localization of the rebar through identifying thehyperbola peak. From the formation of hyperbola signaturesfrom the A-scans, the maximum intensity points in each col-umn form a hyperbola. These points are used as input pointsfor fitting a north-south opening hyperbola of the form
(y − k)2
b2− (x − h)2
a2= 1 (6)
where (h, k) is the center of hyperbola, a is length of semi-major axis, b is length of semi-minor axis. The input pointsused for hyperbola fitting can have outliers due to noise andunwanted subsurface reflections [Fig. 11(a)]. Using nonlin-ear curve fitting alone results in skewed hyperbola fitting inthe presence of noise or outliers as illustrated in Fig. 11(b).Random sample consensus (RANSAC) [46], [47] is an itera-tive method that can be used for robust fitting in presence ofoutliers. The distance threshold between a data point and thehyperbola model used to decide if a data point is an inlier oroutlier is 1.5. The maximum number of iterations allowed forconverging to the model is 1000. Using RANSAC, hyperbolafitting is corrected as shown in Fig. 11(c).
E. Deterioration Maps From Hyperbolas
Detected rebars using the methods described inSections III-A and III-D provide rebar location, two-way travel time and amplitude at each rebar location. Theamplitude can be normalized against the maximum possibleamplitude (32 768 for 16-bit data) and represented in decibels.If a contour plot based on normalized amplitudes at rebarlocations is drawn, the rebars with attenuated amplitude willbe shown as deteriorated areas. For corroded rebars, electricalconductivity of the rebars increases resulting in decreasedvelocity and increased two-way travel time of the EM waves.In addition to rebar corrosion, rebar depth also contributes tothe attenuation of reflected signal. Since the two-way traveltime is more for deeper rebars, they have attenuated signalreflections as compared to the signal reflection at shallowrebars.
To obtain a correct deterioration map, the effect of rebardepth must be removed so that amplitude variation is indica-tive of corrosion. A procedure called depth-correction is
Fig. 12. Depth correction: each point corresponds to a rebar. (a) Depth versusamplitude plot for all rebars in the bridge. The RANSAC line fit is better thanlinear regression line fit in presence of outliers. (b) Depth correction appliedto all the rebars.
applied [48], [49], where linear regression is used to findbest-fit line to the 90th percentile value of normalized ampli-tudes at every measured value of two-way travel time [48].Rebar amplitudes are corrected such that all the points alongthe best-fit line have the same amplitude. Fig. 12(a) shows aplot of normalized rebar amplitude versus time. The RANSACline fit is through the rebars, where for different time (andhence, depth) there is variation in amplitudes. The distancethreshold between a data point and the line-fitting model usedto decide if a data point is an inlier or outlier is 0.5. The maxi-mum number of iterations allowed for converging to the modelis 1000. Fig. 12(b) shows a plot of normalized rebar amplitudeversus time obtained after compensating for the variation inamplitudes due to time (depth).
IV. RESULTS
A. Data Collection and Experimental Setup
GPR data was collected using the robot bridge inspec-tion system [7] and the IDS RIS Hi-Bright GPR (IDSCorporation) or with the GSSI SIR-20. IDS RIS Hi-Brightwas used to collect data from two bridges A and B, listed in

2272 IEEE TRANSACTIONS ON CYBERNETICS, VOL. 46, NO. 10, OCTOBER 2016
TABLE IDATA COLLECTION
TABLE IIDATASETS FOR TRAINING, CROSS-VALIDATION, AND TESTING
Table I. In addition, it was also used to collect data from aconcrete slab, which is referred to as bridge C. This slab wasdesigned for automated nondestructive evaluation and rehabil-itation system project at Rutgers University and has artificialdelamination. GSSI SIR-20 was used to collect data fromBridges B and C. For both the acquisition units, 60 scansper foot are collected and each scan has 512 measurementsspanning a time range of 12 ns.
To train and test the SVM classifier, datasets are constructedby extracting samples of size 52 × 32 pixels from the B-scanscollected. Each sample is manually labeled as a positive ornegative sample. Datasets are listed in Table II. The train-ing set (2400 samples) and cross-validation set (600 samples)are constructed from bridge A. Once an SVM classifier istrained using the training data, it can be used to test datafrom any bridge. To test the trained classifier, two test setsare constructed from Bridges B and C with 2000 sampleseach. All sets have equal number of positive and negativesamples. The hyperbolic signatures used for training andtesting the SVM classifier are extracted from B-scans in asemi-automated way. First, we use template matching to detectand save the hyperbolic regions (52 × 32 pixels). The tem-plate is selected manually from one of the B-scans of thebridge. As shown in Fig. 4, template matching results inmany positive and false-positive (FP) samples. These hyper-bolic signatures are assigned one of the class labels: 1) positive(hyperbolic) samples or 2) negative (not hyperbolic) samples.Additionally, the hyperbolic regions which are not detected[false-negatives (FN)] by the template matching algorithm areextracted manually by cropping the image and labeled asthe positive samples. Random samples from B-scans are alsoextracted and assigned one of the class labels.
B. Classifier Feature Selection
The SVM classifier trained using HOG feature vectors fromtraining samples is used to classify cross-validation and testsets samples. In the training set and cross-validation set, allthe samples are classified correctly and the accuracy is foundto be 100%. For test sets B and C, confusion matrices are listedin Table III. The classifier accuracy was found to be 94.10%and 98.05%, respectively. The confusion matrices provide theevaluation data: true-positives (TP), true-negatives (TN),
TABLE IIICONFUSION MATRICES USING HOG FEATURE
VECTORS AND SVM CLASSIFIER.(a) TEST SET B. (b) TEST SET C
(a)
(b)
TABLE IVCONFUSION MATRICES USING HOG FEATURE
VECTORS AND NNET CLASSIFIER.(a) TEST SET B. (b) TEST SET C
(a)
(b)
FP, and FN. The matrix indicates low numberof both FP and FN. From the confusion matrix, thefollowing performance metrics are computed: accuracy,precision, sensitivity, and specificity [50].
Table V shows the comparison of performance of HOG,gradient-orientation histogram, maximum gradient orientation,and edge pixels. In addition, the intensities of each sample andintensity histogram, which are simple intuitive feature vectorsare also used for comparison. The poor performance of sim-ple intuitive feature vectors is well documented in computervision and it is observed that intensity values as a feature vec-tor result in least accuracy and precision. We also use templatematching for comparison with two matching criterion: 1) nor-malized sum of squared differences (NSSD) and 2) normalizedcross-correlation coefficient (NCORR). The template match-ing result for each sample lies between 0 and 1. For NSSD,lower values (close to 0) indicate a strong match. For NCORR,higher values (close to 1) indicate a strong match. It isobserved that for NSSD, when the threshold is increased from0.09 to 0.10, the precision and specificity decreases while thesensitivity increases. Similarly, for NCORR, as the thresholdis decreased from 0.96 to 0.95, the precision and specificitydecreases while the sensitivity increases. HOG and gradientorientation histogram features outperform the other featurevectors. HOG features have highest sensitivity (97.3% and99.3% for test sets B and C, respectively), which indicatingleast missing detections of hyperbolic signatures and maxi-mum detection rate. HOG features also result in high accuracy(94.10% and 98.05% for test sets B and C, respectively).

KAUR et al.: AUTOMATED GPR REBAR ANALYSIS FOR ROBOTIC BRIDGE DECK EVALUATION 2273
Fig. 13. Deterioration maps obtained using automated algorithm obtained from data collected using GPR system (a) GSSI SIR-20, (b) IDS Hi-Bright, and(c) using GSSI RADAN software obtained from data collected using GSSI SIR-20 GPR system. The deterioration map for the automated analysis (a) and (b)are comparable to the deterioration map using the RADAN software which uses human input and multiple stages of software analysis.
Neural networks (NNET) classifier can also be used to clas-sify the hyperbolic signatures. Table IV lists the confusionmatrices for test sets B and C obtained using HOG feature vec-tors and NNET classifier. The classifier accuracy was foundto be 87.8% and 94.3%, respectively. Thus, SVM classifieroutperforms the accuracy of NNET classifier. Moreover, theaverage time taken by the NNET classifier to classify hyper-bolic signatures in both test sets is 24.9 ms whereas the SVMclassifier takes 6.7 ms. Based on this quantitative analysis, we
use the SVM classifier using HOG feature vectors for the finaldetection algorithm. We use the MATLAB implementation ofthe SVM and NNET classifiers [51].
C. Rebar Detection and Localization
The trained SVM classifier is used to detect a rebar regionand fit a hyperbola in each rebar region to find exact rebarlocation as described in Section III. The rebar detection rate

2274 IEEE TRANSACTIONS ON CYBERNETICS, VOL. 46, NO. 10, OCTOBER 2016
TABLE VPERFORMANCE METRICS FOR SVM CLASSIFIER USING VARIOUS FEATURE VECTORS AND TEMPLATE MATCHING.
TEST SETS WERE CONSTRUCTED FROM TWO DIFFERENT BRIDGES
TABLE VIAVERAGE DETECTION RATE PER B-SCAN. THE DETECTION RATE
INCLUDES THE SUCCESS OF BOTH REBAR REGION
DETECTION AND HYPERBOLA FITTING
includes both rebar region detection and hyperbola fitting.The rebar detection rate for Bridges B and C is 92.45% and91.5%, respectively (Table VI). Ground truth for the rebardetection result is obtained using GSSI RADAN software withhuman interaction. For the ground truth data, false detectionswere removed and missing rebar detections were manuallyadded in order to have a benchmark set.
D. Deterioration Maps
After analyzing all the B-scans in a bridge for rebars,the amplitude value at each rebar location is normalized anddepth-corrected as described in Section III-E. The rebar loca-tions and depth-corrected amplitudes are then used to obtaina deterioration map of the bridge deck. The regions are iden-tified as serious, poor, fair, and good regions based on thesignal amplitude (indicated by different colors). The lowersignal amplitude indicates the deteriorated region, which ismarked as serious or poor. Fig. 13(b) and (c) shows the mapsobtained using automated algorithms for bridge B using datacollected using GSSI SIR-20 and IDS Hi-Bright GPR, respec-tively. These deterioration maps are compared with the mapobtained using rebar detection results from GSSI RADANsoftware, involving manual interaction [Fig. 13(a)]. From thedeterioration maps obtained for Bridge B shown in Fig. 13,it is evident that the regions of deterioration identified byautomated algorithms are comparable to those obtained bysemi-automated methods requiring human interaction.
V. CONCLUSION
Automating the bridge deck inspection and evaluationprocess can save manpower and time, and also improve
repeatability of the results. In this paper, we have shown anautomated rebar detection and localization algorithm to pro-cess large datasets and obtain deterioration maps with highaccuracy. Rebar classification tests show the superiority ofHOG features compared to other gradient and intensity-basedfeature vectors. The advantage of a machine learning approachis demonstrated where training from one bridge is used fornot only for that bridge but also for two additional bridges.In this manner, the use of machine learning replaces tediousparameter tweaking and manual interaction with analysis soft-ware. The use of robotic measurements and automated analysisrepresents an exciting new approach that can enable in-fieldevaluation of bridge decks in a cost-effective manner.
ACKNOWLEDGMENT
The authors would like to thank researchers Dr. B. B. Basily,Dr. H. La, R. Lim, Dr. A. Maher, H. Parvardeh, P. Prassana,and Dr. J. Yi for their contributions in the robot planning,development, and data collection and would also like to thankWarren County Municipal Engineer J. Tate for support andaccess to a local bridge for repeated testing of the prototyperobot.
REFERENCES
[1] Y. P. Virmani and G. G. Clemena, “Corrosion protection-concretebridges,” U.S. Dept. Transp., Fed. Highw. Admin., McLean, VA, USA,Tech. Rep. FHWA-RD-98-088, Sep. 1998.
[2] M. E. Henderson, G. N. Dion, and R. D. Costley, “Acoustic inspec-tion of concrete bridge decks,” Proc. SPIE Nondestruct. Eval. BridgesHighw. III, vol. 3587, pp. 219–227, Feb. 1999.
[3] W. T. Scannell, A. A. Sohanghpurwala, and M. Islam, Assessment ofPhysical Condition of Concrete Bridge Components, Concoor, Inc.,Ashburn, VA, USA, 1996.
[4] F. Romero, G. Roberts, and R. Roberts, “Evaluation of GPR bridgedeck survey results used for delineation of removal/maintenance quantityboundaries on asphalt-overlaid, reinforced concrete deck,” in Proc. NDTConf. Struct. Mater. Technol., Atlantic City, NJ, USA, pp. 23–30, 2000.
[5] G. Roberts, R. Roberts, and A. Tarussov, “Identifying concrete deterio-ration using ground penetrating radar technology,” in Proc. Amer. Soc.Nondestruct. Test. Conf. (ASNT), Oct. 2001.
KAUR et al.: AUTOMATED GPR REBAR ANALYSIS FOR ROBOTIC BRIDGE DECK EVALUATION 2275
[6] R. Parrillo, R. Roberts, and A. Haggan, “Bridge deck condition assess-ment using ground penetrating radar,” in Proc. 9th Eur. Conf. NDT,Berlin, Germany, Sep. 2006, pp. 1–12.
[7] H. M. La et al., “Mechatronic systems design for an autonomousrobotic system for high-efficiency bridge deck inspection and evalua-tion,” IEEE/ASME Trans. Mechatronics, vol. 18, no. 6, pp. 1655–1664,Dec. 2013.
[8] J. Hugenschmidt and P. Furholz, “ATRAS—An automated GPR systemfor data acquisition and storage for roads and bridges,” in Proc. 14thInt. Conf. Ground Penetrat. Radar (GPR), Shanghai, China, Jun. 2012,pp. 448–453.
[9] A. Simi, G. Manacorda, and A. Benedetto, “Bridge deck sur-vey with high resolution ground penetrating radar,” in Proc. 14thInt. Conf. Ground Penetrat. Radar (GPR), Shanghai, China, 2012,pp. 489–495.
[10] X.-Q. He, Z.-Q. Zhu, Q.-Y. Liu, and G.-Y. Lu, “Review of GPRrebar detection,” in Proc. PIERS, Beijing, China, pp. 804–813,Mar. 2009.
[11] F. Soldovieri, R. Solimene, L. Lo Monte, M. Bavusi, and A. Loperte,“Sparse reconstruction from GPR data with applications to rebar detec-tion,” IEEE Trans. Instrum. Meas., vol. 60, no. 3, pp. 1070–1079,Mar. 2011.
[12] Y. Liu, M. Wang, and Q. Cai, “The target detection for GPRimages based on curve fitting,” in Proc. 3rd Int. Congr. Image SignalProcess. (CISP), vol. 6. Yantai, China, Oct. 2010, pp. 2876–2879.
[13] V. Krause, I. Abdel-Qader, O. Abudayyeh, and S. Yehia, “An imagesegmentation algorithm for the detection of rebar in bridge decks fromGPR scans,” in Proc. IEEE Int. Conf. Electro/Inf. Technol., Chicago, IL,USA, May 2007, pp. 114–119.
[14] M. R. Shaw, S. G. Millard, T. C. K. Molyneaux, M. J. Taylor, andJ. H. Bungey, “Location of steel reinforcement in concrete using groundpenetrating radar and neural networks,” NDT&E Int., vol. 38, no. 3,pp. 203–212, Apr. 2005.
[15] P. Gamba and S. Lossani, “Neural detection of pipe signatures in groundpenetrating radar images,” IEEE Trans. Geosci. Remote Sens., vol. 38,no. 2, pp. 790–797, Mar. 2000.
[16] W. Al-Nuaimy, Y. Huang, A. Eriksen, and V. T. Nguyen, “Automaticdetection of hyperbolic signatures in ground-penetrating radar data,”Proc. SPIE, vol. 4491, pp. 327–335, Nov. 2001. [Online]. Available:http://dx.doi.org/10.1117/12.450177
[17] Z. W. Wang, M. Zhou, G. G. Slabaugh, J. Zhai, and T. Fang, “Automaticdetection of bridge deck condition from ground penetrating radarimages,” IEEE Trans. Autom. Sci. Eng., vol. 8, no. 3, pp. 633–640,Jul. 2011.
[18] J. P. Lewis, “Fast normalized cross-correlation,” Vis. Interf., vol. 10,no. 1, pp. 120–123, 1995.
[19] W. Al-Nuaimy et al., “Automatic detection of buried utilities andsolid objects with GPR using neural networks and pattern recognition,”J. Appl. Geophys., vol. 43, nos. 2–4, pp. 157–165, Mar. 2000.
[20] S. Birkenfeld, “Automatic detection of reflexion hyperbolas in GPR datawith neural networks,” in Proc. World Autom. Congr. (WAC), Kobe,Japan, Sep. 2010, pp. 1–6.
[21] N. P. Singh and M. J. Nene, “Buried object detection and analysisof GPR images: Using neural network and curve fitting,” in Proc.Annu. Int. Conf. Emerg. Res. Areas Int. Conf. Microelectron. Commun.Renew. Energy (AICERA/ICMiCR), Kanjirappally, India, Jun. 2013,pp. 1–6.
[22] C. Cortes and V. Vapnik, “Support-vector networks,” Mach. Learn.,vol. 20, no. 3, pp. 273–297, Sep. 1995.
[23] B. Scholkopf and A. J. Smola, Learning With Kernels: Support VectorMachines, Regularization, Optimization, and Beyond. Cambridge, MA,USA: MIT Press, 2001.
[24] E. Pasolli, F. Melgani, and M. Donelli, “Automatic analysis of GPRimages: A pattern-recognition approach,” IEEE Trans. Geosci. RemoteSens., vol. 47, no. 7, pp. 2206–2217, Jul. 2009.
[25] S. Shihab, W. Al-Nuaimy, and A. Eriksen, “Radius estimation for sub-surface cylindrical objects detected by ground penetrating radar,” inProc. 10th Int. Conf. Ground Penetrat. Radar (GPR), vol. 1. Delft, TheNetherlands, Jun. 2004, pp. 319–322.
[26] N. Gucunski, F. Romero, S. Kruschwitz, R. Feldmann, and H. Parvardeh,“Comprehensive bridge deck deterioration mapping of nine bridgesby nondestructive evaluation technologies,” Iowa Dept. Transp., Fed.Highw. Admin., Ames, IA, USA, Tech. Rep. SPR-NDEB(90)–8H-00,2011.
[27] RADAN, Version 7, Geophys. Survey Syst., Inc., Salem, NH, USA, 2013.[Online]. Available: http://www.geophysical.com/software.htm
[28] K. Maser, “Automated interpretation for sensing in situ conditions,”J. Comput. Civ. Eng., vol. 2, no. 3, pp. 215–238, Jul. 1988.
[29] C. R. Carter, T. Chung, F. B. Holt, and D. G. Manning, “An automatedsignal processing system for the signature analysis of radar waveformsfrom bridge decks,” Can. Electr. Eng. J., vol. 11, no. 3, pp. 128–137,Jul. 1986.
[30] K. Maser, “Bridge deck condition surveys using radar: Case studiesof 28 New England decks,” Transp. Res. Board, Nat. Res. Council,Washington, DC, USA, Tech. Rep. 00620406, 1991.
[31] K. Maser and A. Rawson, “Network bridge deck surveys using highspeed radar: Case studies of 44 decks,” Transp. Res. Board, Washington,DC, USA, Tech. Rep. 00638500, 1993.
[32] G. Roberts, Bureau of Materials, and Research, Use of GroundPenetrating Radar to Delineate Bridge Deck Repair Areas, NewHampshire Dept. Transp., Keene, NH, USA, 2002. [Online]. Available:http://books.google.com/books?id=HgAYHAAACAAJ
[33] C. Barnes and J. Trottier, “Effectiveness of ground penetrating radar inpredicting deck repair quantities,” J. Infrastruct. Syst., vol. 10, no. 2,pp. 69–76, 2004.
[34] N. Dalal and B. Triggs, “Histograms of oriented gradients for humandetection,” in Proc. IEEE Comput. Soc. Conf. Comput. Vis. PatternRecognit., vol. 1. San Diego, CA, USA, Jun. 2005, pp. 886–893.
[35] P. Dollar, S. Belongie, and P. Perona, “The fastest pedestrian detec-tor in the west,” in Proc. Brit. Mach. Vis. Conf., London, U.K., 2010,pp. 68.1–68.11.
[36] Q. Zhu, M.-C. Yeh, K.-T. Cheng, and S. Avidan, “Fast human detec-tion using a cascade of histograms of oriented gradients,” in Proc. IEEEComput. Soc. Conf. Comput. Vis. Pattern Recognit., vol. 2. New York,NY, USA, 2006, pp. 1491–1498.
[37] W. Zhang, G. Zelinsky, and D. Samaras, “Real-time accurate objectdetection using multiple resolutions,” in Proc. IEEE 11th Int. Conf.Comput. Vis., Rio de Janeiro, Brazil, 2007, pp. 1–8.
[38] X. Wang, T. Han, and S. Yan, “An HOG-LBP human detector withpartial occlusion handling,” in Proc. IEEE 12th Int. Conf. Comput. Vis.,Kyoto, Japan, 2009, pp. 32–39.
[39] V. Ferrari, L. Fevrier, F. Jurie, and C. Schmid, “Groups of adjacentcontour segments for object detection,” IEEE Trans. Pattern Anal. Mach.Intell., vol. 30, no. 1, pp. 36–51, Jan. 2008.
[40] P. Dollár. (Mar. 2014). Piotr’s Computer VisionMATLAB Toolbox (PMT). [Online]. Available:http://vision.ucsd.edu/~pdollar/toolbox/doc/index.html
[41] Y. Pang, H. Yan, Y. Yuan, and K. Wang, “Robust CoHOG featureextraction in human-centered image/video management system,” IEEETrans. Syst., Man, Cybern. B, Cybern., vol. 42, no. 2, pp. 458–468,Apr. 2012.
[42] Y. Xu et al., “Detection of sudden pedestrian crossings for driving assis-tance systems,” IEEE Trans. Syst., Man, Cybern. B, Cybern., vol. 42,no. 3, pp. 729–739, Jun. 2012.
[43] Y. Pang, K. Zhang, Y. Yuan, and K. Wang, “Distributed objectdetection with linear SVMs,” IEEE Trans. Cybern., vol. 44, no. 11,pp. 2122–2133, Nov. 2014.
[44] M. A. Aziz, J. Niu, X. Zhao, and X. Li, “Efficient and robust learningfor sustainable and reacquisition-enabled hand tracking,” IEEE Trans.Cybern., DOI: 10.1109/TCYB.2015.2418275.
[45] S. Birkenfeld, “Automatic detection of reflexion hyperbolas in gprdata with neural networks,” in Proc. World Autom. Congr. (WAC),Kobe, Japan, 2010, pp. 1–6.
[46] M. A. Fischler and R. C. Bolles, “Random sample consensus:A paradigm for model fitting with applications to image analysis andautomated cartography,” Commun. ACM, vol. 24, no. 6, pp. 381–395,Jun. 1981.
[47] P. D. Kovesi. (Mar. 2014). MATLAB and Octave Functions for ComputerVision and Image Processing, Centre for Exploration Targeting, Schoolof Earth and Environment, University of Western Australia. [Online].Available: http://www.peterkovesi.com/matlabfns/, accessed Sep. 2015.
[48] C. L. Barnes, J.-F. Trottier, and D. Forgeron, “Improved concrete bridgedeck evaluation using GPR by accounting for signal depth-amplitudeeffects,” NDT&E Int., vol. 41, no. 6, pp. 427–433, 2008.
[49] F. Romero, M. Premo, D. Severns, and J. G. Diehl, “Interstate-80 corri-dor ground-penetrating radar bridge assessments: Deterioration mappingof asphalt-overlaid and polymer concrete-overlaid, reinforced concretedecks in Elko county, Nevada,” Transp. Res. Board, Washington, DC,USA, Tech. Rep. 01123120, 2009.
[50] T. Fawcett, “An introduction to ROC analysis,” Pattern Recognit. Lett.,vol. 27, no. 8, pp. 861–874, 2006.
[51] MATLAB Neural Network Toolbox, Version 8.1.0 (R2013a), MathWorksInc., Natick, MA, USA, 2013.
2276 IEEE TRANSACTIONS ON CYBERNETICS, VOL. 46, NO. 10, OCTOBER 2016
Parneet Kaur received the B.E. degree inelectronics and communication engineering fromthe Dayananda Sagar College of Engineering,Visvesvaraya Technological University, Belgaum,India, in 2007, and the M.S. degree in electricaland computer engineering from Rutgers University,Piscataway, NJ, USA, in 2013. She is currently pur-suing the Ph.D. degree in electrical and computerengineering with Rutgers University.
From 2007 to 2009, she was a Software Engineerwith Robert Bosch Engineering and Business
Solutions Ltd., Bangalore, India, where she developed software for real-timeembedded systems deployed in automobile platforms. From 2012 to 2013,she was a Graduate Research Assistant with the Department of Electricaland Computer Engineering, and the Center for Advanced Infrastructure andTransportation, Rutgers University. She was involved in the development ofthe Robotics Assisted Bridge Inspection Tool (RABIT) funded by the FederalHighway Administration. Her current research interests include computervision, machine learning, and pattern recognition.
Ms. Kaur was a Team Member Recipient of the 2014 American Society ofCivil Engineers (ASCE) Charles Pankow Award for Innovation for the RABITproject.
Kristin J. Dana received the B.S. degree in com-puter science and electrical engineering from CooperUnion, New York, NY, USA, in 1990, the M.S.degree in electrical engineering and computer sci-ence from the Massachusetts Institute of Technology,Cambridge, MA, USA, in 1992, and the Ph.D.degree in electrical engineering from ColumbiaUniversity, New York, in 1999.
She is an Associate Professor with the Departmentof Electrical and Computer Engineering, RutgersUniversity, Piscataway, NJ, USA. She is the Inventor
of the Texcam texture camera’ for convenient measurement of reflectanceand texture. She is also a member of the Rutgers Center for CognitiveScience and the Graduate Faculty of the Computer Science Department.From 1992 to 1995, she was a Research Staff with Sarnoff Corporation,Princeton, NJ, USA, developing real-time motion estimation algorithms forapplications in defense, biomedicine, and entertainment industries. Her currentresearch interests include computer vision, such as computational photog-raphy, machine learning, illumination modeling, texture and reflectance,bioimaging, motion estimation, optical devices, optimization in vision, andapplications of robotics.
Dr. Dana was a recipient of the National Science Foundation Career Awardfor a program investigating surface science for vision and graphics in 2001,and a Team Member Recipient of the Charles Pankow Innovation Award in2014 from the ASCE.
Francisco A. Romero received the B.S. degreein petroleum engineering from New Mexico Tech,Socorro, NM, USA, in 1984, and the M.S. degreein civil/structural engineering from the University ofKansas, Lawrence, KS, USA, in 1992.
He is the President and the Owner of Romeronondestructive test (NDT)&E, LLC, Glen Gardner,NJ, USA, providing professional ground penetrat-ing radar (GPR)/NDT&E services, such as conditionassessment, general near-surface geophysical appli-cations, high speed pavement condition assessment,
damage prevention, and structural evaluation. He also provides professionalGPR/non-destructive evaluation (NDE) consulting, training, and businessdevelopment services with expertise related to civil/infrastructure NDT appli-cations, and is active on the GPR TEAM Board of Directors. Since 1993,he has been continuously using GPR and other NDE methods for a varietyof commercial and public projects, applications, pilot studies and research;mostly in structural engineering and transportation infrastructure condi-tion assessment of buildings, bridges, highway pavements, tunnels, dams,buildings, and airport runways and tarmacs. His NDT/geophysics researchbegan as an oilfield acoustic and nuclear wireline logging engineer, andhis materials testing and research background includes the full comple-ment of field, laboratory and batch plant construction materials testing andinspection, such as concrete, soils/aggregates, asphalt, with some metals andgeophysics/geotechnical work.
Nenad Gucunski received the B.S.E. degree in civilengineering from the University of Zagreb, Croatia,in 1979, and the M.S. and Ph.D. degrees in civilengineering from the University of Michigan, AnnArbor, MI, USA, in 1983 and 1991, respectively.
He is a Professor and the Chairman of Civiland Environmental Engineering, Rutgers University,Piscataway, NJ, USA. He is the Director ofInfrastructure Condition Monitoring Program withRutgers’ Center for Advanced Infrastructure andTransportation. His expertise is in nondestructive
test (NDT)/NDE of transportation infrastructure and has published over 150publications on various aspects of the NDE/NDT technologies development,application, and automation. He is/was leading a number of important infras-tructure related research projects, including the National Institute of Standardsand Technology-Technology Innovation Program, Automated NondestructiveEvaluation and Rehabilitation System project on the development of a systemsof devices for local and global NDE assessment and rehabilitation of bridges,Strategic Highway Research Project 2 project on NDE for Bridge Decks,Federal Highway Administrations Long Term Bridge Performance Program,and several other projects for state and federal government and industry.
Dr. Gucunski was a recipient of the 2014 ASCE Charles Pankow Award forInnovation for the development of Robotics Assisted Bridge Inspection Toolfor bridge decks. He is an Active Member of a number of societies. He servesas the Chair of the ASCEs Geophysical Engineering Committee.