Embed Size (px)
Citation preview
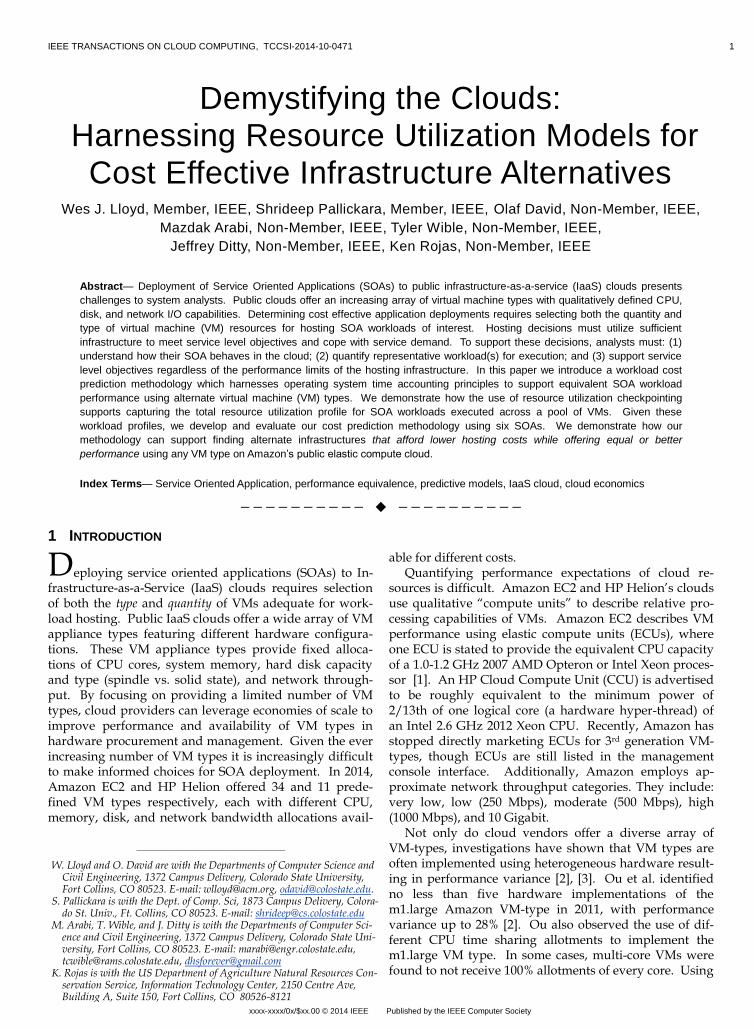
IEEE TRANSACTIONS ON CLOUD COMPUTING, TCCSI-2014-10-0471 1
Demystifying the Clouds: Harnessing Resource Utilization Models for
Cost Effective Infrastructure Alternatives Wes J. Lloyd, Member, IEEE, Shrideep Pallickara, Member, IEEE, Olaf David, Non-Member, IEEE,
Mazdak Arabi, Non-Member, IEEE, Tyler Wible, Non-Member, IEEE,
Jeffrey Ditty, Non-Member, IEEE, Ken Rojas, Non-Member, IEEE
Abstract— Deployment of Service Oriented Applications (SOAs) to public infrastructure-as-a-service (IaaS) clouds presents
challenges to system analysts. Public clouds offer an increasing array of virtual machine types with qualitatively defined CPU,
disk, and network I/O capabilities. Determining cost effective application deployments requires selecting both the quantity and
type of virtual machine (VM) resources for hosting SOA workloads of interest. Hosting decisions must utilize sufficient
infrastructure to meet service level objectives and cope with service demand. To support these decisions, analysts must: (1)
understand how their SOA behaves in the cloud; (2) quantify representative workload(s) for execution; and (3) support service
level objectives regardless of the performance limits of the hosting infrastructure. In this paper we introduce a workload cost
prediction methodology which harnesses operating system time accounting principles to support equivalent SOA workload
performance using alternate virtual machine (VM) types. We demonstrate how the use of resource utilization checkpointing
supports capturing the total resource utilization profile for SOA workloads executed across a pool of VMs. Given these
workload profiles, we develop and evaluate our cost prediction methodology using six SOAs. We demonstrate how our
methodology can support finding alternate infrastructures that afford lower hosting costs while offering equal or better
performance using any VM type on Amazon’s public elastic compute cloud.
Index Terms— Service Oriented Application, performance equivalence, predictive models, IaaS cloud, cloud economics
—————————— ——————————
1 INTRODUCTION
eploying service oriented applications (SOAs) to In-
frastructure-as-a-Service (IaaS) clouds requires selection of both the type and quantity of VMs adequate for work-load hosting. Public IaaS clouds offer a wide array of VM appliance types featuring different hardware configura-tions. These VM appliance types provide fixed alloca-tions of CPU cores, system memory, hard disk capacity and type (spindle vs. solid state), and network through-put. By focusing on providing a limited number of VM types, cloud providers can leverage economies of scale to improve performance and availability of VM types in hardware procurement and management. Given the ever increasing number of VM types it is increasingly difficult to make informed choices for SOA deployment. In 2014, Amazon EC2 and HP Helion offered 34 and 11 prede-fined VM types respectively, each with different CPU, memory, disk, and network bandwidth allocations avail-
able for different costs. Quantifying performance expectations of cloud re-
sources is difficult. Amazon EC2 and HP Helion’s clouds use qualitative “compute units” to describe relative pro-cessing capabilities of VMs. Amazon EC2 describes VM performance using elastic compute units (ECUs), where one ECU is stated to provide the equivalent CPU capacity of a 1.0-1.2 GHz 2007 AMD Opteron or Intel Xeon proces-sor [1]. An HP Cloud Compute Unit (CCU) is advertised to be roughly equivalent to the minimum power of 2/13th of one logical core (a hardware hyper-thread) of an Intel 2.6 GHz 2012 Xeon CPU. Recently, Amazon has stopped directly marketing ECUs for 3rd generation VM-types, though ECUs are still listed in the management console interface. Additionally, Amazon employs ap-proximate network throughput categories. They include: very low, low (250 Mbps), moderate (500 Mbps), high (1000 Mbps), and 10 Gigabit.
Not only do cloud vendors offer a diverse array of VM-types, investigations have shown that VM types are often implemented using heterogeneous hardware result-ing in performance variance [2], [3]. Ou et al. identified no less than five hardware implementations of the m1.large Amazon VM-type in 2011, with performance variance up to 28% [2]. Ou also observed the use of dif-ferent CPU time sharing allotments to implement the m1.large VM type. In some cases, multi-core VMs were found to not receive 100% allotments of every core. Using
xxxx-xxxx/0x/$xx.00 © 2014 IEEE Published by the IEEE Computer Society
D
————————————————
W. Lloyd and O. David are with the Departments of Computer Science and Civil Engineering, 1372 Campus Delivery, Colorado State University, Fort Collins, CO 80523. E-mail: [email protected], [email protected].
S. Pallickara is with the Dept. of Comp. Sci, 1873 Campus Delivery, Colora-do St. Univ., Ft. Collins, CO 80523. E-mail: [email protected]
M. Arabi, T. Wible, and J. Ditty is with the Departments of Computer Sci-ence and Civil Engineering, 1372 Campus Delivery, Colorado State Uni-versity, Fort Collins, CO 80523. E-mail: [email protected], [email protected], [email protected]
K. Rojas is with the US Department of Agriculture Natural Resources Con-servation Service, Information Technology Center, 2150 Centre Ave, Building A, Suite 150, Fort Collins, CO 80526-8121

2 IEEE TRANSACTIONS ON CLOUD COMPUTING, TCCSI-2014-10-0471
CPU benchmarking techniques we confirmed this phe-nomenon. Timeshare allocations of the 4-core m1.xlarge backed by the Intel Xeon E5-2650 v0 @ 2.0 GHz could not be made to exceed 100%, 100%, 95%, and 75% CPU for each respective core.
Beyond VM type heterogeneity challenges, previous research has demonstrated how resource contention from multi-tenancy on VM hosts results in SOA performance variance and degradation [4]–[7]. Provisioning variation, the uncertainty of the physical location of VMs across physical hosts, has been shown to contribute to applica-tion performance variance and degradation [8], [9].
Determining the best VM type for SOA hosting is complicated by: (1) a plethora of vendor provided VM-types, (2) vague qualitative descriptions of VM capabili-ties, (3) heterogeneous vendor hardware and hypervisor configurations, and (4) performance variance from re-source contention and provisioning variation across shared hardware. Given these challenges, a practition-er’s effectiveness at employing only intuition to make architectural choices which account for performance and cost tradeoffs is increasingly in doubt.
1.1 Workload Cost Prediction Methodology
Making informed choices regarding VM deployments for SOA hosting requires (1) characterization of workloads and (2) benchmarking performance capabilities of available VM types. In this paper, we present a workload cost predic-tion methodology that harnesses both to support deter-mination of infrastructure requirements for achieving equivalent performance for SOA workloads.
To develop our approach we investigate SOA work-load hosting consisting of a large number of individual service requests. We focus on achieving equivalent total execution time for entire workloads using different VM types, irrespective of individual service request execution times. Our approach supports prediction of the type and quantity of VMs to achieve equivalent workload performance providing resource alternatives. Given alternatives the most economical can be chosen for SOA hosting. Infrastructure costs can be calculated by multi-plying fixed or spot market prices by the predicted quan-tity of VMs to derive monetary costs. Cost predictions can be compared to determine the most cost effective vir-tual infrastructure.
We consider SOA hosting using VM pools consisting of a single VM type. We do not investigate hosting using pools with mixed VM types. The utility of mixing VM types could emulate support of vertical scaling in a public cloud. Vertical scaling is useful when an optimal CPU core requirement is determined to be 22 cores. With ver-tical scaling this workload could be hosted using 5 x 4-core VMs, and 1 x 2-core VM of similar processing speed. We do not consider provisioning separate infrastructure for different phases of SOA workloads, rather we provi-sion infrastructure for the most resource intensive phase. When necessary, workload phases could be profiled sepa-rately and infrastructure provisioned accordingly.
We consider SOA hosting only on VM types which meet or exceed SOA RAM and disk space requirements.
We do not consider under allocation of VM RAM or disk space. This would likely result in significant performance degradation and represents a problem outside the scope of our investigation.
Unlike related work in cost optimization for cloud workloads we do not assume that application workloads are identical [10]–[12]. We profile representative SOA workloads and build predictive resource utilization mod-els. Our models convert resource requirements from a selected base VM type to alternate VM types needed to achieve equivalent performance. We focus our analysis on service oriented application workloads where many individual service requests are executed independently in parallel. As our resource utilization based approaches are generic, our workload cost prediction methodology is extensible to any workload that will run across a distrib-uted pool of VMs.
We initially considered cloud application performance modeling using resource utilization statistics in [13]. We harnessed this approach to predict performance of vari-ous component compositions across VMs in [8], [14]. These efforts demonstrate how intuition is insufficient to determine the best performing VM component composi-tions. We developed VM-Scaler to easily facilitate re-source utilization profiling of application deployments in private and public cloud settings [15].
1.2 Research Questions
This paper investigates the following research questions:
1. How can equivalent SOA workload performance
be achieved across different virtual machine types
by harnessing resource utilization profiles?
[Equivalent Performance]
2. How effectively can we predict independent re-
source utilization variables for SOA workloads
across VM types? Specifically, how well can we
predict: CPU-user-time, CPU-kernel-time, CPU-
idle-time, and CPU-IO-wait-time? [Profile Prediction]
3. When scaling the number of VMs, how can we ac-
count for changes in the SOA workload resource
utilization profile variables? Specifically, what
changes occur and, how do we accommodate them
for: CPU-user-time, CPU-kernel-time, CPU-idle-
time, and CPU-IO-wait-time? [Profile Scaling]
1.3 Research Contributions
In this paper we present our workload cost prediction
methodology to predict hosting costs of SOA workloads
harnessing resource utilization models. Our methodology
provides infrastructure configuration alternatives that
provide equivalent performance allowing the most eco-
nomical infrastructure to be chosen. Our methodology
supports: (1) characterization of workload requirements,
(2) predicting the required number of VMs of a given type
required to host workloads, while (3) ensuring equivalent
performance is achieved. We additionally contribute:

LLOYD ET AL.: HARNESSING RESOURCE UTILIZATION MODELS FOR COST EFFECTIVE INFRASTRUCTURE ALTERNATIVES 3
1. A novel resource checkpointing scheme that supports
profiling SOA workload resource utilization for jobs
executing across VM pools.
2. A research application of Ou et al.’s trial-and-better
approach [2] to normalize VM pools to ensure each
VM has an identical backing CPU to support SOA
workload profiling.
Our resource utilization checkpointing scheme sup-ports profiling application resource utilization across VM pools. Resource utilization data collection is synchro-nized to the nearest second to accurately benchmark re-source requirements. We use a novel application of the trial-and-better approach to homogenize public cloud infrastructure for all experiments. We argue that all pub-lic cloud research should use trial-and-better to reduce heterogeneity of tested resources. Trial-and-better sup-ports normalization of resources to reduce variance of testing in public clouds.
1.4 Paper Organization
In Section 2 provides an overview of related research for cloud based cost optimization and prediction for work-load hosting. Section 3 describes our workload cost pre-diction methodology that harnesses Linux CPU time ac-counting principles for workload cost prediction to ad-dress research-question 1. Section 4 describes our envi-ronmental science SOAs used for evaluation and our hardware and test configurations. Section 5 describes results of our evaluation while addressing research ques-tions 2 and 3. Section 6 summarizes our findings while Section 7 discusses future work.
2 BACKGROUND AND RELATED WORK
Research on cloud economics and application hosting costs can be broken down into efforts focused on demand based pricing models (spot markets), and investigations on the cost implications of infrastructure management and scaling approaches.
Amazon introduced spot virtual machine instances as a method to sell unused datacenter capacity in late 2009. Spot instances enable bidding for spare public cloud ca-pacity by granting resources to users whose bids exceed current spot prices. When demand spikes, user VMs whose bid price falls below the current market price are terminated instantly, freeing capacity for higher bidders. Spot instances are ideal for executing computational workloads for scientific modeling where the time of exe-cution is less important than completing the workloads at minimum cost. Spot instances were harnessed to conduct our research.
A number of efforts have investigated spot instance pricing and similar demand based pricing mechanisms [11], [12], [16], [17]. These efforts employed modeling to predict or set prices. Yi et al. investigated the use of job checkpointing as a mechanism to reduce job costs execut-ed using spot instances [11]. Their approach was limited to supporting jobs with fixed execution times and was evaluated by simulation using spot price histories. An-
drzejak et al. developed a model which supports users by providing bid suggestions while considering resource availability, reliability, performance, and resource costs [12]. Their approach was limited to compute intensive, embarrassingly parallel jobs whose computation is easily divided.
Other efforts primarily have focused on infrastructure management to minimize hosting costs [2], [3], [10], [18]–[20]. In [21], Galante and E. de Bona provide a survey of recent research on cloud computing elasticity. They iden-tify 28 works which consider elasticity for infrastructure, platform, and application hosting. Of these only one study [10], focused on cost optimization of application hosting and scaling.
In [10] Sharma et al. describe Kingfisher, a manage-ment system supporting cost-aware application hosting and scaling for IaaS clouds. Kingfisher determines the most cost effective approach to transition existing appli-cation infrastructures to target infrastructures to meet service level agreements (SLAs). Transitions considered include vertical and horizontal scaling, as well as VM live migration. Kingfisher was evaluated using Amazon’s public cloud and a local private XEN-based cloud. King-fisher assumes that each VM can service a fixed volume of incoming requests and that all requests require the same resources to process.
In [18], Leitner et al. developed an SLA-aware client side request scheduler which minimizes “aggregate” hosting costs by balancing both price and SLA require-ments. They evaluated their approach by simulation us-ing workload archival data to test how their scheduler responds. They compared the aggregate costs of their algorithms with: (1) the minimum infrastructure (1 VM for all requests), (2) the maximum infrastructure (1 VM for each request) and (3) a bin-packing approach which fully packs existing resources before allocating additional VMs. Their approach provided the lowest aggregate costs but their bin packing approach did not address in-frastructure launch latency.
Simarro et al. provide a cost aware VM-placement scheduler which seeks to reduce infrastructure costs by provisioning VMs across cloud data centers having the lowest infrastructure prices [19]. Their schedulers use price forecasts to predict pricing trends to support the most economical infrastructure placements. Their ap-proach reduced infrastructure costs but did not address network latency and performance issues resulting when application infrastructure is simultaneously provisioned across different data centers.
In [20] Villegas et al. provide a performance and cost analysis of provisioning and job scheduling policies in the cloud. They assessed policies from recent literature for their analysis using two private clouds and Amazon EC2. They found that statically provisioned virtual infrastruc-ture delivered better performance, but was up to 5Xs more costly. Conversely dynamically provisioned infra-structure provided lower hosting costs but with perfor-mance caveats resulting from infrastructure launch laten-cy similar to [22]. This key cost versus performance tradeoff for infrastructure provisioning highlights the
4 IEEE TRANSACTIONS ON CLOUD COMPUTING, TCCSI-2014-10-0471
need for good hot spot detection and load prediction techniques [23].
Farley et al. demonstrated that Amazon EC2 instance types had heterogeneous hardware implementations in [3]. Their investigation focused on the m1.small instance type and demonstrated potential for cost savings by dis-carding VMs with less performant implementations. Ou et al. extended their work by demonstrating that several Amazon and Rackspace VM types exhibit heterogeneous implementations [2]. They identified four different im-plementations of the m1.large VM on Amazon EC2 with varying performance. Performance variations were at-tributed to the use of different backing CPUs and XEN scheduler configurations. They harnessed this heteroge-neity by developing a “trial-and-better” approach to test new instances and discard poor performing instances. The authors demonstrated cost savings for long running jobs as a result of faster job execution. For our work we adopt Ou’s “trial-and-better” approach to improve ho-mogeneity of VM profiling.
Previous research investigating cost implications of IaaS clouds has focused on spot market analysis [16], [17], pricing/bid support [11], [12], cost-aware VM scheduling [10], [19], [20], and job placement schemes [18], [20]. For the surveyed approaches workloads were assumed to be heterogeneous. None of the approaches specifically sup-port diverse workloads with varying resource require-ments (e.g. CPU and I/O) [10]–[12]. Conversely, we pro-vide a workload cost prediction methodology which har-nesses SOA workload profiles and VM benchmarking to capture the unique resource requirements of diverse workloads. Our methodology provides equivalent work-load performance using different VM types and supports cost savings by identifying infrastructure alternatives.
3 RESOURCE UTILIZATION MODELS FOR COST
PREDICTION
Our resource utilization based approach for SOA work-load cost prediction focuses on achieving equivalent per-formance for diverse SOA workloads. For the purposes of our evaluation in section 5, we consider equivalent per-formance to be +/- 2 seconds of the observable wall clock time. This equates to ~2% execution time for our SOA workloads. Our workloads consist of sets of individual service requests that execute in parallel across virtual in-frastructure. We are not concerned with response time of individual service requests, but rather the total workload execution time. In fact, we expect individual requests to perform slower on VM-types having slower CPU clock speeds.
3.1 Workload Equivalent Performance
Given SOA workloads, we predict the workload resource utilization requirements for pools of distinct virtual ma-chine types. For example, we have 3 pools: one consisting of c3.xlarge VMs, another m1.xlarge, and a third c1.medium. Our methodology supports determining the required number of virtual machines to provide equiva-lent workload performance using these different VM
pools. We harness Linux CPU time accounting principles to
account for available time across the pool of VMs servic-ing the workload. Workload wall clock time can be de-termined by summing CPU resource utilization variables across the VM pool and dividing by the total number of CPU cores.
Workload time=
𝑐𝑝𝑢𝑈𝑠𝑟𝑇+𝑐𝑝𝑢𝐾𝑟𝑛𝑇+𝑐𝑝𝑢𝐼𝑑𝑙𝑒𝑇+𝑐𝑝𝑢𝐼𝑜𝑊𝑎𝑖𝑡𝑇+𝑐𝑝𝑢𝐼𝑛𝑡𝑆𝑟𝑣𝑐𝑇+𝑐𝑝𝑢𝑆𝑓𝑡𝐼𝑛𝑡𝑆𝑟𝑣𝑐𝑇+𝑐𝑝𝑢𝑁𝑖𝑐𝑒𝑇+𝑐𝑝𝑢𝑆𝑡𝑒𝑎𝑙𝑇
𝑉𝑀𝑐𝑜𝑟𝑒𝑠 (1)
Eight resource utilization variables contribute to the observed wall clock time. These eight variables described in table 1 include: cpuUsr, cpuKrn, cpuIdle, cpuIoWait, cpuIntSrvc, cpuSftIntSrvc, cpuNice, and cpuSteal. In prac-tice we found it unnecessary to consider all eight varia-bles. For our SOA workloads described in section 4.1, m1.xlarge wall clock time on average was accounted for by cpuUsr (45.26%), cpuKrn (7.52%), and cpuIdle (43.71%). CpuIoWait (3.14%) and cpuSftIntSrvc (0.28%) help further improve prediction accuracy. We ignore cpuIntSrvc (0%), cpuNice (0%) and cpuSteal (.08%) in practice because the time they account for was negligible. We use resource utilization checkpointing, a feature of VM-Scaler cloud to capture the workload resource utilization as described in section 4.3.
Of the eight resource utilization variables, cpuUsr and cpuIdle account for the majority of the time. For our SOA workload evaluation described in section 5, approximate-ly 88.97% of m1.xlarge SOA execution time is accounted for by cpuUsr or cpuIdle. CpuUsr represents the total amount of computation required by the workload. Through extensive testing, we observe that cpuUsr time remains generally the same regardless of the number VMs used to host the workload. Introducing additional VMs into the VM pool adds to the total overhead from background Linux processes. This overhead is relatively constant and can easily be accounted for. CpuIdle repre-sents the unused time where CPU cores have been provi-sioned but remain idle. Workloads exhibiting high cpuIdle time demonstrate parallel execution inefficiencies. This indicates significant resource waste in the service implementation. Applications concerned about cloud hosting costs should be architected to decrease cpuIdle time.
CpuKrn is the time a workload spends executing kernel mode instructions. When executing SOA workloads across VMs, we found the ratio of time spent in kernel mode is similar, with slightly more cpuKrn time occurring on VMs with slower I/O. CpuKrn is the third greatest contributor to workload execution time at approximately 7.52%. CpuIntSrvc and cpuSftIntSrvc represent time spent servicing system interrupts and is generally small. CpuNice is time spent executing prioritized processes in user mode. This is rare, and only occurs when SOAs em-ploy process prioritization in an attempt to gain a larger share of the CPU.

LLOYD ET AL.: HARNESSING RESOURCE UTILIZATION MODELS FOR COST EFFECTIVE INFRASTRUCTURE ALTERNATIVES 5
CpuSteal is an important, though unusable metric. CpuSteal registers processor ticks when a virtual CPU core is ready to execute, but the physical core is busy and una-vailable. The CPU may be unavailable because the hy-pervisor is executing native instructions (e.g. XEN Dom0) or other co-located VMs are currently “stealing” the CPU. The difficulty with this measure is that ticks are only reg-istered when execution should occur, but is unable to. These ticks, unfortunately, do not adequately account for the missing time. When workloads exhibit high cpuSteal time error is introduced into the Linux CPU time account-ing calculations. On the VM there is essentially “missing time”, which is the gap between accounted for time and actual time. There are a number of factors which cause CpuSteal time to occur. These include:
1. Processors are shared by too many VMs, and those VMs are busy
2. The hypervisor is occupying the CPU 3. The VM’s CPU core time share allocation is less
than 100%, though 100% is needed for a CPU inten-sive workload
In the case of 3, we observe high cpuSteal time when executing workloads on Amazon EC2 VMs which under allocate CPU cores as described earlier in section 1. A specific example of this is the m1.small [2] and m3.medium VMs. In 2014, we observed that the m3.medium VM type is only allocated 1 core of a 10-core 2.5 GHz Xeon E5-2670 v2 CPU with an approximate 60% timeshare. The m3.medium is advertised to provide 3 ECUs. Because of this significant CPU under allocation, all workloads executing on m3.medium VMs exhibit high cpuSteal time making time accounting inaccurate. If the degree of cpuSteal in these scenarios remains relatively
constant, it should be possible to buffer time calculations to compensate for the missing clock ticks.
3.2 Workload Cost Prediction Methodology
The steps of our workload cost prediction methodolo-gy for cost calculation are outlined in table 2. As an ex-ample we consider prediction of the number of m1.xlarge VMs (4 CPU cores, 2 ECUs each) required to execute SOA workloads with execution time equivalent to a pool of 5 x c3.xlarge VMs (4 CPU cores, 3.5 ECUs each). For the ex-ample c3.xlarge serves as VMbase.
Step 0 – Train resource utilization models
In this initialization step we train resource utilization models to convert workload resource utilization from VMbase c3.xlarge to m1.xlarge. SOA workload training data is collected using pools of (5) c3.xlarge and (5) m1.xlarge VMs. Training data must always be collected using the same number of CPU cores, though not neces-sarily the same number of VMs for each VM type. For example, if the VMbase is 4 x 8-core c1.xlarge Amazon VMs (32 total cores), training data would be collected using 8 x 4-core m1.xlarge VMs (32 total cores) and 16 x 2-core m1.large VMs (32 total cores).
For our evaluation in section 5, we collect training data for our six domain related SOAs and train a single set of resource utilization (RU) conversion models (Mall). This increases the range of resource utilization scenarios the models are exposed to and offers the potential to predict resource requirements for new models with similar re-source utilization behavior.
RU models are trained using stepwise multiple linear regressions. One model is trained for each VM type being considered. For our example, our c3.xlargem1.xlarge model converts RU data from c3.xlarge (VMbase) to the alternate VM type: m1.xlarge. RU models were trained using the R statistical package.
Step 1 – Profile workload resource utilization
We next perform a single profiling run of the SOA work-load on our VMbase type c3.xlarge to capture its resource requirements. For our workloads (W) we collect the total
TABLE 1 RESOURCE UTILIZATION VARIABLES TRACKED BY VM-SCALER
RU variable Description
cpuUsr CPU time in user mode
cpuKrn CPU time in kernel mode
cpuIdle CPU idle time
cpuIoWait CPU time waiting for I/O to complete
cpuIntSrvc CPU time servicing interupts
cpuSftIntSrvc CPU time servicing soft interrupts
cpuNice CPU time executing prioritized processes (user mode)
cpuSteal CPU ticks lost to other virtualized guests
contextsw Number of context switches
dsr Disk sector reads (1 sector = 512 bytes)
dsw Disk sector writes (1 sector = 512 bytes)
nbs Network bytes sent
nbr Network bytes received
dsreads Number of completed disk reads
drm Number of adjacent disk reads merged
readtime Time in ms spent reading from disk
dswrites Number of completed disk writes
dwm Number of adjacent disk writes merged
writetime Time in ms spent writing to disk
loadavg Avg # of running processes in last 60 sec
TABLE 2 WORKLOAD COST PREDICTION METHODOLOGY
Step Task
0 Train RU conversion models: MVMtype1, .. MVMtype-j
1 Profile workload: RUw(VM-base) (W) on n x VMbase
n=base #VMs
2 Convert: RUw(VM-base) (Mall) RUw{n x VMtype1, .. n x VMtype-j},
n=base #VMs, j=number VM types
3 Scale profiles: RUw{n x VMtype1, .. n x VMtype-j}, n=n to n+x
n=base #VMs, x = scale up #VMs
4 Select profile: perf(VMbase)={perf(n x VMtype1),.. perf(n x VMtype-j)}
n=#VMs w/ equivalent performance
5 Minimize cost: Select min{cost(VMtype1), .. cost(VMtype-j)}

6 IEEE TRANSACTIONS ON CLOUD COMPUTING, TCCSI-2014-10-0471
resource requirements (RUw) across the set of 5 x c3.xlarge VMs.
Step 2 – Convert resource utilization profile
The c3.xlarge workload resource utilization profile for RUw(VM-base) is then converted to our target VM-type m1.xlarge using the resource utilization conversion model trained in step 0 (Mm1.xlarge). Mall models from step 0 gen-erate “predicted” resource utilization profiles, (RUw(VM-
type(1..j))), for each possible VM type (1..j). For our example, we are only interested in 5 x m1.xlarge VMs. We generate (RUw(m1.xlarge)) which represents the resource utilization to execute the workload (W) with 5 x m1.xlarge VMs. How-ever, we know based on m1.xlarge’s 2 ECU performance rating that 5 VMs are insufficient for equivalent perfor-mance to 5 x c3.xlarge VMs. We address scaling up from n to n+x VMs in step 3.
To simplify the cost prediction methodology, it is best to select the profiling VMbase type for Step 1 to be either a very fast or slow offering so resource utilization is scaled in the same direction for all predicted VM types. The required number of VMs (n), should be scaled up (or down) for equivalent performance depending on the VMbase’s VM type relative to VMtype
i.
Step 3 – Scale resource utilization profile
To identify infrastructure configurations that provide equivalent workload performance to VMbase, we scale re-source utilization profiles RUw{n x VMtype1, ..., n x VMtype-j} from n to n+x VMs, where x is the maximum quantity of VMs over n required for equivalent performance. In table 3 we show scaling from 5 to 10 m1.xlarge VMs. For SOA workloads consisting of individual service requests, the maximum number of VMs to ever consider is equal to the number of workload service requests divided by the number of CPU cores. For a workload of 100 requests for example, 25 x m1.xlarge VMs would be the worst case infrastructure to consider for equivalent performance. This infrastructure enables every request to run in paral-lel. A complete SOA workload can never execute faster than its longest service request.
To scale our resource utilization profiles RUw{m1.xlarge} from 5 to 10 VMs, we address how indi-vidual profile variables change when VM resources are added to execute the workload. This is research question 3 from section 1. We investigate two different scaling approaches: Resource Scaling Approach 1 (RS-1) and Re-source Scaling Approach 2 (RS-2). For scaling CPU-bound SOA workloads we focus on scaling up cpuUsr and cpuKrn time. For RS-1, we only scale cpuUsr and cpuKrn because they account for most of the system time (98.94%). If scaling workloads are I/O bound, it becomes important to address scaling of cpuIoWait. For RS-2, we incorporate additionally cpuIoWait scaling. These ap-proaches exhibit an effort vs. accuracy tradeoff. More accuracy can be obtained with greater effort. From a re-search perspective, we investigate how much accuracy is required (Research question 3).
RS-1: APPLICATION AGNOSTIC Resource Scaling Approach 1 (RS-1) is agnostic to the SOA being scaled. For RS-1, idle m1.xlarge VMs are benchmarked to determine their background resource consumption. Observed idle resource utilization consists of typical background Linux server processes. Observed cpuUsr time represents overhead incurred for adding these VMs to the pool. Each VM type being considered should be tested separately to determine its background resource consumption. The average number of back-ground cpuUsr ticks per second is determined. This background overhead/VM rate is used to scale cpuUsr for Step 3. For RS-1, remaining parameters are converted using the c3.xlargem1.xlarge model from step 0, but not scaled up: cpuKrn, cpuIoWait, and cpuSftIntSrvc. These parameters account for only a small fraction of the total time, and represent background activity not directly re-lated to the SOA workload. Table 3 shows RS-1 scaling of cpuUsr with cpuKrn conversion but no scaling for the WEPS SOA (described in 4.1) for c3.xlargem1.xlarge.
RS-2: APPLICATION AWARE HEURISTIC Resource Scaling Approach 2 (RS-2) addresses how appli-cation specific characteristics of how resource utilization profiles change when VMs are added to the pool. A set of scaling runs is used for sample workloads for each SOA scaling from n to n+x, in our case 5 to 10. The average percentage change for scaling up by 1 VM is calculated for cpuUsr, cpuKrn, and cpuIoWait. Use of this average percentage change supports scaling resource utilization profiles to better account for changes based on specific SOAs. This approach helps incorporate application spe-cific information into resource predictions.
Step 4 – Select resource utilization profile
Once SOA workload resource utilization profiles have been converted to alternate VM types (step 2), and scaled (step 3), the final step is to determine the number of VMs required for equivalent SOA performance. An illustration of this selection problem appears in table 3. The first row represents converted profile output from step 2: 5 x c3.xlarge VMs to 5 x m1.xlarge VMs. Harnessing equa-tion 1 allows us to solve for cpuIdle time. With only 5 VMs cpuIdle is negative! With the specified “wall-time goal” for equivalent performance, there is not enough physical time to execute the workload. Each additional VM increases the total available clock ticks. However, it is insufficient to simply select the first line where cpuIdle is positive. To achieve equivalent performance for SOA workloads there has to be extra cpuIdle time to account for overhead, context switching, I/O, etc. We need an approach which estimates when enough cpuIdle time is available to provide equivalent perfor-mance to VMbase. We describe two alternative profile se-lection approaches: Profile Scaling Approach 1 (PS-1) and Profile Scaling Approach 2 (PS-2) to estimate the required cpuIdle time for equivalent performance.

LLOYD ET AL.: HARNESSING RESOURCE UTILIZATION MODELS FOR COST EFFECTIVE INFRASTRUCTURE ALTERNATIVES 7
PS-1: APPLICATION AGNOSTIC Profile Selection Approach 1 (PS-1) is agnostic to the SOA being scaled. For PS-1 we convert the cpuIdle time from n x VMbase to n x VMtype-j, in our case 5 x c3.xlarge to 5 x m1.xlarge. We know there must be more than 5 x m1.xlarge cpuIdle time after scaling to achieve equivalent performance. We also expect more cpuIdle to be required than the value from our Step 2 conversion (c3.xlargem1.xlarge) value for 5 VMs. We need to know cpuIdle time with 5 + x VMs. For PS-1 we use a simple linear function to determine a percentage to in-crease cpuIdle time for each additional VM. Our equation is derived by calculating the average observed % growth in cpuIdle time for all SOAs when scaling up with m1.xlarge VMs. We then assumed 0% growth for the VMbase of c3.xlarge (3.5 ECUs), and linear growth based on the VM’s ECU rating to derive the linear scaling equa-tion:
𝑐𝑝𝑢𝐼𝑑𝑙𝑒%𝑔𝑟𝑜𝑤𝑡ℎ = −6.5715 𝐸𝐶𝑈𝑠 + 23 (2)
Our equation expresses percentage growth as a num-
ber from 1 to 100, and supports increasing cpuIdle time faster for slower VM types. From SOA workload testing we observe that slower VMs require more cpuIdle to achieve equivalent performance. This approach to scale cpuIdle for profile selection is application agnostic. We take advantage of ECUs already being a normalized measure of CPU performance. If ECUs were unavailable a similar approach using CPU clock speed could be de-rived though we would need to compensate for genera-tional improvements in CPU performance. For example a 2012 Intel Xeon CPU at 2.5 GHz is somewhat faster than a 2007 Xeon at the same clock rate. Table 3 shows PS-1 se-lection as the dark grey row. PS-1 and PS-2 identify the same row in the scaling profile example.
PS-2: APPLICATION AWARE HEURISTIC Our second Profile Selection Approach (PS-2) attempts to address application specific characteristics relating to
cpuIdle time when infrastructure is scaled up. We convert cpuIdle time from c3.xlarge to m1.xlarge. After conver-sion, we scale the required cpuIdle time for selection using the SOA specific average percentage change in cpuIdle derived from application scaling test observations. This approach does not assume cpuIdle scales the same for all SOAs, but applies an application specific scaling factor to support prediction of required cpuIdle time. Table 3 shows PS-2 selection as the dark grey row.
Step 5 – Minimize cost
Once profile selection has identified the number of VMs for equivalent performance using alternate VM types, infrastructure costs can be calculated. Cost is determined by multiplying the required number of VMs by fixed or spot market VMtype prices to determine deployment costs. The lowest priced infrastructure can be selected for SOA hosting while ensuring equivalent performance.
4 EXPERIMENTAL INVESTIGATION
4.1 Environmental Modeling Services
To evaluate our workload cost prediction methodology and investigate the research questions presented in sec-tion 1, we harness six environmental science SOAs from the Cloud Services Innovation Platform (CSIP) [24], [25]. These six SOAs represent a diverse array of applications with varying computational requirements and architec-tures. CSIP has been developed by Colorado State Uni-versity with the US Department of Agriculture (USDA) to provide environmental modeling services. CSIP provides a common Java-based framework for REST/JSON based service development. CSIP services are deployed using the Apache Tomcat web container [26]. Our six SOAs include: the Revised Universal Soil Loss Equation – Ver-sion 2 (RUSLE2) [27], the Wind Erosion Prediction System (WEPS) [28], two versions of the Soil Water Assessment Tool for modeling interactive channel degradation (SWAT-DEG) [29], [30], the Comprehensive Flow Analy-sis LOAD ESTimator (CFA-LOADEST) [31], [32], and the Comprehensive Flow Analysis Load Duration Curve (CFA-LDC) [33].
RUSLE2 and WEPS are the USDA–Natural Resource Conservation Service standard models for soil erosion used by over 3,000 county level field offices. RUSLE2 (Windows/MS Visual C++) contains empirical and pro-cess-based science that predicts rill and interrill soil ero-sion by rainfall and runoff. The Wind Erosion Prediction System (WEPS) is a daily simulation model which out-puts average soil loss and deposition values to predict soil erosion due to wind. WEPS (Linux/Java/Fortran) consists of seven sub models for weather, crop growth, decomposition, hydrology, soil, erosion, and tillage. M, D, F, and L components used by RUSLE2 and WEPS are described in table 4. All other tested SOA workloads used only M and L components. Resource profiling oc-curred only on M VMs. One VM was statically allocated for D, F, and L components.
Two variants of SWAT-DEG (Fortran/Linux) were used. A deterministic version simulates stream down-
TABLE 3 SCALING PROFILE: RS-1 (WEPS - C3.XLARGE->M1.XLARGE)
VMs /
cores
wall time-
goal
available
clock ticks cpuUsr cpuKrn cpuIdle
5 / 20 96.774s 193548 219561 10642 -38536
6 / 24 96.774s 232258 220622 10642 -888
7 / 28 96.774s 270967 221684 10642 36760
8 / 32 96.774s 309677 222745 10642 74409
9 / 36 96.774s 348386 223807 10642 112057
10 /40 96.774s 387096 224868 10642 149705
SCALING PROFILE: RS-2 (WEPS - C3.XLARGE -> M1.XLARGE)
VMs /
cores
wall
time-
goal
available
clock ticks cpuUsr cpuKrn
cpu
IoWait cpuIdle
5 / 20 96.774s 193548 219561 10642 1867 -38536
6 / 24 96.774s 232258 221822 10856 2005 -2440
7 / 28 96.774s 270967 224107 11074 2153 33619
8 / 32 96.774s 309677 226416 11297 2312 69638
9 / 36 96.774s 348386 228748 11524 2483 105618
10 /40 96.774s 387096 231104 11755 2667 141556

8 IEEE TRANSACTIONS ON CLOUD COMPUTING, TCCSI-2014-10-0471
cutting and widening while also outputting a flow dura-tion curve and cumulative stream power. A stochastic version supports Monte Carlo model calibration for model uncertainty encountered within nature for river restoration/rehabilitation projects. SWAT-DEG stochastic invokes SWAT-DEG deterministic repeatedly to perform calibration runs and performs Map-Reduce operations. Individual runs are distributed to M worker VMs to per-form local computations which are later reduced. The reduce phase was largely sequential, resulting in a heavy parallel computation phase followed by a largely sequen-tial reduction phase.
CFA-LOADEST (Windows/FORTRAN) estimates the amount of constituent loads in streams and rivers given a time series of stream flows and constituent concentra-tions. Estimation of constituent loads occurs in two steps, the calibration procedure and the estimation procedure based on statistical methods. CFA-LDC (java) graphs Weibull plotting position ranks of river flows on a scale of percent exceedance. Graphing flow values in this way allows for a quick visualization of the variability of flow for different flow regimes.
4.2 The Virtual Machine (VM) Scaler
To facilitate performance profiling of virtual infrastruc-tures for hosting SOA workloads we developed the Vir-tual Machine (VM) Scaler, a REST/JSON-based web ser-vices application [15]. VM-Scaler harnesses the Amazon EC2 API to support application profiling and cloud infra-structure management and currently supports Amazon’s public cloud (EC2) and private clouds running Eucalyp-tus. VM-Scaler provides cloud control while abstracting the underlying IaaS cloud and can be extended to support any EC2 compatible virtual infrastructure manager. Key features are provided to support workload management and IaaS cloud research. Features include: hotspot detec-tion, dynamic scaling, VM management and placement, job scheduling and proxy services, VM workload profil-ing, and VM worker pools.
Upon initialization VM-Scaler probes the host cloud and collects metadata including location and state infor-mation for all VMs and physical hosts (private IaaS only). An agent installed on each VM sends resource utilization data to VM-Scaler at fixed intervals. Collected resource utilization variables are described previously in table 1.
Application and load balancer configuration is performed automatically as needed to support workload execution and profiling tasks. VM-Scaler builds on previous re-search investigating the use of resource utilization varia-bles for guiding cloud application deployment [8], [13].
VM-Scaler supports group management of VMs using a construct known as a “VM pool”. Common operations can be applied to pools in parallel to support flushing memory caches, restarting the web container, checkpoint-ing resource utilization and running scripts. Pools sup-port reuse of VMs for multiple workloads as VMs can be returned to the pool after job assignment. For Amazon’s public cloud, VMs are billed for a minimum of one hour. This coarse-grained billing cycle makes it advantageous to retain VMs for at least one hour for potential reuse. Pools maintain a minimum number of members and can be instructed to spawn new VMs in anticipation of future demand to help alleviate VM launch latency.
4.3 Resource Utilization Checkpointing
VM-Scaler supports collection of resource utilization data across a pool of worker VMs providing SOA workload execution. A simple script installed on each VM sends VM-Scaler resource utilization data at preconfigured in-tervals. VM-Scaler’s checkpoint service is called to mark the start time for workload execution. Resource utiliza-tion deltas can be calculated from any checkpoint to the present to capture total resource utilization across a pool of VMs. All VMs run Linux’s Network Time Protocol daemon (ntpd) to synchronize clock times. VM-Scaler ensures resource utilization data collection is synchro-nized to within one second. Resource utilization check-pointing in VM-Scaler has been tested using pools >100 VMs.
Resource utilization checkpoints allow for a composite view of the total resource consumption of an SOA work-load. This novel feature helps characterize diverse SOA workloads whose execution is distributed across an array of VMs. Composite resource utilization profiles can be harnessed to examine SOA workload characteristics, re-source use efficiency, perform analysis, and to build
TABLE 4 RUSLE2/WEPS SOA COMPONENTS
Component RUSLE2 WEPS
M Model Apache Tomcat 6, Wine, OMS3 [34], [35]
Apache Tomcat 6
D Database
Postgresql-8.4, PostGIS
1.4: soils (4.3m shapes),
mgmt (98k shapes), climate (31k shapes), 4.6
GB total (Tennessee)
Postgresql-8.4, PostGIS
1.4, soils (4.3m shapes),
climate/wind (850 shapes), 17 GB total
(western US data)
F File server
nginx file server, 57k XML files (305MB),
parameterizes RUSLE2
model runs.
nginx file server, 291k files (1.4 GB),
parameterizes WEPS
model runs.
L Logger Redis - distributed cache server
Redis - distributed cache server
TABLE 5
EQUIVALENT PERFORMANCE INVESTIGATION VM TYPES
VM type CPU
cores ECUs/core RAM Disk Cost/hr.
c3.xlarge 4 3.5 7.5 GB 2x40 GB SSD 30¢
m1.xlarge 4 2 15 GB 4x420 GB 48¢
c1.medium 2 2.5 1.7 GB 1x350 GB 14¢
m2.xlarge 2 3.25 17.1 GB 1x420 GB 41¢
m3.xlarge 4 3.25 15 GB 2x40 GB SSD 45¢
NETWORKING AND BACKING CPUS
VM type Network I/O Backing CPU
c3.xlarge High-1000 Mbps Intel Xeon E5-2680 v2 @ 2.8 GHz
m1.xlarge Moderate-500 Mbps Intel Xeon E5-2650 v0 @ 2.0 GHz
c1.medium Moderate-500 Mbps Intel Xeon E5-2650 v0 @ 2.0 GHz
m2.xlarge Moderate-500Mbps Intel Xeon E5-2665 v0 @ 2.4 GHz
m3.xlarge High-1000 Mbps Intel Xeon E5-2670 v2 @ 2.5 GHz

LLOYD ET AL.: HARNESSING RESOURCE UTILIZATION MODELS FOR COST EFFECTIVE INFRASTRUCTURE ALTERNATIVES 9
models to support infrastructure and cost prediction.
4.4 Hardware Configuration
We develop and evaluate our methodology to achieve equivalent SOA workload performance using different VM types using Amazon’s public elastic compute cloud (EC2). Amazon offers a diverse array of VM types, as well as spot instances which enabled this research to be conducted at a low cost in a public cloud environment with real world multi-tenancy challenges. VM types used in the evaluation of our workload cost prediction meth-odology are described in table 5. Trial-and-better was used to normalize the backing CPUs of all VM pools to those described in the table. We selected VMbase to be the c3.xlarge. This third generation VM from Amazon pro-vides 4 cores at 3.5 ECUs per core. The c3 VMs are known as “compute” optimized instances, as they are configured with better CPUs but less memory and disk storage capacity. Third generation VMs are all equipped with solid state storage disks, though most are smaller in capacity than previous first and second generation spin-dle disks. For our investigation we benchmark all SOA workloads using a pool of 5 x c3.xlarge VMs. Using our workload cost prediction methodology we investigate what is required to achieve equivalent SOA performance using m1.xlarge, c1.medium, m2.xlarge, and m3.xlarge VMs.
4.5 Test Configurations
We train our VM-type resource utilization models (MVMtype1, .. MVMtype-j) using workloads from six CSIP ap-plications as described in table 6. Distinct training work-loads were used to train models, while other unique workloads were used for validation. These models sup-port conversion of resource utilization profiles from one VM-type to another. We train models to convert cpuUsr, cpuKrn, cpuIdle, and cpuIoWait resource utilization be-tween VM types. We could also construct models to con-vert cpuIntSrvc, cspuSftIntSrvc, cpuNice, and cpuSteal. However, for our SOA workloads, these resource utiliza-tion variables are shown to have very little impact on to-tal wall clock time.
In section 3.1, we discussed the challenges cpuSteal presents in accounting for wall clock time. We have cho-sen to avoid these challenges by selecting SOA workloads and VM type configurations which exhibit very low cpuSteal time. It should be noted that it was not difficult to avoid these cpuSteal challenges for this work. Account-ing for cpuSteal time may be possible by investigating the use of offset values to account for missing clock ticks in the presence of relatively constant cpuSteal.
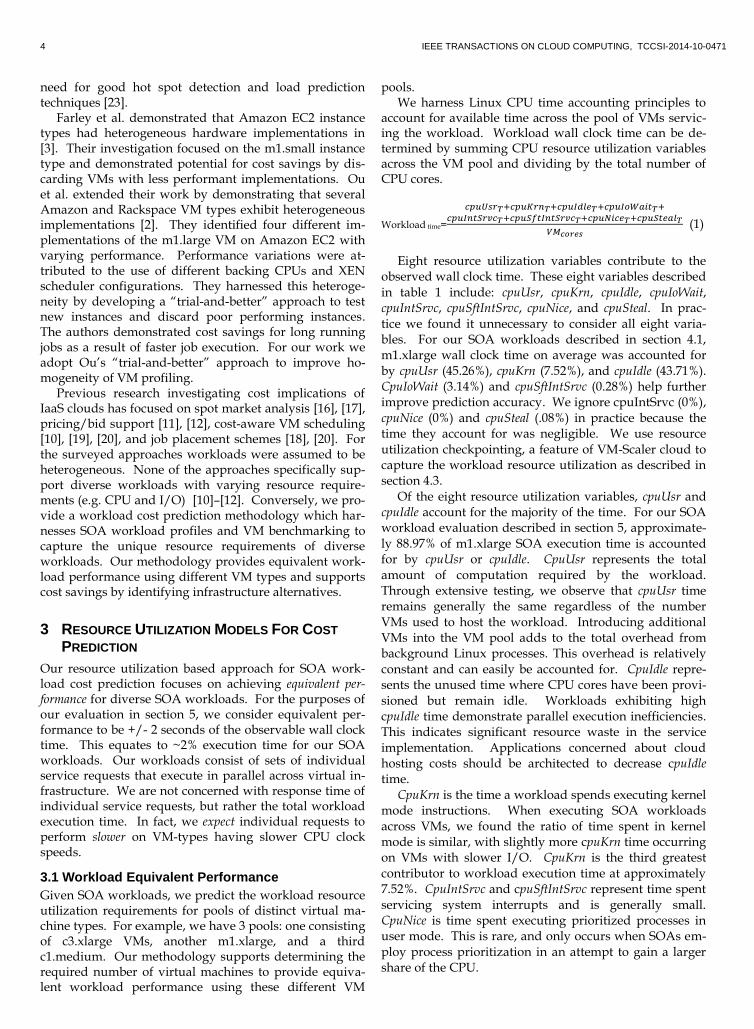
Figure 1 illustrates the resource utilization of our CSIP SOA workloads on 5 x c3.xlarge 4-core VMs. 25% cpuUsr is equivalent to exercising one core at 100% for the dura-tion of the SOA workload. The figure demonstrates that these six workloads are primarily CPU bound but vary widely as to how effectively they exercise available cores. WEPS and SWATDEG-deterministic were most effective at using available cores. RUSLE2 and SWATDEG-stochastic appear to continuously exercise from 1 to 2
CPU cores. CFA-LOADEST and CFA-LDC appear to uti-lize less than one CPU core. The balance between cpuUsr time and cpuIdle time illustrates how well a given work-load performs computations in parallel. Adding increas-ingly more resources to largely sequential workloads provides little performance benefit as described by Amdahl’s Law. VM-Scaler’s resource utilization check-pointing supports profiling the parallel efficiency of SOA workloads. Figure 1 illustrates the range of efficiencies we observed for our 6 modeling SOAs.
Between individual training and validation SOA work-loads, all application services were stopped, caches cleared, and services restarted. The Linux virtual memory drop_caches function was used to clear caches, dentries, and inodes. Clearing caches served to negate training effects resulting from reusing test cases.
5 EXPERIMENTAL RESULTS
5.1 Resource Utilization Profile Prediction
Training resource utilization models which convert SOA workload profiles between VM types requires execution of SOA training workloads. We executed these work-loads using isolated dedicated M VMs. Resource utiliza-tion checkpointing enabled profiling data to be collected with minimum overhead. The effectiveness of our meth-odology is confirmed by the high statistical predictably of key resource utilization variables using linear regression. A linear regression of cpuUsr for m1.xlarge vs. c3.xlarge provides R2 of .9924 when trained with our 6 CSIP SOAs. This relationship is shown in figure 2. Clusters of data can be seen in groups which represents our distinct SOA workloads.
Using linear regression we tested if the same approach was viable to predict cpuKrn, cpuIdle, and cpuIoWait, the most important variables which account for wall clock time. We observed good, though lower, R2 values for these predictions. To refine our predictions we then ap-plied stepwise multiple linear regressions (MLR). We fed stepwise-MLR every available resource utilization varia-ble from table 1 to construct MLR models for cpuUsr, cpuKrn, cpuIdle, and cpuIoWait. Stepwise MLR begins by modeling the dependent variable using the complete set of independent variables and iterates by dropping the least powerful predictor based on significance for each step. This enables testing various combinations until the best fit model which explains the most variance (R2) is found. The resulting MLR models had either 7 or 8 inde-pendent variables. The independent variables having the
TABLE 6 SOA WORKLOADS
CSIP SOA Test cases
per workload
# training
workloads
Avg. duration
5 x c3.xlarge
WEPS 100 10 96.6 s
RUSLE2 800 10 104.6 s
SwatDeg-Stoc 10 users x 150 sims 10 133.6 s
SwatDeg-Det 500 10 13.5 s
CFA-LOADEST 500 10 99.6 s
CFA-LDC 500 10 103.7 s
10 IEEE TRANSACTIONS ON CLOUD COMPUTING, TCCSI-2014-10-0471
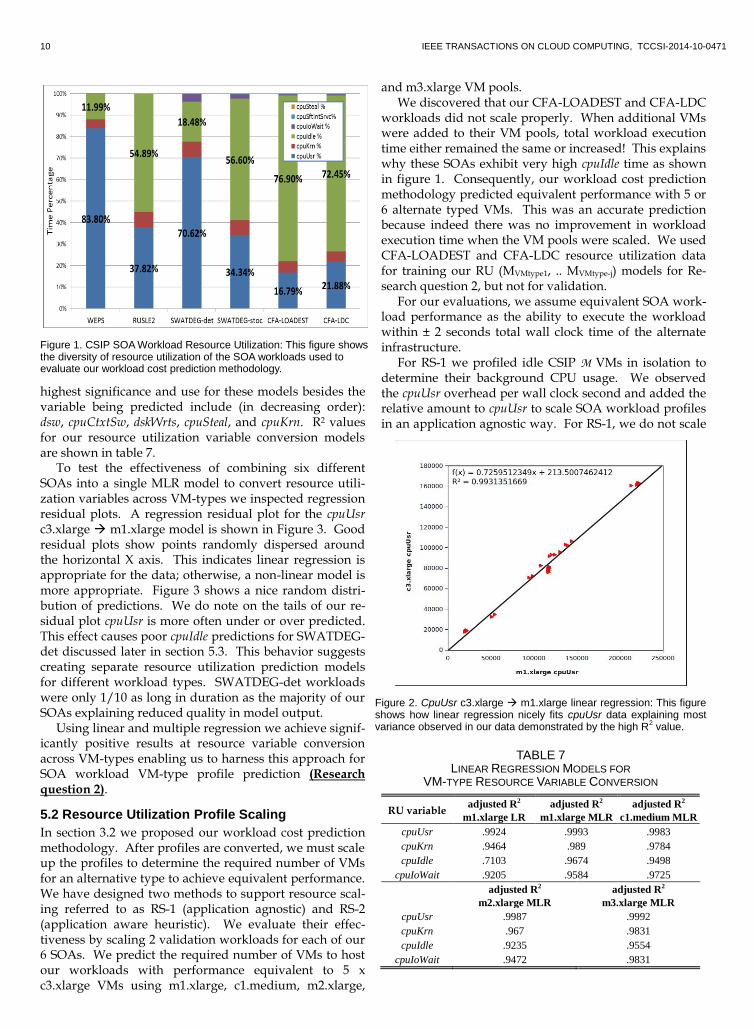
highest significance and use for these models besides the variable being predicted include (in decreasing order): dsw, cpuCtxtSw, dskWrts, cpuSteal, and cpuKrn. R2 values for our resource utilization variable conversion models are shown in table 7.
To test the effectiveness of combining six different SOAs into a single MLR model to convert resource utili-zation variables across VM-types we inspected regression residual plots. A regression residual plot for the cpuUsr c3.xlarge m1.xlarge model is shown in Figure 3. Good residual plots show points randomly dispersed around the horizontal X axis. This indicates linear regression is appropriate for the data; otherwise, a non-linear model is more appropriate. Figure 3 shows a nice random distri-bution of predictions. We do note on the tails of our re-sidual plot cpuUsr is more often under or over predicted. This effect causes poor cpuIdle predictions for SWATDEG-det discussed later in section 5.3. This behavior suggests creating separate resource utilization prediction models for different workload types. SWATDEG-det workloads were only 1/10 as long in duration as the majority of our SOAs explaining reduced quality in model output.
Using linear and multiple regression we achieve signif-icantly positive results at resource variable conversion across VM-types enabling us to harness this approach for SOA workload VM-type profile prediction (Research question 2).
5.2 Resource Utilization Profile Scaling
In section 3.2 we proposed our workload cost prediction methodology. After profiles are converted, we must scale up the profiles to determine the required number of VMs for an alternative type to achieve equivalent performance. We have designed two methods to support resource scal-ing referred to as RS-1 (application agnostic) and RS-2 (application aware heuristic). We evaluate their effec-tiveness by scaling 2 validation workloads for each of our 6 SOAs. We predict the required number of VMs to host our workloads with performance equivalent to 5 x c3.xlarge VMs using m1.xlarge, c1.medium, m2.xlarge,
and m3.xlarge VM pools. We discovered that our CFA-LOADEST and CFA-LDC
workloads did not scale properly. When additional VMs were added to their VM pools, total workload execution time either remained the same or increased! This explains why these SOAs exhibit very high cpuIdle time as shown in figure 1. Consequently, our workload cost prediction methodology predicted equivalent performance with 5 or 6 alternate typed VMs. This was an accurate prediction because indeed there was no improvement in workload execution time when the VM pools were scaled. We used CFA-LOADEST and CFA-LDC resource utilization data for training our RU (MVMtype1, .. MVMtype-j) models for Re-search question 2, but not for validation.
For our evaluations, we assume equivalent SOA work-load performance as the ability to execute the workload within ± 2 seconds total wall clock time of the alternate infrastructure.
For RS-1 we profiled idle CSIP M VMs in isolation to determine their background CPU usage. We observed the cpuUsr overhead per wall clock second and added the relative amount to cpuUsr to scale SOA workload profiles in an application agnostic way. For RS-1, we do not scale
Figure 1. CSIP SOA Workload Resource Utilization: This figure shows the diversity of resource utilization of the SOA workloads used to evaluate our workload cost prediction methodology.
Figure 2. CpuUsr c3.xlarge m1.xlarge linear regression: This figure shows how linear regression nicely fits cpuUsr data explaining most variance observed in our data demonstrated by the high R
2 value.
TABLE 7 LINEAR REGRESSION MODELS FOR
VM-TYPE RESOURCE VARIABLE CONVERSION
RU variable adjusted R2
m1.xlarge LR
adjusted R2
m1.xlarge MLR
adjusted R2
c1.medium MLR
cpuUsr .9924 .9993 .9983
cpuKrn .9464 .989 .9784
cpuIdle .7103 .9674 .9498
cpuIoWait .9205 .9584 .9725
adjusted R2
m2.xlarge MLR
adjusted R2
m3.xlarge MLR
cpuUsr .9987 .9992
cpuKrn .967 .9831
cpuIdle .9235 .9554
cpuIoWait .9472 .9831

LLOYD ET AL.: HARNESSING RESOURCE UTILIZATION MODELS FOR COST EFFECTIVE INFRASTRUCTURE ALTERNATIVES 11
cpuKrn, cpuIoWait, and cpuSftIntSrvc. We use VM-type converted values but do not scale them further. We make 64 evaluations, 8 each for scaling with m1.xlarge, c1.medium, m2.xlarge, and m3.xlarge profiles, with one evaluation each with PS-1 and PS-2. RS-1 supported VM prediction with a mean absolute error of .391 VMs per prediction. RS-1 led to scaling profiles that produced 20 under predictions and only 4 over predictions. Of the prediction errors only 1 had a prediction error of 2 VMs. All other predictions were off by only 1 VM.
For RS-2 we conducted two workload scaling tests for each SOA and averaged the percentage increase for cpuUsr, cpuKrn, and cpuIoWait resulting from scaling the number of M VMs. To generate scaled profiles we in-crease these resource utilization variables by this percent-age for each VM added. For 2-core VMs we always scale using 2 VMs at a time since our VMbase c3.xlarge has 4 cores. For RS-2 we made the same 64 evaluations, 8 for scaling with m1.xlarge, c1.medium, m2.xlarge, and m3.xlarge, twice with PS-1 and PS-2 respectively. RS-2 supported VM prediction with a mean absolute error of .328 VMs per prediction. RS-2 led to scaling profiles that produced 17 under predictions and only 4 over predic-tions. All prediction errors were off by one VM only.
RS-1 and RS-2 represent heuristic-based approaches to scaling the resource utilization profile and provide poten-tial solutions to (Research question 3). RS-1 has the ad-vantage of being SOA agnostic and very simple to im-plement. SOA specific scaling data is not required to scale resource profiles. However, predictions were about ~17% less accurate.
5.3 Profile Selection for Equivalent Performance
In addition to scaling converted resource utilization pro-files, determining equivalent infrastructure performance requires a method to select the resource utilization profile
from the set of scaled profiles. It is not sufficient to simp-ly select the first profile that has positive cpuIdle time. A healthy surplus of cpuIdle time is necessary for most SOAs to achieve equivalent performance. In section 3.2, we proposed two heuristic based approaches to resource uti-lization profile selection for equivalent performance: PS-1 (application agnostic) and PS-2 (application aware).
For SWATDEG-det m1.xlarge evaluations, we ob-served that our multiple linear regression model over predicted cpuIdle time. We believe this prediction error occurred because the average SWATDEG-det workload execution time was only 1/10th of the other SOAs. This caused our regression model to over predict cpuIdle time which prevented profile selection. In this case, to correct the SWATDEG-det cpuIdle prediction error we used raw c3.xlarge cpuIdle values for profile selection.
PS-1 uses a simple linear equation to scale cpuIdle time as the VM pool is scaled. The initial cpuIdle value is taken from the VM-type resource utilization conversion. Equa-tion 2 (section 3.2, PS-1) is then used to grow cpuIdle for each additional VM added. The output value represents the cpuIdle threshold for profile selection. Linux CPU time accounting principles are used to calculate the avail-able cpuIdle time. The first profile which exceeds the threshold is selected to determine the minimum number of VMs required for equivalent performance. PS-1 sup-ported VM prediction with a mean absolute error of .375 VMs per prediction. PS-1 led to profile selections that produced 19 under predictions and only 4 over predic-tions. Of the prediction errors only 1 had a prediction error off by 2 VMs. All other predictions were off by only 1 VM.
For PS-2 we conducted two SOA specific scaling tests and averaged the observed percentage increase in cpuIdle time. The initial cpuIdle value is taken from the VM-type resource utilization conversion. The required cpuIdle time is increased by the SOA specific percentage to establish a threshold for profile selection. The first profile that ex-ceeds the threshold is selected to determine the minimum number of VMs required for equivalent performance. PS-2 supported VM prediction with a mean absolute error of .344 VMs per prediction. PS-2 led to profile selections that produced 18 under predictions and only 4 over pre-dictions. All prediction errors were off by one VM only.
PS-1 and PS-2 represent heuristic-based approaches to selecting the correct resource utilization profile which
TABLE 8 EQUIVALENT INFRASTRUCTURE PREDICTIONS
MEAN ABSOLUTE ERROR (# VMS)
SOA / VM-type PS-1 (RS-1) PS-2 (RS-1) PS-1 (RS-2) PS-2 (RS-2)
WEPS .5 .5 .5 .5
RUSLE2 .25 0 .125 .125
SWATDEG-STOC .75 .5 .5 .625
SWATDEG-DET .25 .375 .125 .125
m1.xlarge .375 .25 .25 .25
c1.medium .875 .625 .5 .625
m2.xlarge .25 .25 .25 .25
m3.xlarge .25 .25 .25 .25
Average .4375 .34375 .3125 .34375
Figure 3. CpuUsr c3.xlarge m1.xlarge residuals plot: This figure shows the residual plot of our cpuUsr linear regression model. Predic-tions are randomly distributed around the X-axis indicating that linear regression is appropriate for dataset.

12 IEEE TRANSACTIONS ON CLOUD COMPUTING, TCCSI-2014-10-0471
will provide equivalent SOA workload performance and provide potential solutions to (Research question 1). PS-1 has the advantage of being SOA agnostic and very sim-ple to implement. SOA specific scaling data is not re-quired. Predictions supported by our application agnos-tic approach PS-1 were ~9% less accurate, which is to be expected.
In Section 3.2 we proposed three alternatives for re-source scaling and profile selection each with increasing implementation costs though offering improved accuracy. Mean absolute error (# VMs) for our SOA infrastructure predictions using our resource scaling and profile selec-tion heuristics is summarized in table 8. The combina-tion of PS-1 and RS-2 together provided the most accu-rate predictions with a mean absolute error of only .3125 VMs per prediction. For resource scaling and profile selection, the application agnostic approaches had slight-ly more error but were easy and fast to implement with no scaling tests required. Our evaluation demonstrates improvement with an application specific approach. We posit that training regression models proposed for RS-3 and PS-3 will provide even greater accuracy in exchange for the effort.
5.4 Cost Prediction
We evaluated our workload cost prediction methodolo-gy’s ability to predict workload costs for infrastructure alternatives that provide equivalent performance. For this evaluation we considered 10,000 compute hours of concurrent SOA workload execution (<10 VMs) using m1.xlarge VMs for WEPS, Rusle2, and SwatDeg-det, and 10,000 compute hours of workload execution using c1.medium, m2.xlarge, and m3.xlarge VMs for WEPS, Rusle2, SWATDEG-stoc, and SWATDEG-det. We identi-fied the number of VMs required to achieve equivalent workload performance relative to VMbase=c3.xlarge for 1 compute hour using brute force testing. We omit m1.xlarge SWATDEG-stoc testing because our models predicted c3.xlarge equivalent performance could not be achieved and testing verified this outcome. We apply the fixed instance prices from table 5. Using the allocation required for 1 compute hour we multiply by 10,000 to estimate cost requirements for 10,000 compute hours.
The results of this evaluation appear in table 9. These cost predictions use our application specific PS-2/RS-2
approach. The total error column represents the cost pre-diction error. Observed error was caused by under pre-dicting the number of VMs required for equivalent SOA performance. A perfect cost prediction methodology accurately predicts hosting costs for alternate VM types with no error. Our workload cost prediction methodol-ogy produces a cost estimate only 3.59% below the actu-al hosting cost for equivalent performance using alter-nate VM types. Our results demonstrate how different VM-types offer a range of economic outcomes for SOA workload hosting. For 10,000 hours of scientific model execution our predictions support a maximum potential cost savings of $25,600 (c1.medium vs. m1.xlarge) nearly a 25% cost variance.
6 CONCLUSIONS
This paper describes our workload cost prediction meth-odology to support hosting SOAs using any virtual ma-chine type to provide equivalent performance. Our cost prediction methodology provides architecture alternatives to minimize hosting costs for diverse SOA workloads. Armed with infrastructure decision support, system ana-lysts are better able to make informed decisions that bal-ance cost and performance tradeoffs for SOA deploy-ments.
Harnessing Linux time accounting principles and VM-type resource predictions, our approach predicts the re-quired infrastructure to achieve equal or better workload performance using any VM type (Research question 1). Multiple linear regression is shown to support prediction of key resource utilization variables required for Linux time accounting. Strong predictability is found with coef-ficients of determination of R2=.9993, .989, .9674, .9585 for cpuUsr, cpuKrn, cpuIdle, and cpuIOWait respectively when converting Amazon EC2 VM resource utilization from the c3.xlarge VM-type to m1.xlarge (Research question 2). A series of resource scaling heuristics were tested to support resource utilization predictions from n to n+x VMs. Pro-file selection heuristics were evaluated to support deter-mining infrastructure required to provide equivalent or better performance. The efficacy of these heuristics to predict the required number of VMs to host SOA work-loads while providing equivalent performance was shown to be as low as .3125 VMs (PS-1 / RS-2) (Research ques-tion 3).
We implement a novel resource utilization checkpoint-ing technique which enables capturing composite resource utilization profiles for SOA workloads executed across VM pools. We applied the Trial-and-Better approach [2] to normalize the CPUs backing VMs in our study to re-duce resource profile variance from VM implementation heterogeneity. Given these profiles we demonstrate the use of stepwise multiple linear regression to convert SOA resource utilization profiles to alternative VM types. We offer heuristics to scale our predicted profiles and support infrastructure decisions for equivalent SOA workload per-formance. Our workload cost prediction methodology provides mean absolute error as low as .3125 VMs, and hosting cost estimates to within 3.59% of actual.
In closing we predict all of the following will change: (1) VM-types offered by public cloud providers, (2) price
TABLE 9 HOURLY SOA HOSTING COST PREDICTIONS
WITH ALTERNATE VM-TYPES
SOA m1.xlarge c1.medium m2.xlarge
WEPS $38,400 $22,400 $24,600
RUSLE2 $38,400 $22,400 $24,600
SWATDEG-Stoc n/a $19,600 $24,600
SWATDEG-Det $38,400 $25,200 $28,700
Total $115,200 $89,600 $102,500
m3.xlarge Total error
WEPS $27,000 -$7,600
RUSLE2 $27,000 $0
SWATDEG-Stoc $27,000 -$8,600
SWATDEG-Det $27,000 +$1,300
Total $108,000 -$1,490 (3.59%)

LLOYD ET AL.: HARNESSING RESOURCE UTILIZATION MODELS FOR COST EFFECTIVE INFRASTRUCTURE ALTERNATIVES 13
for these VMs, and (3) the performance levels they pro-vide. Our workload cost prediction methodology helps demystify the plethora of VM types offered by cloud ven-dors and supports future changes. Our approach is gen-eralizable to any VM-type and helps to clarify ambiguous performance rankings (e.g. ECUs, CCUs) with a quantita-tive statistically backed approach which combines both application profiling and VM benchmarking.
7 FUTURE WORK
As future work we propose Resource Scaling Approach 3 (RS-3), and Profile Selection Approach 3 (PS-3). Both ap-proaches should provide additional accuracy by training SOA workload specific models beyond the heuristics pre-sent in section 3.2
RS-3: SCALING MODELS Resource scaling approach (RS-3) involves training a
set of models, one each for cpuUsr, cpuKrn, cpuIoWait, and cpuSftIntSrvc using resource utilization data collected when scaling infrastructure for SOA workloads. Scaling models incorporate resource utilization parameters and the number of CPU cores as dependent variables. One set of models is required for each VM type. The models can then be trained using multiple linear regressions or an alternate machine learning technique. This approach should provide high accuracy with more testing effort.
PS-3: CPUIDLE SCALING MODELS Our third profile selection approach (PS-3) involves
training a set of models with scaling runs to predict how cpuIdle time increases as infrastructure is scaled up. These cpuIdle models incorporate all resource utilization variables from table 1 and the number of CPU cores for scaled deployments as dependent variables. One cpuIdle model is required for each VM type. These models can then be trained using multiple linear regressions or an alternate machine learning technique. This approach should provide high accuracy with more testing effort.
An interesting extension for this work involves devel-oping an approach to predict resource requirements (CPU time, disk I/O, etc.) for SOA workloads based on scien-tific model service parameterization. It is possible to ana-lyze the model parameterizations to characterize the ex-pected duration and computing requirements for service quests before they execute. We have attempted initial trials using the WEPS model and have achieved R2=~.5 using multiple linear regression using only a subset of the model parameters. This white box approach to predict workload resource requirements would enable initial workload profiling (Step 1) to be eliminated. Service re-quests could be analyzed, not run, to predict workload execution costs and deployment infrastructure. Develop-ing this approach requires harnessing domain specific characteristics of service requests and there will likely be limitations to the ability when training models to accu-rately predict model service behavior.
ACKNOWLEDGMENT
This research has been supported in part by funding
from the US Department of Homeland Security’s Long Range program (HSHQDC-13-C-B0018) and the US Na-tional Science Foundation’s Computer Systems Research Program (CNS-1253908).
REFERENCES
[1] “Amazon EC2 Instance Comparison.” [Online]. Available: http://www.ec2instances.info. [Accessed: 05-Feb-2014].
[2] Z. Ou, H. Zhuang, A. Lukyanenko, J. K. Nurminen, P. Hui, V. Mazalov, and A. Yla-Jaaski, “Is the Same Instance Type Created Equal? Exploiting Heterogeneity of Public Clouds,” IEEE Trans. Cloud Comput., vol. 1, pp. 201–214, 2013.
[3] B. Farley, A. Juels, V. Varadarajan, T. Ristenpart, K. D. Bowers, and M. M. Swift, “More for your money: Exploiting Performance Heterogeneity in Public Clouds,” in Proceedings of the Third ACM Symposium on Cloud Computing - SoCC ’12, 2012, pp. 1–14.
[4] D. Armstrong and K. Djemame, “Performance issues in clouds: An evaluation of virtual image propagation and I/O paravirtualization,” Comput. J., vol. 54, pp. 836–849, 2011.
[5] D. Jayasinghe, S. Malkowski, Q. Wang, J. Li, P. Xiong, and C. Pu, “Variations in performance and scalability when migrating n-tier applications to different clouds,” in Proceedings - 2011 IEEE 4th International Conference on Cloud Computing, CLOUD 2011, 2011, pp. 73–80.
[6] G. Kousiouris, T. Cucinotta, and T. Varvarigou, “The effects of scheduling, workload type and consolidation scenarios on virtual machine performance and their prediction through optimized artificial neural networks,” J. Syst. Softw., vol. 84, pp. 1270–1291, 2011.
[7] S. Ostermann, A. Iosup, N. Yigitbasim, R. Prodan, T. Fahringer, and D. Eperma, “A Performance Analysis of EC2 Cloud Computing Serices for Scientific Computing,” in Proceedings 1st International Conference on Cloud Computing (CloudComp ’09), pp. 115–131.
[8] W. Lloyd, S. Pallickara, O. David, J. Lyon, M. Arabi, and K. W. Rojas, “Performance implications of multi-tier application deployments on Infrastructure-as-a-Service clouds: Towards performance modeling,” Future Generation Computer Systems, 2013.
[9] M. S. Rehman and M. F. Sakr, “Initial findings for provisioning variation in cloud computing,” in Proc. - 2nd IEEE Int. Conference on Cloud Computing Technology and Science, CloudCom 2010, 2010, pp. 473–479.
[10] U. Sharma, P. Shenoy, S. Sahu, and A. Shaikh, “A cost-aware elasticity provisioning system for the cloud,” in Proceedings - International Conference on Distributed Computing Systems, 2011, pp. 559–570.
[11] S. Yi, D. Kondo, and A. Andrzejak, “Reducing costs of spot instances via checkpointing in the Amazon Elastic Compute Cloud,” in Proc. - 2010 IEEE 3rd International Conference on Cloud Computing, CLOUD 2010, 2010, pp. 236–243.
[12] A. Andrzejak, D. Kondo, and S. Yi, “Decision Model for Cloud Computing under SLA Constraints,” in IEEE International Symposium on Modeling, Analysis and Simulation of Computer and Telecommunication Systems, 2010, pp. 257–266.
[13] W. Lloyd, S. Pallickara, O. David, J. Lyon, M. Arabi, and K. W. Rojas, “Performance modeling to support multi-tier application deployment to infrastructure-as-a-service clouds,” in Proceedings - 2012 IEEE/ACM 5th International Conference on Utility and Cloud Computing, UCC 2012, 2012, pp. 73–80.
[14] W. Lloyd, S. Pallickara, O. David, J. Lyon, M. Arabi, and K. W. Rojas, “Service isolation vs. consolidation: Implications for IaaS cloud application deployment,” in Proceedings of the IEEE International Conference on Cloud Engineering, IC2E 2013, 2013, pp. 21–30.
[15] W. Lloyd, O. David, M. Arabi, J. C. Ascough II, T. R. Green, J. Carlson, and K. W. Rojas, “The Virtual Machine (VM) Scaler: An Infrastructure Manager Supporting Environmental
14 IEEE TRANSACTIONS ON CLOUD COMPUTING, TCCSI-2014-10-0471
Modeling on IaaS Clouds,” in Proceedings iEMSs 2014 International Congress on Environmental Modeling and Software, p. 8.
[16] Q. Zhang, Q. Zhu, and R. Boutaba, “Dynamic Resource Allocation for Spot Markets in Cloud Computing Environments,” 2011 Fourth IEEE Int. Conf. Util. Cloud Comput., pp. 178–185, 2011.
[17] O. A. Ben-Yehuda, M. Ben-Yehuda, A. Schuster, and D. Tsafrir, “Deconstructing Amazon EC2 spot instance pricing,” in Proceedings - 2011 3rd IEEE International Conference on Cloud Computing Technology and Science, CloudCom 2011, 2011, pp. 304–311.
[18] P. Leitner, W. Hummer, B. Satzger, C. Inzinger, and S. Dustdar, “Cost-efficient and application SLA-aware client side request scheduling in an infrastructure-as-a-service cloud,” in Proc. - 2012 IEEE 5th Int. Conference on Cloud Computing, CLOUD 2012, 2012, pp. 213–220.
[19] J. L. L. Simarro, R. Moreno-Vozmediano, R. S. Montero, and I. M. Llorente, “Dynamic placement of virtual machines for cost optimization in multi-cloud environments,” in Proc. of the 2011 Int. Conference on High Performance Computing and Simulation, HPCS 2011, 2011, pp. 1–7.
[20] D. Villegas, A. Antoniou, S. M. Sadjadi, and A. Iosup, “An analysis of provisioning and allocation policies for infrastructure-as-a-service clouds,” in Proceedings - 12th IEEE/ACM International Symposium on Cluster, Cloud and Grid Computing, CCGrid 2012, 2012, pp. 612–619.
[21] G. Galante and L. C. E. De Bona, “A survey on cloud computing elasticity,” in Proc. - 2012 IEEE/ACM 5th Int. Conf. on Utility and Cloud Computing, UCC 2012, 2012, pp. 263–270.
[22] A. Kejariwal, “Techniques for optimizing cloud footprint,” in 1st IEEE Int. Conf. on Cloud Eng. (IC2E 2013), 2013, pp. 258–268.
[23] P. Saripalli, G. V. R. Kiran, R. R. Shankar, H. Narware, and N. Bindal, “Load prediction and hot spot detection models for autonomic cloud computing,” in Proceedings - 2011 4th IEEE International Conference on Utility and Cloud Computing, UCC 2011, 2011, pp. 397–402.
[24] W. Lloyd, O. David, J. Lyon, K. W. Rojas, J. C. Ascough II, T. R. Green, and J. Carlson, “The Cloud Services Innovation Platform - Enabling Service-Based Environmental Modeling Using IaaS Cloud Computing,” in Proceedings iEMSs 2012 International Congress on Environmental Modeling and Software, 2012, p. 8.
[25] O. David, W. Lloyd, K. W. Rojas, M. Arabi, F. Geter, J. Carlson, G. H. Leavesley, J. C. Ascough II, and T. R. Green, “Model as a Service (MaaS) using the Cloud Service Innovation Platform (CSIP),” in Proc. iEMSs 2014 Int. Congress on Environmental Modeling and Software, p. 8.
[26] “Apache Tomcat.” 2011. [27] USDA-ARS, “Revised Universal Soil Loss Equation Version
2 (RUSLE2).” . [28] L. Hagen, “A wind erosion prediction system to meet user
needs,” J. Soil Water Conserv., vol. 46, no. 2, pp. 105–11, 1991.
[29] P. M. Allen, J. G. Arnold, and W. Skipwith, “Prediction of channel degradation rates in urbanizing watersheds,” Hydrological Sciences Journal, vol. 53. pp. 1013–1029, 2008.
[30] J. Ditty, P. Allen, O. David, J. Arnold, M. White, and M. Arabi, “Deployment of SWAT-DEG as a Web Infrastructure Utilization Cloud Computing for Stream Restoration,” in Proceedings iEMSs 2014 International Congress on Environmental Modeling and Software, p. 6.
[31] R. L. Runkel, C. G. Crawford, and T. a Cohn, “Load Estimator (LOADEST): A FORTRAN program for estimating constituent loads in streams and rivers. Techniques and Methods Book 4 , Chapter A5. U.S. Geological Survey.,” World, p. 69, 2004.
[32] T. Wible, W. Lloyd, O. David, and M. Arabi, “Cyberinfrastructure for Scalable Access to Stream Flow Analysis,” in Proceedings iEMSs 2014 International Congress on Environmental Modeling and Software2, p. 6.
[33] B. Cleland, “An Approach for Using Load Duration Curves in the Development of TMDLs,” Washington DC 24060, 2007.
[34] O. David, J. C. Ascough II, W. Lloyd, T. R. Green, K. W. Rojas, G. H. Leavesley, and L. R. Ahuja, “A software engineering perspective on environmental modeling framework design: The Object Modeling System,” Environ. Model. Softw., vol. 39, pp. 201–213, 2013.
[35] O. David, J. C. Ascough II, G. H. Leavesley, and L. R. Ahuja, “Rethinking modeling framework design: Object Modeling System 3.0,” in Modelling for Environment’s Sake: Proceedings of the 5th Biennial Conference of the International Environmental Modelling and Software Society, iEMSs 2010, 2010, vol. 2, pp. 1190–1198.
Wes J. Lloyd is a research scientist at the De-
partment of Civil Engineering and the Department
of Computer Science at Colorado State Universi-
ty (CSU). Wes works via a cooperative agree-
ment with the US Dept. of Agriculture Natural
Resource Conservation Service (USDA-NRCS)
on the Cloud Services Innovation Platform pro-
ject.
Shrideep Pallickara is an Associate Professor in
the Department of Computer Science at Colorado
State University. Dr. Pallickara’s research inter-
ests are in the area of large-scale distributed
systems specifically, computing and streaming.
Dr. Pallickara is a recipient of the NSF CAREER
award.
Olaf David is a research scientist at the Depart-
ment of Civil Engineering and the Department of
Computer Science at Colorado State University.
Dr. David works with the US Department of Agri-
culture Natural Resources Conservation Service
(USDA-NRCS) on the Cloud Services Innovation
Platform project and the Object Modeling System
(OMS) framework.
Mazdak Arabi is an Associate Professor in the
Department of Civil Engineering at Colorado
State University. Dr. Arabi is teaching and active-
ly conducting research in the water resources
management and planning and environmental
engineering areas. Mazdak received his Ph.D. in
August 2005 from Purdue University.
Tyler Wible is a full time research associate in
Civil Engineering at Colorado State University.
His research focuses on environmental sciences
model services development. His master’s thesis
focused on coupling the watershed models of
SWAT and MODFLOW for cloud deployment to
improve access and scalability of stream flow
analysis tools.
Jeffrey Ditty is completing graduate study in the
department of Civil and Environmental Engineer-
ing at Colorado State University. His research is
involves the study of water resources, and hydro-
logic and environmental sciences.
Ken Rojas is acting director of the Information
Technology Center of the USDA-Natural Re-
sources Conservation Service in Fort Collins,
Colorado. Ken manages development, en-
hancement, and maintenance of 70+ client and
enterprise applications delivering technical assis-
tance to farmers and ranchers across the US.