Embed Size (px)
Citation preview
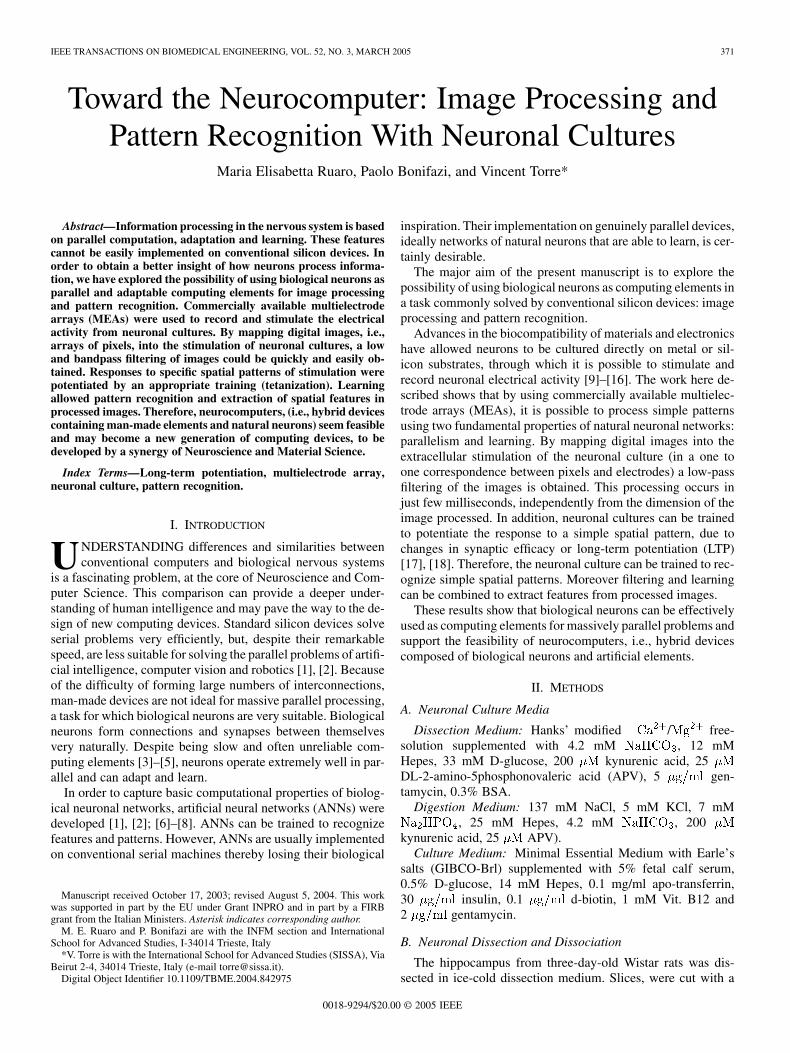
IEEE TRANSACTIONS ON BIOMEDICAL ENGINEERING, VOL. 52, NO. 3, MARCH 2005 371
Toward the Neurocomputer: Image Processing andPattern Recognition With Neuronal Cultures
Maria Elisabetta Ruaro, Paolo Bonifazi, and Vincent Torre*
Abstract—Information processing in the nervous system is basedon parallel computation, adaptation and learning. These featurescannot be easily implemented on conventional silicon devices. Inorder to obtain a better insight of how neurons process informa-tion, we have explored the possibility of using biological neurons asparallel and adaptable computing elements for image processingand pattern recognition. Commercially available multielectrodearrays (MEAs) were used to record and stimulate the electricalactivity from neuronal cultures. By mapping digital images, i.e.,arrays of pixels, into the stimulation of neuronal cultures, a lowand bandpass filtering of images could be quickly and easily ob-tained. Responses to specific spatial patterns of stimulation werepotentiated by an appropriate training (tetanization). Learningallowed pattern recognition and extraction of spatial features inprocessed images. Therefore, neurocomputers, (i.e., hybrid devicescontaining man-made elements and natural neurons) seem feasibleand may become a new generation of computing devices, to bedeveloped by a synergy of Neuroscience and Material Science.
Index Terms—Long-term potentiation, multielectrode array,neuronal culture, pattern recognition.
I. INTRODUCTION
UNDERSTANDING differences and similarities betweenconventional computers and biological nervous systems
is a fascinating problem, at the core of Neuroscience and Com-puter Science. This comparison can provide a deeper under-standing of human intelligence and may pave the way to the de-sign of new computing devices. Standard silicon devices solveserial problems very efficiently, but, despite their remarkablespeed, are less suitable for solving the parallel problems of artifi-cial intelligence, computer vision and robotics [1], [2]. Becauseof the difficulty of forming large numbers of interconnections,man-made devices are not ideal for massive parallel processing,a task for which biological neurons are very suitable. Biologicalneurons form connections and synapses between themselvesvery naturally. Despite being slow and often unreliable com-puting elements [3]–[5], neurons operate extremely well in par-allel and can adapt and learn.
In order to capture basic computational properties of biolog-ical neuronal networks, artificial neural networks (ANNs) weredeveloped [1], [2]; [6]–[8]. ANNs can be trained to recognizefeatures and patterns. However, ANNs are usually implementedon conventional serial machines thereby losing their biological
Manuscript received October 17, 2003; revised August 5, 2004. This workwas supported in part by the EU under Grant INPRO and in part by a FIRBgrant from the Italian Ministers. Asterisk indicates corresponding author.
M. E. Ruaro and P. Bonifazi are with the INFM section and InternationalSchool for Advanced Studies, I-34014 Trieste, Italy
*V. Torre is with the International School for Advanced Studies (SISSA), ViaBeirut 2-4, 34014 Trieste, Italy (e-mail [email protected]).
Digital Object Identifier 10.1109/TBME.2004.842975
inspiration. Their implementation on genuinely parallel devices,ideally networks of natural neurons that are able to learn, is cer-tainly desirable.
The major aim of the present manuscript is to explore thepossibility of using biological neurons as computing elements ina task commonly solved by conventional silicon devices: imageprocessing and pattern recognition.
Advances in the biocompatibility of materials and electronicshave allowed neurons to be cultured directly on metal or sil-icon substrates, through which it is possible to stimulate andrecord neuronal electrical activity [9]–[16]. The work here de-scribed shows that by using commercially available multielec-trode arrays (MEAs), it is possible to process simple patternsusing two fundamental properties of natural neuronal networks:parallelism and learning. By mapping digital images into theextracellular stimulation of the neuronal culture (in a one toone correspondence between pixels and electrodes) a low-passfiltering of the images is obtained. This processing occurs injust few milliseconds, independently from the dimension of theimage processed. In addition, neuronal cultures can be trainedto potentiate the response to a simple spatial pattern, due tochanges in synaptic efficacy or long-term potentiation (LTP)[17], [18]. Therefore, the neuronal culture can be trained to rec-ognize simple spatial patterns. Moreover filtering and learningcan be combined to extract features from processed images.
These results show that biological neurons can be effectivelyused as computing elements for massively parallel problems andsupport the feasibility of neurocomputers, i.e., hybrid devicescomposed of biological neurons and artificial elements.
II. METHODS
A. Neuronal Culture Media
Dissection Medium: Hanks’ modified / free-solution supplemented with 4.2 mM , 12 mMHepes, 33 mM D-glucose, 200 kynurenic acid, 25DL-2-amino-5phosphonovaleric acid (APV), 5 gen-tamycin, 0.3% BSA.
Digestion Medium: 137 mM NaCl, 5 mM KCl, 7 mM, 25 mM Hepes, 4.2 mM , 200
kynurenic acid, 25 APV).Culture Medium: Minimal Essential Medium with Earle’s
salts (GIBCO-Brl) supplemented with 5% fetal calf serum,0.5% D-glucose, 14 mM Hepes, 0.1 mg/ml apo-transferrin,30 insulin, 0.1 d-biotin, 1 mM Vit. B12 and2 gentamycin.
B. Neuronal Dissection and Dissociation
The hippocampus from three-day-old Wistar rats was dis-sected in ice-cold dissection medium. Slices, were cut with a
0018-9294/$20.00 © 2005 IEEE
372 IEEE TRANSACTIONS ON BIOMEDICAL ENGINEERING, VOL. 52, NO. 3, MARCH 2005
razor blade, transferred in a 15-ml centrifuge tube and washedtwice with the dissection medium. Slices were then treated with5 mg/ml Trypsin and 0.75 mg/ml DNAseI in digestion mediumfor 5 min at RT to perform enzymatic dissociation. Trypsinwas then neutralized by 1 mg/ml trypsin inhibitor in dissectionmedium for 15 min on ice. After three washes with the dissec-tion medium, mechanical dissociation was performed by 10 pas-sages through a P1000 blue tip. The cell suspension was thencentrifuged at 100 g for 5 min, and pellet was re-suspended inculture medium.
C. MEA Coating
MEA dishes were coated by overnight incubation at 37with 1 ml of 50 polyornithine (in water). Dishes werethen air-dried and a film of BD-Matrigel (Beckton–Dickinson)was added on the electrode matrix region 20 min before seeding.
D. Cell Culture
100 of cell suspension was laid on the electrode array ofprecoated MEA at the concentration of 8 . Cellswere let to settle at room temperature for 20 min, and then 1 mlof culture medium was added to the MEA and incubated in a5% atmosphere at 37 . After 48 hours 5 cytosine--D-arabinofuranoside (Ara-C) was added to the culture medium,in order to block glial cell proliferation, and re-incubated withgentle rocking.
E. Maintenance of Neuronal Cultures
Neuronal cultures were kept in an incubator providing a con-trolled level of (5%), temperature (37 ) and moisture(95%). Half the medium was changed twice a week. Recordingswere performed, in culture medium, from 3 weeks after seedingfor up to 3 months. To decrease water evaporation and to main-tain sterile conditions outside the incubator [19], during elec-trical recordings dishes were sealed with a cap manufactured byALA Science and distributed by MCS (MultiChannelSystem).After termination of the experiment, usually after 3 to 10 hours,the cap was removed, the medium was changed and the dish wasmoved back to the incubator. The same dish could be used forother experiments in the following days and often repetitivelyover a month. In some cases the same dish was used for morethan four different experiments.
F. Electrical Recordings and Electrode Stimulation
MultiChannelSystems commercially supplied the MEAsystem used for electrical recording. We used a 10 6 mi-croelectrode array, with 500 spacing between adjacentelectrodes. Each titanium-nitride microelectrode has a 30diameter circular shape; its frequency-dependent impedanceis of the order of 100 at 1 kHz. Through gold contactsit is connected to a 60 channel, 10 Hz –3 kHz bandwidthpreamplifier/filter-amplifier (MEA 1060-AMP) which redirectsthe signals toward a further electronic processing (i.e., amplifi-cation and AD conversion), operated by a board lodged withina high performance PC. Signal acquisitions are managed undersoftware control. A thermostat (HC-X) maintains the tempera-ture at 37 underneath the MEA. The MEA provided by MCSis able to digitize in real time at 20 kHz all voltage recordingsobtained from the 60 metal electrodes. One electrode was
used as ground [see Fig. 1(c)]. Sample data were transferredin real time to the hard disk for later processing. Each metalelectrode could be used for recording or for stimulation, butthe present MCS system does not allow a computer-controlledswitch from one mode to the other. Therefore, during a trial,each electrode can be used either for stimulation or recording.Voltage stimulation consisted of bipolar pulses lasting 100 ateach polarity, of amplitude varying from 0.2 V to 1 V, injectedthrough the STG1004 Stimulus Generator. An artifact lasting5 – 20 ms caused by the electrical stimulation was induced onthe recording electrodes but was removed from the electricalrecordings during data analysis.
Tetanus: The tetanus, i.e., a high frequency stimulation, con-sisted of 40 trains of bipolar pulses of lasting for200 delivered every 2 s. Every train consisted of 100 pulsesat 250 Hz. Test stimuli before and after tetanus were deliveredevery 2 s. The tetanus had a spatial profile usually composed bytwo perpendicular bars of electrodes meeting in a corner, or bya vertical or horizontal bar of electrodes.
G. Data Analysis
Acquired data were analyzed using the software MatLab (TheMathworks, Inc., Natick, MA).
Artifact Removal: The artifact at each electrode and for eachpattern of stimulation was estimated and subtracted from thevoltage recordings. The artifact was estimated in the followingway: for each pattern of stimulation and at each electrode thevoltage response was averaged over all trials (typically 50),computed and fitted by 2 polynomials of ninth degree. Usingpolynomials of a lower order provide similar results in most ofexperiments, but not in all, therefore, ninth degree polynomialswere routinely used. The 2 polynomials fitted respectivelythe data in the time windows of 0.5–25 ms and 7.5–100 msafter stimulation. The first polynomial was used to evaluatethe artifact in the time window of 0.5 to 7.5 ms, while thesecond in the time window of 7.5 and 82.5 ms. The artifact,so evaluated, was subtracted from the original voltage signal.The time window between 0 and 1 ms after stimulation was notconsidered in the data analysis.
Computation of Firing Rate ( ) and Related Quantities( , , , , , ): Let
be the voltage recorded at electrode and be thestandard deviation of the noise computed considering a periodof at least 1 s where no spikes were visually observed. The ofthe noise ranged for individual electrodes from 3 to 6 . Ac-tion potentials are considered to be events exceeding 5 . Thefiring rate per electrode is computed with a binwidthof 10 ms centered on . The counts spikes from dif-ferent neurons, making a good electrical contact with electrode
. The average firing rate was computed by aver-aging over the entire set or a subset of identical stimu-lations [Figs. 1(e), (f) and 5(a), (b)]. Let active electrodes be theelectrodes showing a clear electrical contact with the neuronalculture, i.e., where spikes can be recorded. Generally, in orderto have a simple measure of the overall evoked firing rate, thefiring rate spatially averaged was obtained by averaging
over the entire set of active recording electrodes. Onlyfor the computation, shown in Figs. 2(a) and 3(a), the spatialaverage was limited to a row of electrodes. The average overall
RUARO et al.: IMAGE PROCESSING AND PATTERN RECOGNITION WITH NEURONAL CULTURES 373
TABLE I
evoked response is the average of over the en-tire set or a subset of identical stimulations [Figs. 3(b), 4(c),and 5(c), (d)]. The coefficient of variation ofwas computed as the ratio of the standard deviation ofto the . Similarly, the coefficient of variationof was computed as the ratio of the standard devia-tion of to the . In order to describe the propertiesof the neuronal culture to learn and discriminate patterns, theintegrals respectively of , , in a timewindow between 1 and 50 ms have been calculated and definedas, , , . and wereused to compare the average response evoked by an identicalstimulation before and after the tetanization, at a single elec-trode and when all the MEA electrodes were considered [seeFigs. 4(a), 7, respectively]. was used to compare at thelevel of a single-trial the response evoked by different patternsof stimulation, detected by all the MEA electrodes (see Fig. 6).The different quantities used to characterize the firing of the neu-ronal culture are reported in Table I.
H. Pattern of Stimulation and Image Processing
The input to the device is the set of extracellular voltage stim-ulations, delivered at time , applied to the neuronal culturethrough the MEA electrodes. If is an electrode of the MEA,the input is the matrix of voltage stimulations applied to theelectrode . A binary image or pattern of pixels[Fig. 1(a)] is coded into the input of a MEA with elec-trodes [Fig. 1(b)], so that the gray level of pixel of isconverted into the appropriate voltage stimulation of elec-trode . The matrix of voltage signals recorded withthe MEA [Fig. 1(c)], composed of action potentials or spikesproduced by the neurons in the culture [Fig. 1(b)] is analyzed.The output of the device is the matrix . MEAs withat least 54 electrodes providing electrical recordings of clearspikes were used for image processing. For each pattern of elec-trodes used for stimulation, let be the voltage stimulationevoking half of the maximal in the time window be-tween 1 and 11 ms after the onset of the voltage pulse. If isthe corresponding binary image or the pattern to be processedand its gray levels are either 0 or 1, then will beif is 1, 0 otherwise.
Filling Silent Electrodes and Smoothing: The procedurehere described has been applied only for image processing[Figs. 2(b), (c), 3(d), and 8]. MEAs with at least 54 electrodes
providing electrical recordings of clear spikes were used. Whenone electrode is silent, i.e., no spikes can be recorded,the corresponding hole in the processed image is filled in byassigning to the value obtained by averaging the firingrate from neighboring electrodes – i.e., electrodes at a distanceof 500 . of stimulated electrodes was determined byextrapolation from the neighboring active electrodes using (1).All processed images had at most 3 silent electrodes, includingthe one used as ground. The value of was smoothedover the neighboring electrodes ,and .
Processing of 8 Bit Images: The 8-bit image was de-scribed by
where is a 1-bit image. The 8 1-bit images are pro-cessed as described below and their output was summed as de-scribed in (4) and (5).
Scaling of , and Output Color-Coding: Inorder to display processed images using a standard color-coding, the values of , or their combination(for bandpass filtering) were rescaled. The scaling proceduresdescribed in this section refer to the factors and of (2),(4) and (5) (see Results). For low-pass filtered images, thevalues of [Fig. 3(d)] or [Fig. 2(b), upper row]were scaled between 0 and 1 by dividing for the correspondingmaximal value among all electrodes in the time-window1–30 ms. Digitally low-pass filtered images [Fig. 2(b) lowerrow] were scaled between 0 and 1 dividing by their maximalvalue. Bandpass filtered image [Fig. 2(c) top panel] was ob-tained as the difference of calculated in time bins1–6 ms and 4–9 ms and the resulting matrix was scaled be-tween and , dividing by its maximum absolute value.For digitally bandpass filtered images [Fig. 2(c) lower panel],obtained as the difference of digitally low-pass filtered images,the resulting output was scaled between and , dividingfor its maximum absolute value. The color map (of 256 colors)was always scaled between and 1. For 8-bit processedimages [Fig. 8(a)], the values of were scaled asdescribed above, and were added according to (4). When it wasnecessary to compare 8-bit image processing before and aftertetanization [see Fig. 8(b)], the values of obtained
374 IEEE TRANSACTIONS ON BIOMEDICAL ENGINEERING, VOL. 52, NO. 3, MARCH 2005
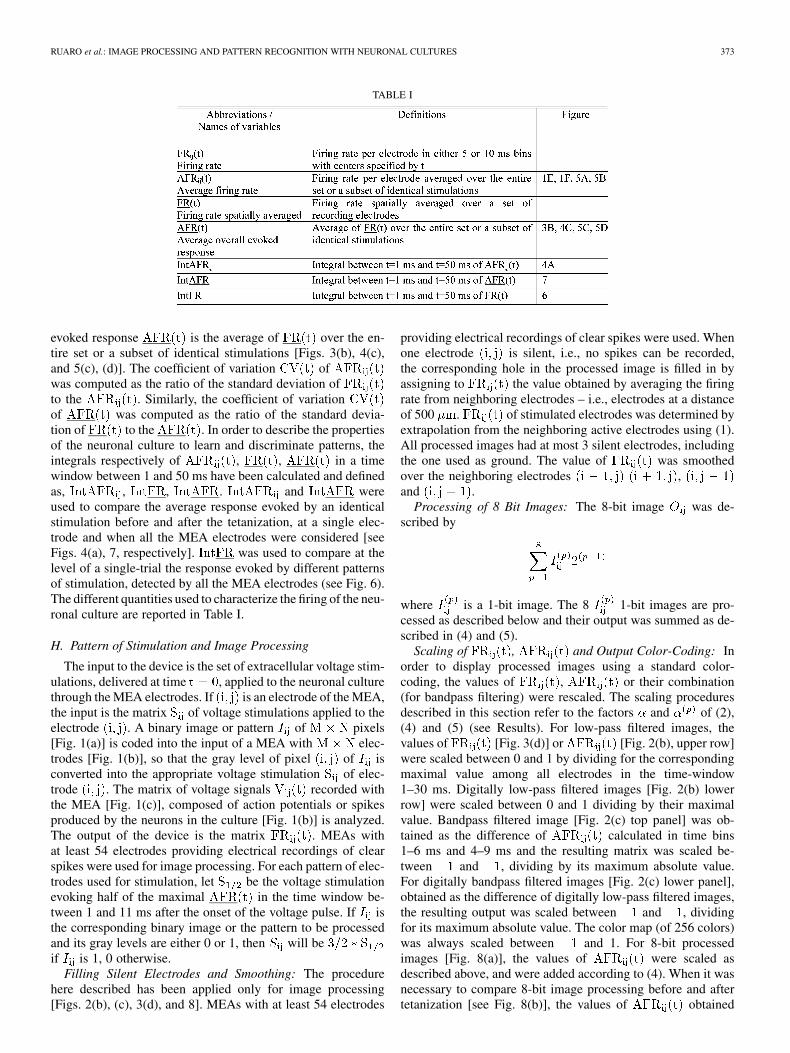
Fig. 1. Mapping an image into the stimulation of a neuronal culture. (A) 10� 6 binary image of a b used as the stimulation pattern of a neuronal culture grownover a 10� 6 MEA manufactured by MCS. (B) Photo of dissociated hippocampal neurons grown on the MEA. Magnification of the neuronal culture on the areamarked by the letters B and C (white rectangle) shown in the inset. (C) Electrical recordings of electrical activity evoked by the electrodes stimulation with bipolarvoltage pulses of 0.9 V. The silent electrode indicated by the arrow was used as the ground. (D) Three voltage recordings evoked by voltage pulses of 0.3, 0.6, and0.9 V when the 6 electrodes of the upper row were stimulated. (E) AFR (t) (see Section II) recorded by a representative electrode in response to five differentvoltage stimulations, as indicated in the panel. (F) AFR (t) recorded by a representative electrode at different repetition rates as indicated in the panel Data in(E) and (F) are averaged from 50 different trials of the same stimulation. Time 0 ms corresponds to the voltage stimulation.
after tetanization were scaled dividing by the maximal value ofmeasured before tetanization. In this case the scaled
values of before tetanization varied between 0 and 1,but, after tetanization, they could be larger than 1. The scaledvalues of were added according to (5). The color map(of 256 colors) was scaled between 0 and 256. Therefore, withthis coding, the processing of images at 1 or 8-bit has the samemap, i.e., the output has 256 different colors.
III. RESULTS
A. The Device
The great majority of MEAs presently available and charge-coupled device (CCD) arrays share the same geometry of asquare grid. Therefore, CCD pixels and MEA electrodes canbe put in a simple one-to-one correspondence preserving theirneighborhood [see Fig. 1]. This observation inspired the designof a new device for processing images and patterns, using aMEA and a neuronal culture grown on its surface. The imageis mapped to the voltage stimulation of the neuronal culture and
the evoked electrical activity is taken as the output of the de-vice. The computing elements of the device are the neurons ofthe culture.
The input to the device is the set of extracellular voltage stim-ulations, delivered at time , applied to the neuronal culturethrough the MEA electrodes, coding for the image to be pro-cessed. The output of the device is the matrix , countingthe number of times in which the extracellular voltage recordedat electrode exceeds a given threshold in the time windowbetween and . Several average quantities – in space,time and over different trials – were computed from (seeSection II for further details).
B. Dynamic Range and Cycle Time
In order to explore the dynamic range and cycle time of theproposed device, a row of electrodes, was repeatedly used forstimulation. Brief (200 ) bipolar voltages with amplitudevarying from 0.3 V to 0.9 V were used. When the voltagestimulation was increased, the frequency of evoked spikesincreased and often spikes with a novel shape, produced bya different neuron, appeared [Fig. 1(d)]. The average firing
RUARO et al.: IMAGE PROCESSING AND PATTERN RECOGNITION WITH NEURONAL CULTURES 375
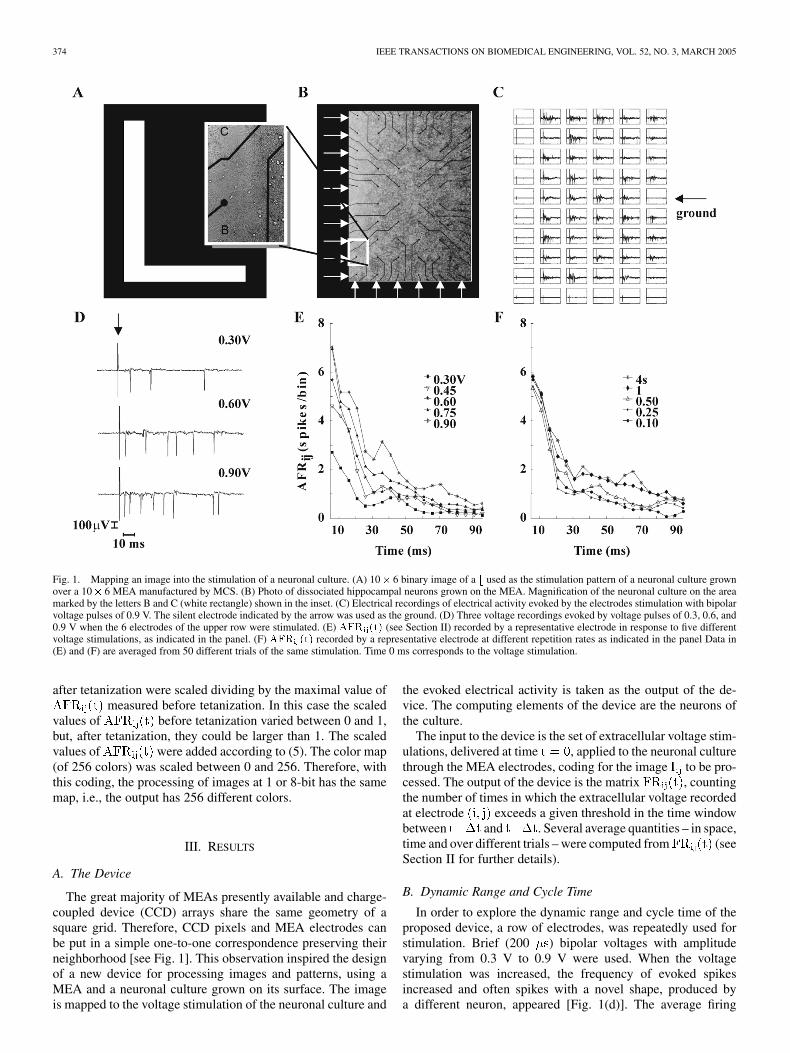
Fig. 2. Spread of excitation through the neuronal culture. (A) AFR (t) averaged by row (AFR(t)) and calculated in the time windows of 1–6, 4–9, 7–12 and12–17 ms after the stimulation of the uppermost row of electrodes with a voltage pulse of 0.6 V. Different symbols indicate experimental data from 6 differentneuronal cultures. Thick curves are theoretical fits calculated from (1). Data obtained in the time windows 1–6 and 4–9 ms were fitted by setting � equal to 0 and� respectively, to 890 and 1240 �m. Data in the time windows 7–12 and 12–17 ms were obtained with � equal to 920 and 1750 and � equal to 980 and 1130 �mrespectively. (B) Comparison between neuronal and digital filtering. (Upper row) images obtained from the processing performed by the neuronal culture in thecorresponding time windows. (Lower row) digital Gaussian filtering of the original binary image with the uppermost row of pixels equal to 1 and 0 elsewhere.(C) (Upper panel) bandpass filtering of the neuronal culture obtained by subtracting the AFRs in the time windows 1–6 and 4–9 ms; (lower panel) digital filteringobtained by convolving the original binary image with the difference of two Gaussians fitting the experimental data in the first and second panel of Fig. 2(a).The thin bars indicate the stimulated electrodes. Color-coding is reproduced at the right side of panel A.
increased with the voltage stimulation [Fig. 1(e)], butits dynamic range was rather narrow: usually no spikes wereevoked by voltage pulses below 0.2 V and a saturating maximalresponse was evoked with voltage stimulation of about 1 V.In the vast majority of the experiments, it was possible todistinguish reliably 4 levels of evoked activity.
In order to determine the cycle time of the device, the samestimulation was repeated at intervals from 0.1 s to 10 s. Witha repetition interval higher than 1 or 2 s the had twocomponents: one which was evoked with a delay of very few msand lasting for about 15 ms, followed by a second lasting around0.1 s. The amplitude of the first component was not significantlyaffected by decreasing the repetition time from 4 to 0.1 s [seeFig. 1(f)]. The amplitude of the second component was clearlydepressed at short repetition times and it was stable for repeti-tion times greater than 4 s (data not shown).
C. Filtering Properties of the Neuronal Culture
The neuronal culture grown on the MEA constitutes a two-di-mensional (2-D) network. Given a homogenous culture, its fil-
tering properties can be simply analyzed by using a long bar asa spatial stimulus, thus reducing a 2-D problem to a much sim-pler one-dimensional. In these experiments the six electrodes ofthe upper row were used for stimulation and the average firingrate evoked in each electrode was measured (see Section II)and averaged by row ( ). At early times, i.e., in the timewindow between 1 and 6 ms [Fig. 2(a)] the decayed as aGaussian function with a standard deviation of about 900corresponding to 1.8 pixels (solid line). In the time window be-tween 4 and 9 ms the electrical activity decayed similarly as aGaussian function but with a larger of about 1200 cor-responding to 2.5 pixels (solid line). A very similar decay andspread of electrical excitation was consistently observed in allthe 24 analyzed neuronal cultures. Data collected from 6 dif-ferent dishes are shown in Fig. 2 as different symbols.
After about 10 ms from the stimulus, the peak of themoved away from the stimulated electrodes and the spread ofthe electrical activity could be described by a Gaussian functioncentered at a distance from the stimulated electrodes [Fig. 2(a),time interval of 7–12 ms]. After 15 ms the evoked electrical ac-
376 IEEE TRANSACTIONS ON BIOMEDICAL ENGINEERING, VOL. 52, NO. 3, MARCH 2005
tivity decayed even further, maintaining a Gaussian-like profile[Fig. 2(a), time interval of 12–17 ms]. While the same quali-tative behavior was observed in all neuronal cultures, after atleast 25 days of cultivation, the speed at which the electrical ac-tivity moved from the stimulating electrodes varied between 70to 250 . The electrical activity in young cultures, i.e.,with less than 20 days, did not propagate well throughout theculture.
A comparison between the spatio-temporal filtering per-formed by the neuronal culture and a digital gaussian filteringis shown in Fig. 2(b). The processing of the bar-stimulus by theneuronal culture represented by the color-coding of the evoked
is shown in the upper row of Fig. 2(b) in the fourtime windows. The corresponding digital convolution of thebinary image correspondent to the bar-stimulus (see Section II)is shown in the lower panels of Fig. 2(b). Between 1 and 9 msthe neuronal filtering is a good approximation of a Gaussiandigital filtering which used the extracted from the fit ofFig. 2(a). Between 7 and 12 ms (and 12–17 ms), the Gaussianfiltering with the values of and (and
and ) shows the same features ofthe neuronal filtering. Therefore, at later times, is anoisy displaced low-pass filtering of the original image.
When an horizontal bar in a different location or a verticalbar of electrodes was used to stimulate the neuronal culture,the electrical activity propagated from the stimulation site withalmost the same properties of the horizontal bar in the upperpart shown in Fig. 2(a) and (b). Experiments where a row (or acolumn) of electrodes or individual electrodes were stimulatedindicate that the spatial-temporal processing of the neuronal cul-ture is – to a first approximation – spatially invariant and can bedescribed by a radial impulse response with a Gaussian functionor kernel, centered on and with a time varying variance
(1)
and is the polar coordinate of the electrode.Therefore, given a 1-bit image the output of the proposed
device varies in time according to
(2)
indicates a 2-D convolution and is a scaling factor(see Section II). As shown in Fig. 2(b), in the time window1–6 ms, the impulse response of the neuronal culture is aGaussian function with a of about 900 , but 2 or 3 mslater with a larger value of of about 1200 . The neuronalfilters obtained in the time windows 1–6 ms and 4–9 ms are lowpass, and their difference is bandpass (see Section II). Bandpassfiltering of the binary image corresponding to the bar-stimulusobtained with the neuronal culture, is shown in the upper panelpanels of Fig. 2(c). This neuronal filtering is rather similarto that obtained by a digital band-pass filtering, shown in thelower panel of Fig. 2(c) (see Section II).
D. Reproducibility of Neuronal Firing and Filtering
Unlike silicon devices, biological neurons are affected by asignificant noise and their reliability is variable. In our neuronalcultures, during repetitions of the same stimulations, the number
of evoked spikes measured by a single electrode was variable,but often the first evoked spike was rather reliable with a jittervarying from just a few hundreds to some ms.
The reproducibility of neuronal firing measured by a singleelectrode was evaluated computing the coefficient of variation
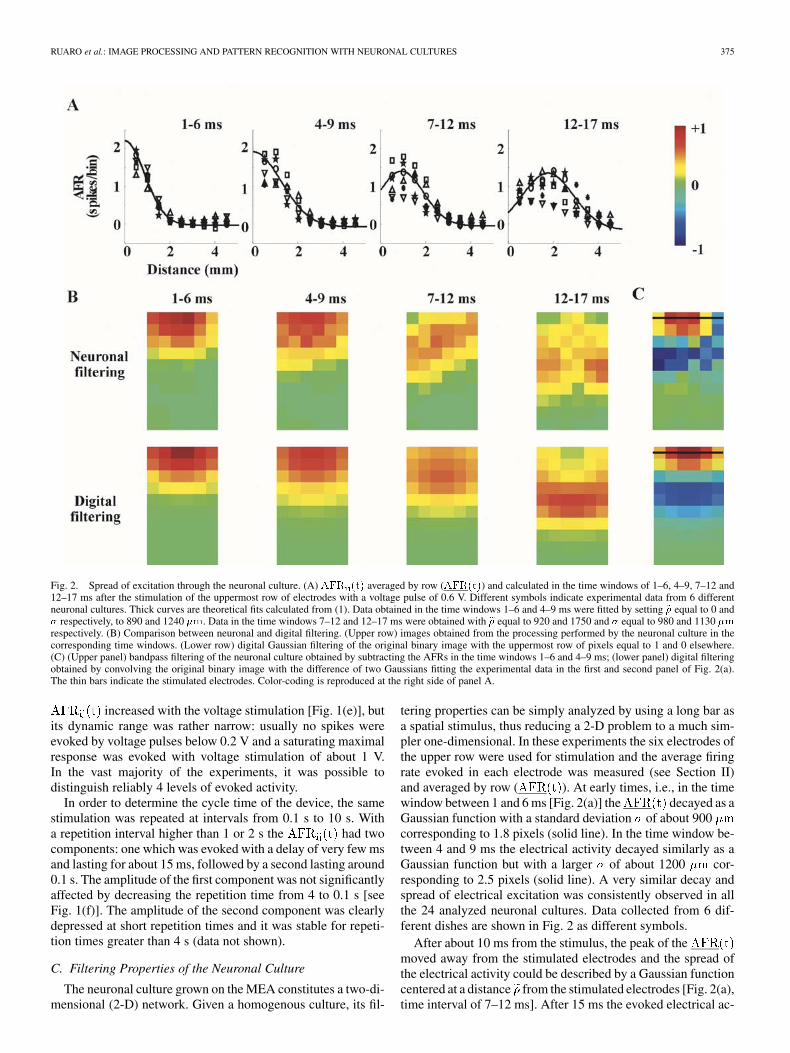
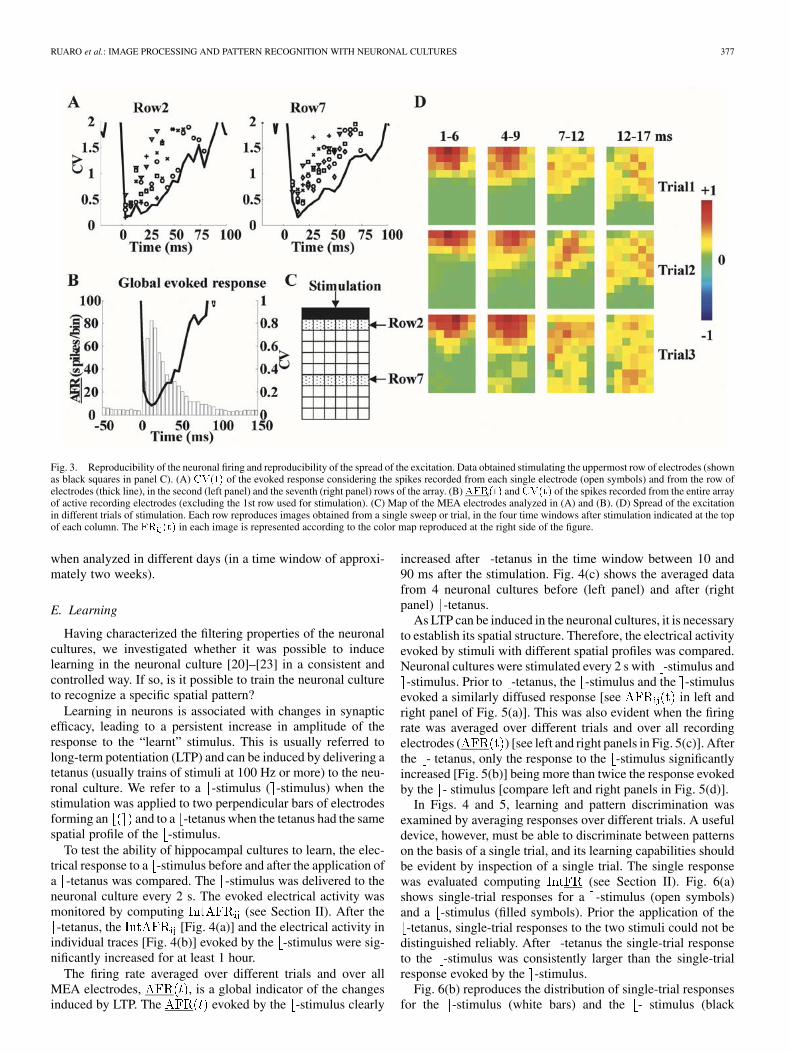
of (see Section II). When the value of CV isless than 0.4, the firing is considered reproducible. Fig. 3(a)shows the of the evoked response recorded by the elec-trodes in the 2nd (left panel, open symbols) and in the 7th (rightpanel, open symbols) rows of the array [Fig. 3(c)]. For the elec-trodes in the 2nd row, in the time window between 1 and 11 ms,the was for most electrodes smaller than 0.5 and couldapproach 0.2. For the electrodes in the 7th row, in the timewindow between 11 and 16 ms, the was always smallerthan 0.75 and could approach 0.3. The value of the wasslightly higher at increasing distances of the recording electrodefrom the stimulation site. These results indicate that there is a“ reliability window “ soon after the stimulation in which the
of the evoked activity at most electrodes is less than 0.5and often around 0.3.
The of the evoked response was further decreased byconsidering all the spikes recorded from a row of electrodes,as shown in Fig. 3(a) (thick line). The was between 0.1and 0.2 for both the electrode rows and the remains lessthan 0.5 for at least 20 ms. When all the spikes recorded fromall electrodes on the MEA were pooled together, the ofthe evoked response was transiently lower than 0.1 (in the timewindow between 11 and 21 ms) and remained less than 0.3 for atleast 45 ms [see Fig. 3(b)]. Therefore, considering larger poolsof neurons, the reliability of the response is improved and ex-tended to larger time windows.
Fig. 3(d) illustrates images obtained from three single trialswhen the uppermost row of electrodes was stimulated with thesame voltage pulse of 0.6 V. While at early times, during the socalled “reliability window,” the spread of the evoked activity indifferent trials was rather similar, at later times, the spread dif-fered from trial to trial consistently with the high of theelectrical recordings [see Fig. 3(a)]. Neuronal cultures obtainedfrom different rats and cultivated in different dishes had a vari-able number of active electrodes, i.e., providing good electricalrecordings, ranging from 30 to 58. All neuronal cultures, witha sufficient number of electrically active electrodes to allow aquantitative characterization of the filtering of the neuronal net-work, i.e., larger than 40, had the same behavior illustrated inFig. 2(a). A very similar decay and spread of electrical excitationwas consistently observed in all the analyzed neuronal cultures.At early times the spread of electrical excitation was character-ized by a Gaussian function with a standard deviation increasingfrom 800 to 1200 in about 3 ms. At later times the be-havior of different neuronal cultures [Fig. 2(a)] was more vari-able than the response of an individual culture [see Fig. 3(a)].These data show that immediately after the voltage stimulationthere is a “good” time window during which the processing ofthe neuronal culture is reproducible leading to a reliable com-putation. This reproducibility is observed among trials from thesame neuronal culture [see Fig. 3] and in different cultures [seeFig. 2(a)]. Since neuronal cultures could be maintained up tosix months, it was possible to repeat several times the same ex-periment in the same culture and to verify that the spread ofelectrical excitation in the same culture had identical properties
RUARO et al.: IMAGE PROCESSING AND PATTERN RECOGNITION WITH NEURONAL CULTURES 377
Fig. 3. Reproducibility of the neuronal firing and reproducibility of the spread of the excitation. Data obtained stimulating the uppermost row of electrodes (shownas black squares in panel C). (A) CV(t) of the evoked response considering the spikes recorded from each single electrode (open symbols) and from the row ofelectrodes (thick line), in the second (left panel) and the seventh (right panel) rows of the array. (B)AFR(t) andCV(t) of the spikes recorded from the entire arrayof active recording electrodes (excluding the 1st row used for stimulation). (C) Map of the MEA electrodes analyzed in (A) and (B). (D) Spread of the excitationin different trials of stimulation. Each row reproduces images obtained from a single sweep or trial, in the four time windows after stimulation indicated at the topof each column. The FR (t) in each image is represented according to the color map reproduced at the right side of the figure.
when analyzed in different days (in a time window of approxi-mately two weeks).
E. Learning
Having characterized the filtering properties of the neuronalcultures, we investigated whether it was possible to inducelearning in the neuronal culture [20]–[23] in a consistent andcontrolled way. If so, is it possible to train the neuronal cultureto recognize a specific spatial pattern?
Learning in neurons is associated with changes in synapticefficacy, leading to a persistent increase in amplitude of theresponse to the “learnt” stimulus. This is usually referred tolong-term potentiation (LTP) and can be induced by delivering atetanus (usually trains of stimuli at 100 Hz or more) to the neu-ronal culture. We refer to a -stimulus ( -stimulus) when thestimulation was applied to two perpendicular bars of electrodesforming an and to a -tetanus when the tetanus had the samespatial profile of the -stimulus.
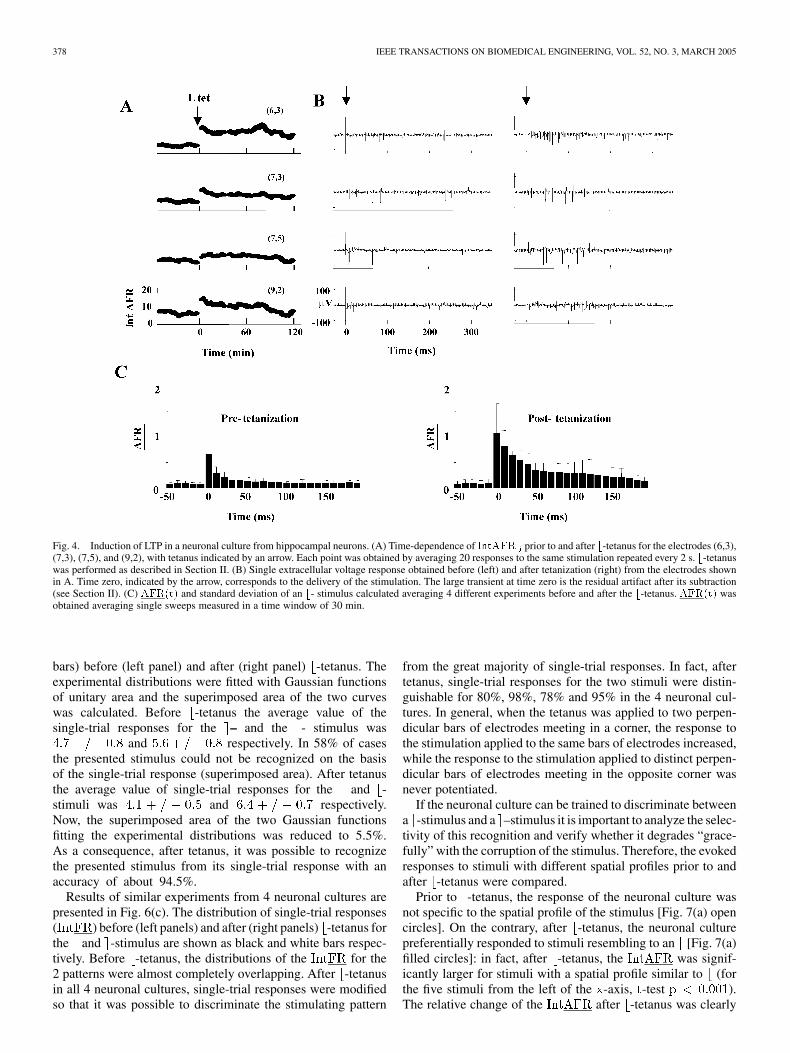
To test the ability of hippocampal cultures to learn, the elec-trical response to a -stimulus before and after the application ofa -tetanus was compared. The -stimulus was delivered to theneuronal culture every 2 s. The evoked electrical activity wasmonitored by computing (see Section II). After the-tetanus, the [Fig. 4(a)] and the electrical activity in
individual traces [Fig. 4(b)] evoked by the -stimulus were sig-nificantly increased for at least 1 hour.
The firing rate averaged over different trials and over allMEA electrodes, , is a global indicator of the changesinduced by LTP. The evoked by the -stimulus clearly
increased after -tetanus in the time window between 10 and90 ms after the stimulation. Fig. 4(c) shows the averaged datafrom 4 neuronal cultures before (left panel) and after (rightpanel) -tetanus.
As LTP can be induced in the neuronal cultures, it is necessaryto establish its spatial structure. Therefore, the electrical activityevoked by stimuli with different spatial profiles was compared.Neuronal cultures were stimulated every 2 s with -stimulus and-stimulus. Prior to -tetanus, the -stimulus and the -stimulus
evoked a similarly diffused response [see in left andright panel of Fig. 5(a)]. This was also evident when the firingrate was averaged over different trials and over all recordingelectrodes ( ) [see left and right panels in Fig. 5(c)]. Afterthe - tetanus, only the response to the -stimulus significantlyincreased [Fig. 5(b)] being more than twice the response evokedby the - stimulus [compare left and right panels in Fig. 5(d)].
In Figs. 4 and 5, learning and pattern discrimination wasexamined by averaging responses over different trials. A usefuldevice, however, must be able to discriminate between patternson the basis of a single trial, and its learning capabilities shouldbe evident by inspection of a single trial. The single responsewas evaluated computing (see Section II). Fig. 6(a)shows single-trial responses for a -stimulus (open symbols)and a -stimulus (filled symbols). Prior the application of the-tetanus, single-trial responses to the two stimuli could not be
distinguished reliably. After -tetanus the single-trial responseto the -stimulus was consistently larger than the single-trialresponse evoked by the -stimulus.
Fig. 6(b) reproduces the distribution of single-trial responsesfor the -stimulus (white bars) and the - stimulus (black
378 IEEE TRANSACTIONS ON BIOMEDICAL ENGINEERING, VOL. 52, NO. 3, MARCH 2005
Fig. 4. Induction of LTP in a neuronal culture from hippocampal neurons. (A) Time-dependence of IntAFR prior to and after b-tetanus for the electrodes (6,3),(7,3), (7,5), and (9,2), with tetanus indicated by an arrow. Each point was obtained by averaging 20 responses to the same stimulation repeated every 2 s. b-tetanuswas performed as described in Section II. (B) Single extracellular voltage response obtained before (left) and after tetanization (right) from the electrodes shownin A. Time zero, indicated by the arrow, corresponds to the delivery of the stimulation. The large transient at time zero is the residual artifact after its subtraction(see Section II). (C) AFR(t) and standard deviation of an b- stimulus calculated averaging 4 different experiments before and after the b-tetanus. AFR(t) wasobtained averaging single sweeps measured in a time window of 30 min.
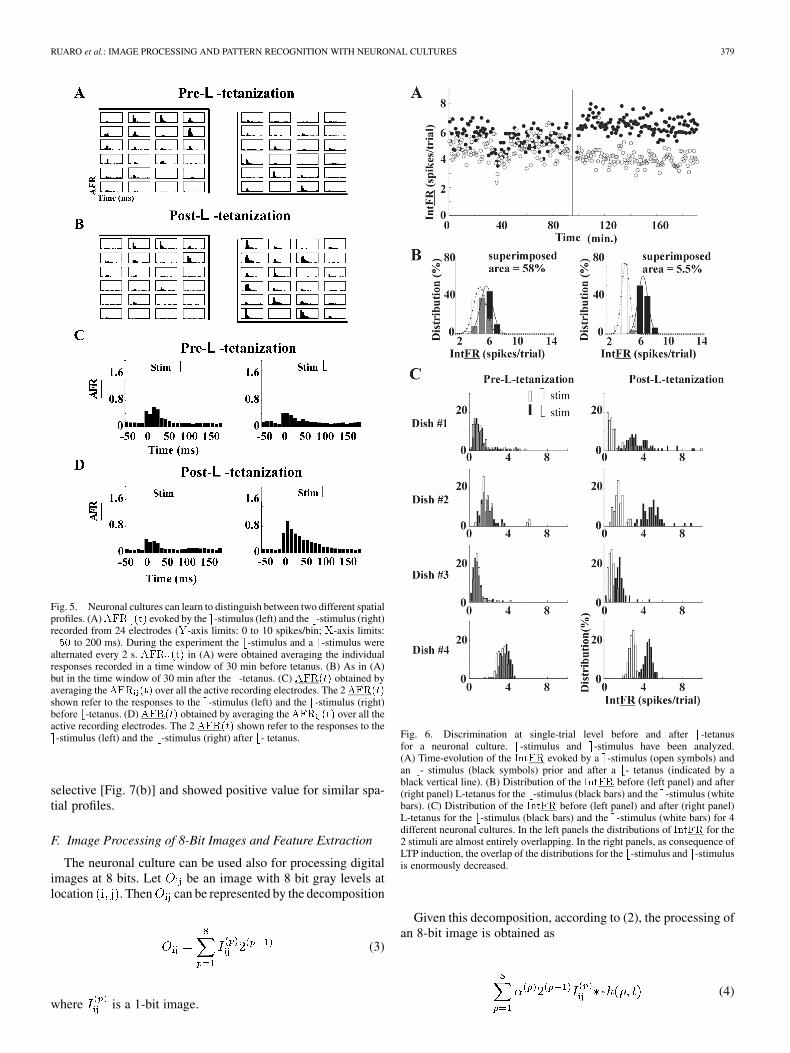
bars) before (left panel) and after (right panel) -tetanus. Theexperimental distributions were fitted with Gaussian functionsof unitary area and the superimposed area of the two curveswas calculated. Before -tetanus the average value of thesingle-trial responses for the – and the - stimulus was
and respectively. In 58% of casesthe presented stimulus could not be recognized on the basisof the single-trial response (superimposed area). After tetanusthe average value of single-trial responses for the and -stimuli was and respectively.Now, the superimposed area of the two Gaussian functionsfitting the experimental distributions was reduced to 5.5%.As a consequence, after tetanus, it was possible to recognizethe presented stimulus from its single-trial response with anaccuracy of about 94.5%.
Results of similar experiments from 4 neuronal cultures arepresented in Fig. 6(c). The distribution of single-trial responses( ) before (left panels) and after (right panels) -tetanus forthe and -stimulus are shown as black and white bars respec-tively. Before -tetanus, the distributions of the for the2 patterns were almost completely overlapping. After -tetanusin all 4 neuronal cultures, single-trial responses were modifiedso that it was possible to discriminate the stimulating pattern
from the great majority of single-trial responses. In fact, aftertetanus, single-trial responses for the two stimuli were distin-guishable for 80%, 98%, 78% and 95% in the 4 neuronal cul-tures. In general, when the tetanus was applied to two perpen-dicular bars of electrodes meeting in a corner, the response tothe stimulation applied to the same bars of electrodes increased,while the response to the stimulation applied to distinct perpen-dicular bars of electrodes meeting in the opposite corner wasnever potentiated.
If the neuronal culture can be trained to discriminate betweena -stimulus and a –stimulus it is important to analyze the selec-tivity of this recognition and verify whether it degrades “grace-fully” with the corruption of the stimulus. Therefore, the evokedresponses to stimuli with different spatial profiles prior to andafter -tetanus were compared.
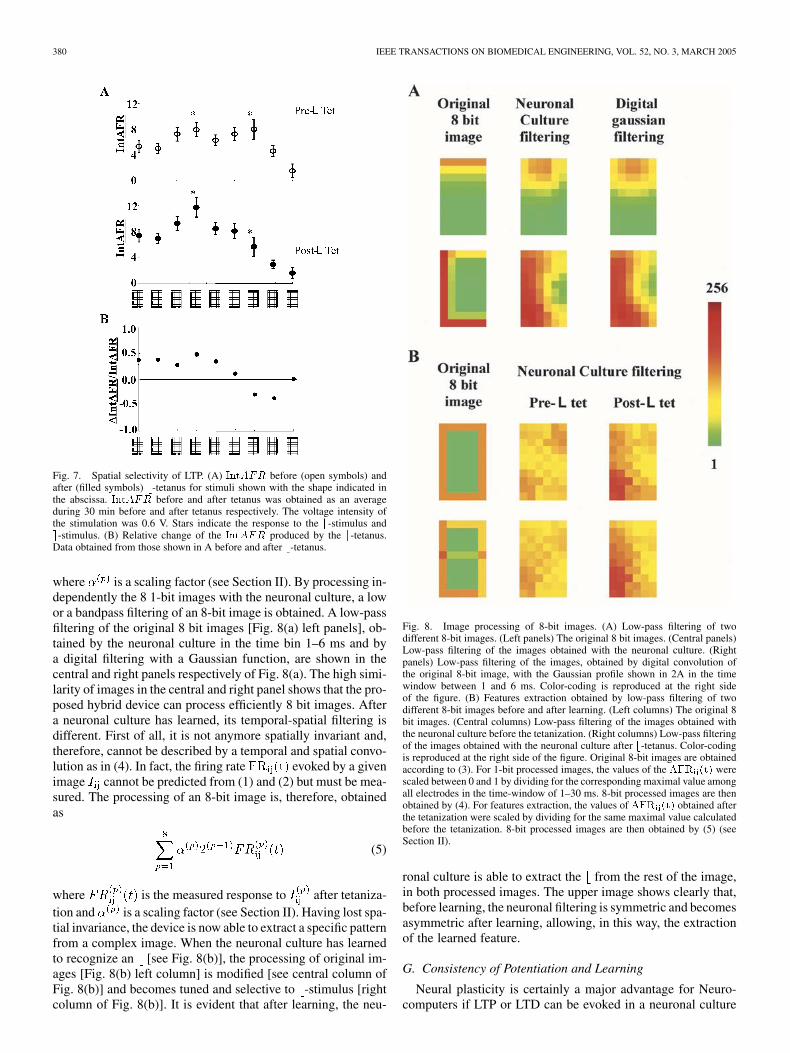
Prior to -tetanus, the response of the neuronal culture wasnot specific to the spatial profile of the stimulus [Fig. 7(a) opencircles]. On the contrary, after -tetanus, the neuronal culturepreferentially responded to stimuli resembling to an [Fig. 7(a)filled circles]: in fact, after -tetanus, the was signif-icantly larger for stimuli with a spatial profile similar to (forthe five stimuli from the left of the -axis, -test ).The relative change of the after -tetanus was clearly
RUARO et al.: IMAGE PROCESSING AND PATTERN RECOGNITION WITH NEURONAL CULTURES 379
Fig. 5. Neuronal cultures can learn to distinguish between two different spatialprofiles. (A)AFR (t) evoked by the e-stimulus (left) and the b-stimulus (right)recorded from 24 electrodes (Y-axis limits: 0 to 10 spikes/bin; X-axis limits:�50 to 200 ms). During the experiment the b-stimulus and a e-stimulus werealternated every 2 s. AFR (t) in (A) were obtained averaging the individualresponses recorded in a time window of 30 min before tetanus. (B) As in (A)but in the time window of 30 min after the b-tetanus. (C) AFR(t) obtained byaveraging theAFR (t) over all the active recording electrodes. The 2AFR(t)shown refer to the responses to the e-stimulus (left) and the b-stimulus (right)before b-tetanus. (D) AFR(t) obtained by averaging the AFR (t) over all theactive recording electrodes. The 2 AFR(t) shown refer to the responses to thee-stimulus (left) and the b-stimulus (right) after b- tetanus.
selective [Fig. 7(b)] and showed positive value for similar spa-tial profiles.
F. Image Processing of 8-Bit Images and Feature Extraction
The neuronal culture can be used also for processing digitalimages at 8 bits. Let be an image with 8 bit gray levels atlocation . Then can be represented by the decomposition
(3)
where is a 1-bit image.
Fig. 6. Discrimination at single-trial level before and after b-tetanusfor a neuronal culture. b-stimulus and e-stimulus have been analyzed.(A) Time-evolution of the IntFR evoked by a e-stimulus (open symbols) andan b- stimulus (black symbols) prior and after a b- tetanus (indicated by ablack vertical line). (B) Distribution of the IntFR before (left panel) and after(right panel) L-tetanus for the b-stimulus (black bars) and the e-stimulus (whitebars). (C) Distribution of the IntFR before (left panel) and after (right panel)L-tetanus for the b-stimulus (black bars) and the e-stimulus (white bars) for 4different neuronal cultures. In the left panels the distributions of IntFR for the2 stimuli are almost entirely overlapping. In the right panels, as consequence ofLTP induction, the overlap of the distributions for the b-stimulus and e-stimulusis enormously decreased.
Given this decomposition, according to (2), the processing ofan 8-bit image is obtained as
(4)
380 IEEE TRANSACTIONS ON BIOMEDICAL ENGINEERING, VOL. 52, NO. 3, MARCH 2005
Fig. 7. Spatial selectivity of LTP. (A) IntAFR before (open symbols) andafter (filled symbols) b-tetanus for stimuli shown with the shape indicated inthe abscissa. IntAFR before and after tetanus was obtained as an averageduring 30 min before and after tetanus respectively. The voltage intensity ofthe stimulation was 0.6 V. Stars indicate the response to the b-stimulus ande-stimulus. (B) Relative change of the IntAFR produced by the b-tetanus.Data obtained from those shown in A before and after b-tetanus.
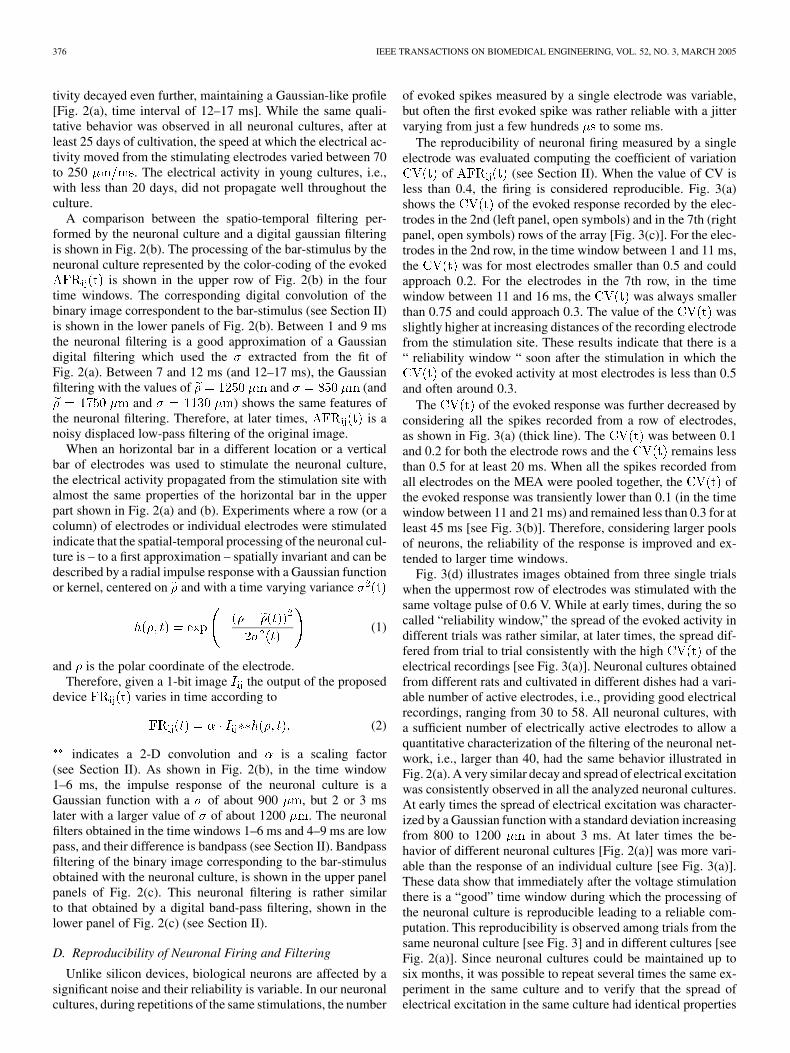
where is a scaling factor (see Section II). By processing in-dependently the 8 1-bit images with the neuronal culture, a lowor a bandpass filtering of an 8-bit image is obtained. A low-passfiltering of the original 8 bit images [Fig. 8(a) left panels], ob-tained by the neuronal culture in the time bin 1–6 ms and bya digital filtering with a Gaussian function, are shown in thecentral and right panels respectively of Fig. 8(a). The high simi-larity of images in the central and right panel shows that the pro-posed hybrid device can process efficiently 8 bit images. Aftera neuronal culture has learned, its temporal-spatial filtering isdifferent. First of all, it is not anymore spatially invariant and,therefore, cannot be described by a temporal and spatial convo-lution as in (4). In fact, the firing rate evoked by a givenimage cannot be predicted from (1) and (2) but must be mea-sured. The processing of an 8-bit image is, therefore, obtainedas
(5)
where is the measured response to after tetaniza-tion and is a scaling factor (see Section II). Having lost spa-tial invariance, the device is now able to extract a specific patternfrom a complex image. When the neuronal culture has learnedto recognize an [see Fig. 8(b)], the processing of original im-ages [Fig. 8(b) left column] is modified [see central column ofFig. 8(b)] and becomes tuned and selective to -stimulus [rightcolumn of Fig. 8(b)]. It is evident that after learning, the neu-
Fig. 8. Image processing of 8-bit images. (A) Low-pass filtering of twodifferent 8-bit images. (Left panels) The original 8 bit images. (Central panels)Low-pass filtering of the images obtained with the neuronal culture. (Rightpanels) Low-pass filtering of the images, obtained by digital convolution ofthe original 8-bit image, with the Gaussian profile shown in 2A in the timewindow between 1 and 6 ms. Color-coding is reproduced at the right sideof the figure. (B) Features extraction obtained by low-pass filtering of twodifferent 8-bit images before and after learning. (Left columns) The original 8bit images. (Central columns) Low-pass filtering of the images obtained withthe neuronal culture before the tetanization. (Right columns) Low-pass filteringof the images obtained with the neuronal culture after b-tetanus. Color-codingis reproduced at the right side of the figure. Original 8-bit images are obtainedaccording to (3). For 1-bit processed images, the values of the AFR (t) werescaled between 0 and 1 by dividing for the corresponding maximal value amongall electrodes in the time-window of 1–30 ms. 8-bit processed images are thenobtained by (4). For features extraction, the values of AFR (t) obtained afterthe tetanization were scaled by dividing for the same maximal value calculatedbefore the tetanization. 8-bit processed images are then obtained by (5) (seeSection II).
ronal culture is able to extract the from the rest of the image,in both processed images. The upper image shows clearly that,before learning, the neuronal filtering is symmetric and becomesasymmetric after learning, allowing, in this way, the extractionof the learned feature.
G. Consistency of Potentiation and Learning
Neural plasticity is certainly a major advantage for Neuro-computers if LTP or LTD can be evoked in a neuronal culture
RUARO et al.: IMAGE PROCESSING AND PATTERN RECOGNITION WITH NEURONAL CULTURES 381
consistently and in a repeated way. As shown by Jimbo et al.[23] when a tetanizing train of pulses is applied through a singleelectrode of a MEA both LTP and LTD can be observed. The in-duction of LTP occurred when neurons before tetanus fired in acorrelated way; while LTD occurred when the firing of neuronswere poorly correlated. Therefore, when a single electrode wasused the induction of LTP or LTD could not be controlled butdepended from the intrinsic connectivity of the network. Thissituation is not satisfactory if neuronal cultures have to be usedfor information processing and learning. Therefore, we lookedfor experimental conditions in which LTP could be induced con-sistently. LTP described in previous sections was always evokedwhen the same tetanizing pulse was applied to many electrodes,more than 10, with a spatial profile of two perpendicular bars.With this pattern of stimulation, LTP was successfully inducedin 10 (over 12 tested) neuronal cultures. LTP could be evoked inthe same neuronal culture on different days over a period of 6weeks. When the tetanus was applied through a smaller numberof electrodes, i.e., less than 7, LTP was not consistently inducedand both LTP and LTD was observed. When a bar-tetanus wasdelivered, LTP was never induced in 6 experiments. In 3 ex-periments performed with young (less than 20 days) neuronalcultures, stimulation applied to a bar of electrodes, either hor-izontal or vertical, produced an electrical excitation confinedaround the electrodes used for stimulation, and LTP could notbe induced by an - tetanus. In one dish the two tetanization pro-tocols were combined: a bar-tetanus was first applied and, after2 hours, an - tetanus was applied. The response to the - stim-ulus after the bar-tetanus was unchanged, while the - tetanusclearly induced LTP. LTP could be evoked in the same neuronalculture, on different days over a period of 6 weeks. When 50 mi-cromolar DL-2-amino-5-phosphonovaleric acid (APV), a wellknown blocker of NMDA channels, was added to the extracel-lular medium bathing the neuronal culture, the evoked electricalactivity did not spread significantly from the electrodes used forstimulation, as in cortical neuronal cultures [24]. Under theseconditions LTP could not be induced in the neuronal cultures.
IV. DISCUSSION
The work described here demonstrates that, by growing neu-ronal cultures over multi electrode arrays (MEA), a new hybrid-computing device, composed of biological neurons and metalelectrodes, can be foreseen. The biophysical mechanisms un-derlying the low-pass and band-pass filtering of digital images,here described, originate from membrane properties of culti-vated neurons and their mode of interaction. Synaptic proper-ties limit and shape the propagation of action potentials in theculture. The combination of these biophysical mechanisms de-termines the exact parameters of the filtering. The consistencyof the experimental set up was discussed in the two sectionson the reproducibility of neuronal filtering and consistency ofpotentiation and learning. The major difference with previouswork on neuronal culture grown on MEA [23]–[25] is the con-trolled induction of LTP and its use for pattern recognition. Thepresented results, show, in our opinion, that neuronal culturesgrown on MEA can constitute the basis for the development ofNeurocomputers, possibly new computing devices.
A. Comparison With Previous Work
The present work is a continuation of previous analysis of thebehavior of neuronal cultures grown on MEAs [23]–[25] andconfirms several previous observations on how the evoked elec-trical activity spreads throughout the neuronal culture. Jimboet al. [23] have shown that when a tetanizing train of pulses isapplied through a single electrode of a MEA, both LTP and LTDcan be observed and that the induction of LTP or LTP dependedfrom the intrinsic connectivity of the network. The present workshows that, when many electrodes are used for tetanizing, LTPis preferentially induced and, therefore, the induction of LTPcan be controlled. The controlled induction of LTP allows theuse of neuronal cultures for pattern recognition (see Figs. 5 and6) and opens the way for using neuronal cultures as new com-puting devices, i.e., Neurocomputers. Although the molecularmechanisms controlling the induction of LTP and/or LTD havenot yet been fully revealed [26], it is well established that amoderate elevation of intracellular favors the inductionof LTD, while a larger increase is more likely to induce LTP. Asneuronal firing leads to an elevation of intracellular , it isnot surprising that a massive electrical excitation preferably in-duces LTP instead of LTD. As stated in the Results section, LTPwas induced in 10 over 12 tested neuronal cultures. However,in all neuronal cultures, after an -tetanus, the discriminabilitybetween an and -stimulus increased. Therefore, in all testedcultures learning was observed, provided that the tetanus wasapplied through a sufficiently large number of electrodes. LTPwas not observed when the frequency of tetanization was lowerthan 100 Hz.
B. Reproducibility and Reliability of Neuronal Firing
The reliability of the evoked response increases by poolingthe electrical activity recorded from a larger number of neu-rons, as shown by the decrease of the calculated for asingle electrode, a row of electrodes or the 60 electrodes of theMEA. These conclusions, drawn from an investigation in a dis-sociated culture of hippocampal neurons, are remarkably sim-ilar to those obtained in an isolated leech ganglion (5) and ina semi-intact leech [27]. In the leech nervous system, motoneu-rons coactivated during the same behavioral reaction, fire spikesin an almost statistically independent way. As a consequence ofstatistical independence pooling, the electrical activity over allco-activated motoneurons makes highly variable spike trains un-derlying reproducible motor reactions.
These results suggest that, analogously to nervous systems,reliability and reproducibility of neurocomputers can be ob-tained by pooling the neuronal electrical activity over popula-tions of neurons, as already shown by several previous inves-tigations with intelligent prostheses [28]–[31]. The extent ofpooling depends on the task to be solved: in fact, when it is nec-essary to discriminate between patterns, it is convenient to av-erage the neuronal activity over a very large number of neurons(of the order of 100) in order to obtain a successful discrimina-tion over a single trial, as shown in Fig. 6. When the MEA isused to filter images, averaging is restricted to neurons recordedfrom the same electrode, i.e., less than 6 or so different neurons.In this case the resulting computation is noisier. In a populationof neurons firing spikes in an almost unrelated way, the CVdecreases as the square root of [32]. Therefore, if each neuron
382 IEEE TRANSACTIONS ON BIOMEDICAL ENGINEERING, VOL. 52, NO. 3, MARCH 2005
has a CV between 0.5 and 1 [27], a good reproducibility – witha CV of less than 0.1 – can be obtained by pooling the electricalactivity of 100–1000 neurons, i.e., the same order of magnitudeof neurons thought to be present in a column in the cortex [33].This requirement may pose severe constraints on the construc-tion of MEA and on the development of future Neurocomputers.
C. Limitations of the Tested Device
The tested device, based on the MEA supplied by MultiChan-nelSystem, has several limitations, which may be overcome byfuture technological improvements. First of all, in the presentrelease it is not possible to stimulate and record simultaneouslyfrom the same electrode, contrary to the MEA developed byJimbo and coworkers [25]. As a consequence, the electrical ac-tivity evoked in the stimulated electrode cannot be measuredbut has to be interpolated (see Section II) from the neighboringrecording electrodes. In addition, switching between recordingand stimulation cannot be obtained via software and has to beperformed manually, reducing the possible experimentation andthe analysis of parallel processing with the neuronal culture. Re-cently new circuits for distributing stimuli to all electrodes elec-tronically (from Multichannel Systems, MEA1060-BC) and forstimulating and recording on the same electrode [34] have beendeveloped. These circuits will allow to overcome the limitationsdiscussed above. The implementation of on-line analysis [21],[35] allows the exploration of alternative parallel processing andlearning with the neuronal culture.
Another disadvantage of the present device, possibly sharedby a large variety of Neurocomputers, is the presence of silentelectrodes or of electrodes making good electrical contacts witha limited number of neurons. The ideal device is composedof electrodes all making good electrical contact with a largenumber of healthy neurons. Since it is necessary to measure in-dividual spikes and not field potentials, the number of neurons ingood electrical contact with each electrode cannot be too high.Therefore, it is necessary to develop standard protocols in orderto have MEA with almost all electrodes making good electricalcontact with approximately the same number of neurons.
The training procedure, by which a neurocomputer learns torecognize a spatial feature, is simply an appropriate tetanus, i.e.,a relatively simple procedure, representing, therefore, an ob-vious advantage of the Neurocomputer. On the other side theNeurocomputer – at least in its present form – seems to be pri-marily a coprocessor, which cannot be easily programmed for adifferent tasks, as usual digital processor can. After the declineof LTP, the neurocomputer can be trained to learn a new pat-tern and, therefore, can be reprogrammed and becomes reusable.Several issues, however, must be addressed such as the dura-tion of induced LTP, the possibility of encoding new inputs andto erase stored information – possibly by inducing LTD. Oncethese issues will be properly addressed, the exploitation of LTP,as here demonstrated, and of LTD [18], [36], may provide anatural implementation of algorithms based on artificial neuralnetworks (ANN).
D. Future of Neurocomputers
The use of biological neurons as computing devices opens anew avenue in which computer science can capitalize on the ex-pertise and technology of cell biology and genetic engineering.
Taking advantage of stem cell technology [37]–[39] we aretrying to obtain a standard source of neurons in order to elimi-nate the variability intrinsic to individual rats, possibly leadingto computing devices with a much higher reproducibility. Stemcell technology could provide also populations of neuronswith specific properties, for example neurons that releaseselected neurotransmitters. In this way neuronal cultures withcontrolled ratios of inhibitory and excitatory neurons could beconstructed. The possibility of guiding neuronal growth alongspecific spatial directions [40]–[43] will allow the fabricationof large variety of spatial filters, imitating the receptive fieldproperties of neurons in early visual area [44]. Neurocomputerscan become promising new computing devices if their relia-bility can be increased. In order to do so, besides using stemcell technology for obtaining a standardized source of neurons,it will be necessary to automate with appropriate robots all thesubsequent procedures necessary for preparing and maintainingneuronal cultures. It will be very important to standardize thehandling of MEAs, neuron deposition on the MEAs and theirmaintenance.
ACKNOWLEDGMENT
The authors would like to thank Dr. E. Cherubini andDr. G. Musso for helpful comments and D. Dean for carefullyreading the manuscript.
REFERENCES
[1] D. Marr, Vision: A Computational Investigation into the Human Repre-sentation and Processing of Visual Information. San Francisco, CA:Freeman, 1982.
[2] D. E. Rumelhart and J. L. McClelland, Explorations in Parallel Dis-tributed Processing. Cambridge, MA: MIT Press, 1988.
[3] J. G. Nicholls, B. G. Wallace, A. R. Martin, and P. A. Fuchs, FromNeuron to Brain: A Cellular and Molecular Approach to the Functionof the Nervous System, 4th ed. Sunderland, MA: Sinauer, 2000.
[4] M. N. Shadlen and W. T. Newsome, “Noise, neural codes and corticalorganization,” Curr. Opin. Neurobiol., vol. 4, pp. 569–579, 1994.
[5] D. Zoccolan, G. Pinato, and V. Torre, “Highly variable spike trains un-derlie reproducible sensory-motor responses in the medicinal leech,” J.Neurosci., vol. 22, pp. 10 790–10 800, 2002.
[6] J. Hertz, A. Krogh, and R. G. Palmer, “Introduction to the theory ofneural computation,” in Studies in the Sciences of Complexity. SantaFe, NM: Santa Fe Institute, 1991, vol. 1.
[7] J. J. Hopfield, “Neural networks and physical systems with emergentcollective computational ability,” Proc. Nat. Acad. Sci., vol. 79, pp.2554–2558, 1982.
[8] M. Minsky and S. Papert, Perceptrons: An Introduction to Computa-tional Geometry. Cambridge, MA: MIT Press, 1988.
[9] G. W. Gross, E. Rieske, G. W. Kreutzberg, and A. Meyer, “A new fixed-array multimicroelectrode system designed for long-term monitoring ofextracellular single unit neuronal activity in vitro,” Neurosci. Lett., vol.6, pp. 101–105, 1977.
[10] J. Pine, “Recording action potentials from cultured neurons with extra-cellular microcircuit electrodes,” J. Neurosci. Meth., vol. 2, pp. 19–31,1980.
[11] J. L. Novak and B. C. Wheeler, “Recording from the aplysia abdominalganglion with a planar microelectrode array,” IEEE Trans, Biomed. Eng.,vol. BME-33, pp. 196–202, 1986.
[12] Y. Jimbo and A. Kawana, “Electrical stimulation and recording from cul-tured neurons using a planar electrode array,” Bioelectrochem. Bioener-getics, vol. 29, pp. 193–204, 1992.
[13] S. Martinoia, M. Bove, G. Carlini, C. Ciccarelli, M. Grattarola, C.Storment, and G. Kovacs, “A general purpose system for long-termrecording from a microelectrode array coupled to excitable cells,” J.Neurosci. Meth., vol. 48, pp. 115–121, 1993.
[14] S. Vassanelli and P. Fromherz, “Neurons from rat brain coupled to tran-sistors,” Appl. Phys. A, vol. 65, pp. 85–88, 1997.
RUARO et al.: IMAGE PROCESSING AND PATTERN RECOGNITION WITH NEURONAL CULTURES 383
[15] G. Zeck and P. Fromherz, “Noninvasive neuroelectronic interfacing withsynaptically connected snail neurons immobilized on a semiconductorchip,” Proc. Nat. Acad. Sci., vol. 98, pp. 10 457–10 462, 2001.
[16] P. Bonifazi and P. Fromherz, “Silicon chip for electronic communicationbetween nerve cells by noninvasive interfacing and analog-digital pro-cessing,” Advanced Mater., vol. 14, pp. 1190–1193, 2002.
[17] T. V. P. Bliss and G. L. Collingridge, “A synaptic model of memory:Long-term potentiation in the hippocampus,” Nature, vol. 361, pp.31–39, 1993.
[18] O. Paulsen and T. J. Sejnowski, “Natural patterns of activity and long-term synaptic plasticity,” Curr. Opin. Neurobiol., vol. 10, pp. 172–179,2000.
[19] S. M. Potter and T. B. DeMarse, “A new approach to neural cell culturefor long-term studies,” J. Neurosci. Meth.., vol. 110, pp. 17–24, 2001.
[20] S. Marom and G. Shahaf, “Development, learning and memory in largerandom networks of cortical neurons: Lessons beyond anatomy,” Quart.Rev. Biophys., vol. 35, pp. 63–87, 2002.
[21] G. Shahaf and S. Marom, “Learning in networks of cortical neurons,” J.Neurosci., vol. 21, pp. 8782–8788, 2001.
[22] W. L. Rutten, “Selective electrical interfaces with the nervous system,”Annu. Rev. Biomed. Eng., vol. 4, pp. 407–452, 2002.
[23] Y. Jimbo, T. Tateno, and H. Robinson, “Simultaneous induction ofpathway-specific potentiation and depression in networks of corticalneurons,” Biophys. J., vol. 76, pp. 670–678, 1999.
[24] Y. Jimbo, A. Kawana, P. Parodi, and V. Torre, “The dynamics of a neu-ronal culture of dissociated cortical neurons of neonatal rats,” Biol. Cy-bern., vol. 83, pp. 1–20, 2000.
[25] Y. Jimbo, N. Kasai, K. Torimitsu, T. Tateno, and H. P. C. Robinson, “Asystem for MEA-based multisite stimulation. Biomedical engineering,”IEEE Trans. Biomed. Eng., vol. 50, no. 2, pp. 241–248, Feb 2003.
[26] M. Sheng and M. J. Kim, “Postsynaptic signaling and plasticity mecha-nisms,” Science, vol. 298, no. 5594, pp. 776–80, 2002.
[27] I. Arisi, D. Zoccolan, and V. Torre, “Distributed motor pattern under-lying whole-body shortening in the medicinal leech,” J. Neurophysiol.,vol. 86, pp. 2475–2488, 2001.
[28] J. Wessberg, C. R. Stambaugh, J. D. Kralik, P. D. Beck, M. Laubach, J.K. Chapin, J. Kim, S. J. Biggs, M. A. Srinivasan, and M. A. Nicolelis,“Real-time prediction of hand trajectory by ensembles of cortical neu-rons in primates,” Nature, vol. 408, no. 6810, pp. 361–365, 2000.
[29] M. A. Nicolelis, “Brain-machine interfaces to restore motor function andprobe neural circuits,” Nat. Rev. Neurosci., vol. 4, no. 5, pp. 417–422,2003.
[30] A. E. Grumet, J. L. Wyatt Jr., and J. F. Rizzo, III, “Multi-electrode stim-ulation and recording in the isolated retina,” J. Neurosci. Meth., vol. 101,no. 1, pp. 31–42, 2000.
[31] R. A. Normann, E. M. Maynard, P. J. Rousche, and D. J. Warren, “Aneural interface for a cortical vision prosthesis,” Vis. Res., vol. 39, no.15, pp. 2577–87, 1999.
[32] A. Papoulis, Probability, Random Variables and Stochastic Pro-cesses. New York: McGraw-Hill, 1984.
[33] V. B. Mountcastle, “The columnar organization of the neocortex,” Brain,vol. 120, pp. 701–722, 1997.
[34] D. A. Wagenaar and S. M. Potter, “A versatile all-channel stimulatorfor electrode arrays, with real-time control,” J. Neural Eng., vol. 1, pp.39–45, 2004.
[35] T. B. DeMarse, D. A. Wagenaar, A. W. Blau, and S. M. Potter, “The neu-rally controlled animat: Biological brains acting with simulated bodies,”Autonomous Robot., vol. 11, pp. 305–310, 2001.
[36] D. J. Linden and J. A. Conner, “Long-term synaptic depression,” Ann.Rev. Neurosci., vol. 18, pp. 319–357, 1995.
[37] T. Barberi, P. Klivenyi, N. Y. Calingasan, H. Lee, H. Kawamata, K.Loonam, A. L. Perrier, J. Bruses, M. E. Rubio, N. Topf, V. Tabar, N.L. Harrison, M. F. Beal, M. A. Moore, and L. Studer, “Neural subtypespecification of fertilization and nuclear transfer embryonic stem cellsand application in parkinsonian mice,” Nat. Biotechnol., vol. 21, pp.1200–1207, 2003.
[38] H. Kawasaki, H. Suemori, K. Mizuseki, K. Watanabe, F. Urano, H. Ichi-nose, M. Haruta, M. Takahashi, K. Yoshikawa, S. Nishikawa, N. Nakat-suji, and Y. Sasai, “Generation of dopaminergic neurons and pigmentedepithelia from primate ES cells by stromal cell-derived inducing ac-tivity,” Proc. Nat. Acad. Sci., vol. 99, pp. 1580–1585, 2002.
[39] J. J. Westmoreland, C. R. Hancock, and B. G. Condie, “Neuronal devel-opment of embryonic stem cells: A model of GABAergic neuron dif-ferentiation,” Biochem. Biophys. Res. Commun., vol. 284, pp. 674–680,2001.
[40] J. C. Chang, G. J. Brewer, and B. C. Wheeler, “Modulation of neuralnetwork activity by patterning,” Biosensors Bioelectron., vol. 16, pp.527–533, 2001.
[41] F. Nakamura, R. G. Kalb, and S. M. Strittmatter, “Molecular basisof semaphorin-mediated axon guidance,” J. Neurobiol., vol. 44, pp.219–229, 2000.
[42] J. A. Raper, “Semaphorins and their receptors in vertebrates and inver-tebrates,” Curr. Opin. Neurobiol., vol. 10, pp. 88–94, 2000.
[43] M. Tessier-Lavigne and C. S. Goodman, “The molecular biology of axonguidance,” Science, vol. 274, pp. 1123–1133, 1996.
[44] D. H. Hubel and T. N. Wiesel, “Early exploration of the visual cortex,”Neuron, vol. 20, pp. 401–412, 1998.
Maria Elisabetta Ruaro received the Laurea degreein biological science from the University of Trieste,Trieste, Italy, in 1984.
In 1987, she worked at the EMBL in Heidelbergin the group of Lennard Philipson, where she learneddifferent cell biology and molecular biology tech-niques. From 1991 to 1997, she was responsible forthe microinjection facility at the ICGEB-UNIDO atthe Area Science Park while maintaining scientificcollaboration with scientific groups in Italy, U.K.,and USA. From 1998 to 2000, she was a Scientific
Collaborator at the LNCIB, where she studied two growth arrest specific genesGas1 and Gas6, and became an expert in cell culture of different cell type andcell biology techniques. Since 2001, she has been a Research Fellow in thegroup of V. Torre at the International School for Advanced Studies where sheparticipated to the neurocomputer project in particular to the cell culture andelectrophysiological aspects. During this period she visited the laboratory ofDr. Studer at the Sloan Kettering Institute in New York where she learned themethodology to differentiate neurons from embryonic stem cells. Since 1996she has been teaching cell biology, as an external teacher, at the University ofUdine (IT) and Trieste (IT).
Paolo Bonifazi was born in Sassoferrato, Italy, in1975. He received the Laurea degree in physicsfrom the University of Perugia, Perugia, Italy, inMay 2001. He is currently working toward thePh.D. degree in neurobiology at the InternationalSchool for Advanced Studies (ISAS/SISSA), Tri-este, Italy. From January 2000 to July 2001, hewas a trainee and a postgraduate student at thedepartment of “Membrane and Neurophysics” of theMax-Planck-Institute for Biochemistry in Munich,under the supervision of Prof. P. Fromherz.
His research interests include electrophysiology, neuroengineering, compu-tational neuroscience.
Vincent Torre received the degree in theoreticalphysics from Genoa University, Genoa, Italy, in1973.
In the early 1980s, along with T. Poggio and C.Koch, he pioneered in the area of computationalneuroscience. For several years he was a Post Docand Visiting Scientist in Sir Alan Hodgkin Lab,Cambridge, U.K., where he learned a variety ofelectrophysiological methods and became expert inmodeling biological process. In the late 1980s andearly 1990s he worked on computer vision and in
particular, edge detection and motion perception. Since 1997 he has been aFull Professor at International School of Advanced Studies, Trieste, Italy andis the Head of the Department of Neurobiology. He has a well-establishedexpertise in electrophysiology, computer vision, computational neuroscienceand modeling biological process. He is the author of more than 100 full papers.