Embed Size (px)
Citation preview

Small Cells are a Big Deal IEEE ComSoc SCV Panel on Mobile Backhaul
October 10, 2012
Michael HowardCo-Founder and Principal Analyst
Carrier Networks

Copyright © 2012 Infonetics Research, Inc.
Mobile Backhaul Trends

Copyright © 2012 Infonetics Research, Inc.
Traffic growth—Ethernet to the rescue
Source: Infonetics Research, Mobile Backhaul Equipment and Services, Market Size, Share, and Forecasts, March 2012
PDH vs Ethernet: Annual Mobile Backhaul Service Charges per Connection
$0
$10,000
$20,000
$30,000
$40,000
$50,000
CY08 CY09 CY10 CY11 CY12 CY13 CY14 CY15 CY16
PDH and ATM over PDH Ethernet wireline
Worldwide Average Bandwidth per Installed Connection (Mbps)
0
10
20
30
40
50
60
70
80
90
100
CY08 CY09 CY10 CY11 CY12 CY13 CY14 CY15 CY16Aver
age
BW p
er In
stal
led
Conn
ectio
n (M
bps)
New Ethernet wireline PDH and ATM over PDHSONET/SDH and WDM
…or move to Ethernet
Stay on TDM
• Costs of traffic drive operators to IP/Ethernet backhaul– The “new Ethernet wireline” (Ethernet over fiber or copper, DSL, PON,
cable) costs significantly less per bit than TDM
• Capacities and charges reflect current planning for HSPA+ and LTE

Copyright © 2012 Infonetics Research, Inc.
Operators are deploying MBH capable of supporting LTE now
74%
100%
0%
20%
40%
60%
80%
100%
By the end of 2011 2012Timeframe
Perc
ent o
f Res
pond
ents
Dep
loyi
ng
From Infonetics survey of 27 mobile operators and backhaul transport providers, representing 54% of 2011 telecom capex
Source: Infonetics Research, Small Cell and LTE Backhaul Strategies: Global Service Provider Survey, November 30, 2011

Copyright © 2012 Infonetics Research, Inc.
$0
$1
$2
$3
$4
$5
$6
$7
$8
$9
CY08 CY09 CY10 CY11 CY12 CY13 CY14 CY15 CY16
Reve
nue
(US$
Bill
ions
)
0%
10%
20%
30%
40%
50%
60%
70%
80%
90%
100%
IP/Ethernet Equipment Other Equipment Ethernet % of total
IP/Ethernet is 94% of 2012 MBH equipment spending—must support LTE
• Global 2012 MBH equipment spend will be $7.3 billion
– Surge of Ethernet MBH routers in China caused part of the 2011 bump; return to normal in 2012
• Steady growth after 2012 – $8.3B in 2016
– Cumulative $39B over 5 years
• This is very healthy growth, especially for a market in the billions of dollars
Source: Infonetics Research, Mobile Backhaul Equipment and Services, Market Size, Share, and Forecasts, March 2012

Copyright © 2012 Infonetics Research, Inc.
Small cells and small cell backhaul

Copyright © 2012 Infonetics Research, Inc.
Virtually all new connections are IP Ethernet
• IP/Ethernet and LTE mobile backhaul are intertwined
• Microwave is big part: Ethernet-only and dual Ethernet/TDMSource: Infonetics Research, Mobile Backhaul Equipment and Services, Market Size, Share, and Forecasts, March 2012
-400
-200
0
200
400
600
800
1,000
1,200
1,400
1,600
CY08 CY09 CY10 CY11 CY12 CY13 CY14 CY15 CY16
Num
ber o
f New
Con
nect
ions
(K)
Ethernet TDM Other

Copyright © 2012 Infonetics Research, Inc.
Until LTE kicks in, 3G dominates small cells• Small cells: Micro, pico, public access femto—not residential;
outdoor is new, in-building is not
• We expect $250 million in small cell equipment spending in 2012, growing to over $2 billion in 2016
– Phase 1: 3G rollouts, 2008–2011
– Phase 2: 3G expansion and upgrades, 2012–2016
– Phase 3: 4G capacity upgrades, 2013–2016
• In Phase 3, we expect a dramatic shift from 3G to LTE– By unit numbers:
2012: 100% 3G (early LTE deployments are field trials only)
2013: Kick-off year with 37% LTE small cell units (63% for 3G)
2015: LTE small cells hit about 57% of total, overtaking 3G
Source: Infonetics, Small Cell Equipment Market Size and Forecast, April 2012

Copyright © 2012 Infonetics Research, Inc.
Small cell backhaul is Ethernet NLOS-MWV-MMW play• Operators are evaluating, testing, planning outdoor small cells
– Very few outdoor rollouts to date, so no clear operator approach
– Virtually all small cell deployments to date: 3G, in-building
• Most operators will deploy first outdoor in the urban core– 3 to 8 picocells per macrocell
– Most will aggregate small cell backhaul traffic onto the nearest macrocell site
– Macrocell sites are connected to fiber backhaul networks
• From operators, we know fiber preferred, but that collectively various “microwave” technologies will play a strong role outdoors
– Signaling between macrocells and coordinated small cells is certain
– Microwave
– Millimeter wave, licensed/unlicensed
– NLOS, licensed/unlicensed
– Operators considering P2P, P2MP, mesh
• Opportunity: backhaul transport providers can extend Ethernet backhaul service from urban core fiber to small cells via fiber, NLOS, MWV, MMW
Source: Infonetics, SDNs, 40G/100G, and MPLS Control Plane Strategies: Global Service Provider Survey, July 2012

Copyright © 2012 Infonetics Research, Inc.
SDNs and mobile backhaul

Copyright © 2012 Infonetics Research, Inc.
SDNs are here to stay, but not here today
Source: Infonetics, SDNs, 40G/100G, and MPLS Control Plane Strategies: Global Service Provider Survey, July 9, 2012
• Service providers are smitten by SDNs; a good majority of those we surveyed are planning purchases or considering 5 new SDN technologies:
– OpenFlow—good for operations/provisioning in contained domains
– BGP-TE—allows network elements to communicate across IP address domains known as Autonomous Systems (almost every operator has 1 AS of their own)
– PCE—allows network elements to “see farther” to discover network nodes, compute pathways
– IETF SDNP—goal is to define applications to network API mechanisms
– ALTO—allows network elements to locate cloud resources dynamically
• SDNs targeted for contained network domains, including mobile backhaul

Copyright © 2012 Infonetics Research, Inc.
SDNs are here to stay, but long slow path
• Top 3 drivers for carriers to consider or use service provider SDNs– #1 Simplified provisioning
– #2 Creation of network services—and virtual networks—not possible with existing technologies
– #3 Creation of virtual networks across multivendor equipment
Service Providers Have SDNs on Their Minds (July 2012)
43%33% 33% 33%
19%
38%43% 38% 33%
33%
0%
20%
40%
60%
80%
100%
OpenFlow BGP-TE PCE IETF SDNP ALTOSDN Technologies
Perc
ent o
f Res
pond
ents
Under consideration Will/may consider
81% 76%71%
67%
52%
Source: Infonetics, SDNs, 40G/100G, and MPLS Control Plane Strategies: Global Service Provider Survey, July 9, 2012
Copyright © 2012 Infonetics Research, Inc.
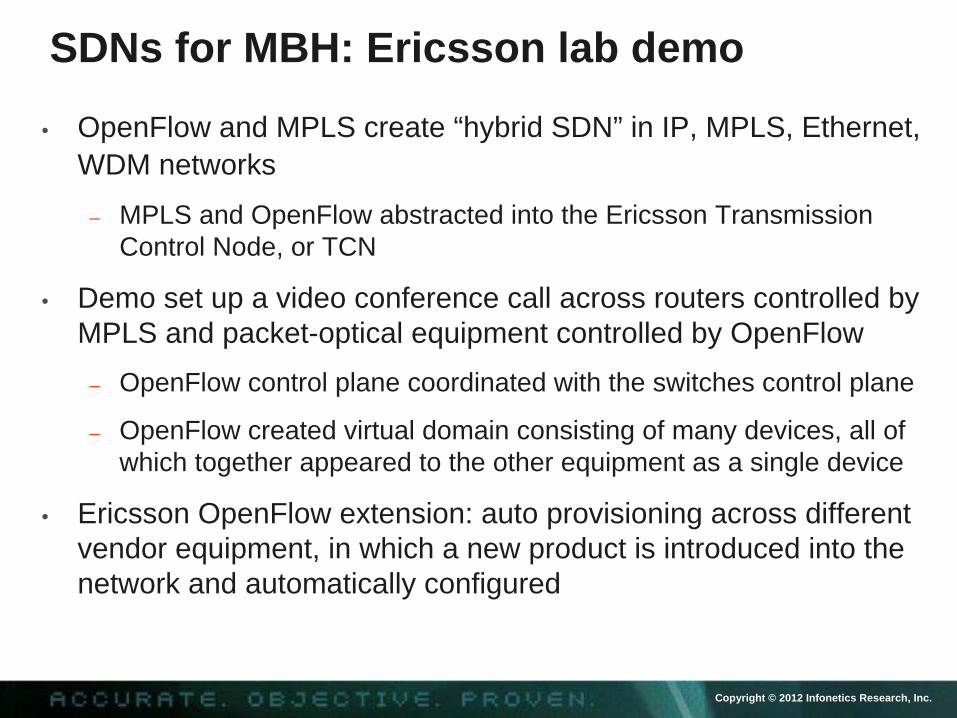
SDNs for MBH: Ericsson lab demo
• OpenFlow and MPLS create “hybrid SDN” in IP, MPLS, Ethernet, WDM networks
– MPLS and OpenFlow abstracted into the Ericsson Transmission Control Node, or TCN
• Demo set up a video conference call across routers controlled by MPLS and packet-optical equipment controlled by OpenFlow
– OpenFlow control plane coordinated with the switches control plane
– OpenFlow created virtual domain consisting of many devices, all of which together appeared to the other equipment as a single device
• Ericsson OpenFlow extension: auto provisioning across different vendor equipment, in which a new product is introduced into the network and automatically configured

Copyright © 2012 Infonetics Research, Inc.
SDNs for MBH: Ericsson lab demo
• Demo set up a video conference call across routers controlled by MPLS and packet-optical equipment controlled by OpenFlow
Source (with permission): Ericsson, “Virtual Network System,” Elisa Bellagamba, MPLS + Ethernet Congress, Paris, February, 2012

Copyright © 2012 Infonetics Research, Inc.
Q & A

Michael HowardCo-founder & Principal Analyst, Carrier Networks
Infonetics Research+1 408.583.3357
THANK YOU

Copyright © 2012 Infonetics Research, Inc.
What makes our analysts different?
17
Tenure Average 19 years in the telecom and datacom industries; 8 years with Infonetics
InfluenceWith all industry participants, including vendors, network operators, investors, regulators, industry groups and the press
ExperienceFormer equipment and solutions vendors, network operators, components vendors, industry analysts
CollaborationOur analysts work closely together, providing cross-market perspectives, checks and balances
1234
Copyright © 2012 Infonetics Research, Inc.
Our reach and influence
18
• Top 10 most quoted U.S. analyst firm
• Top 5% for online influence, authority, engagement, and trustworthiness
• Top 200 tech firm for media coverage among 1000s of U.S. companies, incl. Apple, Google, Microsoft and AT&T
• Fast-growing media coverage in Europe, Asia, Latin America
Sources: Apollo Research, PeerIndex

Copyright © 2012 Infonetics Research, Inc.
Our rigorous methodology
19
The key to the quality and accuracy of our research
Phase 1Clearly define categories
Phase 5Report on accuracy and continually update forecast
Phase 2Gather and validate data
from vendors, service providers, others
Phase 4Validate and explain
forecast
Phase 3Forecast
12
3
4
5

Copyright © 2012 Infonetics Research, Inc.
We cross-check and verify our data
20
To identify market shifts quickly and give you a thorough, factual view of the market
Supply-side research Demand-side research
• Service providers• Product manufacturers • Their suppliers
Surveys throughout the year with:
• Service providers• Enterprises• SMBs
Thorough data collection, constant interaction with:
Thorough data collection of:
• Service provider capex• Subscribers

Copyright © 2012 Infonetics Research, Inc.
We give you the complete picture
21
Because we work with all players in the market
Service providers
Product manufacturers
Enterprises and SMBs
Test and measurement
Investment community Trade showsChannels Press
Chip and component
Consumers

Copyright © 2012 Infonetics Research, Inc.
Investment &Financial
Manufacturers ServiceProviders
Chip &
Component
Select clients

Copyright © 2012 Infonetics Research, Inc. 23
Locations •• •••• ••
Partners
Offices
Taiwan: 張耕豪, 基泰國際有限公司
South Korea: 문덕대 | (주)엠비에이피
Silicon Valley: 695 Campbell Technology Parkway, Suite 200 | Campbell, CA 95008 | +1 408.583.0011
Boston Metro: 91 Montvale Avenue, Suite 102 | Stoneham, MA 02180
Greater London: Dorchester House, Suite 113 | Station Road, Letchworth | Hertfordshire SG6 3AW UK
Amsterdam: Prinseneiland 8b | Amsterdam 1013 LR | The Netherlands
Shanghai: 上海市闸北区芷江北路788号
| 华舟大厦802室
| 邮编: 200070 中国
Tokyo: TAK アナリティクスリサーチ 〒141-0022 東京都品川区東五反田1-21-9 ウィスタリア東五反田ビル