Embed Size (px)
DESCRIPTION
standard
Citation preview

~7)
')
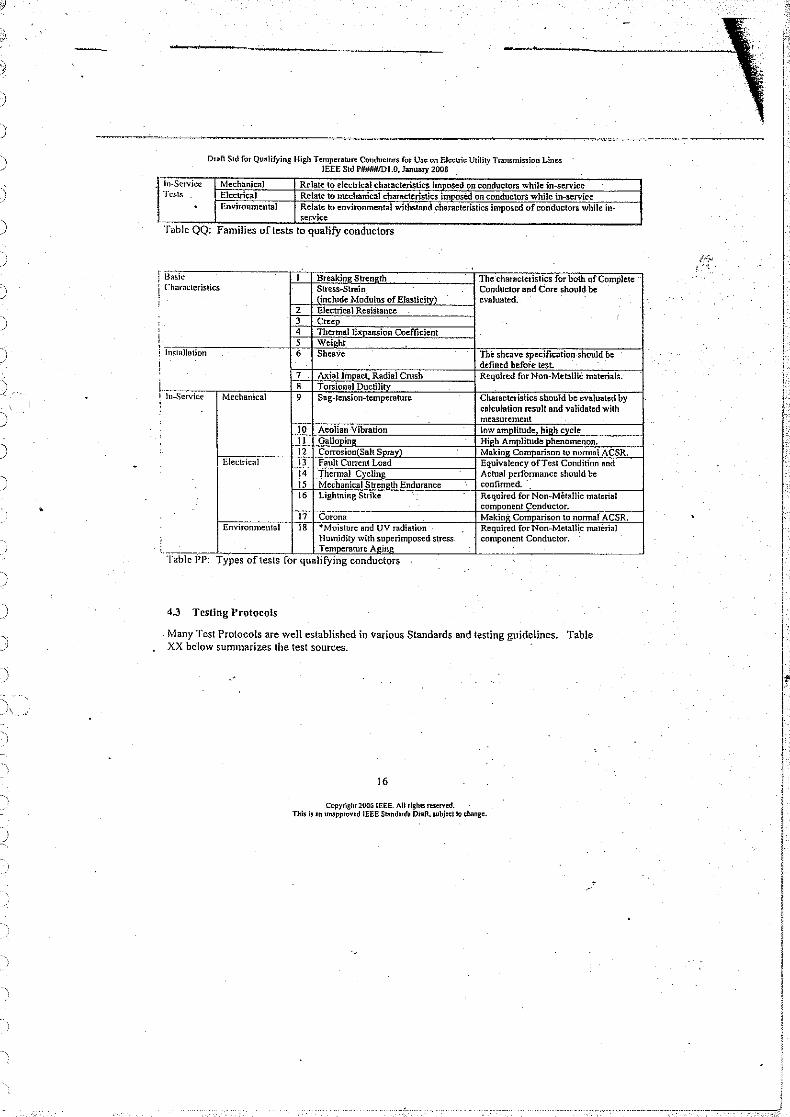
) SELF-DAMPING MEASUREMENTS
IEEE Std 563-1978
j
)
)
)
)
)
)
)'
~
}
, I
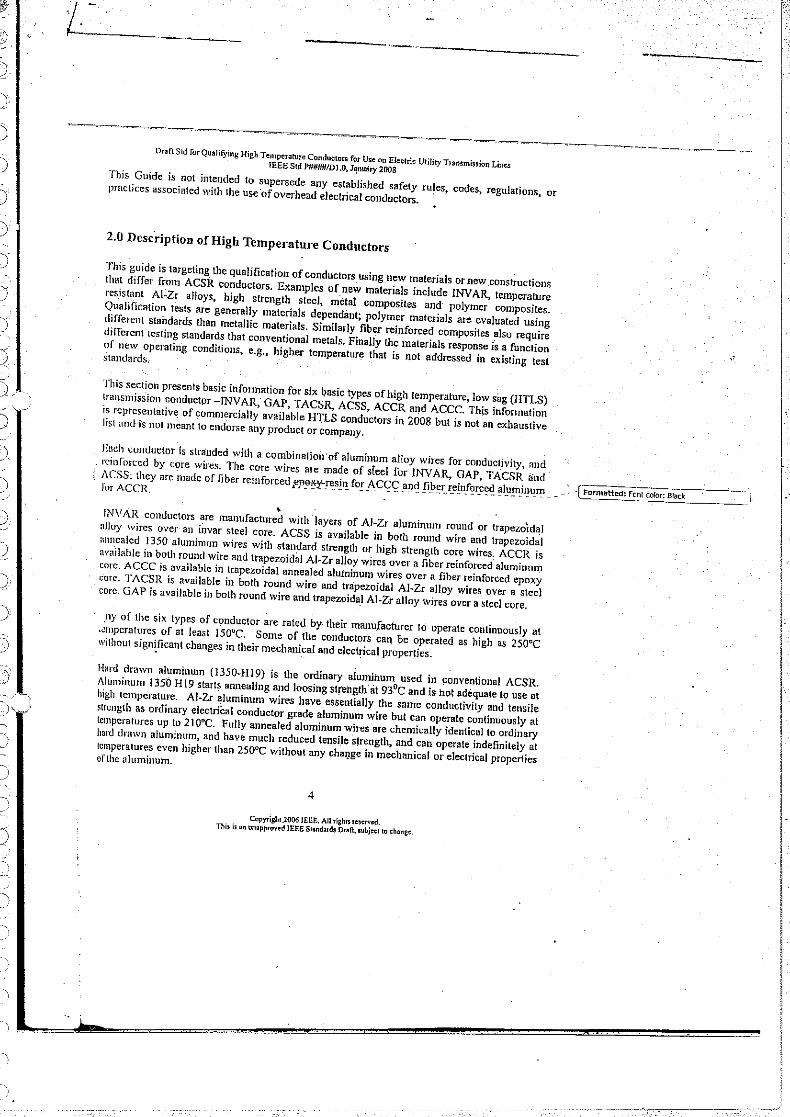
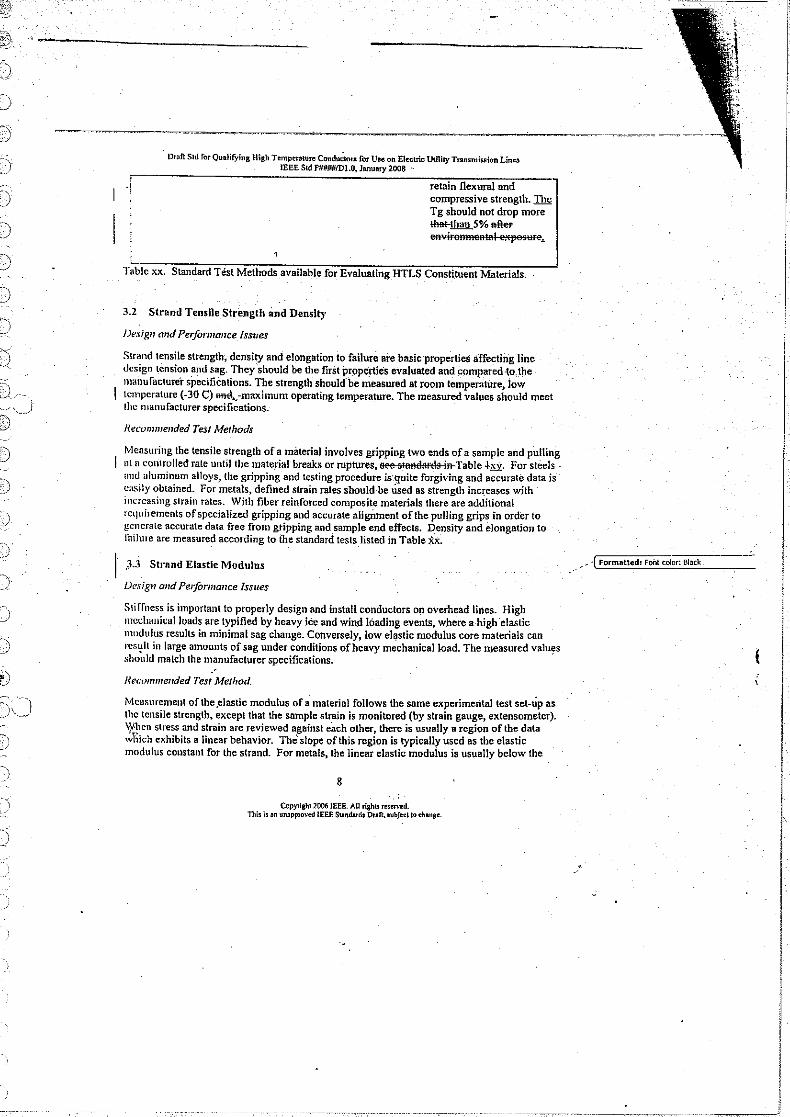
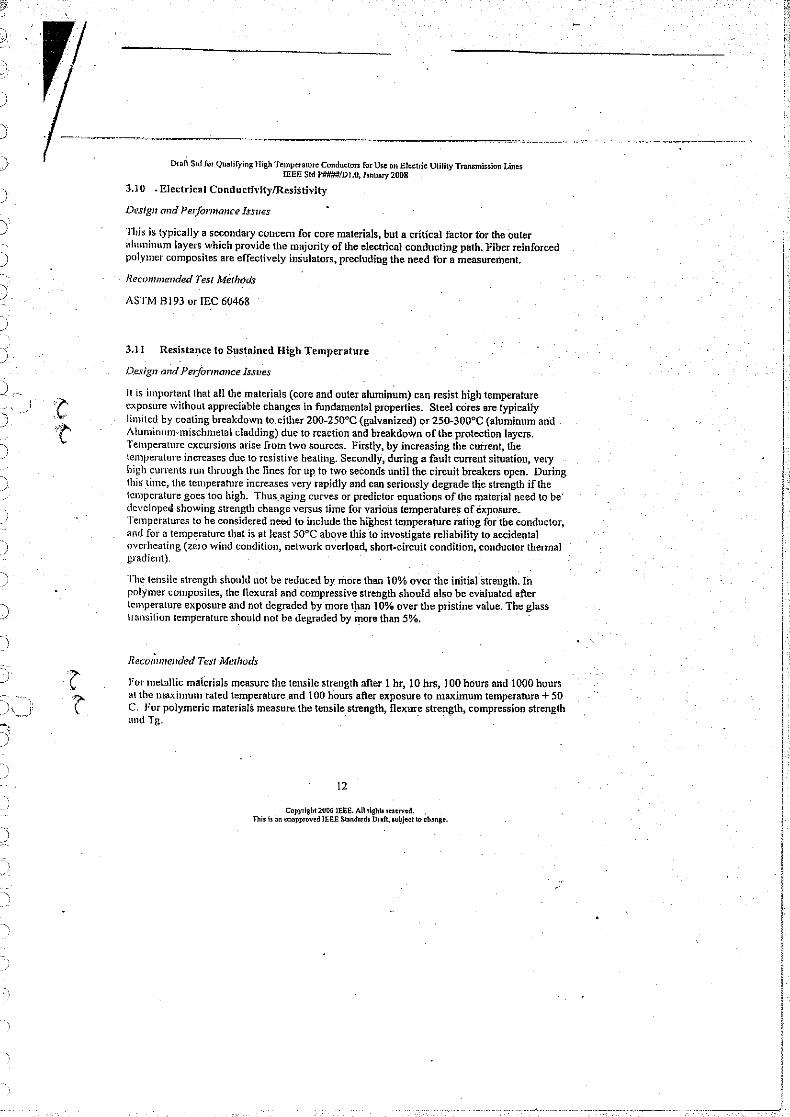
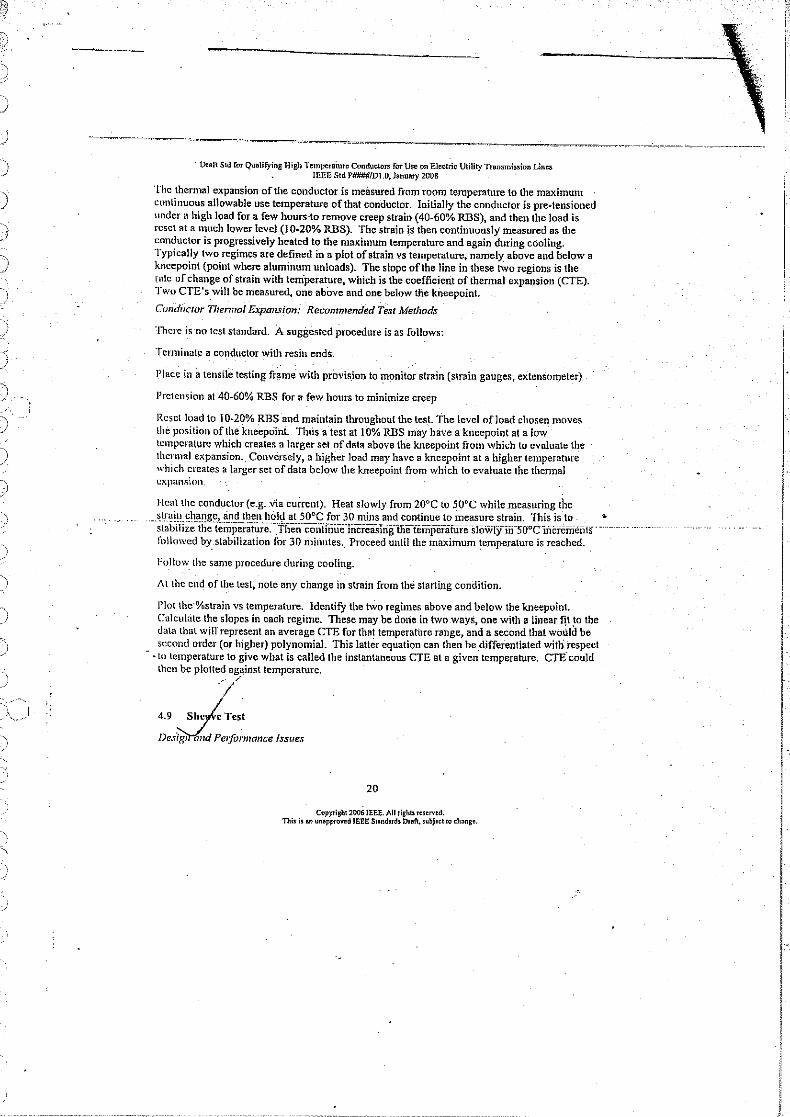
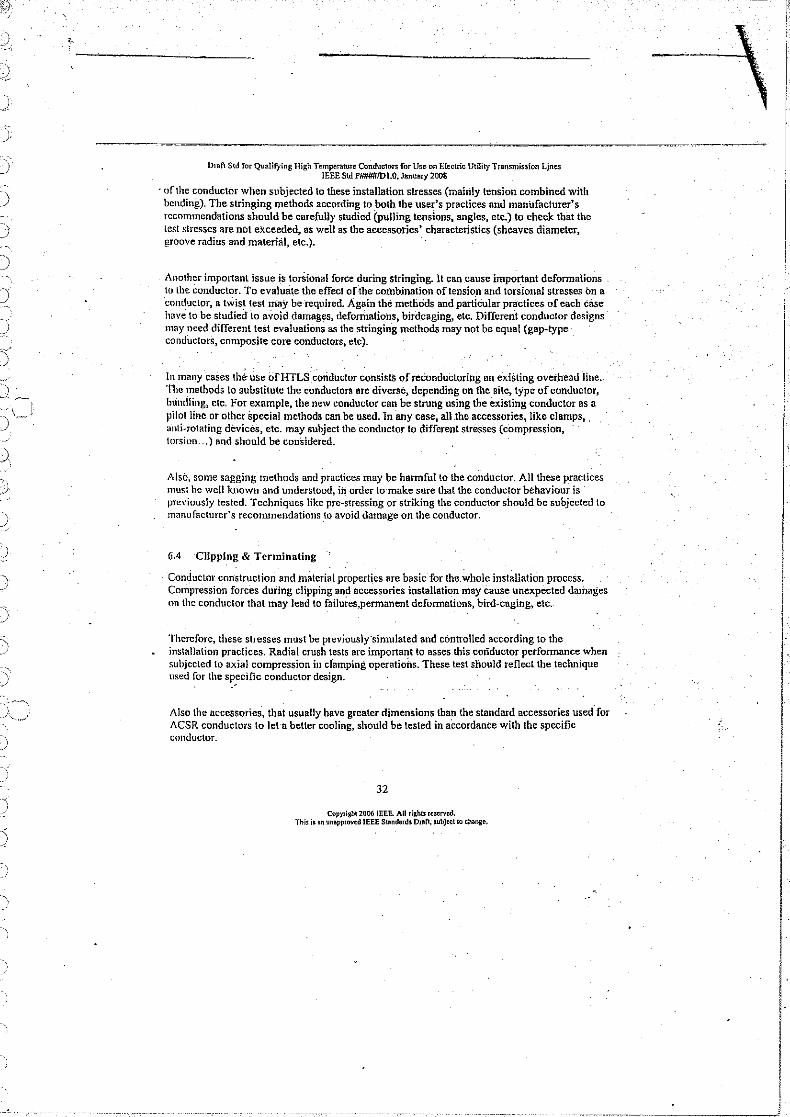
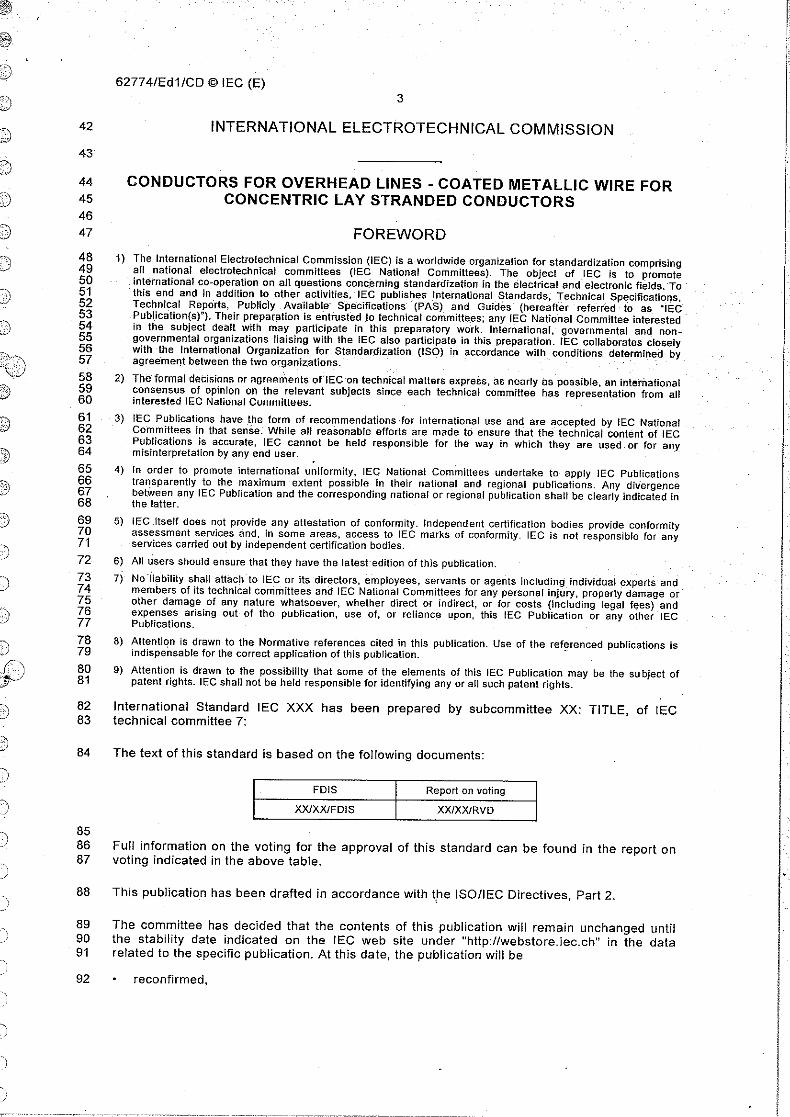
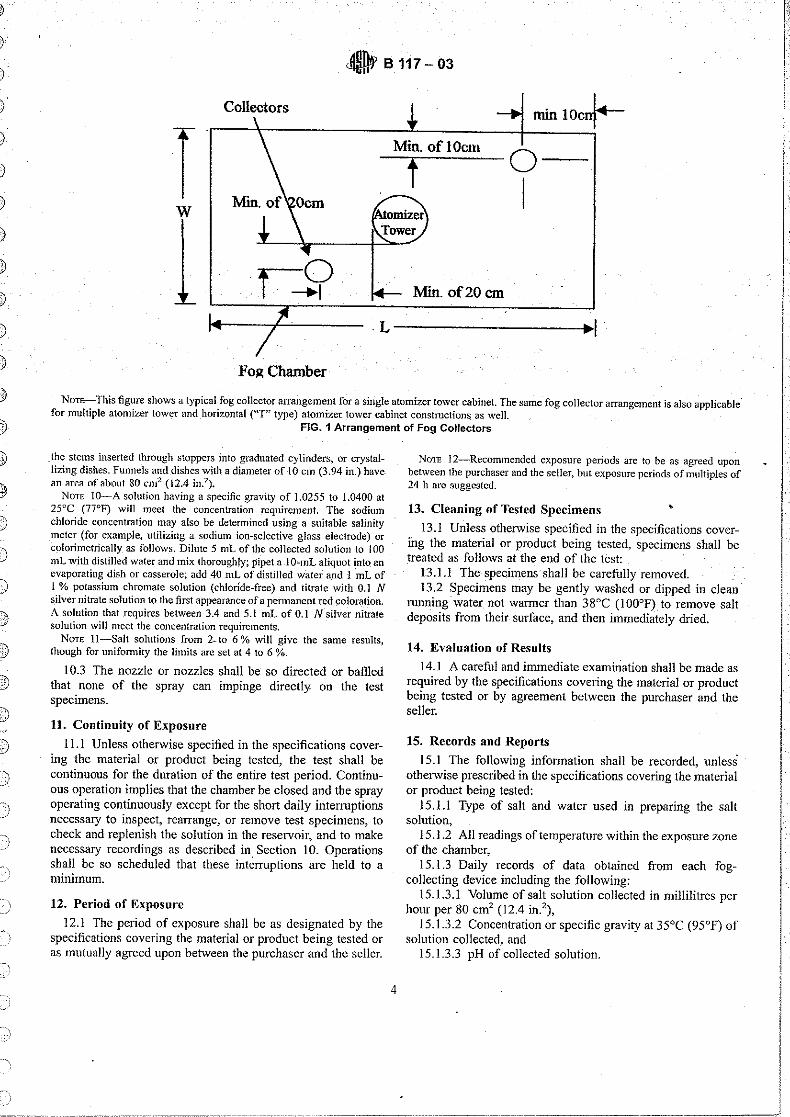
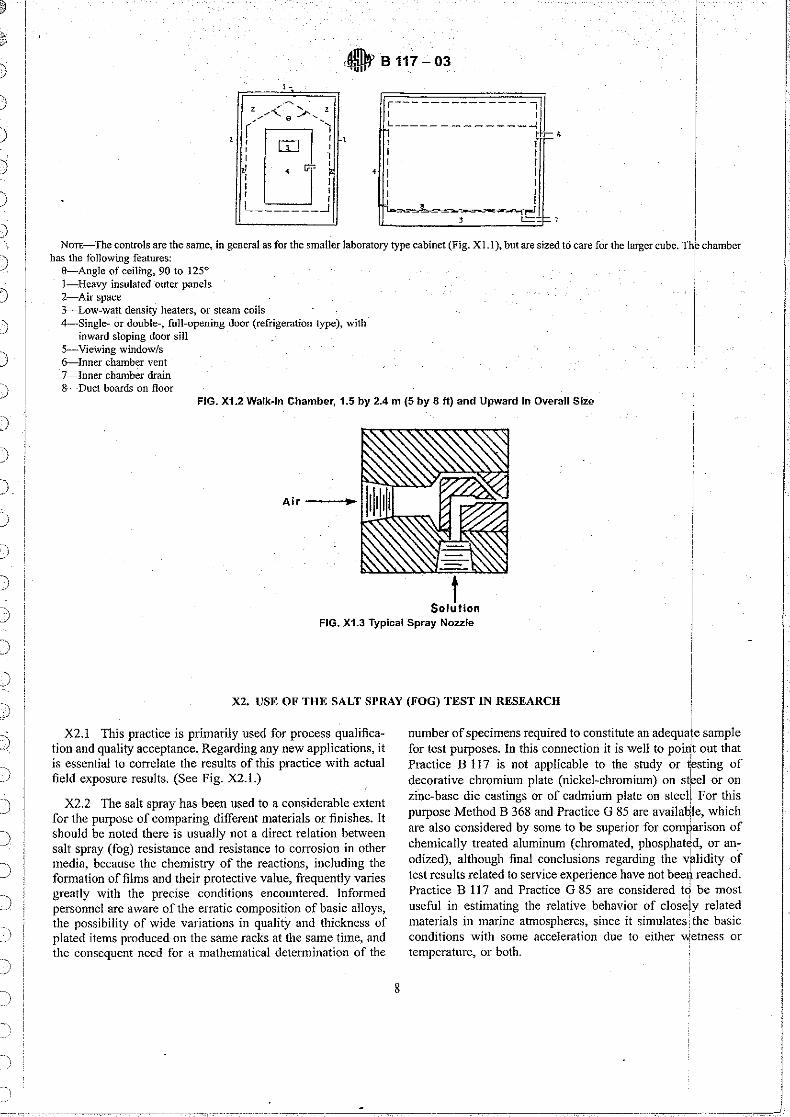
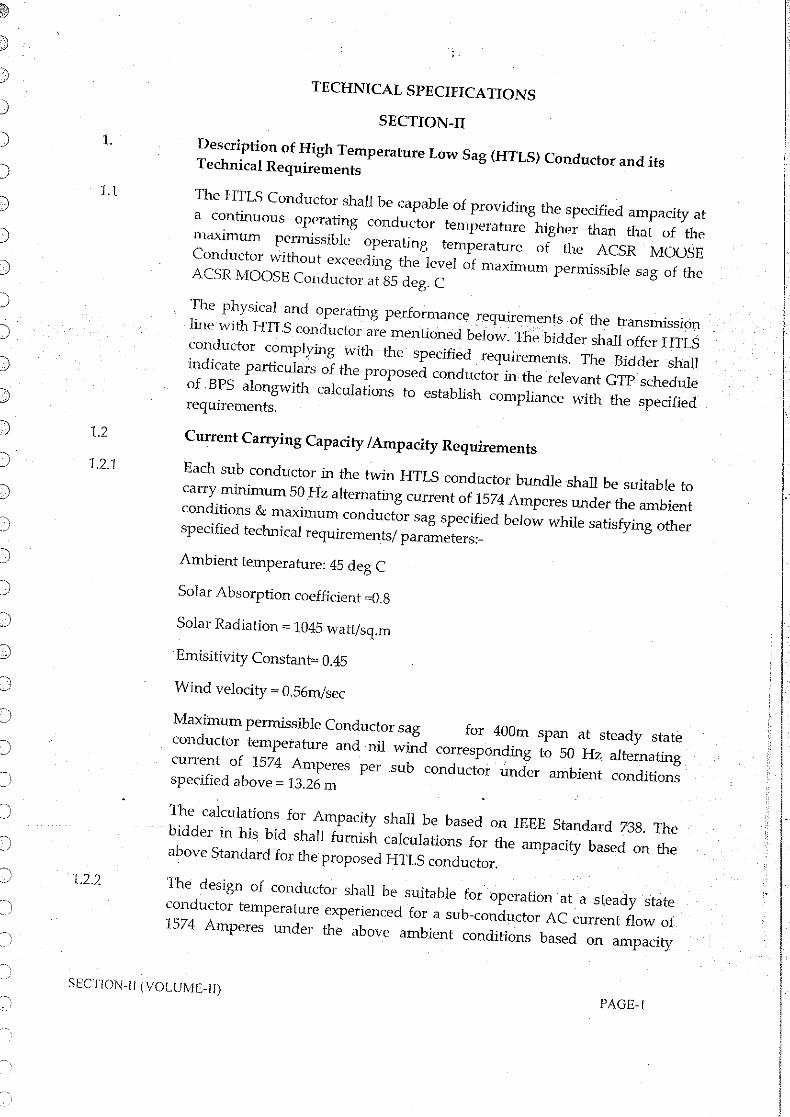
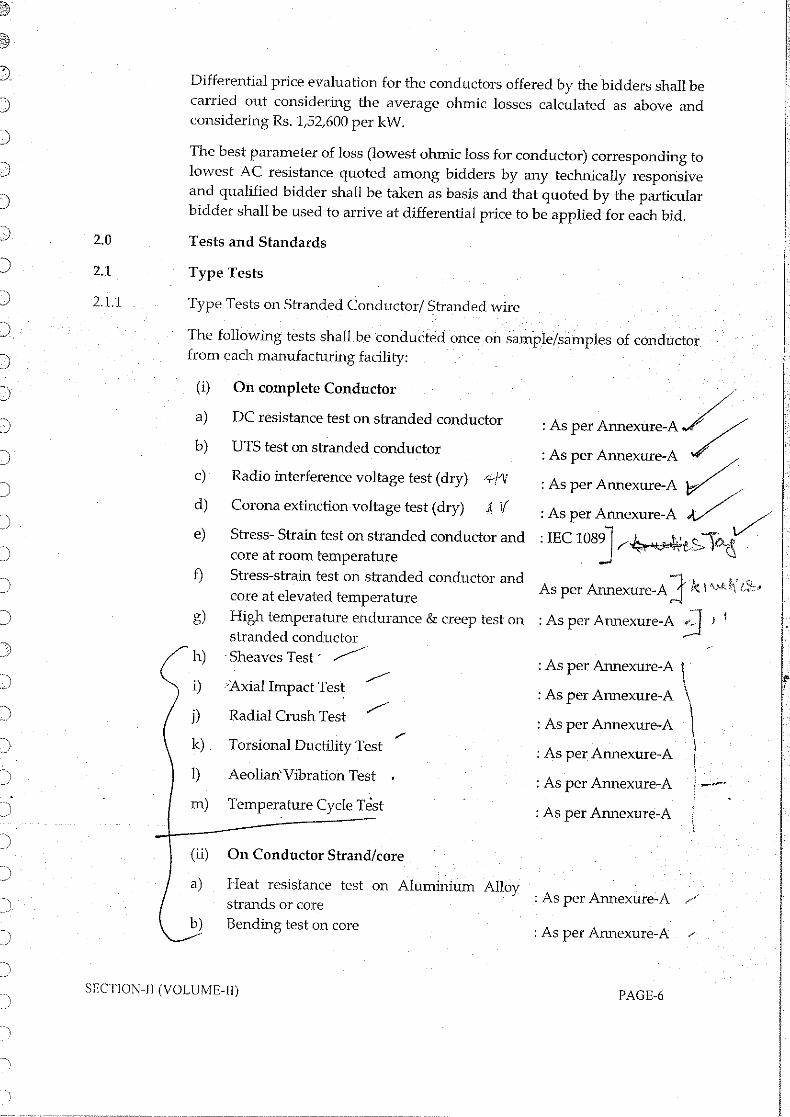
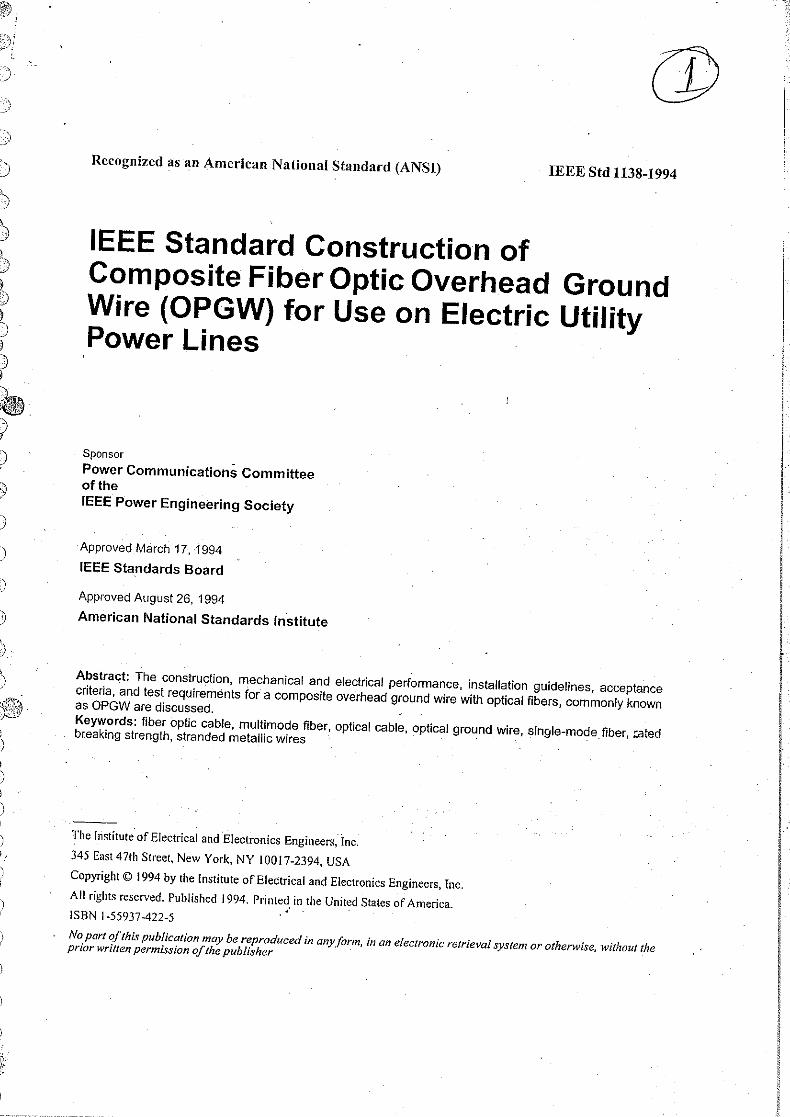
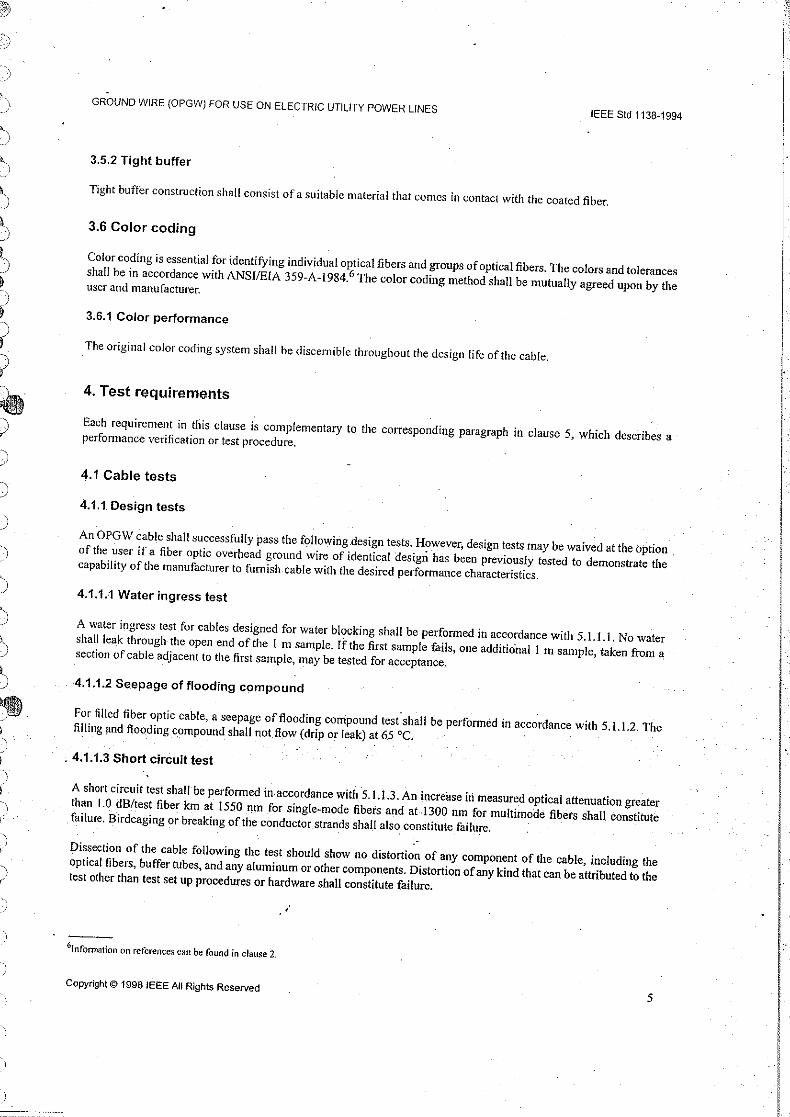
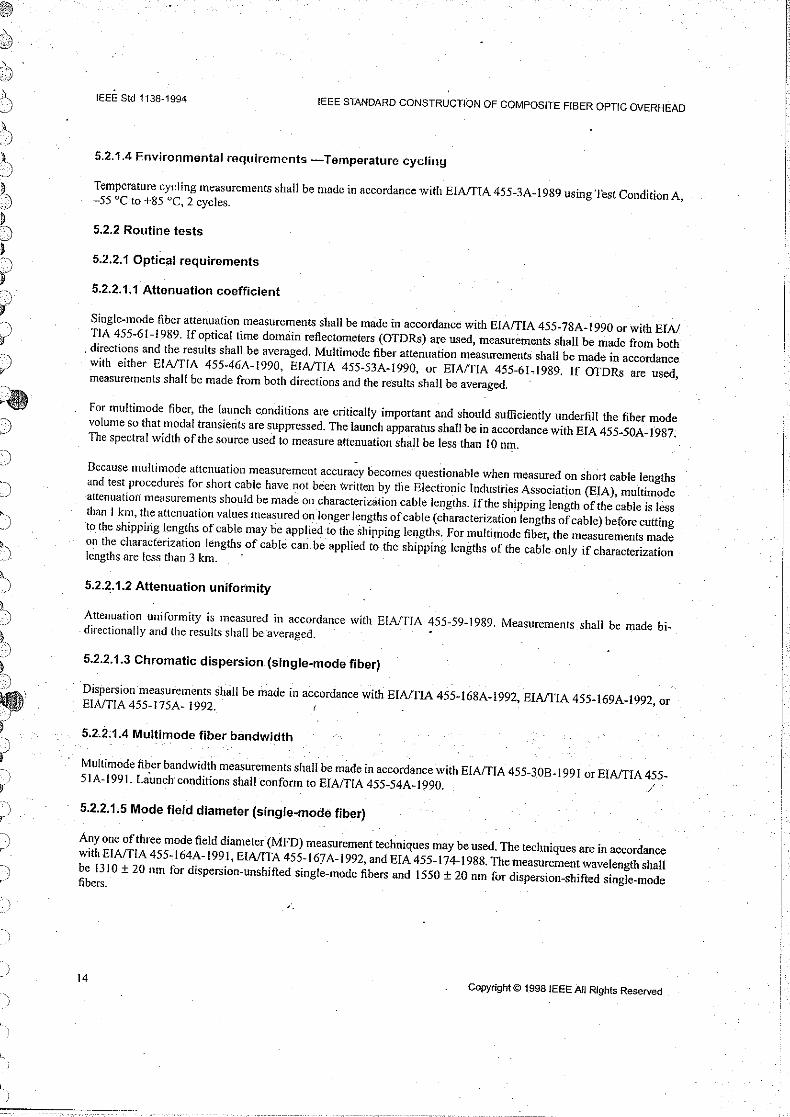
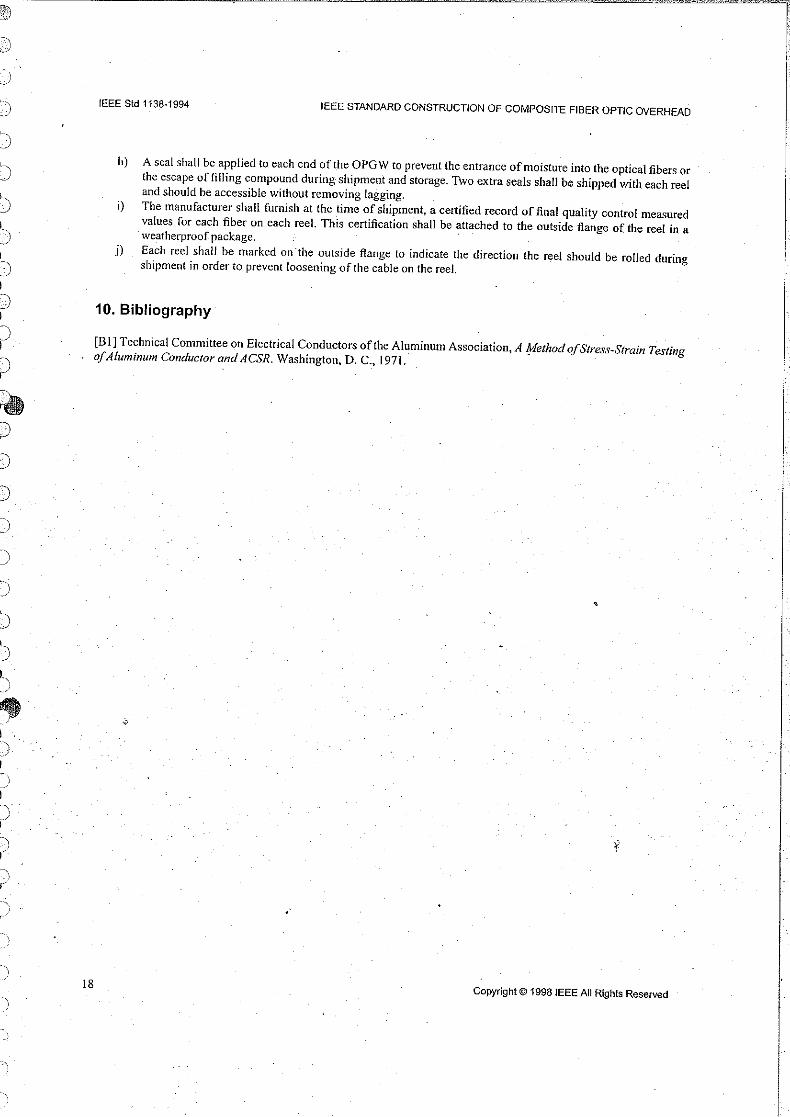
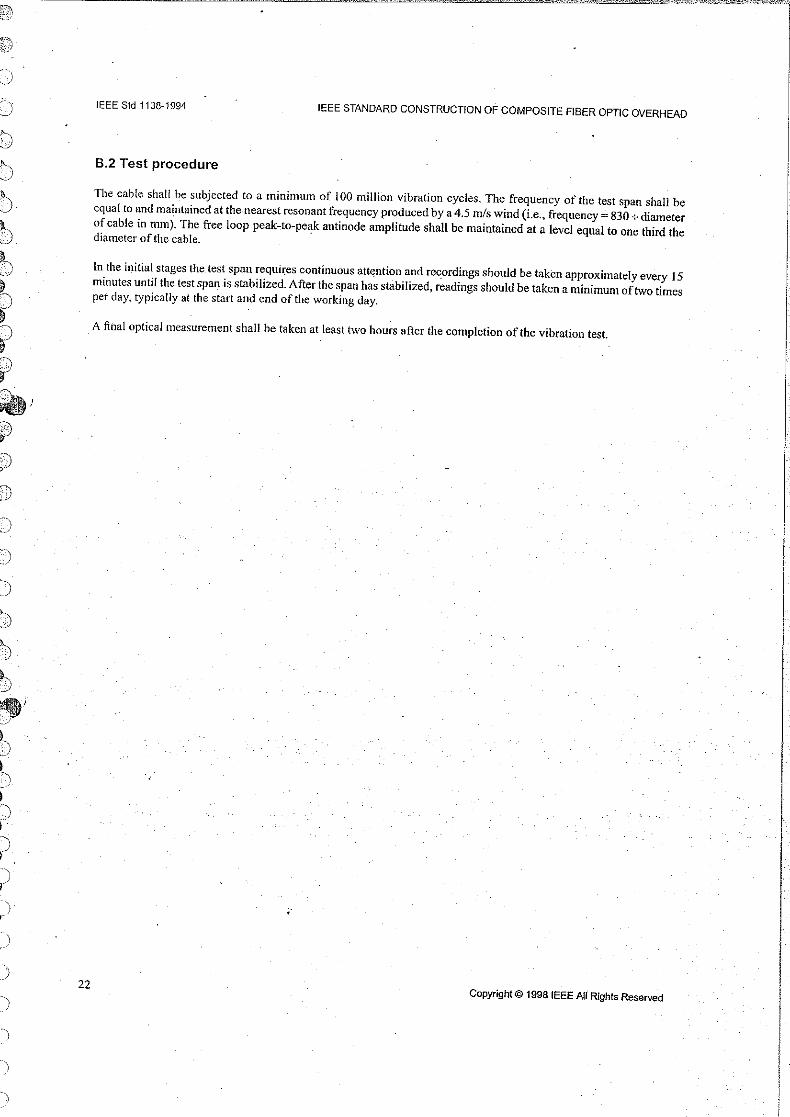
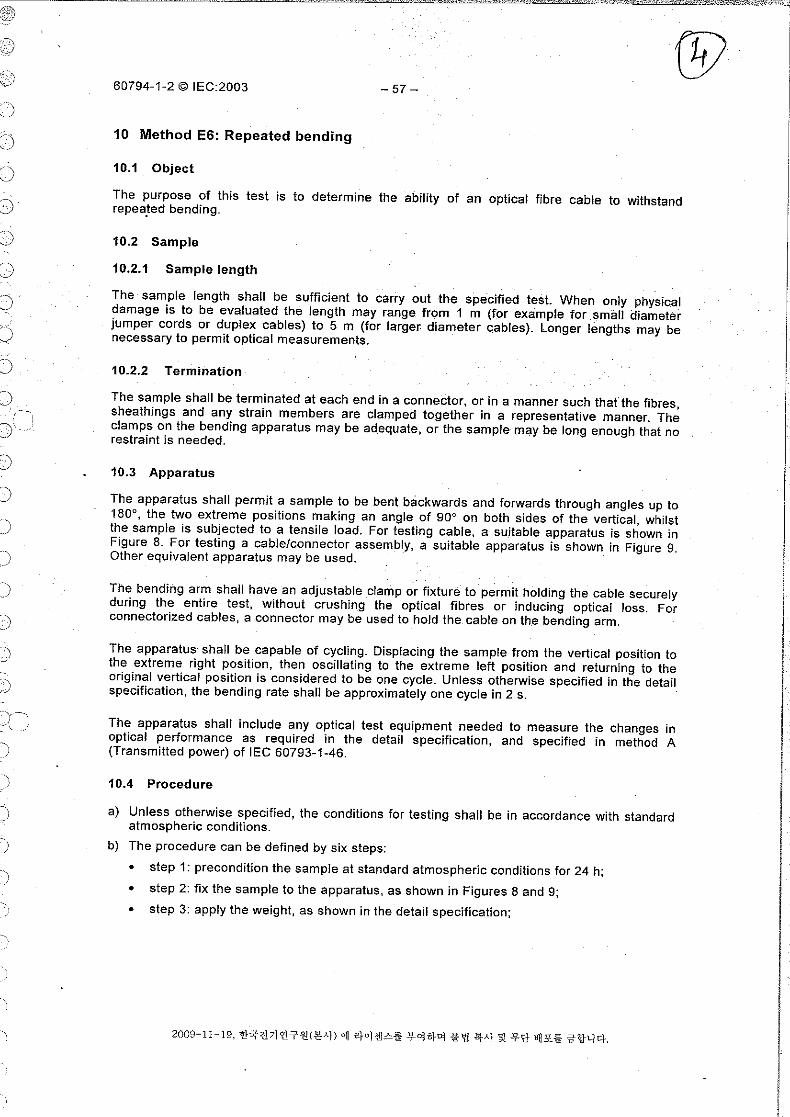
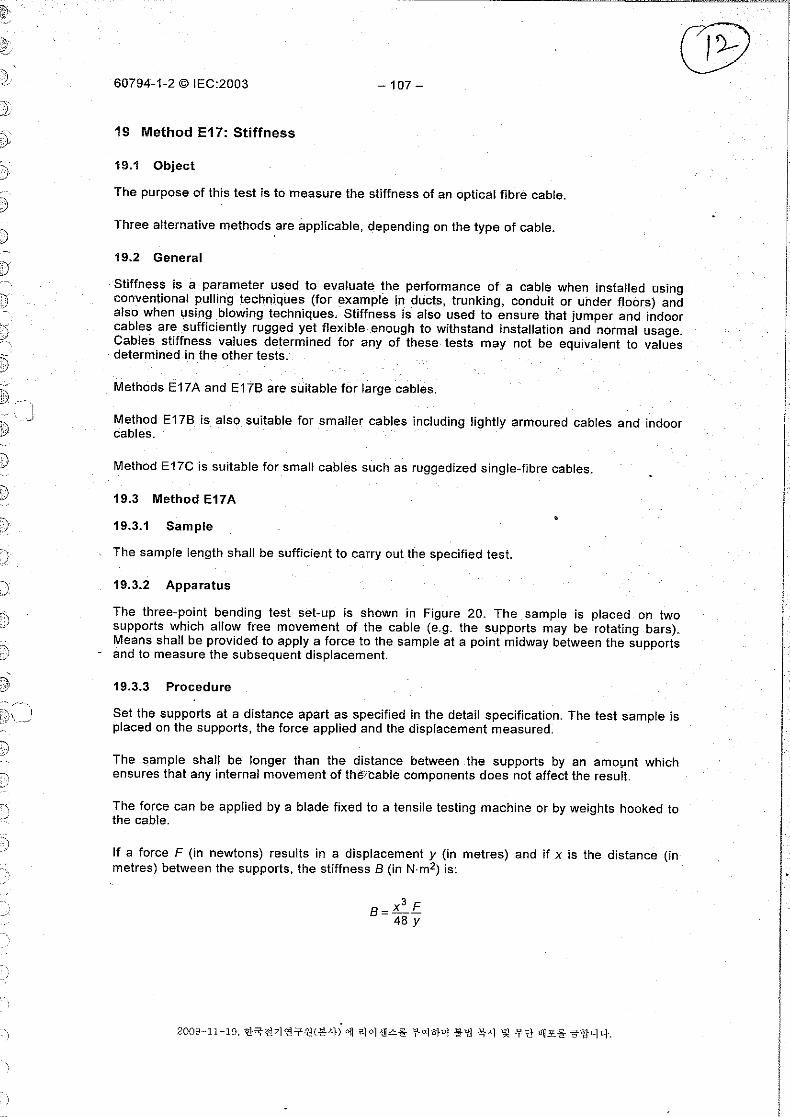
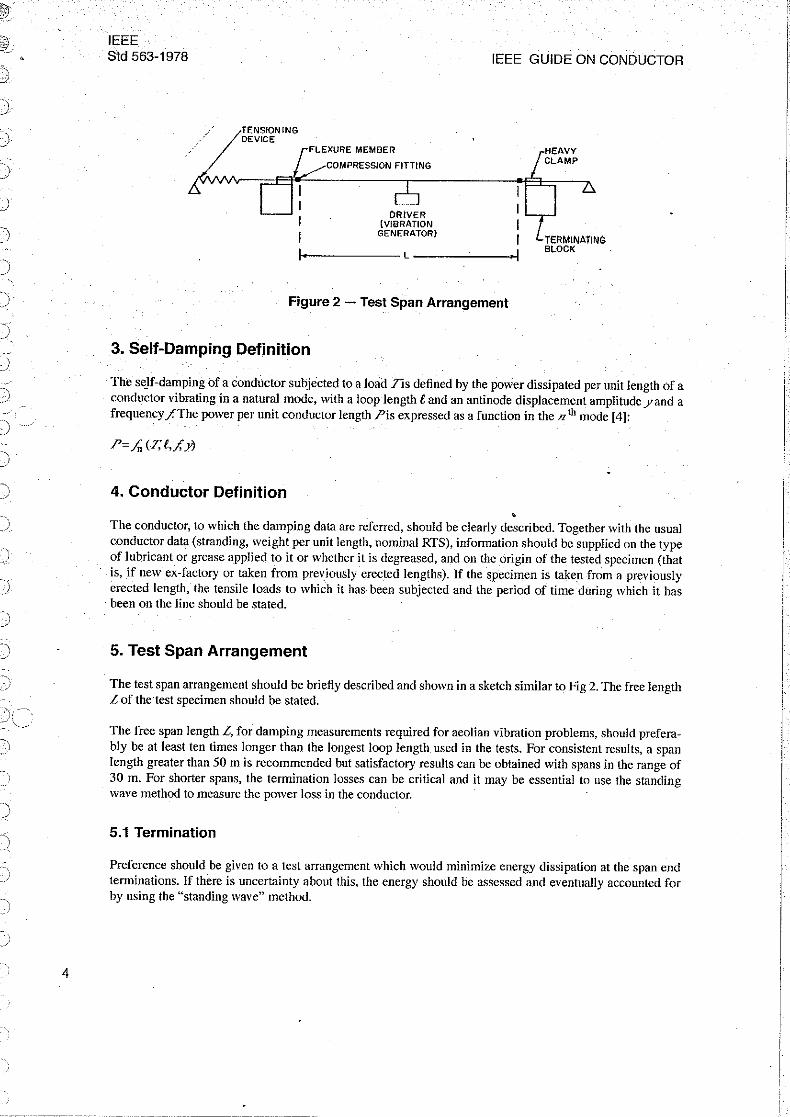
Figure 5 - Electro-dynamic Vibration Generator
the driver, should be corrected so that it is equivalent to the antinode velocity. Excessive generator mass changes the length of the loop to which it is attached and is indicative of localized damping. The effect of attaching the vibration generator to the conductor should not change the loop length in which the attachment is made by more than 10 percent. Otherwise, it should be accounted for in the determination of the self
. damping of the conductor. A generator mass of less than 10 perccnt of the mass per unit length of conductor • is normally satisfactory. The method of attachment of the driver to the conductor should be noted in the table ofresults.
The alternating force provided by the generator should be simple harmonic with a distortion level of less than 5 percent.
6. Test Method
The method used to drive the conductor to vibrate at resonance in one of its principal mod~s should be briefly described. Information should be given on the type of driving device and on the mechanical connections between the device and the conductor.
The method used to assess resonance conditions and the accuracy of frequency, force, displacement or velocity measurements, etc., should be stated.
The motion of the conductor must be simple harmonic. The amount of distortion can be determined directly from either the displacement or velocity signal. Alternatively, the distortion is acceptable if the difference between the maximum and minimum antinode amplitudes, compared with the average throughout the span, is equal or less than 5 percent.
Tests should be performed to check that the conductor test arrangement is stable and the results are repeatable, such as by making measurements twice with both increasing and decreasing amplitudes. Steady-state condition stability is acceptable if four or five readings of the energy dissipated per cycle or of power, performed at a few seconds intervals, do not show a definite increase or decrease of value and the variations are
7
)
)
)
II::EE Std 563-1978 I[[E GUIDE 01\1 CONDUCTOR
)
)
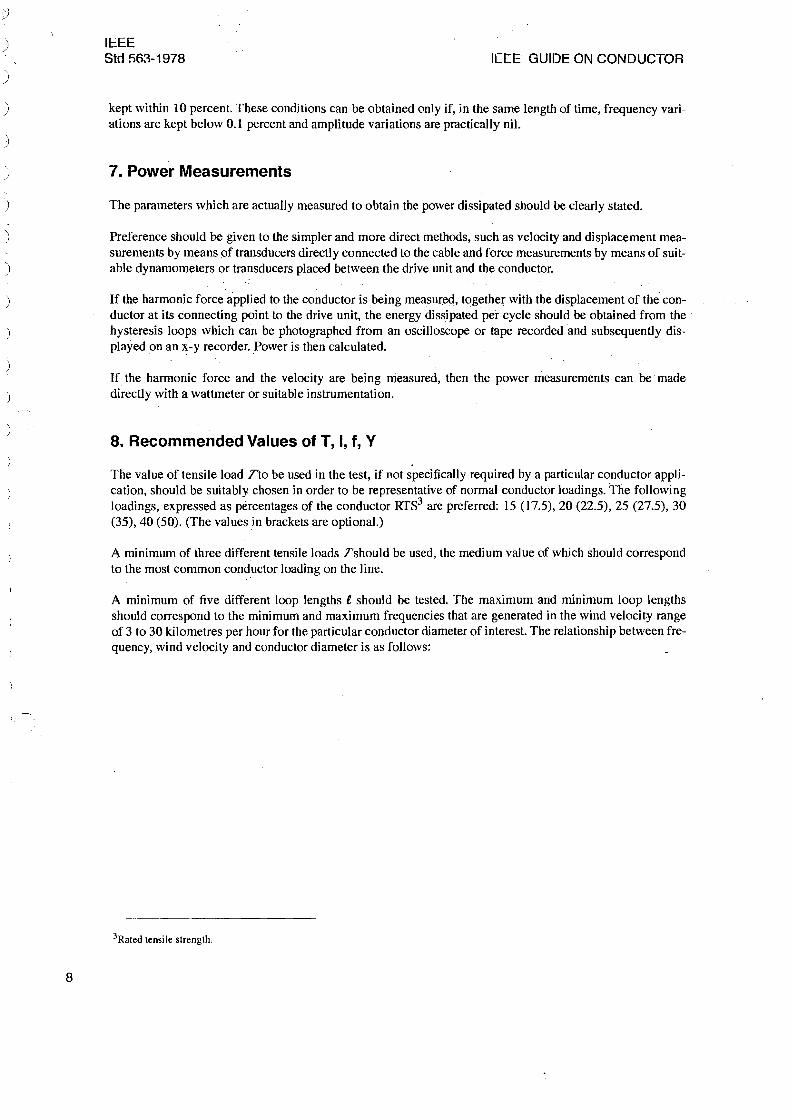
kept within 10 percent. These conditions can be obtained only if, in the same length of time, frequency variations are kept below 0.1 percent and amplitude variations are practically nil.
) 7. Power Measurements
) The parameters which are actually measured to obtain the power dissipated should be clearly stated.
)
)
Preference should be given to the simpler and more direct methods, such as velocity and displacement measurements by means of transducers directly connected to the cable and force measurements by means of suitable dynamometers or transducers placed between the drive unit and the conductor.
) If the harmonic force applied to the conductor is being measured, together with the displacement of the conductor at its connecting point to the drive unit, the energy dissipated per cycle should be obtained from the· hysteresis loops which ca'n be photographed from an oscilloscope or tape recorded and subsequently displayed on an x-y recorder. Power is then calculated.
If the harmonic force and the velocity are being measured, then the power measurements can be· made direcLly with a wattmeter or suitable instrumentation.
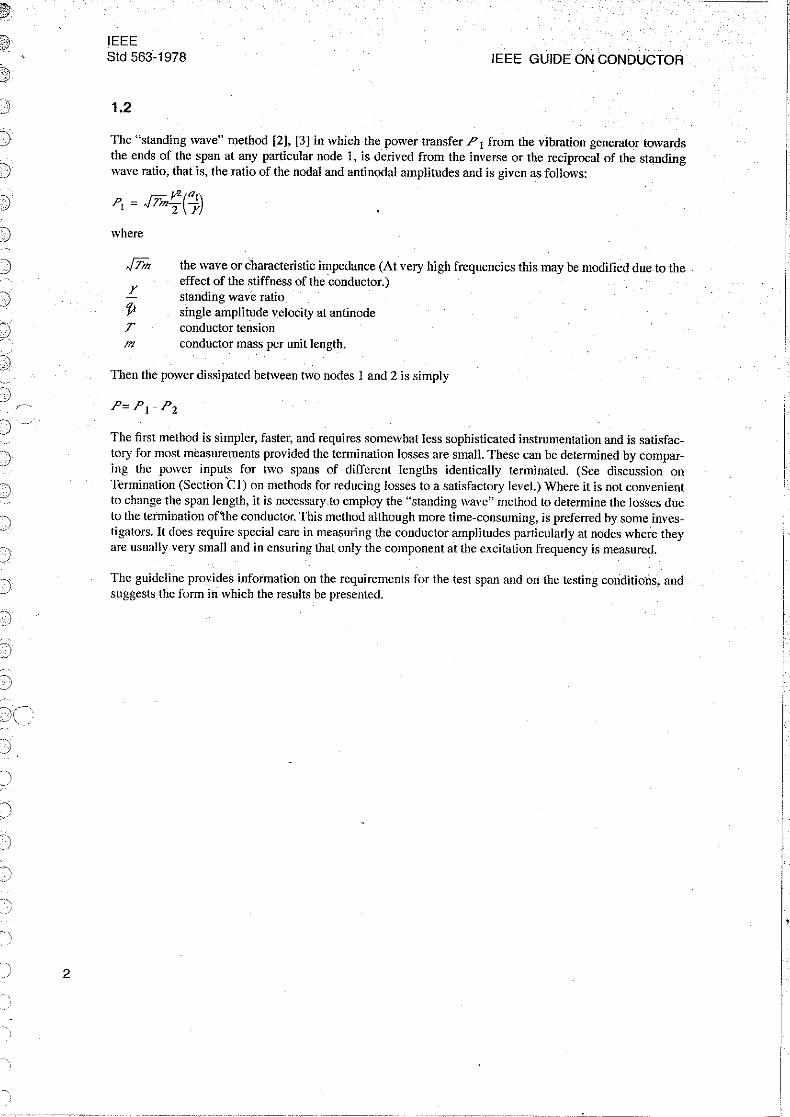
B. Recommended Values of T, I, f, Y
The value of tensile load Tto be used in the test, if not specifically required by a particular conductor application, should be suitably chosen in order to be representative of normal conductor loadings. The following loadings, expressed as percentages of the conductor RfS3 are preferred: 15 (17.5),20 (22.5), 25 (27.5),30 (35),40 (50). (The values in brackets are optional.)
A minimum of three different tensile loads Tshould be used, the medium value of which should correspond to the most common, conductor loading on the line.
A minimum of five different loop lengths eshould be tested. The maximum and minimum loop lengths should correspond to the minimum and maximum frequencies that are generated in the wind velocity range of 3 to 30 kilometres per hour for the particular conductor diameter of interest. The relationship between frequency, wind velocity and conductor diameter is as follows:
3Rated tensile strength,
8
IEEE SELF-DAMPING MEASUREMENTS Std 563-1978
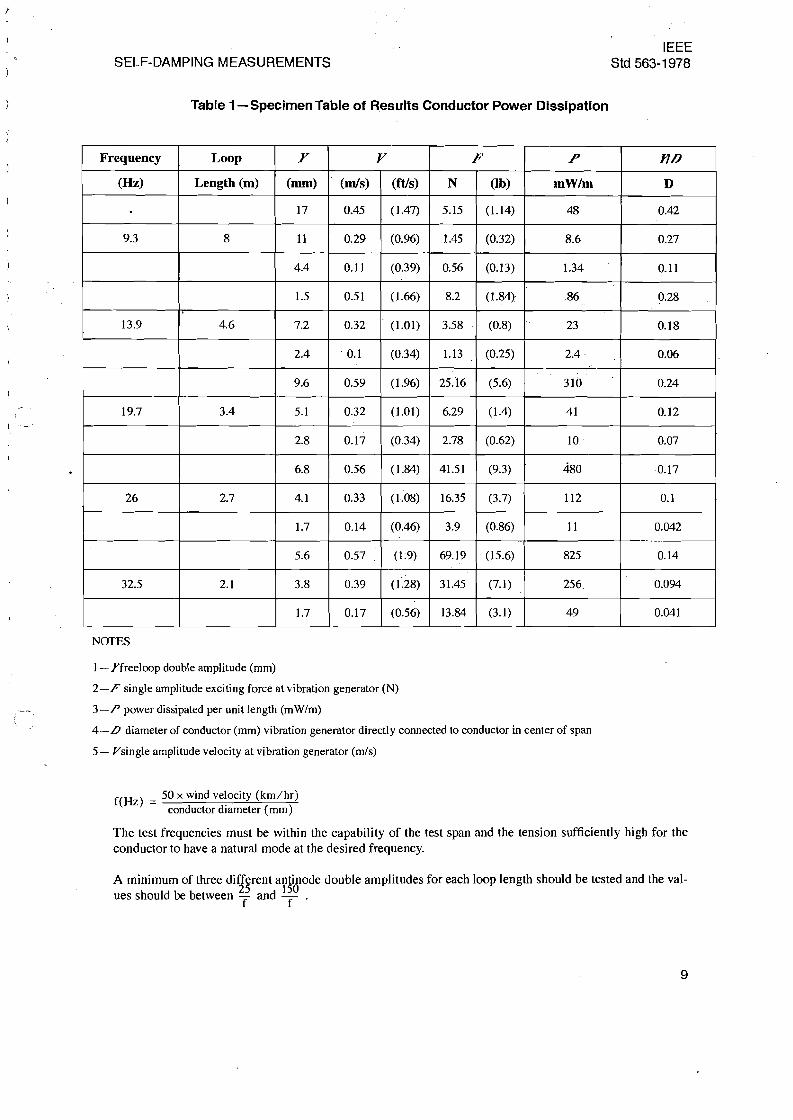
Table 1-Specimen Table of Results Conductor Power Dissipation
Frequency Loop Y 1/ F .P l1LJ
(Hz) Length (m) (mm) (m/s) (ftis) N (Ib) mW/m D
. 17 0.45 (1.47) 5.15 (1.14) 48 0.42
9.3 8 11 0.29 (0.96) 1.45 (0.32) 8.6 0.27
4.4 0.11 (0.39) 0.56 (0.13) 1.34 0.11
1.5 0.51 (1.66) 8.2 (1.84) 86 0.28
13.9 4.6 7.2 0.32 (1.01) 3.58 (0.8) 23 0.18
2.4 ·0.1 (034) 1.13 (0.25) 2.4 0.06
9.6 . 0.59 (1.96) 25.16 (5.6) . 310 0.24
19.7 3.4 5.1 0.32 (1.01) 6.29 (1.4) 41 0.12
2.8 0.17 (0.34) 2.78 (0.62) 10 0.07
6.8 0.56 (1.84) 41.51 (9.3) 480 -0.17
26 2.7 4.1 0.33 (1.08) 16.35 (3.7) 112 0.1
1.7 0.14 (0.46) 3.9 (0.86) 11 0.042
5.6 0.57 (1.9) 69.19 . (15.6) 825
-- .._.
0.14
32.5 2.1 3.8 0.39 (1.28) 31.45 (7.1) 256 0.094
1.7 0.17 (0.56) 13.84 (3.1) 49 0.041
NarES
1- Yfreeloop double amplitude (mm)
2-F single amplitude exciting force at vibration generator (N)
3-P power dissipated per unit length (mW/m)
4-.0 diameter of conductor (mm) vibration generator directly connected to conductor in center of span
5- Vsingle amplitude velocity at vibration generator (m/s)
f(Hz) = 50 x wind velocity (km/hr) conductor diameter (mm)
The test frequencies must be within the capability of the test span and the tension sufficiently high for the conductor to have a natural mode at the desired frequency.
A minimum of three different antinode double amplitudes for each loop length should be tested and the val25 150
ues should be between T and f .
9
IEEE SId 563-1978 IEEE GUIDE ON CONDUCTOR
It is recommended that the loop lengths chosen be common to all the tensile loads Tused. It is also recommended that, within the previously suggested range values of Y, a number of antinode displacement ampli
) tudes be selected that are common to all the loop lengths used.
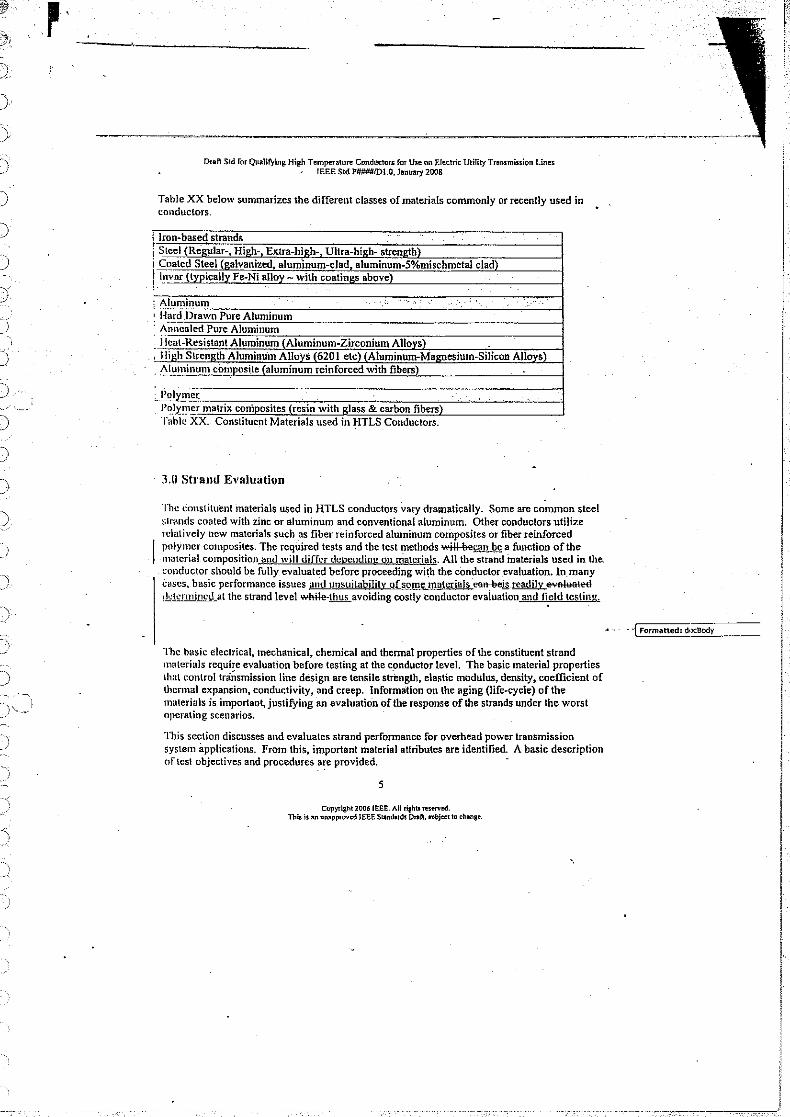
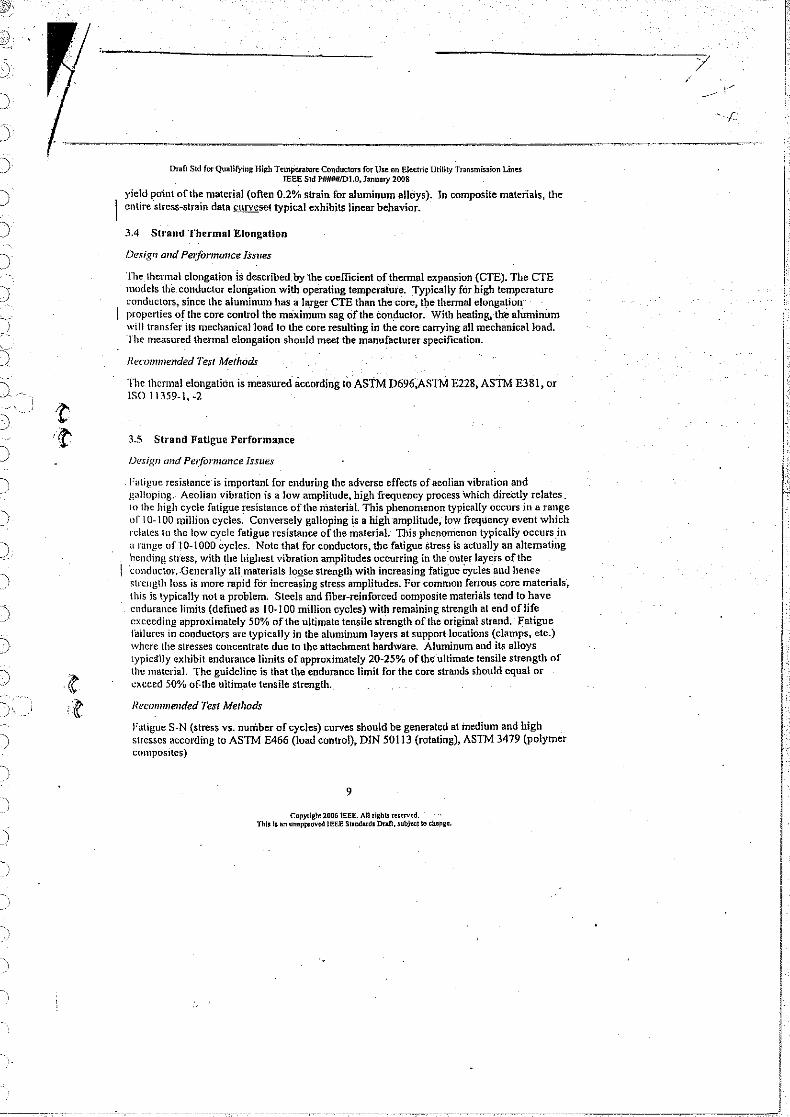
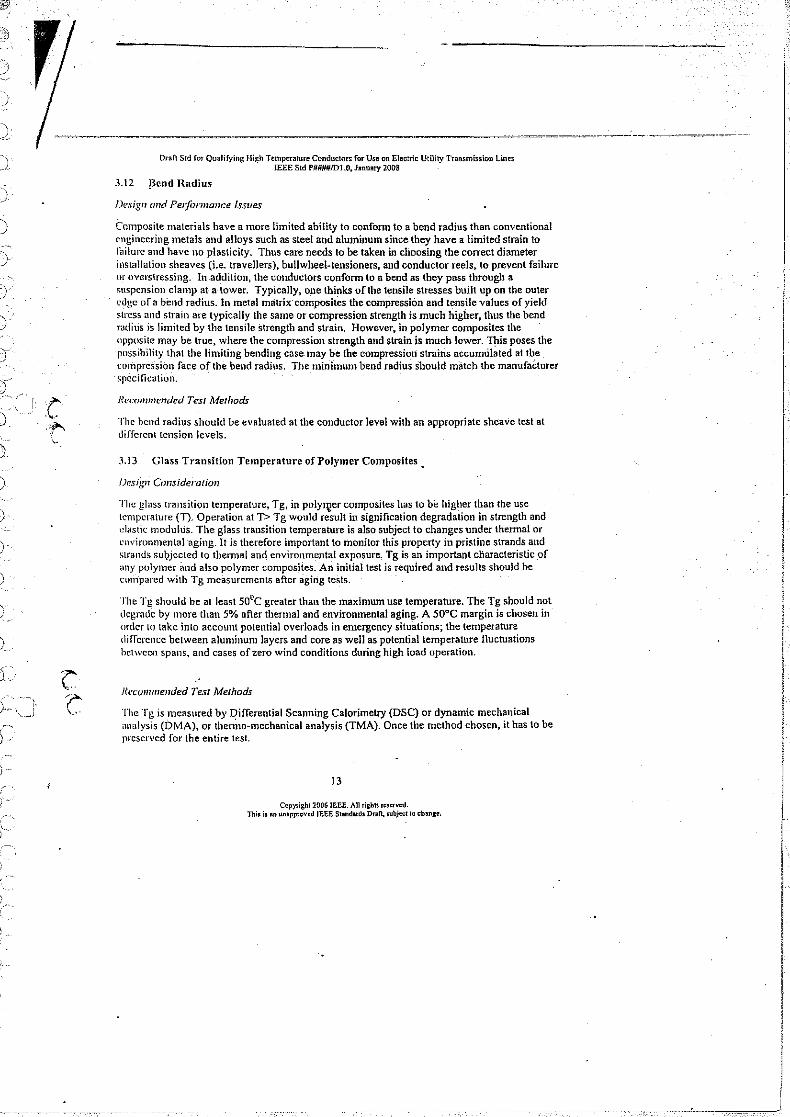
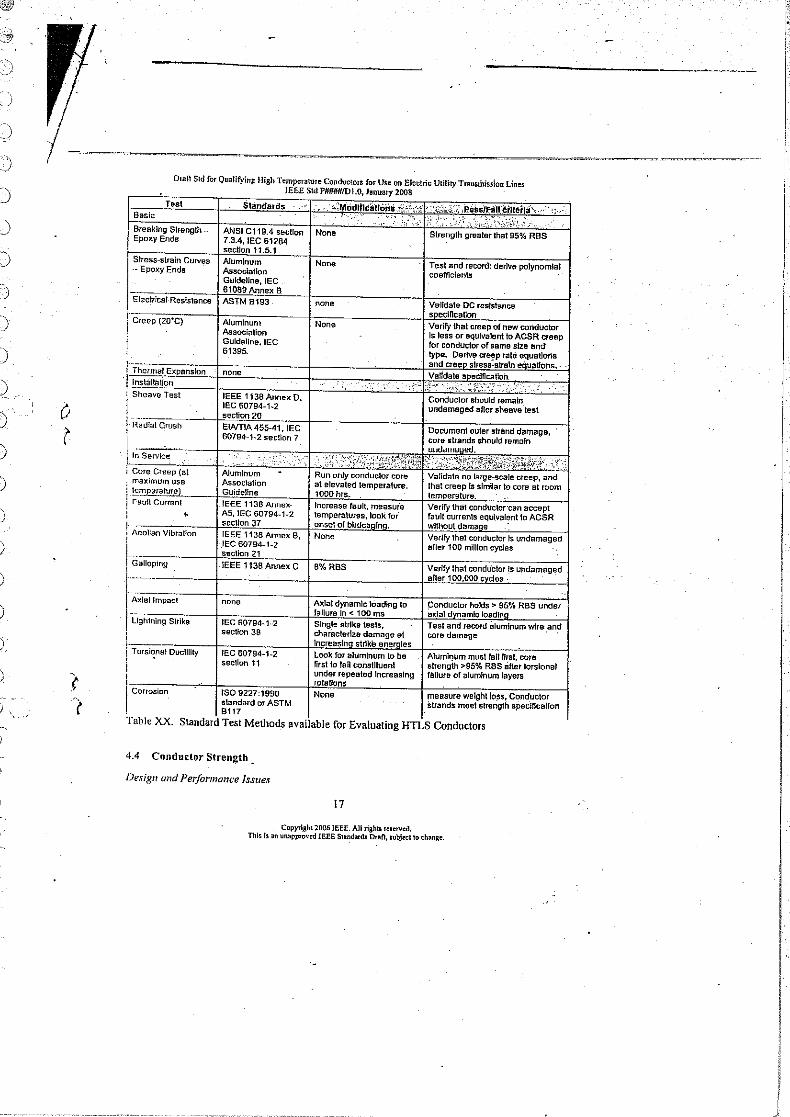
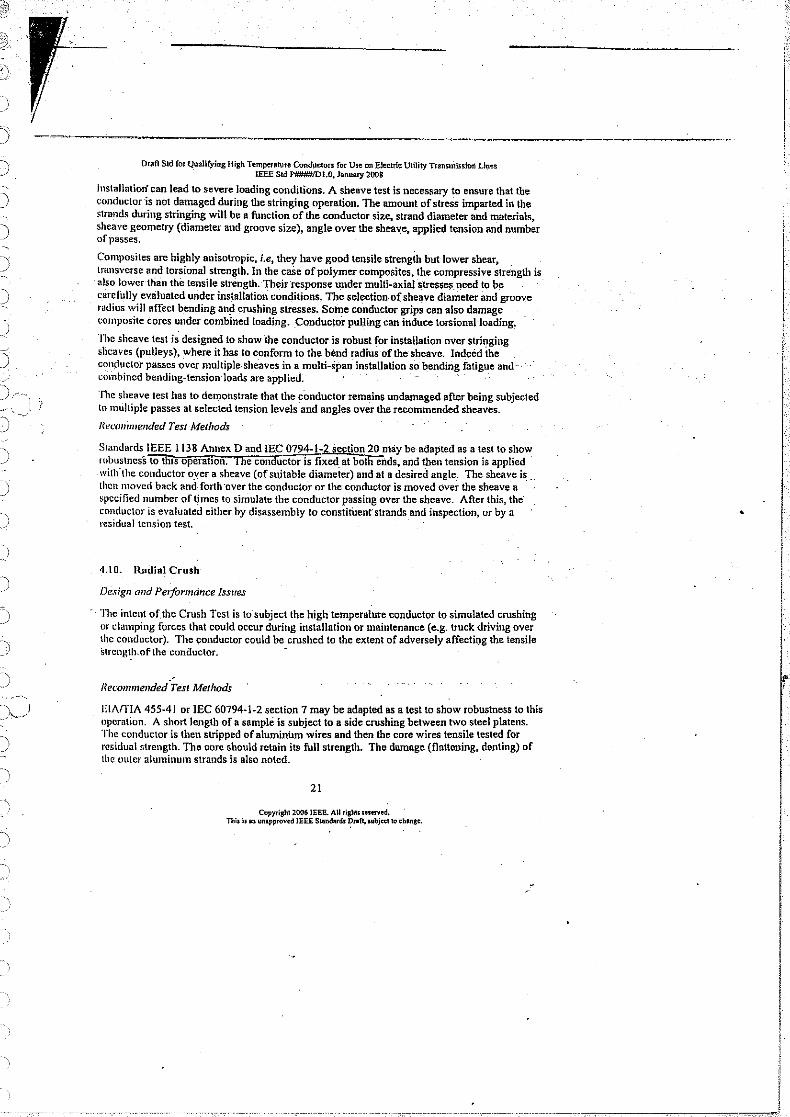
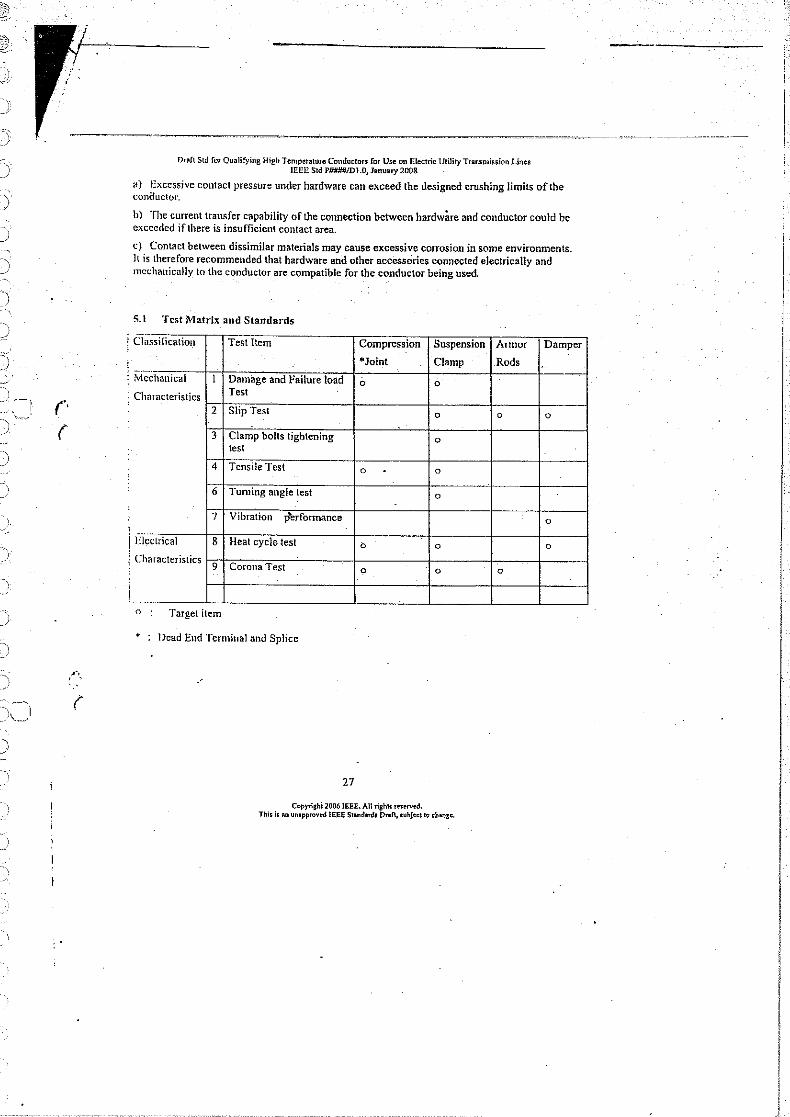
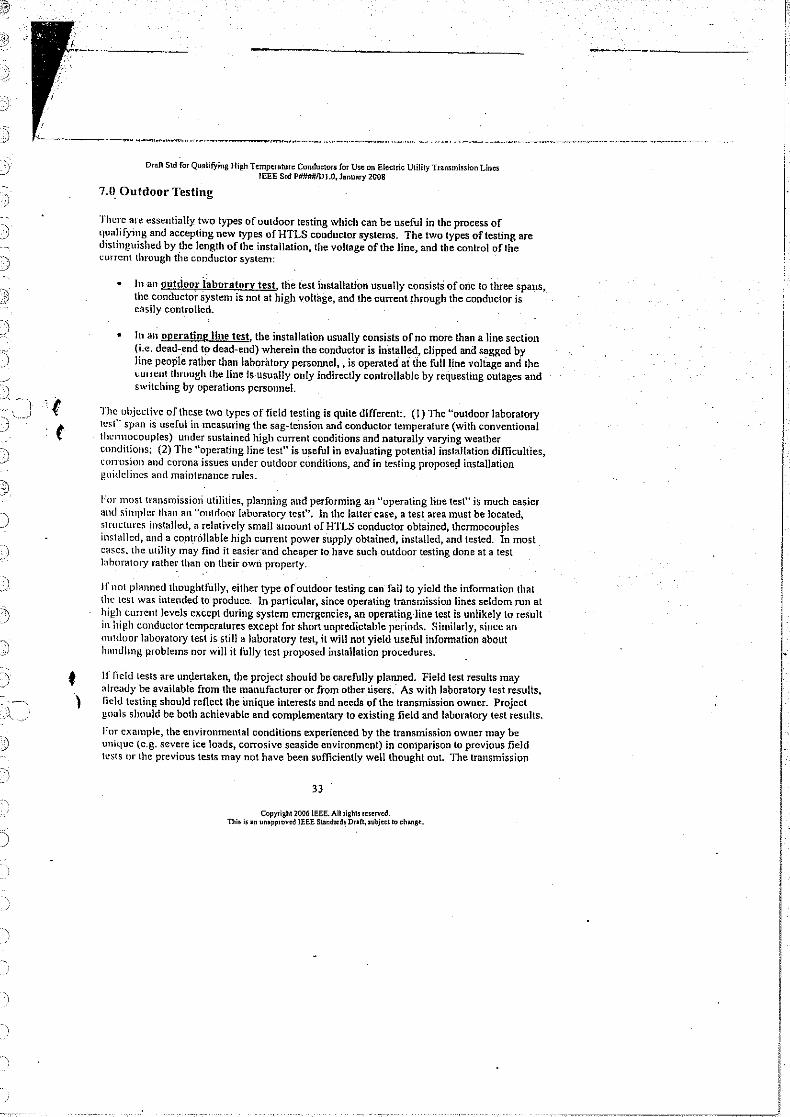
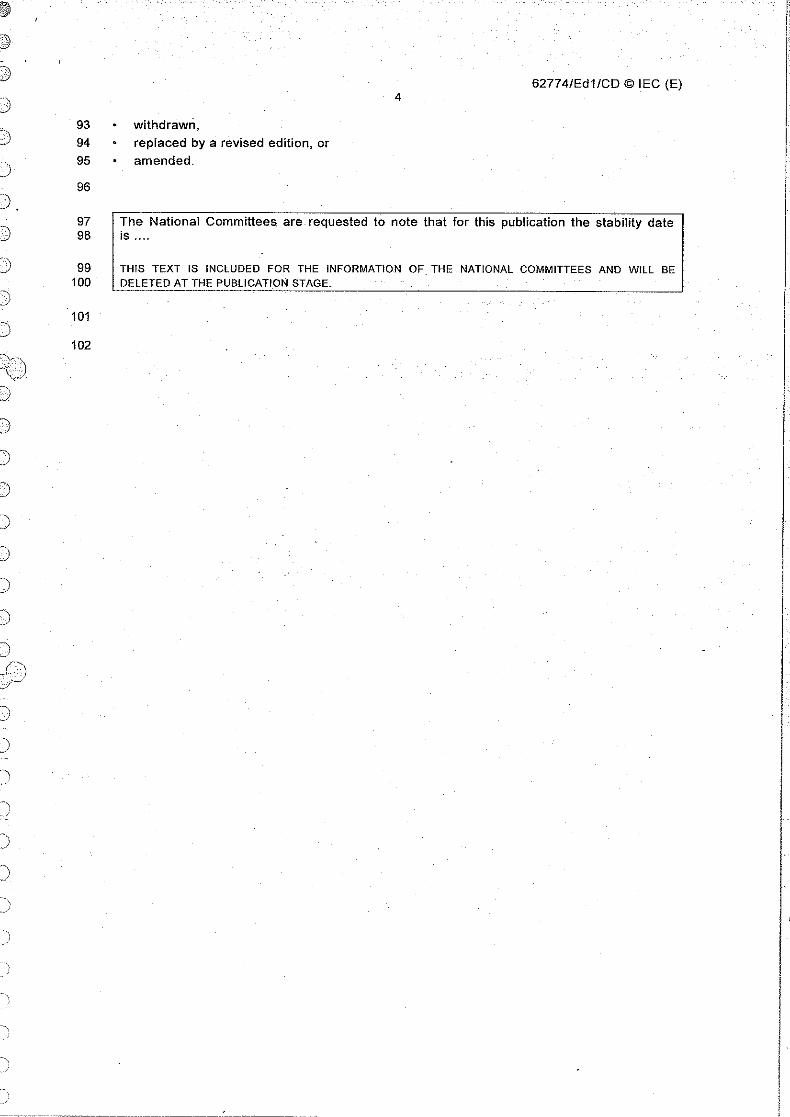
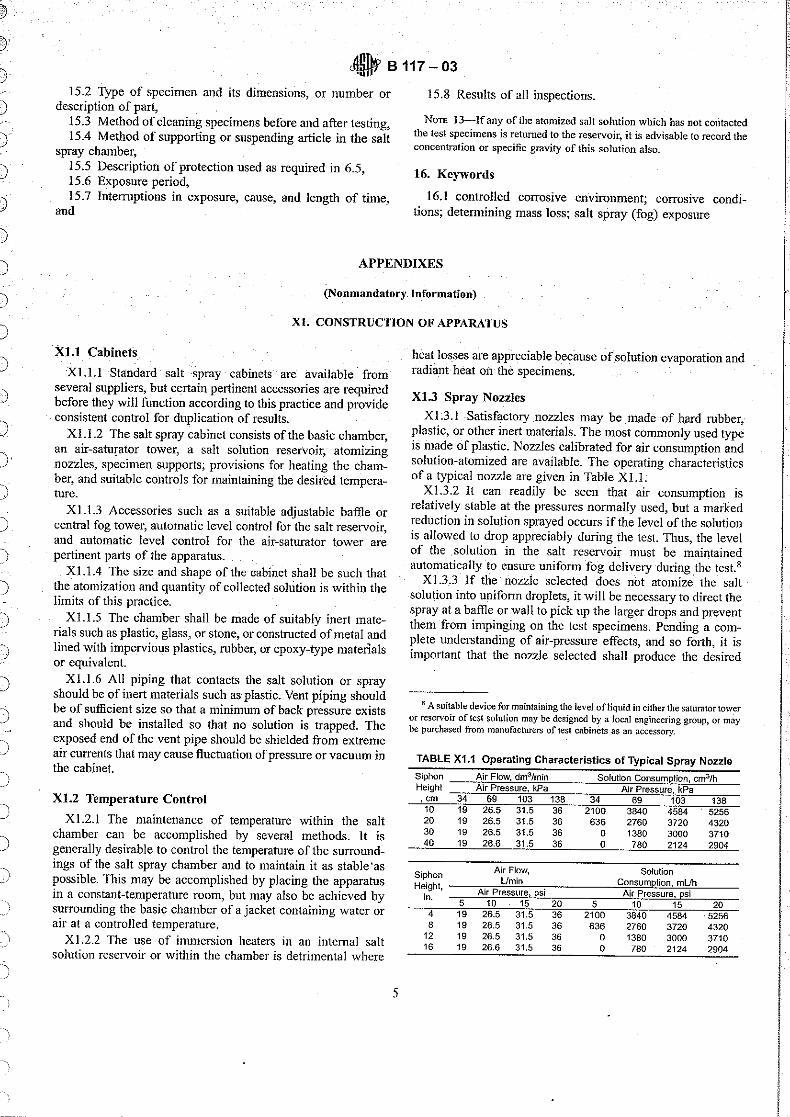
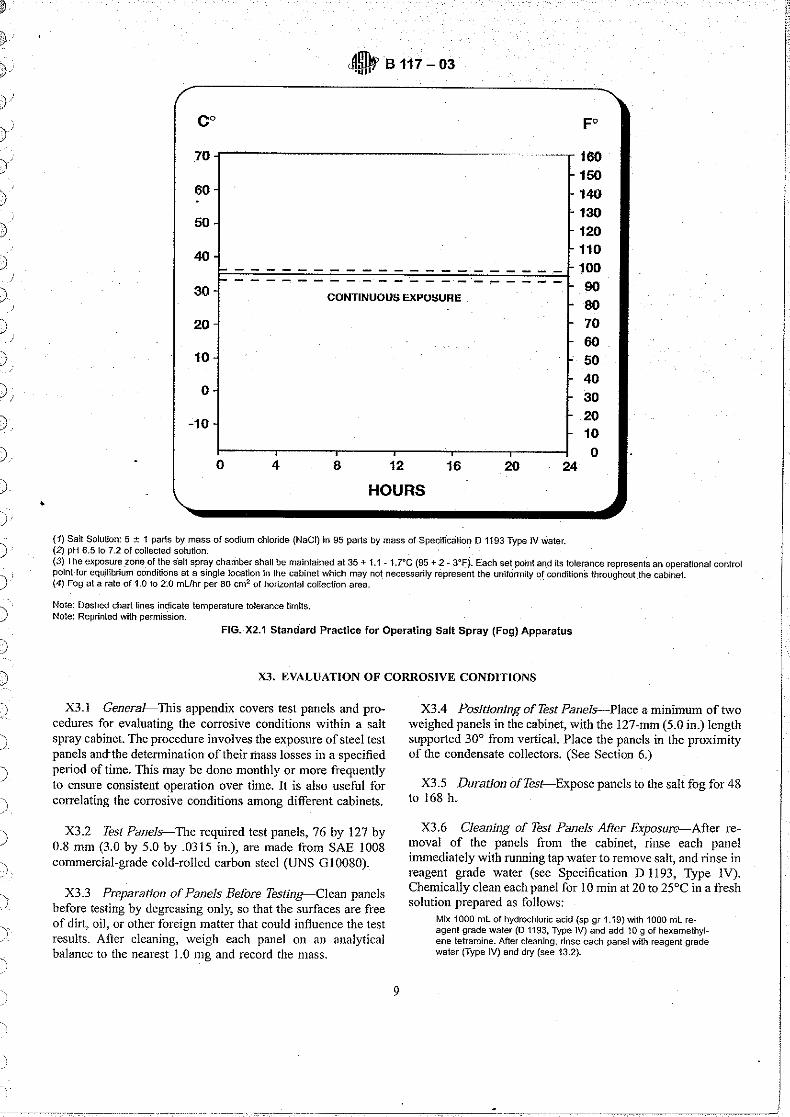
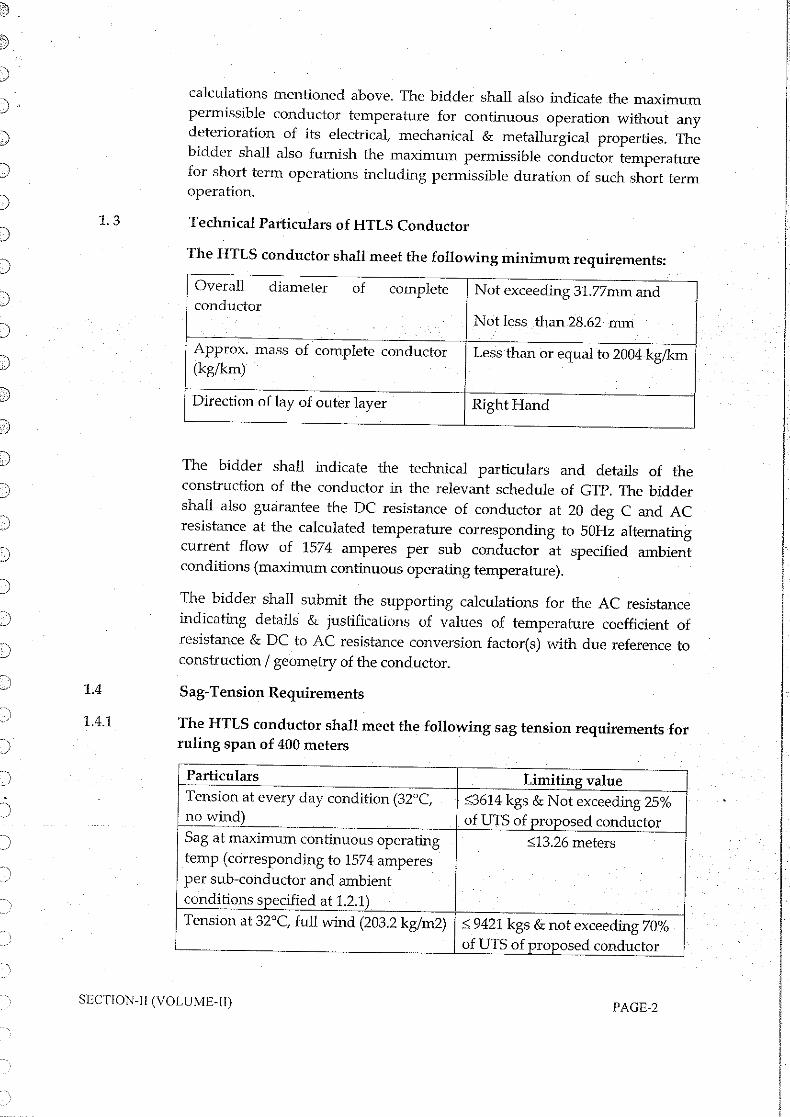
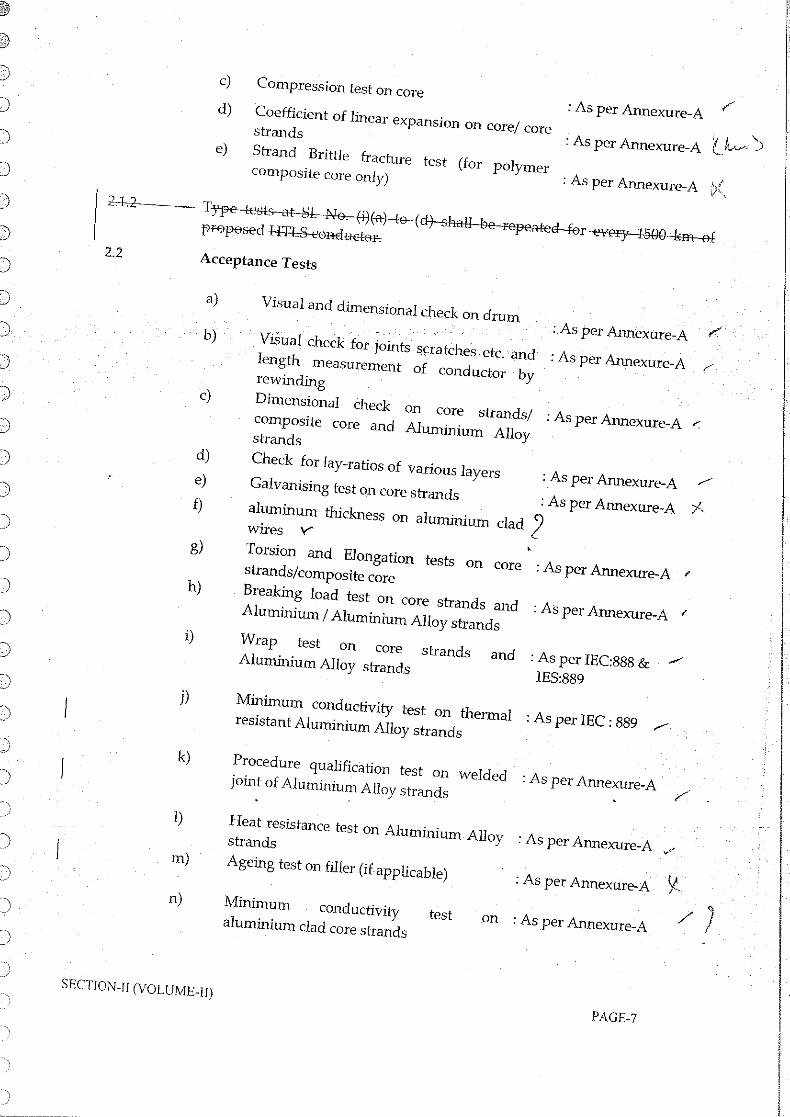
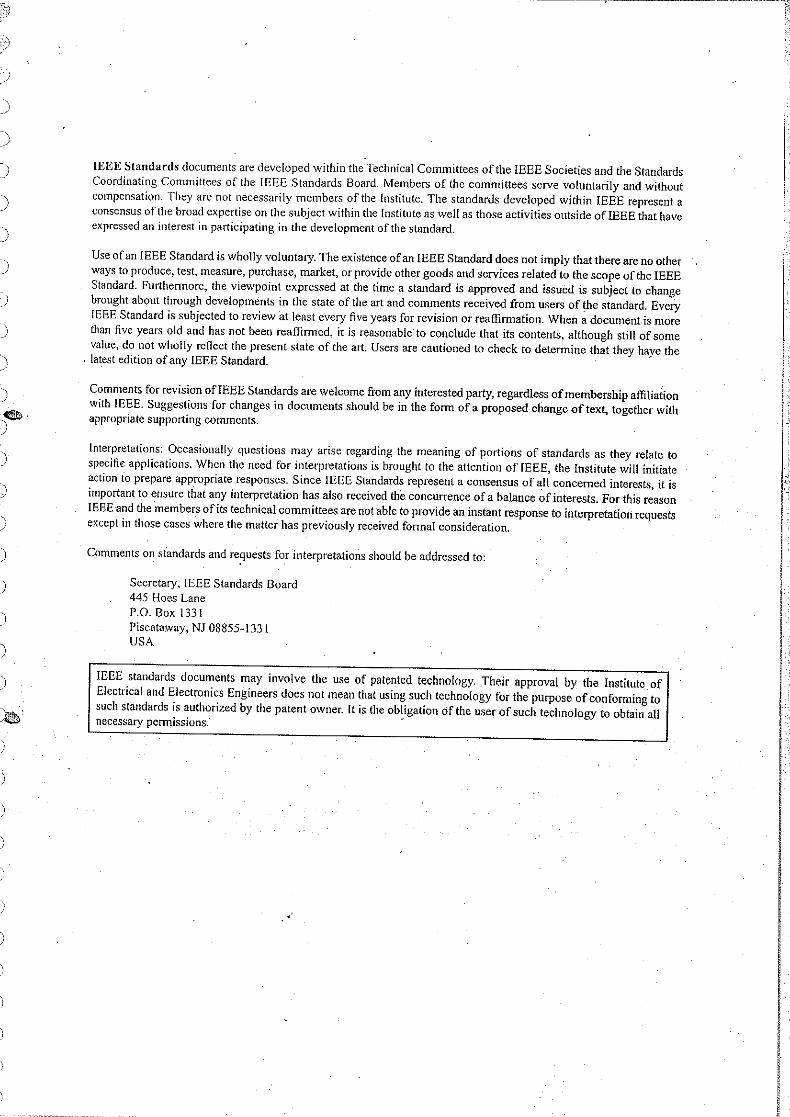
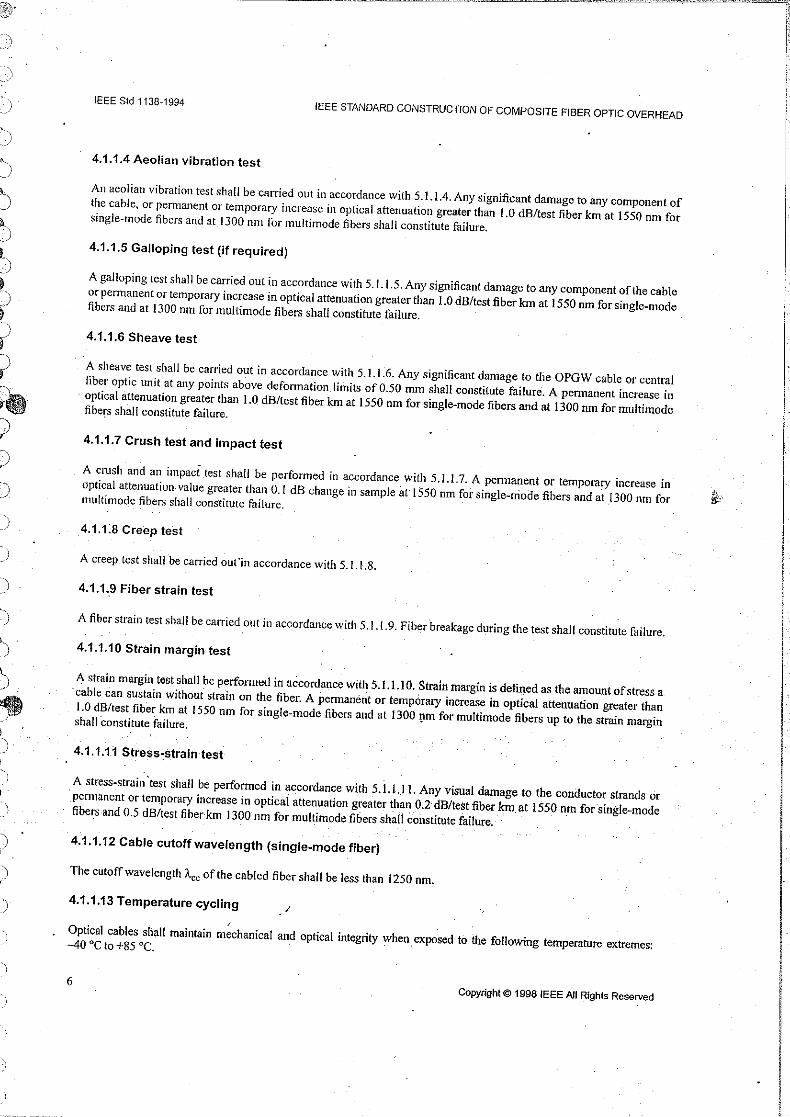
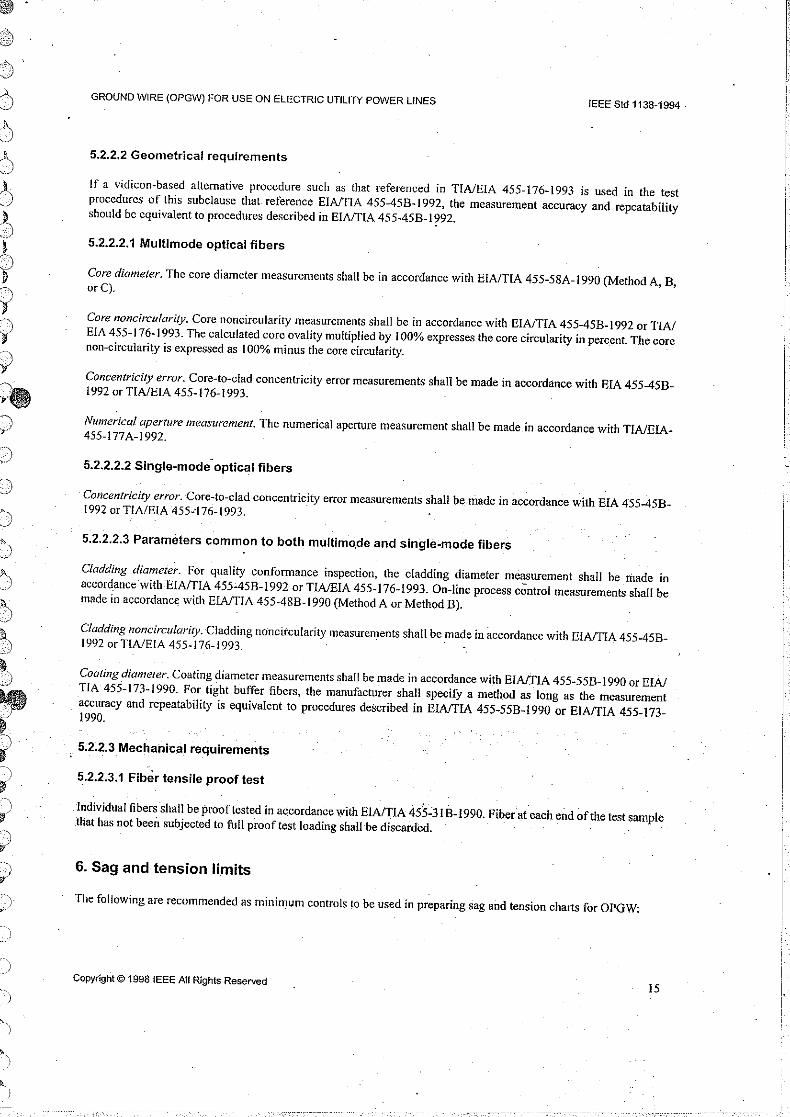
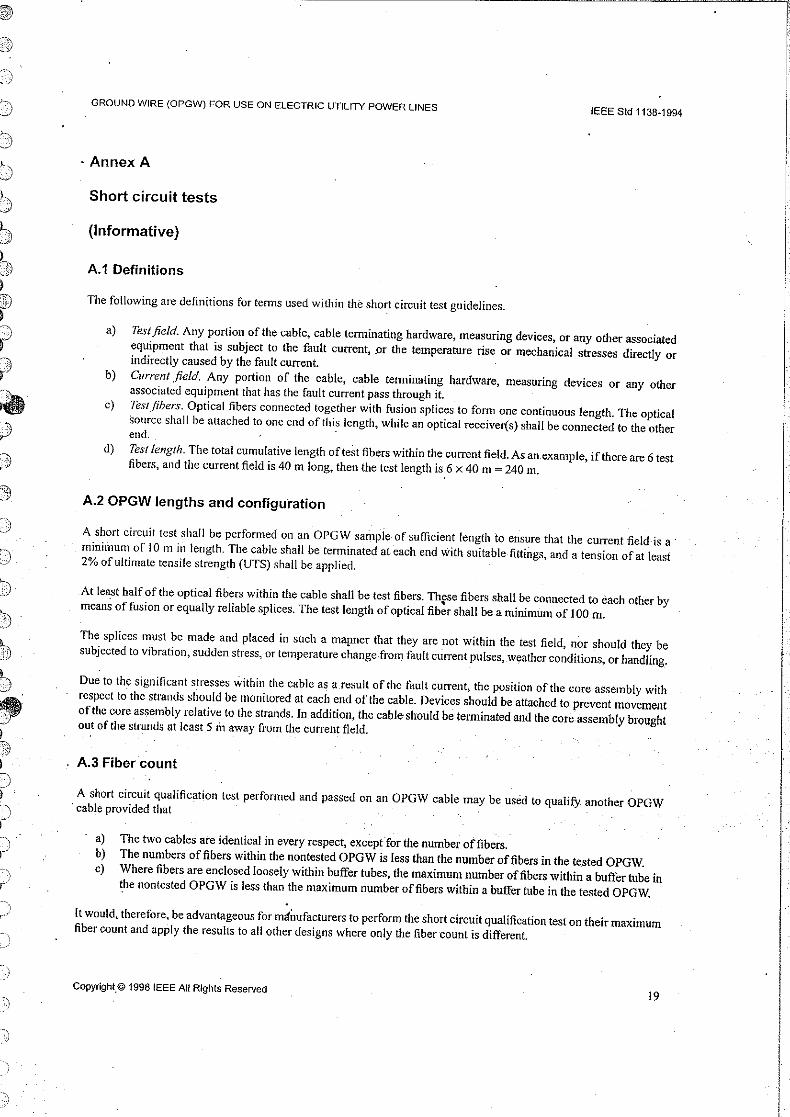
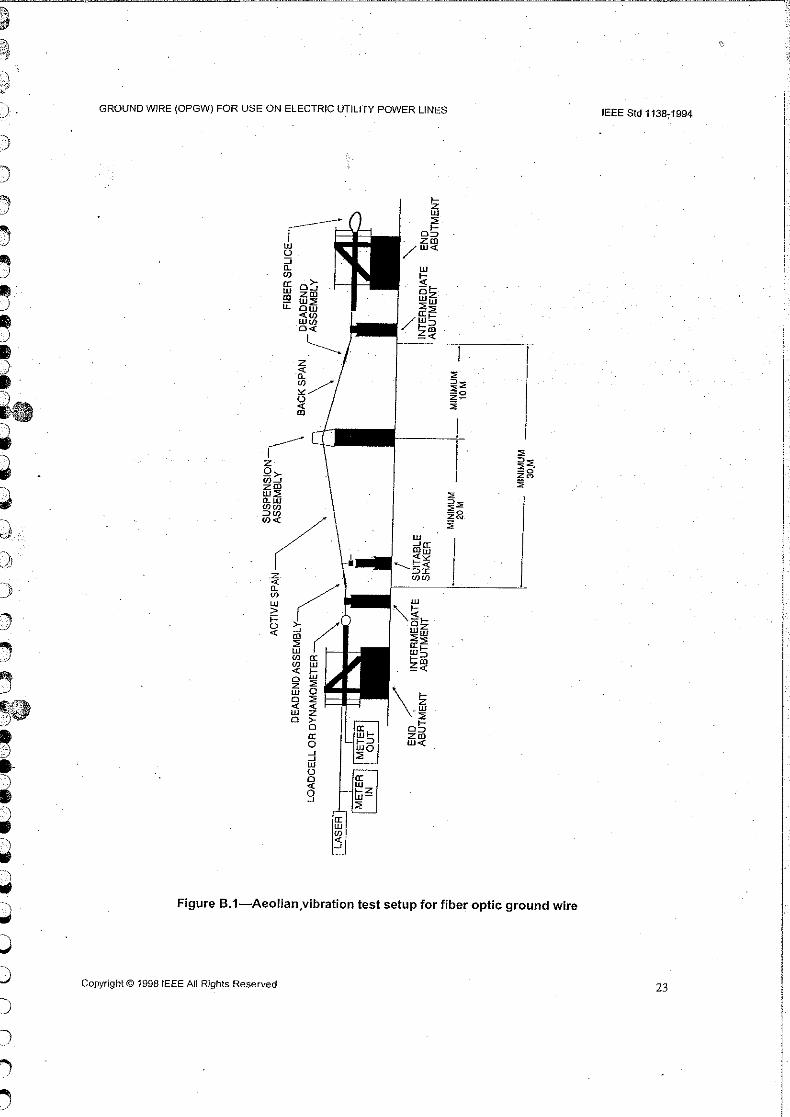
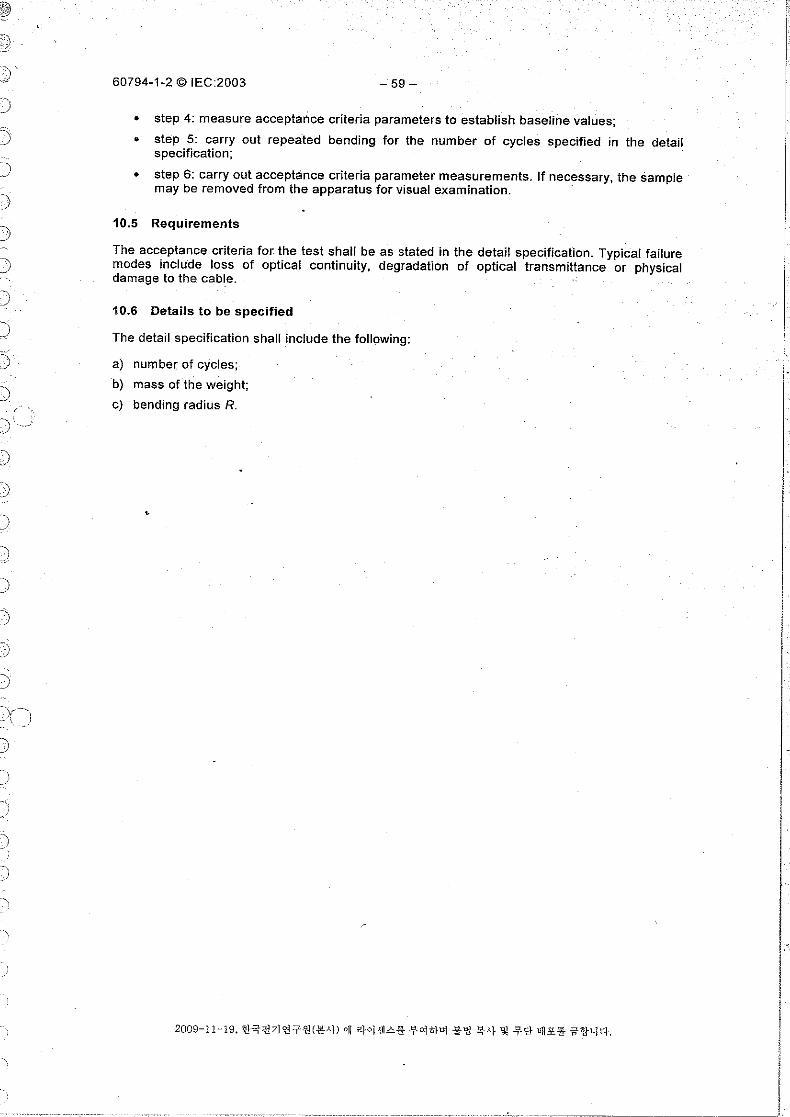
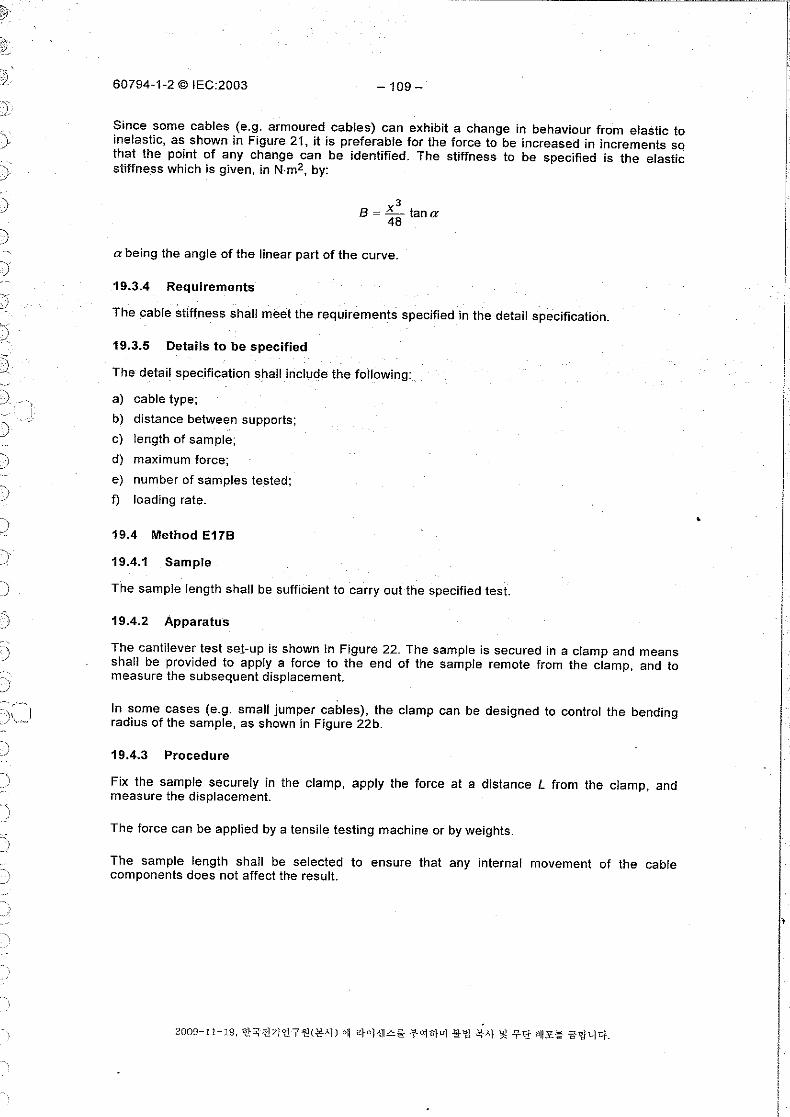
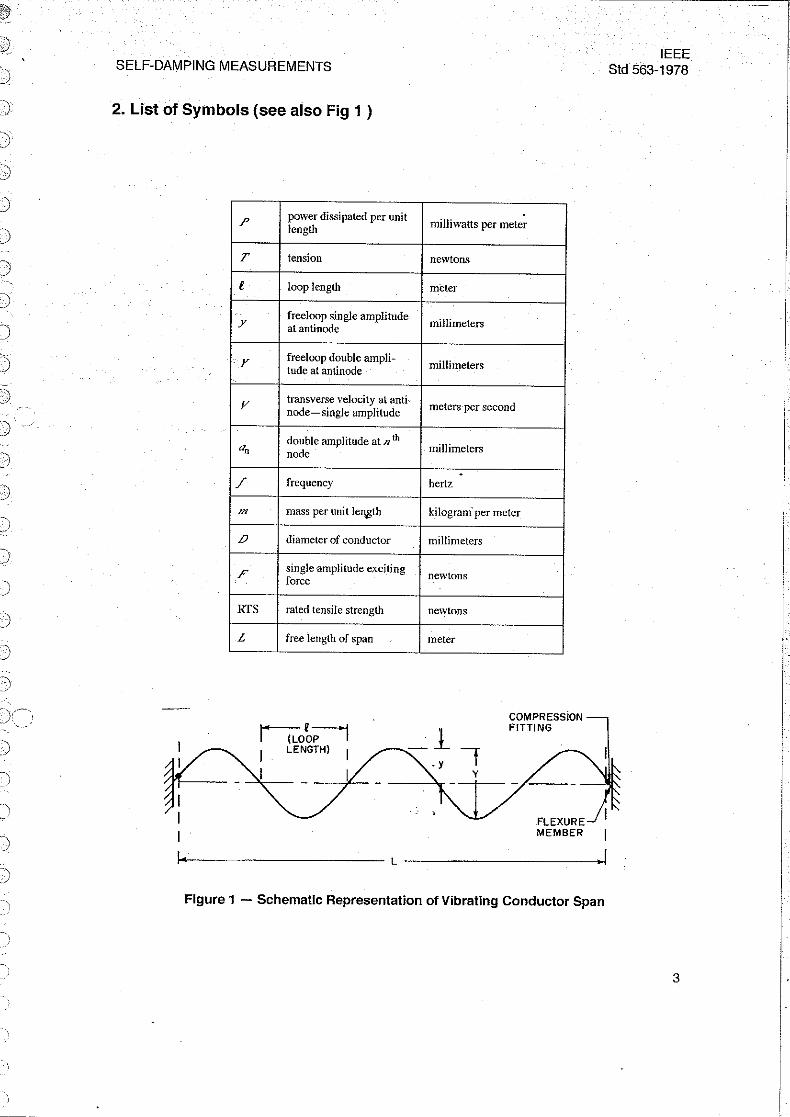
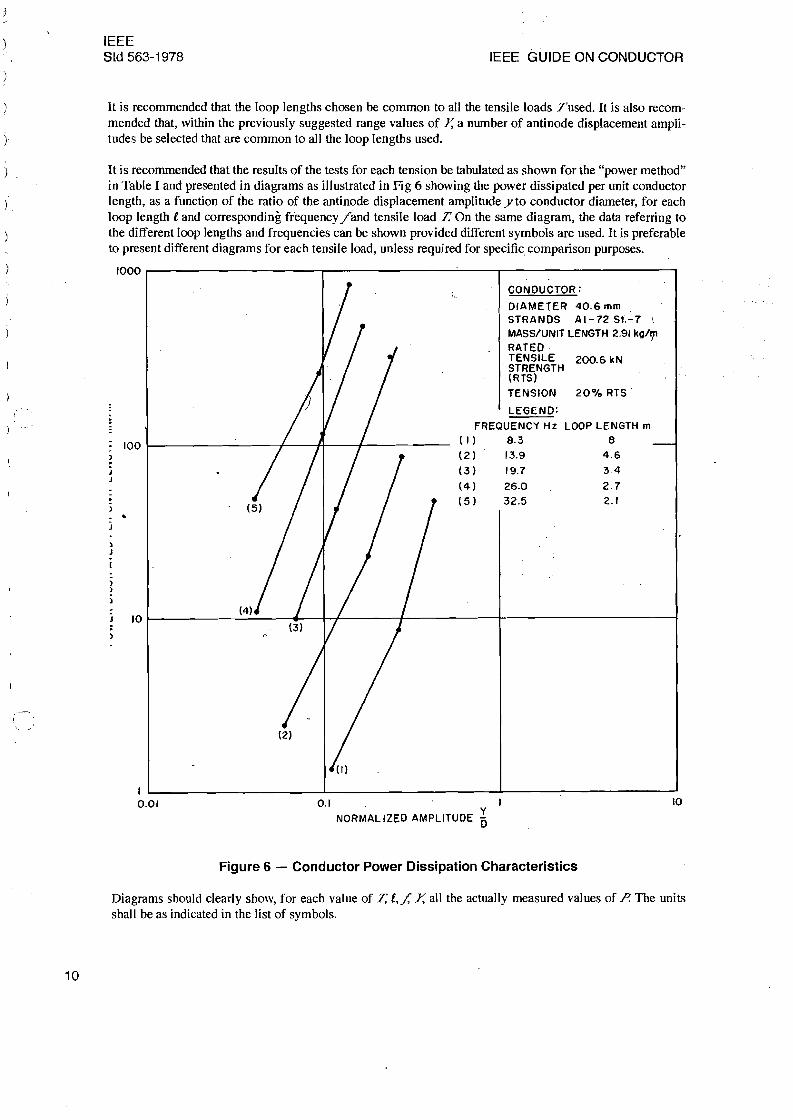
It is recommended that the results of the tests for each tension be tabulated as shown for the "power method" in Table I and presented in diagrams as illustrated in Fig 6 showing the power dissipated per unit conductor length, as a function of ihe ratio of the antinode displacement amplitude yto conductor diameter, for each loop length eand corresponding frequency /and tensile load T. On the same diagram, the data referring to the different loop lengths and frequencies can be shown provided different symbols are used. It is preferable to present different diagrams for each tensile load, unless required for specific comparison purposes.
/000 I
CONDUCTOR:i ..
DIAMETER 40.6 mm STRANDS AI-72 St.-7 MASS/UNIT LENGTH 2.9/ kg/?" RATED TENSILE 200.6 kN
. STRENGTH (RTS)
TENSION 20% RTS .
LEGEND:
FREQUENCY Hz LOOP LENGTH m ( I ) 8.3 8100 I (2) 13.9 4.6
(3) 19.7 3.4
(4) 26.0 2.7
(5) 32.5 2.1
•
10 I I I
" I i I
0.01 0.1 . 10
NORMAL IZED AMPLITUDE 5
Figure 6 - Conductor Power Dissipation Characteristics
Diagrams should clearly show, for each value of 7; e,./. Y, all the actually measured values of P. The units shall be as indicated in the list of symbols.
iii
In}
.., ~ I I ,} y
10
IEEE .. SELF-DAMPING MEASUREMENTS Std 563-1978
)
9. References
[1] CLAREN, R. and DIANA, G. Mathematical Analysis of Transmission Line Vibration. /EEE 7hmsactiollSonPowerApparatllsandSyslems, vol PAS-88, no 12, pp 1741-1767.
[2] TOMKINS, J. S., MERRILL, L. L., JONES, B. L. Quantitative Relationships in Conductor Vihration Damping. A/EE, 7Tansactions, pl//J; (PowerApparatus alld$yslem,IJ, vol 75, pp 879-884, October 1956.
[3] SEPPA, T. O. Self-Damping Measurement and Energy Balance of ACSR DRAKE. Presented at the 1971 Winter Power Meeting, New York, N.Y. January 3I-February 5,1971.
[4] Aeolian Vibratiolloll Overhead Lines, ClGRE Paper 22-11 (1970).
~
11
;: .
~
r--.. II I
IEEE Std 563-1978 IEEE GUIDE ON CONDUCTOR
Annex
(informative)
Appendix
(This Appendix IS nora parr0.//£££Srd50.1-/978, GHkle on CO~/dHcroTSe(/-lJamping MetlSHTemenrs.)
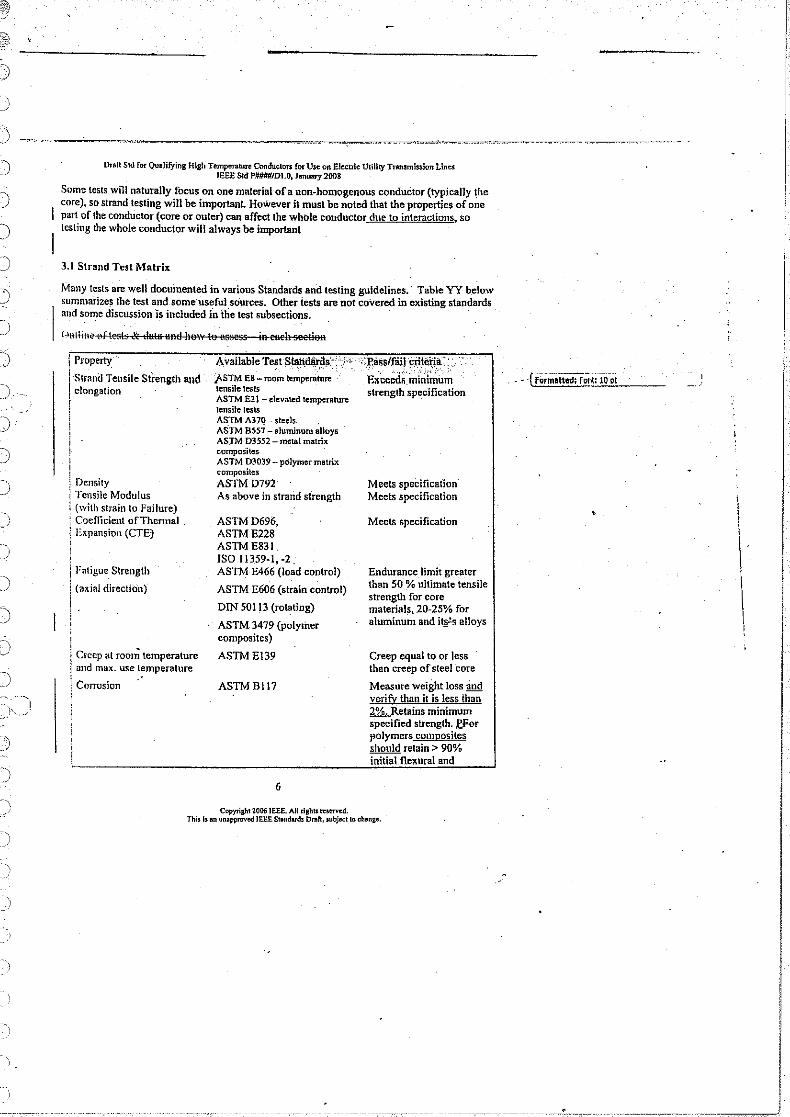
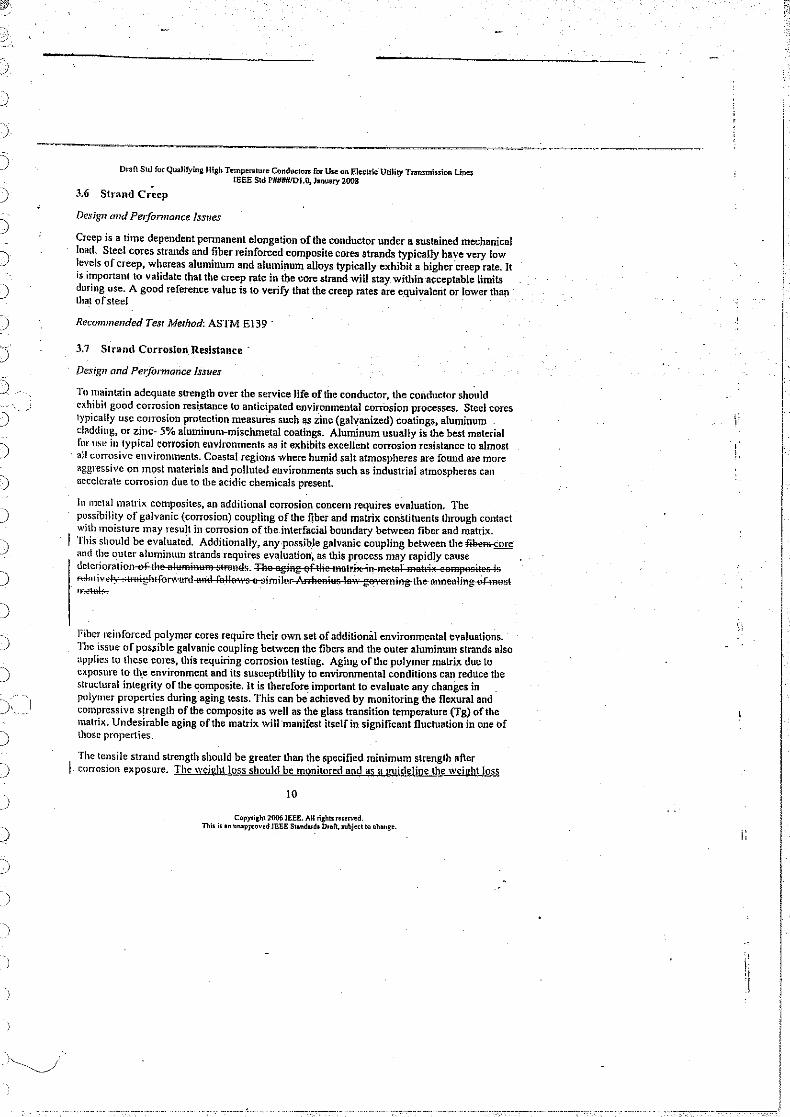
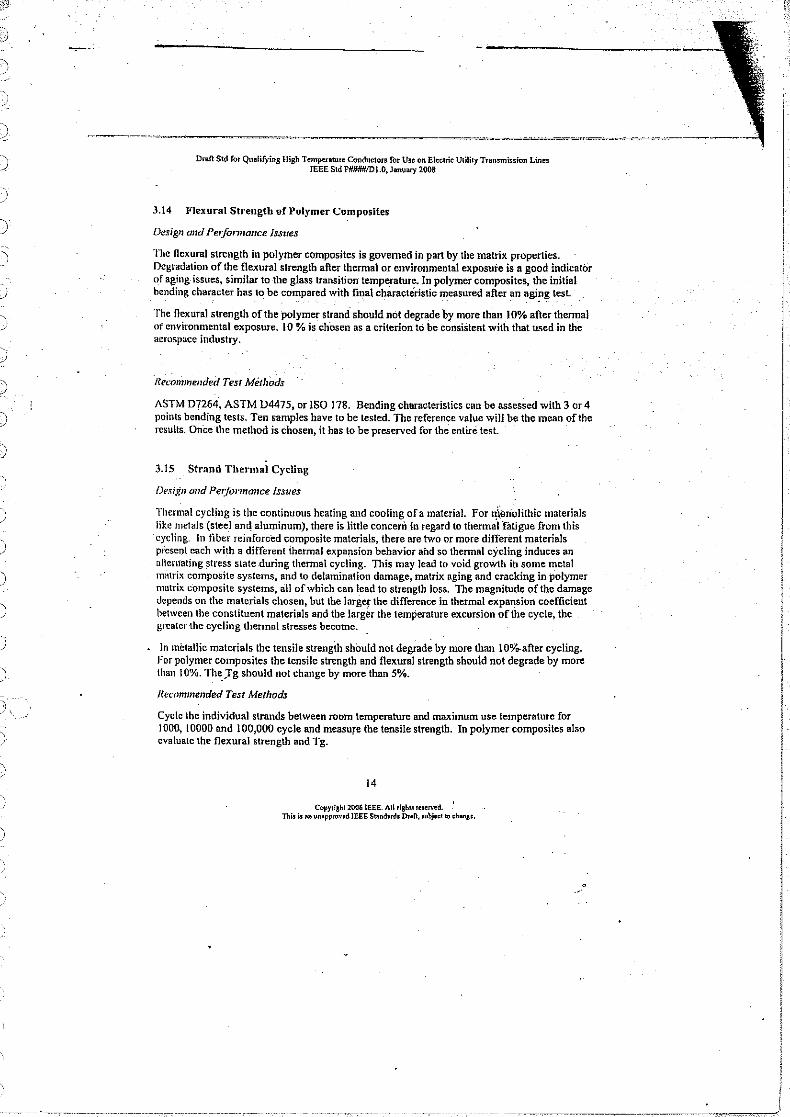
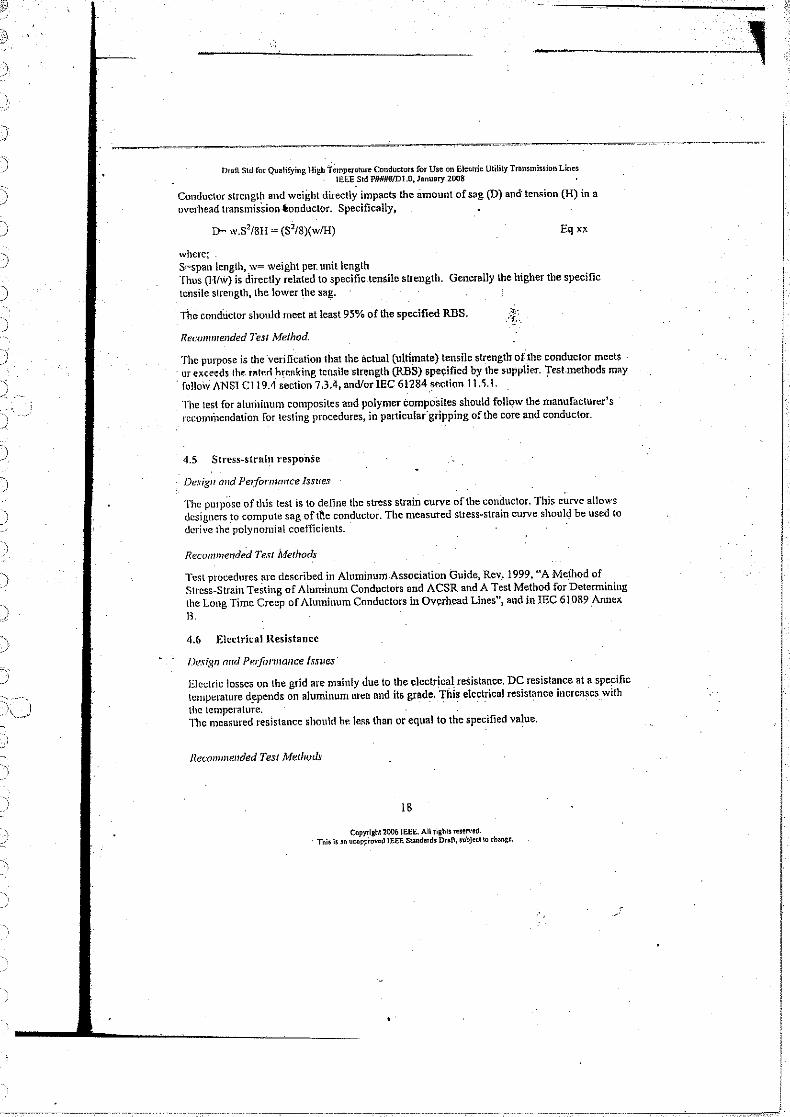
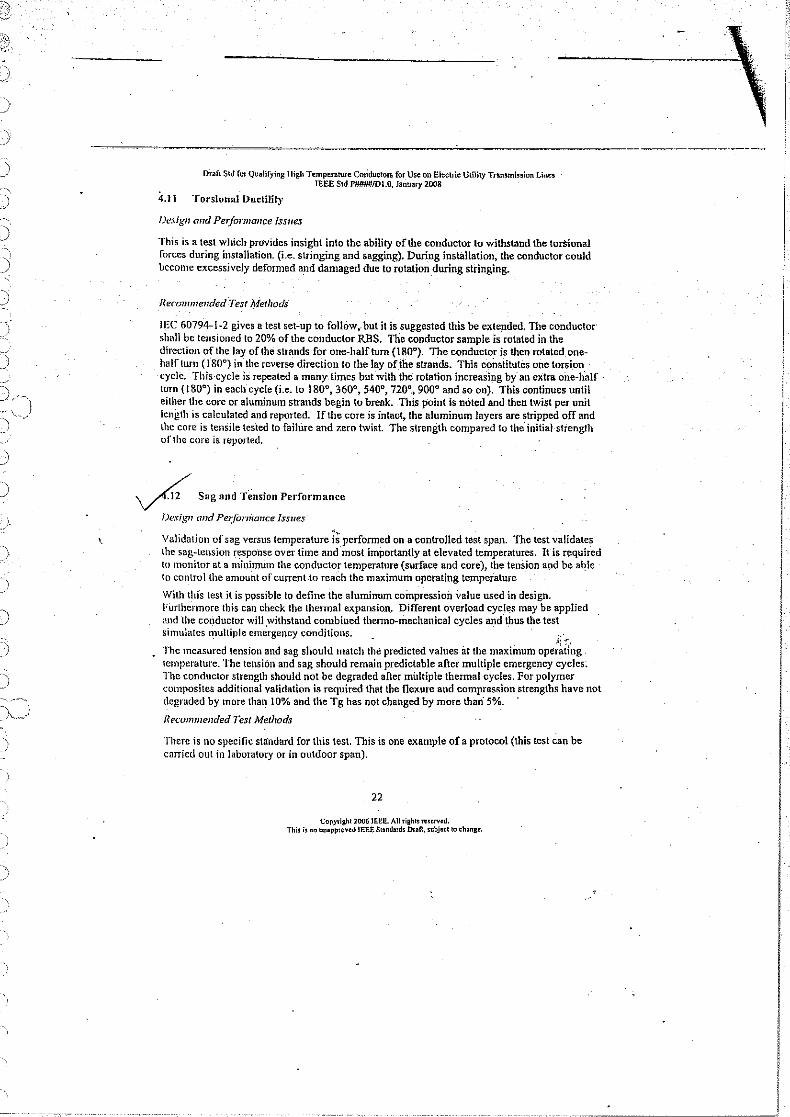
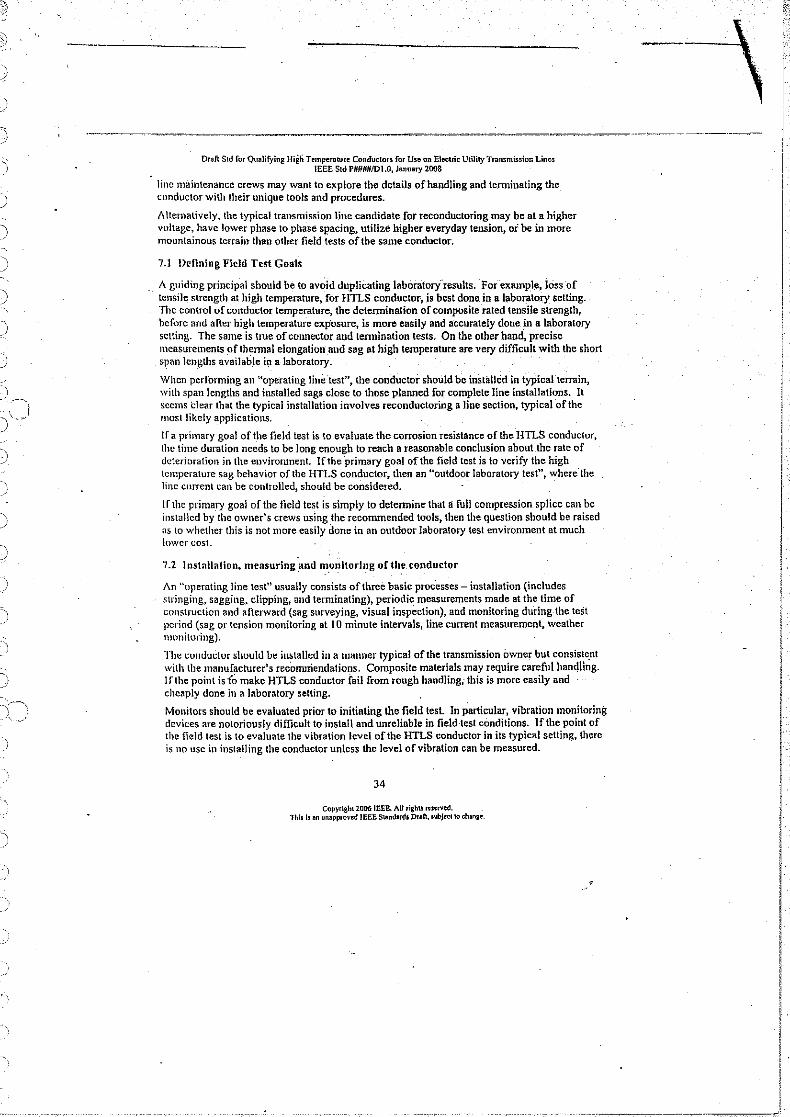
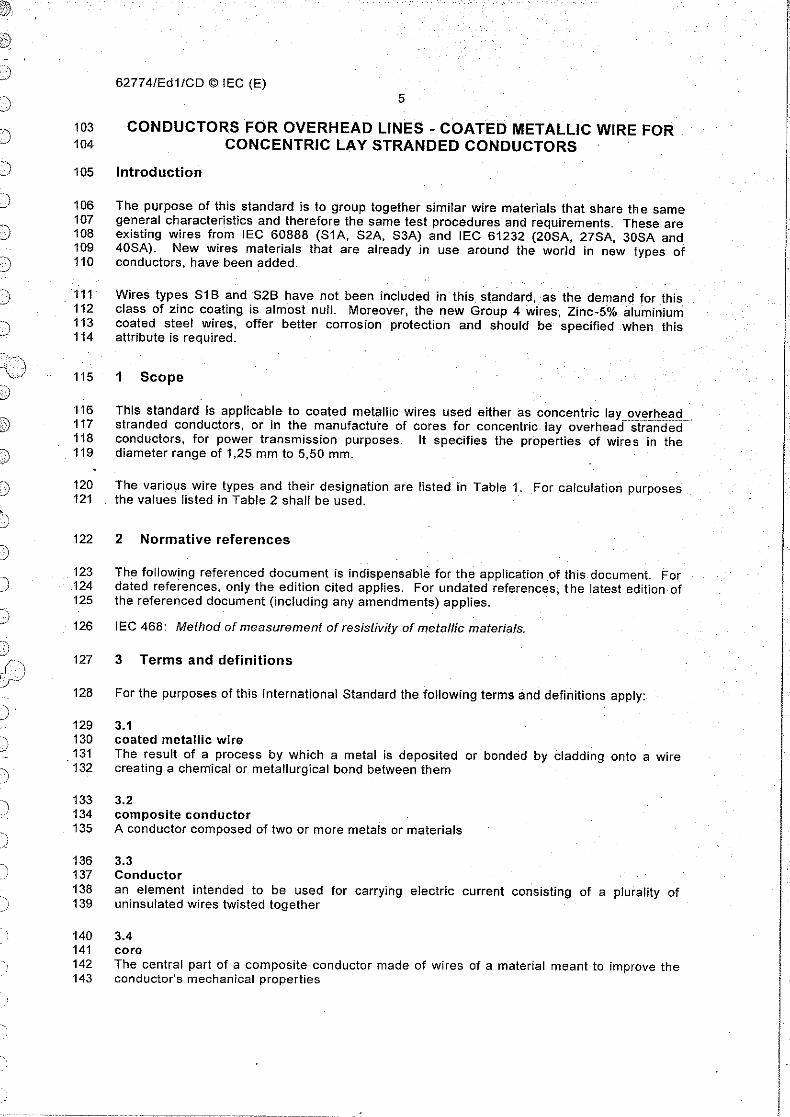
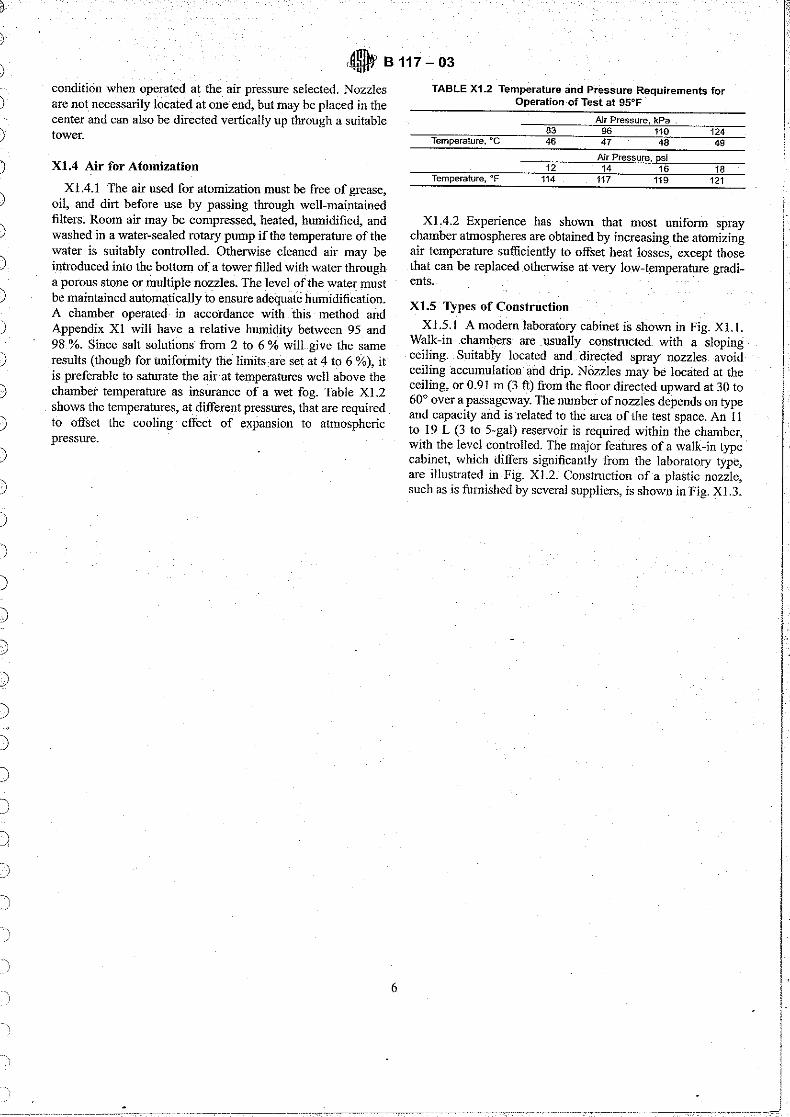
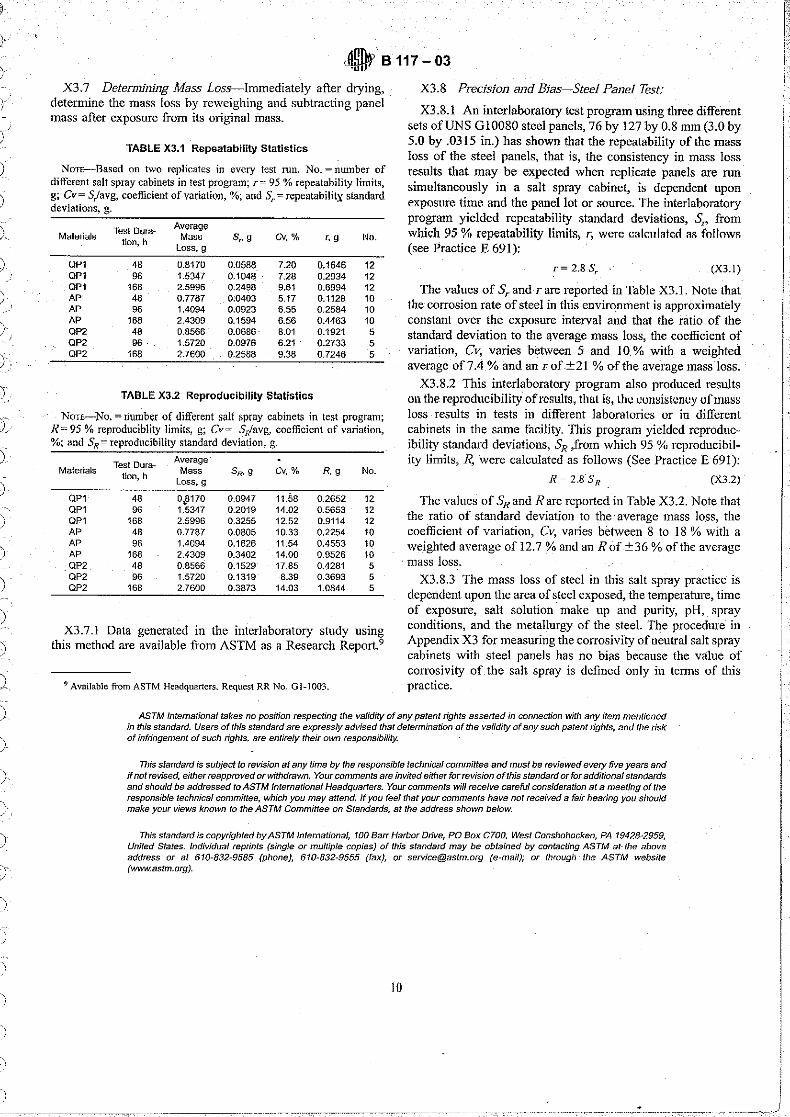
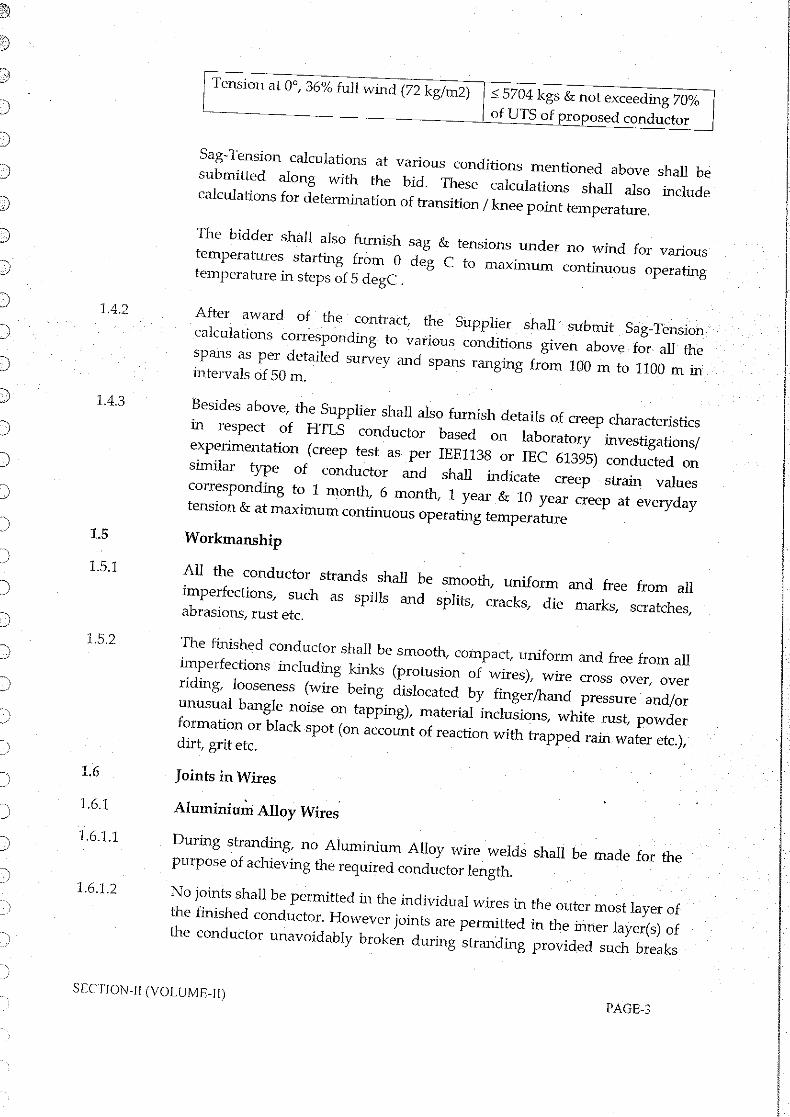
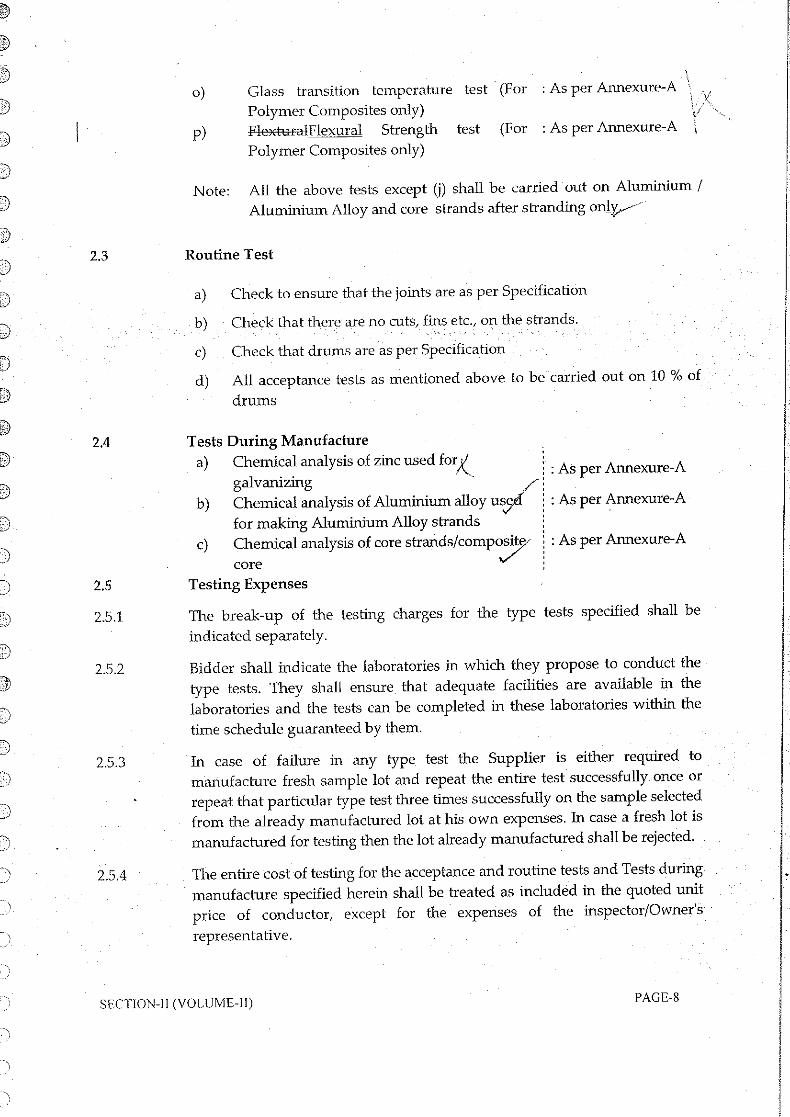
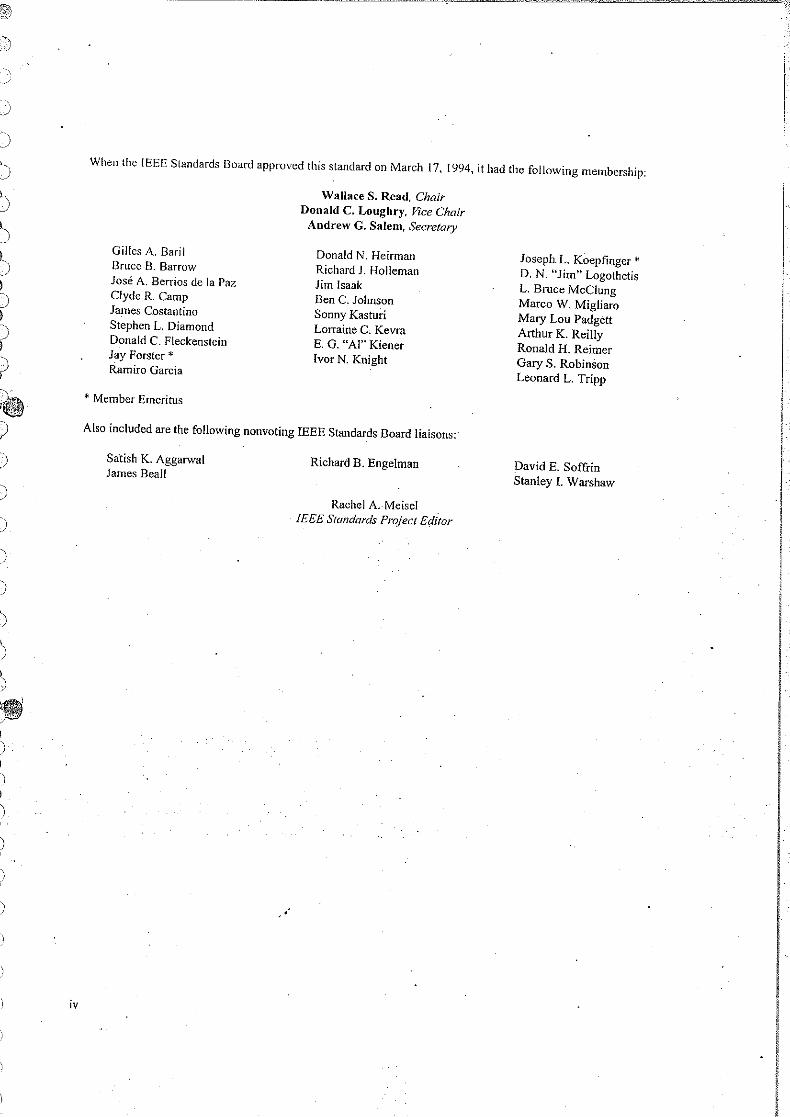
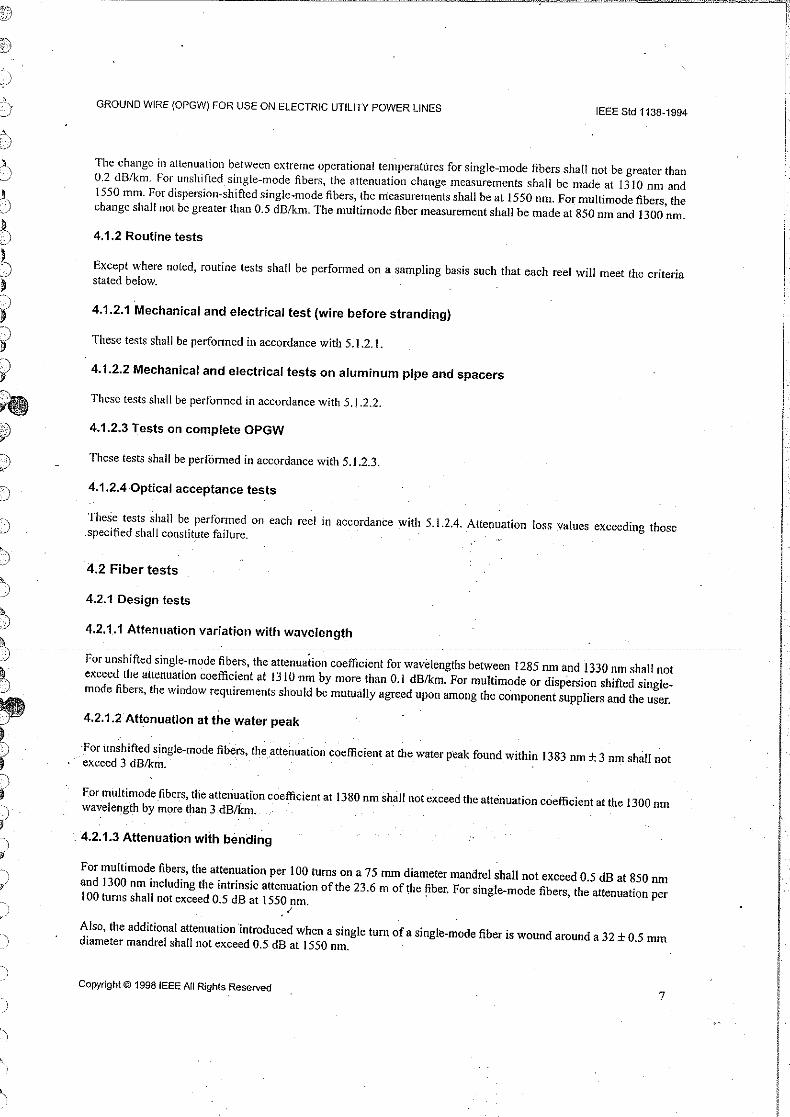
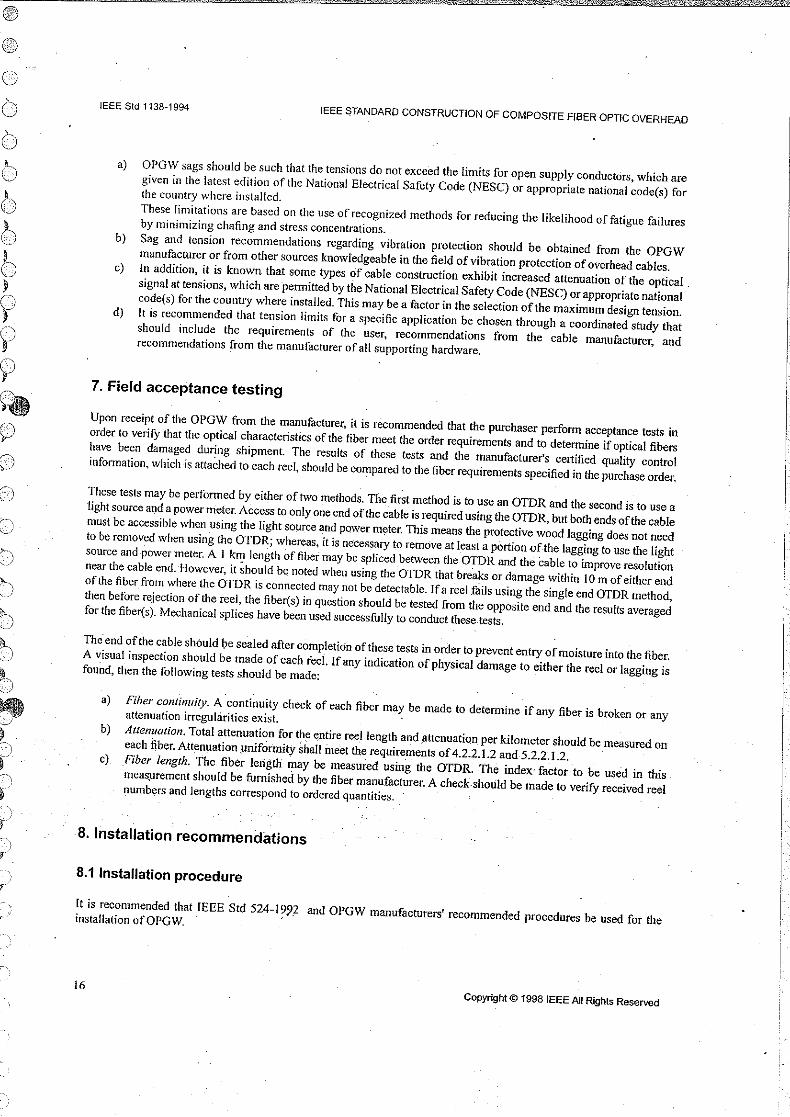
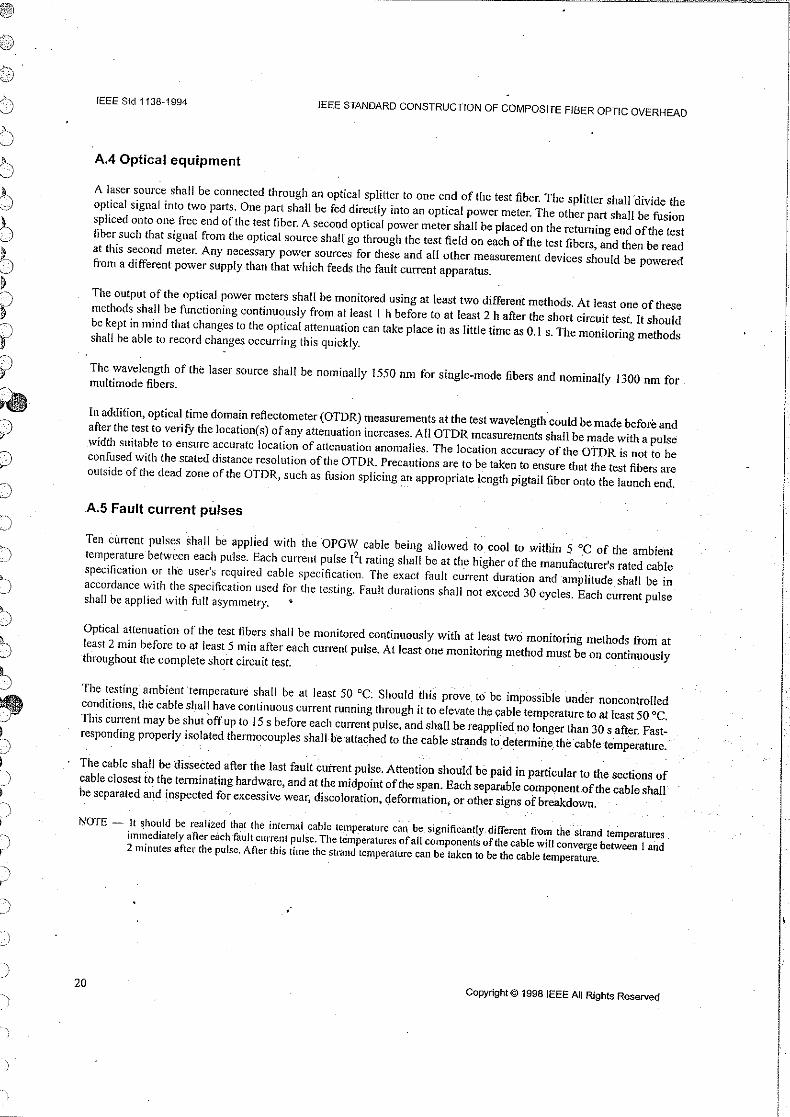
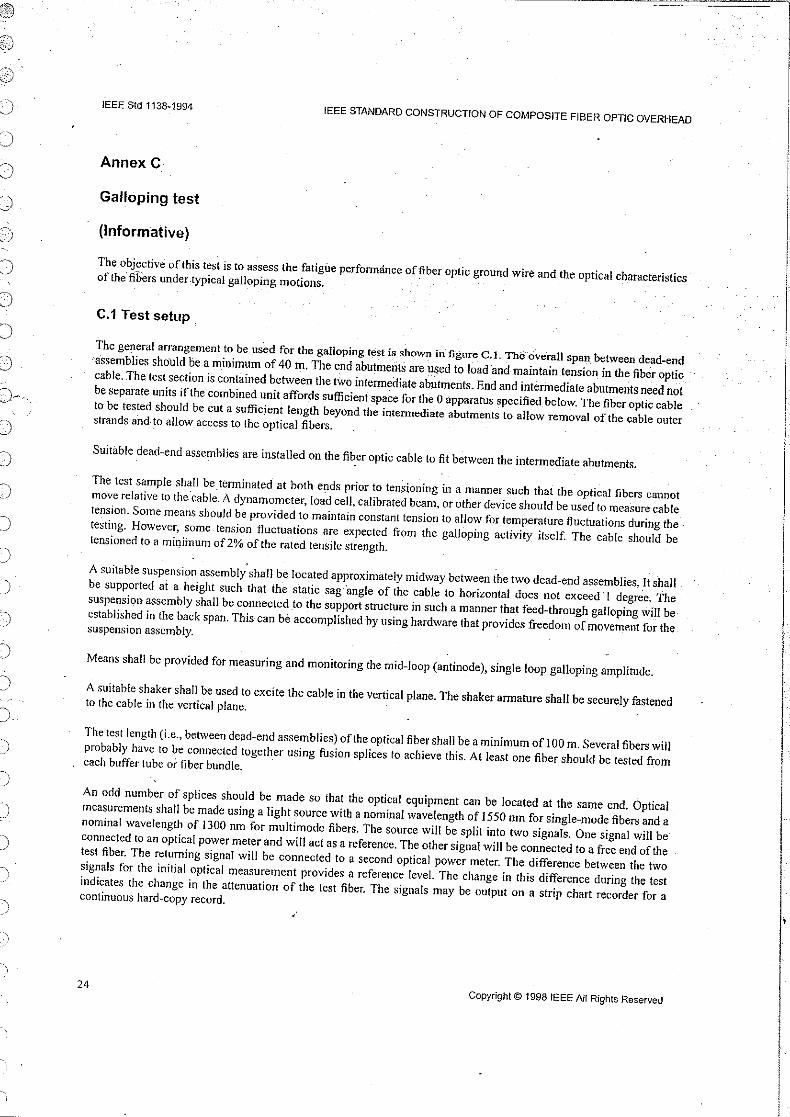
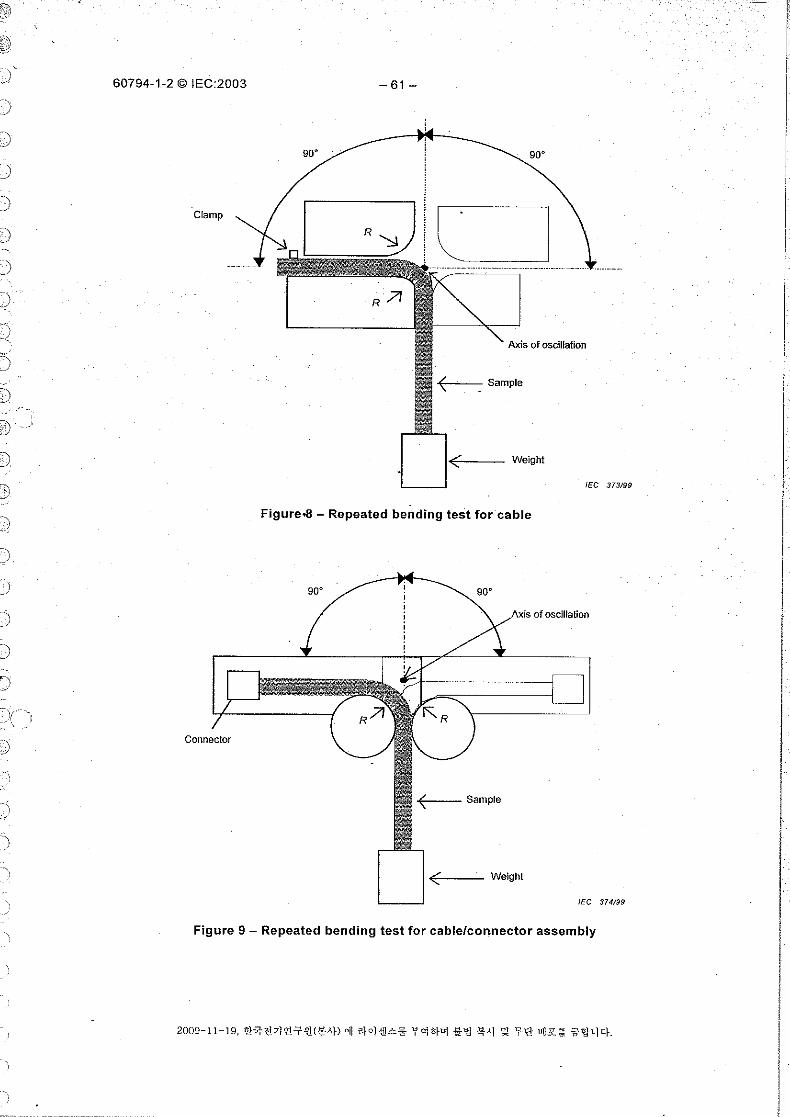
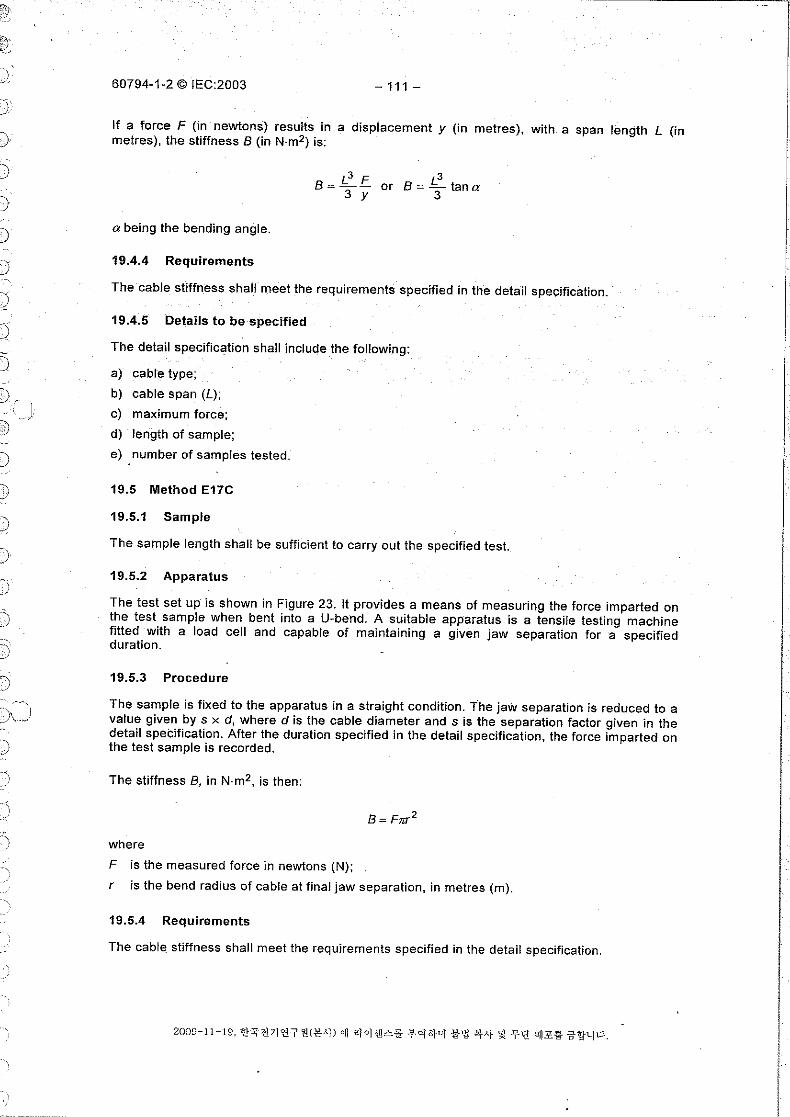
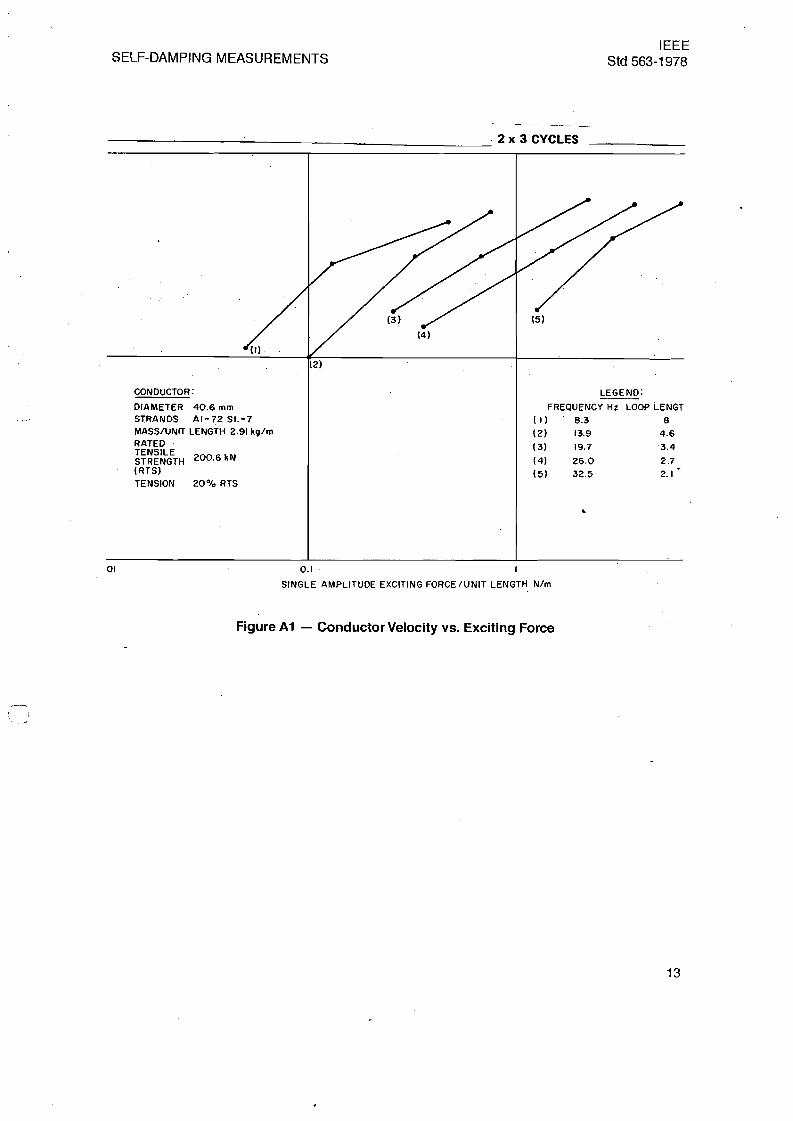
In addition to the information given in IEEE Std 563-1978, it may be useful to present the results as a plotof conductor velocity against force per unit length for different frequencies and associated loop lengths, for each tension, as illustrated in Fig Al Fig Al from the results in Table 1 . This presentation allows, by simple calculation, the determination of the power dissipated, conductor amplitUde, and the mechanical resistance of the conductor, that is, the ratio of the force to the conductor velocity, fora wide variety of conditions. The test arran~ement with the vibration generator located at the center of the span provides information in the most suitable form for this type presentation since it is a requirement that the conductor be excited at an antinode, that is, the center of a loop.
•
12
IEEE SELF-DAMPING MEASUREMENTS Std 563-1978
. 2x 3 CYCLES
CONDUCTOR: LEGEND:
DIAMETER 40.6 mm FREQUENCY Hz LOOP LENGT STRANDS AI-72 SI.-7 (') 8.3 8 MASS/UNIT LENGTH 2.91 kg/m (2) 13.9 4.6 RATED - (3) 19.7 ·3.4TENSILE STRENGTH 200.6 kN (4) 26.0 2.7 (RTS) (5) 32.5 2.1 TENSION 20% RTS
~
01 0.1 - I
SINGLE AMPLITUDE EXCITING FORCE IUNIT LENGTH N/m
Figure A1 - Conductor Velocity vs. Exciting Force
13
::J y:" ? @ )1' ... NORME eEl ) ("\: INTE.RNATIONALE lEe )
l
,----",
) INTERNATIONAL 61395 ) STANDARD Premiere edition
First edition 1998-03
)
)
5.
)
)
) Conducteurs pour lignes electriques aeriennes Procedures d'essai de fluage
) pour conducteu'rscabh~s .
) .
) Overhead electrical conductors 10 Creep test procedures for stranded conductors ..
)
\, ,f\.
-,
© lEG 199B Droits de reproduction reserves - Copyright - all rights reserved
Aucune partie de celie publication no peul etre reprodulla ni No part of this pUbliCll1lon may be reproducad or ullll2:ed in ulllls!!e. 80US qualque 10rme Que ce soli el per auaun any form ar by any means, electronic or mechanical, procode, eJeclronlque au mecanlque, y camprll; Ie photo· Including photocopying and microfilm, without permission In cople el las mlcrolilms, sans I'aceord eerlt de l'odUaur. writing tram 1he publisher.
Intemational Electrotechnical Commission 3, rue de Varembe Geneva, Switzerland Telelax: +41 229190300 e-mail: [email protected] web site http://wvroJec.ch
(:\~ ..// CODE PRIX
IICommission Electrotechnique Internationale LPRICE CODEInternatlonal.:Electrotechnical Commission Me"'J1VHapoJ1H:lR 81lelfTpOTeXHH4ecKaR HOMHCCIolR
Pour prix, voir r;etaloglle en vlgllel For prlr;e. sr;e r;urrenr catalogue==============~=====.
)-,
r'\ ~
,1,,\
61395 © lEG:1998 -3~ . "),() CONTENTS /
Page
FOREWORD 5
Clause
1 Scope....................................................................................................................... 7
2 Normative reference ; ;~ :........................................................................ 7
3 Definitions ; ; ;' ' : : ,..... .7
) 4 Units, instrumentation and calibration......................................................................... 9
5 Sample selection and preparation : , "l~.............. 9 "... ~~.....:. .. .)
5 ..1 Sample selection ; ;.;................. . 'g
) 5.2 Sample preparation :.............................................................. 11
6 Temperature and temperature variations :.............................. 11
6.1 Temperature variations _. 13
6.2 Accuracy of temperature measuring devices :.. 13
iO 6.3 Temperature compensation ;.......................................................................... 13
7 Load ,................................................................................................................. 13
7.1 Tes1Joad........................................................................................................... 13 )'" 7.2 Strain measurement. ,....................................................................... 13
S Test procedure ~....................................................... 13
9 Data acquisition ;......... .15
10 Data interpretation , ~..................................... 15
Annex A (informative) . Practice 19
!l/~.
, '"-,../
),
() •
---_'_-'-_.. '." .._--_.. ---------,------
)
..~.
.' 61395 ~ IEC:199B -5
)
l- (~) INTERNATIONAL ELECTROTECHNICAL COMMISSION
,. t
OVERHJ:AD ELECTRICAL CONDUCTORS CREEP TEST PROCEDURES FOR STRANDED CONDUCTORS
FOREWORD . .-.". _.. . .
1) The lEe (International Electrotechnical Commission) Is a worldwide or~anization for standardization comprIsing all national electrotechnlcal committees (IEC Natlonal Committees). The object of the IEC .Is to promote
. international co-opera1fon on all questions concerning standardization In the electrical and electronic fields. To this end and in addItion to other activities, the IEC pUblishes International Standjards. Their preparation is entrusted to technical committees; any lEe National Committee interested in the sUbject dealt with may participate in this preparatory work. International, governmental and non-governmental organizations liaising) with the IEC also participate in this preparation. The IEC collaborateS closely with the InternationalOrganization for Standardization (ISO) in accordance with conditions determined by agreement between the. two
) organizations. . .---.
2) The formal decisions or agreements of the IEC on technical matters express. as nearly as possible, an interna,lional consensus of opinion on the relevant SUbjects since each technical committee has representation from all interested National Committees. .
3) The documents produced have the form of recommendations for international use and are pUblished In the form of standards, technical reports or guides and they Bre accepted by the National Committees In that sense.
4) In order to promote international unification, IEC National Committees undertake to apply IEC lntii/national Standards transparently to the maximum extent possible in their national and regional standards. Any divergence between the IEC Standard and the corresponding national or regional standard shall be clearly
0 indicated In the latter.
5) The lEe provides no marking procedure to indicate its approval and cannot be rendered responsible· for any equipment declared to be in conformity with one of Its standards.
6) Atlention is drawn to the possibility that some ·of the elements of this International Standard rnay be the subject of patent rights. The IEC shall not be held responsible for identifying any or all such patent rights.
) International Standard IEC 61395 has been prepared by IEC technical committee 7: Overhead electrical conductors.
I
The text of this standard is based on the following documents: I
'Ii FDIS Report on voting
7/515/FDIS 7/516/RVD
Full information on the voting for the approval of this standard can be found in the report on voting indicated in the above table:
Annex "A is for information only.
c}· ,.;;
r·
) .' .
61395 © IEC:1998 -7
I () OVERHEAD El..,ECTRJCAL CONDUCTORS.CREEP TEST PROCEDURES FOR STRANDED CONDUCTORS
1 Scope
This International Standard is primarily applica,ble to non-interrupted creep-testing of strande!:! conductors for overhead lines such as. those specified by lEe B1089~ Procedures for in~erpreting the results are also included. .
The object of the test is prinCipally to calculate creep for any purpose and to compare creep of different conductors.
The requirement of this standard aims at an accuracy of 1 %. However. itshouid be recognized that due to variations occurring in the manufacturing process, the creep obtained in the test is not a precise value for all conductors of the type tested. .
) .
2 Normative reference
The following normative document contains provisions which, through reference in this text, cons1itute provisions of this International Standard. At the time of pUblication, the edition indicated was valid. All normative documents are subject to revision, and parties to agreementso made on this International Standard are encouraged to investigate the possibility of applying the most recent edition of the normative document indicated below. Members of IEC and ISO maintain registers of currently valid International Standards.
lEe 61089:1991, Round wire concentric Jay overhead electrical stranded conductors
3 Definitions
For the purpose of this International Standard, the following definitions apply..
-'.i 3.1".
semple length total length of the conductor between the end fittings
3.2 9puge length distance of the conductor over which the creep is measured
3.3 testternperature mean temperature taken at the three pre-specified positions along the gauge length or, when more than three measuring positions are used, the mean temperature take.n at equal distances along the gauge length
(~\
.:.
---.._- _.. -- ------_..__.------ -----_._- --------_._---
)
),.
~
~" / O·
;0 61395 © IEC:1998 -9
3.4 test load constant load acting on the conductor during the test) NOTE - ThIs caUSel! the permiinent time d~p~n!:lent elongation known as creep.
3.5 ) loading time .
time requirel;! either from preload when preload is applied to test load or from no load to test load
3.6 duration of test time span between reaching test load and the end cif the test .
3.7 creep test machine oomplete equipment by means of which the conductor sample is tensioned during the test
3.8 end fitting hardware that maintains the ele(;trlcaJ and/or the mechanical continuity of the oonductor
4 Units, instrumentation and caHbratlon ~ r\,) ( i , "-.-/ Units of the International System of Units (SI-units)shall be used.
To ensure traceable accuracy of the test, calibration r~cords of all instruments. used in the test shall be kept. The equipment shall be calibrated in accordance with nationally recognized standards. Where no such standards exist, the basis used for calibration shall be documented.
) .
5 Sample selection and preparation
5.1 Sample selection
The sample shall be taken at least 20 m from the end of the conductor on the drum. It shall be undamaged during removal and preparation. At least three strong hoseclips shall be placed on hoth ends of the sample to prevent interlayer movement, before it is cut from the drum.
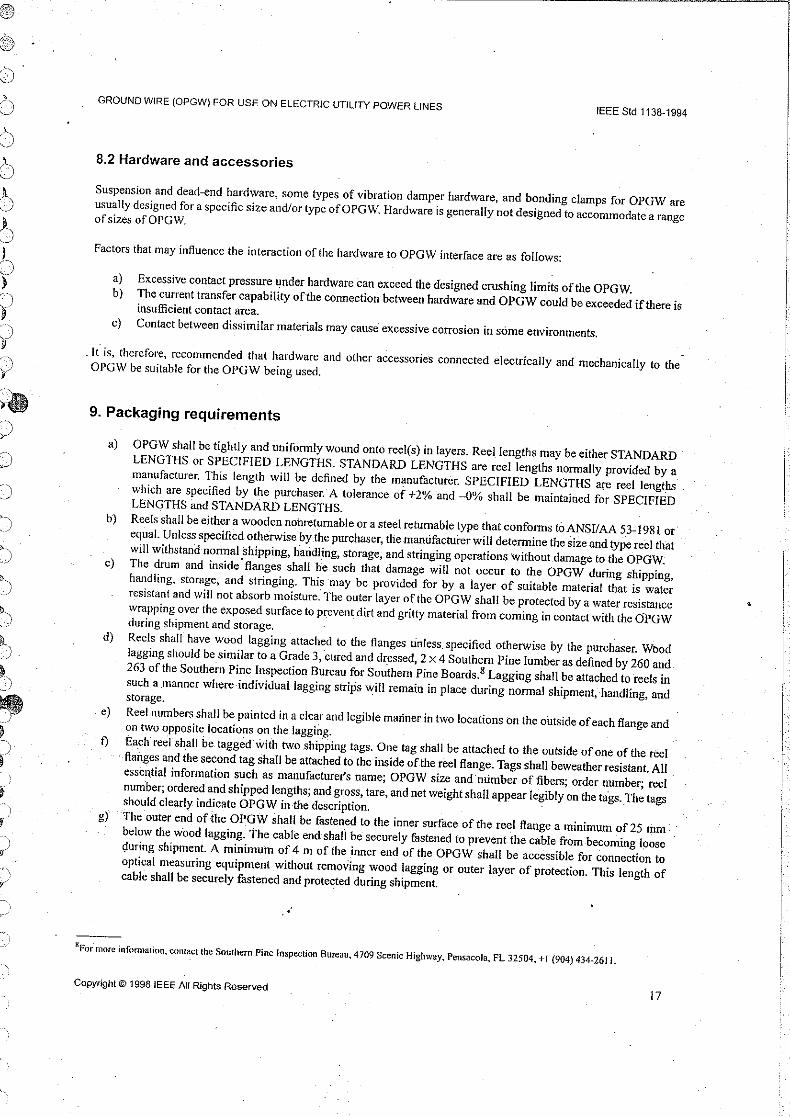
The minimum sample length between the end fittings shall be:
100 x.d+ 2 x a
where
100 x d is the minimum gauge length;
d is the conductor dj~meter;
a is the distance between the end fitting and the gauge length. 1}
C). ./
...
1) These minimum soeclflcatlons are onlv correct when the ends are olaced in resin. . _----.. -._----
1,'
S) 61395 @ lEC:199B -11
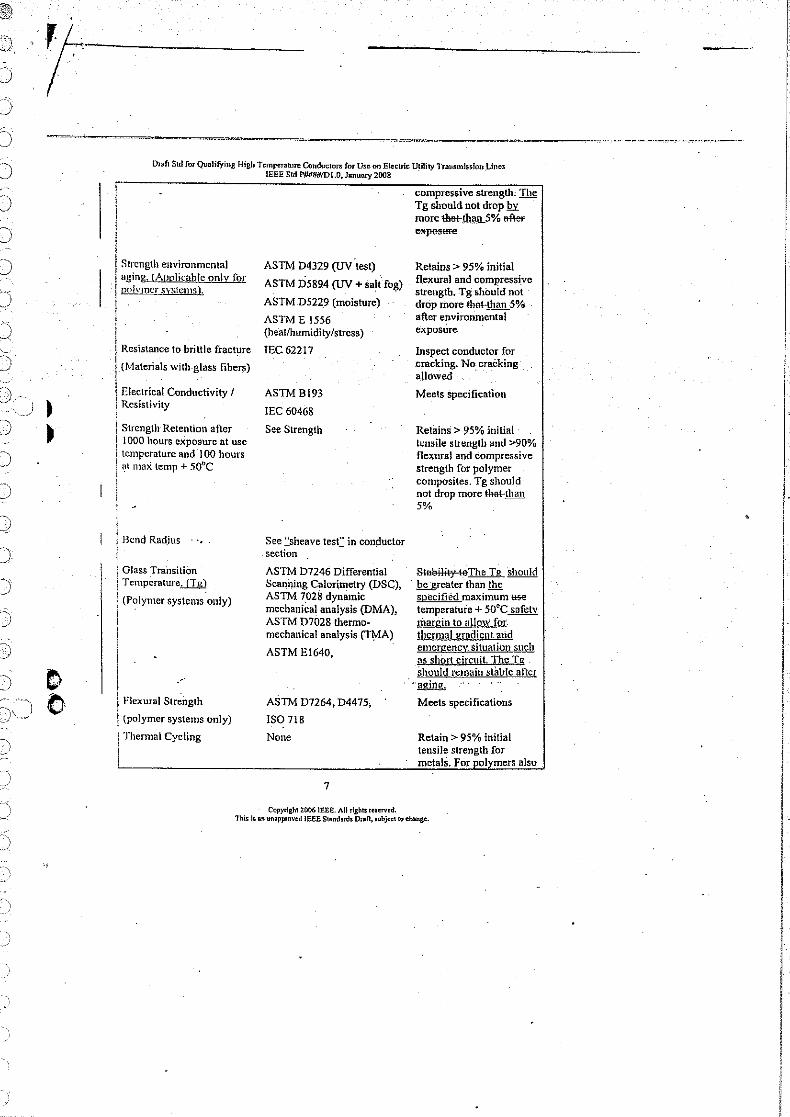
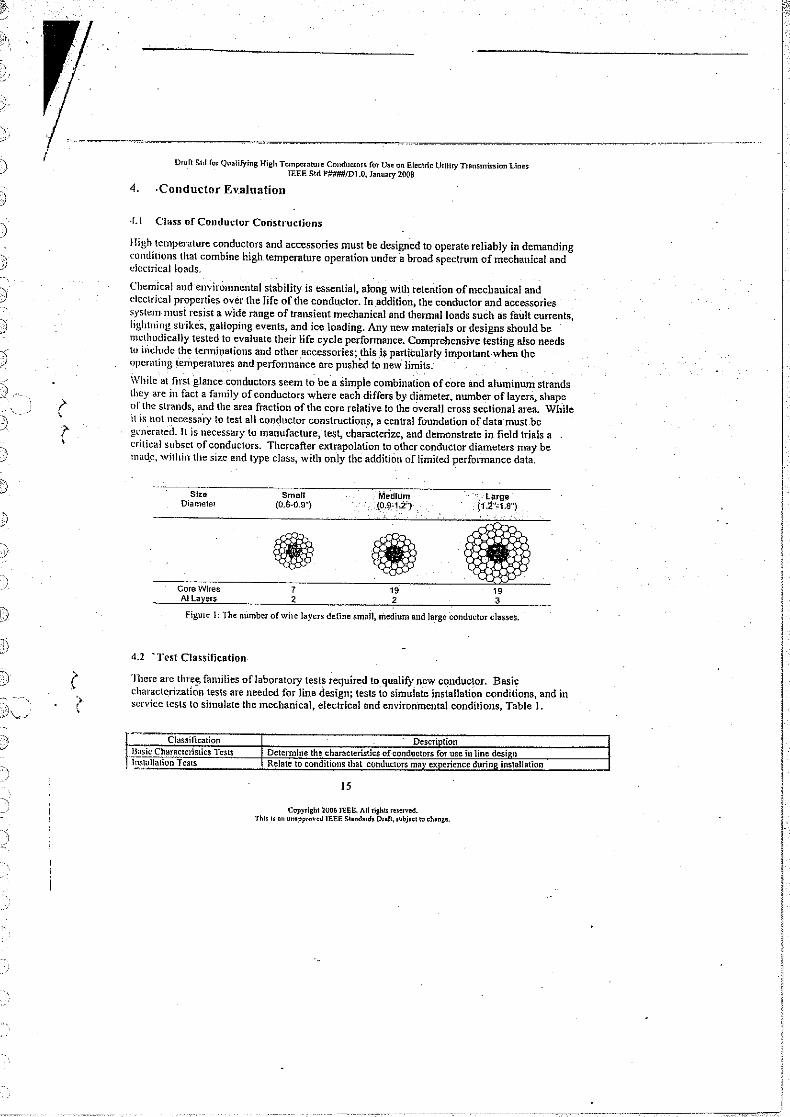
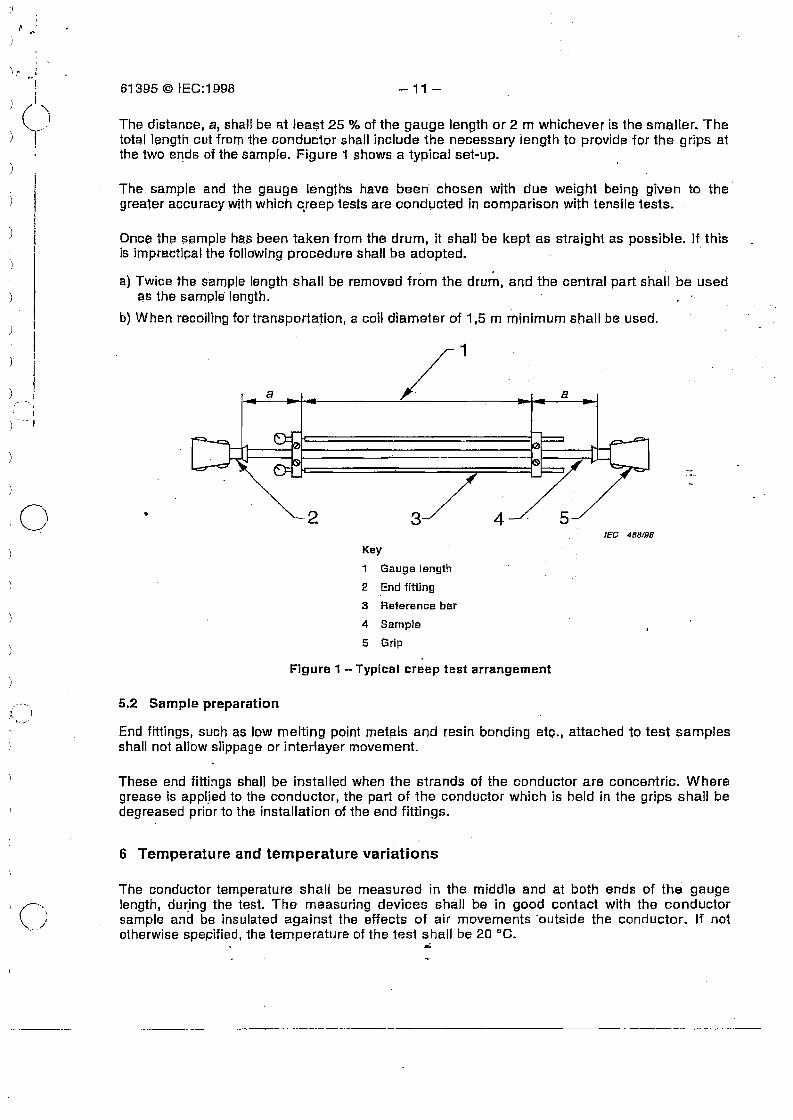
The distance, a, shall be at least 25 % of the gauge length or 2 m whichever is the smaller. The total hmgth cut from the conductor shall include the neoessary length to provide for the grips at
I "'-_e" J
o ..
a
2 3 4
a
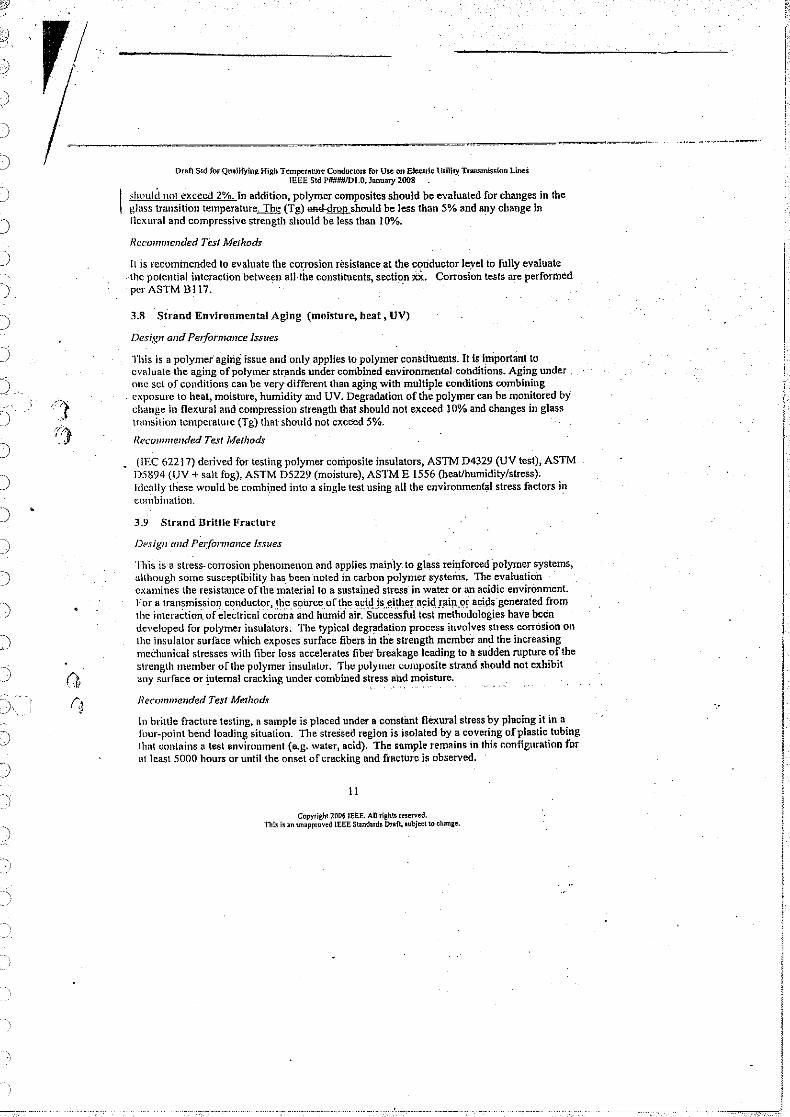
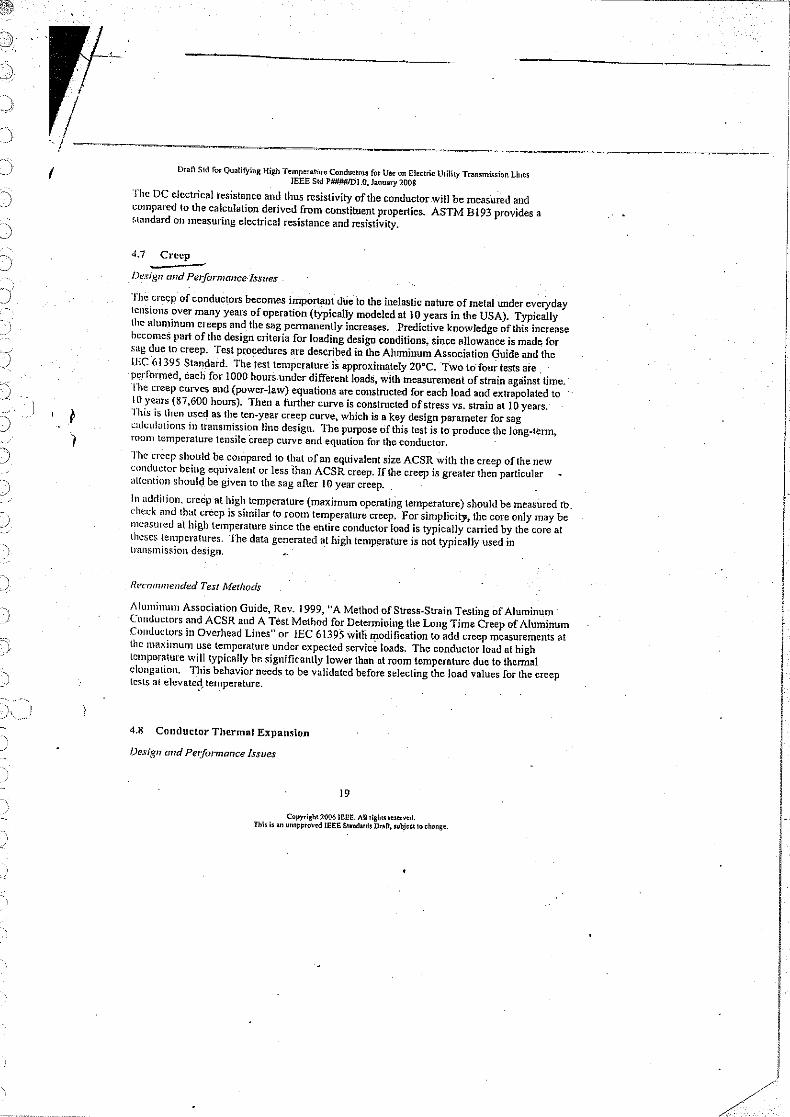
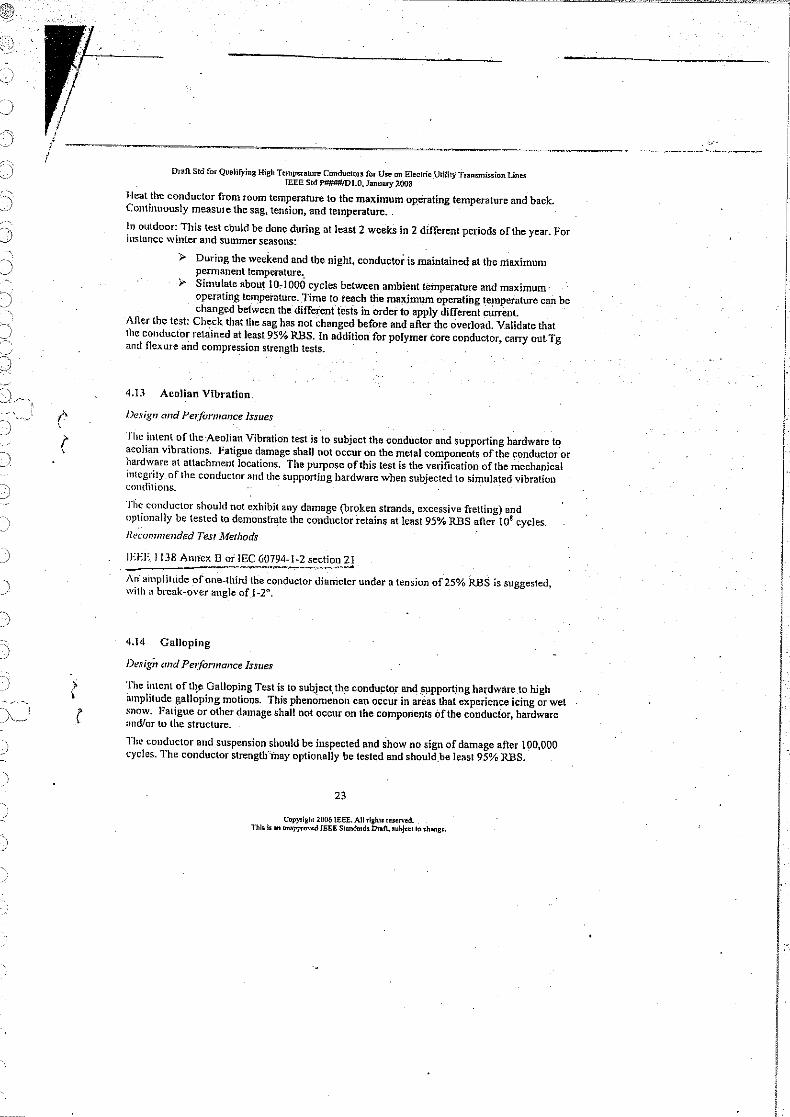
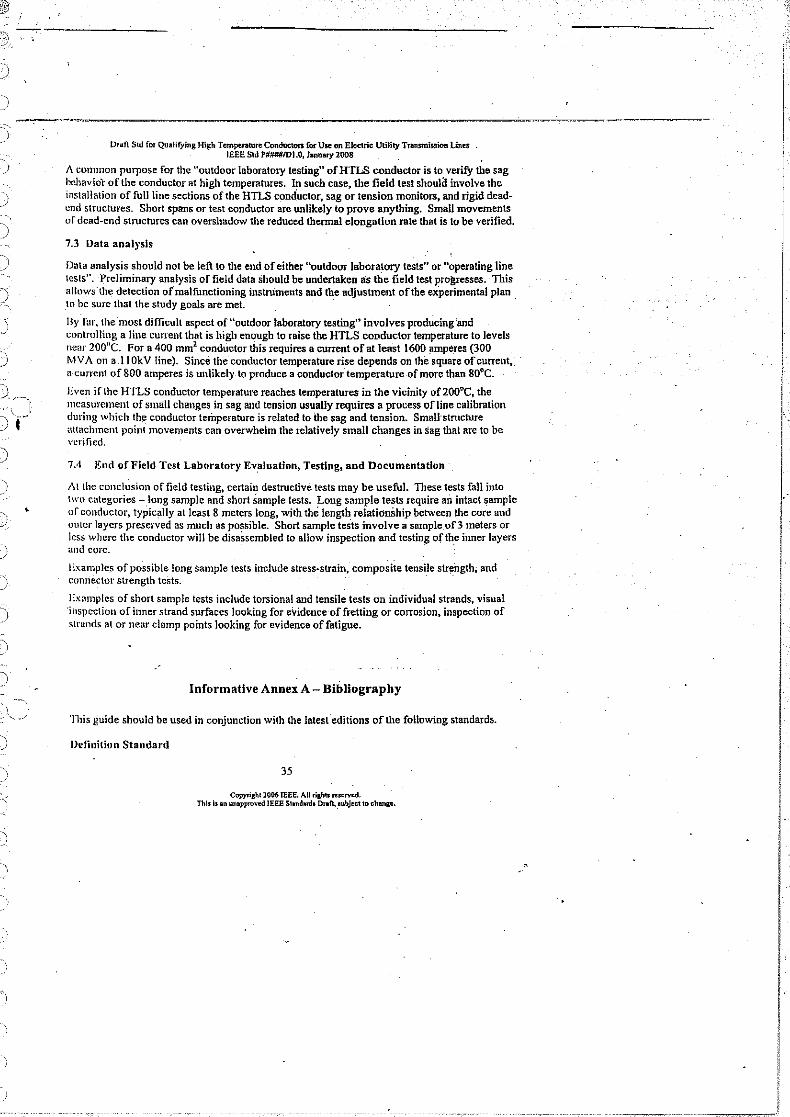
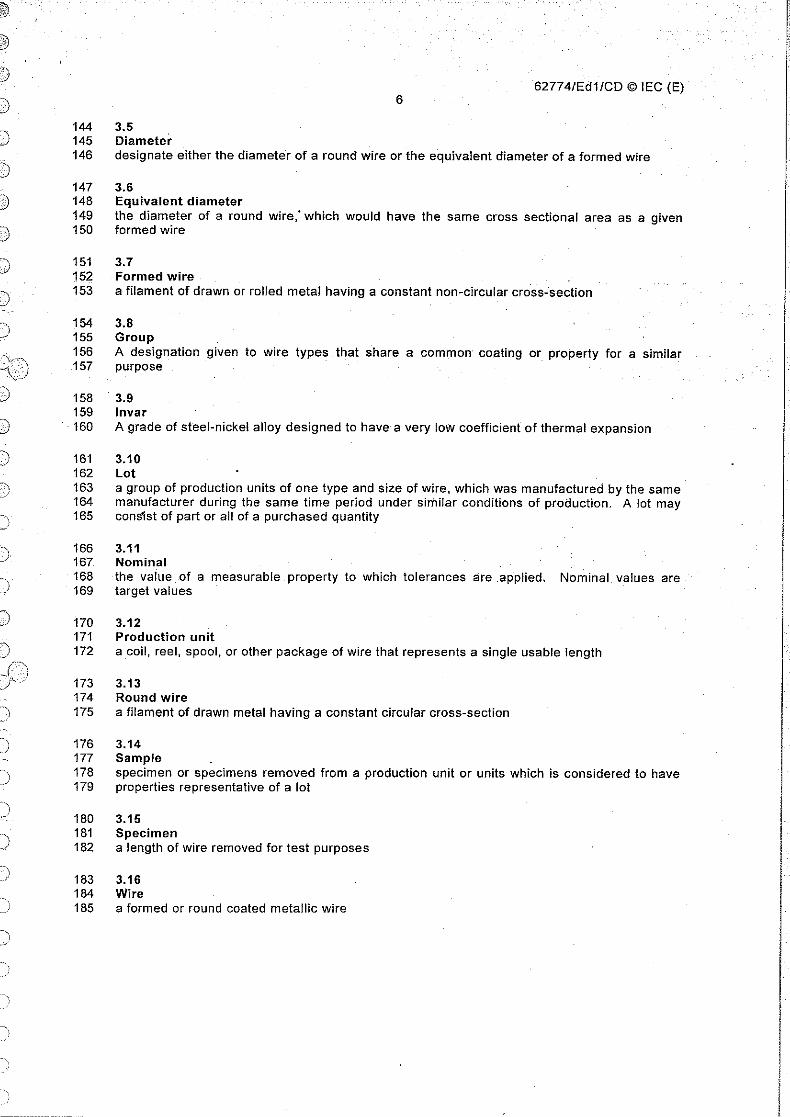
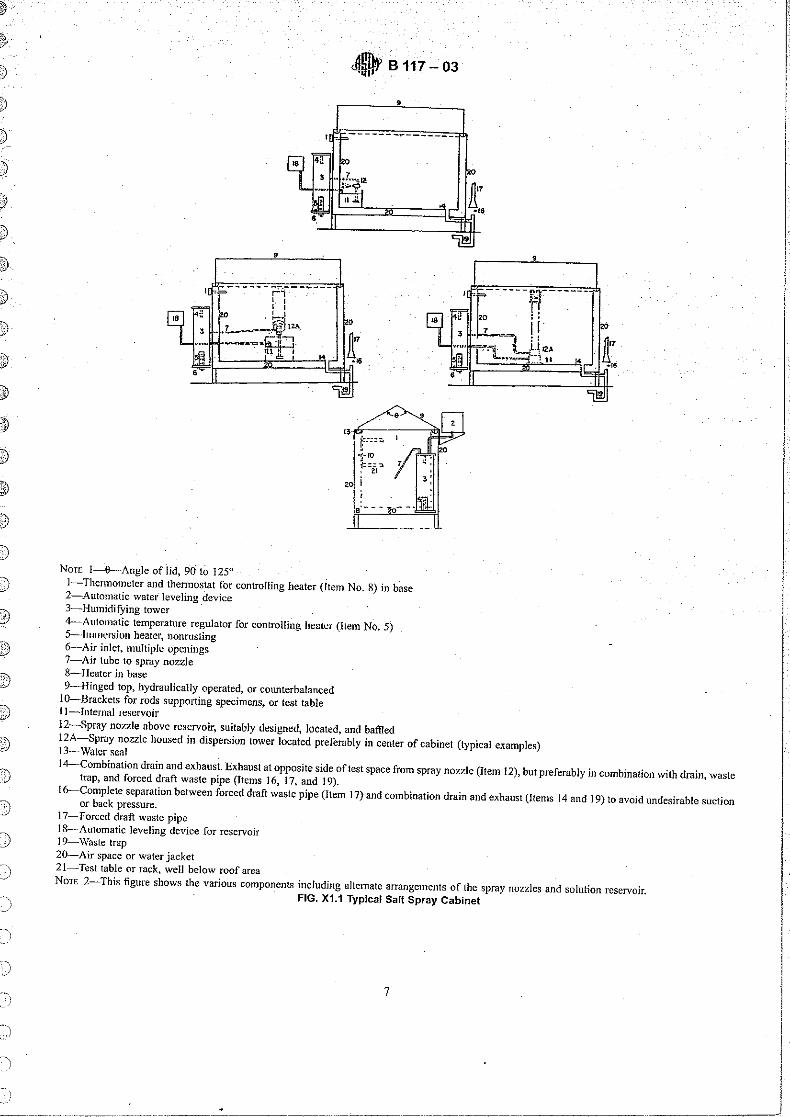
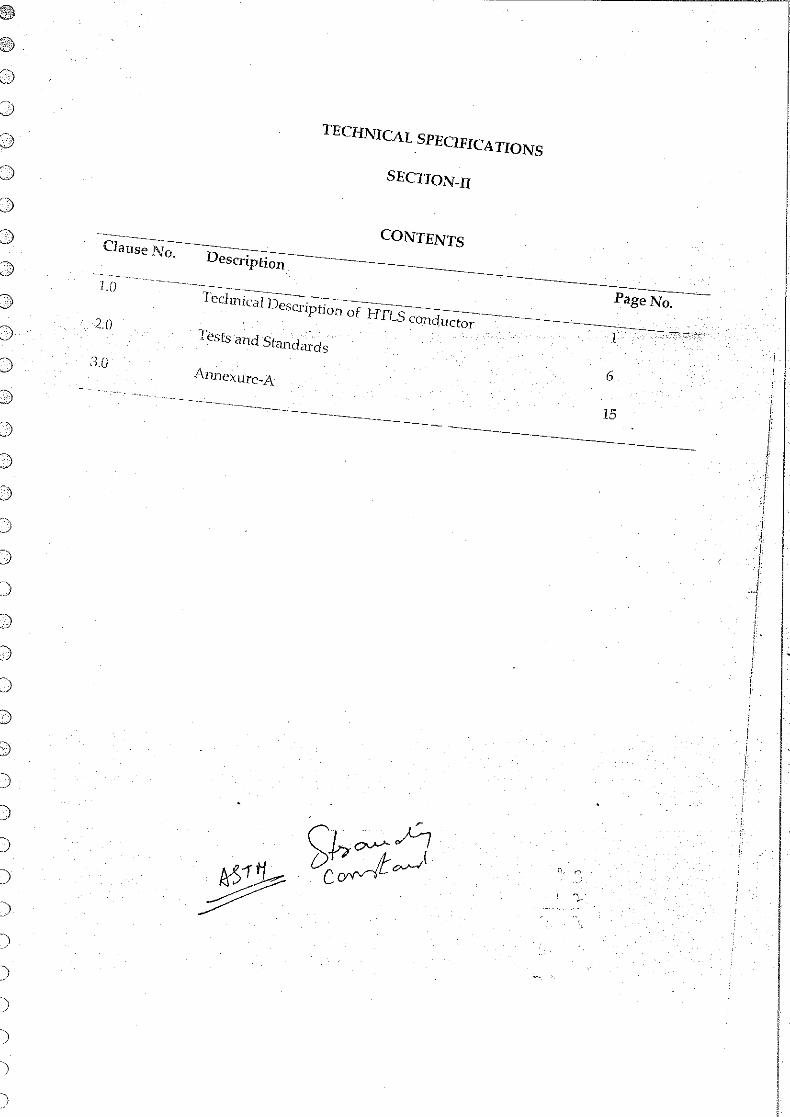
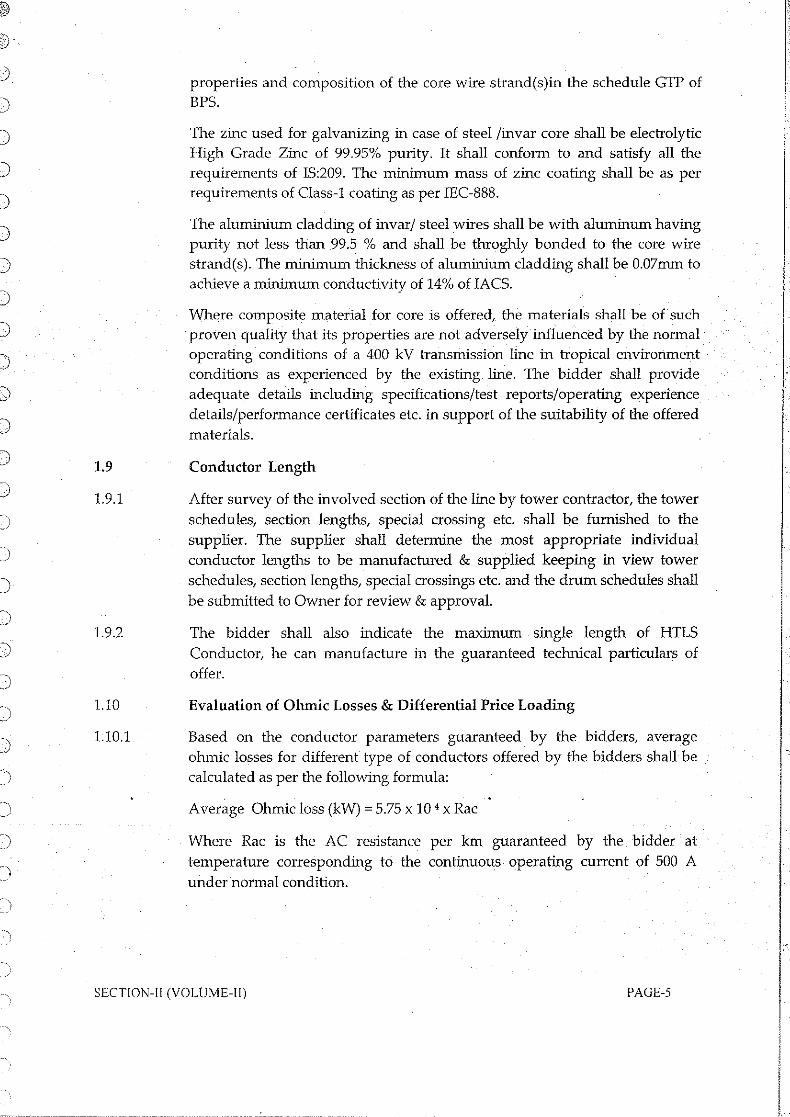
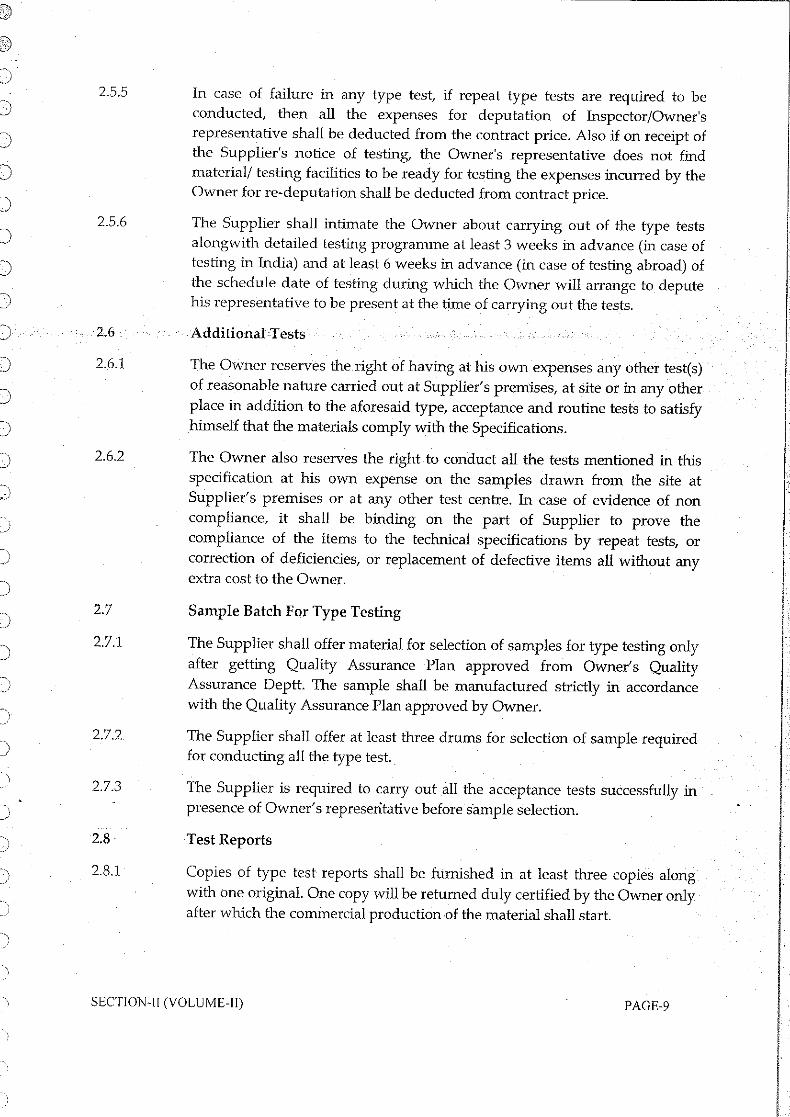
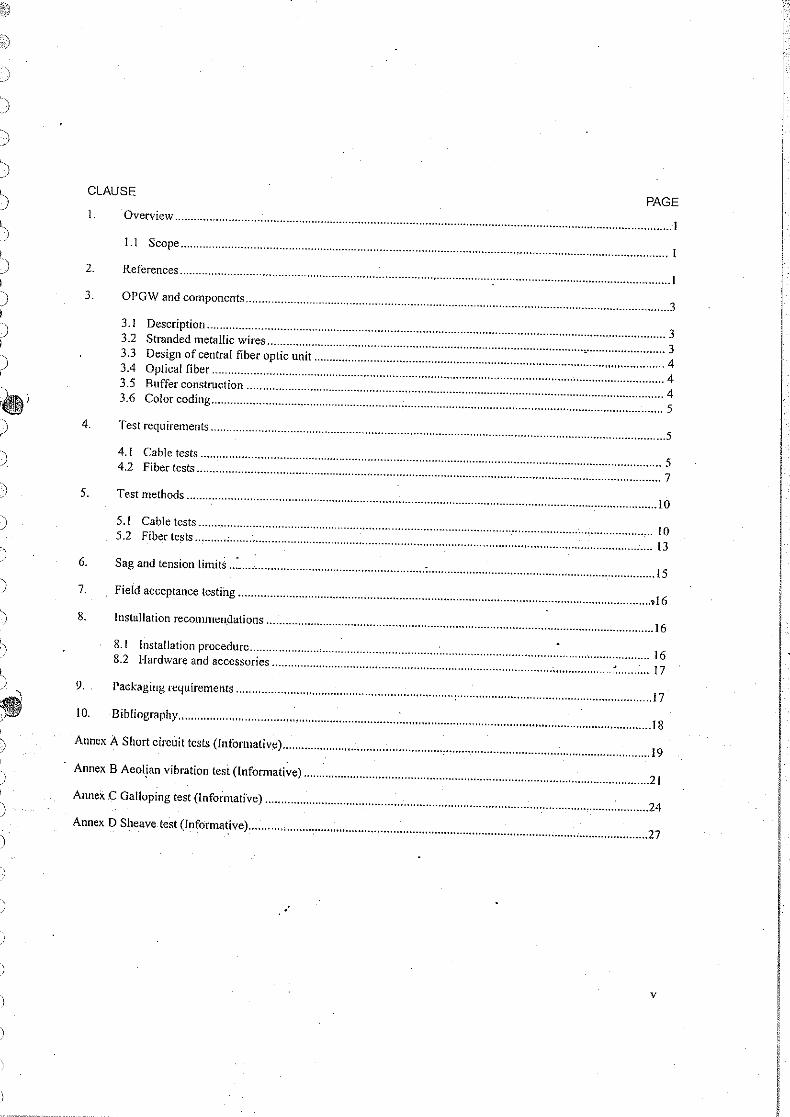
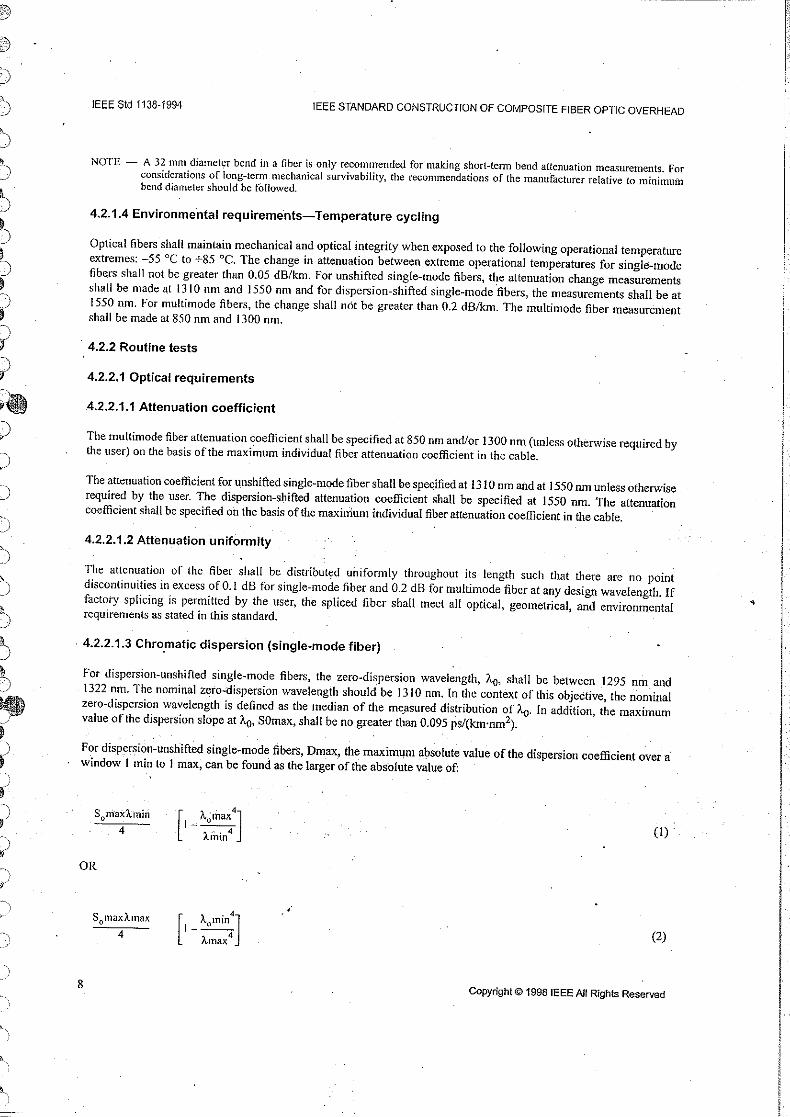
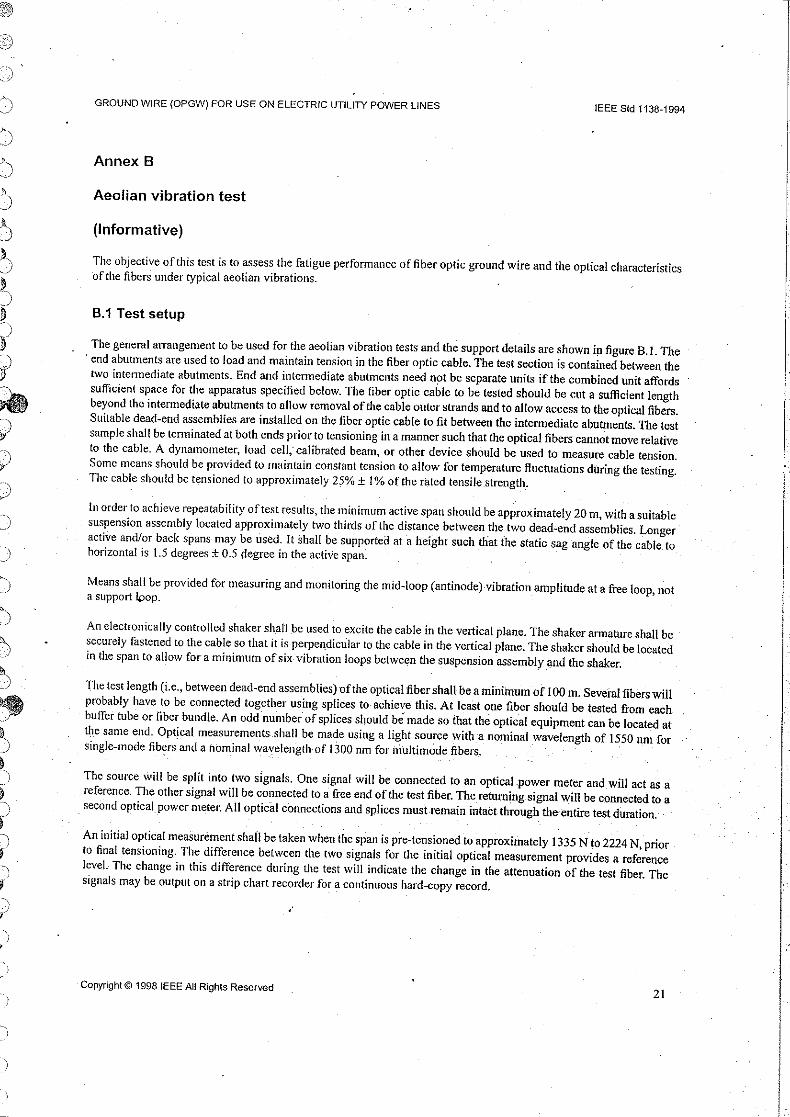
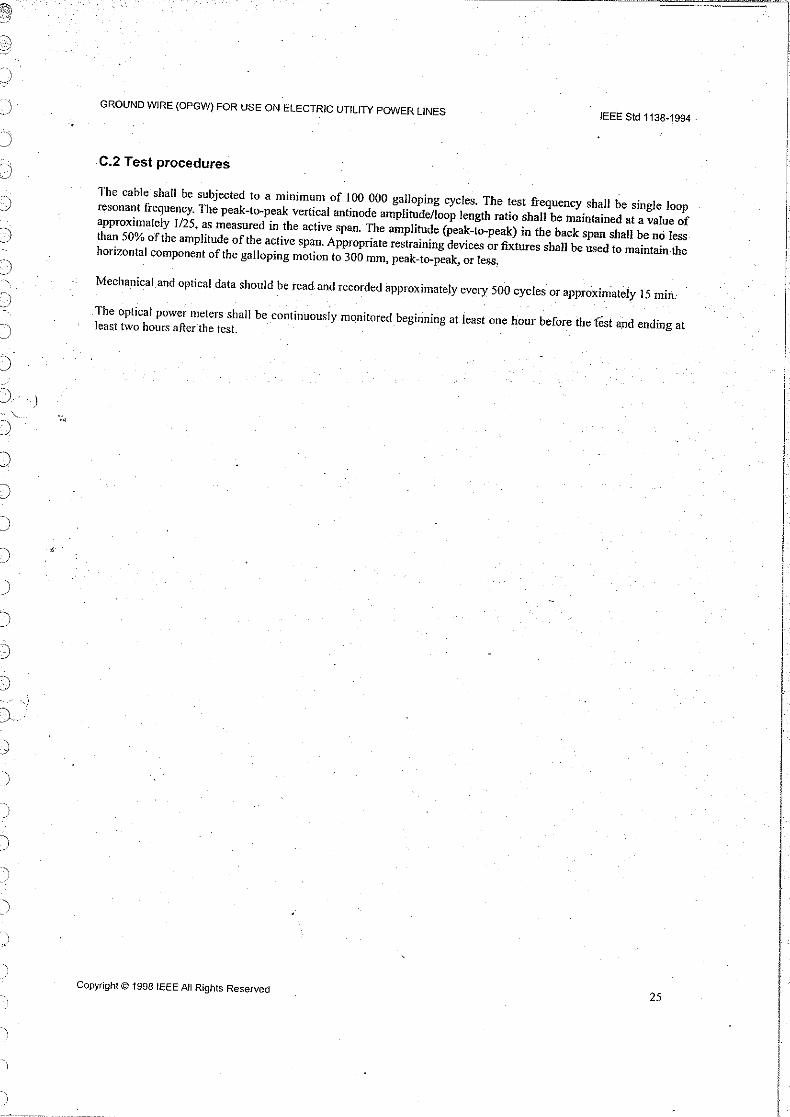
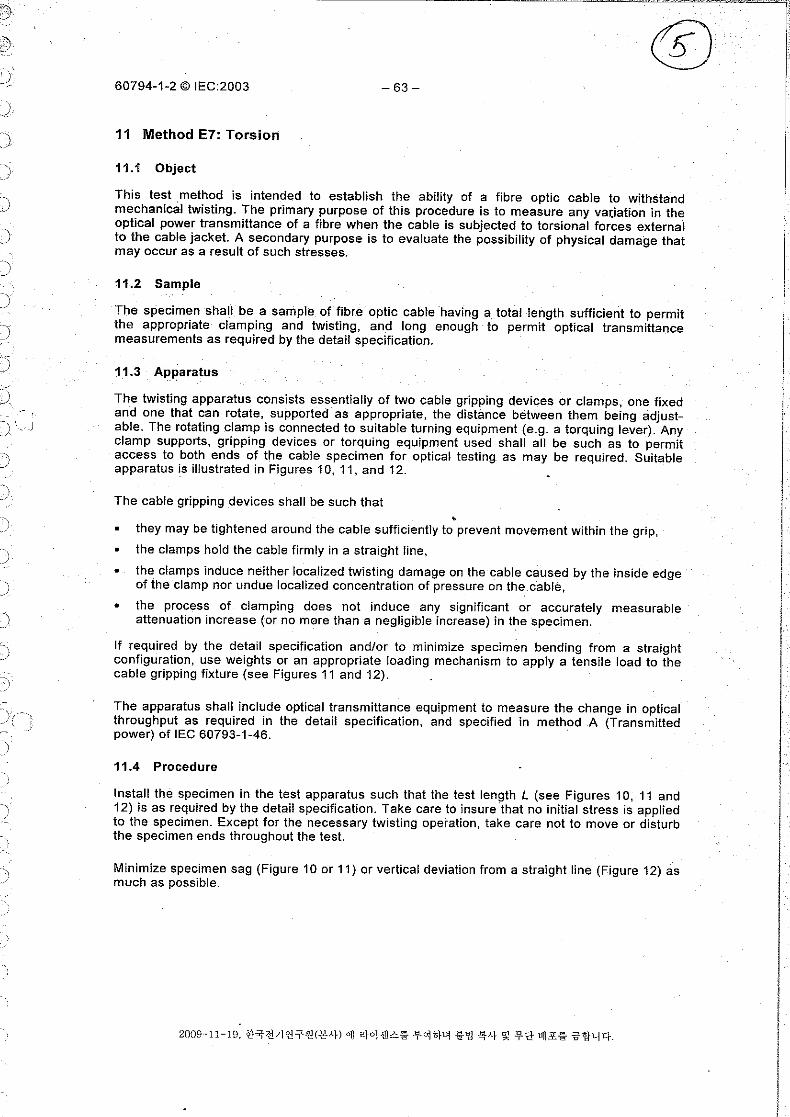
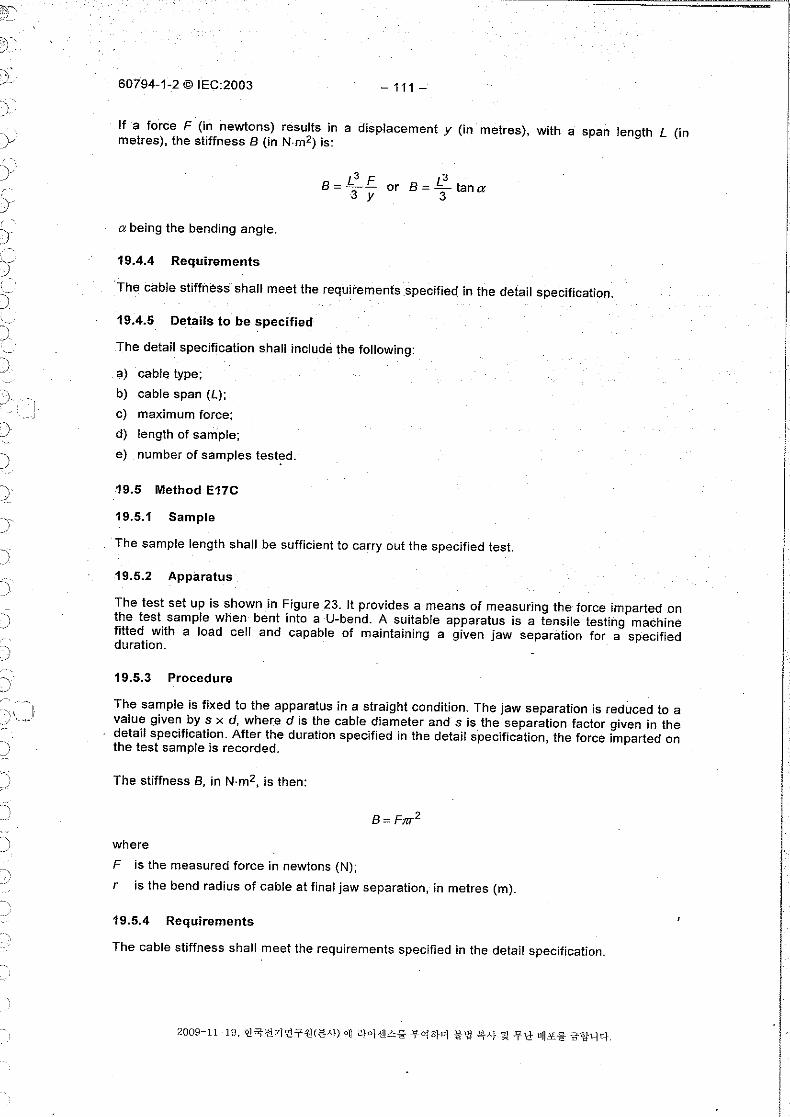
the two e~ds of the sample. Figure 1 shows a typical set-up.
The sample and the gauge lengths have been chosen with due weight being given to the' greater accuracy with which qreep tests are conducted in comparison with tensile tests.
Once the ~ample has been taken from the drum, it sh;;l1J be kept as straight as possible. If this is impractical the following procedure shall be adopted. .
a) Twice the sample length shall be removed from the drum, and the central part shall be used as the sample length.
b} When recoiling for transporta~ion, a coil diameter of 1,5 m minimum shall be used.
) /1
lEe 468/98
Key
1 Gauge length
2 End fitting
3 Reference bar
4 Sample
5 Grip
Figure 1 - Typical creep test arrangement
5.2 Sample preparation, "
End fittings, such as low melting point metals and resin bonding etc., attached to test samples shall not pllow slippage or interlayer movement.
These end fittings shall be installed when the strands of the conductor are concentric. Where grease is appl.ied to the conductor, the part of the conductor which is held in the grips shall be degreased prior to the installation of the end fittings.
6 Temperature and temperature variations
The conductor temperature shall be measured in the middle and at both ends of the gauge,, length, dur.ing the test. The measuring devices shall be in good contact with the conductor sample and be insulated against the effects of air movements 'outside the conductor. If not ... / otherwise spe.cified, 1he temperature of the test shall be 20 cC.
,.;;
_. ----- ----_._------_._.__ .•..._..-.~----
C
I' ...
') ,1.1
;
I
(''1 r
I I I I
)
I
--\
I
>,1 I
i ir
I
(i~) .,./
! I
-------.
61395 © IEC:199B -13
6.1 Temperature variations
Conductor temperature variation Cllong the gauge length shall be less than 2,0 DC; Conductor t!;!mperature variation during the test shall be less than ±2,D bC. It Is important to ensure that greater deviations than those stated above ,do not take place. A means of continuously monitoring the air or cond\..lctor temperature is recommended.
6.2 Accuracy of temperature measuring devices
The accuracy of the equipment used for temperature measurements shall be witjlin ±O,~ DC. The accuracy pf the temperature measuring device used on the gauge length shall beclearly stated in the test report. The method used for temperature control 'and measurement shall ~Jso
be fully documented.
6.3 Temperature compensation
Temperature variations shall be compensated, either by using a thermal reference with the same coefficient of thermal expansion as the sample, called reference bars in figure 1, or by using a thermocouple reference. In the latter case, the strain variation is calculated and subtracted from the elongation measurements. Three temperature measuring devices are used, the accuracy of which shall be within 0,5 "C. It shall be clearly understood that the temperature compensation is to reduce the scatter in the measurement arising from the length change of the conductor sample due to thermal elongation only. The effect of temperature change on the creep rate cannot be compensated.
,. 7 Load
~
7.1 Test load
The accuracy of the test load shall be within ±1 % or ±120 N whichever is the greater.· Load cells shall be used during the test. .
7.2 Strain measurement
The accuracy and the set up of the strain measuring device shall be sufficient to determine the conductor sample strain to the nearest 5 x 10⁻⁶ . The measuring devices may be of any suitable type such as micrometer dial gauges, low voltage displacement transducers or optical systems. Uncontrolled rotation during the test, especially of long samples may take place and shall be avoided or compensated for.
8 Test procedure
The sample prepared in accordance with the procedure desc;;ribed in clause 5 shall be placed in the creep test machine. Some machines may require a preload in order to attach the strain measuring devices. In such casep a preload of up to 2 % of the rated tensile strength of the conductor may be allowed. Prolonged period at preload shall be avoided in order not to influence the shape of the creep curve. Usually not more than 5 min at preload can be accepted.
,,;;
--_.-.--------_._------_.
·--------_._----......._---- "------- ,_.'. '. ,:'.~lO.'~,\;{",-/'.,?~"__.:,C.~.:..:...:..::,:•.
61395 © IEC:1998 -15
, ~ _....
) The loading time shall be 5 min ± 10 s. The loading should be applied evenly up to the tes1 load, without overload. Where it is necessary to load in steps, incremental steps shall not be greater than 20 % of the test load 2). When step loading is utilised, care should be taken to ensure that the area under the load graph (in a stress vsrsus time dia,gram) equals that of the straight line from preload or zero load to the test load. The load shall be kept constant during the duration of the test. 3)
9 Data acquisition
Creep and conductor temperature measurements shall. be taken from the mornent the full load isapplied.Le. at the end of the 5 min allowed for the loading time. Thereafter, conductor temperature and readings to calculate the creep elongations shall be evenly spaced on the logarithmic time sC;:lle 4). The n~mber of these readings shall be at least three in each interval, with ten times increase of the 1ime. The first reading corresponds to zero time and creep. The second reading, which is the first value of the creep. shall be taken not later than 0,02 h after the first reading. When a thermocolJple reference is used for the temperature compensation, readings of ~rongation and temperature shall be made at the same moment. The duration of the test shall be at least 1 000 h, which would predict the long time creep sufficiently accurately. .
I I Most of the creep data available are based on 1 000 h creep tests. Longer times give greater
accuracy, but due to the logarithmic presentation, very long times are needed to increase the effect significantly. It is recognized that due to the unmeasured creep at the beginning of theI test, the curvature will result in lower time creep the longer the test continues. o 10 Data interpretation
1
When the conductor elongates according to power law creep, the creep measured for each equal time interval on the logarithmic scale will usually be close to equal, Le. the. creep between 1 hand 10 h is of the same magnitude as that between 100 h a,nd l' 000 h. The regression line which is fitted to the values minimizes the sum of squares of the distances to the straight line. Concentrations of values therefore torce the line to pass closer to the centre of the concentrations 5). To make possible an unbiased linear regression to the creep formula, the method requires values to be evenly spaced along the fitted line.
The creep equation Ec = a x tbean be transformed to
Jog LC = log a+ bx log t
where
E:.c is the elongation in % due to power law creep, . t is the time in hours
a and b are constants.
() 2) This procedure has been chosen so that all samples experience the same amount of creep time beiore the
measurement commences. ,.;
3) Vibration 11 not isolated can affect results.
4) Other readings can be taken but should not be Included in the calculation.
5) The reading intervals can unintentionally influence the derived creep equation due to the double logarithmic scale of the creep diagram and the usual slight curvature of the graph.
. ,.._--_ .. ---_ .•.... _._------_..__ ..._-_."'
---
creep' curve (J purchaser.
()
C)o
()
()
c\ ,-)
C)
o r):~)
(j
rJ ()
"
'0
() () ()
b ':Jl,_
o .®
EO
61395 © IEC:1998 -17
In a graph of elongation versus time plotted on a log-Ipg scale, the measured creep values will form a curve which approaches a straight line for longer times. When the line is fitted to the values, a is the intercept with the creep axis for t =1 hand b is the slope of the straight line.
() A ,linear regression shall be made using the values between 1 hand 1 000 h to calculate the
() creep equation. Creep values at less thiln 1 h are taken for information purposes only.
() The constants a and b togethfH with the calculated long time creep fpr 10 years for purposes- of comparison shall be presented in the report. together with nominal agreed temperature and o actual temperature variation. A log-log diagram shall be made with elongation versus time up to 100 ODD h with the fitted straight line plotted together with the nominal and average
C) . temperatures &nd actual temperature variation. Any further information such asa plot of the and any additional information shall be agreed upon by the supplier and the
.....---_._-----_._-----_ ..----------
I
(I
o I·
i)\ . ( j,c)' " "
() "()
~)
()
()
.J
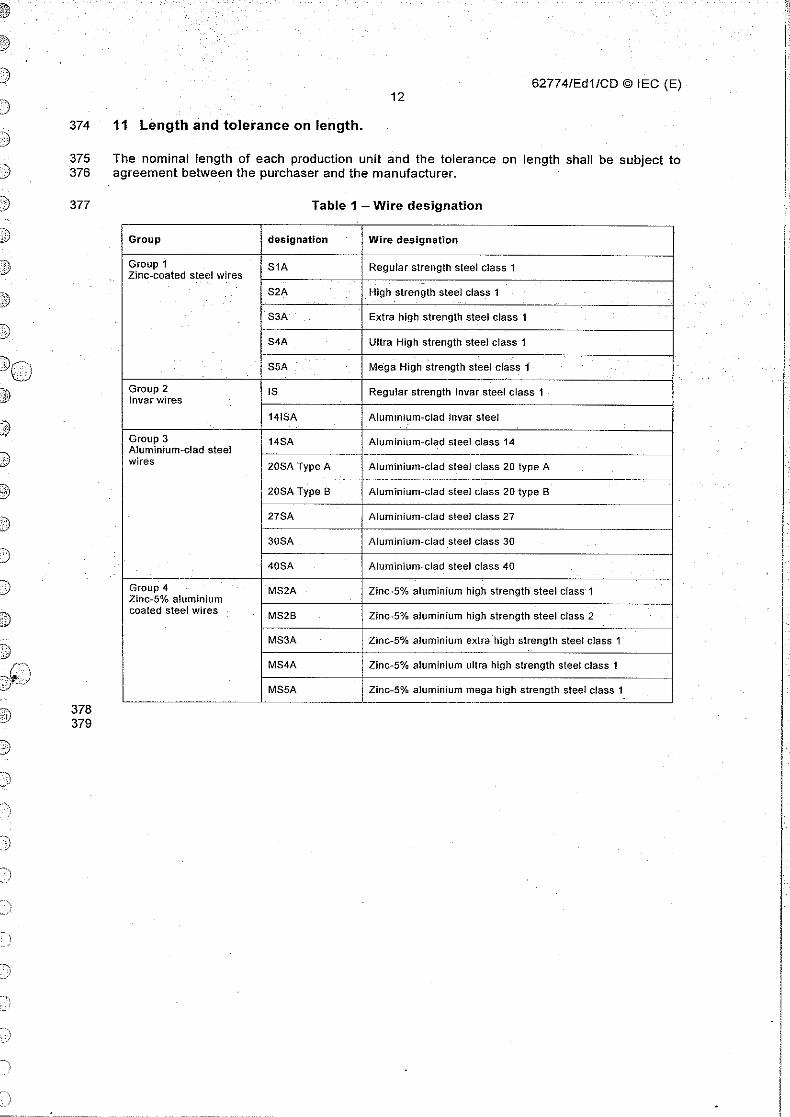
()
()-
o o ()
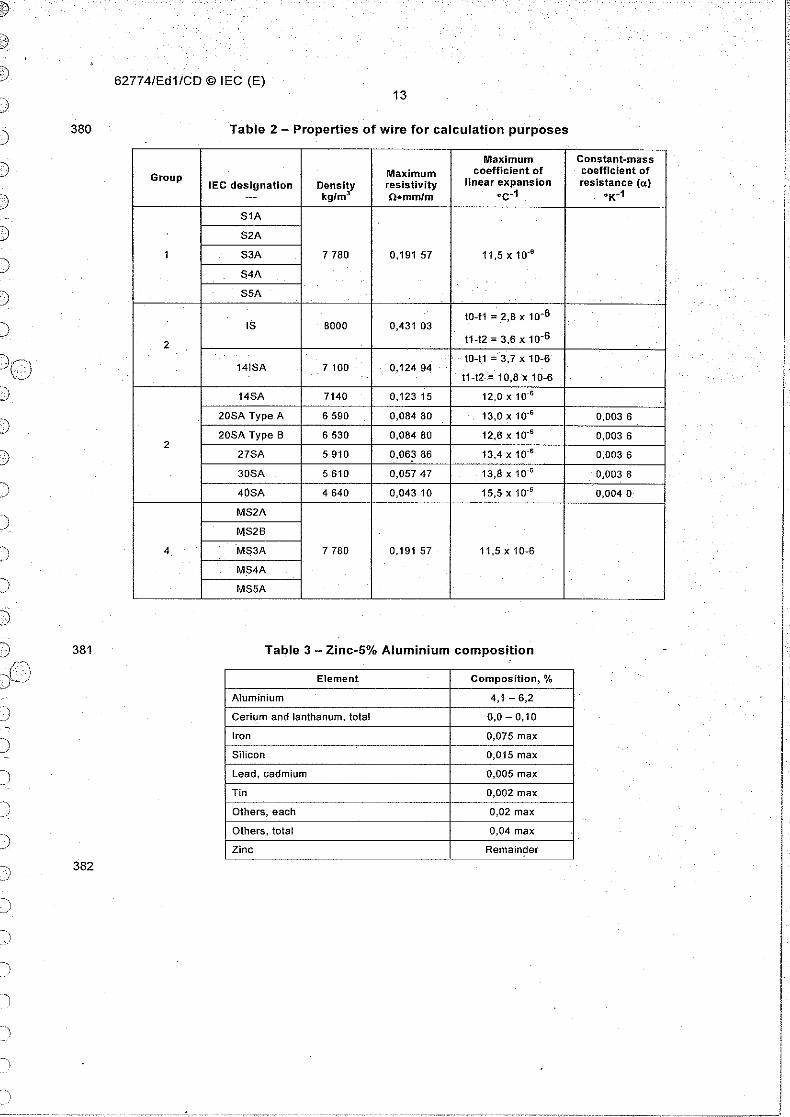
() ?'J ('j '-"J
I I
(0'. 1,,-_.J
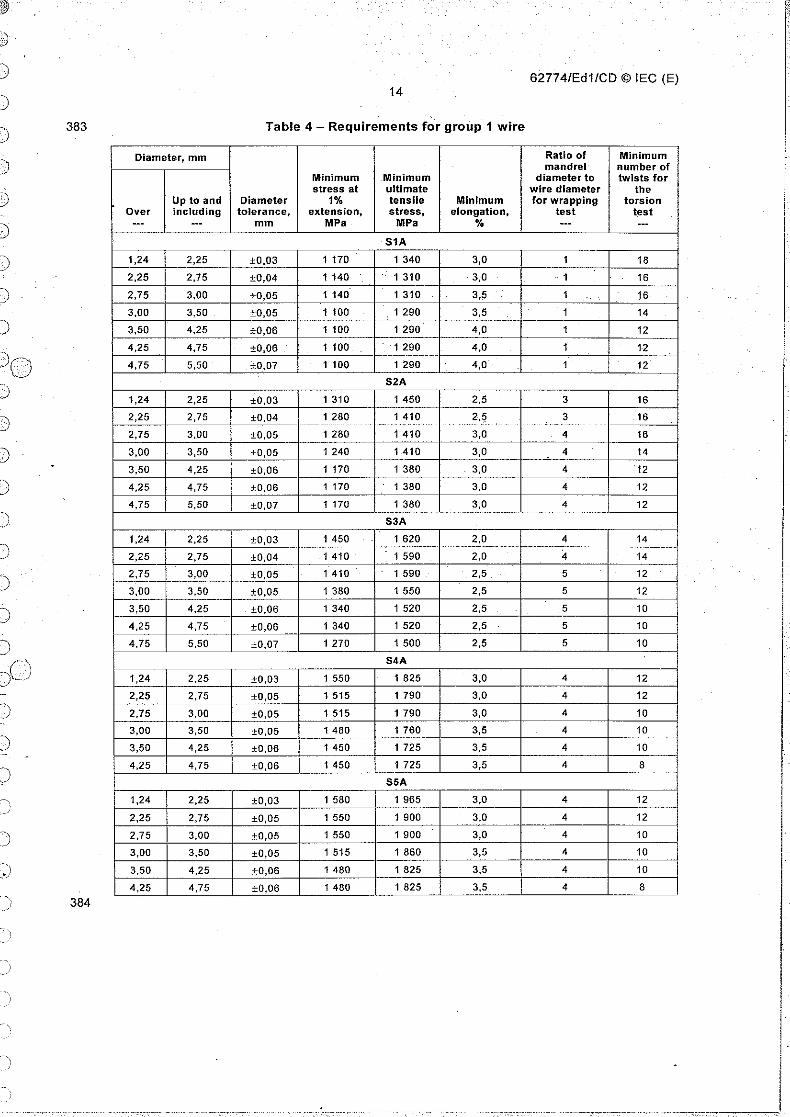
()' I , I " I C?,__ I ()' 'I () I
I() I
(J r
() t
o I r
() f'iC) .,(J
(),
()r0-------
o o
61395 © IEG:1998 -19 ~
Annex A (informative)
Practice
A.1 Recommended testing parameters
The following t~sting parameters are recommended:
- the temperature of the test should be 20 DC;
-~~i~'fi,j!,~rq.Jmmt"'~§!li;]~;':'(f~W7~.!IDf1PPf;lQmgtl. . .' ...' .
If a complete characterization of the creep behaviour of ,8 conductor is needed, tests should be carried out at least at two different loads and two different temperatures.
A.2 Testing procedure
When long conductor samples are used, the preload will not be sufficient to lift the conductor. In such cases the conductor sample should be supported at regular intervals, either by a balanced weights and lever arms system or by trolleys underneath the sample.
A.3 Sample selection and preparation
The sample preparation aims to prepare a sample for the creep test in which all strands are stressed as equally as possible during the test.. Thereby the same tensile conditio.ns are obtained as naturally occur in the very long spans of transmission lines in use. Unnecessary recoiling and bending of the conductor should therefore be avoided.
Moulded end fittings (e.g. rl:lsin or low melting metal) are recommended both to reduce the risk of slippage and to avoid disturbing the layers and thereby causing the layers to take stresses unequally. . .
A.4 Temperature and temperature variations
The creep rate of the conductor increases by around 4 % for every 1 DC the temperature is increased. The creep temperature is therefore the single parameter which has the greatest influence on the accuracy by which the test can be carried out. A difference. in temperature betvveen the two ends of the gauge length is therefore not as large a problem as an error in the true mean temperature during the test. As the rate by which the creep rate increases with temperature is unknown it, is' not possible to compensate for this effect. In order to do so, measurements on single wires or a conductor built using the same wires have first to be carried out at different temperatures to determine the effect.
In real life, conductors elongate when the effects of creep and thermal elongation are taken into account. The effect of both these Items would be to decrease the tension on the conductor and therefore the increase in creep rate would not be as pronounced.
.."-_. " - ·---__0_- _ "----- -- ---~-----,---._._-------------------
1
C
) ",.,.
61395 © IEC:1SS8 -21
Different pountries may have a different mean temperature at which the test can most appropriately be carried owl. Due to the different creep rates obtained at Gifferent templ3ratures, two mepsurements at two different temperatures Olinnot be directly compared.
A pimple arri3ngement for the temperature compen~ation ponslsts of two aluminium bars, called '''') ,
r~ference bars in figure 1 t which are fitted on oPPP!3ite side!'> of the conductor at one end of the gauge length. The other end of the alwmlnium bars extends to the other eoo of the gauge
IJ length. At this end the bars are free and the distance is melisured between the gauge mark and , tHe free end of the aluminium blim. The measured distancl;l is the elongation which takes place
() over the gauge length. When the' length of the conductor changes, the length of the compensating bars changes with the same distance. and thereby the influence from the th.ermal elongation is neutralized.
A.5 Data interpretation , ,
Increasing time intervals can be used according to the formula
t::: 10n
where
t is the time in hours from the beginning of the measurement;
n is a number series with constant increment. such that nm+1 =nm + A,c) where
A is a constant, i.e. if 10 readings are to be made for each increase of time by 10 timesC)O' (e.g. from 10 h to 100 h) and the first reading is made at 10 h (10' h), the next readings will be made at 101+0,1, 101+0•2 , •.. (12,6 h; 15,8 h; 20,0 h...). On the logarithmic scale these points will be evenly spaced.
The derived creep equation will always be pessimistic and result in larger long time creep than the true creep. It is not possible to obtain better values by starting the measurement late and thereby exclude some creep at the beginning. _Such a procedure will move the creep curve towards smaller creep and therefore -decrease the short time creep. but on the other hand result in a higher creep exponent and ther~by increase the long ~ime creep.
,'-".' I'
UI'....... '
()
()
()
C) ()
C) (-J, -, )
()
() i I I I I
Ir~._ '-"--'-, -,,-" -.-._--- -'-"._--------- - ----------------,--, --- \_)