Embed Size (px)
Citation preview

© OECD/IEA 2011
N. Tanaka & J. CorbenWashington, 8 June 2011

© OECD/IEA 2011
The context
Mounting worries over energy security & climate change
Policy uncertainty favours gas
Renewed debate surrounding nuclear power
A transformation of natural gas markets is underway
The North American shale gas boom is spreading
Dramatic & continuing expansion of LNG trade
Increasing concerns about local pollution in emerging economies

© OECD/IEA 2011
Are we entering a Golden Age of Gas ?
Objectives of the report:
Examine factors that could result in a more prominent role for gas
Assess implications for all fuels, energy security & climate change
Key drivers of the GAS Scenario
Widespread development of unconventional gas
Lower gas prices
Gas targets in China’s 12th Five-Year Plan
Reduced growth of nuclear energy
Increased deployment of natural gas vehicles
WEO-2010 New Policies Scenario serves as benchmark for comparison

© OECD/IEA 2011
Gas grows nearly twice as fast as total energy…..
World primary energy demand by fuel in the GAS Scenario
Gas overtakes coal before 2030 and meets one quarter of global energy demand by 2035 – demand grows by 2% annually, compared with just 1.2% for total energy
Other renewables
0
1 000
2 000
3 000
4 000
5 000
1980 1990 2000 2010 2020 2030
Mto
e
Oil
Coal
Biomass
Nuclear
Gas
Hydro
2035

© OECD/IEA 2011
…..mainly displacing coal
World primary energy demand by fuel and scenario
Gas demand in 2035 is 13% higher than in the New Policies Scenario, while demand for coal, nuclear & oil declines
0
1 000
2 000
3 000
4 000
5 000
Oil Gas Coal Renewables Nuclear
Mto
e
2035 GAS Scenario
2035 New Policies
Scenario WEO-2010
2008

© OECD/IEA 2011
Consumption grows most in developing economies
Increase in natural gas consumption in the GAS scenario, 2010-2035
Non-OECD countries account for 80% of demand growth – China alone makes up nearly 30% of global growth & uses as much gas as the EU by 2035
0 100 200 300 400 500 600
Rest of the world
Africa
Russia
Latin America
India
Middle East
OECD total
China
bcm

© OECD/IEA 2011
Power sector drives gas demand
Change in power generation by fuel in the GAS scenario, 2010-2035
Total electricity demand increases 70% by 2035, underpinned by a near doubling of gas-fired generation
-1 000 0 1 000 2 000 3 000 4 000 5 000
Oil
Nuclear
Hydro
Coal
Other renewables
Wind
Gas
TWh

© OECD/IEA 2011
Natural gas: recoverable unconventional resources match conventional
Natural gas can enhance security of supply: global resources exceed 250 years of current production; while in each region, resources exceed 75 years of current consumption

© OECD/IEA 2011
Production of unconventional gas becomes widespread
Largest gas producers in the GAS Scenario, 2035
Unconventional gas supplies 40% of the 1.8 tcm increase in gas demand to 2035, making up nearly one quarter of total production
0 200 400 600 800 1 000
Turkmenistan
Saudi Arabia
Australia
Algeria
Canada
Qatar
Iran
China
United States
Russia Conventional
Unconventional
bcm

© OECD/IEA 2011
Growing LNG enhances supply security & market flexibility
Projected LNG liquefaction capacity by country
Trade in natural gas between major regions doubles to over 1 tcm by 2035, with Australia becoming a leading LNG supplier
0
100
200
300
400
500
600
2008 2009 2010 2011 2012 2013 2014 2015 2020
Europe
Other Africa
Other Middle East
Russia
Americas
Algeria
Indonesia
Nigeria
Other Asia
Qatar
Australia
bcm
© OECD/IEA 2011
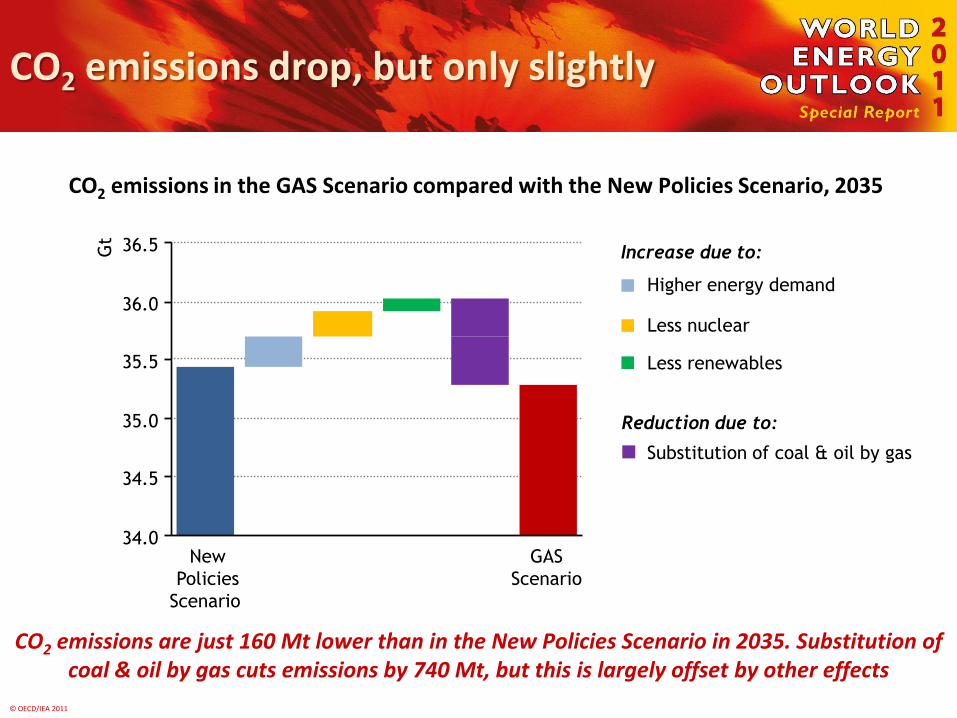
CO2 emissions drop, but only slightly
CO2 emissions in the GAS Scenario compared with the New Policies Scenario, 2035
CO2 emissions are just 160 Mt lower than in the New Policies Scenario in 2035. Substitution of coal & oil by gas cuts emissions by 740 Mt, but this is largely offset by other effects
34.0
34.5
35.0
35.5
36.0
36.5
New
Policies
Scenario
GAS
Scenario
Gt
Less nuclear
Less renewables
Higher energy demand
Increase due to:
Reduction due to:
Substitution of coal & oil by gas
© OECD/IEA 2011
Environmental concerns with unconventional gas
Existing regulatory regimes are being tested
Hydraulic fracturing: water use, contamination & disposal
Greenhouse-gas emissions
But regulatory & operational best practices can mitigate the risks
Ensuring gas, water & chemicals cannot enter other formations
Minimising water use
Treating & disposing of water appropriately
Limiting gas venting
Using best practice, “well-to-burner” emissions from shale gas production are 3.5% higher than from conventional gas
© OECD/IEA 2011
Key messages
Market uncertainties create opportunities for natural gas
Greater gas use could enhance regional energy security
New supplies & trade routes emerge
Gas has a role to play in a low-carbon energy economy, but increased use in itself is far from sufficient to reach the 2 C goal
Unconventional resources could boost supplies substantially
But best practice regulation is essential to mitigate environmental risks
In the GAS Scenario, demand for gas grows more than 50% by 2035, providing over 25% of world energy…..
.…. surely a prospect to designate the Golden Age of Gas

© OECD/IEA 2011
N. Tanaka & J. CorbenWashington, 8 June 2011