Embed Size (px)
Citation preview
Acknowledgements
Acknowledgements
The IEA-AMF Organization is grateful to the following countries and
their representatives for their support in providing research to
develop this report:
Finland – Päivi Aakko-Saksa, Timo Murtonen, Piritta Roslund,
Päivi Koponen and Jukka Nuottimäki, VTT; Panu Karjalainen,
Topi Rönkkö, TUT; Hilkka Timonen, Sanna Saarikoski, Risto
Hillamo, FMI;
Canada – Jill Hendren and Debbie Rosenblatt (Environment and
Climate Change Canada) and Natural Resources Canada (PERD)
and Transport Canada (eTV);
China – Zhang Fan and Tian Donglian (China Automotive
Technology & Research Center);
Sweden —Peter Ahlvik and Lars Eriksson (Ecotraffic on contract
from the Swedish Transport Administration);
Israel –Gideon Goldwine (Technion), Eran Sher (Technion), JRC
VELA lab staff, Dr. Bracha Halaf (Ministry of Energy and Water
Resources);
Contents
Contents
Chapter 1 Introduction .................................................................... 1 1.1 Project background................................................................ 1 1.2 Main research content and report structure ............................. 3
Chapter 2 Literature Review of Unregulated Pollutants Emissions ... 6 2.1 Pollutants characteristics from vehicle exhaust emissions ....... 6 2.2 Previous research on unregulated emissions in vehicle
exhaust ............................................................................... 11
Chapter 3 Test Matrix and Analysis Methods ................................. 27 3.1 Canada ................................................................................ 27 3.2 Finland ............................................................................... 31 3.3 China .................................................................................. 39 3.4 Israel .................................................................................. 45
Chapter 4 Comparison Results of Different Analysis Methods ........ 52 4.1 Instantaneous Regulated Emissions ...................................... 52 4.2 Cycle Average Regulated Emissions .................................... 55 4.3 Cycle Average Unregulated Emissions ................................. 58
Chapter 5 Exhaust Emissions Results of Different Alcohol Fuels, Vehicles and Temperatures ................................................. 62
5.1 Canada ................................................................................ 62 5.2 Finland ............................................................................... 77 5.3 China .................................................................................. 88 5.4 Israel .................................................................................113
Chapter 6 Comparison Results of Different Test Cycles ................117 6.1 Instantaneous regulated emissions results ...........................118 6.2 Instantaneous unregulated emissions results ........................120 6.3 Cycle average emissions results ..........................................123
Chapter 7 Conclusions and Summary ............................................125 7.1 Finland results ...................................................................125 7.2 Canada results ....................................................................127 7.3 China results ......................................................................128 7.4 Israel results ......................................................................130
References ...................................................................................131
Chapter 1 Introduction
1
Chapter 1 Introduction
1.1 Project background
The gradual depletion of petroleum resources throughout the world
generates an increased urgency to develop alternative energy sources.
Alcohol fuels have the advantages of a wide range of sources. These
fuels can be manufactured from biomass raw materials, agricultural
raw materials (e.g., sugar cane, cereals, and rice), timber and urban
waste, and fossil fuels (e.g., natural gas, petrochemical, and coal). A
number of countries support the use of alcohol alternative fuels. For
example, the United States, Brazil, and Sweden encourage the use of
ethanol fuel made from biomass materials. In addition, several
regions in China, including Shanxi Province and Shanghai, have
initiated a pilot program to promote the use of methanol fuel (Shangxi
Province, 2005).
Due to the reduction of the limits of regulated pollutant emissions,
unregulated pollutant emissions in the vehicle exhaust have attracted
an increasing attention. Studies indicate that the use of alcohol fuels
blended with gasoline in vehicles can reduce engine-out hydrocarbon
(HC) and carbon monoxide (CO) emissions to some extent. The
reduction occurs because the oxygen content in the fuel can promote
the complete combustion of the fuel. However, more unregulated
pollutants may be emitted, such as polycyclic aromatic hydrocarbons,
aldehydes, and ketones (Charalampos et al. 2003, Hasan 2003,
Vaughan et al 1994, Knapp et al. 1998, Poulopoulos et al. 2001).
These substances have very strong stimulation and sensitization. They
also have potential genetic toxicity and carcinogenic activity, which
Chapter 1 Introduction
2
could significantly impact human health. Such as formaldehyde and
acetaldehyde, they are easily converted into other secondary air
pollutants because of its short atmospheric residence time. They are
considered as nerve poisons, and even carcinogens, which cause
serious damage to the health of the body because they stimulate
people’s skin, eyes and olfactory mucous membrane. Inhalation or
contacting a large number of benzene into the body can cause acute or
chronic benzene poisoning. Mild poisoning can cause giddy,
headache, nausea, chest tightness, weakness and confusion. Severe
poisoning can cause coma which lead to death of respiratory and
circulatory failure. Benzene is a strong carcinogen, which inhibits the
body's hematopoietic function and reduces red blood cells, white
blood cells and platelets (Yan et al. 2004).
The harm to human health from the aromatic hydrocarbon, aldehyde,
ketone and other gas pollutants cannot be ignored. America
established more stringent emission standards in the “Clean Air
Amendments” (1990), formulated the new standards to control over
189 species of toxic pollutants, and classified 9 kinds of aldehydes
and ketones (including formaldehyde, acetaldehyde, propyl aldehyde,
acrolein, etc.) and 19 kinds of monocyclic and polycyclic aromatic
hydrocarbons (including benzene, toluene, ethyl benzene, etc.) as
hazardous emissions (Rutten et al. 1998). Japan promulgated “the
emission prevention law” and classified 234 species of harmful air
pollutants. 22 species of these were defined as priority pollutants,
including benzene, toluene, acetaldehyde, etc. Britain, France,
Germany and other European countries control the harmful pollutants
Chapter 1 Introduction
3
such as benzene, polycyclic aromatic hydrocarbons according to
promulgating and implementing a series of laws like “European air
quality guidelines” and “Instructions on European air quality and
cleaner air”. In China, the standards of environmental quality and
emissions contain the strict rule about formaldehyde, benzene and
total volatile organic compounds.
The issue of unregulated emissions has become an important factor
that could hinder further development of alcohol alternative fuels.
Therefore, it is necessary to investigate the unregulated pollutant
emissions from vehicles fueled with alcohol alternative fuels. This
type of research would serve to promote the application of alcohol
alternative fuels in a more expedient manner.
By measuring the unregulated pollutant emissions of vehicles fueled
with alcohol fuels, the main purpose of this project is to obtain the
unregulated pollutant emission levels of alcohol-fueled vehicles and
to gradually establish the measurement methods and limits of
unregulated pollutant emissions.
Furthermore, our research will examine the influences that
measurement methods, automotive technology, alcohol content in the
fuel, ambient temperature, test cycles, and other relevant factors have
on the vehicle unregulated pollutant emissions.
1.2 Main research content and report structure
The main activities of this project include:
(1) Literature survey, to obtain the existing measurement methods
and test data of unregulated emissions from alcohol- fuelled vehicles;
Chapter 1 Introduction
4
(2) Comparative analysis of different measurement methods of
unregulated pollutant emissions (such as FTIR, HPLC, GC and MS),
to establish the complete measurement specifications;
(3) Research on effects of different vehicles (PFI, GDI) on
unregulated pollutant emissions;
(4) Research on influences of alcohol content in the fuel (methanol
15%, 30%, 85% and ethanol 10%, 20%, 85%) on unregulated
pollutants types and concentration values in vehicle exhaust
emissions;
(5) Research on effects of the ambient temperature (25℃ , -7℃) on
the concentration of unregulated pollutant emissions;
(6) Investigation on the levels of unregulated pollutant emissions
from alcohols fuelled vehicles in different test cycles (U.S. FTP75,
Europe NEDC);
(7) Measurement on the regulated and unregulated evaporative
pollutant emissions from vehicles fuelled with alcohols.
This report is the summary of above-mentioned research project. The
structure of the report is shown as below:
Chapter 1 is Introduction, including project background, research
content and project structure.
Chapter 2 is Literature survey, including unregulated emissions
characteristics, measurement methods and previous research on
emissions of alcohol fuelled vehicles.
Chapter 3 mainly introduces the light-duty vehicles emissions tests on
the chassis dynamometer of Canada, Finland, China and Israel,
including: test fuels, vehicles, main test equipment, test curves,
Chapter 1 Introduction
5
regulated and unregulated pollutants analysis methods and other
relevant information.
Chapter 4 compares instantaneous emissions of CO, CO2, and NOX
pollutants as well as cycle average emissions of CO, CO2, NOX,
formaldehyde, acetaldehyde, benzene, and toluene pollutants, in order
to verify the accuracy and consistency of the various measurement
methods.
Chapter 5 mainly introduces the emissions tests of alcohol fueled
vehicles on the chassis dynamometer at normal and low temperatures
and researches the influences of key factors on the vehicle emissions
performance. It mainly contains the influences of alcohol content in
the fuels on regulated and unregulated pollutants emissions from
light-duty vehicles at normal and low temperatures, the influences of
ambient temperature on vehicle pollutants emissions, and the
influences of engine types on vehicle regulated emissions,
unregulated emission and particulate emissions.
Chapter 6 mainly introduces the comparison emissions tests of the
same light-duty vehicle fuelled with E10 fuel during European,
American and Japanese emissions regulations on a chassis
dynamometer, and researches the influences of different driving
cycles on the regulated and unregulated emissions.
Chapter 7 is the conclusion and summary of the research carried out
by Canada, Finland, China and Israel.
Chapter 2 Literature Review of Unregulated Pollutants Emissions
6
Chapter 2 Literature Review of Unregulated Pollutants Emissions
This chapter is the summary of literature survey, including
unregulated emissions characteristics, measurement methods and
previous research on emissions of alcohol fuelled vehicles.
2.1 Pollutants characteristics from vehicle exhaust emissions
There are many different kinds of vehicle exhaust emissions,
aldehydes, ketones and aromatic hydrocarbons, etc. which catch the
most attention from the researchers.
2.1.1 Aldehydes
Aldehydes is the compound combined with aldehyde group (-CHO)
and alkyl (or hydrogen atoms). Aldehyde group consists of a carbon
atom, a hydrogen atom and a double bond oxygen atom. Aldehydes in
vehicle exhaust emissions generally include formaldehyde,
acetaldehyde, acrolein, propionaldehyde, 2-butene aldehyde, methyl
acrolein, butyraldehyde, benzaldehyde, amyl aldehyde and hexanal,
etc. Totally formaldehyde and acetaldehyde are two of the main
vehicle exhausts emissions in the aldehyde pollutants, accounting for
about 70%-90% of the total aldehydes emissions (Sergio et al. 2007).
In general, aldehyde pollutants are all toxic substances. It can not
only result in the unwell symptom such as headaches, tiredness,
cross-eyed and upper respiratory tract stimulation, but also in the case
of acute poisoning cause the phenomenon of loss of consciousness
and the vomiting. It is even more important that they show a certain
genetic toxicity, as the compound belongs to direct electrophilic
class.
Chapter 2 Literature Review of Unregulated Pollutants Emissions
7
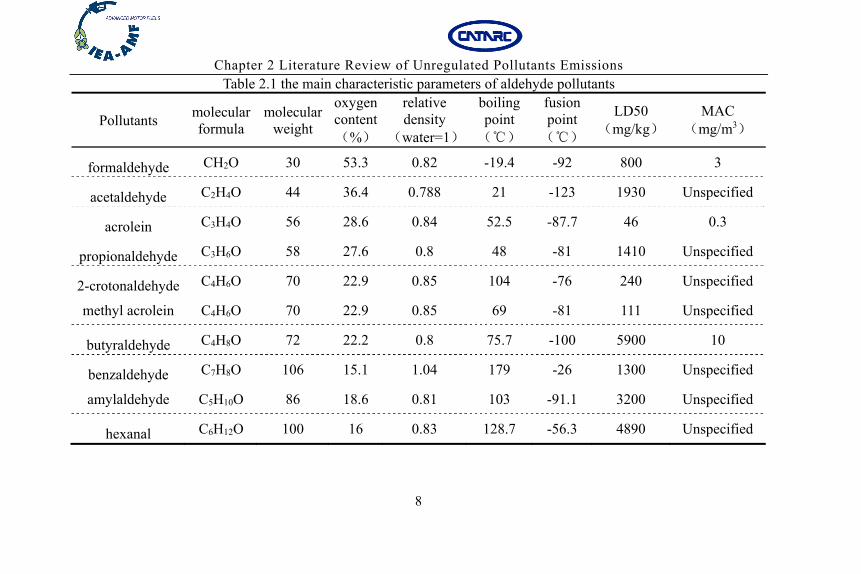
Table 2.1 lists the main characteristic of aldehyde pollutants
parameters. Seen from the table, expect for formaldehyde and
acetaldehyde appearing gaseous at normal temperature, aliphatic
aldehydes below C12 are liquids. The comparison of LD50 and MAC
data shows that the most toxic pollutants are acrolein, methyl acrolein,
2-butene aldehyde and formaldehyde.
Formaldehyde is one of the most important pollutants in vehicle
exhaust emissions. Formaldehyde is the next highest in the priority
controlled list of toxic chemicals in China. It has been confirmed by
the world health organization (WHO) as the carcinogenic substances
and the material causing deformity. It is regarded as the source of
allergy and also one of highly potential mutagenic material.
Acetaldehyde is another important pollutant in vehicle exhaust
emissions. Toxicity of acetaldehyde is slightly less than that of
formaldehyde, and as 83 times of ethanol. It has strongly excitant,
which can stimulate the nervous centralis of vomit to make the person
produce nausea, vomiting, cause the headaches because of brain
shrinkage, and stimulate person’s peripheral nerve and skin.
2.1.2 Ketones
Ketones are the compounds constituted by carbonyl and two
hydroxyls. Carbonyl group is the bivalent group made up of a carbon
atom and a double bond of the oxygen atom group. Ketones in vehicle
exhaust emissions generally includes acetone, 2-butanone, 2,3-butyl
ketone, 2-pentanone, cyclohexanone, etc.
Chapter 2 Literature Review of Unregulated Pollutants Emissions
8
Table 2.1 the main characteristic parameters of aldehyde pollutants
Pollutants molecular formula
molecular weight
oxygen content (%)
relative density
(water=1)
boiling point (℃)
fusion point(℃)
LD50 (mg/kg)
MAC (mg/m3)
formaldehyde CH2O 30 53.3 0.82 -19.4 -92 800 3
acetaldehyde C2H4O 44 36.4 0.788 21 -123 1930 Unspecified
acrolein C3H4O 56 28.6 0.84 52.5 -87.7 46 0.3
propionaldehyde C3H6O 58 27.6 0.8 48 -81 1410 Unspecified
2-crotonaldehyde C4H6O 70 22.9 0.85 104 -76 240 Unspecified
methyl acrolein C4H6O 70 22.9 0.85 69 -81 111 Unspecified
butyraldehyde C4H8O 72 22.2 0.8 75.7 -100 5900 10
benzaldehyde C7H8O 106 15.1 1.04 179 -26 1300 Unspecified
amylaldehyde C5H10O 86 18.6 0.81 103 -91.1 3200 Unspecified
hexanal C6H12O 100 16 0.83 128.7 -56.3 4890 Unspecified
Chapter 2 Literature Review of Unregulated Pollutants Emissions
9
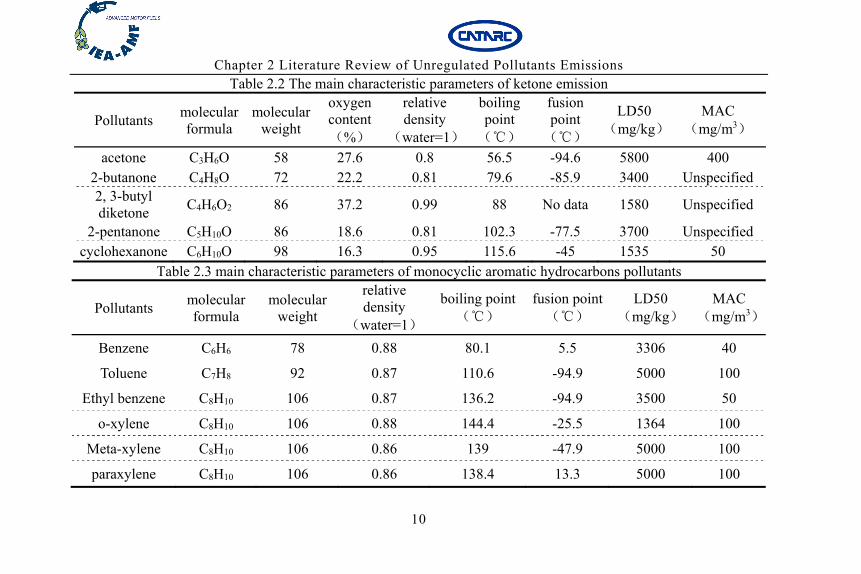
Table 2.2 lists the main characteristic parameters of ketone pollutants.
From the table, the boiling point of ketones is higher than 50℃ and
the melting point is lower than 40℃ . Thus, the ketones are liquid at
room temperature. The main impacts of ketones are anesthesia and
inhibitor on the nervous centralis system. Through the contrast of the
LD50 and MAC data, it can be seen that the toxicity of ketones is
lower than that of aldehyde.
Acetone is the largest ketones in vehicle exhaust emissions, which
belong to the slight nervous centralis inhibitors. Contacting high
concentrations emissions may cause damage of liver, kidney and
pancreas for individuals. Long-term damage from acetone to the
human body is shown as the stimulus symptoms to eyes, such as
lacrimation, photophobia and corneal epithelium infiltrating, and also
appears dizziness, burning sensation, throat irritation, coughing, etc.
2.1.3 Aromatic hydrocarbons
Aromatic hydrocarbons are hydrocarbons which contain one or
several benzene ring structures in the molecule. According to the
number and the connection mode of benzene rings, aromatic
hydrocarbons can be divided into monocyclic aromatics hydrocarbons
and polycyclic aromatic hydrocarbons by the structure.
Monocyclic aromatic hydrocarbons are mainly benzene homologues,
including benzene, toluene, ethylbenzene, o-xylene, m-xylene,
p-xylene, etc. Table 2.3 shows the main characteristic parameters of
monocyclic aromatic hydrocarbon pollutants.
Chapter 2 Literature Review of Unregulated Pollutants Emissions
10
Table 2.2 The main characteristic parameters of ketone emission
Pollutants molecular formula
molecular weight
oxygen content (%)
relative density
(water=1)
boiling point (℃)
fusion point(℃)
LD50 (mg/kg)
MAC (mg/m3)
acetone C3H6O 58 27.6 0.8 56.5 -94.6 5800 400 2-butanone C4H8O 72 22.2 0.81 79.6 -85.9 3400 Unspecified 2, 3-butyl diketone
C4H6O2 86 37.2 0.99 88 No data 1580 Unspecified
2-pentanone C5H10O 86 18.6 0.81 102.3 -77.5 3700 Unspecified cyclohexanone C6H10O 98 16.3 0.95 115.6 -45 1535 50
Table 2.3 main characteristic parameters of monocyclic aromatic hydrocarbons pollutants
Pollutants molecular formula
molecular weight
relative density
(water=1)
boiling point (℃)
fusion point(℃)
LD50 (mg/kg)
MAC (mg/m3)
Benzene C6H6 78 0.88 80.1 5.5 3306 40
Toluene C7H8 92 0.87 110.6 -94.9 5000 100
Ethyl benzene C8H10 106 0.87 136.2 -94.9 3500 50
o-xylene C8H10 106 0.88 144.4 -25.5 1364 100
Meta-xylene C8H10 106 0.86 139 -47.9 5000 100
paraxylene C8H10 106 0.86 138.4 13.3 5000 100
Chapter 2 Literature Review of Unregulated Pollutants Emissions
11
The main part of aromatic hydrocarbons from vehicle exhaust
emissions is benzene, toluene and xylene. Mononuclear aromatics are
all toxic. Benzene has the strongest effect on the nervous centralis
and blood. It is generally believed that benzene entering into body
can form metabolites with blood toxicity in the hematopoietic tissue
itself. Long-term exposure to benzene can cause genetic and bone
marrow damage. The blood picture check presents white blood cells
and thrombocytopenia reducing, pancytopenia, aplastic anemia, and
even leukaemia.
2.2 Previous research on unregulated emissions in vehicle
exhaust
Existing literatures show that many automobile companies and
research institutions have carried out qualitative and quantitative
analysis on unregulated emissions. Different measurement methods
were utilized to measure various unregulated emissions from
methanol and ethanol engines and vehicles (Wei et al. 2008, Liu et al.
2007, Charlotte et al 2010, Zhang et al. 2006, Zhang et al. 2008, Ge et
al. 2008, Zhang et al. 2010, Liu et al. 2010, He et al 2003, Dong et al.
2006). For example, in Xi'an Jiaotong University, Tianjin University
and Jilin University unburned methanol and formaldehyde emissions
from methanol-gasoline engines were measured by GC. In Chrysler
Motor Company, The American auto testing laboratory and Beijing
Institute of Technology, HPLC and GC-MS were used to measure
benzene and formaldehyde emissions during the driving cycle from
methanol-gasoline vehicles. In Tsinghua University, methanol,
Chapter 2 Literature Review of Unregulated Pollutants Emissions
12
formaldehyde and acetaldehyde emissions before and after the
catalyst from methanol-gasoline engines were also measured by FTIR.
In Xi'an Jiaotong University, Tsinghua University, Tianjin University
and the Massachusetts Institute of Technology, GC was used to
measure formaldehyde, acetaldehyde and ethanol emissions from
ethanol-gasoline engines. In the French Institute of Petroleum,
acetaldehyde and aromatic hydrocarbon emissions in the exhaust from
ethanol vehicles were measured by GC-MS. FTIR were also used to
measure the instantaneous emissions of formaldehyde, acetaldehyde
and benzene from ethanol-gasoline vehicles in different cycle
conditions in Austria AVL Company and the Finnish National
Technology Research Center. A few of typical projects researching
on the effects of alcohol proportions in fuels on vehicle pollutant
emissions are discussed in the following sections.
2.2.1 Research on the effect of E85 on the exhaust emissions
High-oxygen-containing fuels, for example up to 85% ethanol (E85),
can be used in special flexible-fuel vehicles (FFV). In Brazil, FFV
cars are also designed for the use of hydrous E100 fuel. Methanol
(M85) was used in the FFVs in early 90’s, and now it is used again,
for example, in China. FFV cars are basically spark-ignition gasoline
cars with some modifications. For example, all materials in the FFV
cars are compatible with ethanol. Due to E85 fuel’s low energy
content, fuel injectors of the FFV cars are designed for higher fuel
flows than in conventional gasoline cars leading to higher volumetric
fuel consumption despite of lower energy consumption. Feedback
Chapter 2 Literature Review of Unregulated Pollutants Emissions
13
control in FFV cars adjusts fuel delivery and ignition timing.
Ethanol’s higher octane rating would enable an increased
compression ratio to achieve better energy efficiency. However, FFV
cars still represent a compromise when compared to dedicated alcohol
cars. The ignition of ethanol is poor, and therefore excess fuel is
injected during cold starts when using E85 fuel to achieve
performance similar to gasoline cars. Consequently, some exhaust
emissions tend to be high when using E85 in the cold-start when the
three-way catalyst is not warmed-up. Engine- and emissions-control
technologies are expected to reduce cold-start exhaust emissions of
the FFV cars using the E85 fuel in the future. (Lupescu 2009, Chiba
et al. 2010, Kabasin et al. 2009, Yanowitz and McCormick 2009).
Recently, a concern of adverse effect of ethanol on the aged TWC
catalyst has been presented (Winkler et al. 2013).
When the automotive exhaust emissions are evaluated, it is important
to consider harmfulness of the emissions. The US EPA’s Mobile
Source Air Toxic (MSAT) list from 2007 discusses key MSATs:
benzene, 1,3-butadiene, formaldehyde, acetaldehyde, acrolein,
polycyclic organic matter (POM), naphthalene, diesel exhaust and
gasoline particulate matter. Benzene, 1,3-butadiene, formaldehyde
and benzo[a]pyrene have been classified as human carcinogens
(IARC, 2010, 2012). Acetaldehyde (IARC, 1999) has been classified
as a possible carcinogen. Many other compounds, such as PAHs and
nitro-PAHs have been classified as proven, probable or possible
carcinogens to humans. Ethene forms potential damages for plants
and contribute in the formation of ozone and peroxylacetyl nitrate
Chapter 2 Literature Review of Unregulated Pollutants Emissions
14
(PAN) (Gaffney and Marley 2011). Risk factors for calculating the
cancer potency of exhaust gas are defined by many organisations.
OEHHA (2009) defines cancer unit risks and potency factors for 107
carcinogenic substances or groups of substances. The US EPA IRIS
(Integrated Risk Information System) is a human health-assessment
programme that evaluates quantitative and qualitative risk
information for effects that may result from exposure to
environmental contaminants. The Nordic Swan labelling criteria for
biofuels define substances, which are measured in accordance with a
particular protocol, and calculate the cancer potency of exhaust gas
using risk factors (Nordic Ecolabelling 2008). There are differences
in the risk factors defined by different organizations.
Volatile organic compounds (VOC) contribute to the formation of
ground-level ozone together with nitrogen oxides (NOX) in the
presence of heat and sunlight. Potential interactions between ozone
and particulate matter emissions have been suggested. Precursor
gases emitted by transport sources affect PM2.5, PM10 and ozone
formation locally and in other regions. Exhaust and evaporative
emissions from gasoline cars are the dominant source of VOCs within
the transport sector, contributing 19% to the total VOCs emitted in
2010. Ozone causes adverse health effects, for example irritation of
the respiratory system, coughing, throat irritation, reduction of lung
function and induced asthma. There is also evidence of the effect of
ozone on, for example, cardiovascular related morbidity (US EPA
2007). Ozone contributes to damage to plants and ecosystems, which
may lead to species shifts and losses reflecting also related goods and
Chapter 2 Literature Review of Unregulated Pollutants Emissions
15
services (US EPA 2007). Individual VOC species contribute
differently to formation of ozone and oxidants. Carter and Atkinson
(1987) developed a maximum incremental reactivity (MIR) scale to
assess the ozone-forming potential (OFP) of any emitted molecule.
Environmental impacts can be analyzed by various methodologies,
such as CML2001 or ReCiPe2008, which take into account OFP, but
also acidification potential (AP), photochemical oxidation creation
potential (POCP), particulate matter formation potential (PMFP) and
marine eutrophication potential (MEP) (Querini et al. 2011).
Transformation of primary exhaust emissions into secondary products
is an important aspect when transport sector’s emissions are assessed.
For example, about 30% of PM10 measured is in the form of
secondary inorganic sulphate and nitrate aerosols, which are formed
from the transformation of gaseous SO2, NOX and NH3 emitted from
various sources. These aerosols are presumably even more important
as regards PM2.5 (EEA 2012a). Secondary organic aerosols are
formed from atmospheric oxidation and subsequent condensation of
various VOCs (EEA 2012a, AQEG 2005).
Ammonia originates mainly from agricultural sources. However,
concern of traffic sources in the production of ammonium aerosols
increased as the use of urea-based SCR systems for NOX control for
diesel vehicles became common. Ammonia is also formed by the
three-way catalysts of the spark-ignited gasoline cars. Nitrous oxide
(N2O), a strong greenhouse gas, is also induced by catalyst chemistry
under lean conditions. (Meija-Centeno 2007, EEA 2012b).
Chapter 2 Literature Review of Unregulated Pollutants Emissions
16
NOX, CO and HC emissions tend to be lower or at the same level for
E85/FFVs than for gasoline at normal test temperature. NOX
comprises almost totally of NO while NO2 emissions are low. Despite
of low CO and HC emissions at normal test temperature, at -7°C
higher or similar emission level has been observed for E85 as for
gasoline (Laurikko et al. 2013, Aakko et al. 2011, Yanowitz and
McCormick 2009, Graham et al. 2008, Westerholm et al. 2008, De
Serves 2005, Aakko and Nylund 2003). The latent heat of
vaporization of ethanol is higher than that of gasoline leading to poor
cold-startability and high emissions of organic gases at cold starts.
(Chiba et al. 2010). On the other hand, fuel evaporative emissions are
lower for E85 than for gasoline (Yanowitz and McCormick 2009,
Westerholm 2008). Lower permeation emissions have also been
reported for the E85 fuel than the non-ethanol fuel (Haskew and
Liberty 2006, Kassel 2006, Stahl et al. 1992).
Higher methane and ethene, but lower benzene, toluene and
1,3-butadiene emissions are reported for E85 than for gasoline at
normal temperature (Clairotte et al. 2013, Karavalakis et al. 2012,
Yanowitz and McCormick
2009, Westerholm et al. 2008). At -7°C, high methane, ethene,
acetylene and BTEX emissions have been observed for the FFV car
using the E85 fuel. (Aakko-Saksa et al. 2011).
The formaldehyde, acetaldehyde and ethanol emissions tend to
increase substantially when E85 is compared with gasoline at cold
starts at low temperatures (Clairotte 2013, Karavalakis et al. 2012,
Aakko-Saksa et al. 2011, Yanowitz and McCormic 2009, Graham
Chapter 2 Literature Review of Unregulated Pollutants Emissions
17
2008, Westerholm et al. 2008 and De Serves 2005). Westerholm et al.
(2008) reported that acetaldehyde emissions were 8–15 times higher
for an FFV car using E85 than when using E5 at normal test
temperature, and more than 100 times higher at a test temperature of
-7°C. Acetaldehyde, formaldehyde, and ethanol emissions represent a
major part of organic gas emissions with ethanol containing fuels
during the engine cold start (Chiba et al. 2010). However, when
engine and catalyst are warmed up, lower or similar acetaldehyde and
ethanol emissions have been reported for E85 than for gasoline (De
Serves 2005).
Millet et al. (2012) reported that the increased ethanol use is
estimated to elevate acetaldehyde concentration in atmosphere, which
leads to higher PAN: NOX ratio via peroxylacetyl radicals combined
with lower NOX emissions.
Particulate matter (PM) emissions for FFVs using E85 have been
lower than for gasoline at normal temperature (Yanowitz and
McCormic 2009). At -7°C, higher PM emission has been observed for
the E85 fuel than for gasoline, assumedly related to cold-start
behavior of car (Westerholm et al. 2008). Hayes et al. (2013)
observed that elemental carbon emissions decreased with increasing
ethanol content of fuel (Hays et al. 2013). For E85, low PAH
emissions have been reported at normal test temperature, but elevated
PAH emissions and cancer potency at -7°C (Westerholm et al. 2008,
Aakko-Saksa et al. 2011).
Lower particle number emissions have been observed for E85 than for
gasoline at normal temperature, but the opposite has been seen at
Chapter 2 Literature Review of Unregulated Pollutants Emissions
18
-7°C (Westerholm et al. 2008, De Serves 2005). According to Lee et
al. (2009), particle number emission decreased by 37% when E85 was
compared with gasoline. In these studies, only dry particles were
measured with so called “PMP” procedure. Szybist et al. (2011)
concluded that low particle number emissions for E85 would enable
using efficient direct-injection technology without penalty of high
particle emissions.
Lower OFP for E85 has been reported when compared with gasoline
at normal temperature (Graham et al. 2008). At cold temperature E85
may induce higher OFP due to increased ethanol, ethene and
acetaldehyde emissions (Clairotte et al. 2013, Aakko-Saksa et al.
2011). These studies were not taken into account atmospheric
chemistry or the NOX emissions. In the US, E85 has been estimated to
slightly increase ozone under summer, but particularly over winter
conditions. (Jacobson 2007, Ginnebaugh and Jacobson 2012).
Negligible changes or varying results in OFP and PM have been
reported for the dedicated E85 vehicles in the U.S. (Nopmongcol et al.
2011, Alhajeri et al. 2012). Formation of ozone is a complex process
involving CO, VOC, NOX and meteorological conditions, and it is not
straight-forward to conclude the impact of fuel. (Querini et al. 2011).
Fridell et al. (2014) estimated that for regions in Sweden health risks
decrease with E85 compared with gasoline due to decreased NOX in
relation to smaller effects on ozone, acetaldehyde, PM2.5 and
benzene. However, authors pointed out that NOX indicator may not be
applicable for the E85 case, because there are differences in exhaust
Chapter 2 Literature Review of Unregulated Pollutants Emissions
19
components associated with NOX from different combustion
processes.
Well-to-Wheel (WTW) environmental impacts of cars and fuels were
analyzed by Querini et al. (2011). Differences in emission impacts
between fuels (E85, gasoline) were less significant than between car
generations from Euro 3 to Euro 5. Also in the scenarios by Winther
et al. (2012) emission impacts of E85 on NOX, VOC and CO were
small. These conclusions were based on the car emissions at normal
temperature. According to Huo et al. (2009), E85 reduces VOCs, NOX,
PM and CO emissions in the life-cycle perspective in urban areas by
up to 30%, as the major part of emissions are released in production
of ethanol. Yang et al. (2012) claim that E85 does not necessarily
outperform gasoline when wide spectrum of life-cycle environmental
impacts is considered.
Ammonia (NH3) or nitrous oxide (N2O) are not directly fuel-related
emissions. However, fuel has some indirect influence on these
catalyst-generated emissions. Mejia-Centeno (2007) observed that
low sulphur fuels reduce the formation of nitrous oxide emission
while favouring the formation of ammonia. Clairotte et al. (2013)
reported of lower ammonia emissions for E85 than for E5. Graham et
al. (2008) observed that N2O tends to increase with increasing ethanol
content of fuel. In one study, nitrous oxide emissions were very low,
mostly below 4 ppm, for three spark-ignition cars representing
different engine technologies regardless of fuel. (Aakko-Saksa 2011)
Chapter 2 Literature Review of Unregulated Pollutants Emissions
20
2.2.2 Research on the effect of low content methanol fuels
The INTROMET (INTroduction of METhanol) project. It was
started in 2003 with financial support from the Swedish Energy
Administration (Ecotraffic, 2006). The objective was to study the
introduction of methanol as a motor fuel, primarily via low-level
blending in gasoline. One car, a Renault Clio of model year 2002, was
tested at several fuel blends. The tests were conducted at a chassis
dynamometer at AVL MTC in Jordbro. To isolate the effect of
methanol on emissions, the base gasoline was ethanol free, and
blended with 0 (baseline), 5, 10, 15 and 20 % methanol. The test
cycle was the NEDC driving cycle and double tests at each fuel was
conducted. The test temperature was 22°C.
Besides regulated emissions, also aldehydes (formaldehyde and
acetaldehyde), particle mass, particle number and particle size
distribution were measured. The latter components were measured
with an electrical low-pressure impactor (ELPI™ by Dekati in
Tampere, Finland). The results for CO and HC emissions showed
clear trends of decrease with higher content of methanol but in some
cases, the measurement scatter was relatively large. The measurement
scatter for NOX emissions was relatively high but the comparatively
high level at the highest blending level suggests that the air-fuel ratio
could have been too lean. This is a well-known phenomenon and also
indicates that the blending limit for this particular car could lie at
~15 %. Modal emissions show the two phases of the driving cycle and
the total weighted result. Formaldehyde emissions showed an
Chapter 2 Literature Review of Unregulated Pollutants Emissions
21
increasing trend while the acetaldehyde emissions were decreasing
with increasing methanol content.
Interestingly, the particle mass (PM) emissions decreased
substantially with increasing methanol content. The decrease from
baseline condition (0 % methanol) to the level for 20 % methanol
content was as high as approximately a factor of 5. Note that this was
during test at normal ambient conditions, which was +22°C in this
case. Therefore, it is not known if this very positive trend of PM vs.
blending rate would also be valid at lower ambient temperatures.
Extensive data on real-time emissions of particle number and size
distribution were collected. One general observation was that
significant levels of particles were emitted in the first acceleration
with the cold engine and the acceleration in the highway part of the
test cycle. The results for particle number and size distribution were
not clear. Since the definition of solid particle number (SPN) was not
conceived when these tests were carried out, it should be noted that
the tests were not made with a sampling and dilution system that
removes volatile particles. Thus, any firm conclusions from the
results on particle number and size distribution should not be made. A
trend towards a marginal reduction of the CO2 emissions could be
seen. Since the ratio between hydrogen and coal is higher in methanol
than in gasoline, this could explain the results for fuel consumption
and CO2 emissions.
Emission tests on an engine dynamometer were carried out at the
Chalmers Technical University in Gothenburg. The same fuel
compositions as in the chassis dynamometer tests were used. Only

Chapter 2 Literature Review of Unregulated Pollutants Emissions
22
regulated emission components were measured. A port-injected
(Volvo) and a direct-injected engine (Mitsubishi) were used.
Emissions were measured at various speed and load test points.
Methanol blending seems to have a certain positive impact on CO and
energy efficiency. For HC and NOX no clear impact could be seen.
The trend was a small increase for HC for both engine types while
NOX decreased for the port-injected engine but increased marginally
for the direct-injected engine. The exhaust content of methane,
acetaldehyde, formaldehyde and methanol in the exhaust was very
low. The catalyst will reduce these levels even further with the
exception for methane. In summary, it was concluded that no
objections for blending methanol in gasoline could be found.
Optimizing the engine and its injection system would give further
improvements.
The Swedish M15 project in the 1970’s and 1980’s. In the search
for alternate fuels for the transportation sector, methanol was
considered a competitive candidate in the late 1970’s. It was
anticipated that methanol-gasoline blends may be used in the
automobiles at that time with minor adjustments. In the process of
evaluating the environmental implications when gasoline is replaced
by a methanol-gasoline blend, comparative emission data have been
generated.
During 1975 – 76 two fuels were tested at the BP laboratories in
Sunbury on Thames for Volvo and Swedish companies involved in
introducing methanol as a component in gasoline. The main interest
was to check the increase of octane requirement for a special blend of
Chapter 2 Literature Review of Unregulated Pollutants Emissions
23
16 % methanol and 4 % isobutanol in a mixture of reformate and
straight run gasoline. Octane requirement increased for a test period
of 30 000 km and had not stabilized. One fuel pump and one
carburettor float malfunctioned due to the fuel. Nothing was said
about cleaning additives in the reference or test fuel. There was a
tendency for higher increase of octane number requirement for
vehicles run on the methanol containing fuel compared to references
run on a reference gasoline without methanol (BP, 1976).
Four vehicles of 1976 model, two Volvo 244 cars equipped with
carburettors and two Volvo 264 cars with fuel injection without
catalysts, were used for tests with gasoline followed by tests with a
methanol-gasoline blend. No attempt was made to optimize the
engine systems for best utilization of the methanol, for example,
compression ratios and ignition timing. When running on gasoline,
the vehicles were adjusted according to the manufacturer´s
specifications. When running on methanol-gasoline blend the carbon
monoxide content in the exhaust gas was used as a measure of the
“leaning out effect” caused by methanol, which was compensated for.
No other adjustments were made. Drivability was considered
satisfactory with both fuels. However, no specific drivability tests
were made. Ordinary leaded gasoline and a methanol –gasoline blend
consisting of 80 % (volume) of lead-free gasoline, 18 % methanol and
2 % isobutanol were used.
Tests were made on a chassis dynamometer according to the 1975
Federal Emission Test Procedure and also the European Test
Procedure. Carbon monoxide (CO), hydrocarbons (HC) and nitrogen
Chapter 2 Literature Review of Unregulated Pollutants Emissions
24
oxides (NOX) sere measured and fuel consumption was calculated. In
addition, total aldehydes, formaldehyde and polynuclear aromatic
hydrocarbons (PAH) were analyzed.
The following conclusions were drawn from the study of four Volvo
cars where a methanol-gasoline blend was substituted for a standard
gasoline: CO, HC and NOX tended to slightly decrease (provided that
the carburettor and fuel injection system are carefully maintained).
Total aldehydes increased, formaldehyde being responsible for most
of the increase. The amount of PAH seems to depend more on the
driving cycle and driving pattern prior to the test than on the fuel. No
significant difference could be detected between the two regarding
PAH emissions. The fuel consumption was about the same on an
energy basis. With widespread use, adjustment of the fuel system will
be a critical point. Monitoring the carbon monoxide content at idling
will not be sufficient to obtain optimal performance.
The experimental program was conducted by the Swedish Methanol
Development Co. (SMAB), the group for Exhaust Gas Research, AB
Atomenergi and the department of Analytical Chemistry, Arrhenius
Laboratory, and Stockholm University. The tests in the project were
run in the last quarter of 1977. The test was performed on chassis
dynamometer and regulated emissions measured according to best
available technique of that time for example measuring after CVS
system and HC measured with FID for all driving cycles (Britt-Marie
Bertilsson et al., 1978-02-01).
Emissions were tested according to the old ECE test procedure with
four consecutive city cycles with a maximum speed of 50 km/h. The
Chapter 2 Literature Review of Unregulated Pollutants Emissions
25
US-73 test cycle was composed of one Yht and one Ys cycle with
maximum speeds around 90 and 55 km h (Bertilsson & Egebäck,
1978). The regulated emissions were very high, compared to what we
demand today, but typical of well-maintained vehicles of that time.
The two vehicles with carburettors had idle emissions of 3-4 % CO,
the ones with fuel injection 1-2 %. The M20 has a leaning out effect
on the emissions, especially the US cycles with their higher load. For
the ECE tests, formaldehyde was 35 to 45 % higher and total
aldehydes were 10 to 30 % higher for M20 compared to gasoline. For
the US tests, formaldehyde was 15 to 35 % higher and total aldehydes
were 10 to 30 % higher. The increase of total aldehyde values were
almost all the result of increased formaldehyde emissions when
running on M20.
Temperature in the exhaust system is very much dependent on
developed power from the engine and during start-up phase losses
occurs via condensation of water and the deposition of combustion
products in pipes and mufflers. PAH emissions were sampled from
undiluted exhaust with a constant flow system based on laminar flow
elements in the engine air flow and after the sampling equipment. The
volume sampled was about 7 % of the total flow. After cooling in all
glass cooler, the gas was filtered in a 127 mm glass fibre filter 99.9 %
effective on 0.3 μm particles. Acetone was used for rinsing the cooler
after the test and added to the condensed water which was extracted
and analyzed separately. Emissions of PAH were generally much
higher in the US test cycles which could depend on the higher load
and thus higher temperature rise and exhaust pipe/muffler
Chapter 2 Literature Review of Unregulated Pollutants Emissions
26
temperature. This in turn will help to evaporate PAH from deposits in
engine and exhaust system. Emissions of PAH were on average 25 %
higher for the M20 fuel. The cold started cycles however (ECE cold
and US-73), has higher relative PAH emissions for the M20 fuel,
which could be explained by cold start enrichment washing the inlet
system and the cylinder walls thus dissolving deposited PAH in
engine and exhaust system.
Chapter 3 Test Matrix and Analysis Methods
27
Chapter 3 Test Matrix and Analysis Methods
This chapter mainly introduces the light-duty vehicles emissions tests
on the chassis dynamometer of Canada, Finland, China and Israel,
including: test fuels, vehicles, main test equipment, test curves,
regulated and unregulated pollutants analysis methods and other
relevant information.
3.1 Canada
Testing was conducted by Environment and Climate Change Canada’s
Emissions Research and Measurement Section. This test program
was supported by Transport Canada’s ecoTECHNOLOGY for
Vehicles Program (eTV) and Natural Resources Canada’s Program of
Energy Research and Development (PERD) Advanced Fuels and
Technologies for Emissions Reduction (AFTER 9)
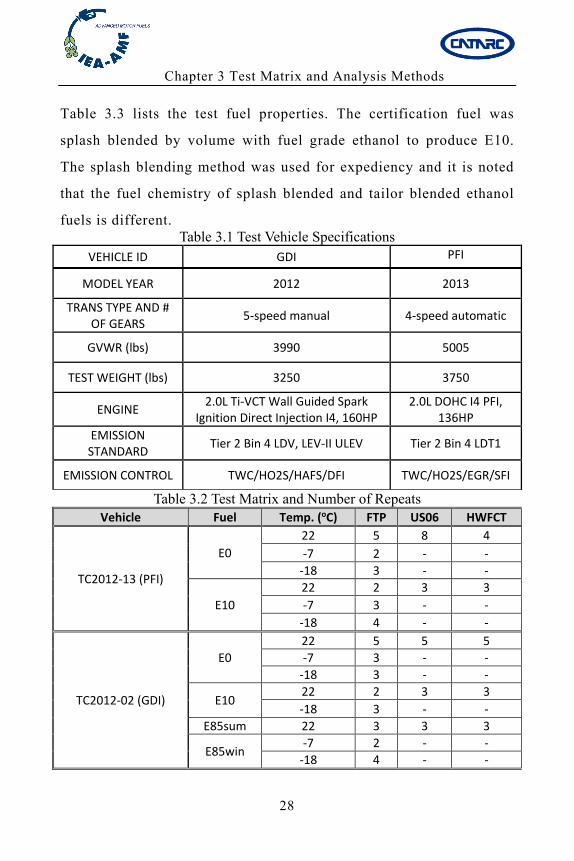
3.1.1 Test matrix
Two vehicles (shown in Table 3.1), a Ford Transit Connect
employing port fuel injection (PFI) and a Ford Focus flexible fuel
vehicle (FFV) with gasoline direct injection (GDI) were tested on 0%
and 10% ethanol blended gasoline (E0 and E10). Three test cycles
were used representing city driving and cold-start (FTP-75),
aggressive high speed driving (US06), and free flow highway driving
(HWFCT). Tests were performed at temperatures of 22°C, -7°C, and
-18°C. The Ford Focus was also tested on two different 85% by
volume ethanol blends (E85), summer (E85sum) and winter (E85win),
while operated at 22°C, and -7°C and -18°C respectively. Table 3.2
provides a summary of the test matrix.
Chapter 3 Test Matrix and Analysis Methods
28
Table 3.3 lists the test fuel properties. The certification fuel was
splash blended by volume with fuel grade ethanol to produce E10.
The splash blending method was used for expediency and it is noted
that the fuel chemistry of splash blended and tailor blended ethanol
fuels is different. Table 3.1 Test Vehicle Specifications
VEHICLE ID GDI PFI
MODEL YEAR 2012 2013
TRANS TYPE AND # OF GEARS
5‐speed manual 4‐speed automatic
GVWR (lbs) 3990 5005
TEST WEIGHT (lbs) 3250 3750
ENGINE 2.0L Ti‐VCT Wall Guided Spark
Ignition Direct Injection I4, 160HP 2.0L DOHC I4 PFI,
136HP
EMISSION STANDARD
Tier 2 Bin 4 LDV, LEV‐II ULEV Tier 2 Bin 4 LDT1
EMISSION CONTROL TWC/HO2S/HAFS/DFI TWC/HO2S/EGR/SFI
Table 3.2 Test Matrix and Number of Repeats Vehicle Fuel Temp. (oC) FTP US06 HWFCT
TC2012‐13 (PFI)
E0
22 5 8 4
‐7 2 ‐ ‐
‐18 3 ‐ ‐
E10
22 2 3 3
‐7 3 ‐ ‐
‐18 4 ‐ ‐
TC2012‐02 (GDI)
E0
22 5 5 5
‐7 3 ‐ ‐
‐18 3 ‐ ‐
E10 22 2 3 3
‐18 3 ‐ ‐
E85sum 22 3 3 3
E85win ‐7 2 ‐ ‐
‐18 4 ‐ ‐
Chapter 3 Test Matrix and Analysis Methods
29
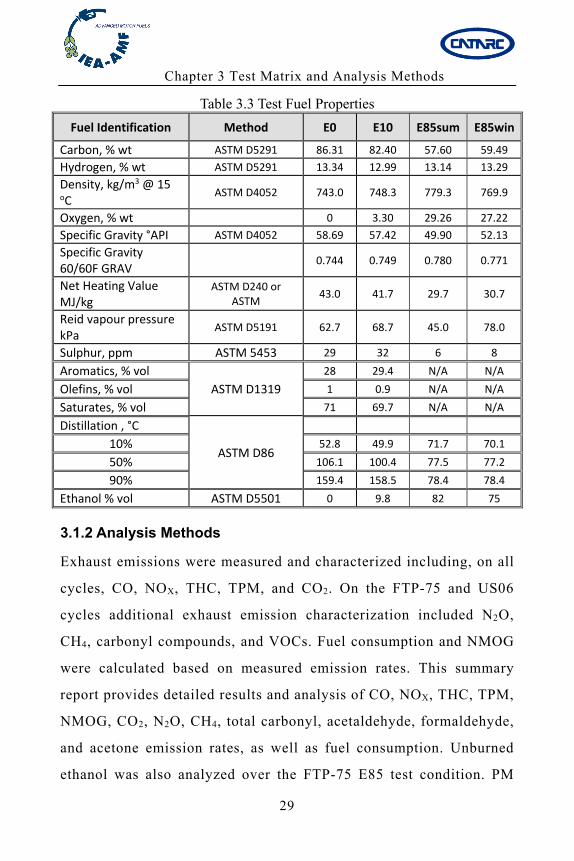
Table 3.3 Test Fuel Properties
Fuel Identification Method E0 E10 E85sum E85win
Carbon, % wt ASTM D5291 86.31 82.40 57.60 59.49
Hydrogen, % wt ASTM D5291 13.34 12.99 13.14 13.29
Density, kg/m3 @ 15 oC
ASTM D4052 743.0 748.3 779.3 769.9
Oxygen, % wt 0 3.30 29.26 27.22
Specific Gravity °API ASTM D4052 58.69 57.42 49.90 52.13
Specific Gravity 60/60F GRAV
0.744 0.749 0.780 0.771
Net Heating Value MJ/kg
ASTM D240 or ASTM
43.0 41.7 29.7 30.7
Reid vapour pressure kPa
ASTM D5191 62.7 68.7 45.0 78.0
Sulphur, ppm ASTM 5453 29 32 6 8
Aromatics, % vol
ASTM D1319
28 29.4 N/A N/A Olefins, % vol 1 0.9 N/A N/A Saturates, % vol 71 69.7 N/A N/A Distillation , °C
ASTM D86
10% 52.8 49.9 71.7 70.1
50% 106.1 100.4 77.5 77.2
90% 159.4 158.5 78.4 78.4
Ethanol % vol ASTM D5501 0 9.8 82 75
3.1.2 Analysis Methods
Exhaust emissions were measured and characterized including, on all
cycles, CO, NOX, THC, TPM, and CO2. On the FTP-75 and US06
cycles additional exhaust emission characterization included N2O,
CH4, carbonyl compounds, and VOCs. Fuel consumption and NMOG
were calculated based on measured emission rates. This summary
report provides detailed results and analysis of CO, NOX, THC, TPM,
NMOG, CO2, N2O, CH4, total carbonyl, acetaldehyde, formaldehyde,
and acetone emission rates, as well as fuel consumption. Unburned
ethanol was also analyzed over the FTP-75 E85 test condition. PM
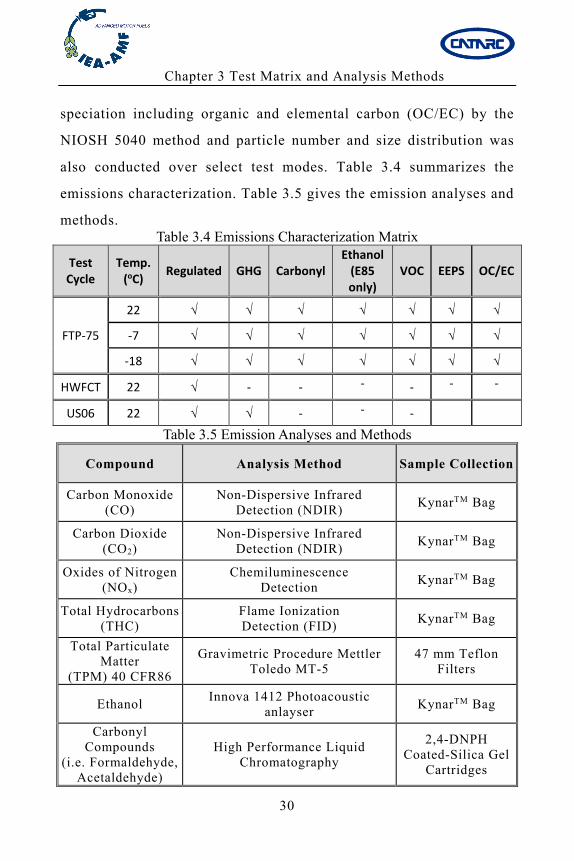
Chapter 3 Test Matrix and Analysis Methods
30
speciation including organic and elemental carbon (OC/EC) by the
NIOSH 5040 method and particle number and size distribution was
also conducted over select test modes. Table 3.4 summarizes the
emissions characterization. Table 3.5 gives the emission analyses and
methods. Table 3.4 Emissions Characterization Matrix
Test Cycle
Temp. (oC)
Regulated GHG Carbonyl Ethanol (E85 only)
VOC EEPS OC/EC
FTP‐75
22 √ √ √ √ √ √ √
‐7 √ √ √ √ √ √ √
‐18 √ √ √ √ √ √ √
HWFCT 22 √ ‐ ‐ ‐ ‐ ‐ ‐
US06 22 √ √ ‐ ‐ ‐
Table 3.5 Emission Analyses and Methods
Compound Analysis Method Sample Collection
Carbon Monoxide (CO)
Non-Dispersive Infrared Detection (NDIR)
KynarTM Bag
Carbon Dioxide (CO2)
Non-Dispersive Infrared Detection (NDIR)
KynarTM Bag
Oxides of Nitrogen (NOx)
Chemiluminescence Detection
KynarTM Bag
Total Hydrocarbons (THC)
Flame Ionization Detection (FID)
KynarTM Bag
Total Particulate Matter
(TPM) 40 CFR86
Gravimetric Procedure Mettler Toledo MT-5
47 mm Teflon Filters
Ethanol Innova 1412 Photoacoustic
anlayser KynarTM Bag
Carbonyl Compounds
(i.e. Formaldehyde, Acetaldehyde)
High Performance Liquid Chromatography
2,4-DNPH Coated-Silica Gel
Cartridges
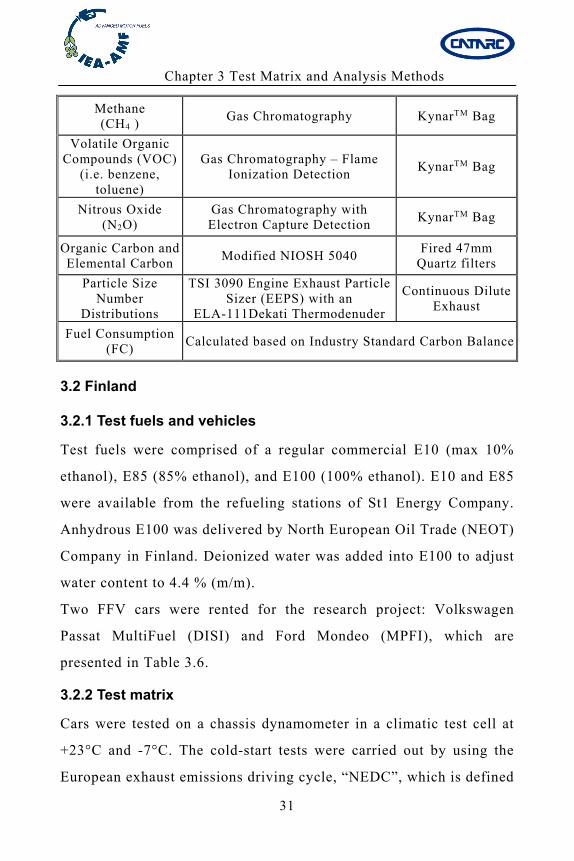
Chapter 3 Test Matrix and Analysis Methods
31
Methane (CH4 )
Gas Chromatography KynarTM Bag
Volatile Organic Compounds (VOC)
(i.e. benzene, toluene)
Gas Chromatography – Flame Ionization Detection
KynarTM Bag
Nitrous Oxide (N2O)
Gas Chromatography with Electron Capture Detection
KynarTM Bag
Organic Carbon and Elemental Carbon
Modified NIOSH 5040 Fired 47mm
Quartz filters
Particle Size Number
Distributions
TSI 3090 Engine Exhaust Particle Sizer (EEPS) with an
ELA-111Dekati Thermodenuder
Continuous Dilute Exhaust
Fuel Consumption (FC)
Calculated based on Industry Standard Carbon Balance
3.2 Finland
3.2.1 Test fuels and vehicles
Test fuels were comprised of a regular commercial E10 (max 10%
ethanol), E85 (85% ethanol), and E100 (100% ethanol). E10 and E85
were available from the refueling stations of St1 Energy Company.
Anhydrous E100 was delivered by North European Oil Trade (NEOT)
Company in Finland. Deionized water was added into E100 to adjust
water content to 4.4 % (m/m).
Two FFV cars were rented for the research project: Volkswagen
Passat MultiFuel (DISI) and Ford Mondeo (MPFI), which are
presented in Table 3.6.
3.2.2 Test matrix
Cars were tested on a chassis dynamometer in a climatic test cell at
+23°C and -7°C. The cold-start tests were carried out by using the
European exhaust emissions driving cycle, “NEDC”, which is defined
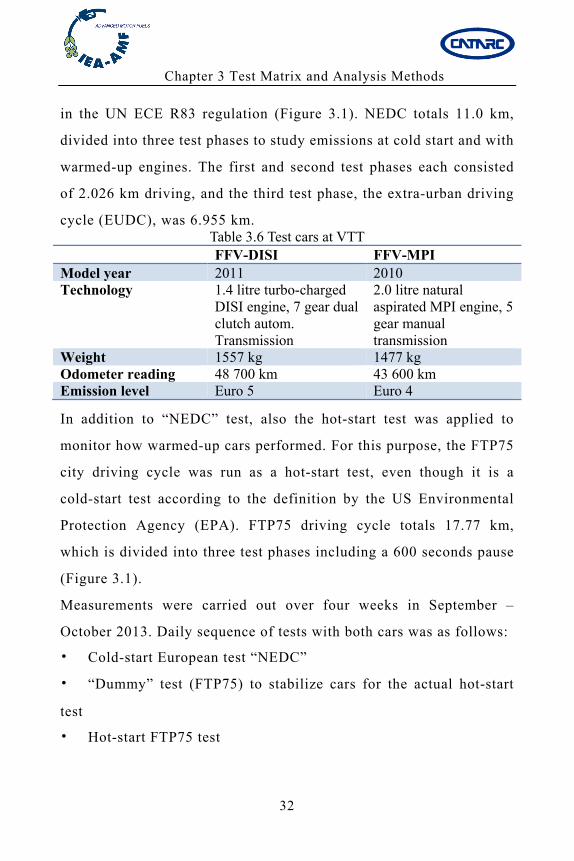
Chapter 3 Test Matrix and Analysis Methods
32
in the UN ECE R83 regulation (Figure 3.1). NEDC totals 11.0 km,
divided into three test phases to study emissions at cold start and with
warmed-up engines. The first and second test phases each consisted
of 2.026 km driving, and the third test phase, the extra-urban driving
cycle (EUDC), was 6.955 km. Table 3.6 Test cars at VTT
FFV-DISI FFV-MPI Model year 2011 2010 Technology 1.4 litre turbo-charged
DISI engine, 7 gear dual clutch autom. Transmission
2.0 litre natural aspirated MPI engine, 5 gear manual transmission
Weight 1557 kg 1477 kg Odometer reading 48 700 km 43 600 km Emission level Euro 5 Euro 4
In addition to “NEDC” test, also the hot-start test was applied to
monitor how warmed-up cars performed. For this purpose, the FTP75
city driving cycle was run as a hot-start test, even though it is a
cold-start test according to the definition by the US Environmental
Protection Agency (EPA). FTP75 driving cycle totals 17.77 km,
which is divided into three test phases including a 600 seconds pause
(Figure 3.1).
Measurements were carried out over four weeks in September –
October 2013. Daily sequence of tests with both cars was as follows:
• Cold-start European test “NEDC”
• “Dummy” test (FTP75) to stabilize cars for the actual hot-start
test
• Hot-start FTP75 test
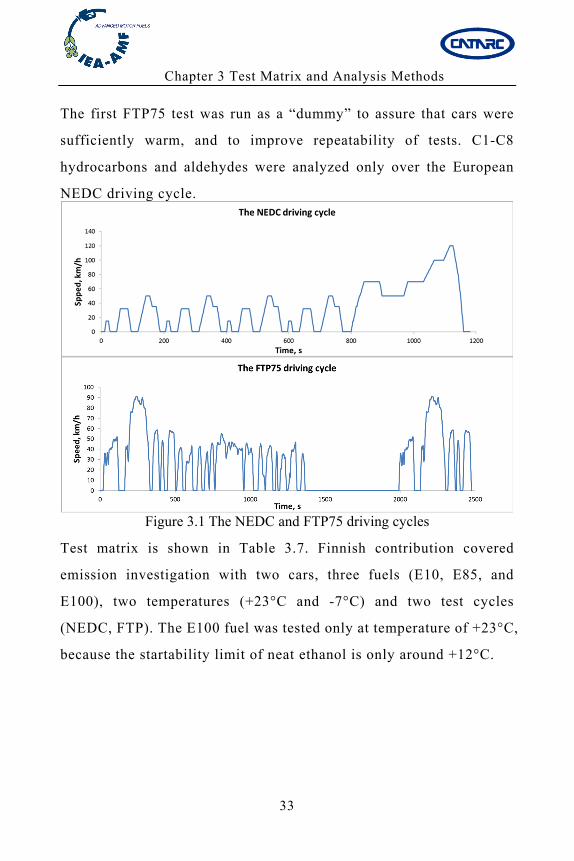
Chapter 3 Test Matrix and Analysis Methods
33
The first FTP75 test was run as a “dummy” to assure that cars were
sufficiently warm, and to improve repeatability of tests. C1-C8
hydrocarbons and aldehydes were analyzed only over the European
NEDC driving cycle.
Figure 3.1 The NEDC and FTP75 driving cycles
Test matrix is shown in Table 3.7. Finnish contribution covered
emission investigation with two cars, three fuels (E10, E85, and
E100), two temperatures (+23°C and -7°C) and two test cycles
(NEDC, FTP). The E100 fuel was tested only at temperature of +23°C,
because the startability limit of neat ethanol is only around +12°C.
Chapter 3 Test Matrix and Analysis Methods
34
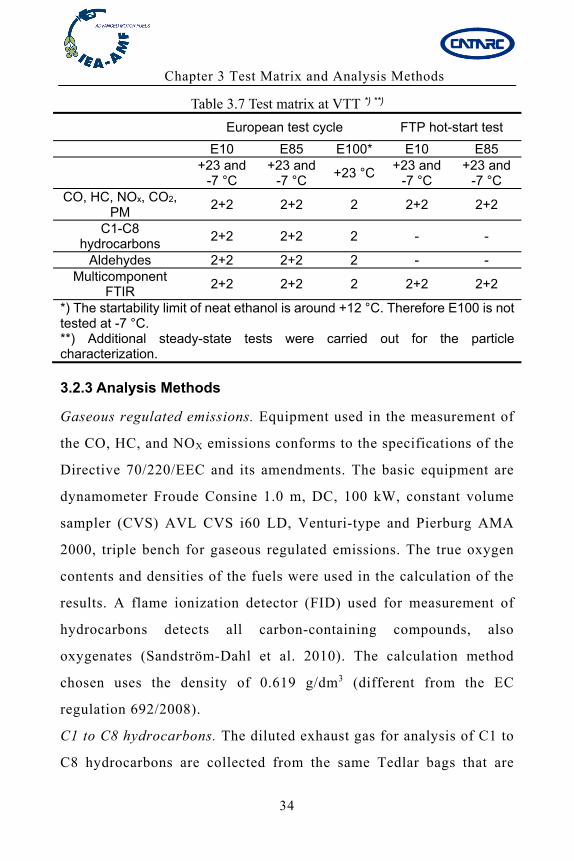
Table 3.7 Test matrix at VTT *) **)
European test cycle FTP hot-start test
E10 E85 E100* E10 E85
+23 and
-7 °C +23 and
-7 °C +23 °C
+23 and -7 °C
+23 and -7 °C
CO, HC, NOx, CO2, PM
2+2 2+2 2 2+2 2+2
C1-C8 hydrocarbons
2+2 2+2 2 - -
Aldehydes 2+2 2+2 2 - - Multicomponent
FTIR 2+2 2+2 2 2+2 2+2
*) The startability limit of neat ethanol is around +12 °C. Therefore E100 is not tested at -7 °C. **) Additional steady-state tests were carried out for the particle characterization.
3.2.3 Analysis Methods
Gaseous regulated emissions. Equipment used in the measurement of
the CO, HC, and NOX emissions conforms to the specifications of the
Directive 70/220/EEC and its amendments. The basic equipment are
dynamometer Froude Consine 1.0 m, DC, 100 kW, constant volume
sampler (CVS) AVL CVS i60 LD, Venturi-type and Pierburg AMA
2000, triple bench for gaseous regulated emissions. The true oxygen
contents and densities of the fuels were used in the calculation of the
results. A flame ionization detector (FID) used for measurement of
hydrocarbons detects all carbon-containing compounds, also
oxygenates (Sandström-Dahl et al. 2010). The calculation method
chosen uses the density of 0.619 g/dm3 (different from the EC
regulation 692/2008).
C1 to C8 hydrocarbons. The diluted exhaust gas for analysis of C1 to
C8 hydrocarbons are collected from the same Tedlar bags that are
Chapter 3 Test Matrix and Analysis Methods
35
used for measurement of the regulated emissions, and fed to the gas
chromatograph, (HP 5890 Series II, AL2O3, KCl/PLOT column, an
external standard method). The hydrocarbons analysed are methane,
ethane, ethene, propane, propene, acetylene, isobutene, 1,3-butadiene,
benzene, toluene, ethyl benzene and m-, p- and o-xylenes. The
detection limit is 0.02 mol-ppm, which corresponds to approximately
0.1 mg/km for methane, 0.5 mg/km for 1,3-butadiene and 0.7 mg/km
for benzene.
Aldehydes are collected from the CVS diluted exhaust gas using
2,4-dinitrophenylhydrazine (DNPH) cartridges. The DNPH
derivatives are extracted with an acetonitrile/water mixture and
analysed using HPLC technology (Agilent 1260, UV detector,
Nova-Pak C18 column). Aldehydes analysed are formaldehyde,
acetaldehyde, acrolein, propionaldehyde, crotonaldehyde,
methacrolein, butyraldehyde, benzaldehyde, valeraldehyde,
m-tolualdehyde and hexanal. The detection limit for aldehydes
corresponds to approximately 0.01 mg/km.
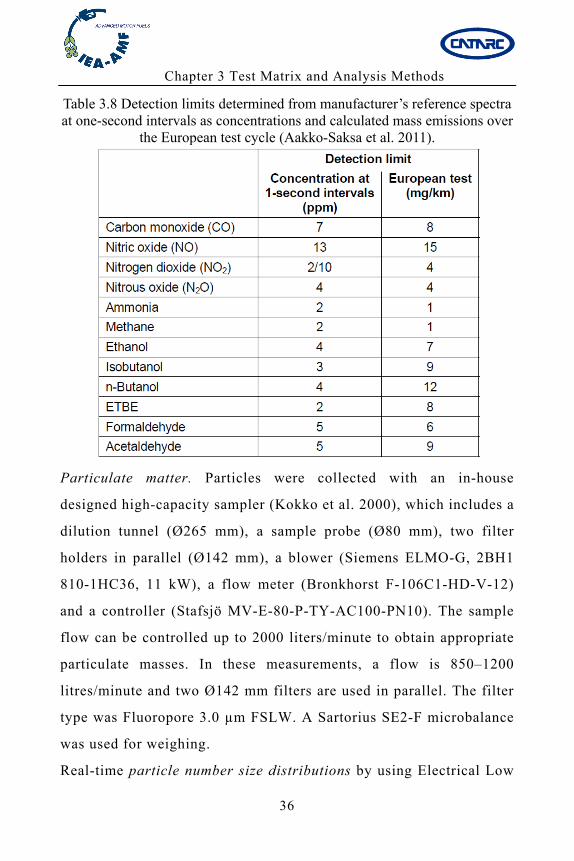
Multi-component analysis. A number of compounds were measured
on-line using Fourier transformation infrared (FTIR) equipment
(Gasmet Cr-2000). More than 10 exhaust components from the raw
exhaust gas were measured at two-second intervals. The
concentrations of many compounds are low with gasoline-fuelled cars
when compared to detection limits (Table 3.8). These detection limits
were converted to corresponding mass-based emissions representing
the duration of the European test cycle with certain assumptions.
Chapter 3 Test Matrix and Analysis Methods
36
Table 3.8 Detection limits determined from manufacturer’s reference spectra at one-second intervals as concentrations and calculated mass emissions over
the European test cycle (Aakko-Saksa et al. 2011).
Particulate matter. Particles were collected with an in-house
designed high-capacity sampler (Kokko et al. 2000), which includes a
dilution tunnel (Ø265 mm), a sample probe (Ø80 mm), two filter
holders in parallel (Ø142 mm), a blower (Siemens ELMO-G, 2BH1
810-1HC36, 11 kW), a flow meter (Bronkhorst F-106C1-HD-V-12)
and a controller (Stafsjö MV-E-80-P-TY-AC100-PN10). The sample
flow can be controlled up to 2000 liters/minute to obtain appropriate
particulate masses. In these measurements, a flow is 850–1200
litres/minute and two Ø142 mm filters are used in parallel. The filter
type was Fluoropore 3.0 µm FSLW. A Sartorius SE2-F microbalance
was used for weighing.
Real-time particle number size distributions by using Electrical Low
Chapter 3 Test Matrix and Analysis Methods
37
Pressure Impactor (ELPI, >8 nm) equipment by VTT after the TUT’s
dilution system shown in Figure 3 to validate stability of the
measurements and to screen tailpipe particle emissions. In Europe, a
particle number limit applies to the Euro 5/6 emission level light-duty
vehicles with certain exceptions. The procedure takes into account
only solid “dry” particles as the volatile portion of particles is
evaporated before the measurement. The particle number
measurements with ELPI at VTT took into account total number of
“wet” particles. Therefore the European PN limit of 5 × 10¹¹ #/km is
not relevant for the results of this report.
In-depth analyses of nanoparticle formation and of secondary organic
aerosols were carried out by the Tampere University of Technology
(TUT) and the Finnish Meteorological Institute (FMI). Primary
(tailpipe) emissions go through atmospheric transformations leading
to secondary emissions. FMI and TUT studied this phenomena by
using the Potential Aerosol Mass (PAM) chamber to oxidize primary
emissions into secondary organic aerosols (SOA). Measurements
were carried out before and after the PAM chamber.
FMI characterized before and after PAM from sub-micron PM:
organics, sulfate, nitrate, ammonium, chloride, black carbon and
metals (e.g. Ni, V, Ba, Cr, Fe, etc) with time resolution of 5 seconds
by using the SP-AMS equipment (Figure 3.2).
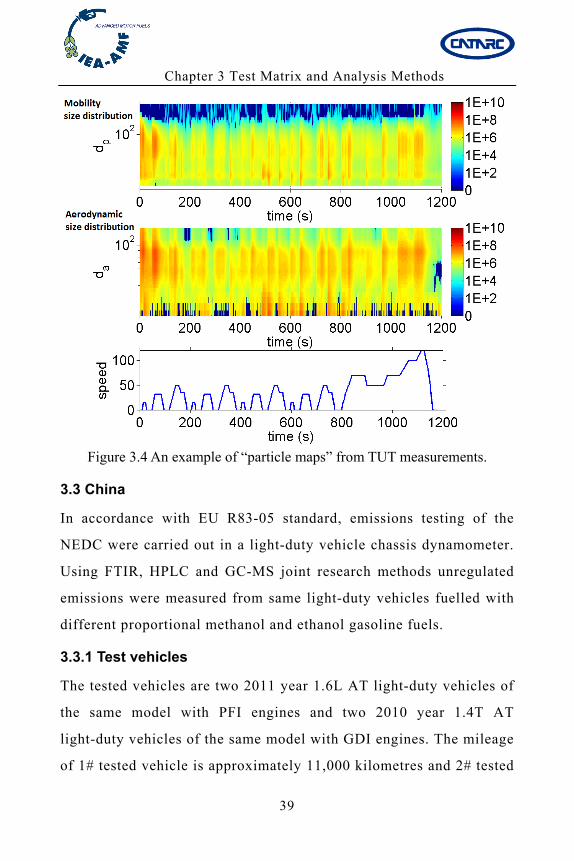
TUT focused on in-depth characterization of particles by on-line
detection of particle number sizes and number concentrations as
“particle maps”. In addition to primary particles, also secondary
aerosol formed in atmospheric reactions is studied (after PAM
Chapter 3 Test Matrix and Analysis Methods
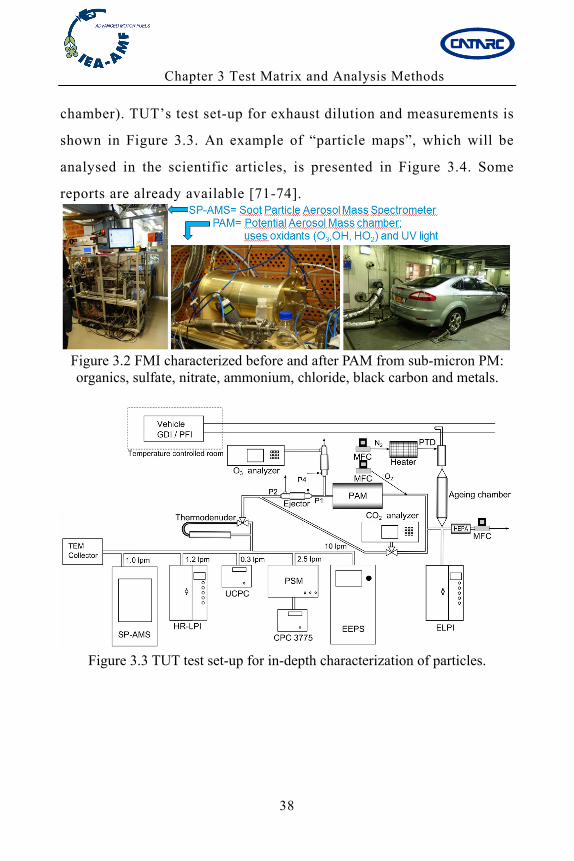
38
chamber). TUT’s test set-up for exhaust dilution and measurements is
shown in Figure 3.3. An example of “particle maps”, which will be
analysed in the scientific articles, is presented in Figure 3.4. Some
reports are already available [71-74].
Figure 3.2 FMI characterized before and after PAM from sub-micron PM: organics, sulfate, nitrate, ammonium, chloride, black carbon and metals.
Figure 3.3 TUT test set-up for in-depth characterization of particles.
Chapter 3 Test Matrix and Analysis Methods
39
Figure 3.4 An example of “particle maps” from TUT measurements.
3.3 China
In accordance with EU R83-05 standard, emissions testing of the
NEDC were carried out in a light-duty vehicle chassis dynamometer.
Using FTIR, HPLC and GC-MS joint research methods unregulated
emissions were measured from same light-duty vehicles fuelled with
different proportional methanol and ethanol gasoline fuels.
3.3.1 Test vehicles
The tested vehicles are two 2011 year 1.6L AT light-duty vehicles of
the same model with PFI engines and two 2010 year 1.4T AT
light-duty vehicles of the same model with GDI engines. The mileage
of 1# tested vehicle is approximately 11,000 kilometres and 2# tested
Chapter 3 Test Matrix and Analysis Methods
40
vehicle is 22,000km. The mileage of 3# tested vehicle is
approximately 24,000 kilometres and 4# tested vehicle is
41,000km.1# tested vehicle used pure gasoline, M15, and M30 fuels.
2 # tested vehicle used pure gasoline, E10, and E20 fuels. 3# tested
vehicle used pure gasoline, M15, and M30 fuels. 4 # tested vehicle
used pure gasoline, E10, and E20 fuels. The parameters of tested
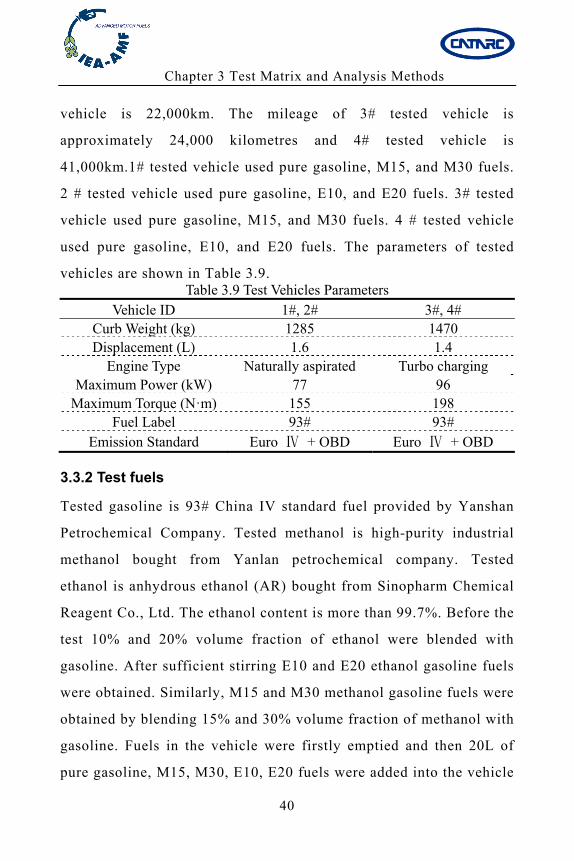
vehicles are shown in Table 3.9. Table 3.9 Test Vehicles Parameters
Vehicle ID 1#, 2# 3#, 4# Curb Weight (kg) 1285 1470 Displacement (L) 1.6 1.4
Engine Type Naturally aspirated Turbo charging Maximum Power (kW) 77 96
Maximum Torque (N·m) 155 198 Fuel Label 93# 93#
Emission Standard Euro Ⅳ + OBD Euro Ⅳ + OBD
3.3.2 Test fuels
Tested gasoline is 93# China IV standard fuel provided by Yanshan
Petrochemical Company. Tested methanol is high-purity industrial
methanol bought from Yanlan petrochemical company. Tested
ethanol is anhydrous ethanol (AR) bought from Sinopharm Chemical
Reagent Co., Ltd. The ethanol content is more than 99.7%. Before the
test 10% and 20% volume fraction of ethanol were blended with
gasoline. After sufficient stirring E10 and E20 ethanol gasoline fuels
were obtained. Similarly, M15 and M30 methanol gasoline fuels were
obtained by blending 15% and 30% volume fraction of methanol with
gasoline. Fuels in the vehicle were firstly emptied and then 20L of
pure gasoline, M15, M30, E10, E20 fuels were added into the vehicle
Chapter 3 Test Matrix and Analysis Methods
41
in turn to carry out the test. After the test the remaining fuels in the
vehicle were release off and then 2L of fuel samples were sent to SGS
test center and analyzed. The analysis results of the parameters of
pure gasoline, methanol gasoline, and ethanol gasoline fuels are
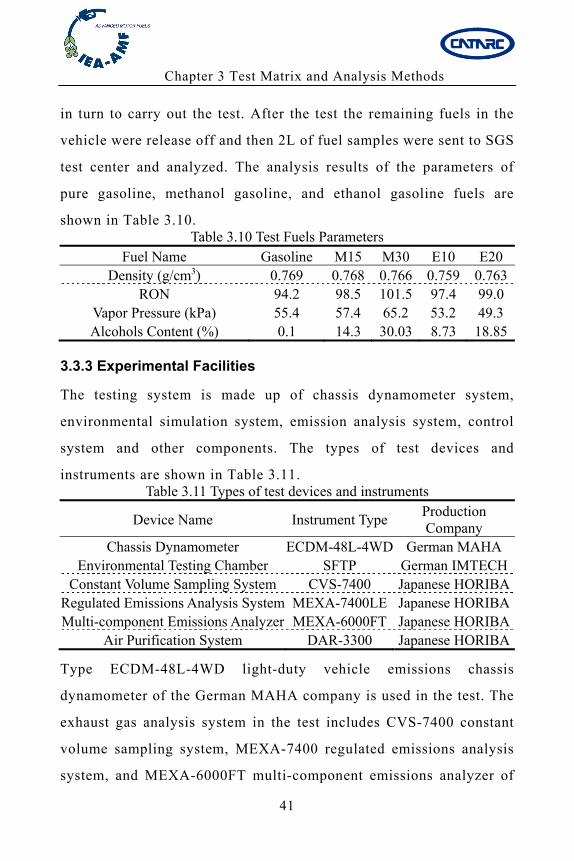
shown in Table 3.10. Table 3.10 Test Fuels Parameters
Fuel Name Gasoline M15 M30 E10 E20 Density (g/cm3) 0.769 0.768 0.766 0.759 0.763
RON 94.2 98.5 101.5 97.4 99.0 Vapor Pressure (kPa) 55.4 57.4 65.2 53.2 49.3 Alcohols Content (%) 0.1 14.3 30.03 8.73 18.85
3.3.3 Experimental Facilities
The testing system is made up of chassis dynamometer system,
environmental simulation system, emission analysis system, control
system and other components. The types of test devices and
instruments are shown in Table 3.11. Table 3.11 Types of test devices and instruments
Device Name Instrument Type Production Company
Chassis Dynamometer ECDM-48L-4WD German MAHA Environmental Testing Chamber SFTP German IMTECH
Constant Volume Sampling System CVS-7400 Japanese HORIBA Regulated Emissions Analysis System MEXA-7400LE Japanese HORIBA Multi-component Emissions Analyzer MEXA-6000FT Japanese HORIBA
Air Purification System DAR-3300 Japanese HORIBA
Type ECDM-48L-4WD light-duty vehicle emissions chassis
dynamometer of the German MAHA company is used in the test. The
exhaust gas analysis system in the test includes CVS-7400 constant
volume sampling system, MEXA-7400 regulated emissions analysis
system, and MEXA-6000FT multi-component emissions analyzer of
Chapter 3 Test Matrix and Analysis Methods
42
the Japanese Horiba Company. The environment simulation system
includes SFTP low temperature environmental testing chamber of the
German IMTECH Company and DAR-3300 air purification system of
Horiba Company.
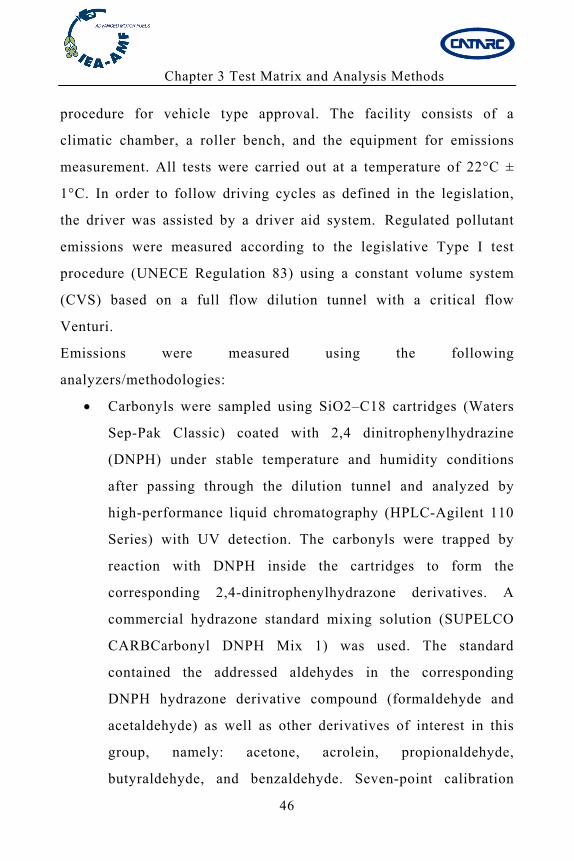
3.3.4 Analysis methods of Instantaneous Emissions
Instantaneous and cycle average emissions of regulated and
unregulated pollutants in the vehicle exhaust were measured by joint
methods of MEXA, FTIR, HPLC, and GC-MS.
Instantaneous regulated emissions were measured by two kinds of
methods: MEXA-7400LE (MEXA method) and MEXA-6000FT
(FTIR method).
In MEXA method the sampling object is the diluted exhaust gas,
which has mixed with the dilution air in the mixing chamber. In the
MEXA-7400LE system the instantaneous values of CO and CO2
emissions are measured by NDIR (Non-Dispersive Infrared) analyzer.
Instantaneous NOX emission is measured by CLD (Chemiluminescent
detector) analyzer. HFID (Heated flame ionization detector) analyzer
is used to measure the instantaneous value of HC emission. The
measurement results are marked as CO(MEXA), NOX(MEXA),
CO2(MEXA), and HC(MEXA).
In FTIR method instantaneous values of CO, NOX, CO2, and CH4
emissions in the vehicle exhaust before the mixing chamber are
measured using MEXA-6000FT. According to the method specified in
the EU R83-05 standard, the instantaneous dilution factor is
calculated by instantaneous CO2, HC and CO emissions values, which
Chapter 3 Test Matrix and Analysis Methods
43
are obtained from the MEXA-7400LE system. Through the factor the
FTIR measured concentration is converted into the concentration in
the diluted exhaust gas, respectively marked as CO(FTIR),
NOX(FTIR), CO2(FTIR), and CH4(FTIR).
The instantaneous emissions of CH3OH, HCHO, CH3CHO, C6H6,
C7H8, C2H4, C3H6, 1,3-C4H6, and iso-C4H8 unregulated pollutants
before the dilution are measured by MEXA-6000FT (FTIR method).
3.3.5 Analysis methods of Cycle Average Regulated Emissions
The cycle average emissions of regulated pollutants are calculated by
three kinds of methods: MEXA analysis of bag sampling, integral of
FTIR instantaneous values, and integral of MEXA instantaneous
values.
In MEXA analysis of bag sampling method, regulated emissions of
CO, NOX, HC, and CH4 pollutants of diluted exhaust gas in the
sampling bag are measured MEXA-7400LE at the end of the driving
cycle. The results are marked as MEXA analysis results of bag
sampling.
In the integral of FTIR instantaneous values method, the cycle
average emissions are calculated by integrating the instantaneous
emissions curve. According to the EU R83-05 standard, the
instantaneous flow of the diluted exhaust gas is recorded by the
constant volume sampling system. The integral of above FTIR
instantaneous emissions results and the instantaneous flow is
calculated. The average emissions values of CO, NOX, CO2, and CH4
pollutants during the cycle are obtained by dividing the total vehicle
Chapter 3 Test Matrix and Analysis Methods
44
driving distance. The results are marked as the integral results of
FTIR instantaneous values.
Similarly in the integral of MEXA instantaneous values method, the
average emissions of CO, NOX, CO2, and HC pollutants during the
entire NEDC are obtained by the integral of the MEXA instantaneous
emissions results and the instantaneous exhaust gas flow, marked as
the integral results of MEXA instantaneous values.
3.3.6 Analysis methods of Cycle Average Unregulated Emissions
The cycle average emissions of unregulated pollutants are measured
by two kinds of methods: the integral of FTIR instantaneous values
and chemical analysis of bag sampling.
Similarly as CO, NOX, CO2, and CH4 pollutants, the average
emissions of formaldehyde, acetaldehyde, benzene, toluene, methanol,
ethylene, propylene, 1,3-butadiene, and isobutylene pollutants during
the NEDC are obtained by the integral of FTIR instantaneous values
method.
In the chemical analysis of bag sampling method, unregulated
emissions of the diluted exhaust gas in the sampling bag are measured
by the chemical analysis method from the dilute exhaust bag after the
NEDC. At the end of the testing cycle, TENAX-TA adsorption
columns are used to sample VOCs (Volatile organic compounds) in
the diluted exhaust gas and 2,4-DNPH adsorption columns are used to
sample aldehydes and ketones pollutants. After the thermal
desorption of TENAX-TA absorption columns, GC-MS are used to
obtain benzene, toluene, and xylene emissions. After the solid phase
Chapter 3 Test Matrix and Analysis Methods
45
extraction of 2,4-DNPH adsorption columns, formaldehyde,
acetaldehyde, and acetone emissions can be obtained by HPLC. In
order to avoid the interference of sampling and analysis process in the
test results, the same diluted exhaust gas were sampled twice in the
test. The samplings are independently analyzed in the China
Automotive Technology & Research Center and the Beijing Physical
and Chemical Analysis Center. The measurement results are marked
as the chemical analysis results (bag sampling 1) and chemical
analysis results (bag sampling 2).
3.4 Israel
The study of Israel was focused on comparative research on the
emissions from vehicles equipped with SI engines that comply with
different emission standards (Euro 6, Euro 5, and Euro 3) and feature
different combustion technologies (direct injection and port fuel
injection), using various fuels (RON 95, M15, and E10). The tests
were performed using a conventional state-of-the-art emissions test
facility equipped with a chassis dynamometer and the measuring
equipment needed for emissions testing according to the European
emissions legislation. Two different driving cycles were used: NEDC
and US06. During the campaign, four vehicles were tested.
3.4.1 Experimental set-up
The measurements were carried out in the Vehicle Emissions
Laboratory (VELA) of the Joint Research Centre in Ispra (Italy). The
emissions test facility used for the experimental campaign is in full
compliance with the emissions requirements set by the legislative
Chapter 3 Test Matrix and Analysis Methods
46
procedure for vehicle type approval. The facility consists of a
climatic chamber, a roller bench, and the equipment for emissions
measurement. All tests were carried out at a temperature of 22°C ±
1°C. In order to follow driving cycles as defined in the legislation,
the driver was assisted by a driver aid system. Regulated pollutant
emissions were measured according to the legislative Type I test
procedure (UNECE Regulation 83) using a constant volume system
(CVS) based on a full flow dilution tunnel with a critical flow
Venturi.
Emissions were measured using the following
analyzers/methodologies:
Carbonyls were sampled using SiO2–C18 cartridges (Waters
Sep-Pak Classic) coated with 2,4 dinitrophenylhydrazine
(DNPH) under stable temperature and humidity conditions
after passing through the dilution tunnel and analyzed by
high-performance liquid chromatography (HPLC-Agilent 110
Series) with UV detection. The carbonyls were trapped by
reaction with DNPH inside the cartridges to form the
corresponding 2,4-dinitrophenylhydrazone derivatives. A
commercial hydrazone standard mixing solution (SUPELCO
CARBCarbonyl DNPH Mix 1) was used. The standard
contained the addressed aldehydes in the corresponding
DNPH hydrazone derivative compound (formaldehyde and
acetaldehyde) as well as other derivatives of interest in this
group, namely: acetone, acrolein, propionaldehyde,
butyraldehyde, and benzaldehyde. Seven-point calibration
Chapter 3 Test Matrix and Analysis Methods
47
curves were constructed between 0 and 2 mg L−1, using a
correlation coefficient better than 0.99 as acceptable criteria.
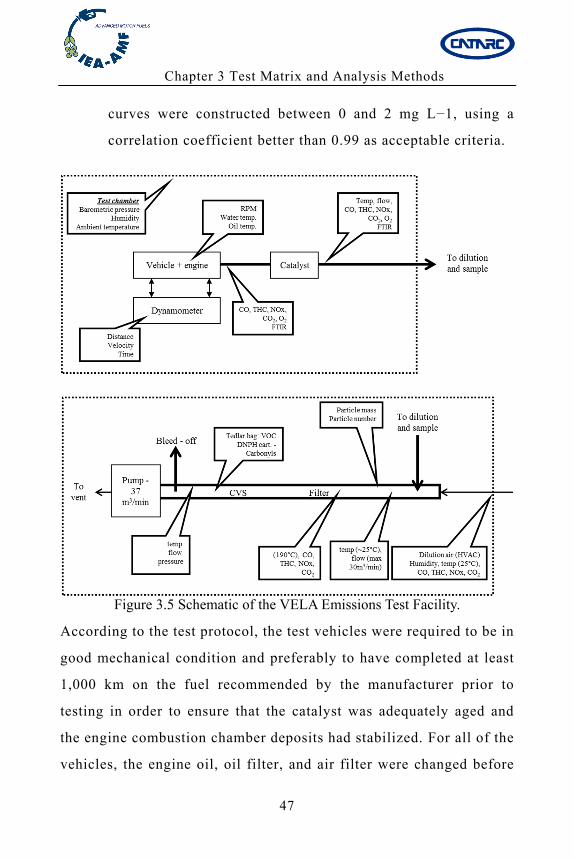
Figure 3.5 Schematic of the VELA Emissions Test Facility.
According to the test protocol, the test vehicles were required to be in
good mechanical condition and preferably to have completed at least
1,000 km on the fuel recommended by the manufacturer prior to
testing in order to ensure that the catalyst was adequately aged and
the engine combustion chamber deposits had stabilized. For all of the
vehicles, the engine oil, oil filter, and air filter were changed before
Chapter 3 Test Matrix and Analysis Methods
48
starting the test program. After the oil change, the oil was aged by the
vehicle being driven a minimum of 500 km on the dynamometer. The
fuel used for oil aging was Fuel 1 from the test fuel matrix (RON95).
The engine oil complied with the grade recommended by the vehicle
manufacturer.
In addition, the following operations were performed on each vehicle:
The exhaust system of the vehicle was checked for leaks.
The engine was checked for leaks of the gasoline/lubricant
circuit.
When necessary, additional fittings, adapters, or devices were
fitted to the fuel system in order to allow complete drainage of
the fuel tank, which was, in general, accomplished by means
of the vehicle fuel pump.
When possible, the engine was equipped with suitable
thermocouples to monitor the lubricant and coolant
temperature.
3.4.2 Tested fuels
Three fuels were tested:
RON95 – regular gasoline.
M15 – 85% gasoline and 15% methanol.
E10 – 90% gasoline and 10% ethanol.
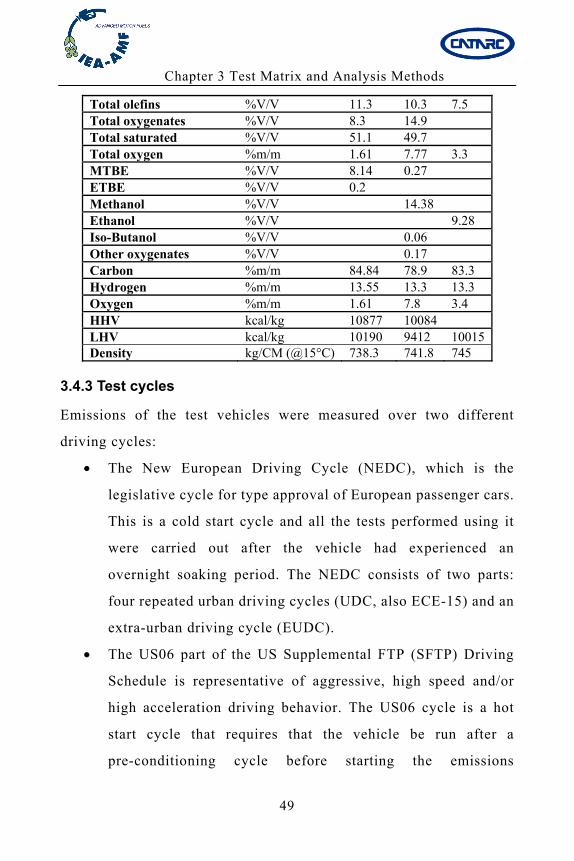
The properties of the different fuels are detailed at table 3.12. Table 3.12 Properties of the tested fuels
Ron 95 M15 E10 Research octane number 96.6 96.7 95.4 Motor octane number 86.5 85 85.7 Benzene %V/V 0.37 0.34 Total aromatics %V/V 29.3 25.1 25.6
Chapter 3 Test Matrix and Analysis Methods
49
Total olefins %V/V 11.3 10.3 7.5 Total oxygenates %V/V 8.3 14.9 Total saturated %V/V 51.1 49.7 Total oxygen %m/m 1.61 7.77 3.3 MTBE %V/V 8.14 0.27 ETBE %V/V 0.2 Methanol %V/V 14.38 Ethanol %V/V 9.28 Iso-Butanol %V/V 0.06 Other oxygenates %V/V 0.17 Carbon %m/m 84.84 78.9 83.3 Hydrogen %m/m 13.55 13.3 13.3 Oxygen %m/m 1.61 7.8 3.4 HHV kcal/kg 10877 10084 LHV kcal/kg 10190 9412 10015 Density kg/CM (@15°C) 738.3 741.8 745
3.4.3 Test cycles
Emissions of the test vehicles were measured over two different
driving cycles:
The New European Driving Cycle (NEDC), which is the
legislative cycle for type approval of European passenger cars.
This is a cold start cycle and all the tests performed using it
were carried out after the vehicle had experienced an
overnight soaking period. The NEDC consists of two parts:
four repeated urban driving cycles (UDC, also ECE-15) and an
extra-urban driving cycle (EUDC).
The US06 part of the US Supplemental FTP (SFTP) Driving
Schedule is representative of aggressive, high speed and/or
high acceleration driving behavior. The US06 cycle is a hot
start cycle that requires that the vehicle be run after a
pre-conditioning cycle before starting the emissions
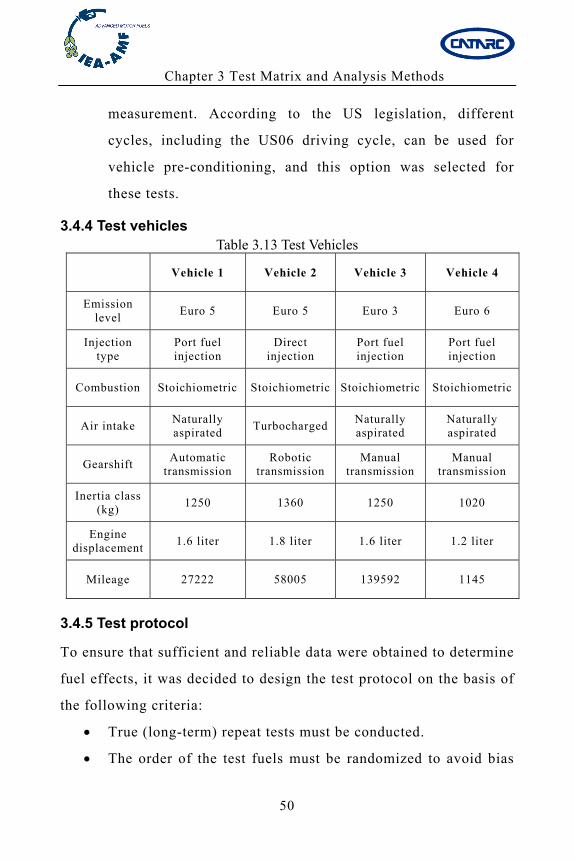
Chapter 3 Test Matrix and Analysis Methods
50
measurement. According to the US legislation, different
cycles, including the US06 driving cycle, can be used for
vehicle pre-conditioning, and this option was selected for
these tests.
3.4.4 Test vehicles Table 3.13 Test Vehicles
Vehicle 1 Vehicle 2 Vehicle 3 Vehicle 4
Emission level
Euro 5 Euro 5 Euro 3 Euro 6
Injection type
Port fuel injection
Direct injection
Port fuel injection
Port fuel injection
Combustion Stoichiometric Stoichiometric Stoichiometric Stoichiometric
Air intake Naturally aspirated
Turbocharged Naturally aspirated
Naturally aspirated
Gearshift Automatic
transmission Robotic
transmission Manual
transmission Manual
transmission
Inertia class (kg)
1250 1360 1250 1020
Engine displacement
1.6 liter 1.8 liter 1.6 liter 1.2 liter
Mileage 27222 58005 139592 1145
3.4.5 Test protocol
To ensure that sufficient and reliable data were obtained to determine
fuel effects, it was decided to design the test protocol on the basis of
the following criteria:
True (long-term) repeat tests must be conducted.
The order of the test fuels must be randomized to avoid bias
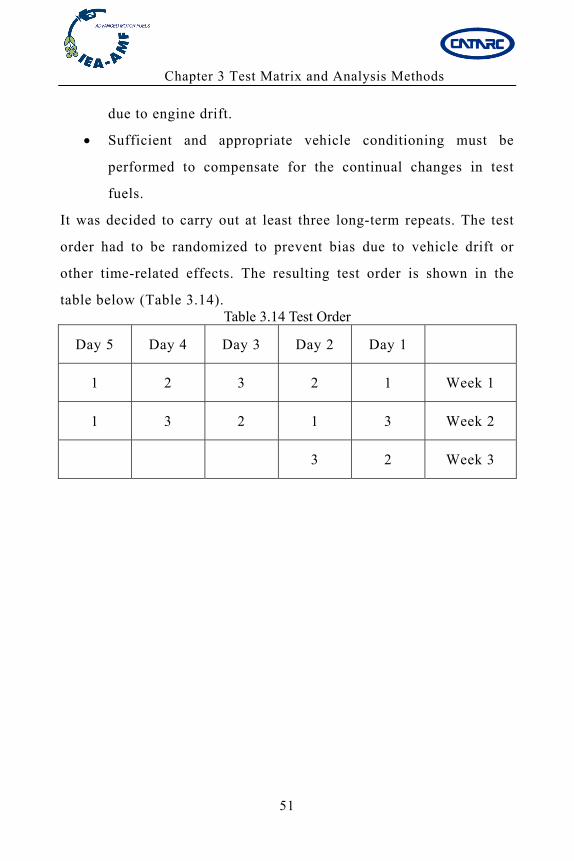
Chapter 3 Test Matrix and Analysis Methods
51
due to engine drift.
Sufficient and appropriate vehicle conditioning must be
performed to compensate for the continual changes in test
fuels.
It was decided to carry out at least three long-term repeats. The test
order had to be randomized to prevent bias due to vehicle drift or
other time-related effects. The resulting test order is shown in the
table below (Table 3.14). Table 3.14 Test Order
Day 1 Day 2 Day 3 Day 4 Day 5
Week 1 1 2 3 2 1
Week 2 3 1 2 3 1
Week 3 2 3
Chapter 4 Comparison Results of Different Analysis Methods
52
Chapter 4 Comparison Results of Different Analysis Methods
In order to verify the accuracy and consistency of the various
measurement methods, instantaneous emissions of CO, CO2, and NOX
pollutants as well as cycle average emissions of CO, CO2, NOX,
formaldehyde, acetaldehyde, benzene, and toluene pollutants are
compared in Chapter 4.
4.1 Instantaneous Regulated Emissions
Comparatively analysis of the measurement results of M30 and E20
fuels, the instantaneous emissions curves of CO, NOX, and CO2
during the entire NEDC are measured by MEXA and FTIR two kinds
of methods, as shown in Figure 4.1(a)~(c) and Figure 4.2(a)~(c).
As shown in Figure 4.1(a)~(b) and Figure 4.2(a)~(b), for either M30
fuel or E20 fuel, the curve shape and numerical size of CO and NOX
instantaneous emissions curves measured by two methods are
basically the same. Even during the first 100s when the variation of
emissions is largest and the last 200s when the change of vehicle
speed and load is largest, CO and NOX emissions results of two
methods could accurately reflect the concentration of vehicle exhaust
emissions varying with vehicle running conditions. The consistency
of the two methods can be verified.
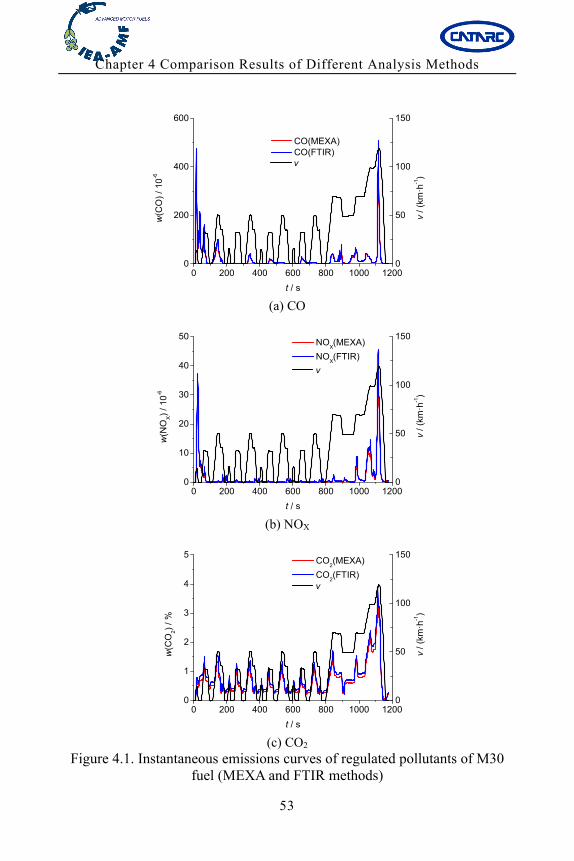
Chapter 4 Comparison Results of Different Analysis Methods
53
0 200 400 600 800 1000 12000
200
400
600
CO(MEXA) CO(FTIR)
w(C
O)
/ 10
-6
t / s
0
50
100
150
v
v /
(km
·h-1)
(a) CO
0 200 400 600 800 1000 12000
10
20
30
40
50 NO
X(MEXA)
NOX(FTIR)
w(N
OX)
/ 10
-6
t / s
0
50
100
150
v
v /
(km
·h-1)
(b) NOX
0 200 400 600 800 1000 12000
1
2
3
4
5 CO
2(MEXA)
CO2(FTIR)
w(C
O2)
/ %
t / s
0
50
100
150
v
v /
(km
·h-1)
(c) CO2
Figure 4.1. Instantaneous emissions curves of regulated pollutants of M30 fuel (MEXA and FTIR methods)
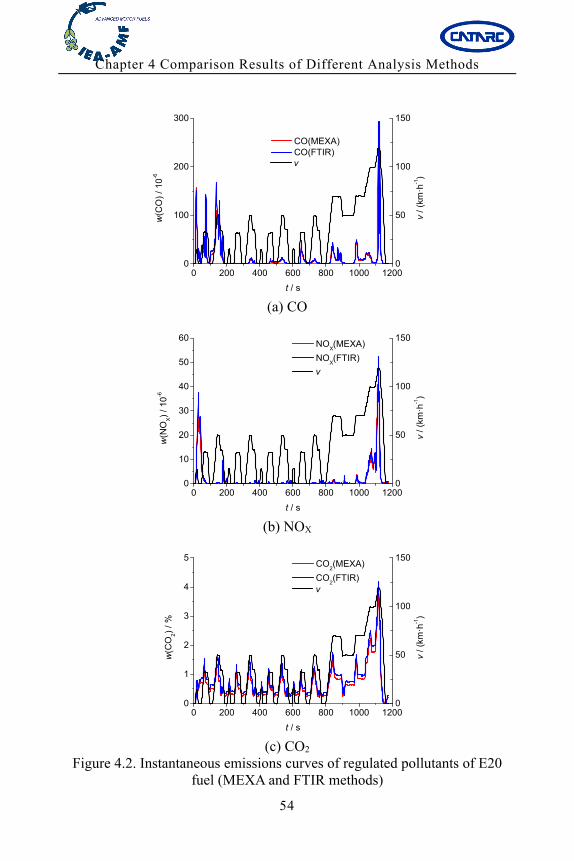
Chapter 4 Comparison Results of Different Analysis Methods
54
0 200 400 600 800 1000 12000
100
200
300
CO(MEXA) CO(FTIR)
w(C
O)
/ 10
-6
t / s
0
50
100
150
v
v /
(km
·h-1)
(a) CO
0 200 400 600 800 1000 12000
10
20
30
40
50
60 NO
X(MEXA)
NOX(FTIR)
w(N
OX)
/ 10-6
t / s
0
50
100
150
v
v / (k
m·h
-1)
(b) NOX
0 200 400 600 800 1000 12000
1
2
3
4
5 CO
2(MEXA)
CO2(FTIR)
w(C
O2)
/ %
t / s
0
50
100
150
v
v / (k
m·h
-1)
(c) CO2
Figure 4.2. Instantaneous emissions curves of regulated pollutants of E20 fuel (MEXA and FTIR methods)
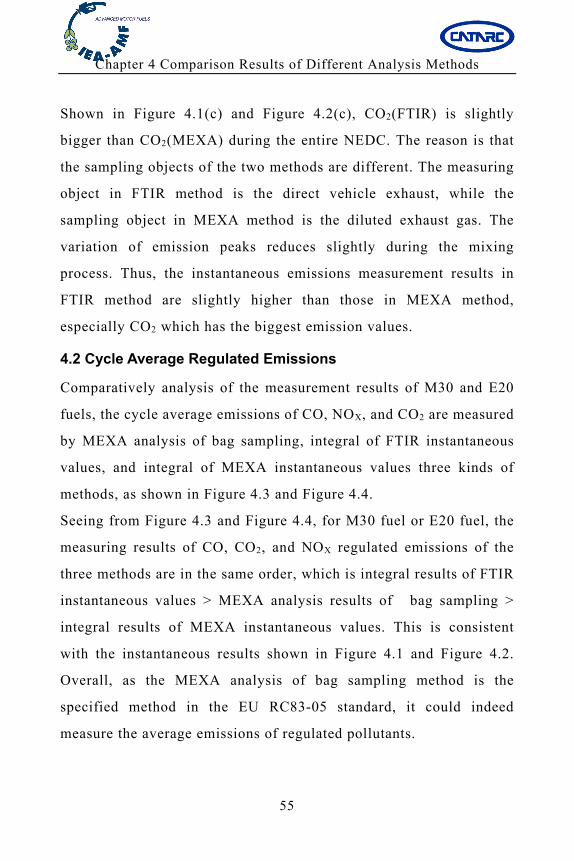
Chapter 4 Comparison Results of Different Analysis Methods
55
Shown in Figure 4.1(c) and Figure 4.2(c), CO2(FTIR) is slightly
bigger than CO2(MEXA) during the entire NEDC. The reason is that
the sampling objects of the two methods are different. The measuring
object in FTIR method is the direct vehicle exhaust, while the
sampling object in MEXA method is the diluted exhaust gas. The
variation of emission peaks reduces slightly during the mixing
process. Thus, the instantaneous emissions measurement results in
FTIR method are slightly higher than those in MEXA method,
especially CO2 which has the biggest emission values.
4.2 Cycle Average Regulated Emissions
Comparatively analysis of the measurement results of M30 and E20
fuels, the cycle average emissions of CO, NOX, and CO2 are measured
by MEXA analysis of bag sampling, integral of FTIR instantaneous
values, and integral of MEXA instantaneous values three kinds of
methods, as shown in Figure 4.3 and Figure 4.4.
Seeing from Figure 4.3 and Figure 4.4, for M30 fuel or E20 fuel, the
measuring results of CO, CO2, and NOX regulated emissions of the
three methods are in the same order, which is integral results of FTIR
instantaneous values > MEXA analysis results of bag sampling >
integral results of MEXA instantaneous values. This is consistent
with the instantaneous results shown in Figure 4.1 and Figure 4.2.
Overall, as the MEXA analysis of bag sampling method is the
specified method in the EU RC83-05 standard, it could indeed
measure the average emissions of regulated pollutants.
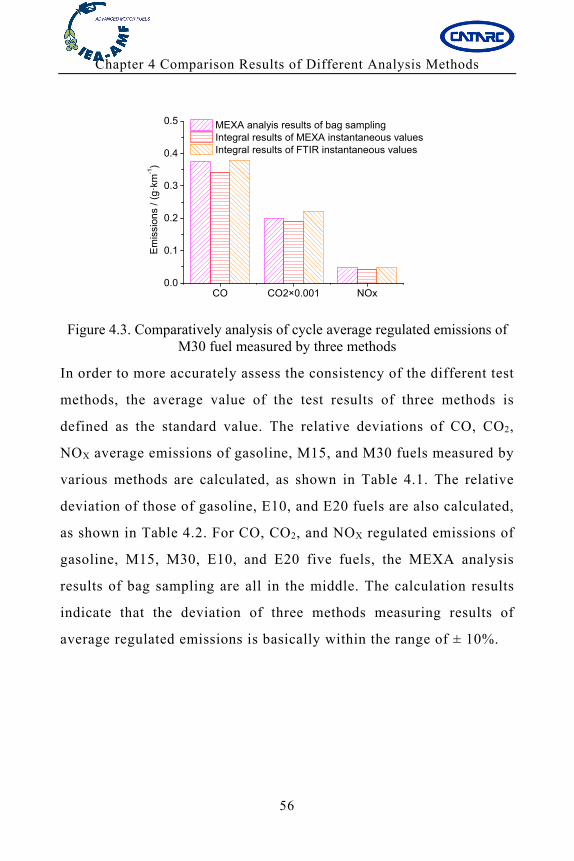
Chapter 4 Comparison Results of Different Analysis Methods
56
CO CO2×0.001 NOx0.0
0.1
0.2
0.3
0.4
0.5
Em
issi
ons
/ (g
·km
-1)
MEXA analyis results of bag sampling Integral results of MEXA instantaneous values Integral results of FTIR instantaneous values
Figure 4.3. Comparatively analysis of cycle average regulated emissions of
M30 fuel measured by three methods
In order to more accurately assess the consistency of the different test
methods, the average value of the test results of three methods is
defined as the standard value. The relative deviations of CO, CO2,
NOX average emissions of gasoline, M15, and M30 fuels measured by
various methods are calculated, as shown in Table 4.1. The relative
deviation of those of gasoline, E10, and E20 fuels are also calculated,
as shown in Table 4.2. For CO, CO2, and NOX regulated emissions of
gasoline, M15, M30, E10, and E20 five fuels, the MEXA analysis
results of bag sampling are all in the middle. The calculation results
indicate that the deviation of three methods measuring results of
average regulated emissions is basically within the range of ± 10%.
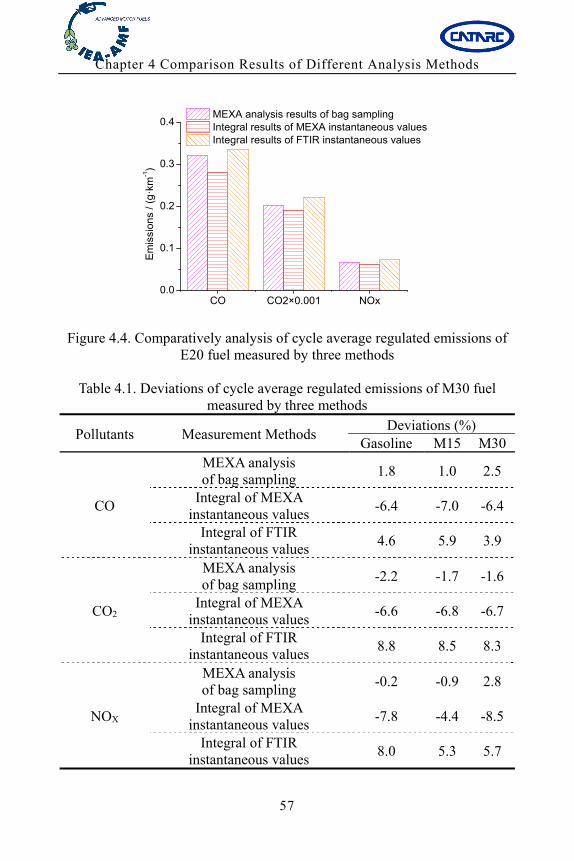
Chapter 4 Comparison Results of Different Analysis Methods
57
CO CO2×0.001 NOx0.0
0.1
0.2
0.3
0.4
Em
issi
on
s /
(g·k
m-1)
MEXA analysis results of bag sampling Integral results of MEXA instantaneous values Integral results of FTIR instantaneous values
Figure 4.4. Comparatively analysis of cycle average regulated emissions of
E20 fuel measured by three methods
Table 4.1. Deviations of cycle average regulated emissions of M30 fuel measured by three methods
Pollutants Measurement Methods Deviations (%)
Gasoline M15 M30
CO
MEXA analysis of bag sampling
1.8 1.0 2.5
Integral of MEXA instantaneous values
-6.4 -7.0 -6.4
Integral of FTIR instantaneous values
4.6 5.9 3.9
CO2
MEXA analysis of bag sampling
-2.2 -1.7 -1.6
Integral of MEXA instantaneous values
-6.6 -6.8 -6.7
Integral of FTIR instantaneous values
8.8 8.5 8.3
NOX
MEXA analysis of bag sampling
-0.2 -0.9 2.8
Integral of MEXA instantaneous values
-7.8 -4.4 -8.5
Integral of FTIR instantaneous values
8.0 5.3 5.7
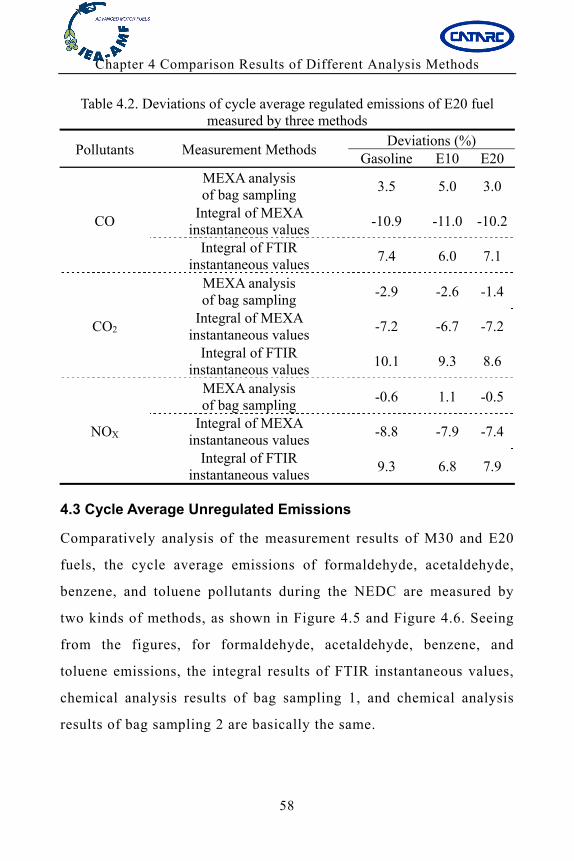
Chapter 4 Comparison Results of Different Analysis Methods
58
Table 4.2. Deviations of cycle average regulated emissions of E20 fuel measured by three methods
Pollutants Measurement Methods Deviations (%)
Gasoline E10 E20
CO
MEXA analysis of bag sampling
3.5 5.0 3.0
Integral of MEXA instantaneous values
-10.9 -11.0 -10.2
Integral of FTIR instantaneous values
7.4 6.0 7.1
CO2
MEXA analysis of bag sampling
-2.9 -2.6 -1.4
Integral of MEXA instantaneous values
-7.2 -6.7 -7.2
Integral of FTIR instantaneous values
10.1 9.3 8.6
NOX
MEXA analysis of bag sampling
-0.6 1.1 -0.5
Integral of MEXA instantaneous values
-8.8 -7.9 -7.4
Integral of FTIR instantaneous values
9.3 6.8 7.9
4.3 Cycle Average Unregulated Emissions
Comparatively analysis of the measurement results of M30 and E20
fuels, the cycle average emissions of formaldehyde, acetaldehyde,
benzene, and toluene pollutants during the NEDC are measured by
two kinds of methods, as shown in Figure 4.5 and Figure 4.6. Seeing
from the figures, for formaldehyde, acetaldehyde, benzene, and
toluene emissions, the integral results of FTIR instantaneous values,
chemical analysis results of bag sampling 1, and chemical analysis
results of bag sampling 2 are basically the same.
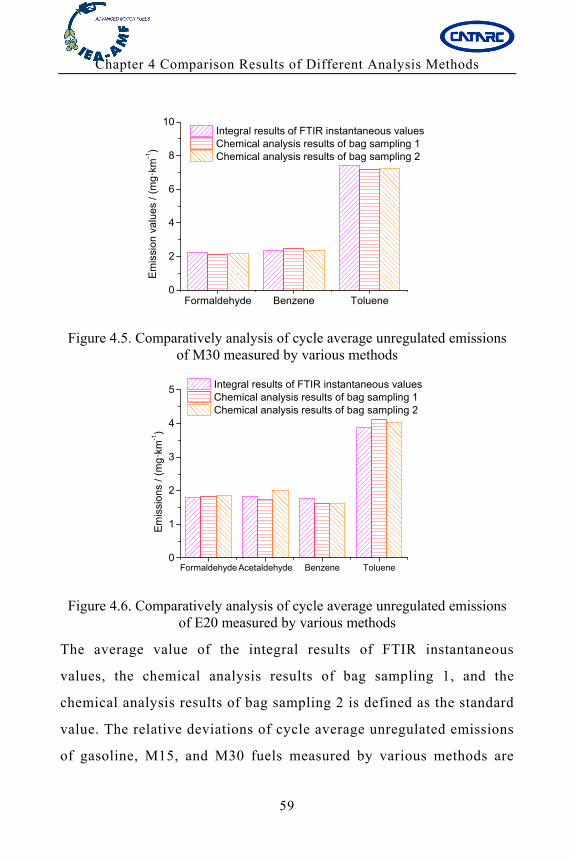
Chapter 4 Comparison Results of Different Analysis Methods
59
Formaldehyde Benzene Toluene0
2
4
6
8
10
Em
issi
on
va
lue
s / (
mg
·km
-1)
Integral results of FTIR instantaneous values Chemical analysis results of bag sampling 1 Chemical analysis results of bag sampling 2
Figure 4.5. Comparatively analysis of cycle average unregulated emissions
of M30 measured by various methods
Formaldehyde Acetaldehyde Benzene Toluene0
1
2
3
4
5
Em
issi
on
s /
(mg
·km
-1)
Integral results of FTIR instantaneous values Chemical analysis results of bag sampling 1 Chemical analysis results of bag sampling 2
Figure 4.6. Comparatively analysis of cycle average unregulated emissions
of E20 measured by various methods
The average value of the integral results of FTIR instantaneous
values, the chemical analysis results of bag sampling 1, and the
chemical analysis results of bag sampling 2 is defined as the standard
value. The relative deviations of cycle average unregulated emissions
of gasoline, M15, and M30 fuels measured by various methods are
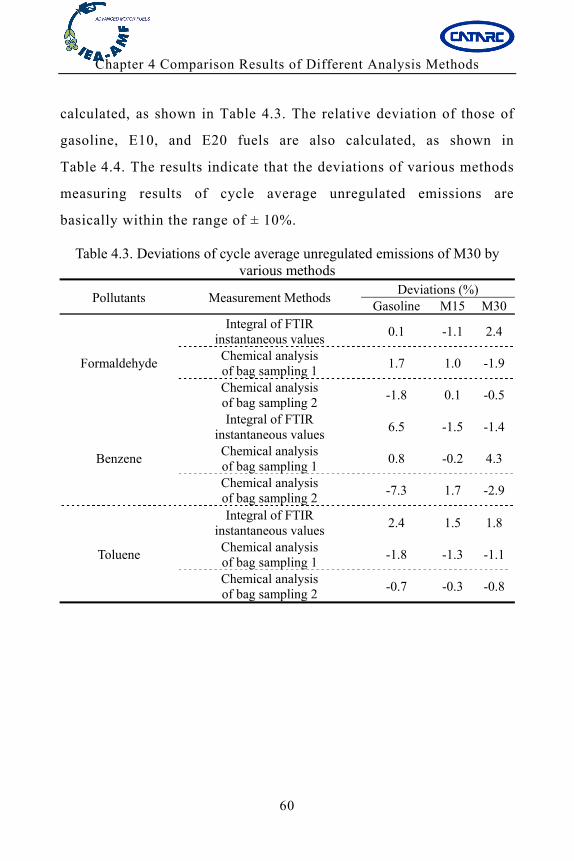
Chapter 4 Comparison Results of Different Analysis Methods
60
calculated, as shown in Table 4.3. The relative deviation of those of
gasoline, E10, and E20 fuels are also calculated, as shown in
Table 4.4. The results indicate that the deviations of various methods
measuring results of cycle average unregulated emissions are
basically within the range of ± 10%.
Table 4.3. Deviations of cycle average unregulated emissions of M30 by various methods
Pollutants Measurement Methods Deviations (%)
Gasoline M15 M30
Formaldehyde
Integral of FTIR instantaneous values
0.1 -1.1 2.4
Chemical analysis of bag sampling 1
1.7 1.0 -1.9
Chemical analysis of bag sampling 2
-1.8 0.1 -0.5
Benzene
Integral of FTIR instantaneous values
6.5 -1.5 -1.4
Chemical analysis of bag sampling 1
0.8 -0.2 4.3
Chemical analysis of bag sampling 2
-7.3 1.7 -2.9
Toluene
Integral of FTIR instantaneous values
2.4 1.5 1.8
Chemical analysis of bag sampling 1
-1.8 -1.3 -1.1
Chemical analysis of bag sampling 2
-0.7 -0.3 -0.8
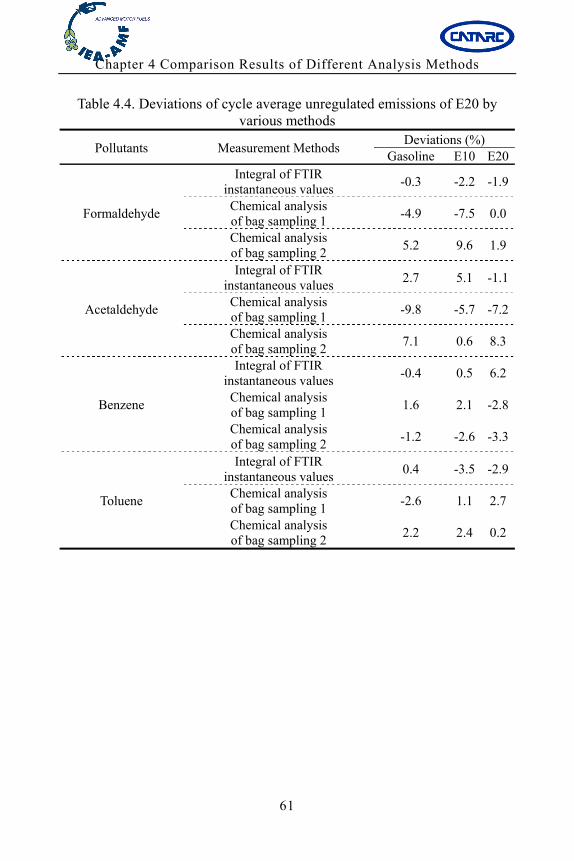
Chapter 4 Comparison Results of Different Analysis Methods
61
Table 4.4. Deviations of cycle average unregulated emissions of E20 by various methods
Pollutants Measurement Methods Deviations (%)
Gasoline E10 E20
Formaldehyde
Integral of FTIR instantaneous values
-0.3 -2.2 -1.9
Chemical analysis of bag sampling 1
-4.9 -7.5 0.0
Chemical analysis of bag sampling 2
5.2 9.6 1.9
Acetaldehyde
Integral of FTIR instantaneous values
2.7 5.1 -1.1
Chemical analysis of bag sampling 1
-9.8 -5.7 -7.2
Chemical analysis of bag sampling 2
7.1 0.6 8.3
Benzene
Integral of FTIR instantaneous values
-0.4 0.5 6.2
Chemical analysis of bag sampling 1
1.6 2.1 -2.8
Chemical analysis of bag sampling 2
-1.2 -2.6 -3.3
Toluene
Integral of FTIR instantaneous values
0.4 -3.5 -2.9
Chemical analysis of bag sampling 1
-2.6 1.1 2.7
Chemical analysis of bag sampling 2
2.2 2.4 0.2
Chapter 5 Emissions Results of Different Alcohol Fuels, Vehicles and Temperatures
62
Chapter 5 Exhaust Emissions Results of Different Alcohol Fuels, Vehicles and Temperatures
This chapter mainly introduces the emissions tests of alcohol fueled
vehicles on the chassis dynamometer at normal and low temperatures
and researches the influences of key factors on the vehicle emissions
performance. It mainly contains the influences of alcohol content in
the fuels on regulated and unregulated pollutants emissions from
light-duty vehicles at normal and low temperatures, the influences of
ambient temperature on vehicle pollutants emissions, and the
influences of engine types on vehicle regulated emissions,
unregulated emission and particulate emissions.
5.1 Canada
5.1.1 Test results of FTP-75 cycle
Figure 5.1~5.7 shows the test results of two vehicles (PFI and GDI)
during the FTP-75 cycle, including regulated emissions, greenhouse
gases, select carbonyl compounds, BTEX and other VOCs, organic
carbon and elemental carbon, particle number emission rate and
particle number size distribution.
Firstly, E10 fuel was compared to E0 (gasoline). In general there
were very few significant changes in the gaseous emissions for either
vehicle due to the use of E10. The largest differences measured due to
the use of E10 were increases in the acetaldehyde and formaldehyde
emissions rates of up to 594% and 124% respectively during cold
temperature testing. The PFI acetaldehyde emission rate increased
more than 100% at 22°C. The increases in carbonyls contributed to an
increase in the NMOG and THC emission rates of 5% and 6%. A 4%
Chapter 5 Emissions Results of Different Alcohol Fuels, Vehicles and Temperatures
63
increase in fuel consumption was observed for the PFI at 22°C. There
was a statistically significant decrease of 3% in the CO2 emission rate
for the PFI at -7°C. This equated to the same decrease in CO2e as CO2
is the most abundant of the three GHGs measured. The only
statistically significant changes observed in the BTEX emission rates
due to the use of the E10 fuel occurred for the GDI at 22°C where
reductions of 38% to 65% were quantified. There also appeared to be
reductions in the PFI BTEX emission rates over the same test
condition but a statistical analysis was not conducted due to a sample
size of only 1. There were significant reductions in the TPM emission
rates for both vehicles due to the use of E10 over various test
conditions. The PFI vehicle had lower TPM of 38% to 40% at 22°C
and -7°C respectively. However there was no measurable difference
at -18°C. The GDI TPM emission rate was reduced by 30% to 48% at
22°C and -18°C respectively. TPM was collected using two sampling
methods and thus the delta TPM emission rates varied between the
two methods. In general decreases in EC follow the same trends as
the TPM. There were also reductions in the percent OC of the TC at
-18°C for both vehicles. Although the above changes were observed
in the TPM emission rates, the only significant change in the particle
number emission rate was for the GDI at -18°C where a reduction of
27% was measured due to the use of the E10 fuel. There appeared to
be a slight shift downwards in the primary peak diameter from 69nm
to around 60nm for the PFI vehicle at 22°C when operated on E10 vs.
E0.
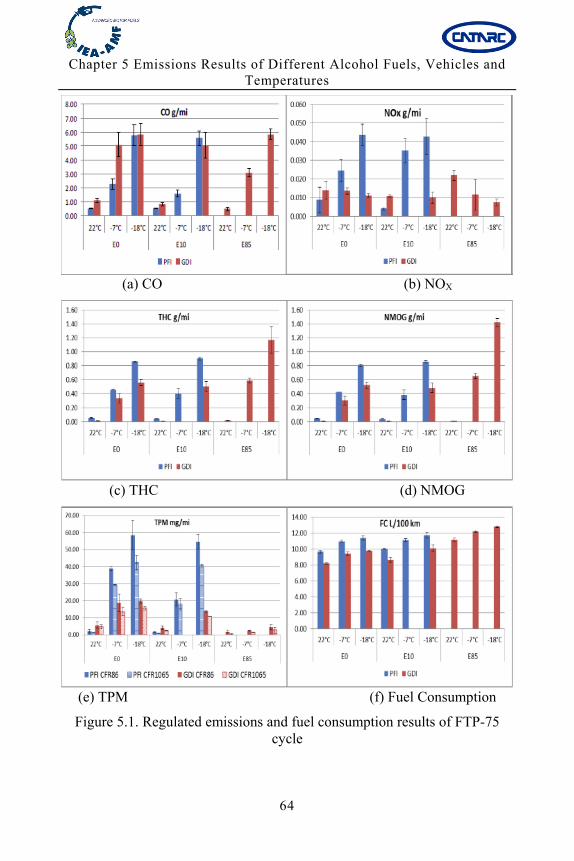
Chapter 5 Emissions Results of Different Alcohol Fuels, Vehicles and Temperatures
64
(a) CO (b) NOX
(c) THC (d) NMOG
(e) TPM (f) Fuel Consumption
Figure 5.1. Regulated emissions and fuel consumption results of FTP-75 cycle
Chapter 5 Emissions Results of Different Alcohol Fuels, Vehicles and Temperatures
65
Secondly, the emissions results of E85 were compared to E0 fuel
(GDI only). There were significant reductions in the CO emission
rates of 56% and 40% at 22°C and -7°C respectively. However there
was no measureable difference at -18°C. E85 appeared to increase the
NOX emission rate at 22°C but decrease it at -18°C. Statistically
significant increases in THC and NMOG due to the use of the E85
fuel mainly during the cold start, were measured across all three test
temperatures. These increases were due in part to the increase in
carbonyl compounds as well as in the measured unburned ethanol
which comprised 22% to almost 70%, from 22°C, to -18°C
respectively, of the calculated NMOG emission rates. As expected,
since the energy density of E85 fuels is lower than that of E0, there
was a fuel consumption penalty of approximately 29% to 36%. The
fuel penalty was higher for the 22°C tests as the E85sum fuel
contained more ethanol by volume and had a lower net heating value.
The use of E85 fuel as opposed to E0 led to reductions of 5% to 8% in
CO2 at 22°C and both cold temperatures. This CO2 reduction
translated into similar reductions in the CO2e emission rate (5-7%)
even though there were increases of 67%, 110%, and 235% in CH4 at
22°C, -7°C and -18°C respectively. The emission rates of
formaldehyde and acetaldehyde were 3 and 9 times higher
respectively when the GDI vehicle was fuelled with E85 compared to
E0 and tested at 22°C. The increases in emissions of these compounds
were more pronounced at cold temperature, for example acetaldehyde
was almost two orders of magnitude higher on E85 than on E0 at
-18°C. BTEX emission rates were approximately 73% to 84% lower
Chapter 5 Emissions Results of Different Alcohol Fuels, Vehicles and Temperatures
66
with use of the E85 fuel compared to E0 at 22°C. Reductions in
BTEX by approximately 50% were also observed at -7°C and, to a
lesser extent at-18°C, due to the use of the E85 fuel; however these
reductions were not statistically significant at -18°C due to sample
variability. Statistically significant reductions in TPM of 70% to 90%
were observed over the three test temperatures due to the use of E85.
Corresponding reductions of approximately 90% were observed in the
EC and TC results indicating that the decrease in TPM was mainly
due to a decrease in elemental carbon for some of the same reasons as
mentioned below. The use of E85 with the GDI engine also decreased
the particle number emission rate by 78% to 90% to the range of the
particle number emission rate from the PFI vehicle on E0. These
reductions were fairly uniform over all three phases of the FTP-75.
There was also a shift to a lower primary peak diameter, from
70-80nm to as low as 34nm at 22°C, due to the use of E85. This
reduction in particle number emissions with the use of mid to higher
level ethanol blends has been reported elsewhere (Mamakos and
Manfredi 2012, Yanowitz and McCormick 2009) and is thought to be
owing in part to the lower sooting tendency of ethanol due to
increased oxidation from higher levels of oxygen and to a reduced
quantity of aromatics present in the blended fuel.
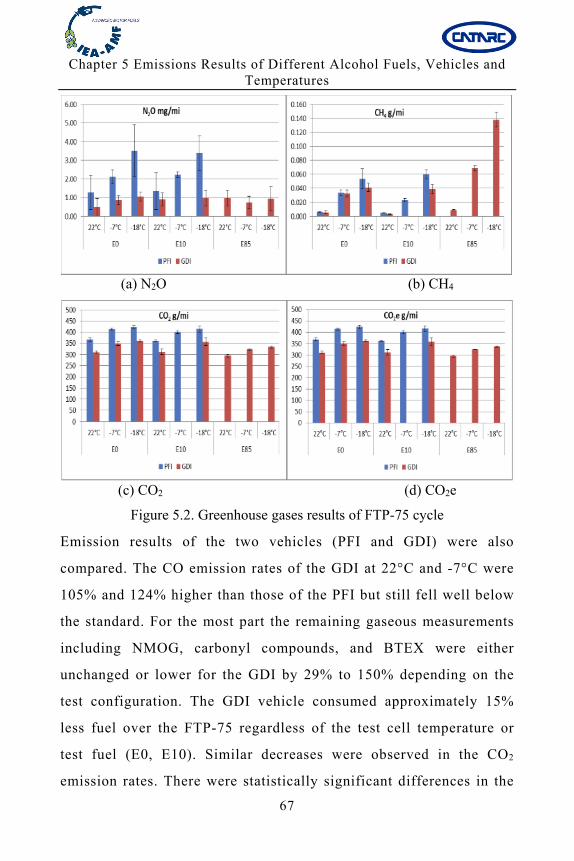
Chapter 5 Emissions Results of Different Alcohol Fuels, Vehicles and Temperatures
67
(a) N2O (b) CH4
(c) CO2 (d) CO2e
Figure 5.2. Greenhouse gases results of FTP-75 cycle
Emission results of the two vehicles (PFI and GDI) were also
compared. The CO emission rates of the GDI at 22°C and -7°C were
105% and 124% higher than those of the PFI but still fell well below
the standard. For the most part the remaining gaseous measurements
including NMOG, carbonyl compounds, and BTEX were either
unchanged or lower for the GDI by 29% to 150% depending on the
test configuration. The GDI vehicle consumed approximately 15%
less fuel over the FTP-75 regardless of the test cell temperature or
test fuel (E0, E10). Similar decreases were observed in the CO2
emission rates. There were statistically significant differences in the
Chapter 5 Emissions Results of Different Alcohol Fuels, Vehicles and Temperatures
68
CH4 and N2O emissions rates when both vehicles were operated on
E10 at -18°C: the GDI emitted 36% to 72% less respectively. The
GDI had 15% lower CO2e emission rates over the test matrix except
at the E10 22°C test condition; these reductions were largely
influenced by similar reductions in CO2. The GDI vehicle had
approximately 200% higher averaged cycle TPM emission rates at
22°C than the PFI, however at both -7°C and -18°C the trend was
reversed and the PFI vehicle emitted more than 2-3 times the amount
of TPM. A similar pattern was seen with the TC emission rate where
both OC and EC were observed to be lower at cold temperature when
comparing the GDI to the PFI. It was also noted that the ratio of OC:
EC increased from 10:90% to 41:59%: for the PFI while operated on
E0 at -18°C. Although the TPM emission rate was lower for the GDI
vehicle at both cold temperature conditions, the particle number
emission rate was higher for the GDI vehicle across all three
temperatures, by 615% to 32%, at 22°C and -18°C respectively, when
the vehicles were fuelled with E0. It should be noted that the particle
number emission rate is measured after the dilute exhaust passes
through a thermodenuder which serves to remove volatile material
and thus the make-up of the particles in the exhaust at the EEPS and
at the TPM filter are not identical. Further discussion of the particle
composition is presented in Chan et al. where it was found that while
the solid particle number emissions of the GDI remained higher than
the PFI, the amount of black carbon emitted by the GDI vehicle was
significantly lower than from the PFI at cold temperature. Reasons
given for this increase were possible differences in how the demands
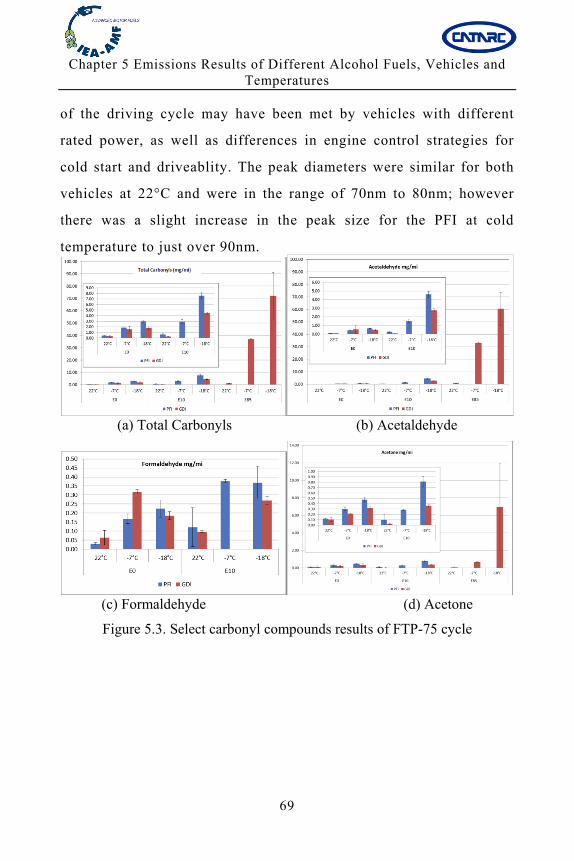
Chapter 5 Emissions Results of Different Alcohol Fuels, Vehicles and Temperatures
69
of the driving cycle may have been met by vehicles with different
rated power, as well as differences in engine control strategies for
cold start and driveablity. The peak diameters were similar for both
vehicles at 22°C and were in the range of 70nm to 80nm; however
there was a slight increase in the peak size for the PFI at cold
temperature to just over 90nm.
(a) Total Carbonyls (b) Acetaldehyde
(c) Formaldehyde (d) Acetone
Figure 5.3. Select carbonyl compounds results of FTP-75 cycle
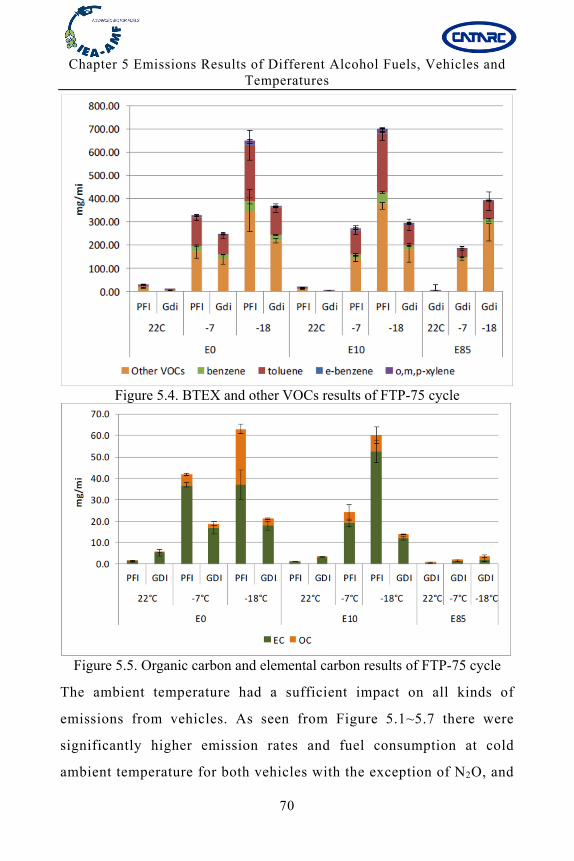
Chapter 5 Emissions Results of Different Alcohol Fuels, Vehicles and Temperatures
70
Figure 5.4. BTEX and other VOCs results of FTP-75 cycle
Figure 5.5. Organic carbon and elemental carbon results of FTP-75 cycle
The ambient temperature had a sufficient impact on all kinds of
emissions from vehicles. As seen from Figure 5.1~5.7 there were
significantly higher emission rates and fuel consumption at cold
ambient temperature for both vehicles with the exception of N2O, and
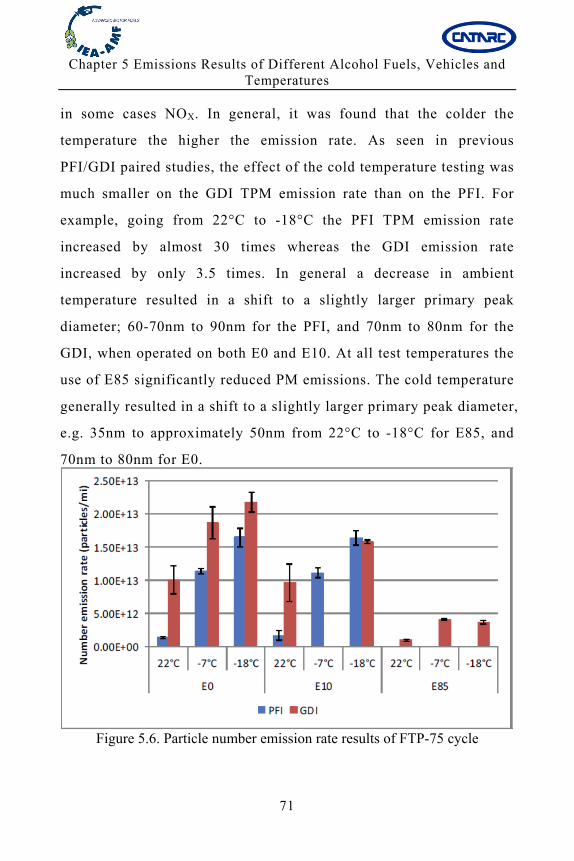
Chapter 5 Emissions Results of Different Alcohol Fuels, Vehicles and Temperatures
71
in some cases NOX. In general, it was found that the colder the
temperature the higher the emission rate. As seen in previous
PFI/GDI paired studies, the effect of the cold temperature testing was
much smaller on the GDI TPM emission rate than on the PFI. For
example, going from 22°C to -18°C the PFI TPM emission rate
increased by almost 30 times whereas the GDI emission rate
increased by only 3.5 times. In general a decrease in ambient
temperature resulted in a shift to a slightly larger primary peak
diameter; 60-70nm to 90nm for the PFI, and 70nm to 80nm for the
GDI, when operated on both E0 and E10. At all test temperatures the
use of E85 significantly reduced PM emissions. The cold temperature
generally resulted in a shift to a slightly larger primary peak diameter,
e.g. 35nm to approximately 50nm from 22°C to -18°C for E85, and
70nm to 80nm for E0.
Figure 5.6. Particle number emission rate results of FTP-75 cycle
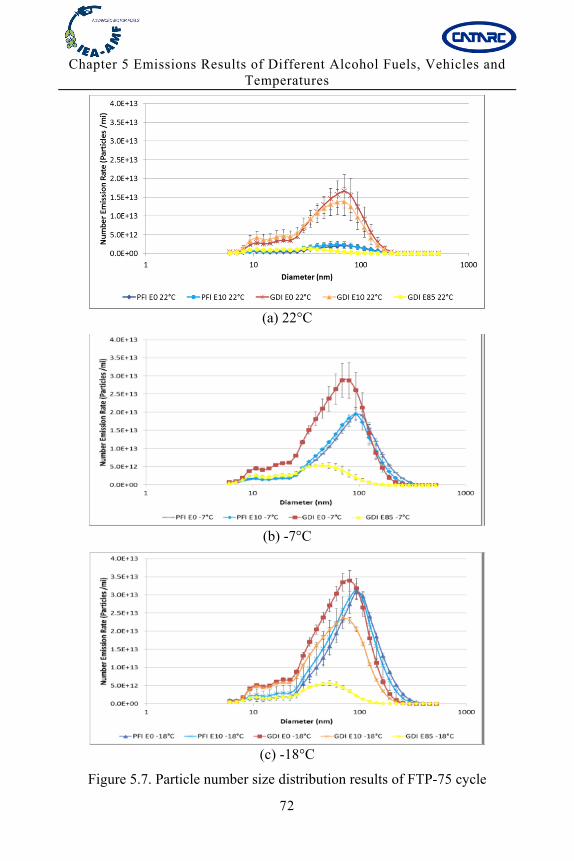
Chapter 5 Emissions Results of Different Alcohol Fuels, Vehicles and Temperatures
72
(a) 22°C
(b) -7°C
(c) -18°C
Figure 5.7. Particle number size distribution results of FTP-75 cycle
Chapter 5 Emissions Results of Different Alcohol Fuels, Vehicles and Temperatures
73
5.1.2 Test results of HWFCT cycle
Figure 5.8 (a) ~ (f) shows the test results of two vehicles (PFI and
GDI) during the HWFCT cycle at normal temperature, including
regulated emissions and fuel consumption.
Firstly, the impact of ethanol content proportion in fuels on HWFCT
emissions was analyzed. Figure 5.8 shows that generally there were
no significant differences due to the use of the E10 fuel. There were
however significant reductions ranging from 77% to 89% in CO, THC,
and TPM (40CFR1065) due to the use of E85. As seen over the
FTP-75 composite there was a 32% increase in fuel consumption, but
an 8% decrease in CO2.
Secondly, the emissions results of PFI and GDI vehicles during the
HWCFT cycle were compared. As seen in Figure 5.8, the GDI vehicle
had higher CO and NOX emissions than the PFI however the higher
emission rates were only statistically significant while the vehicles
were operated on E0. The calculated fuel consumption was
significantly lower for the GDI by 20-22% when compared to the PFI
vehicle. Corresponding decreases in CO2 were also observed. There
were no statistically significant changes in the TPM emission rates
between the two vehicles.
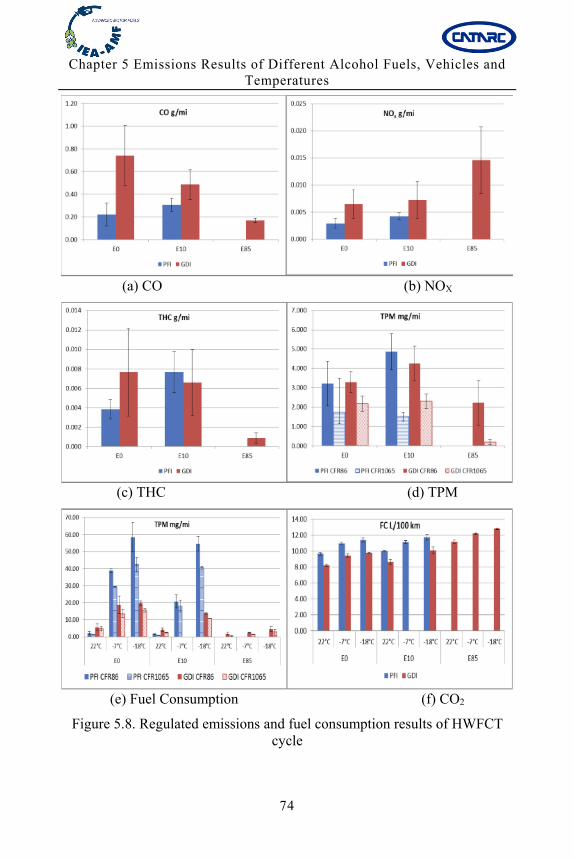
Chapter 5 Emissions Results of Different Alcohol Fuels, Vehicles and Temperatures
74
(a) CO (b) NOX
(c) THC (d) TPM
(e) Fuel Consumption (f) CO2
Figure 5.8. Regulated emissions and fuel consumption results of HWFCT cycle
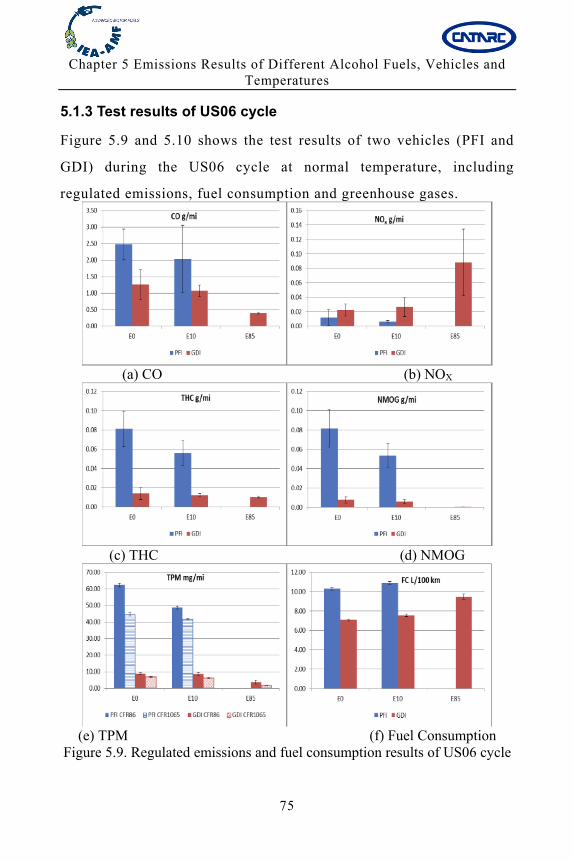
Chapter 5 Emissions Results of Different Alcohol Fuels, Vehicles and Temperatures
75
5.1.3 Test results of US06 cycle
Figure 5.9 and 5.10 shows the test results of two vehicles (PFI and
GDI) during the US06 cycle at normal temperature, including
regulated emissions, fuel consumption and greenhouse gases.
(a) CO (b) NOX
(c) THC (d) NMOG
(e) TPM (f) Fuel Consumption
Figure 5.9. Regulated emissions and fuel consumption results of US06 cycle
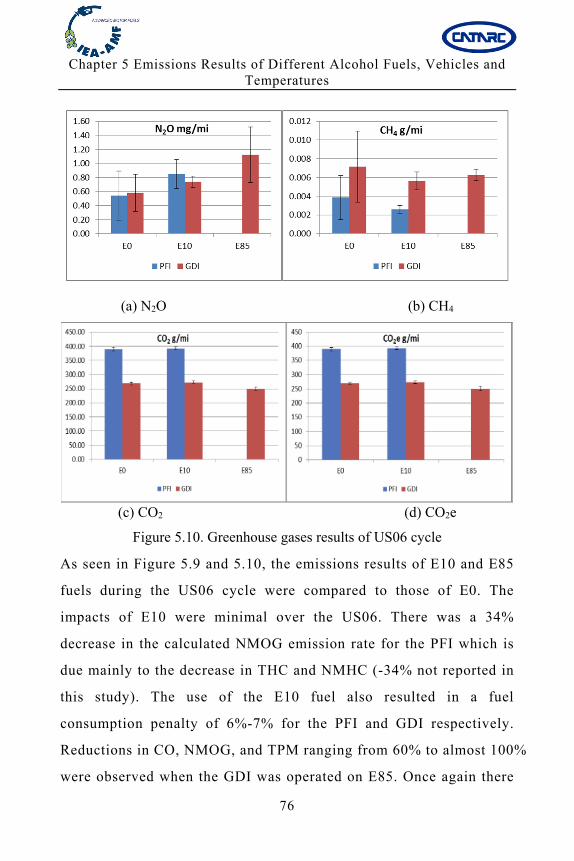
Chapter 5 Emissions Results of Different Alcohol Fuels, Vehicles and Temperatures
76
(a) N2O (b) CH4
(c) CO2 (d) CO2e
Figure 5.10. Greenhouse gases results of US06 cycle
As seen in Figure 5.9 and 5.10, the emissions results of E10 and E85
fuels during the US06 cycle were compared to those of E0. The
impacts of E10 were minimal over the US06. There was a 34%
decrease in the calculated NMOG emission rate for the PFI which is
due mainly to the decrease in THC and NMHC (-34% not reported in
this study). The use of the E10 fuel also resulted in a fuel
consumption penalty of 6%-7% for the PFI and GDI respectively.
Reductions in CO, NMOG, and TPM ranging from 60% to almost 100%
were observed when the GDI was operated on E85. Once again there
Chapter 5 Emissions Results of Different Alcohol Fuels, Vehicles and Temperatures
77
was a fuel consumption penalty as with the other two drive cycles but
a reduction in the CO2 and overall CO2e GHG emission rates of 7%.
Figure 5.9 and 5.10 also shows the comparison of emissions results
between PFI and GDI vehicles during the US06 cycle. Emission rates
of CO, NOX, and NMOG were significantly lower, by 49% to 90%,
for the GDI vehicle as compared to the PFI. There was a fuel
consumption penalty of 31% for the PFI versus the GDI vehicle. The
CO2 emission rates of the GDI were 31% lower than those of the PFI.
This CO2 decrease led to equally low CO2e emissions rates. There
was a statistically significant increase in the CH4 emission rate of
almost 118% for the GDI compared to the PFI while the vehicles were
operated on E10, although there were no differences in N2O, the
remaining measured GHG. Contrary to the observation made over the
FTP-75 at 22°C, the GDI had lower TPM emission rates by 82% to 86%
for E0 and E10 respectively.
5.2 Finland
5.2.1 CO and HC emissions
CO and HC emissions were higher at -7°C than at +23°C in the cold
start NEDC test, particularly for the MPI car (Figure 5.11). Relatively
low CO and HC emissions were seen over the hot start FTP75 test at
both temperatures, though some differences were observed between
cars. CO emission was higher for the MPI car than for the DISI car.
The CO emission was generally lower for E85 than for E10 with cars,
temperatures and test cycles. E100, however, showed similar or
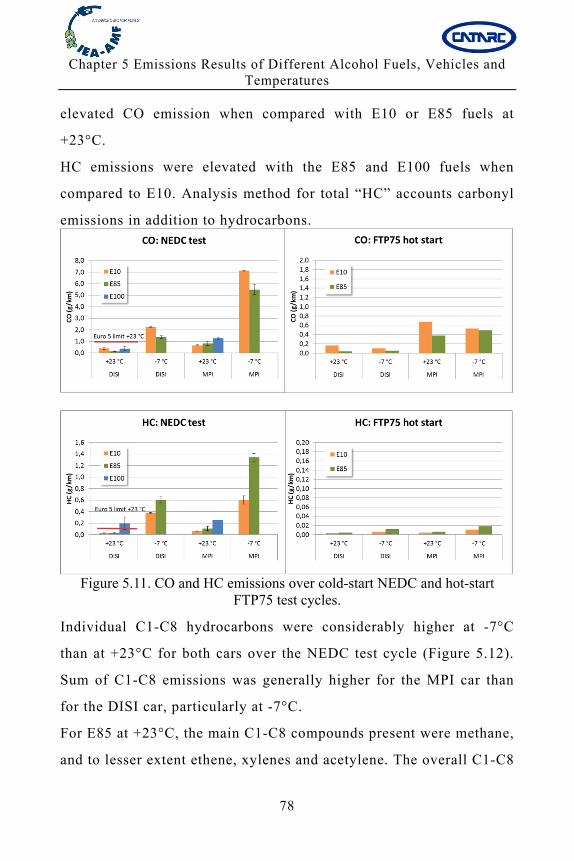
Chapter 5 Emissions Results of Different Alcohol Fuels, Vehicles and Temperatures
78
elevated CO emission when compared with E10 or E85 fuels at
+23°C.
HC emissions were elevated with the E85 and E100 fuels when
compared to E10. Analysis method for total “HC” accounts carbonyl
emissions in addition to hydrocarbons.
Figure 5.11. CO and HC emissions over cold-start NEDC and hot-start
FTP75 test cycles.
Individual C1-C8 hydrocarbons were considerably higher at -7°C
than at +23°C for both cars over the NEDC test cycle (Figure 5.12).
Sum of C1-C8 emissions was generally higher for the MPI car than
for the DISI car, particularly at -7°C.
For E85 at +23°C, the main C1-C8 compounds present were methane,
and to lesser extent ethene, xylenes and acetylene. The overall C1-C8
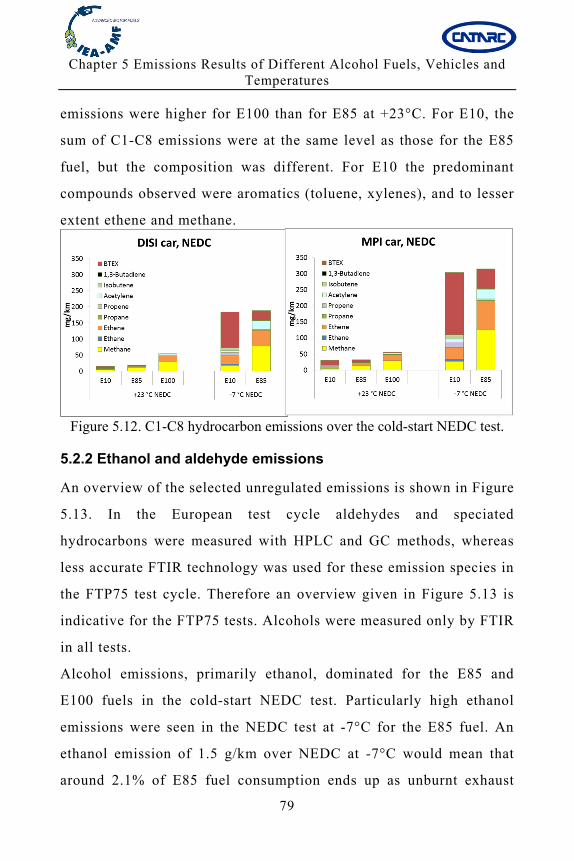
Chapter 5 Emissions Results of Different Alcohol Fuels, Vehicles and Temperatures
79
emissions were higher for E100 than for E85 at +23°C. For E10, the
sum of C1-C8 emissions were at the same level as those for the E85
fuel, but the composition was different. For E10 the predominant
compounds observed were aromatics (toluene, xylenes), and to lesser
extent ethene and methane.
Figure 5.12. C1-C8 hydrocarbon emissions over the cold-start NEDC test.
5.2.2 Ethanol and aldehyde emissions
An overview of the selected unregulated emissions is shown in Figure
5.13. In the European test cycle aldehydes and speciated
hydrocarbons were measured with HPLC and GC methods, whereas
less accurate FTIR technology was used for these emission species in
the FTP75 test cycle. Therefore an overview given in Figure 5.13 is
indicative for the FTP75 tests. Alcohols were measured only by FTIR
in all tests.
Alcohol emissions, primarily ethanol, dominated for the E85 and
E100 fuels in the cold-start NEDC test. Particularly high ethanol
emissions were seen in the NEDC test at -7°C for the E85 fuel. An
ethanol emission of 1.5 g/km over NEDC at -7°C would mean that
around 2.1% of E85 fuel consumption ends up as unburnt exhaust
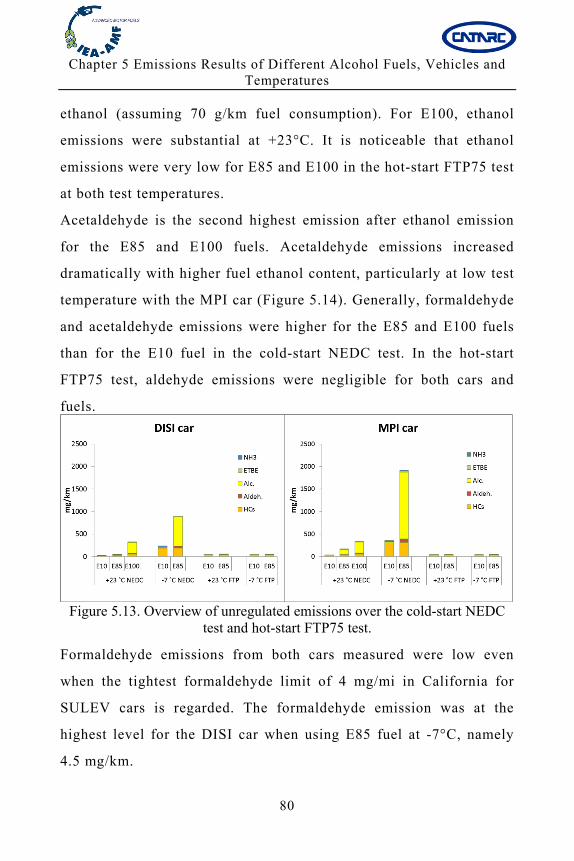
Chapter 5 Emissions Results of Different Alcohol Fuels, Vehicles and Temperatures
80
ethanol (assuming 70 g/km fuel consumption). For E100, ethanol
emissions were substantial at +23°C. It is noticeable that ethanol
emissions were very low for E85 and E100 in the hot-start FTP75 test
at both test temperatures.
Acetaldehyde is the second highest emission after ethanol emission
for the E85 and E100 fuels. Acetaldehyde emissions increased
dramatically with higher fuel ethanol content, particularly at low test
temperature with the MPI car (Figure 5.14). Generally, formaldehyde
and acetaldehyde emissions were higher for the E85 and E100 fuels
than for the E10 fuel in the cold-start NEDC test. In the hot-start
FTP75 test, aldehyde emissions were negligible for both cars and
fuels.
Figure 5.13. Overview of unregulated emissions over the cold-start NEDC
test and hot-start FTP75 test.
Formaldehyde emissions from both cars measured were low even
when the tightest formaldehyde limit of 4 mg/mi in California for
SULEV cars is regarded. The formaldehyde emission was at the
highest level for the DISI car when using E85 fuel at -7°C, namely
4.5 mg/km.
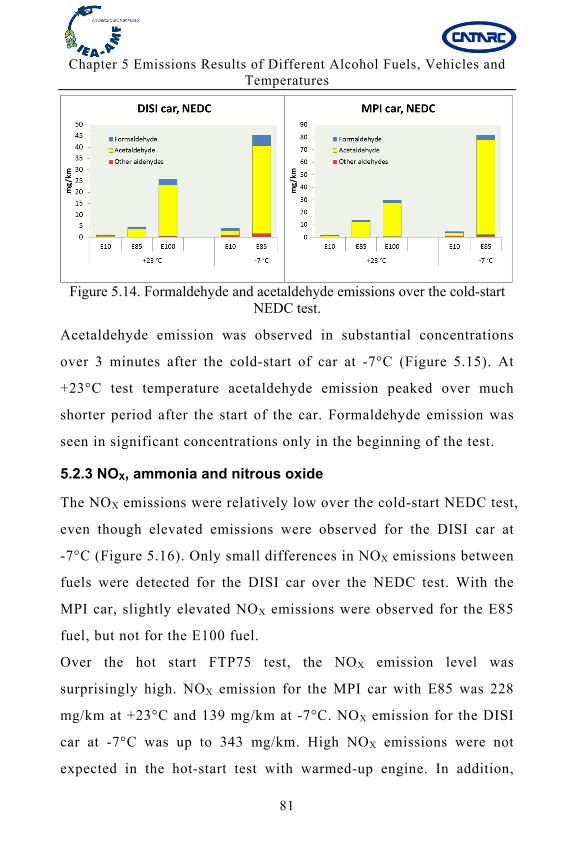
Chapter 5 Emissions Results of Different Alcohol Fuels, Vehicles and Temperatures
81
Figure 5.14. Formaldehyde and acetaldehyde emissions over the cold-start
NEDC test.
Acetaldehyde emission was observed in substantial concentrations
over 3 minutes after the cold-start of car at -7°C (Figure 5.15). At
+23°C test temperature acetaldehyde emission peaked over much
shorter period after the start of the car. Formaldehyde emission was
seen in significant concentrations only in the beginning of the test.
5.2.3 NOX, ammonia and nitrous oxide
The NOX emissions were relatively low over the cold-start NEDC test,
even though elevated emissions were observed for the DISI car at
-7°C (Figure 5.16). Only small differences in NOX emissions between
fuels were detected for the DISI car over the NEDC test. With the
MPI car, slightly elevated NOX emissions were observed for the E85
fuel, but not for the E100 fuel.
Over the hot start FTP75 test, the NOX emission level was
surprisingly high. NOX emission for the MPI car with E85 was 228
mg/km at +23°C and 139 mg/km at -7°C. NOX emission for the DISI
car at -7°C was up to 343 mg/km. High NOX emissions were not
expected in the hot-start test with warmed-up engine. In addition,
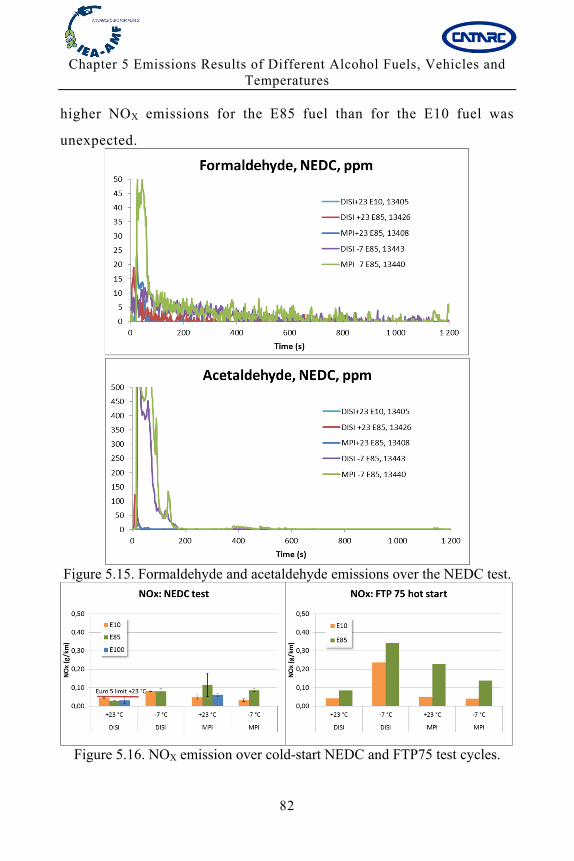
Chapter 5 Emissions Results of Different Alcohol Fuels, Vehicles and Temperatures
82
higher NOX emissions for the E85 fuel than for the E10 fuel was
unexpected.
Figure 5.15. Formaldehyde and acetaldehyde emissions over the NEDC test.
Figure 5.16. NOX emission over cold-start NEDC and FTP75 test cycles.
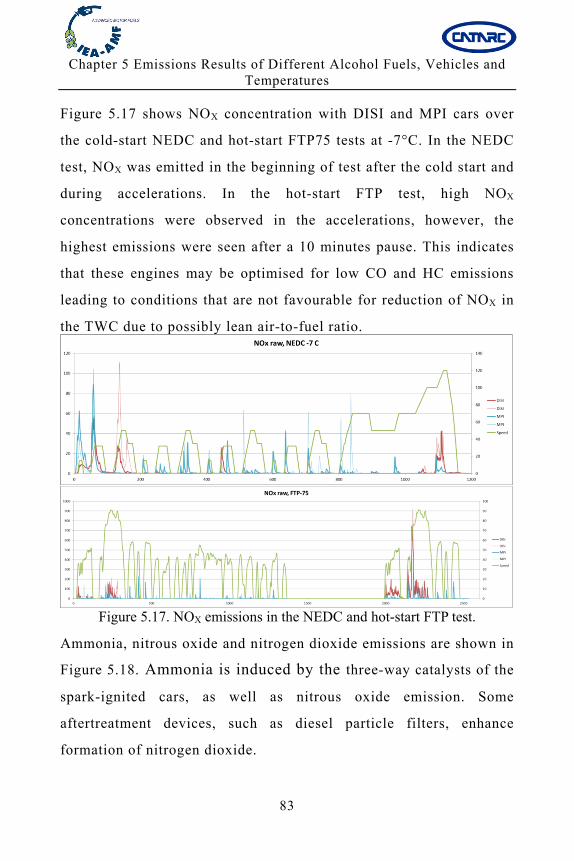
Chapter 5 Emissions Results of Different Alcohol Fuels, Vehicles and Temperatures
83
Figure 5.17 shows NOX concentration with DISI and MPI cars over
the cold-start NEDC and hot-start FTP75 tests at -7°C. In the NEDC
test, NOX was emitted in the beginning of test after the cold start and
during accelerations. In the hot-start FTP test, high NOX
concentrations were observed in the accelerations, however, the
highest emissions were seen after a 10 minutes pause. This indicates
that these engines may be optimised for low CO and HC emissions
leading to conditions that are not favourable for reduction of NOX in
the TWC due to possibly lean air-to-fuel ratio.
Figure 5.17. NOX emissions in the NEDC and hot-start FTP test.
Ammonia, nitrous oxide and nitrogen dioxide emissions are shown in
Figure 5.18. Ammonia is induced by the three-way catalysts of the
spark-ignited cars, as well as nitrous oxide emission. Some
aftertreatment devices, such as diesel particle filters, enhance
formation of nitrogen dioxide.
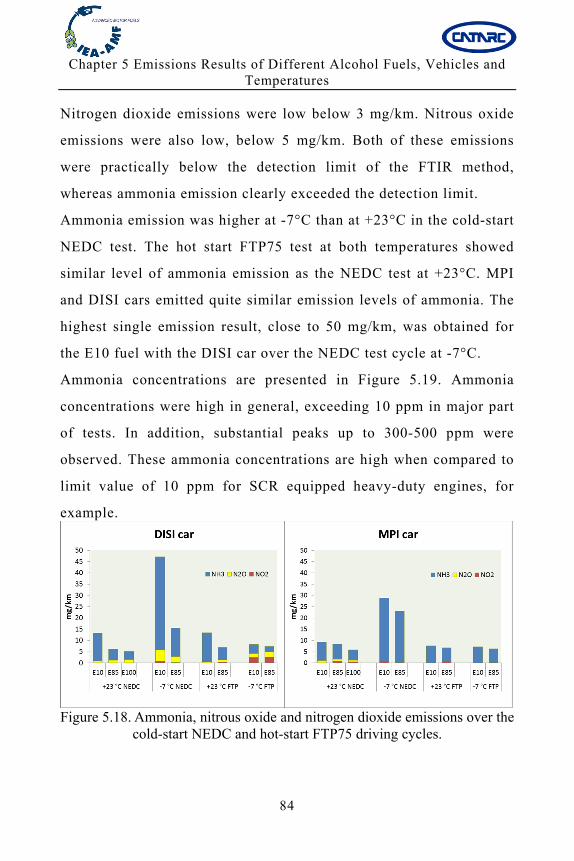
Chapter 5 Emissions Results of Different Alcohol Fuels, Vehicles and Temperatures
84
Nitrogen dioxide emissions were low below 3 mg/km. Nitrous oxide
emissions were also low, below 5 mg/km. Both of these emissions
were practically below the detection limit of the FTIR method,
whereas ammonia emission clearly exceeded the detection limit.
Ammonia emission was higher at -7°C than at +23°C in the cold-start
NEDC test. The hot start FTP75 test at both temperatures showed
similar level of ammonia emission as the NEDC test at +23°C. MPI
and DISI cars emitted quite similar emission levels of ammonia. The
highest single emission result, close to 50 mg/km, was obtained for
the E10 fuel with the DISI car over the NEDC test cycle at -7°C.
Ammonia concentrations are presented in Figure 5.19. Ammonia
concentrations were high in general, exceeding 10 ppm in major part
of tests. In addition, substantial peaks up to 300-500 ppm were
observed. These ammonia concentrations are high when compared to
limit value of 10 ppm for SCR equipped heavy-duty engines, for
example.
Figure 5.18. Ammonia, nitrous oxide and nitrogen dioxide emissions over the
cold-start NEDC and hot-start FTP75 driving cycles.
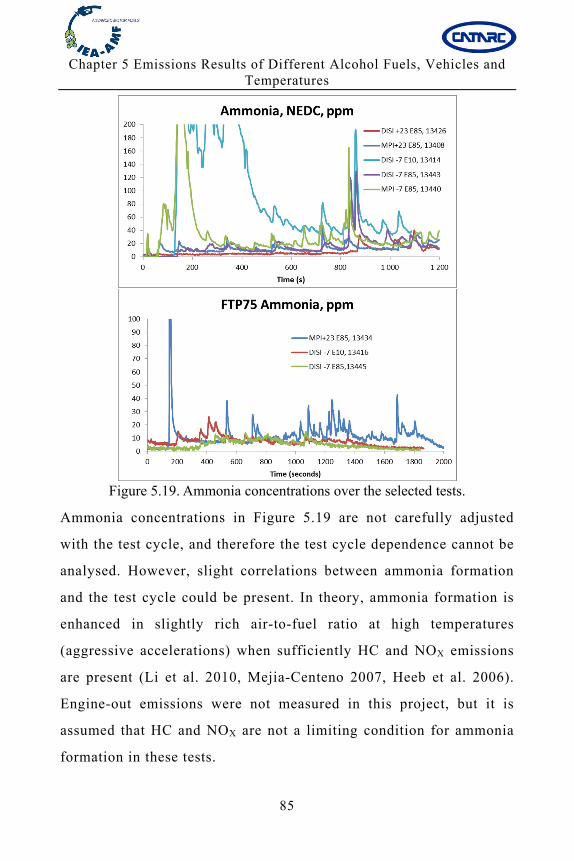
Chapter 5 Emissions Results of Different Alcohol Fuels, Vehicles and Temperatures
85
Figure 5.19. Ammonia concentrations over the selected tests.
Ammonia concentrations in Figure 5.19 are not carefully adjusted
with the test cycle, and therefore the test cycle dependence cannot be
analysed. However, slight correlations between ammonia formation
and the test cycle could be present. In theory, ammonia formation is
enhanced in slightly rich air-to-fuel ratio at high temperatures
(aggressive accelerations) when sufficiently HC and NOX emissions
are present (Li et al. 2010, Mejia-Centeno 2007, Heeb et al. 2006).
Engine-out emissions were not measured in this project, but it is
assumed that HC and NOX are not a limiting condition for ammonia
formation in these tests.
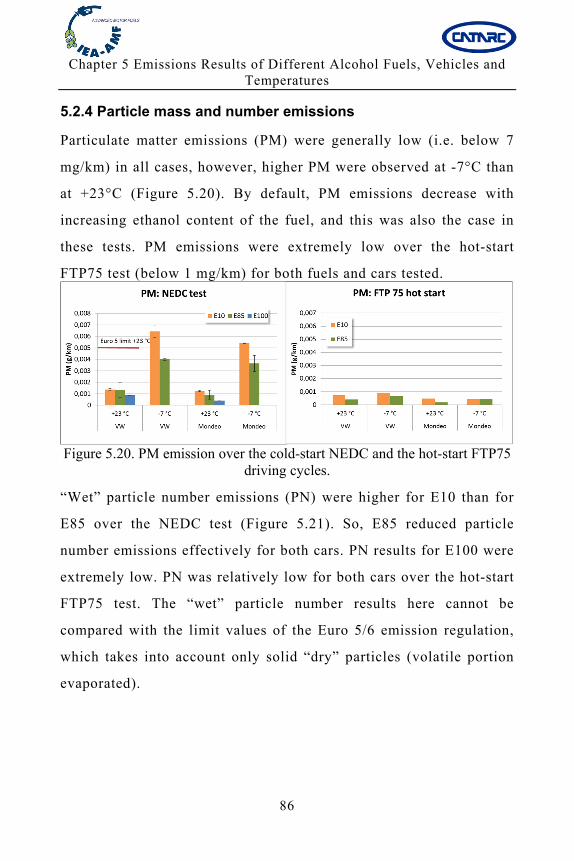
Chapter 5 Emissions Results of Different Alcohol Fuels, Vehicles and Temperatures
86
5.2.4 Particle mass and number emissions
Particulate matter emissions (PM) were generally low (i.e. below 7
mg/km) in all cases, however, higher PM were observed at -7°C than
at +23°C (Figure 5.20). By default, PM emissions decrease with
increasing ethanol content of the fuel, and this was also the case in
these tests. PM emissions were extremely low over the hot-start
FTP75 test (below 1 mg/km) for both fuels and cars tested.
Figure 5.20. PM emission over the cold-start NEDC and the hot-start FTP75
driving cycles.
“Wet” particle number emissions (PN) were higher for E10 than for
E85 over the NEDC test (Figure 5.21). So, E85 reduced particle
number emissions effectively for both cars. PN results for E100 were
extremely low. PN was relatively low for both cars over the hot-start
FTP75 test. The “wet” particle number results here cannot be
compared with the limit values of the Euro 5/6 emission regulation,
which takes into account only solid “dry” particles (volatile portion
evaporated).
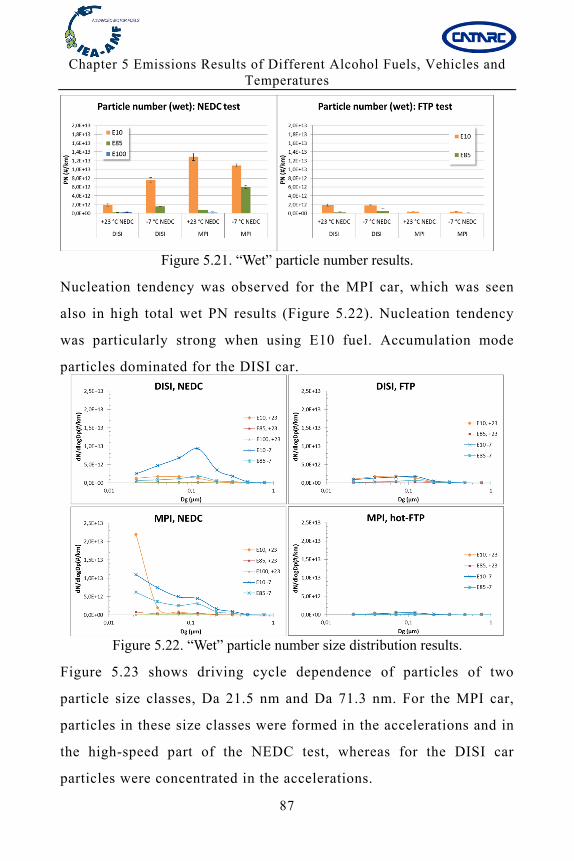
Chapter 5 Emissions Results of Different Alcohol Fuels, Vehicles and Temperatures
87
Figure 5.21. “Wet” particle number results.
Nucleation tendency was observed for the MPI car, which was seen
also in high total wet PN results (Figure 5.22). Nucleation tendency
was particularly strong when using E10 fuel. Accumulation mode
particles dominated for the DISI car.
Figure 5.22. “Wet” particle number size distribution results.
Figure 5.23 shows driving cycle dependence of particles of two
particle size classes, Da 21.5 nm and Da 71.3 nm. For the MPI car,
particles in these size classes were formed in the accelerations and in
the high-speed part of the NEDC test, whereas for the DISI car
particles were concentrated in the accelerations.
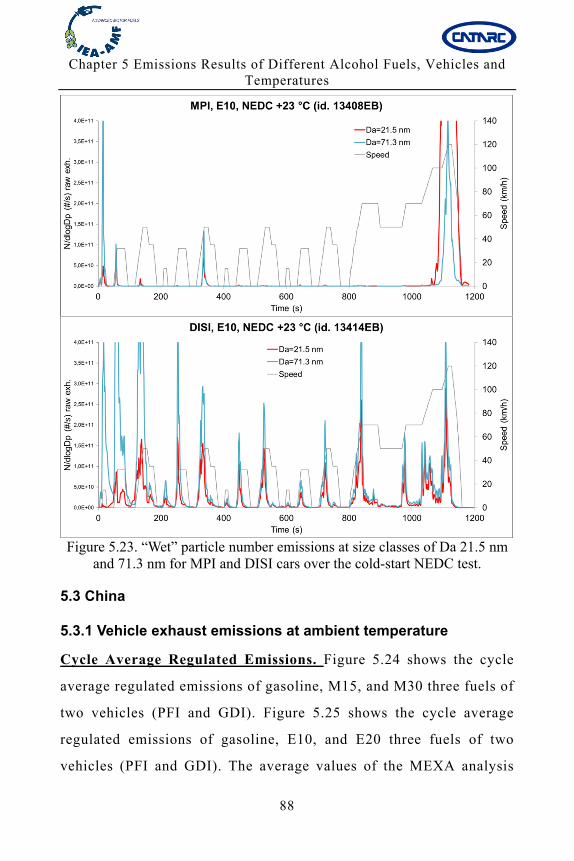
Chapter 5 Emissions Results of Different Alcohol Fuels, Vehicles and Temperatures
88
Figure 5.23. “Wet” particle number emissions at size classes of Da 21.5 nm
and 71.3 nm for MPI and DISI cars over the cold-start NEDC test.
5.3 China
5.3.1 Vehicle exhaust emissions at ambient temperature
Cycle Average Regulated Emissions. Figure 5.24 shows the cycle
average regulated emissions of gasoline, M15, and M30 three fuels of
two vehicles (PFI and GDI). Figure 5.25 shows the cycle average
regulated emissions of gasoline, E10, and E20 three fuels of two
vehicles (PFI and GDI). The average values of the MEXA analysis
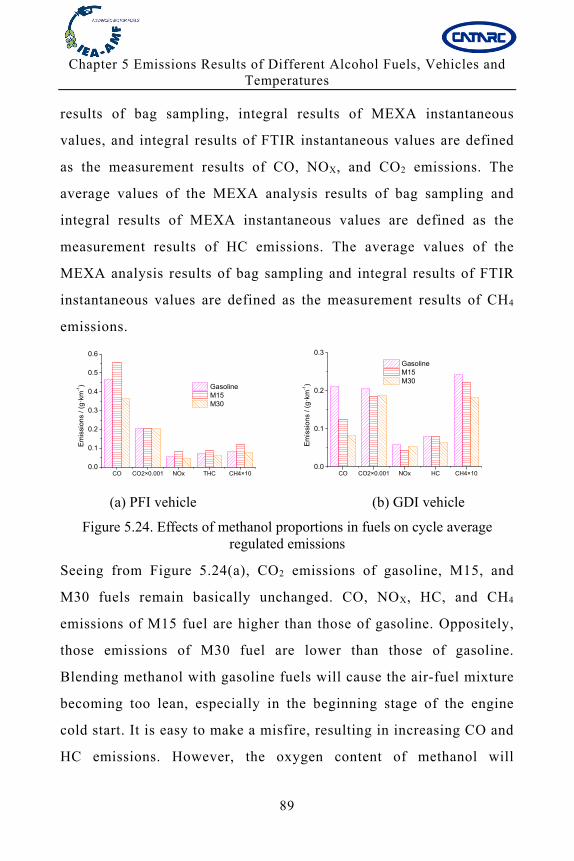
Chapter 5 Emissions Results of Different Alcohol Fuels, Vehicles and Temperatures
89
results of bag sampling, integral results of MEXA instantaneous
values, and integral results of FTIR instantaneous values are defined
as the measurement results of CO, NOX, and CO2 emissions. The
average values of the MEXA analysis results of bag sampling and
integral results of MEXA instantaneous values are defined as the
measurement results of HC emissions. The average values of the
MEXA analysis results of bag sampling and integral results of FTIR
instantaneous values are defined as the measurement results of CH4
emissions.
CO CO2×0.001 NOx THC CH4×100.0
0.1
0.2
0.3
0.4
0.5
0.6
Em
issi
ons
/ (g
·km
-1) Gasoline
M15 M30
(a) PFI vehicle (b) GDI vehicle
Figure 5.24. Effects of methanol proportions in fuels on cycle average regulated emissions
Seeing from Figure 5.24(a), CO2 emissions of gasoline, M15, and
M30 fuels remain basically unchanged. CO, NOX, HC, and CH4
emissions of M15 fuel are higher than those of gasoline. Oppositely,
those emissions of M30 fuel are lower than those of gasoline.
Blending methanol with gasoline fuels will cause the air-fuel mixture
becoming too lean, especially in the beginning stage of the engine
cold start. It is easy to make a misfire, resulting in increasing CO and
HC emissions. However, the oxygen content of methanol will
CO CO2×0.001 NOx HC CH4×100.0
0.1
0.2
0.3
Em
issi
on
s /
(g·k
m-1)
Gasoline M15 M30
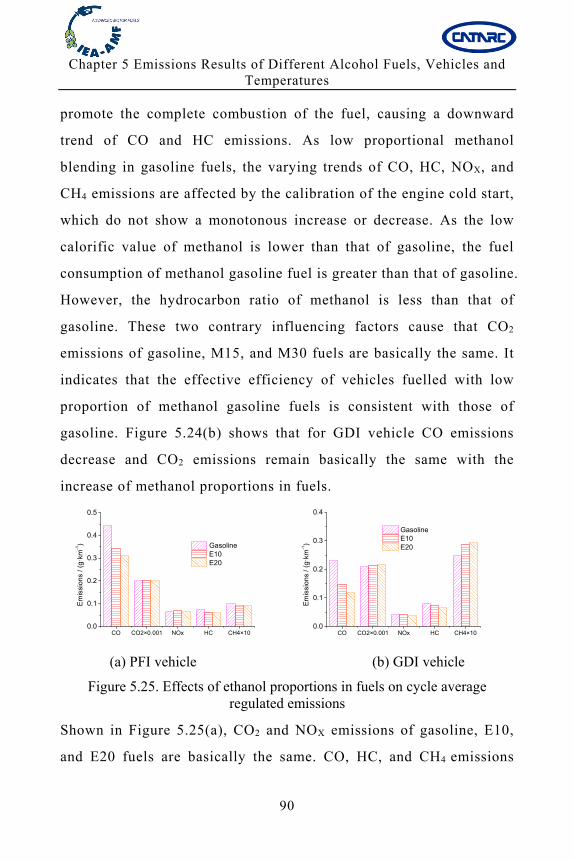
Chapter 5 Emissions Results of Different Alcohol Fuels, Vehicles and Temperatures
90
promote the complete combustion of the fuel, causing a downward
trend of CO and HC emissions. As low proportional methanol
blending in gasoline fuels, the varying trends of CO, HC, NOX, and
CH4 emissions are affected by the calibration of the engine cold start,
which do not show a monotonous increase or decrease. As the low
calorific value of methanol is lower than that of gasoline, the fuel
consumption of methanol gasoline fuel is greater than that of gasoline.
However, the hydrocarbon ratio of methanol is less than that of
gasoline. These two contrary influencing factors cause that CO2
emissions of gasoline, M15, and M30 fuels are basically the same. It
indicates that the effective efficiency of vehicles fuelled with low
proportion of methanol gasoline fuels is consistent with those of
gasoline. Figure 5.24(b) shows that for GDI vehicle CO emissions
decrease and CO2 emissions remain basically the same with the
increase of methanol proportions in fuels.
CO CO2×0.001 NOx HC CH4×100.0
0.1
0.2
0.3
0.4
0.5
Em
issi
ons
/ (g
·km
-1) Gasoline
E10 E20
(a) PFI vehicle (b) GDI vehicle
Figure 5.25. Effects of ethanol proportions in fuels on cycle average regulated emissions
Shown in Figure 5.25(a), CO2 and NOX emissions of gasoline, E10,
and E20 fuels are basically the same. CO, HC, and CH4 emissions
CO CO2×0.001 NOx HC CH4×100.0
0.1
0.2
0.3
0.4
Em
issi
on
s /
(g·k
m-1)
Gasoline E10 E20
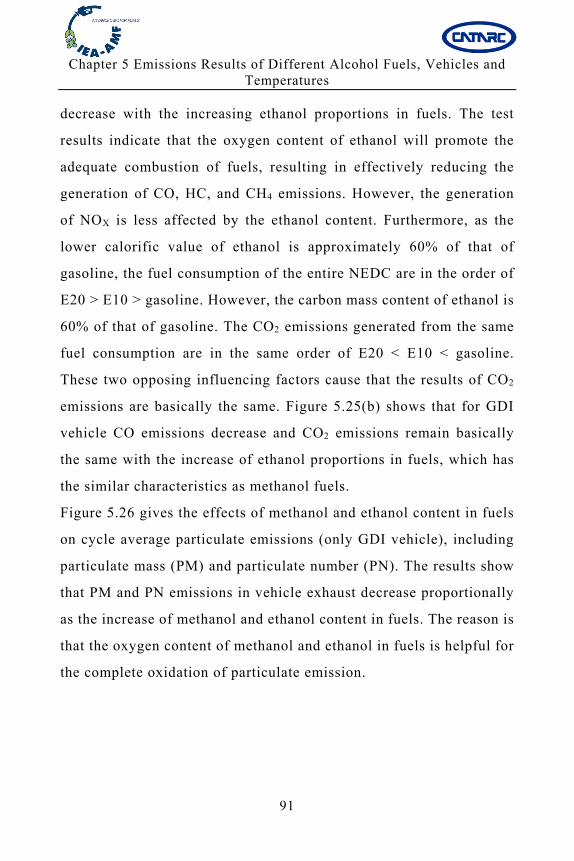
Chapter 5 Emissions Results of Different Alcohol Fuels, Vehicles and Temperatures
91
decrease with the increasing ethanol proportions in fuels. The test
results indicate that the oxygen content of ethanol will promote the
adequate combustion of fuels, resulting in effectively reducing the
generation of CO, HC, and CH4 emissions. However, the generation
of NOX is less affected by the ethanol content. Furthermore, as the
lower calorific value of ethanol is approximately 60% of that of
gasoline, the fuel consumption of the entire NEDC are in the order of
E20 > E10 > gasoline. However, the carbon mass content of ethanol is
60% of that of gasoline. The CO2 emissions generated from the same
fuel consumption are in the same order of E20 < E10 < gasoline.
These two opposing influencing factors cause that the results of CO2
emissions are basically the same. Figure 5.25(b) shows that for GDI
vehicle CO emissions decrease and CO2 emissions remain basically
the same with the increase of ethanol proportions in fuels, which has
the similar characteristics as methanol fuels.
Figure 5.26 gives the effects of methanol and ethanol content in fuels
on cycle average particulate emissions (only GDI vehicle), including
particulate mass (PM) and particulate number (PN). The results show
that PM and PN emissions in vehicle exhaust decrease proportionally
as the increase of methanol and ethanol content in fuels. The reason is
that the oxygen content of methanol and ethanol in fuels is helpful for
the complete oxidation of particulate emission.
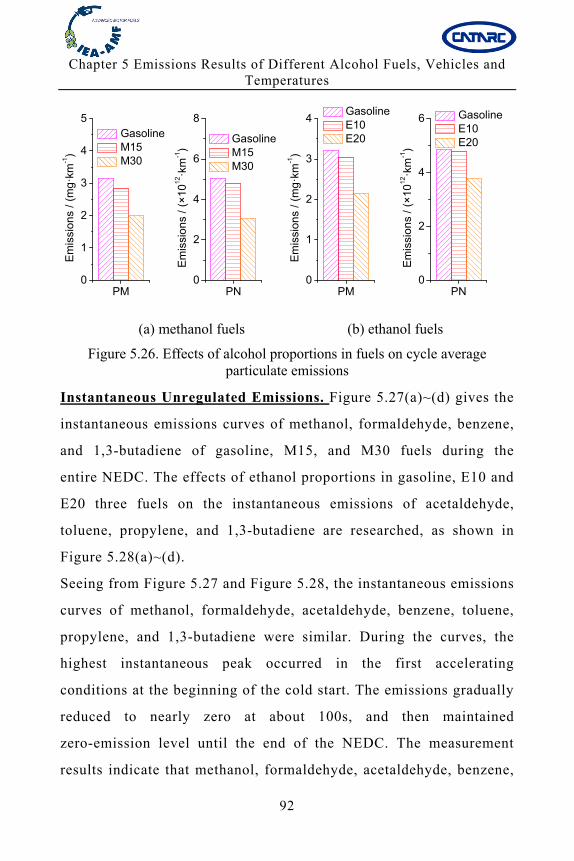
Chapter 5 Emissions Results of Different Alcohol Fuels, Vehicles and Temperatures
92
PM0
1
2
3
4
5 Gasoline M15 M30
Em
issi
ons
/ (m
g·k
m-1)
PN0
2
4
6
8
Gasoline M15 M30
Em
issi
ons
/ (×
101
2·k
m-1)
PM0
1
2
3
4 Gasoline E10 E20
Em
issi
ons
/ (m
g·k
m-1)
PN0
2
4
6 Gasoline E10 E20
Em
issi
ons
/ (×
101
2·k
m-1)
(a) methanol fuels (b) ethanol fuels
Figure 5.26. Effects of alcohol proportions in fuels on cycle average particulate emissions
Instantaneous Unregulated Emissions. Figure 5.27(a)~(d) gives the
instantaneous emissions curves of methanol, formaldehyde, benzene,
and 1,3-butadiene of gasoline, M15, and M30 fuels during the
entire NEDC. The effects of ethanol proportions in gasoline, E10 and
E20 three fuels on the instantaneous emissions of acetaldehyde,
toluene, propylene, and 1,3-butadiene are researched, as shown in
Figure 5.28(a)~(d).
Seeing from Figure 5.27 and Figure 5.28, the instantaneous emissions
curves of methanol, formaldehyde, acetaldehyde, benzene, toluene,
propylene, and 1,3-butadiene were similar. During the curves, the
highest instantaneous peak occurred in the first accelerating
conditions at the beginning of the cold start. The emissions gradually
reduced to nearly zero at about 100s, and then maintained
zero-emission level until the end of the NEDC. The measurement
results indicate that methanol, formaldehyde, acetaldehyde, benzene,
Chapter 5 Emissions Results of Different Alcohol Fuels, Vehicles and Temperatures
93
toluene, propylene, 1,3-butadiene emissions could be converted
completely by the three-way catalyst and the vehicle-out emissions
after the catalyst remain in a rather low level, as those pollutants are
essentially hydrocarbons. Overall, vehicle unregulated emissions
during the entire NEDC mainly depended on the first 100s of the cold
start before the catalyst completely lighted off.
0 200 400 600 800 1000 12000
100
200
300
400 Gasoline M15 M30
w(M
eth
anol
) / 1
0-6
t / s
0
50
100
150
v
v / (
km·h
-1)
0 200 400 600 800 1000 12000
10
20
30
40
50
60 Gasoline M15 M30
w(F
orm
ald
ehy
de)
/ 10
-6
t / s
0
50
100
150
v
v / (
km·h
-1)
(a) Methanol (b) Formaldehyde
0 200 400 600 800 1000 12000
10
20
30
40 Gasoline M15 M30
w(B
enze
ne)
/ 10
-6
t / s
0
50
100
150
v
v / (
km·h
-1)
0 200 400 600 800 1000 12000
20
40
60
80
100 Gasoline M15 M30
w(1
,3-b
uta
dien
e) /
10-6
t / s
0
50
100
150
v
v / (
km·h
-1)
(c) Benzene (d) 1,3-butadiene Figure 5.27. Instantaneous emissions curves of unregulated pollutants of
different proportional methanol fuels
Shown in Figure 5.27(a), the peak values of methanol emissions in
the vehicle exhaust increased proportionally, as the increase of
methanol proportions in gasoline fuels. The first methanol emission
peak of M30 was as high as 350×10-6. At the same time the methanol
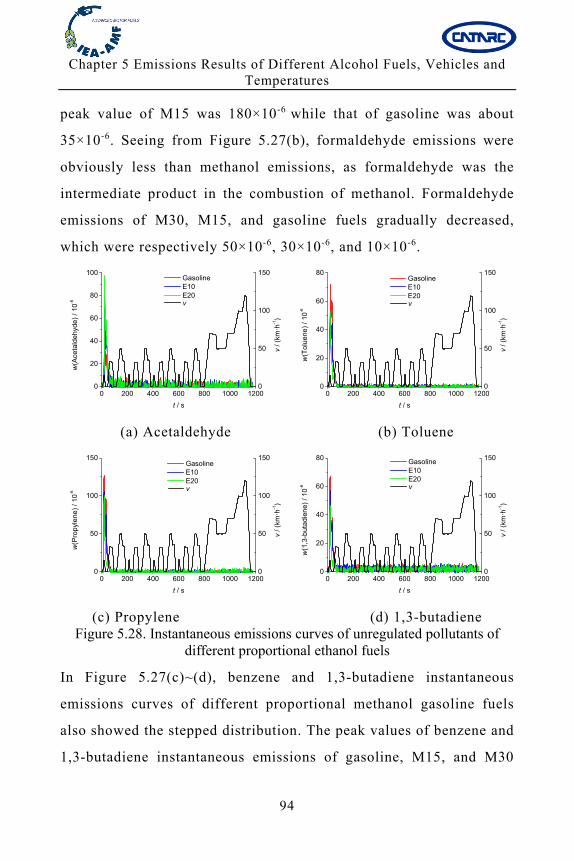
Chapter 5 Emissions Results of Different Alcohol Fuels, Vehicles and Temperatures
94
peak value of M15 was 180×10-6 while that of gasoline was about
35×10-6. Seeing from Figure 5.27(b), formaldehyde emissions were
obviously less than methanol emissions, as formaldehyde was the
intermediate product in the combustion of methanol. Formaldehyde
emissions of M30, M15, and gasoline fuels gradually decreased,
which were respectively 50×10-6, 30×10-6, and 10×10-6.
0 200 400 600 800 1000 12000
20
40
60
80
100 Gasoline E10 E20
w(A
ceta
lde
hyde
) /
10-6
t / s
0
50
100
150
v
v / (
km·h
-1)
0 200 400 600 800 1000 12000
20
40
60
80 Gasoline E10 E20
w(T
olue
ne)
/ 10
-6
t / s
0
50
100
150
v
v / (
km·h
-1)
(a) Acetaldehyde (b) Toluene
0 200 400 600 800 1000 12000
50
100
150 Gasoline E10 E20
w(P
rop
yle
ne)
/ 10-6
t / s
0
50
100
150
v
v / (
km·h
-1)
0 200 400 600 800 1000 12000
20
40
60
80 Gasoline E10 E20
w(1
,3-b
uta
dien
e) /
10-6
t / s
0
50
100
150
v
v / (
km·h
-1)
(c) Propylene (d) 1,3-butadiene Figure 5.28. Instantaneous emissions curves of unregulated pollutants of
different proportional ethanol fuels
In Figure 5.27(c)~(d), benzene and 1,3-butadiene instantaneous
emissions curves of different proportional methanol gasoline fuels
also showed the stepped distribution. The peak values of benzene and
1,3-butadiene instantaneous emissions of gasoline, M15, and M30
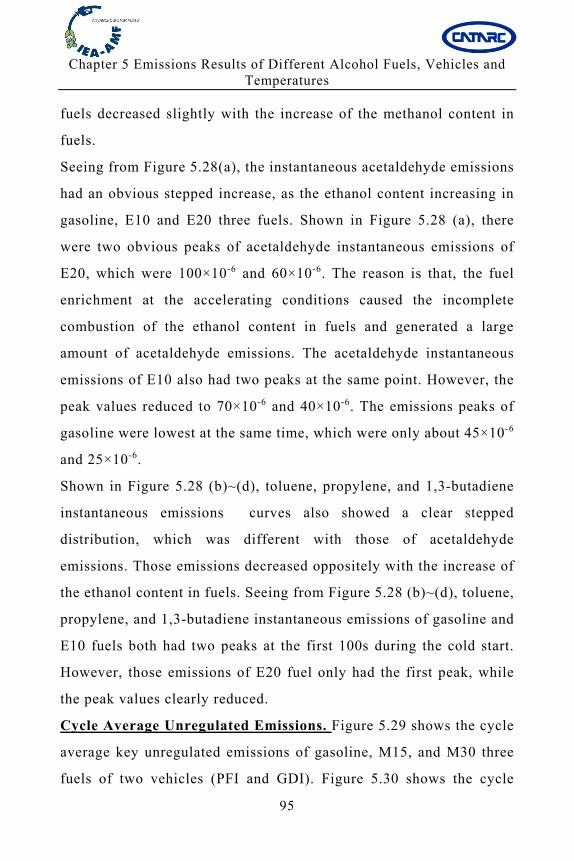
Chapter 5 Emissions Results of Different Alcohol Fuels, Vehicles and Temperatures
95
fuels decreased slightly with the increase of the methanol content in
fuels.
Seeing from Figure 5.28(a), the instantaneous acetaldehyde emissions
had an obvious stepped increase, as the ethanol content increasing in
gasoline, E10 and E20 three fuels. Shown in Figure 5.28 (a), there
were two obvious peaks of acetaldehyde instantaneous emissions of
E20, which were 100×10-6 and 60×10-6. The reason is that, the fuel
enrichment at the accelerating conditions caused the incomplete
combustion of the ethanol content in fuels and generated a large
amount of acetaldehyde emissions. The acetaldehyde instantaneous
emissions of E10 also had two peaks at the same point. However, the
peak values reduced to 70×10-6 and 40×10-6. The emissions peaks of
gasoline were lowest at the same time, which were only about 45×10-6
and 25×10-6.
Shown in Figure 5.28 (b)~(d), toluene, propylene, and 1,3-butadiene
instantaneous emissions curves also showed a clear stepped
distribution, which was different with those of acetaldehyde
emissions. Those emissions decreased oppositely with the increase of
the ethanol content in fuels. Seeing from Figure 5.28 (b)~(d), toluene,
propylene, and 1,3-butadiene instantaneous emissions of gasoline and
E10 fuels both had two peaks at the first 100s during the cold start.
However, those emissions of E20 fuel only had the first peak, while
the peak values clearly reduced.
Cycle Average Unregulated Emissions. Figure 5.29 shows the cycle
average key unregulated emissions of gasoline, M15, and M30 three
fuels of two vehicles (PFI and GDI). Figure 5.30 shows the cycle
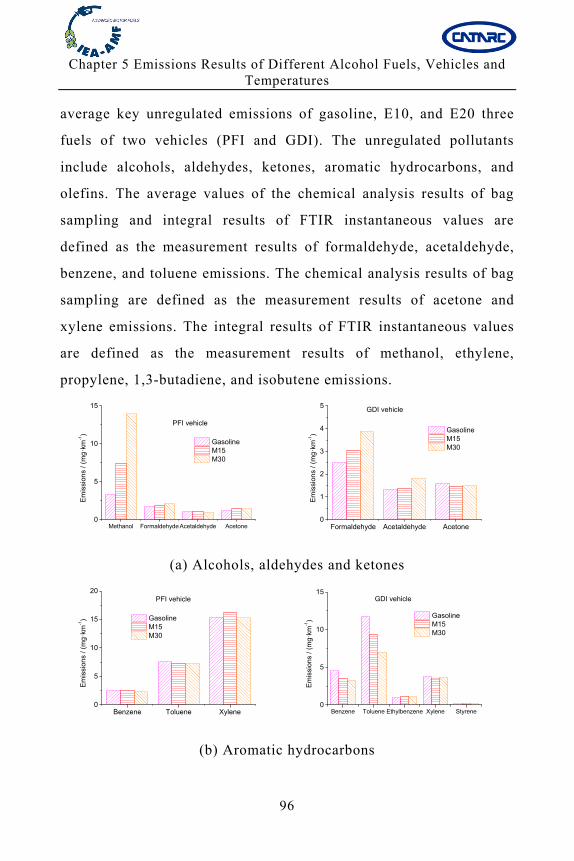
Chapter 5 Emissions Results of Different Alcohol Fuels, Vehicles and Temperatures
96
average key unregulated emissions of gasoline, E10, and E20 three
fuels of two vehicles (PFI and GDI). The unregulated pollutants
include alcohols, aldehydes, ketones, aromatic hydrocarbons, and
olefins. The average values of the chemical analysis results of bag
sampling and integral results of FTIR instantaneous values are
defined as the measurement results of formaldehyde, acetaldehyde,
benzene, and toluene emissions. The chemical analysis results of bag
sampling are defined as the measurement results of acetone and
xylene emissions. The integral results of FTIR instantaneous values
are defined as the measurement results of methanol, ethylene,
propylene, 1,3-butadiene, and isobutene emissions.
Methanol Formaldehyde Acetaldehyde Acetone0
5
10
15
Em
issi
ons
/ (m
g·k
m-1)
Gasoline M15 M30
PFI vehicle
Formaldehyde Acetaldehyde Acetone0
1
2
3
4
5
Em
issi
ons
/ (m
g·k
m-1) Gasoline
M15 M30
GDI vehicle
(a) Alcohols, aldehydes and ketones
Benzene Toluene Xylene0
5
10
15
20
Em
issi
ons
/ (m
g·k
m-1) Gasoline
M15 M30
PFI vehicle
Benzene Toluene Ethylbenzene Xylene Styrene0
5
10
15
Em
issi
ons
/ (m
g·km
-1)
Gasoline M15 M30
GDI vehicle
(b) Aromatic hydrocarbons
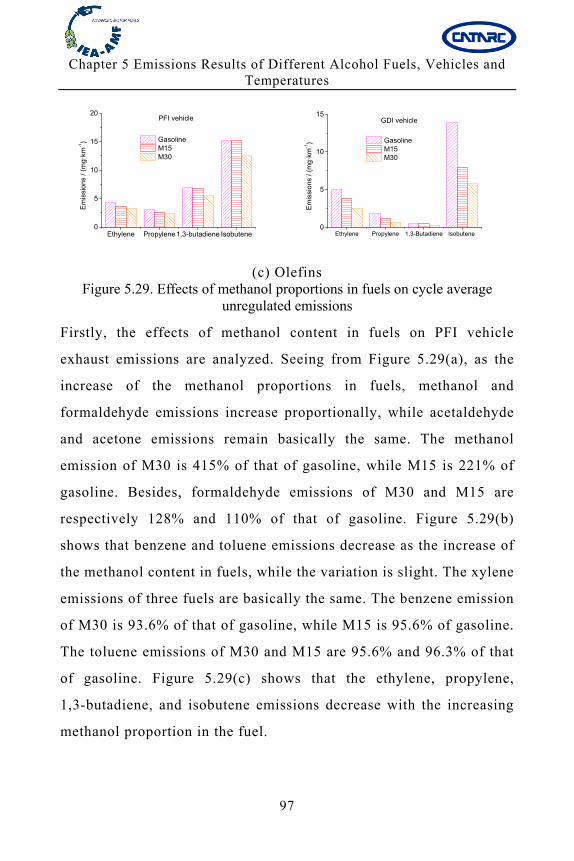
Chapter 5 Emissions Results of Different Alcohol Fuels, Vehicles and Temperatures
97
Ethylene Propylene1,3-butadiene Isobutene0
5
10
15
20
Em
issi
ons
/ (m
g·km
-1) Gasoline
M15 M30
PFI vehicle
Ethylene Propylene 1,3-Butadiene Isobutene 0
5
10
15
Em
issi
ons
/ (m
g·km
-1) Gasoline
M15 M30
GDI vehicle
(c) Olefins Figure 5.29. Effects of methanol proportions in fuels on cycle average
unregulated emissions
Firstly, the effects of methanol content in fuels on PFI vehicle
exhaust emissions are analyzed. Seeing from Figure 5.29(a), as the
increase of the methanol proportions in fuels, methanol and
formaldehyde emissions increase proportionally, while acetaldehyde
and acetone emissions remain basically the same. The methanol
emission of M30 is 415% of that of gasoline, while M15 is 221% of
gasoline. Besides, formaldehyde emissions of M30 and M15 are
respectively 128% and 110% of that of gasoline. Figure 5.29(b)
shows that benzene and toluene emissions decrease as the increase of
the methanol content in fuels, while the variation is slight. The xylene
emissions of three fuels are basically the same. The benzene emission
of M30 is 93.6% of that of gasoline, while M15 is 95.6% of gasoline.
The toluene emissions of M30 and M15 are 95.6% and 96.3% of that
of gasoline. Figure 5.29(c) shows that the ethylene, propylene,
1,3-butadiene, and isobutene emissions decrease with the increasing
methanol proportion in the fuel.
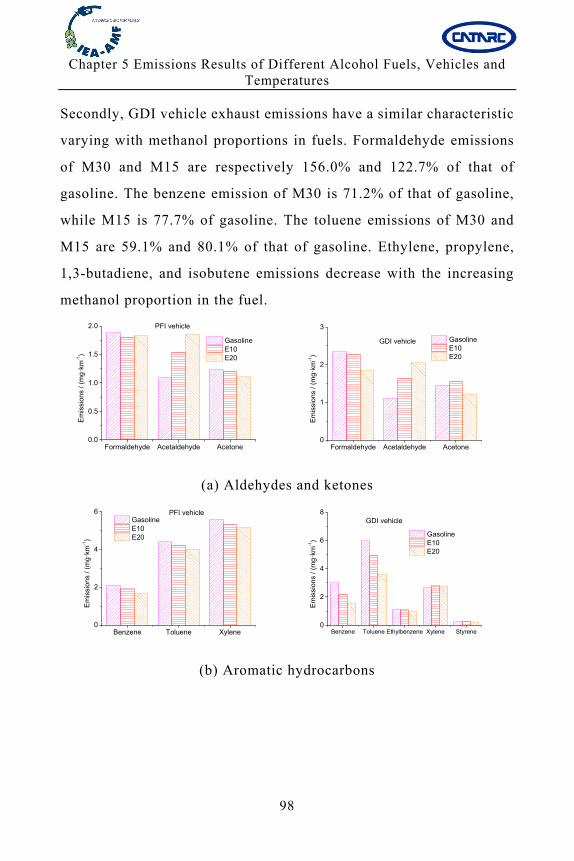
Chapter 5 Emissions Results of Different Alcohol Fuels, Vehicles and Temperatures
98
Secondly, GDI vehicle exhaust emissions have a similar characteristic
varying with methanol proportions in fuels. Formaldehyde emissions
of M30 and M15 are respectively 156.0% and 122.7% of that of
gasoline. The benzene emission of M30 is 71.2% of that of gasoline,
while M15 is 77.7% of gasoline. The toluene emissions of M30 and
M15 are 59.1% and 80.1% of that of gasoline. Ethylene, propylene,
1,3-butadiene, and isobutene emissions decrease with the increasing
methanol proportion in the fuel.
Formaldehyde Acetaldehyde Acetone0.0
0.5
1.0
1.5
2.0
Em
issi
ons
/ (m
g·k
m-1)
Gasoline E10 E20
PFI vehicle
Formaldehyde Acetaldehyde Acetone0
1
2
3
Em
issi
ons
/ (m
g·km
-1)
Gasoline E10 E20
GDI vehicle
(a) Aldehydes and ketones
Benzene Toluene Xylene0
2
4
6
Em
issi
ons
/ (m
g·k
m-1)
Gasoline E10 E20
PFI vehicle
Benzene Toluene Ethylbenzene Xylene Styrene0
2
4
6
8
Em
issi
ons
/ (m
g·km
-1)
Gasoline E10 E20
GDI vehicle
(b) Aromatic hydrocarbons
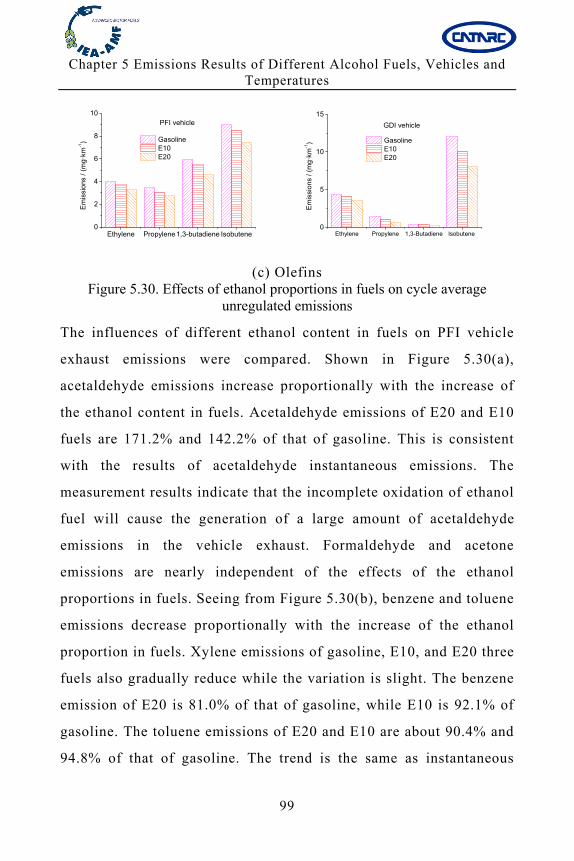
Chapter 5 Emissions Results of Different Alcohol Fuels, Vehicles and Temperatures
99
Ethylene Propylene1,3-butadiene Isobutene0
2
4
6
8
10
Em
issi
ons
/ (m
g·km
-1) Gasoline
E10 E20
PFI vehicle
Ethylene Propylene 1,3-Butadiene Isobutene 0
5
10
15
Em
issi
ons
/ (m
g·km
-1) Gasoline
E10 E20
GDI vehicle
(c) Olefins Figure 5.30. Effects of ethanol proportions in fuels on cycle average
unregulated emissions
The influences of different ethanol content in fuels on PFI vehicle
exhaust emissions were compared. Shown in Figure 5.30(a),
acetaldehyde emissions increase proportionally with the increase of
the ethanol content in fuels. Acetaldehyde emissions of E20 and E10
fuels are 171.2% and 142.2% of that of gasoline. This is consistent
with the results of acetaldehyde instantaneous emissions. The
measurement results indicate that the incomplete oxidation of ethanol
fuel will cause the generation of a large amount of acetaldehyde
emissions in the vehicle exhaust. Formaldehyde and acetone
emissions are nearly independent of the effects of the ethanol
proportions in fuels. Seeing from Figure 5.30(b), benzene and toluene
emissions decrease proportionally with the increase of the ethanol
proportion in fuels. Xylene emissions of gasoline, E10, and E20 three
fuels also gradually reduce while the variation is slight. The benzene
emission of E20 is 81.0% of that of gasoline, while E10 is 92.1% of
gasoline. The toluene emissions of E20 and E10 are about 90.4% and
94.8% of that of gasoline. The trend is the same as instantaneous
Chapter 5 Emissions Results of Different Alcohol Fuels, Vehicles and Temperatures
100
toluene emissions of three fuels. The xylene emissions of E20 and
E10 are approximately 93.0% and 95.0% of that of gasoline. The
measurement results indicate that blending ethanol with gasoline
fuels could reduce benzene, toluene, and xylene emissions in the
vehicle exhaust in a certain extent, as ethanol does not have the
aromatic hydrocarbon content. Shown in Figure 5.30(c), ethylene,
propylene, 1,3-butadiene, and isobutylene emissions decrease nearly
linearly with the increase of the ethanol content in fuels. The ethylene
emission of E20 is 82.1% of that of gasoline, while E10 is 92.8% of
gasoline. The propylene emissions of E20 and E10 are about 80.1%
and 87.3% of that of gasoline, while the 1,3-butadiene emissions of
E20 and E10 are 76.6% and 91.4% of that of gasoline. This is
consistent with the instantaneous results of propylene and
1,3-butadiene emissions. The isobutylene emissions of E20 and E10
are about 82.4% and 94.0% of that of gasoline. The measurement
results indicate the oxygen content of ethanol in fuels is helpful for
the complete oxidation of olefins in fuels, which could effectively
reduce the olefin emissions in the vehicle exhaust.
The influences of ethanol content in fuels on GDI vehicle exhaust
unregulated emissions were also analyzed. Acetaldehyde emissions of
E20 and E10 fuels are 183.9% and 146.9% of that of gasoline. The
benzene emission of E20 is 73.7% of that of gasoline, while E10 is
82.5% of gasoline. The toluene emissions of E20 and E10 are about
51.8% and 60.3% of that of gasoline. Ethylene, propylene,
1,3-butadiene, and isobutylene emissions decrease with the increase
Chapter 5 Emissions Results of Different Alcohol Fuels, Vehicles and Temperatures
101
of the ethanol. The ethylene emission of E20 is 81.8% of that of
gasoline, while E10 is 91.7% of gasoline.
5.3.2 Vehicle exhaust emissions at low temperature
In accordance with the EU R83-05 standard, emissions testing at the
-7°C low temperature of the NEDC were carried out in a light-duty
vehicle chassis dynamometer, using vehicle 1# fuelled with gasoline,
M15, M30 and using vehicle 2# fuelled with gasoline, E10, E20. The
effects of methanol and ethanol proportions in fuels on CO, NOX, HC,
CO2 regulated emissions and methanol, formaldehyde, acetaldehyde,
acetone, benzene, toluene, xylene, ethylene, propylene, 1,3-butadiene,
isobutylene unregulated emissions were analyzed using FTIR, HPLC
and GC-MS joint research methods. The variations of different
pollutants emissions at low and normal temperature were also
compared.
Average regulated emissions at low temperature. Figure 5.31
shows respectively the average regulated emissions of gasoline, M15
and M30 three fuels at low temperature. Figure 5.32 shows
respectively the average regulated emissions of gasoline, E10 and
E20 three fuels at low temperature. Seen from Figure 5.31, CO2
emissions of gasoline, M15 and M30 three fuels at low temperature
are basically the same. CO emissions of M30 and M15 fuels are
respectively 125% and 128% of that of gasoline. HC emissions of
M30 and M15 fuels are respectively 120% and 105% of that of
gasoline. Oppositely, NOX emissions of the two fuels are 92% and 81%
of that of gasoline. Figure 5.32 shows CO2 emissions of gasoline, E10
Chapter 5 Emissions Results of Different Alcohol Fuels, Vehicles and Temperatures
102
and E20 three fuels remain nearly unchanged at low temperature. CO
emissions of E20 and E10 fuels are respectively 108% and 98% of
that of gasoline, while HC emissions of the two fuels are 102% and
97% of that of gasoline. However, NOX emissions of E20 and E10
fuels are respectively 83% and 83% of that of gasoline.
Comprehensively speaking, when low proportional methanol or
ethanol fuels is added into gasoline, CO2 emissions are basically, CO
and HC emissions increases slightly, and the NOX emissions have a
tendency to reduce at low temperature.
As shown in Table 5.1, the comparison results of regulated emissions
and unregulated emission of CO, CO2, NOX and HC pollutants at low
temperature and normal temperature. The test results indicate that all
kinds of regulated emissions at low temperature are obviously higher
than those at normal temperature. For low proportional
methanol-gasoline and ethanol-gasoline fuels, CO2 emissions at low
temperature are 1.7 times as high as those at normal temperature. CO,
HC, and NOX emissions at low temperature are respectively 7~13
times, 25~33 times, 2~5 times as high as those at normal temperature.
With the increase of the alcohol content in fuels, the ratios of CO, HC
emissions at low temperature to those at normal temperature have a
tendency to increase, while NOX emissions fell slightly.
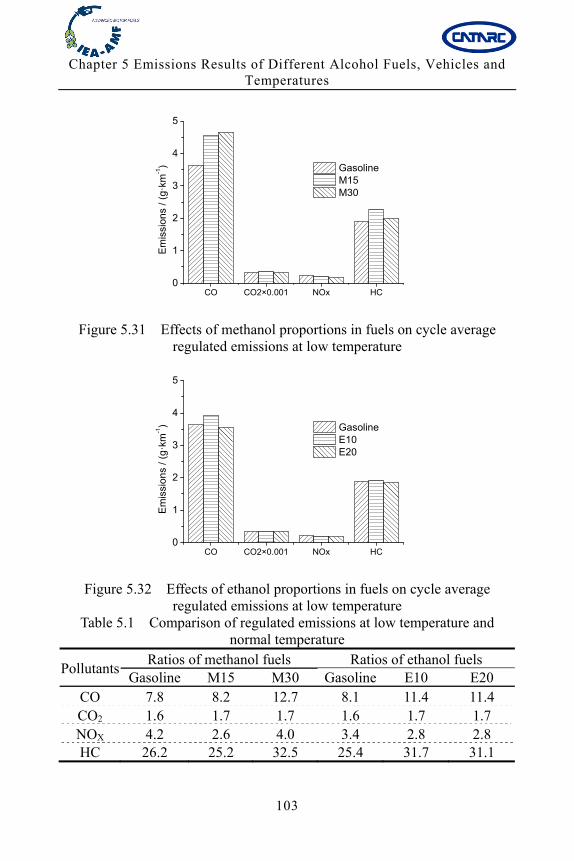
Chapter 5 Emissions Results of Different Alcohol Fuels, Vehicles and Temperatures
103
CO CO2×0.001 NOx HC0
1
2
3
4
5
Em
issi
ons
/ (g
·km
-1) Gasoline
M15 M30
Figure 5.31 Effects of methanol proportions in fuels on cycle average
regulated emissions at low temperature
CO CO2×0.001 NOx HC0
1
2
3
4
5
Em
issi
ons
/ (g
·km
-1) Gasoline
E10 E20
Figure 5.32 Effects of ethanol proportions in fuels on cycle average
regulated emissions at low temperature Table 5.1 Comparison of regulated emissions at low temperature and
normal temperature
Pollutants Ratios of methanol fuels Ratios of ethanol fuels
Gasoline M15 M30 Gasoline E10 E20 CO 7.8 8.2 12.7 8.1 11.4 11.4 CO2 1.6 1.7 1.7 1.6 1.7 1.7 NOX 4.2 2.6 4.0 3.4 2.8 2.8 HC 26.2 25.2 32.5 25.4 31.7 31.1
Chapter 5 Emissions Results of Different Alcohol Fuels, Vehicles and Temperatures
104
Average unregulated emissions at low temperature. Figure 5.33
shows the cycle average key unregulated emissions of gasoline, M15,
and M30 three fuels at low temperature. Figure 5.34 shows the cycle
average key unregulated emissions of gasoline, E10, and E20 three
fuels at low temperature.
Seen from Figure 5.33(a), as the increase of the methanol proportion
in fuels, methanol and formaldehyde emissions increase significantly
at low temperature, while acetaldehyde emissions increase slightly.
The methanol emission of M30 is 41.6 times as high as that of
gasoline, while M15 is 15.7 times higher as that of gasoline. Besides,
formaldehyde emissions of M30 and M15 are respectively 5.1 times
and 2.4 times as high as that of gasoline. Acetaldehyde emissions of
M30 and M15 fuels are respectively 132% and 110% of that of
gasoline. Acetone emission decreases with the increase of methanol
content in fuels, while the variation is slight. Acetone emissions of
M30 and M15 are 90% and 93% of that of gasoline. Figure 5.33(b)
shows benzene, toluene, and xylene emissions decrease with the
increase of methanol content in fuels. Benzene emission of M30 is 75%
of that of gasoline, while M15 is 80% of that of gasoline. The toluene
emissions of M30 and M15 are 90% and 92% of that of gasoline. The
xylene emissions of M30 and M15 are 59% and 89% of that of
gasoline. Seen from Figure 5.33(c), the 1,3-butadiene emission at low
temperature decrease with the increasing methanol proportion in the
fuel, while the ethylene, propylene, and isobutene emissions remain
basically the same. The 1,3-butadiene emissions of M30 and M15 are
respectively 51% and 86% of that of gasoline. The results indicate
Chapter 5 Emissions Results of Different Alcohol Fuels, Vehicles and Temperatures
105
that unburned methanol and formaldehyde emissions increase
significantly. Using M30 fuel during the rapid acceleration condition
at low temperature has been beyond the normal calibration range of
general gasoline engine. Fuels which have methanol content higher
than 30% cannot be directly used in gasoline engine.
During the aldehydes and ketones emission shown in Figure 5.34(a),
acetaldehyde emissions increase proportionally with the increase of
the ethanol content in fuels at low temperature. Acetaldehyde
emissions of E20 and E10 fuels are 3.2 times and 2.4 times as high as
that of gasoline, while has a similar characteristic as normal
temperature. Formaldehyde emission is nearly independent of the
effects of the ethanol proportions in fuels, while acetone emission
decreases slightly with the increase of the ethanol content in fuels.
Figure 5.34(b) shows that benzene and xylene emissions decrease
proportionally with the increase of the ethanol proportion in fuels.
Toluene emissions of gasoline, E10, and E20 three fuels remain
nearly unchanged. The benzene emission of E20 is 69% of that of
gasoline, while E10 is 77% of gasoline. The xylene emissions of E20
and E10 are about 94% and 90% of that of gasoline. Seen from Figure
5.34(c), ethylene, propylene, and 1,3-butadiene emissions decrease
significantly with the increase of the ethanol content in fuels at low
temperature, while isobutylene emission keeps stable. The ethylene
emission of E20 is 66% of that of gasoline, while E10 is 82% of
gasoline. The propylene emissions of E20 and E10 are about 70% and
68% of that of gasoline, while the 1,3-butadiene emissions of E20 and
E10 are 38% and 43% of that of gasoline.
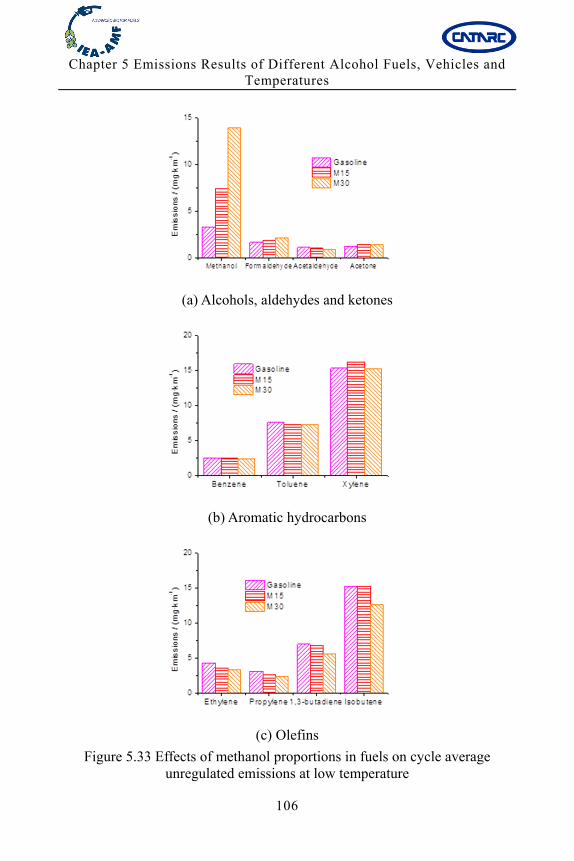
Chapter 5 Emissions Results of Different Alcohol Fuels, Vehicles and Temperatures
106
(a) Alcohols, aldehydes and ketones
(b) Aromatic hydrocarbons
(c) Olefins
Figure 5.33 Effects of methanol proportions in fuels on cycle average unregulated emissions at low temperature
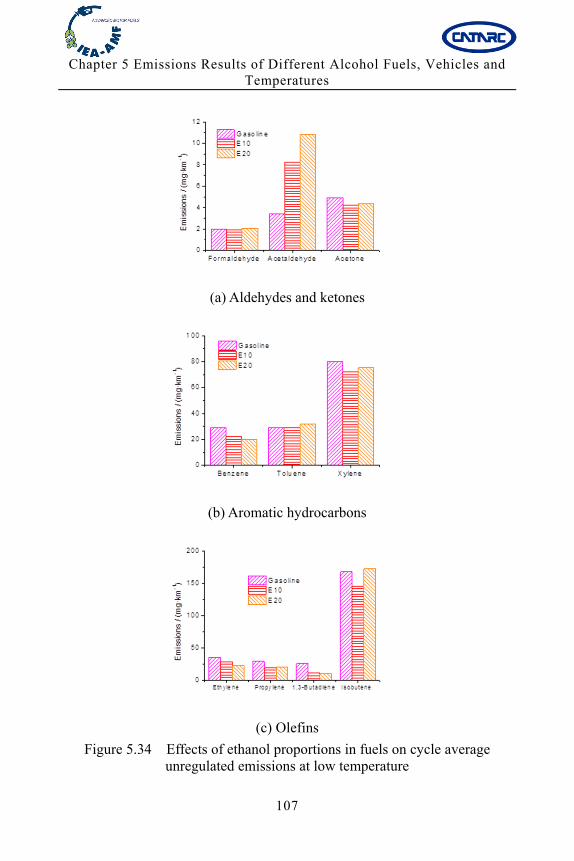
Chapter 5 Emissions Results of Different Alcohol Fuels, Vehicles and Temperatures
107
(a) Aldehydes and ketones
(b) Aromatic hydrocarbons
(c) Olefins
Figure 5.34 Effects of ethanol proportions in fuels on cycle average unregulated emissions at low temperature
Chapter 5 Emissions Results of Different Alcohol Fuels, Vehicles and Temperatures
108
Generally speaking, the characteristics of various unregulated
emissions varying with the alcohols content in fuels at low
temperature are similar as those at normal temperature. However, the
change of various emissions at low temperature has a tendency to
enlarge compared with that at normal temperature, especially for
methanol, formaldehyde, 1,3-butadiene emissions of
methanol-gasoline fuels and acetaldehyde emissions of
ethanol-gasoline fuels.
Table 5.2 gives the comparison results of various unregulated
emissions at low temperature and at normal temperature. The test
results indicate that various unregulated emissions increase
significantly at low temperature, similar with regulated emissions.
For low proportion of methanol gasoline fuels, the increase value of
methanol emissions is the largest. The ratios of methanol emissions at
low temperature to those at normal temperature of gasoline, M15,
M30 three fuels are 4.5, 32.0, and 45.3. However, the increase value
of formaldehyde emissions decreases significantly. The ratios of
formaldehyde emissions at low temperature to those at normal
temperature are respectively 1.3, 2.8, and 5.1. Benzene, ethylene,
propylene and isobutylene emissions at low temperature are about
10~15 times as high as those at normal temperature, while
low-temperature acetaldehyde, acetone, toluene, xylene, 1,
3-butadiene emissions are 2 ~ 6 times higher as those at normal
temperature.
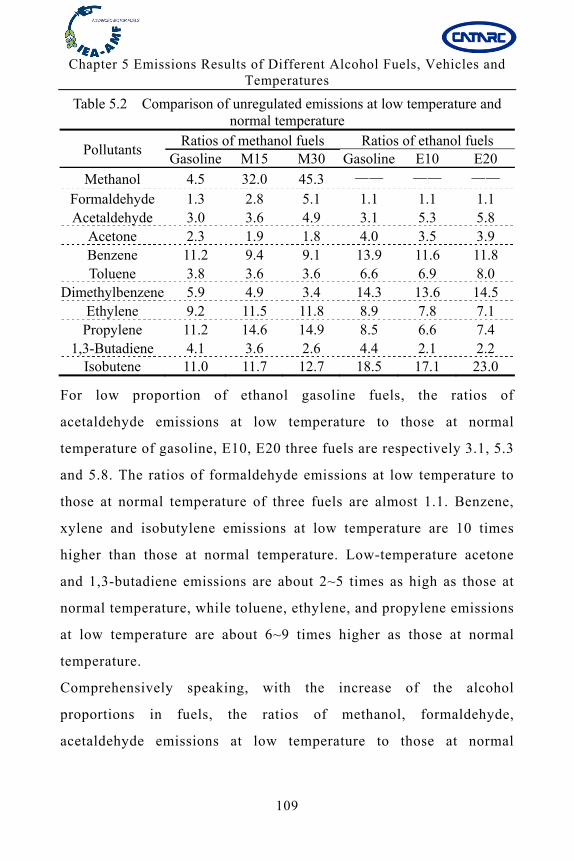
Chapter 5 Emissions Results of Different Alcohol Fuels, Vehicles and Temperatures
109
Table 5.2 Comparison of unregulated emissions at low temperature and normal temperature
Pollutants Ratios of methanol fuels Ratios of ethanol fuels
Gasoline M15 M30 Gasoline E10 E20
Methanol 4.5 32.0 45.3 —— —— —— Formaldehyde 1.3 2.8 5.1 1.1 1.1 1.1 Acetaldehyde 3.0 3.6 4.9 3.1 5.3 5.8
Acetone 2.3 1.9 1.8 4.0 3.5 3.9 Benzene 11.2 9.4 9.1 13.9 11.6 11.8 Toluene 3.8 3.6 3.6 6.6 6.9 8.0
Dimethylbenzene 5.9 4.9 3.4 14.3 13.6 14.5 Ethylene 9.2 11.5 11.8 8.9 7.8 7.1 Propylene 11.2 14.6 14.9 8.5 6.6 7.4
1,3-Butadiene 4.1 3.6 2.6 4.4 2.1 2.2 Isobutene 11.0 11.7 12.7 18.5 17.1 23.0
For low proportion of ethanol gasoline fuels, the ratios of
acetaldehyde emissions at low temperature to those at normal
temperature of gasoline, E10, E20 three fuels are respectively 3.1, 5.3
and 5.8. The ratios of formaldehyde emissions at low temperature to
those at normal temperature of three fuels are almost 1.1. Benzene,
xylene and isobutylene emissions at low temperature are 10 times
higher than those at normal temperature. Low-temperature acetone
and 1,3-butadiene emissions are about 2~5 times as high as those at
normal temperature, while toluene, ethylene, and propylene emissions
at low temperature are about 6~9 times higher as those at normal
temperature.
Comprehensively speaking, with the increase of the alcohol
proportions in fuels, the ratios of methanol, formaldehyde,
acetaldehyde emissions at low temperature to those at normal
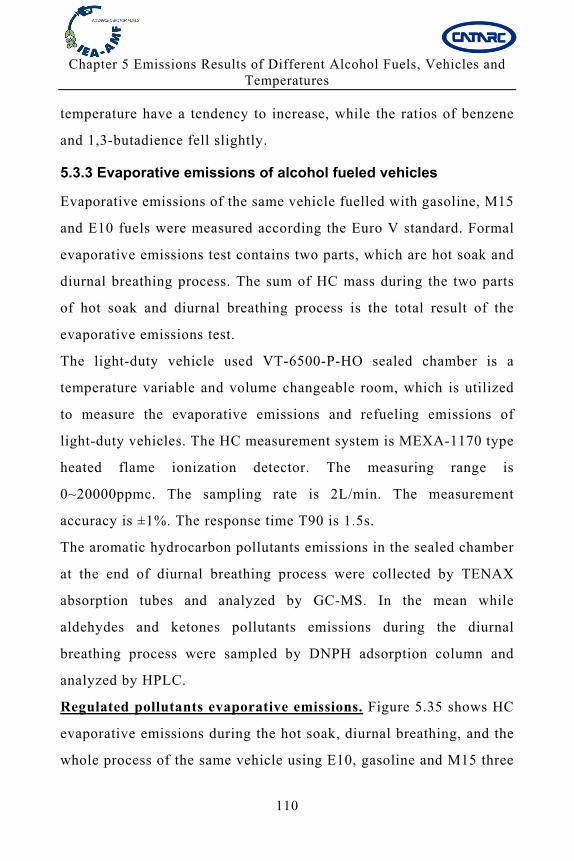
Chapter 5 Emissions Results of Different Alcohol Fuels, Vehicles and Temperatures
110
temperature have a tendency to increase, while the ratios of benzene
and 1,3-butadience fell slightly.
5.3.3 Evaporative emissions of alcohol fueled vehicles
Evaporative emissions of the same vehicle fuelled with gasoline, M15
and E10 fuels were measured according the Euro V standard. Formal
evaporative emissions test contains two parts, which are hot soak and
diurnal breathing process. The sum of HC mass during the two parts
of hot soak and diurnal breathing process is the total result of the
evaporative emissions test.
The light-duty vehicle used VT-6500-P-HO sealed chamber is a
temperature variable and volume changeable room, which is utilized
to measure the evaporative emissions and refueling emissions of
light-duty vehicles. The HC measurement system is MEXA-1170 type
heated flame ionization detector. The measuring range is
0~20000ppmc. The sampling rate is 2L/min. The measurement
accuracy is ±1%. The response time T90 is 1.5s.
The aromatic hydrocarbon pollutants emissions in the sealed chamber
at the end of diurnal breathing process were collected by TENAX
absorption tubes and analyzed by GC-MS. In the mean while
aldehydes and ketones pollutants emissions during the diurnal
breathing process were sampled by DNPH adsorption column and
analyzed by HPLC.
Regulated pollutants evaporative emissions. Figure 5.35 shows HC
evaporative emissions during the hot soak, diurnal breathing, and the
whole process of the same vehicle using E10, gasoline and M15 three
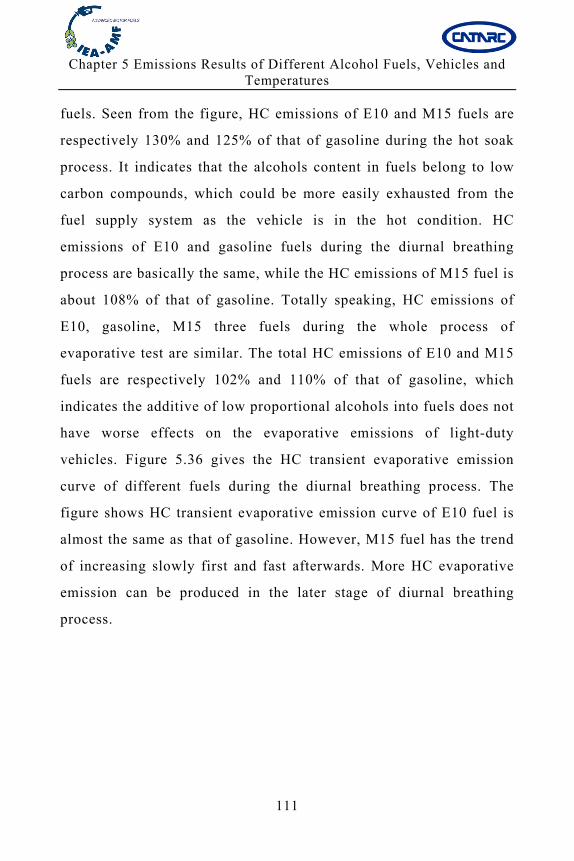
Chapter 5 Emissions Results of Different Alcohol Fuels, Vehicles and Temperatures
111
fuels. Seen from the figure, HC emissions of E10 and M15 fuels are
respectively 130% and 125% of that of gasoline during the hot soak
process. It indicates that the alcohols content in fuels belong to low
carbon compounds, which could be more easily exhausted from the
fuel supply system as the vehicle is in the hot condition. HC
emissions of E10 and gasoline fuels during the diurnal breathing
process are basically the same, while the HC emissions of M15 fuel is
about 108% of that of gasoline. Totally speaking, HC emissions of
E10, gasoline, M15 three fuels during the whole process of
evaporative test are similar. The total HC emissions of E10 and M15
fuels are respectively 102% and 110% of that of gasoline, which
indicates the additive of low proportional alcohols into fuels does not
have worse effects on the evaporative emissions of light-duty
vehicles. Figure 5.36 gives the HC transient evaporative emission
curve of different fuels during the diurnal breathing process. The
figure shows HC transient evaporative emission curve of E10 fuel is
almost the same as that of gasoline. However, M15 fuel has the trend
of increasing slowly first and fast afterwards. More HC evaporative
emission can be produced in the later stage of diurnal breathing
process.
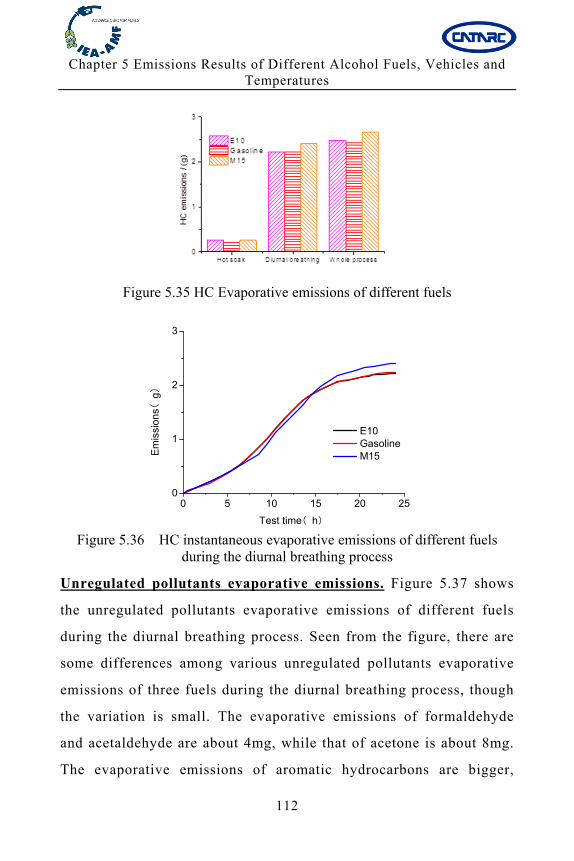
Chapter 5 Emissions Results of Different Alcohol Fuels, Vehicles and Temperatures
112
Figure 5.35 HC Evaporative emissions of different fuels
0 5 10 15 20 250
1
2
3
()
Em
issi
on
sg
( )Test time h
E10 Gasoline M15
Figure 5.36 HC instantaneous evaporative emissions of different fuels during the diurnal breathing process
Unregulated pollutants evaporative emissions. Figure 5.37 shows
the unregulated pollutants evaporative emissions of different fuels
during the diurnal breathing process. Seen from the figure, there are
some differences among various unregulated pollutants evaporative
emissions of three fuels during the diurnal breathing process, though
the variation is small. The evaporative emissions of formaldehyde
and acetaldehyde are about 4mg, while that of acetone is about 8mg.
The evaporative emissions of aromatic hydrocarbons are bigger,
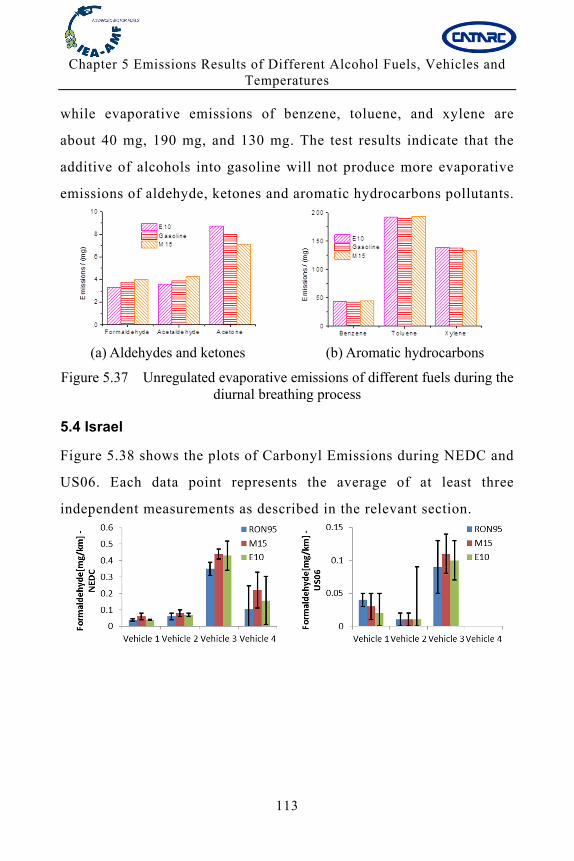
Chapter 5 Emissions Results of Different Alcohol Fuels, Vehicles and Temperatures
113
while evaporative emissions of benzene, toluene, and xylene are
about 40 mg, 190 mg, and 130 mg. The test results indicate that the
additive of alcohols into gasoline will not produce more evaporative
emissions of aldehyde, ketones and aromatic hydrocarbons pollutants.
(a) Aldehydes and ketones (b) Aromatic hydrocarbons
Figure 5.37 Unregulated evaporative emissions of different fuels during the diurnal breathing process
5.4 Israel
Figure 5.38 shows the plots of Carbonyl Emissions during NEDC and
US06. Each data point represents the average of at least three
independent measurements as described in the relevant section.
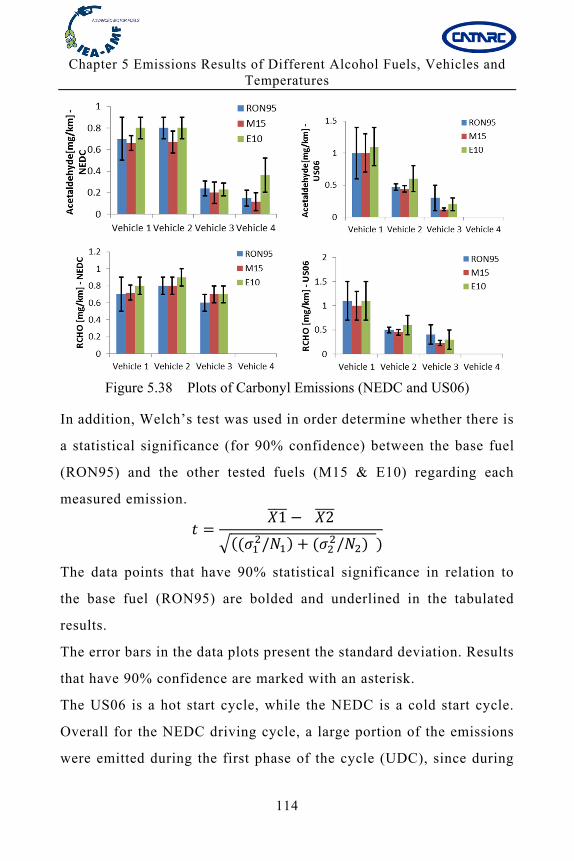
Chapter 5 Emissions Results of Different Alcohol Fuels, Vehicles and Temperatures
114
Figure 5.38 Plots of Carbonyl Emissions (NEDC and US06)
In addition, Welch’s test was used in order determine whether there is
a statistical significance (for 90% confidence) between the base fuel
(RON95) and the other tested fuels (M15 & E10) regarding each
measured emission. 1 2
/ /
The data points that have 90% statistical significance in relation to
the base fuel (RON95) are bolded and underlined in the tabulated
results.
The error bars in the data plots present the standard deviation. Results
that have 90% confidence are marked with an asterisk.
The US06 is a hot start cycle, while the NEDC is a cold start cycle.
Overall for the NEDC driving cycle, a large portion of the emissions
were emitted during the first phase of the cycle (UDC), since during
Chapter 5 Emissions Results of Different Alcohol Fuels, Vehicles and Temperatures
115
this phase, the engine and the catalectic converter are far from their
working temperature. The combined effect of a fuel-rich mixture that
will support ignition during the cold start and the low temperature of
the catalytic converter, which is lower than its light-up temperature,
increases the emissions per km substantially in comparison to the
EUDC phase.
Formaldehyde
Of the seven results for all the cycles (three for US06 and four
for NEDC), five show that the amount of emitted formaldehyde
when using M15 is slightly higher than it is when using RON95.
Two results show that formaldehyde emission for M15 is lower
than for RON95.
Of these results, one showed statistical significance with
confidence of 90%.
All the measurements were considerably below the California
legal limit of 4mg/mile.
Acetaldehyde
All seven results for the cycles (three for US06 and four for
NEDC) show that when using M15 the amount of emitted
acetaldehyde is lower than it is when using RON95.
None of the results shows statistical significance with confidence
of 90%.
RCHO
Of the six results for all the cycles (three each for US06 and
NEDC), four show that the amount of emitted carbonyls is lower
Chapter 5 Emissions Results of Different Alcohol Fuels, Vehicles and Temperatures
116
when using M15 than it is when using RON95. Two results show
that carbonyls for M15 are lower than for RON95.
None of the results shows statistical significance with confidence
of 90%.
Chapter 6 Comparison Results of Different Test Cycles
117
Chapter 6 Comparison Results of Different Test Cycles
This chapter mainly introduces the comparison emissions tests of the
same light-duty vehicle fuelled with E10 fuel during European,
American and Japanese emissions regulations on a chassis
dynamometer, and researches the influences of different driving
cycles on the regulated and unregulated emissions.
Using a light-duty vehicle fuelled with the same fuel, emission tests
during European, American and Japanese emissions regulations were
carried on a chassis dynamometer. FTIR, HPLC and GC-MS methods
were utilized to measure methanol, formaldehyde, acetaldehyde,
acetone, benzene, toluene, xylene, ethylene, propylene, 1,3-butadiene
and isobutylene unregulated emissions in the vehicle exhaust. Due to
the differences of actual driving conditions in each country, the
detailed test parameters of above-mentioned test cycles are
consequently different. The total mileage and total time of the
American FTP75 cycle is the longest. The cycle phases are diverse,
containing cold start stage, transition stage and hot start stage. The
European NEDC cycle consists of two test stages. The cycle
parameter is located in the middle of the three test cycles, combining
the driving conditions in urban area and suburb. Due to the small size
of national territorial area, Japan JC08 cycle mainly indicates the
driving conditions of vehicles in the crowded city. Therefore, the
cycle mileage is short and the test time is long. The average speed
and the maximum speed of Japan cycle are lower than that of
European and American cycles.
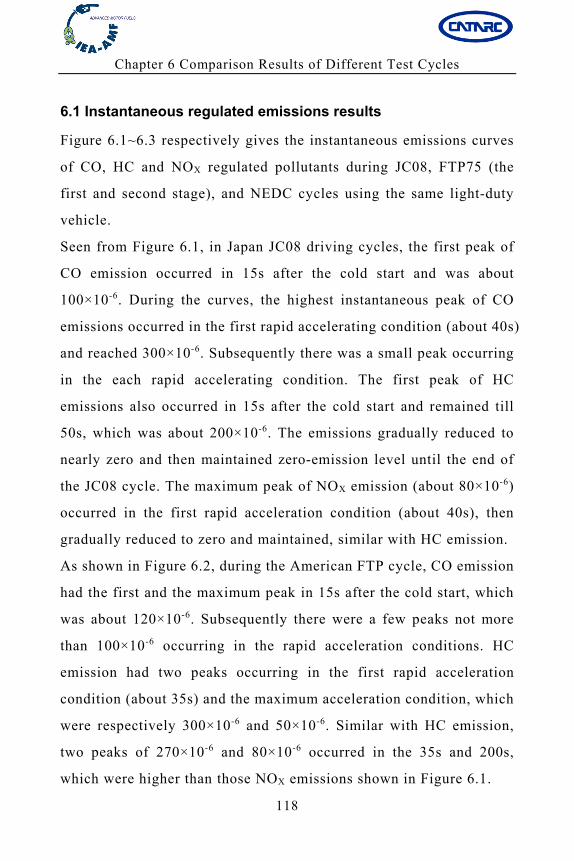
Chapter 6 Comparison Results of Different Test Cycles
118
6.1 Instantaneous regulated emissions results
Figure 6.1~6.3 respectively gives the instantaneous emissions curves
of CO, HC and NOX regulated pollutants during JC08, FTP75 (the
first and second stage), and NEDC cycles using the same light-duty
vehicle.
Seen from Figure 6.1, in Japan JC08 driving cycles, the first peak of
CO emission occurred in 15s after the cold start and was about
100×10-6. During the curves, the highest instantaneous peak of CO
emissions occurred in the first rapid accelerating condition (about 40s)
and reached 300×10-6. Subsequently there was a small peak occurring
in the each rapid accelerating condition. The first peak of HC
emissions also occurred in 15s after the cold start and remained till
50s, which was about 200×10-6. The emissions gradually reduced to
nearly zero and then maintained zero-emission level until the end of
the JC08 cycle. The maximum peak of NOX emission (about 80×10-6)
occurred in the first rapid acceleration condition (about 40s), then
gradually reduced to zero and maintained, similar with HC emission.
As shown in Figure 6.2, during the American FTP cycle, CO emission
had the first and the maximum peak in 15s after the cold start, which
was about 120×10-6. Subsequently there were a few peaks not more
than 100×10-6 occurring in the rapid acceleration conditions. HC
emission had two peaks occurring in the first rapid acceleration
condition (about 35s) and the maximum acceleration condition, which
were respectively 300×10-6 and 50×10-6. Similar with HC emission,
two peaks of 270×10-6 and 80×10-6 occurred in the 35s and 200s,
which were higher than those NOX emissions shown in Figure 6.1.
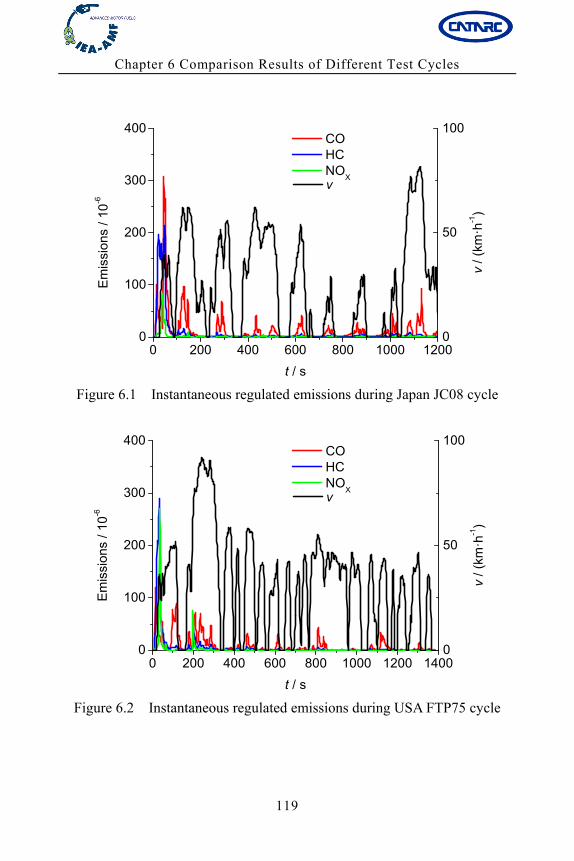
Chapter 6 Comparison Results of Different Test Cycles
119
0 200 400 600 800 1000 12000
100
200
300
400 CO HC NO
X
Em
issi
ons
/ 10
-6
t / s
0
50
100
v
v / (
km·h
-1)
Figure 6.1 Instantaneous regulated emissions during Japan JC08 cycle
0 200 400 600 800 1000 1200 14000
100
200
300
400 CO HC NO
X
Em
issi
ons
/ 10
-6
t / s
0
50
100
v
v / (
km·h
-1)
Figure 6.2 Instantaneous regulated emissions during USA FTP75 cycle
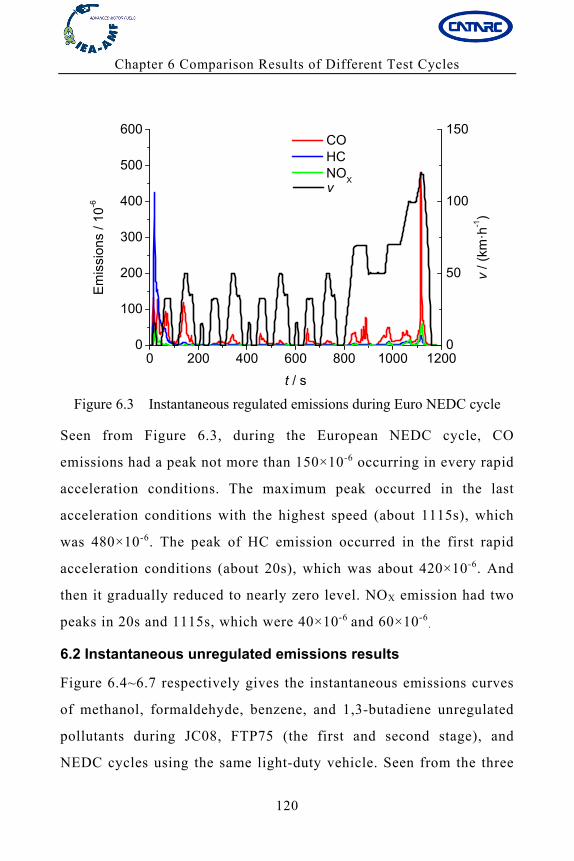
Chapter 6 Comparison Results of Different Test Cycles
120
0 200 400 600 800 1000 12000
100
200
300
400
500
600 CO HC NO
X
Em
issi
ons
/ 1
0-6
t / s
0
50
100
150
v
v /
(km
·h-1)
Figure 6.3 Instantaneous regulated emissions during Euro NEDC cycle
Seen from Figure 6.3, during the European NEDC cycle, CO
emissions had a peak not more than 150×10-6 occurring in every rapid
acceleration conditions. The maximum peak occurred in the last
acceleration conditions with the highest speed (about 1115s), which
was 480×10-6. The peak of HC emission occurred in the first rapid
acceleration conditions (about 20s), which was about 420×10-6. And
then it gradually reduced to nearly zero level. NOX emission had two
peaks in 20s and 1115s, which were 40×10-6 and 60×10-6
.
6.2 Instantaneous unregulated emissions results
Figure 6.4~6.7 respectively gives the instantaneous emissions curves
of methanol, formaldehyde, benzene, and 1,3-butadiene unregulated
pollutants during JC08, FTP75 (the first and second stage), and
NEDC cycles using the same light-duty vehicle. Seen from the three
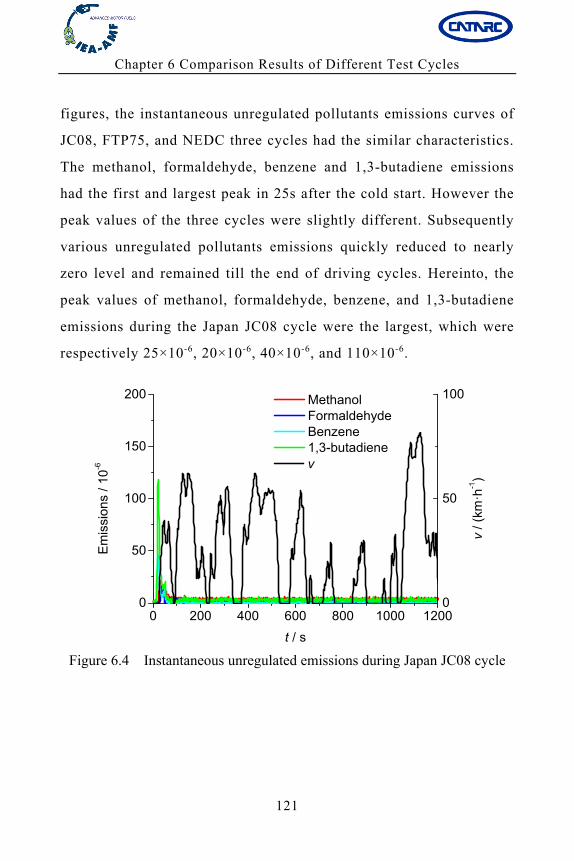
Chapter 6 Comparison Results of Different Test Cycles
121
figures, the instantaneous unregulated pollutants emissions curves of
JC08, FTP75, and NEDC three cycles had the similar characteristics.
The methanol, formaldehyde, benzene and 1,3-butadiene emissions
had the first and largest peak in 25s after the cold start. However the
peak values of the three cycles were slightly different. Subsequently
various unregulated pollutants emissions quickly reduced to nearly
zero level and remained till the end of driving cycles. Hereinto, the
peak values of methanol, formaldehyde, benzene, and 1,3-butadiene
emissions during the Japan JC08 cycle were the largest, which were
respectively 25×10-6, 20×10-6, 40×10-6, and 110×10-6.
0 200 400 600 800 1000 12000
50
100
150
200 Methanol Formaldehyde Benzene 1,3-butadiene
Em
issi
ons
/ 10
-6
t / s
0
50
100
vv
/ (km
·h-1)
Figure 6.4 Instantaneous unregulated emissions during Japan JC08 cycle
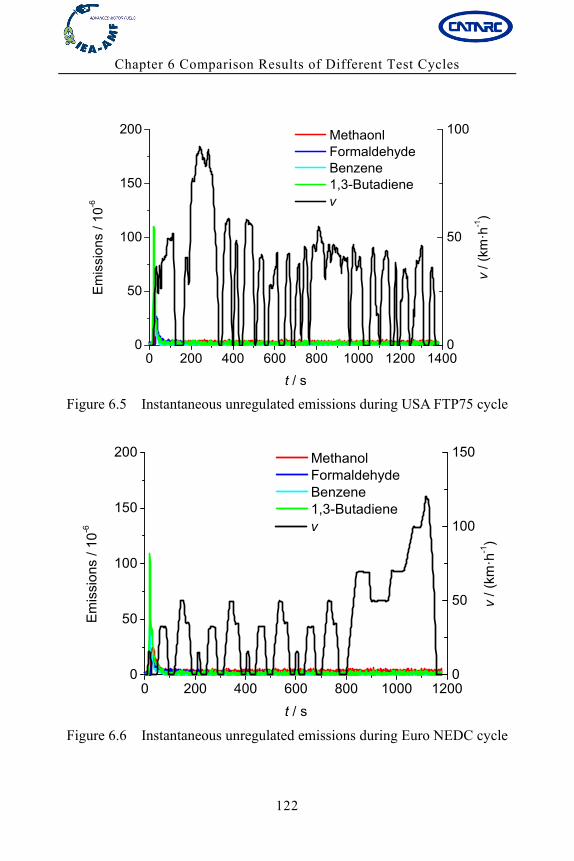
Chapter 6 Comparison Results of Different Test Cycles
122
0 200 400 600 800 1000 1200 14000
50
100
150
200 Methaonl Formaldehyde Benzene 1,3-Butadiene
Em
issi
ons
/ 1
0-6
t / s
0
50
100
v
v /
(km
·h-1)
Figure 6.5 Instantaneous unregulated emissions during USA FTP75 cycle
0 200 400 600 800 1000 12000
50
100
150
200 Methanol Formaldehyde Benzene 1,3-Butadiene
Em
issi
ons
/ 10
-6
t / s
0
50
100
150
v
v /
(km
·h-1)
Figure 6.6 Instantaneous unregulated emissions during Euro NEDC cycle
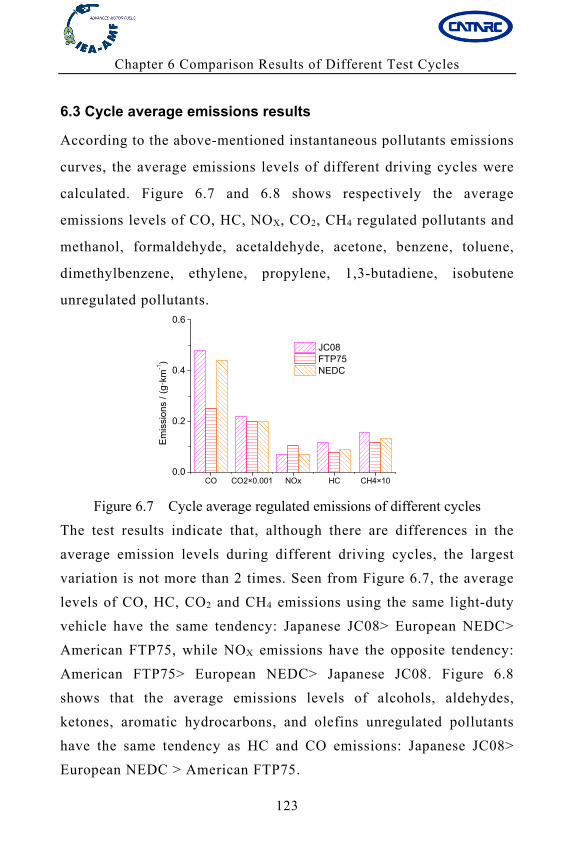
Chapter 6 Comparison Results of Different Test Cycles
123
6.3 Cycle average emissions results
According to the above-mentioned instantaneous pollutants emissions
curves, the average emissions levels of different driving cycles were
calculated. Figure 6.7 and 6.8 shows respectively the average
emissions levels of CO, HC, NOX, CO2, CH4 regulated pollutants and
methanol, formaldehyde, acetaldehyde, acetone, benzene, toluene,
dimethylbenzene, ethylene, propylene, 1,3-butadiene, isobutene
unregulated pollutants.
Figure 6.7 Cycle average regulated emissions of different cycles
The test results indicate that, although there are differences in the
average emission levels during different driving cycles, the largest
variation is not more than 2 times. Seen from Figure 6.7, the average
levels of CO, HC, CO2 and CH4 emissions using the same light-duty
vehicle have the same tendency: Japanese JC08> European NEDC>
American FTP75, while NOX emissions have the opposite tendency:
American FTP75> European NEDC> Japanese JC08. Figure 6.8
shows that the average emissions levels of alcohols, aldehydes,
ketones, aromatic hydrocarbons, and olefins unregulated pollutants
have the same tendency as HC and CO emissions: Japanese JC08>
European NEDC > American FTP75.
CO CO2×0.001 NOx HC CH4×100.0
0.2
0.4
0.6
Em
issi
on
s /
(g·k
m-1)
JC08 FTP75 NEDC
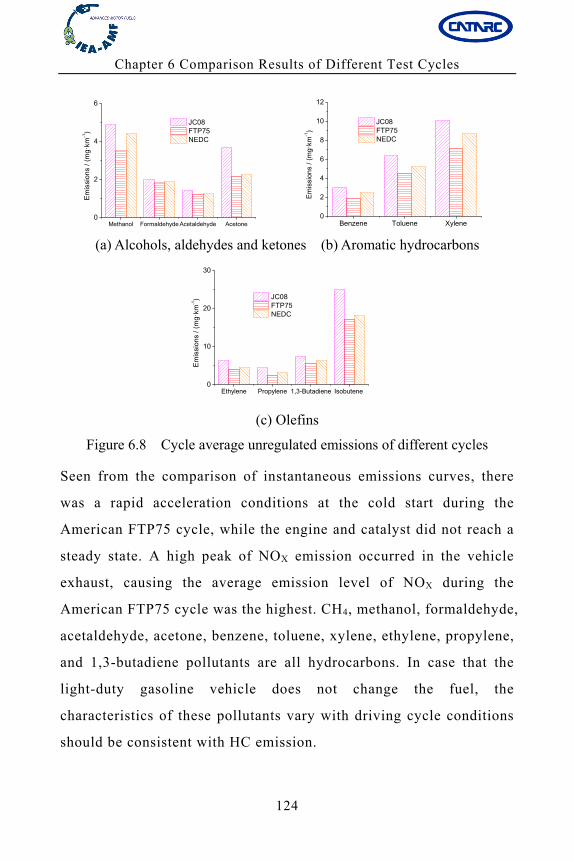
Chapter 6 Comparison Results of Different Test Cycles
124
(a) Alcohols, aldehydes and ketones (b) Aromatic hydrocarbons
(c) Olefins
Figure 6.8 Cycle average unregulated emissions of different cycles
Seen from the comparison of instantaneous emissions curves, there
was a rapid acceleration conditions at the cold start during the
American FTP75 cycle, while the engine and catalyst did not reach a
steady state. A high peak of NOX emission occurred in the vehicle
exhaust, causing the average emission level of NOX during the
American FTP75 cycle was the highest. CH4, methanol, formaldehyde,
acetaldehyde, acetone, benzene, toluene, xylene, ethylene, propylene,
and 1,3-butadiene pollutants are all hydrocarbons. In case that the
light-duty gasoline vehicle does not change the fuel, the
characteristics of these pollutants vary with driving cycle conditions
should be consistent with HC emission.
Methanol Formaldehyde Acetaldehyde Acetone0
2
4
6
Em
issi
ons
/ (
mg·
km-1)
JC08 FTP75 NEDC
Benzene Toluene Xylene0
2
4
6
8
10
12
Em
issi
ons
/ (m
g·k
m-1)
JC08 FTP75 NEDC
Ethylene Propylene 1,3-Butadiene Isobutene 0
10
20
30
Em
issi
ons
/ (
mg·
km-1) JC08
FTP75 NEDC
Chapter 7 Conclusions and Summary
125
Chapter 7 Conclusions and Summary
With the reduction of regulations restricting emissions and the
application of alternative fuels, unregulated emissions in automobile
exhaust have gradually attracted the attention. The hazards of
polycyclic aromatic hydrocarbons, aldehydes, ketones, and olefins on
the environment and human health cannot be ignored. However, the
key issues of measurement methods and quantitative analysis on
unregulated emissions need to conduct in-depth research at this stage.
7.1 Finland results
The effect of test temperature was evident for the most emissions. CO
and HC emissions were higher at -7°C than at +23°C in the cold start
NEDC test, particularly with the MPI car. E85 reduced the CO
emission, but increased HC emissions when compared with E10. The
dominating hydrocarbons present were methane, ethene, xylenes and
acetylene for E85, whereas aromatics, methane and ethene dominated
for E10. Ethanol emission was huge for the E85 fuel at -7°C.
Formaldehyde and acetaldehyde emissions were higher for the E85
fuel than for the E10 fuel in the cold-start NEDC test. Acetaldehyde
was formed in substantial concentrations in 3 minutes after the
cold-start of car, whereas emission level was low with warmed-up
engine.
The NOX emissions were relatively low over the NEDC test and only
small differences between fuels were detected. Surprisingly high NOX
emissions were observed over the hot start FTP75 test, particularly
after a 10 minutes pause. This indicates that cars may be optimised
towards low CO and HC emissions at a cost of increased NOX
Chapter 7 Conclusions and Summary
126
emissions. Nitrogen dioxide and nitrous oxide emissions were mostly
below the detection limit of measurement equipment. In the opposite,
ammonia emissions were substantial. Ammonia concentrations
continuously exceeded 10 ppm, which is a limit value for SCR
equipped heavy-duty engines, and even as high as 300-500 ppm
concentrations were observed. Ammonia is formed by the three-way
catalysts of the spark-ignited cars, and by the use of urea-based SCR
systems for NOX control for diesel vehicles.
PM emissions were low: below 7 mg/km in the NEDC test and below
1 mg/km in the hot-start FTP75 test. However, a slight decrease in
PM emission was observed with increasing ethanol content of fuel.
“Wet” particle number emissions (PN) were higher at -7°C than at
+23°C in the NEDC test and higher for E10 than for E85. Nucleation
tendency was seen for the MPI car, whereas accumulation mode
particles dominated for the DISI car.
E100 was tested only at +23 °C temperature, because the
startability limit of neat ethanol is only around +12 °C. Both
cars experienced serious starting and driveability problems in
the beginning of test with E100, whereas no problems occurred
with warmed-up engine. The overall emissions were higher for
E100 than for E85, though particle mass and number emissions
were low.
E85 fuel typically reduces CO, HC, and NOX emissions compared
with gasoline at normal temperature, but not necessarily at low
temperatures. Excess fuel is injected in cold starts due to the poor
Chapter 7 Conclusions and Summary
127
ignition of ethanol, which tend to increase for example acetaldehyde
emission before the engine is warmed-up at cold temperatures.
Engine and emissions control technology of FFV cars are developing
to overcome elevated cold-start emissions when using the E85 fuel,
but the FFV cars in this study still showed a strong
temperature-dependence. High emissions occurred only for the first
kilometers after a cold-start, however, driving distances for gasoline
cars are generally short in real-life. In sub-zero temperatures, block
heaters could efficiently reduce cold-start emissions.
7.2 Canada results
In general it was found that changes in the emission rates of
pollutants and in fuel consumption due to the use of E10 was
dependent on the drive cycle, test conditions and vehicle technology.
The use of E85 led to reduced TPM, particle number, and tailpipe
CO2 equivalent greenhouse gas emission rates; however these
reductions came with roughly a 30% increase in fuel consumption and
substantial increases in acetaldehyde emissions. The use of E85
lowered the GDI TPM emission rate to a range similar to that of the
PFI.
The emission rates of formaldehyde and acetaldehyde were 3 and
9 times higher respectively with the use of E85 compared to E0 and
tested at 22°C. The increases in emissions of these compounds were
more pronounced at cold temperature, for example acetaldehyde was
roughly two orders of magnitude higher on E85 than on E0 at -18°C.
Chapter 7 Conclusions and Summary
128
BTEX emission rates were approximately 70% to 84% lower with use
of the E85 fuel compared to E0 at 22°C. Reductions in BTEX by
approximately 50% were also observed at -7°C and, to a lesser extent
at-18°C, due to the use of the E85 fuel; however, for the most part,
these reductions were not statistically significant at -18°C due to
sample variability.
The use of E85 also decreased the particle number emission rate by
78% to 90% compared to E0. There was also a shift to a lower
primary peak diameter, from 70-80nm to as low as 34nm at 22°C, due to
the use of E85.
The GDI had better fuel economy and used 14-30% less fuel than the
PFI over the three test cycles. The GDI had higher TPM emission
rates at 22°C but this trend was reversed at cold temperature where
the emission rate of the PFI exceeded that of the GDI. Interestingly
the particle number emission rate of the PFI remained lower than that
of the GDI regardless of the test cell temperature indicating that the
particles emitted by the PFI at cold temperature contributed more
mass than those of the GDI due possibly to a shift to larger particle
sizes.
As expected, decreasing the ambient test temperature led to
increases in the emission rates of almost all measured pollutants.
7.3 China results
Using a light-duty gasoline vehicle fuelled with the same fuel,
emission tests during European, American and Japanese emissions
regulations were carried on a chassis dynamometer. Using two PFI
Chapter 7 Conclusions and Summary
129
vehicles and two GDI vehicles fuelled with pure gasoline, M15, M30
and pure gasoline, E10, E20 separately, 25℃ normal temperature
emission test, -7℃ low temperature emission test and evaporation
emission test were carried on.
Comparing the transient emissions and average emissions during the
driving cycle of major pollutants, the good consistency of MEXA,
FTIR, HPLC and GC-MS measurement methods has been verified.
The deviations of the average regulated and unregulated emissions
measured by various measurement methods are basically in the range
of ± 10%.
From the light-duty gasoline vehicle using alcohols fuels, the
transient emissions of formaldehyde, acetaldehyde, toluene,
propylene and 1,3-butadiene have the highest peak during the first
acceleration condition. Then with the catalyst lights off, the
emissions values gradually reduce to nearly zero and remain until the
end of the driving cycle. In the low as well as normal ambient
temperature, as the alcohols proportion increasing in the fuel, CO2 in
the exhaust emissions remain basically the same, HC, CO and CH4
decrease slightly, NOX increases slightly, unburned methanol,
formaldehyde, acetaldehyde increase proportionally, benzene, toluene,
ethylene, propylene, 1,3-butadiene and isobutene decrease slightly.
The regulated and unregulated emissions in the low ambient
temperature are significantly higher than those in the normal ambient
temperature. The average unregulated emissions levels of GDI and
PFI test vehicles are in the same order of magnitude. The regulated
and unregulated emissions have the good consistency. The difference
Chapter 7 Conclusions and Summary
130
of HC emissions in the entire process of the evaporative emission
tests of E10, gasoline and M15 fuels is slight. Although there is a
difference of unregulated emissions in the diurnal test of three fuels,
the difference is very small.
Although there are differences in the average emission levels from
the same light-duty vehicle during different driving cycles, the largest
variation is not more than 2 times. Opposite with NOX emissions, the
average levels of CO, HC, CO2, CH4, aromatic hydrocarbons,
aldehydes, ketones, and olefins emissions have the same tendency:
Japanese JC08> European NEDC> American FTP75.
7.4 Israel results
Oxygenated fuels tested at this research did not change the amount of
emitted formaldehyde compared to RON95. Oxygenated fuels tested
at this research may decrease the amount of emitted acetaldehyde
compared to RON95. Oxygenated fuels tested at this research did not
change the amount of emitted carbonyls compared to RON95. It is
concluded that using M15 does not have statistically significant
effects on carbonyl emissions.
References
131
References [1] Shangxi Province ”National Methanol Vechile Demonstration Project”
Project Group. Feasibility Report on Promotion of China’s methanol fuel and vehicle[J]. 2005
[2] Charalampos I A, Anastaslos N K, Panagiotis D S. Behavior of a Small Four-Stroke Engine Using as Fuel Methanol-Gasoline Mixtures. SAE Paper 2003-32-0024
[3] Hasan M A. Effect of ethanol-unleaded gasoline blends on engine performance and exhaust emission. Energy Conversion and Management, 2003, 44(9): 1547-1561
[4] Vaughan R B, William J K, Jack D B, et al. Emissions with Reformulated Gasoline and Methanol Blends in 1992 and 1993 Model Year Vehicles. SAE Paper 1994: 941969
[5] Knapp K T, Stump F D, Tejada S B. Effect of ethanol fuel on the emissions of vehicles over a wide range of temperatures. J Air & Waste Management Association, 1998, 48 (7): 646-653
[6] Poulopoulos S G, Samaras D P, Philoppopoulos C J. Regulated and unregulated emissions from an internal combustion engine operating on ethanol containing fuels. Atmospheric Environment, 2001, 35(26): 4399-4406
[7] Yan X, Huang H, Huang X. Evaluation of toxicity and environmental impact of vehicle-used methanol fuel. J Occu Heal Dam, 2004; 19(2): 117-118.
[8] Rutten G A, Burtner C W J, Visser H, et al. The Determination of aldehydes in the exhaust gases of LPG fulled engines. Chromatographia, 1998(26): 274-280
[9] Sergio M C, Graciela A. Carbonyl emissions in diesel and biodiesel exhaust. Atmospheric Environment, 2007, 41: 5436-5441
[10] Wei Yanju, Liu Shenghua, Li Hongsong, et al. Effects of Methanol/Gasoline Blends on a Spark Ignition Engine Performance and Emissions. Energy & Fuels, 2008(22): 1254-1259
[11] Liu Shenghua, Eddy R. Cuty Clemente, Hu Tiegang, et al. Study of spark igntion engine fueled with methanol/gasoline fuel blends. Applied Thermal Engineering, 2007(27): 1904-1910
[12] Wei Yanju, Liu Shenghua, Liu Fangjie, et al. Formaldehyde and Methanol Emissions from a Methanol/Gasoline-Fueled Spark-Ignition (SI) Engine. Energy & Fuels, 2009(23): 3313-3318
References
132
[13] Charlotte S, Lennart E, Jan G, et al. Measurement Methodologies for Hydrocarbons, Ethanol and Aldehyde Emissions from Ethanol Fuelled Vehicles. SAE Paper 2010-01-1557.
[14] Zhang, Z., Fang, G., Song, C. et al., "Unregulated Emissions Characteristics from SI Electronic Control Methanol Engine," Journal of Combustion Science and Technology, 2006, 12(1): 86-89, doi:CNKI:SUN:RSKX. 0.2006-01-018.
[15] Zhang, H., Li, J., Wang, L. et al., "Measurement of formaldehyde emission from an engine fuelled by gasoline-methanol blends," Journal of Jilin University (Engineering and Technology Edition), 2008, 38(1):32-36, doi: CNKI:SUN:JLGY.0.2008-01-007.
[16] Kelly, K., Bailey, B., Coburn, T., Clark, W. et al., "FTP Emissions Test Results from Flexible-Fuel Methanol Dodge Spirits and Ford Econoline Vans," SAE Technical Paper 961090, 1996, doi:10.4271/961090.
[17] Ge, Y., You, K., Wang, J. et al., "A Study on Exhaust Emission from Methanol Vehicle," Transactions of Beijing Institute of Technology, 2008, 28(4):314-318, doi: CNKI:SUN:BJLG.0.2008-04-010.
[18] Zhang, F., Zhang, X., Shuai, S. et al., "Unregulated Emissions and Combustion Characteristics of Low-Content Methanol−Gasoline Blended Fuels," Energy Fuels, 2010, 24 (2):1283–1292, doi:10.1021/ef900974p.
[19] Liu, F., Wei, Y., Liu, S. et al., "Unregulated Emissions and Their Three-Way Catalytic Conversion of a Spark Ignition Engine Fueled with Ethanol-Gasoline," Journal of Xi'an Jiaotong University, 2010, 44(1):13-16, doi: CNKI:SUN:XAJT.0.2010-01-005.
[20] He, B., Wang, J., Hao, J. et al., "A study on emission characteristics of an EFI engine with ethanol blended gasoline fuels," Atmospheric Environment, 2003, 37(7):949-957, doi:10.1016/S1352-2310(02)00973-1.
[21] Dong, S., Song, C., Zhao, C. et al., "Unregulated Emissions from Gasoline Engine Using Ethanol-Blended Gasoline as Fuels," Journal of Tianjin University, 2006, 39(1):68-72, doi:CNKI:SUN:TJDX.0.2006-01-016.
[22] Aakko, P. and Nylund, N.-O. (2003) Particle emissions at moderate and cold temperatures using different fuels. Warrendale: Society of Automotive Engineers. SAE Paper 2003-01-3285.
[23] Aakko-Saksa, P., Rantanen-Kolehmainen, L., Koponen, P., Engman, A. and Kihlman, J. (2011) Biogasoline options – Possibilities for achieving high bio-share and compatibility with conventional cars.
References
133
SAE International Journal of Fuels and Lubricants, 4:298–317 (also SAE Technical Paper 2011 24-0111). Full technical report: http://www.vtt.fi/inf/pdf/workingpapers/2011/W187.pdf
[24] Alhajeri, N.S., McDonald-Buller, E.C., Allen, D.T. (2012) Impacts of replacement of gasoline and diesel with biofuels on ozone concentrations: a central Texas case study. Air and Waste Management Association Annual Conference and Exhibition, 105th, San Antonio, TX, United States, June 19-22, 2012 (2012), 2, 1323-1327.
[25] Chiba, F., Ichinose, H., Morita, K., Yoshioka, M., Noguchi, Y. and Tsugagoshi, T. High Concentration Ethanol Effect on SI Engine Emissions (2010) SAE Technical Paper 2010-01-1268.
[26] Clairotte, M., Adam, T. W., Zardini, A. A., Manfredi, U., Martini, G., Krasenbrink, A., Vicet, A., Tournie, E. and Astorga, C. (2013) Effects of low temperature on the cold start gaseous emissions from light duty vehicles fueled by ethanol-blended gasoline. Applied Energy (2013), 102, 44-54. DOI:10.1016/j.apenergy.2012.08.010.
[27] CRFA (2003) Canadian Renewable Fuels Association Website. http://www.greenfuels.org.
[28] De Serves, C. (2005) Emissions from Flexible Fuel Vehicles with different ethanol blends. AVL MTC AB, Sweden. Report No AVL MTC 5509. Online http://www.senternovem.nl/mmfiles/Emissions%20from%20flexible%20fuel%20vehicles_tcm24 280163.pdf.
[29] E85 Handbook (2010) Handbook for Handling, Storing, and Dispensing E85. US Department of Energy. DOE/GO-102010-3073.
[30] European Environment Agency (2012a) Air quality in Europe — 2012 report. EEA Report No 4/2012.
[31] European Environment Agency (2012b) The contribution of transport to air quality. EEA Report No 10/2012.
[32] Fridell, E., Haeger-Eugensson, M. Moldanova, J. Forsberg, B. and Sjoeberg, K. (2014) A modelling study of the impact on air quality and health due to the emissions from E85 and petrol fuelled cars in Sweden. Atmospheric Environment (2014), 82, 1-8. DOI:10.1016/j.atmosenv.2013.10.002
[33] Gaffney, J.S. and Marley, N.A. Beyond ozone and carbon dioxide: Ethene and its potential ecosystem impacts from biomass burning and ethanol biofuels. Abstracts, 67th Southwest Regional Meeting of the American Chemical Society, Austin, TX, United States, November 9-12 (2011), SWRM-231.
References
134
[34] Ginnebaugh, D.L. and Jacobson, M.Z. (2012) Examining the impacts of ethanol (E85) versus gasoline photochemical production of smog in a fog using near-explicit gas- and aqueous-chemistry mechanisms. Environmental Research Letters (2012), 7(4), 045901, 8 pp. DOI:10.1088/1748-9326/7/4/045901
[35] Graham, L., Belisle, S. and Baas, C.-L. (2008) Emissions from light duty gasoline vehicles oper-ating on low blend ethanol gasoline and E85. Atmospheric Environment 42(2008) 4498–4516.
[36] Haskew, H. and Liberty, T. (2006) Fuel permeation from automotive systems: E0, E6, E10, E20 and E85. Final report. CRC Project No. E-65-3.
[37] Hays, M.D., Preston, W., George, B.J., Schmid, J., Baldauf, R., Snow, R., Robinson, J.R., Long, T. and Faircloth, J. (2013) Carbonaceous Aerosols Emitted from Light-Duty Vehicles Operating on Gasoline and Ethanol Fuel Blends. Environmental Science & Technology (2013), 47(24), 14502-14509. DOI:10.1021/es403096v.
[38] Heeb N.V., Saxer C.J. et al. Correlation of hydrogen, ammonia and nitrogen monoxide (nitric oxide) emissions of gasoline-fueled Euro-3 passenger cars at transient driving. Atmospheric Environment, Vol 40, 2006, pp. 3750-3763.
[39] Huo, H., Wu, Y. and Wang, M. Total versus urban: Well-to-wheels assessment of criteria pollutant emissions from various vehicle/fuel systems. Atmospheric Environment (2009), 43(10), 1796-1804. DOI:10.1016/j.atmosenv.2008.12.025.
[40] IARC (1999). Re-evaluation of some organic chemicals, hydrazine and hydrogen peroxide. IARC Monogr Eval Carcinog Risks Hum, 71: 1–315. PMID:10507919
[41] IARC (2010). Some non-heterocyclic polycyclic aromatic hydrocarbons and some related exposures. IARC Monogr Eval Carcinog Risks Hum, 92: 1–853. PMID:21141735.
[42] IARC (2012). Arsenic, metals, fibres, and dusts. IARC Monogr Eval Carcinog Risks Hum, 100C: 1–499. PMID:23189751
[43] Jacobson, M. (2007) Effects of Ethanol (E85) versus Gasoline Vehicles on Cancer and Mortality in the United States. Environ. Sci. Technol. 2007, 41, 4150–4157.
[44] Karavalakis, G., Durbin, T., Shrivastava, M., Zheng, Z., Villela, M., Jung, H. (2012) Impacts of ethanol fuel level on emissions of regulated and unregulated pollutants from a fleet of gasoline light-duty vehicles. Fuel (2012), 93, 549-558. DOI:10.1016/j.fuel.2011.09.021.
References
135
[45] Karlsson, H., Gåste, J. and Åsman, P. (2008) Regulated and non-regulated emissions from Euro 4 alternative fuel vehicles. Society of Automotive Engineers. Warrendale. Tech-nical Paper 2008-01-1770.
[46] Kassel, R. (2006) An Environmental Perspective: EPA’s RFS Proposal. Presentation in the meet-ing of Mobile Sources Technical Review Subcommittee (MSTRS), October 4, 2006.
[47] Laurikko, J., Nylund, N-O., Aakko-Saksa, P. (2013) High-volume ethanol fuel composition optimized for cold driving conditions. Warrendale: Society of Automotive Engineers. SAE Technical Papers 2013-01-2613. doi-link: 10.4271/2013-01-2613.
[48] Li, W., Perry, K., Narayanaswamy, K., Kim, C. et al., (2010) Passive Ammonia SCR System for Lean-burn SIDI Engines, SAE Int. J. Fuels Lubr. 3(1):99-106, 2010, doi:10.4271/2010-01-0366.
[49] Mejia-Centeno, I., Martínez-Hernández, A. and Fuentes, G. (2007) Effect of low-sulfur fuels upon NH3 and N2O emission during operation of commercial three-way catalytic converters. Topics in Catalysis. Vols. 42–43, May 2007.
[50] Millet, D.B., Apel, E., Henze, D., Hill, J., Marshall, J.D., Singh, H.B. and Tessum, C.W. (2012) Natural and Anthropogenic Ethanol Sources in North America and Potential Atmospheric Impacts of Ethanol Fuel Use. Environmental Science & Technology (2012), 46(15), 8484-8492. DOI:10.1021/es300162u.
[51] Nopmongcol, U., Griffin, W.M., Yarwood, G., Dunker, A.M., MacLean, H.L., Mansell, G. and Grant, J. (2011) Impact of dedicated E85 vehicle use on ozone and particulate matter in the US. Atmospheric Environment (2011), 45(39), 7330-7340. DOI:10.1016/j.atmosenv.2011.07.057.
[52] The Nordic Ecolabelling (2008) Swan labeling of fuels. Version 1.0. 25 June 2008 – 30 June 2010.
[53] OEHHA (2009) Technical support document for cancer potency factors. California Environmental Protection Agency. Office of Environmental Health Hazard Assessment. May 2009.
[54] Querini F, Béziat JC, Morel S, Boch V, Rousseaux P (2011) Life cycle assessment of automotive fuels: critical analysis and recommendations on the emissions inventory in the tank to wheels stage. Int J Life Cycle Assess 16:454–464.
[55] Stahl, W. and Stevens, R. (1992) Fuel-alcohol permeation rates of fluoroelastomers fluoroplastics, and other fuel resistant materials. SAE
References
136
Technical Paper 920163. Referred to in Kassel (2006) An Environmental Perspective: EPA’s RFS Proposal.
[56] Szybist, J.P., Youngquist, A.D., Baronet, T.L., Storey, J.M., Moore, W.R., Foster, M. and Confer, K. (2011) Ethanol Blends and Engine Operating Strategy Effects on Light-Duty Spark-Ignition Engine Particle Emissions. Energy & Fuels (2011), 25(11), 4977-4985. DOI:10.1021/ef201127y
[57] US EPA (2007) 40 CFR Parts 59, 80, 85, and 86, Control of Hazardous Air Pollutants From Mobile Sources. Final Rule. 26 February 2007.
[58] US EPA IRIS (2010) Integrated Risk Information System (IRIS). http://www.epa.gov/IRIS/. Data as of September 2010.
[59] Westerholm, R., Ahlvik, P. and Karlsson, H.L. (2008) An exhaust characterization study based on regulated and unregulated tailpipe and evaporative emissions from bi-fuel and flexi-fuel light-duty passenger cars fuelled by petrol (E5), bioethanol (E70, E85) and biogas tested at ambient temperatures of +22 °C and 7 °C. Final Report to the Swedish Road Administration, March 2008.
[60] Winkler, A., Eyssler, A., Magli, A., Liati, A., Dimopoulos, E.P., Bach, C. (2013) Fuel impact on the aging of TWC's under real driving conditions. Fuel (2013), 111, 855-864. DOI:10.1016/j.fuel.2013.04.014
[61] Winther, M., Møller, F. and Jensen, T. C. Emission consequences of introducing bio ethanol as a fuel for gasoline cars. Atmospheric Environment, Volume 55, August 2012, Pages 144–153.
[62] Yang, Y., Bae, J., Kim, J. and Suh, S. (2012) Replacing Gasoline with Corn Ethanol Results in Significant Environmental Problem-Shifting. Environ. Sci. Technol. 2012, 46, 3671-3678. doi: 10.1021/es203641p
[63] Yanowitz, J. and McCormick, R. (2009) Effect of E85 on tailpipe emissions from light-duty vehicles. J. Air & Waste Manage. Assoc. 59(2009)172–182.
[64] Mamakos, A., and U. Manfredi, 2012. Physical characteristics of exhaust particle emissions from late technology gasoline vehicles. JRC Scientific and Policy Reports, EUR 25302 EN, doi:10.2788/32371.
[65] Szybist J., Youngquist A., Barone T., Storey J., Moore W., Foster M. and Confer K. (2011). Ethanol Blends and Engine Operating Strategy Effects on Light-Duty Spark-Ignition Engine Particle Emissions. Energy & Fuels, 25: 4977–4985.
References
137
[66] Chan, T. W.; Meloche, E.; Kubsh, J.; Brezny, R.; Black Carbon Emissions in Gasoline Exhaust and a Reduction Alternative with a Gasoline Particulate Filter. Environ. Sci. Technol. 2014 Article ASAP. (web) April 23, 2014.
[67] ERMS Report #12-13 2012 Mazda 3 GASOLINE DIRECT INJECTION/ETHANOL BLENDS CAMPAIGN: ecoTECHNOLOGY for Vehicles II Program
[68] ERMS Report #12-16 ECOTECHNOLOGY FOR VEHICLES II PROGRAM, GASOLINE DIRECT INJECTION/ETHANOL BLENDS CAMPAIGN - Kias
[69] Rutten G A, Burtner C W J, Visser H, et al. The Determination of aldehydes in the exhaust gases of LPG fulled engines. Chromatographia, 1998(26): 274-280
[70] Robert Edwards, et al. Well-to-Wheels Analysis of Future Automotive Fuels and Powertrains in the European Context. SAE Paper 2004: 2004-01-1924
[71] Sergio M C, Graciela A. Carbonyl emissions in diesel and biodiesel exhaust. Atmospheric Environment, 2007, 41: 5436-5441
[72] Kenichi ITO, Toshiaki YANO, Ryo NAGASAKA. Unburned Methanol and Formaldehyde in Exhaust Gases from a Methanol Fueled S.I. Engine. Bulletin of the JSME, 1982, 210(25): 1938-1944
[73] C H Schleyer, W J Koehl. Comparison of Gasoline and Methanol Vehicle Emissions Using VOC Reactivity. SAE Paper 1990: 902095
[74] Vaughan R. Burns, William J. Koehl, Jack D. Benson, et al. Emissions with Reformulated Gasoline and Methanol Blends in 1992 and 1993 Model Year Vehicles. SAE Paper 1994: 941969
[75] Kenneth J Kelly, Brent K Bailey, Timothy C Coburn, et al. FTP Emissions Test Results from Flexible-Fuel Methanol Dodge Spirits and Ford Econoline Vans. SAE Paper 1996: 961090
[76] Lynd L R. Overview and Evaluation of Fuel Ethanol from Cellulosic Biomass: Technology, Economics, the Environment, and Policy. Annual Review of Energy and the Environment, 1996, 21: 403-465
[77] Kar K, Cheng W K. Speciated Engine-Out Organic Gas Emissions from a PFI-SI Engine Operating on Ethanol/Gasoline Mixtures. SAE Paper 2009-01-2673
[78] Zervas E, Montagne X, Lahaye J. Emission of alcohols and carbonyl compounds from a spark ignition engine: influence of fuel and air/ fuel equivalence ratio. Environ. Sci. Technol., 2002,36(11): 2414-2421
References
138
[79] Ecotraffic. (2006). INTROMET - Introduction of methanol as motor fuel. Eskilstuna: The Swedish Energy Authority.
[80] Bertilsson, & Egebäck. (1978). Comparative emission tests on vehicles fuelled with gasoline and gasoline mixed with methanol. Automotive emissions group. Studsvik and SMAB, BIL-99, 1978-02-01.
[81] Bertilsson, B. (1983). Environmental risk in handling alternative fuels, In Swedish.
[82] Britt-Marie Bertilsson et al., K.-E. E. (1978-02-01). Comparative emission tests on vehicles fuelled with gasoline and gasoline mixed with methanol. Studsvik: Automotive emissions group Studsvik, and SMAB, BIL-99.
[83] Aakko-Saksa, P. Murtonen, T., Roslund, P., Koponen, P., Nuottimäki, J., Karjalainen, P., Rönkkö, T., Timonen, H., Saarikoski, S. and Hillamo, R. Research on Unregulated Pollutants Emissions of Vehicles Fuelled with Alcohol Alternative Fuels - VTT's contribution to the IEA-AMF Annex 44. 2014, Research Report: VTT-R-03970-14.
[84] Aakko-Saksa, P., Murtonen, T., Koponen, P., Lehtoranta, K., Roslund, P., Karjalainen, P., Rönkkö, T., Timonen, H., Saarikoski, S., Hillamo, R. Nitrogen containing exhaust emissions for consideration in the aerosol research. Aerosol Technology, 2015, 15 - 17 June 2015, Tampere, Finland.
[85] Karjalainen, P., Timonen, H., Saukko, E., Kuuluvainen, H., Saarikoski, S., Aakko-Saksa, P., Murtonen, T., Dal Maso, M., Ahlberg, E., Svenningsson, B., Brune, W. H., Hillamo, R., Keskinen, J. and Rönkkö, T. Time-resolved characterization of primary and secondary particle emissions of a modern gasoline passenger car. Atmos. Chem. Phys. Discuss., 2015, 15: 33253-33282.
[86] Karjalainen, P., Arffman, A., Murtonen, T., Aakko-Saksa, P., Pirjola, L., Niemi, S., Keskinen, J. and Rönkkö, T. Real-time exhaust particle measurements with a high-resolution low-pressure cascade impactor. 2015, 19th ETH Conference on Combustion Generated Nanoparticles, June 28th - July 1st, 2015, ETH Zentrum, Zürich, Switzerland, 015_ETH-NPC-19.