Embed Size (px)
Citation preview
Budgeting for Results
IDOC Post-Secondary Education Program Assessment
2
Introduction The statute that created Budgeting for Results (BFR) states that in Illinois, budgets submitted and appropriations made must adhere to a method of budgeting where priorities are justified each year according to merit (Public Act 96-958). The BFR Commission, established by the same statute, has worked since 2011 to create and implement a structure for data-driven program assessment useful to decision makers. The BFR framework utilizes the Results First benefit-cost model and the State Program Assessment Rating Tool to produce comprehensive assessments of state funded programs. The Pew-MacArthur Results First Initiative developed a benefit-cost analysis model based on methods from the Washington State Institute for Public Policy (WSIPP). The Results First benefit-cost model can conduct analysis on programs within multiple policy domains including; adult crime, juvenile justice, substance use disorders, K-12 education, general prevention, health, higher education, mental health, and workforce development. The State Program Assessment Rating Tool (SPART) combines both quantitative (benefit-cost results) and qualitative components in a comprehensive report. It is based on the federal Program Assessment Rating Tool (PART) developed by the President’s Office of Management and Budget and has been modified for state use. The SPART provides a universal rating classification to allow policy makers and the public to more easily compare programs and their performance across results areas. Methods BFR begins each assessment by modeling an Illinois program’s design and assessing its implementation. Each program is then matched with an existing rigorously studied program or policy. BFR completes a comprehensive review of related program literature to inform the modeling and matching process. Each rigorously studied program has an effect size determined from existing validated research that summarizes the extent to which a program impacts a desired outcome. The effect size is useful in understanding the impact of a program run with fidelity to best practices or core principles. The Results First benefit-cost model uses the effect size combined with the state’s unique population and resource characteristics to project the optimal return on investment that can be realized by taxpayers, victims of crime, and others in society when program goals are achieved. The SPART contains summary program information, historical and current budgetary information, the statutory authority for the program, performance goals and performance measures. The SPART tool consists of weighted questions, which tally to give a program a numerical score of 1-100. Numerical scores are converted into qualitative assessments of program performance: effective, moderately effective, marginal and not effective.
3
Section 1
Results First Benefit-Cost Report
4
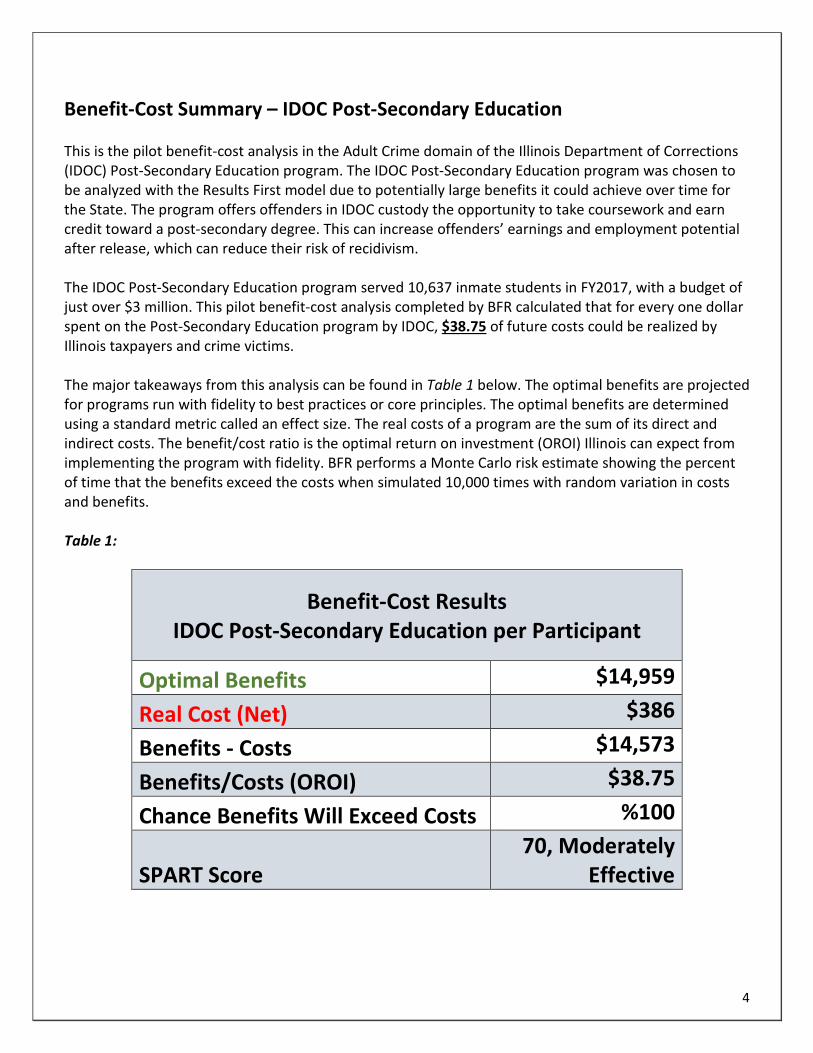
Benefit-Cost Summary – IDOC Post-Secondary Education This is the pilot benefit-cost analysis in the Adult Crime domain of the Illinois Department of Corrections (IDOC) Post-Secondary Education program. The IDOC Post-Secondary Education program was chosen to be analyzed with the Results First model due to potentially large benefits it could achieve over time for the State. The program offers offenders in IDOC custody the opportunity to take coursework and earn credit toward a post-secondary degree. This can increase offenders’ earnings and employment potential after release, which can reduce their risk of recidivism. The IDOC Post-Secondary Education program served 10,637 inmate students in FY2017, with a budget of just over $3 million. This pilot benefit-cost analysis completed by BFR calculated that for every one dollar spent on the Post-Secondary Education program by IDOC, $38.75 of future costs could be realized by Illinois taxpayers and crime victims. The major takeaways from this analysis can be found in Table 1 below. The optimal benefits are projected for programs run with fidelity to best practices or core principles. The optimal benefits are determined using a standard metric called an effect size. The real costs of a program are the sum of its direct and indirect costs. The benefit/cost ratio is the optimal return on investment (OROI) Illinois can expect from implementing the program with fidelity. BFR performs a Monte Carlo risk estimate showing the percent of time that the benefits exceed the costs when simulated 10,000 times with random variation in costs and benefits. Table 1:
Benefit-Cost Results IDOC Post-Secondary Education per Participant
Optimal Benefits $14,959
Real Cost (Net) $386
Benefits - Costs $14,573
Benefits/Costs (OROI) $38.75
Chance Benefits Will Exceed Costs %100
SPART Score 70, Moderately
Effective
5
Benefit-Cost Detail – IDOC Post-Secondary Education Program Information The IDOC Post-Secondary Education program offers inmates the opportunity to take post-secondary academic classes for credit. One of the primary outcomes this program was implemented to achieve is a reduction in recidivism among offenders released from IDOC custody. Using program information gathered with IDOC, BFR determined that Illinois’ Post-Secondary Education program matched the Corrections-Based Adult Basic/Secondary Education practice profile in the CrimeSolutions.gov clearinghouse. The program information for Post-Secondary Education in Illinois was provided by the Office of Adult Education and Vocational Services (OAEVS) at IDOC, and is described in Table 2 below. Table 2:
Program Name Program Description
Post-Secondary Education
- In FY2017, 10,637 inmate students participated in post-secondary academic classes
- Available course options include Baccalaureate, Business, Technical, and Health
- The cost IDOC pays for credit hours ranges from $25 for a Baccalaureate class to $45 for a Health class. IDOC pays for teachers and for any necessary equipment.
- The average cost per person in FY2017 was $386 per year - Due to a shortage of community college partners, post-
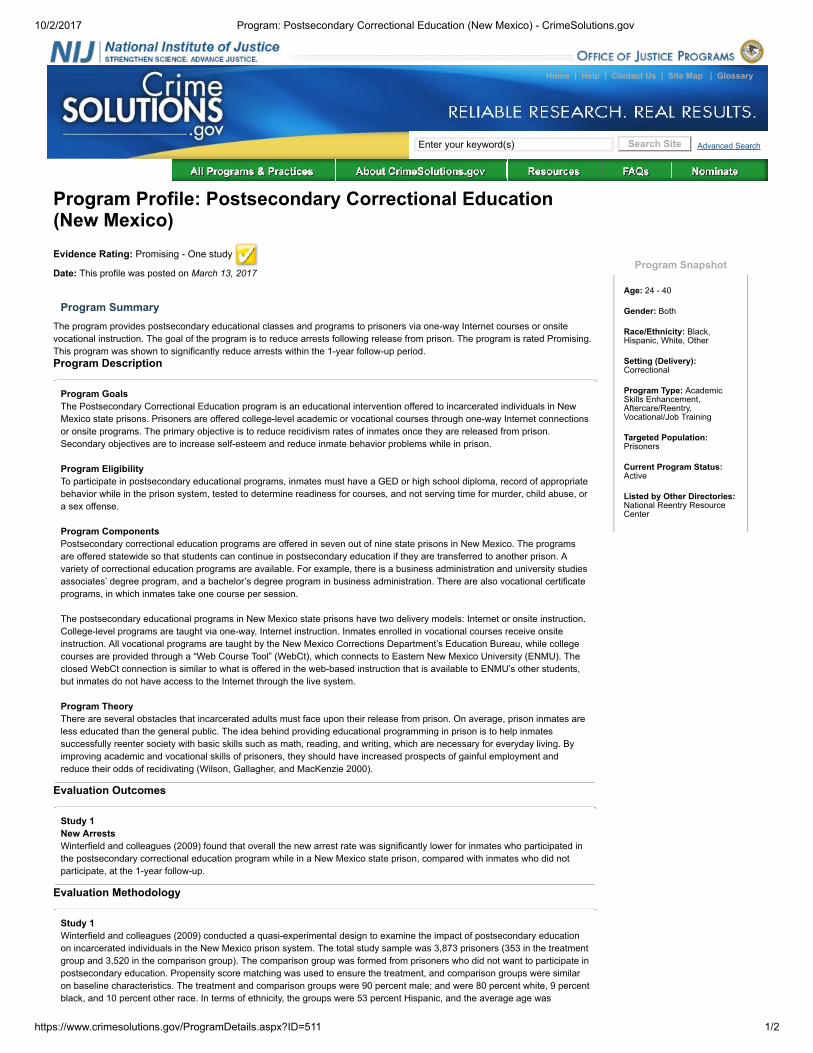
secondary education is not available at all IDOC facilities The clearinghouse rated this type of program as “effective, promising” based on three meta-analyses, each of approximately one dozen individual experimental and quasi-experimental studies. The clearinghouse studies found that “there were significant reductions in recidivism (including reoffending, rearrest, reconviction, reincarceration, and technical parole violation) for inmates who participated in postsecondary correctional education (PSCE) compared with inmates who did not participate.”1
1 Crime Solutions (https://www.crimesolutions.gov/ProgramDetails.aspx?ID=511)
6
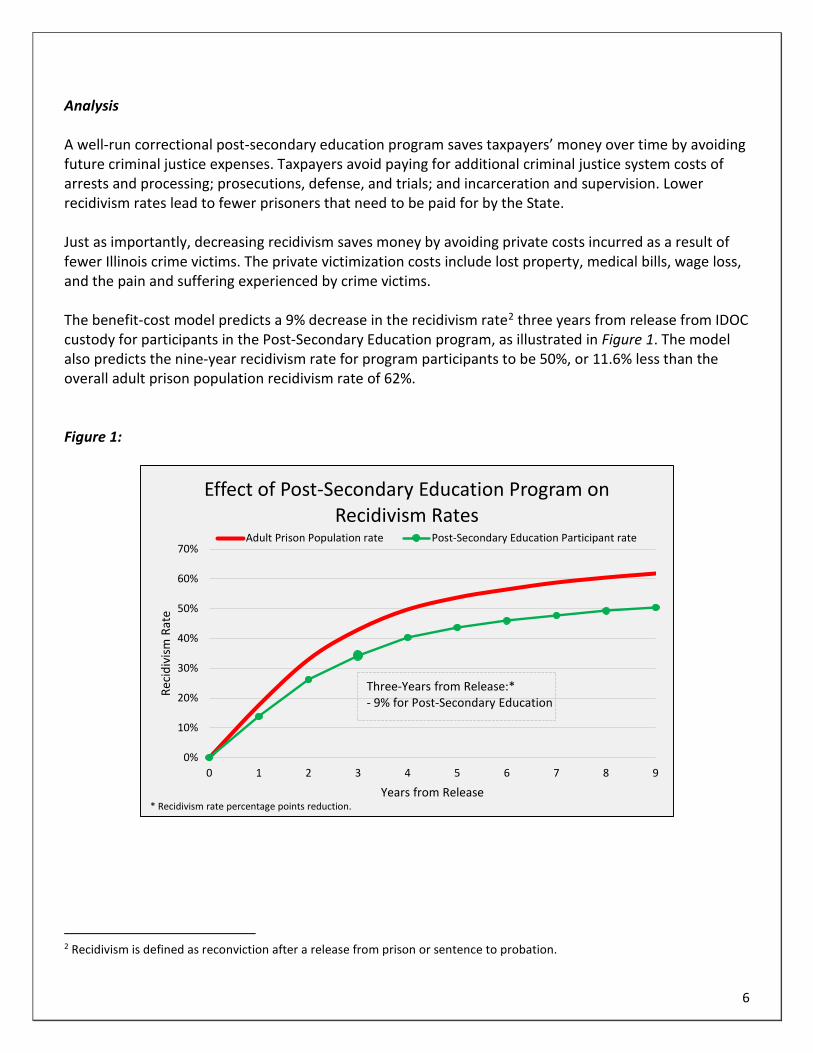
Analysis A well-run correctional post-secondary education program saves taxpayers’ money over time by avoiding future criminal justice expenses. Taxpayers avoid paying for additional criminal justice system costs of arrests and processing; prosecutions, defense, and trials; and incarceration and supervision. Lower recidivism rates lead to fewer prisoners that need to be paid for by the State. Just as importantly, decreasing recidivism saves money by avoiding private costs incurred as a result of fewer Illinois crime victims. The private victimization costs include lost property, medical bills, wage loss, and the pain and suffering experienced by crime victims. The benefit-cost model predicts a 9% decrease in the recidivism rate2 three years from release from IDOC custody for participants in the Post-Secondary Education program, as illustrated in Figure 1. The model also predicts the nine-year recidivism rate for program participants to be 50%, or 11.6% less than the overall adult prison population recidivism rate of 62%. Figure 1:
2 Recidivism is defined as reconviction after a release from prison or sentence to probation.
0%
10%
20%
30%
40%
50%
60%
70%
0 1 2 3 4 5 6 7 8 9
Reci
divi
sm R
ate
Years from Release
Effect of Post-Secondary Education Program on Recidivism Rates
Adult Prison Population rate Post-Secondary Education Participant rate
Three-Years from Release:*- 9% for Post-Secondary Education
* Recidivism rate percentage points reduction.
7
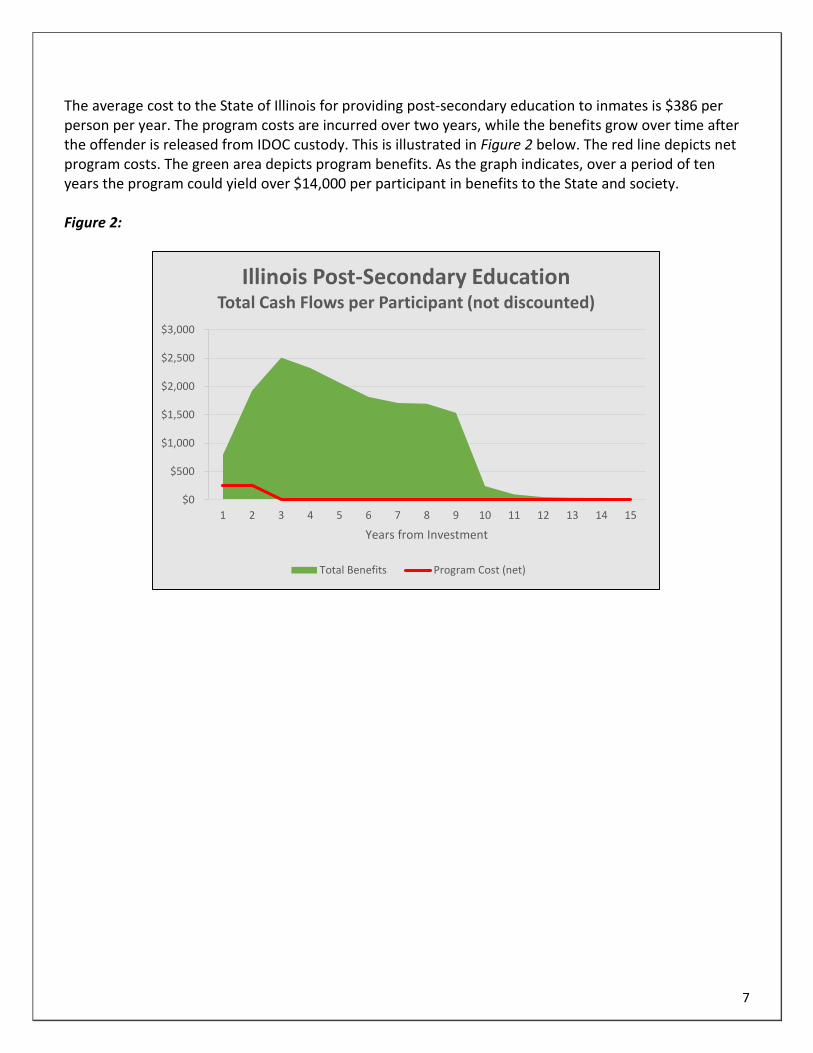
The average cost to the State of Illinois for providing post-secondary education to inmates is $386 per person per year. The program costs are incurred over two years, while the benefits grow over time after the offender is released from IDOC custody. This is illustrated in Figure 2 below. The red line depicts net program costs. The green area depicts program benefits. As the graph indicates, over a period of ten years the program could yield over $14,000 per participant in benefits to the State and society. Figure 2:
$0
$500
$1,000
$1,500
$2,000
$2,500
$3,000
1 2 3 4 5 6 7 8 9 10 11 12 13 14 15
Years from Investment
Illinois Post-Secondary EducationTotal Cash Flows per Participant (not discounted)
Total Benefits Program Cost (net)
8
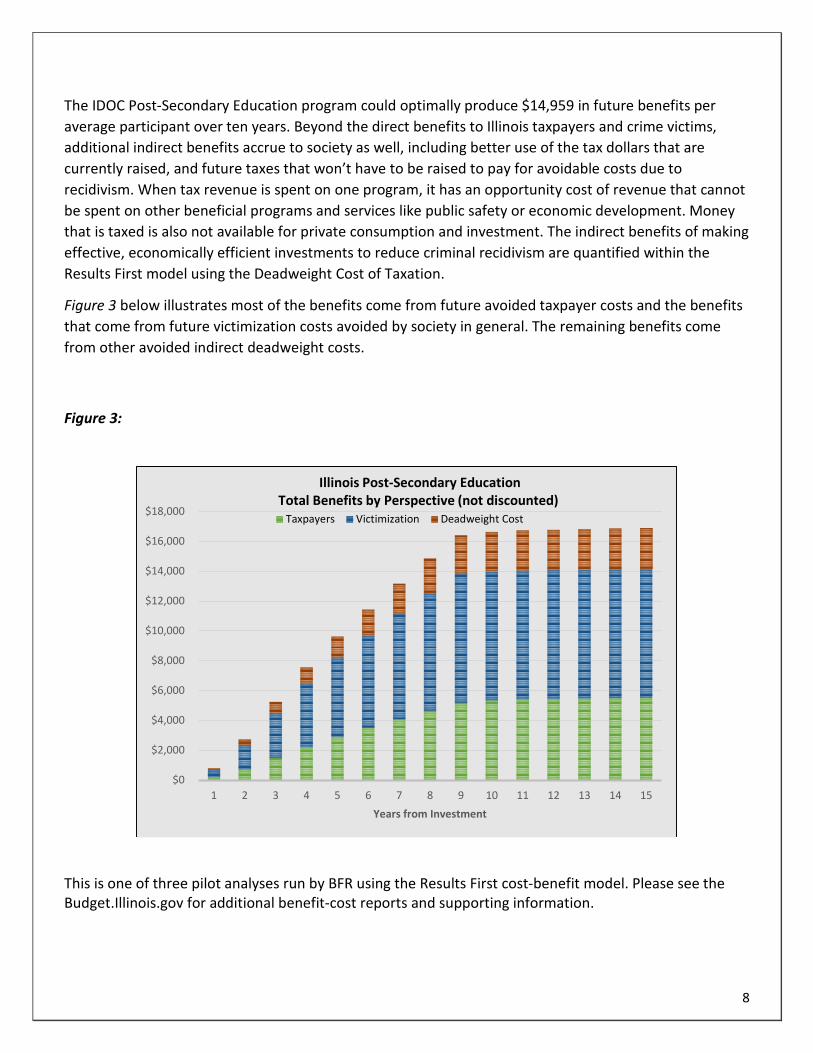
The IDOC Post-Secondary Education program could optimally produce $14,959 in future benefits per average participant over ten years. Beyond the direct benefits to Illinois taxpayers and crime victims, additional indirect benefits accrue to society as well, including better use of the tax dollars that are currently raised, and future taxes that won’t have to be raised to pay for avoidable costs due to recidivism. When tax revenue is spent on one program, it has an opportunity cost of revenue that cannot be spent on other beneficial programs and services like public safety or economic development. Money that is taxed is also not available for private consumption and investment. The indirect benefits of making effective, economically efficient investments to reduce criminal recidivism are quantified within the Results First model using the Deadweight Cost of Taxation.
Figure 3 below illustrates most of the benefits come from future avoided taxpayer costs and the benefits that come from future victimization costs avoided by society in general. The remaining benefits come from other avoided indirect deadweight costs.
Figure 3:
This is one of three pilot analyses run by BFR using the Results First cost-benefit model. Please see the Budget.Illinois.gov for additional benefit-cost reports and supporting information.
$0
$2,000
$4,000
$6,000
$8,000
$10,000
$12,000
$14,000
$16,000
$18,000
1 2 3 4 5 6 7 8 9 10 11 12 13 14 15Years from Investment
Taxpayers Victimization Deadweight Cost
Illinois Post-Secondary EducationTotal Benefits by Perspective (not discounted)

9
Section 2
State Program Assessment Rating Tool
10
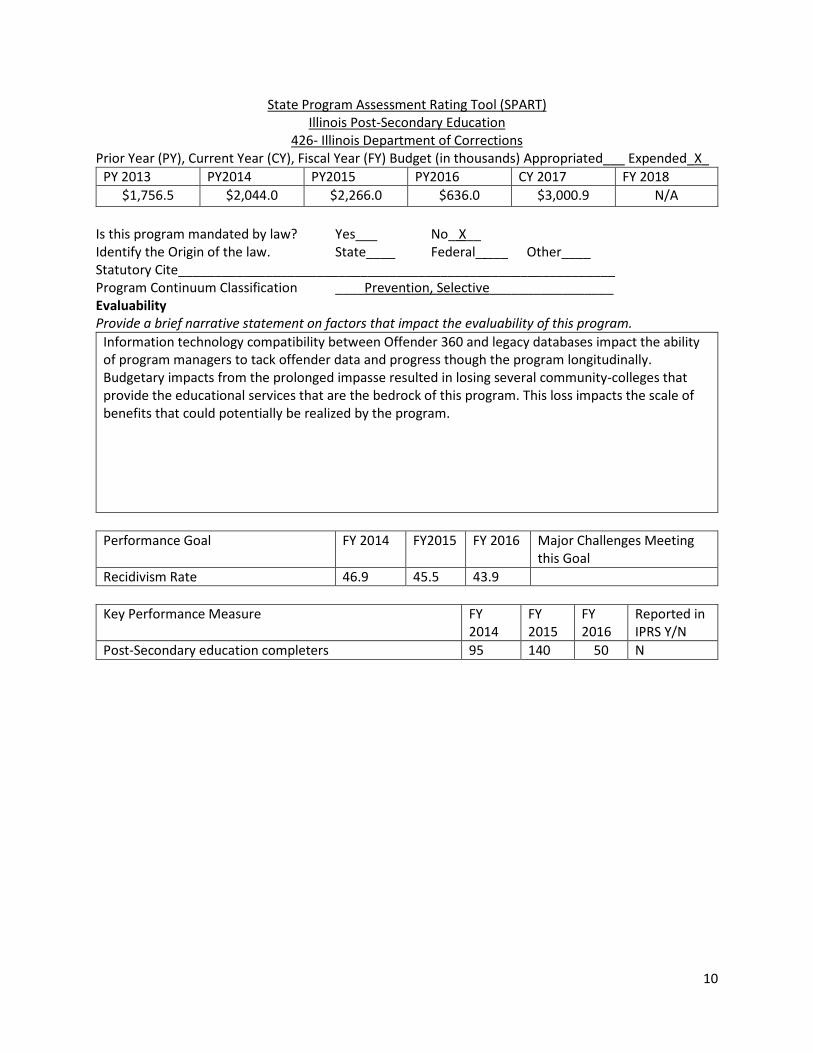
State Program Assessment Rating Tool (SPART) Illinois Post-Secondary Education
426- Illinois Department of Corrections Prior Year (PY), Current Year (CY), Fiscal Year (FY) Budget (in thousands) Appropriated___ Expended_X_
PY 2013 PY2014 PY2015 PY2016 CY 2017 FY 2018 $1,756.5 $2,044.0 $2,266.0 $636.0 $3,000.9 N/A
Is this program mandated by law? Yes___ No_ X__ Identify the Origin of the law. State____ Federal_ ___ Other____ Statutory Cite____________________________________________________________ Program Continuum Classification ____Prevention, Selective_________________ Evaluability Provide a brief narrative statement on factors that impact the evaluability of this program.
Information technology compatibility between Offender 360 and legacy databases impact the ability of program managers to tack offender data and progress though the program longitudinally. Budgetary impacts from the prolonged impasse resulted in losing several community-colleges that provide the educational services that are the bedrock of this program. This loss impacts the scale of benefits that could potentially be realized by the program.
Performance Goal FY 2014 FY2015 FY 2016 Major Challenges Meeting
this Goal Recidivism Rate 46.9 45.5 43.9
Key Performance Measure FY
2014 FY 2015
FY 2016
Reported in IPRS Y/N
Post-Secondary education completers 95 140 50 N
11
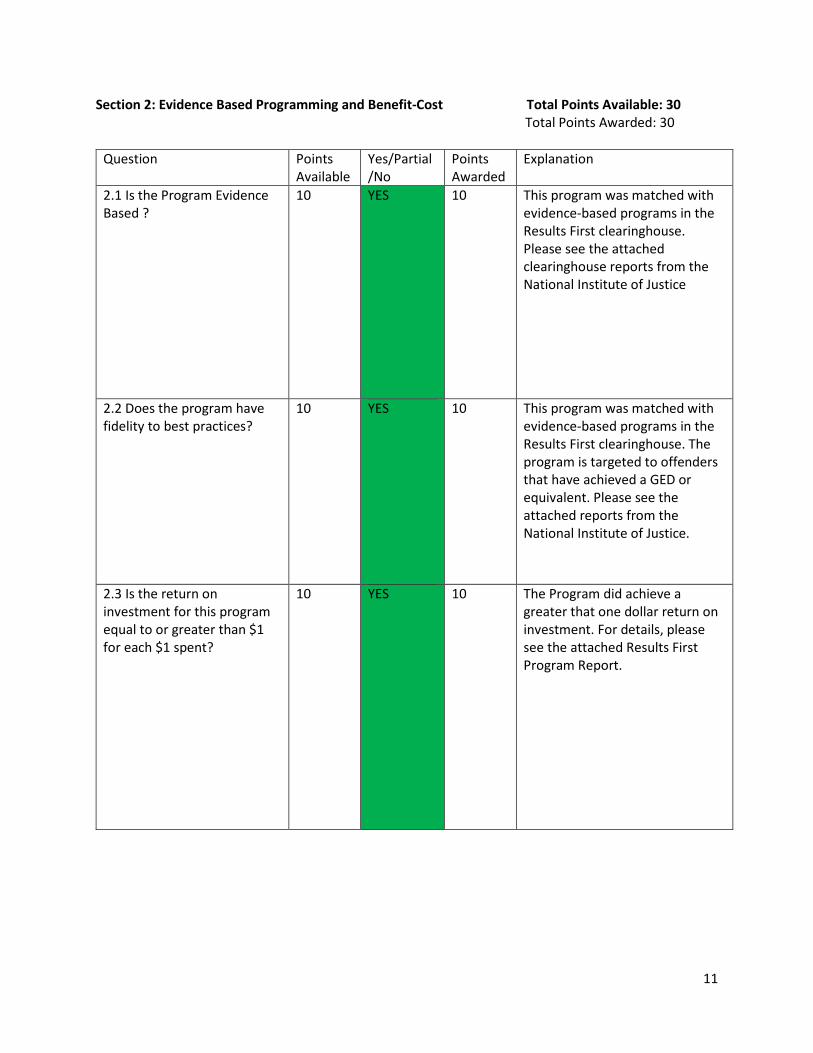
Section 2: Evidence Based Programming and Benefit-Cost Total Points Available: 30 Total Points Awarded: 30
Question Points Available
Yes/Partial/No
Points Awarded
Explanation
2.1 Is the Program Evidence Based ?
10 YES 10 This program was matched with evidence-based programs in the Results First clearinghouse. Please see the attached clearinghouse reports from the National Institute of Justice
2.2 Does the program have fidelity to best practices?
10 YES 10 This program was matched with evidence-based programs in the Results First clearinghouse. The program is targeted to offenders that have achieved a GED or equivalent. Please see the attached reports from the National Institute of Justice.
2.3 Is the return on investment for this program equal to or greater than $1 for each $1 spent?
10 YES 10 The Program did achieve a greater that one dollar return on investment. For details, please see the attached Results First Program Report.
12
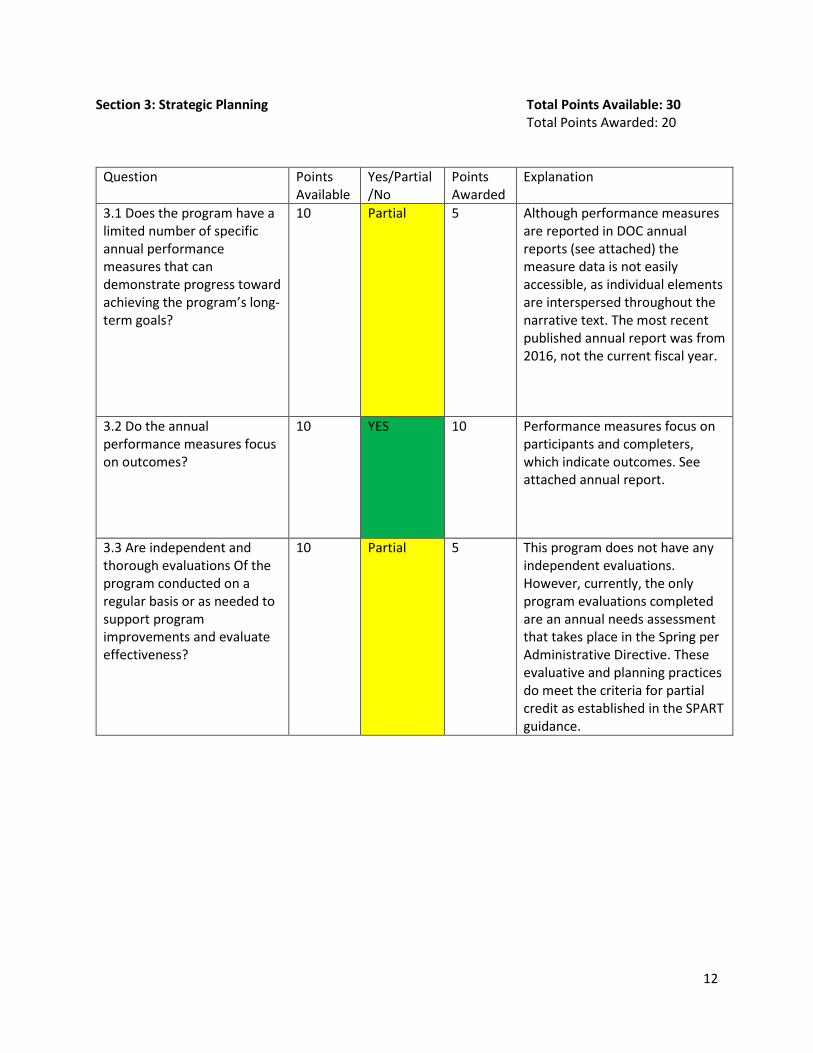
Section 3: Strategic Planning Total Points Available: 30 Total Points Awarded: 20
Question Points Available
Yes/Partial/No
Points Awarded
Explanation
3.1 Does the program have a limited number of specific annual performance measures that can demonstrate progress toward achieving the program’s long-term goals?
10 Partial 5 Although performance measures are reported in DOC annual reports (see attached) the measure data is not easily accessible, as individual elements are interspersed throughout the narrative text. The most recent published annual report was from 2016, not the current fiscal year.
3.2 Do the annual performance measures focus on outcomes?
10 YES 10 Performance measures focus on participants and completers, which indicate outcomes. See attached annual report.
3.3 Are independent and thorough evaluations Of the program conducted on a regular basis or as needed to support program improvements and evaluate effectiveness?
10 Partial 5 This program does not have any independent evaluations. However, currently, the only program evaluations completed are an annual needs assessment that takes place in the Spring per Administrative Directive. These evaluative and planning practices do meet the criteria for partial credit as established in the SPART guidance.
13
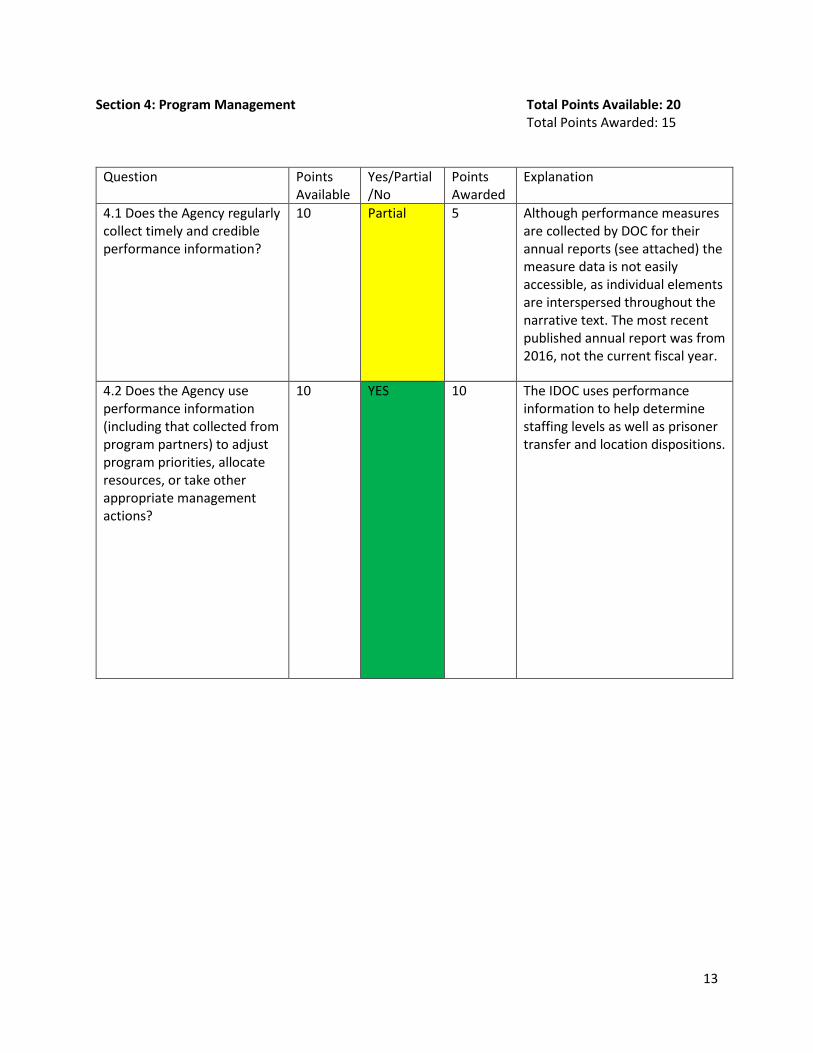
Section 4: Program Management Total Points Available: 20 Total Points Awarded: 15
Question Points Available
Yes/Partial/No
Points Awarded
Explanation
4.1 Does the Agency regularly collect timely and credible performance information?
10 Partial 5 Although performance measures are collected by DOC for their annual reports (see attached) the measure data is not easily accessible, as individual elements are interspersed throughout the narrative text. The most recent published annual report was from 2016, not the current fiscal year.
4.2 Does the Agency use performance information (including that collected from program partners) to adjust program priorities, allocate resources, or take other appropriate management actions?
10 YES 10 The IDOC uses performance information to help determine staffing levels as well as prisoner transfer and location dispositions.
14
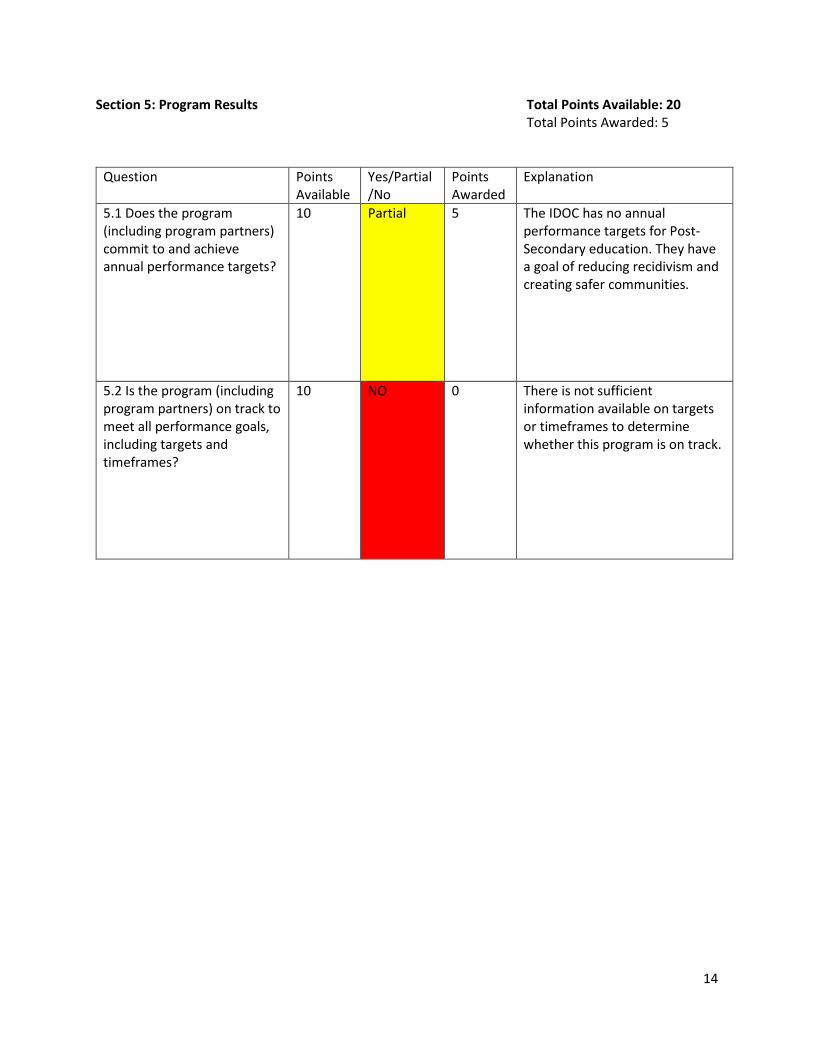
Section 5: Program Results Total Points Available: 20 Total Points Awarded: 5
Question Points Available
Yes/Partial/No
Points Awarded
Explanation
5.1 Does the program (including program partners) commit to and achieve annual performance targets?
10 Partial 5 The IDOC has no annual performance targets for Post-Secondary education. They have a goal of reducing recidivism and creating safer communities.
5.2 Is the program (including program partners) on track to meet all performance goals, including targets and timeframes?
10 NO 0 There is not sufficient information available on targets or timeframes to determine whether this program is on track.
15
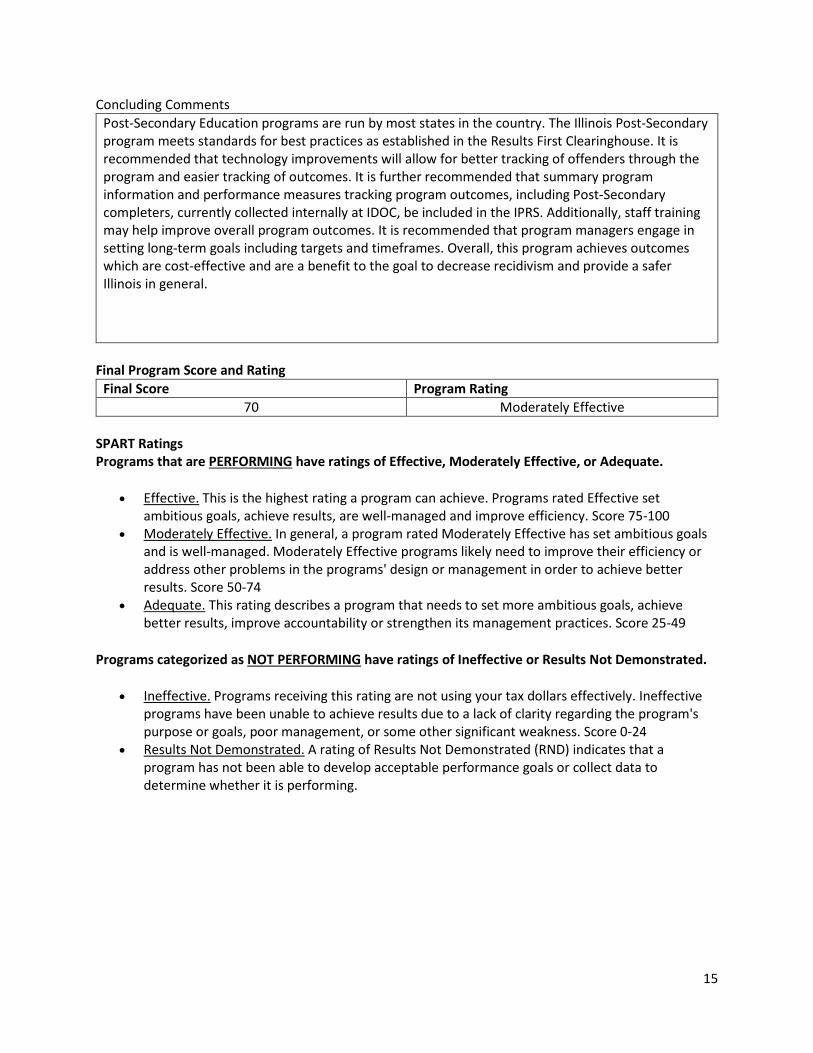
Concluding Comments Post-Secondary Education programs are run by most states in the country. The Illinois Post-Secondary program meets standards for best practices as established in the Results First Clearinghouse. It is recommended that technology improvements will allow for better tracking of offenders through the program and easier tracking of outcomes. It is further recommended that summary program information and performance measures tracking program outcomes, including Post-Secondary completers, currently collected internally at IDOC, be included in the IPRS. Additionally, staff training may help improve overall program outcomes. It is recommended that program managers engage in setting long-term goals including targets and timeframes. Overall, this program achieves outcomes which are cost-effective and are a benefit to the goal to decrease recidivism and provide a safer Illinois in general.
Final Program Score and Rating
Final Score Program Rating 70 Moderately Effective
SPART Ratings Programs that are PERFORMING have ratings of Effective, Moderately Effective, or Adequate.
• Effective. This is the highest rating a program can achieve. Programs rated Effective set ambitious goals, achieve results, are well-managed and improve efficiency. Score 75-100
• Moderately Effective. In general, a program rated Moderately Effective has set ambitious goals and is well-managed. Moderately Effective programs likely need to improve their efficiency or address other problems in the programs' design or management in order to achieve better results. Score 50-74
• Adequate. This rating describes a program that needs to set more ambitious goals, achieve better results, improve accountability or strengthen its management practices. Score 25-49
Programs categorized as NOT PERFORMING have ratings of Ineffective or Results Not Demonstrated.
• Ineffective. Programs receiving this rating are not using your tax dollars effectively. Ineffective programs have been unable to achieve results due to a lack of clarity regarding the program's purpose or goals, poor management, or some other significant weakness. Score 0-24
• Results Not Demonstrated. A rating of Results Not Demonstrated (RND) indicates that a program has not been able to develop acceptable performance goals or collect data to determine whether it is performing.
16
Glossary
Best Practices: Policies or activities that have been identified through evidence-based policymaking to be most effective in achieving positive outcomes. Evidence-Based: Systematic use of multiple, rigorous studies and evaluations which demonstrate the efficacy of the program’s theory of change and theory of action. Illinois Performance Reporting System (IPRS): The state’s web-based database for collecting program performance data. The IPRS database allows agencies to report programmatic level data to the Governor’s Office of Management and Budget on a regular basis. Optimal Return on Investment (OROI): A dollar amount that expresses the present value of program benefits net of program costs that can be expected if a program is implemented with fidelity to core principles or best practices. Outcome Measures: Outcomes describe the intended result of carrying out a program or activity. They define an event or condition that is external to the program or activity and that is of direct importance to the intended beneficiaries and/or the general public. For example, one outcome measure of a program aimed to prevent the acquisition and transmission of HIV infection is the number (reduction) of new HIV infections in the state. Output Measures: Outputs describe the level of activity that will be provided over a period of time, including a description of the characteristics (e.g., timeliness) established as standards for the activity. Outputs refer to the internal activities of a program (i.e., the products and services delivered). For example, an output could be the percentage of warnings that occur more than 20 minutes before a tornado forms. Results First Clearinghouse Database: One-stop online resource providing policymakers with an easy way to find information on the effectiveness of various interventions as rated by eight nation research clearinghouses which conduct systematic research reviews to identify which policies and interventions work. Target: A quantifiable metric established by program managers or the funding entity established as a minimum threshold of performance (outcome or output) the program should attain within a specified timeframe. Program results are evaluated against the program target. Theory Informed: A program where a lesser amount of evidence and/or rigor exists to validate the efficacy of the program’s theory of change and theory of action than an evidence-based program. Theory of Change: The central processes or drives by which a change comes about for individuals, groups and communities Theory of Action: How programs or other interventions are constructed to activate theories of change.