Embed Size (px)
Citation preview
IDL Tutorial
Advanced Graphics
Copyright © 2008 ITT Visual Information Solutions
All Rights Reserved http://www.ittvis.com/
IDL® is a registered trademark of ITT Visual Information Solutions for the computer
software described herein and its associated documentation. All other product names
and/or logos are trademarks of their respective owners.
ITT Visual Information Solutions • 4990 Pearl East Circle Boulder, CO 80301 P: 303.786.9900 • F: 303.786.9909 • www.ittvis.com
Page 2 of 24
IDL’s Graphical Systems
The IDL software package has 3 distinct graphical systems :
• IDL Intelligent Tools (iTools)
• Object Graphics
• Direct Graphics
All of the graphical visualizations that have been created thus far have been in one of
the pre-built iTools utilities (iPlot, iContour, iSurface, iImage, iVolume, iMap). The
three graphical systems are listed above in order of increasing age; the iTools were
introduced in IDL version 6.0 (2003), the Object Graphics were introduced in version
5.0 (1997), and the Direct Graphics have been in IDL since the beginning. There is
actually an inherent relationship between the iTools and the Object Graphics because
the iTools system is merely a set of interactive (point-and-click) utilities with a
graphical user interface that are built on top of the underlying Object Graphics
components. In contrast, the Direct Graphics are a completely separate graphical
system that require a very unique syntax. Each graphical system has distinct
advantages in comparison to the others, and this chapter presents an introduction to
the Direct and Object Graphics systems.
The Direct Graphics rely on the concept of a current graphics device. The routines
in the IDL language that create Direct Graphics will send the graphical output directly
to the current graphics device. The relevant features of the Direct Graphics system
are :
• The Direct Graphics send visualizations to a graphics device (“X” for X-
windows systems displays, “WIN” for Microsoft Windows displays, “PS” for
PostScript files, etc.). The user switches between graphics devices using the
SET_PLOT procedure, and controls the features of the current graphics device
using the DEVICE procedure.
• Once a Direct Graphics mode visualization is drawn to the current graphics
device, it cannot be altered or re-used. This means that if the user wishes to
re-create the graphic on a different device, they must re-issue the IDL
commands to create the graphic again.
• When the user adds a new item to an existing Direct Graphics visualization,
the new item is drawn in front of the existing graphics.
• Some of the primary routines in the IDL language for creating Direct Graphics
are :
o Display Management : WINDOW, WSET, WSHOW, WDELETE
o Color Tables : TVLCT, LOADCT, XLOADCT, XPALETTE
o Line Plots : PLOT, OPLOT, PLOTS
o Contours : CONTOUR, IMAGE_CONT
o Surfaces : SURFACE, SHADE_SURF, SHOW3
o Images : TV, TVSCL, SLIDE_IMAGE, TVRD, XINTERANIMATE
o Volumes : SLICER3, SHADE_VOLUME, PROJECT_VOL, VOXEL_PROJ,
POLYSHADE
o Maps : MAP_SET, MAP_GRID, MAP_CONTINENTS, MAP_IMAGE
ITT Visual Information Solutions • 4990 Pearl East Circle Boulder, CO 80301 P: 303.786.9900 • F: 303.786.9909 • www.ittvis.com
Page 3 of 24
In contrast, the Object Graphics use an object-oriented programmer’s interface to
create graphic objects, which must then be explicitly drawn to a destination of the
programmer’s choosing. The relevant features of the Object Graphics system are :
• Object Graphics are device independent. There is no concept of a current
graphics device when using object-mode graphics; any graphics object can be
displayed on any physical device for which a destination object can be
created.
• Object Graphics are object-oriented. Graphic objects are meant to be created
and re-used; the user may create a set of graphic objects, modify their
attributes, draw them to a window on the computer screen, modify their
attributes again, then draw them to a printer device without reissuing all of
the IDL commands used to create the objects. Graphics objects also
encapsulate functionality. This means that individual objects include method
routines that provide functionality specific to the individual object.
• Object graphics are rendered in three dimensions. Rendering implies many
operations not needed when drawing Direct Graphics, including calculation of
normal vectors for lines and surfaces, lighting considerations, and general
object overhead. As a result, the time needed to render a given object—a
surface, say—will often be longer than the time taken to draw the analogous
graphic in Direct Graphics.
• Object Graphics use a programmer’s interface. Unlike Direct Graphics, which
are well suited for both programming and interactive, ad hoc use, Object
Graphics are designed to be used in programs that are compiled and run.
While it is still possible to create and use graphics objects directly from the
IDL> command prompt, the syntax and naming conventions make it more
convenient to build a program offline than to create graphics objects on the
fly.
• Because Object Graphics persist in memory, there is a greater need for the
programmer to be cognizant of memory issues and memory leakage.
Efficient design—remembering to destroy unused object references and
cleaning up—will avert most problems, but even the best designs can be
memory-intensive if large numbers of graphic objects (or large datasets) are
involved.
• Some of the primary object classes in the IDL language for creating Object
Graphics are :
o Display Management : IDLgrWindow, IDLgrScene, IDLgrView,
IDLgrViewgroup, IDLgrModel
o Color Tables : IDLgrPalette, IDLgrColorbar
o Line Plots : IDLgrPlot
o Contours : IDLgrContour
o Surfaces : IDLgrSurface
o Images : IDLgrImage
o Volumes : IDLgrVolume
o Geometries : IDLgrPolyline, IDLgrPolygon
o Auxiliary : IDLgrAxis, IDLgrFont, IDLgrLight, IDLgrROI, IDLgrBuffer,
IDLgrClipboard, IDLgrPrinter, IDLgrLegend, IDLgrMPEG, IDLgrPattern
The following exercise will illustrate a simple comparison between the Direct and
Object Graphics systems. Start by generating a small two-dimensional array using
the BESELJ and DIST functions :
1. IDL> data = BESELJ (SHIFT (DIST (50), 25, 25) / 2, 0)
ITT Visual Information Solutions • 4990 Pearl East Circle Boulder, CO 80301 P: 303.786.9900 • F: 303.786.9909 • www.ittvis.com
Page 4 of 24
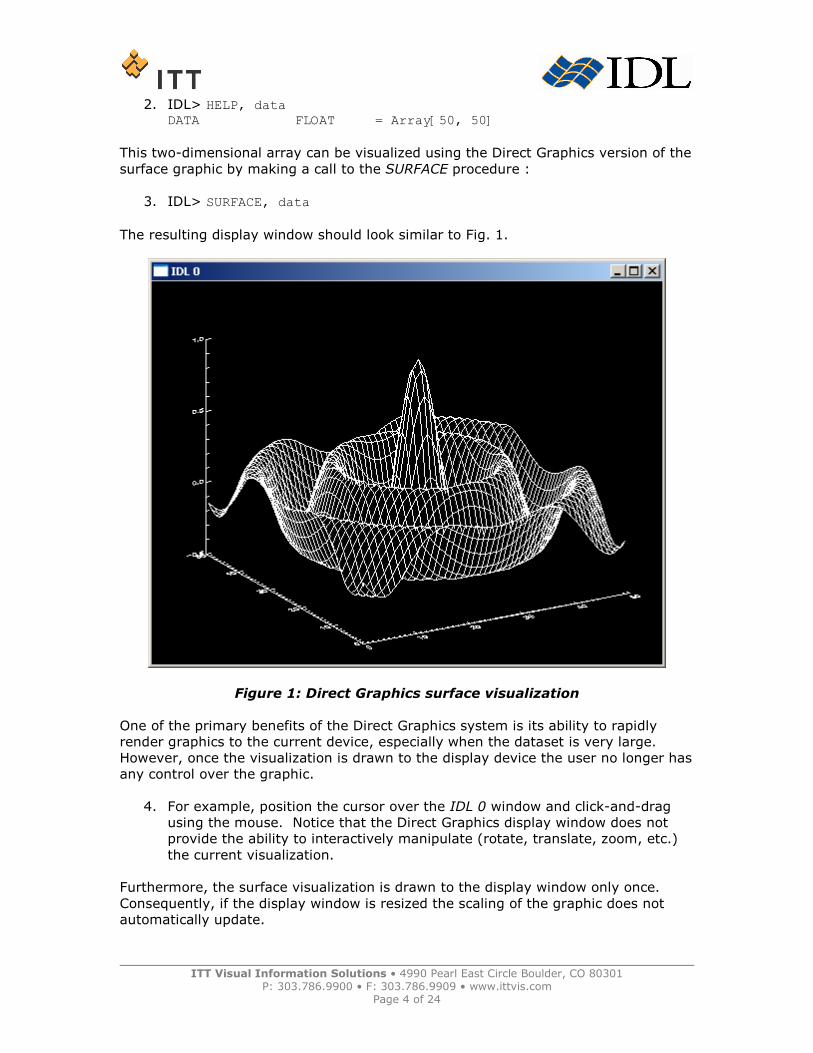
2. IDL> HELP, data DATA FLOAT = Array[50, 50]
This two-dimensional array can be visualized using the Direct Graphics version of the
surface graphic by making a call to the SURFACE procedure :
3. IDL> SURFACE, data
The resulting display window should look similar to Fig. 1.
Figure 1: Direct Graphics surface visualization
One of the primary benefits of the Direct Graphics system is its ability to rapidly
render graphics to the current device, especially when the dataset is very large.
However, once the visualization is drawn to the display device the user no longer has
any control over the graphic.
4. For example, position the cursor over the IDL 0 window and click-and-drag
using the mouse. Notice that the Direct Graphics display window does not
provide the ability to interactively manipulate (rotate, translate, zoom, etc.)
the current visualization.
Furthermore, the surface visualization is drawn to the display window only once.
Consequently, if the display window is resized the scaling of the graphic does not
automatically update.
ITT Visual Information Solutions • 4990 Pearl East Circle Boulder, CO 80301 P: 303.786.9900 • F: 303.786.9909 • www.ittvis.com
Page 5 of 24
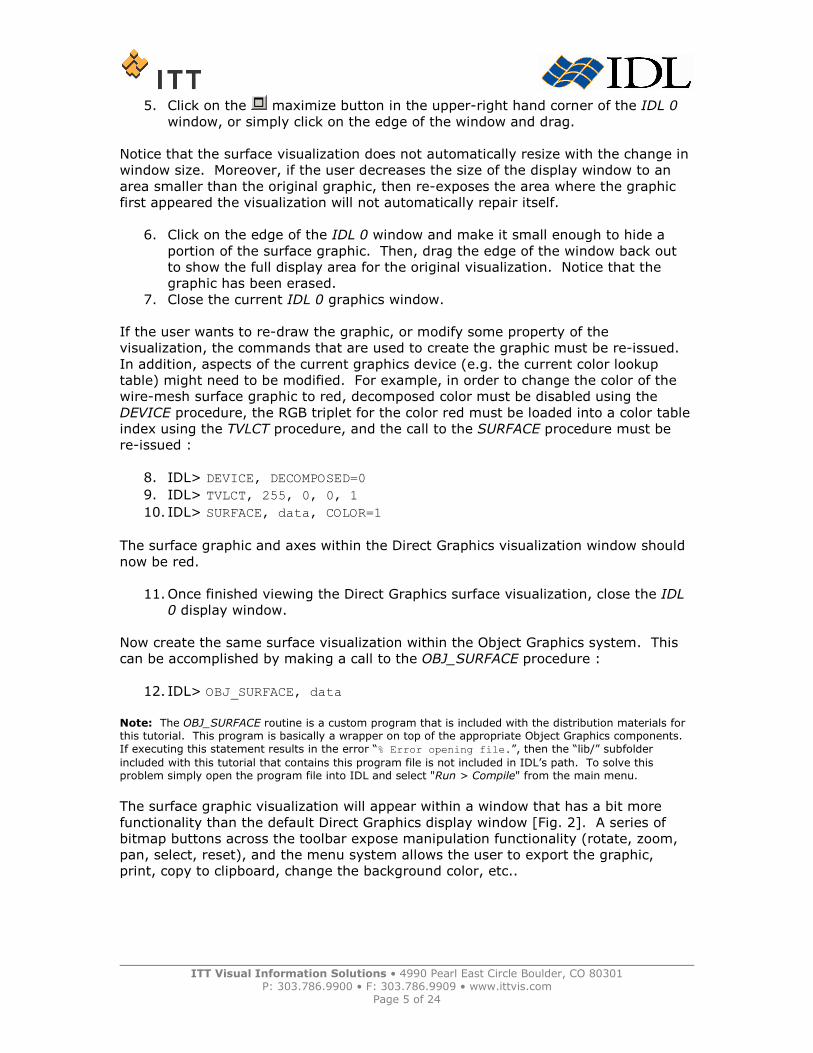
5. Click on the maximize button in the upper-right hand corner of the IDL 0
window, or simply click on the edge of the window and drag.
Notice that the surface visualization does not automatically resize with the change in
window size. Moreover, if the user decreases the size of the display window to an
area smaller than the original graphic, then re-exposes the area where the graphic
first appeared the visualization will not automatically repair itself.
6. Click on the edge of the IDL 0 window and make it small enough to hide a
portion of the surface graphic. Then, drag the edge of the window back out
to show the full display area for the original visualization. Notice that the
graphic has been erased.
7. Close the current IDL 0 graphics window.
If the user wants to re-draw the graphic, or modify some property of the
visualization, the commands that are used to create the graphic must be re-issued.
In addition, aspects of the current graphics device (e.g. the current color lookup
table) might need to be modified. For example, in order to change the color of the
wire-mesh surface graphic to red, decomposed color must be disabled using the
DEVICE procedure, the RGB triplet for the color red must be loaded into a color table
index using the TVLCT procedure, and the call to the SURFACE procedure must be
re-issued :
8. IDL> DEVICE, DECOMPOSED=0
9. IDL> TVLCT, 255, 0, 0, 1
10. IDL> SURFACE, data, COLOR=1
The surface graphic and axes within the Direct Graphics visualization window should
now be red.
11. Once finished viewing the Direct Graphics surface visualization, close the IDL
0 display window.
Now create the same surface visualization within the Object Graphics system. This
can be accomplished by making a call to the OBJ_SURFACE procedure :
12. IDL> OBJ_SURFACE, data
Note: The OBJ_SURFACE routine is a custom program that is included with the distribution materials for this tutorial. This program is basically a wrapper on top of the appropriate Object Graphics components.
If executing this statement results in the error “% Error opening file.”, then the “lib/” subfolder
included with this tutorial that contains this program file is not included in IDL’s path. To solve this problem simply open the program file into IDL and select "Run > Compile" from the main menu.
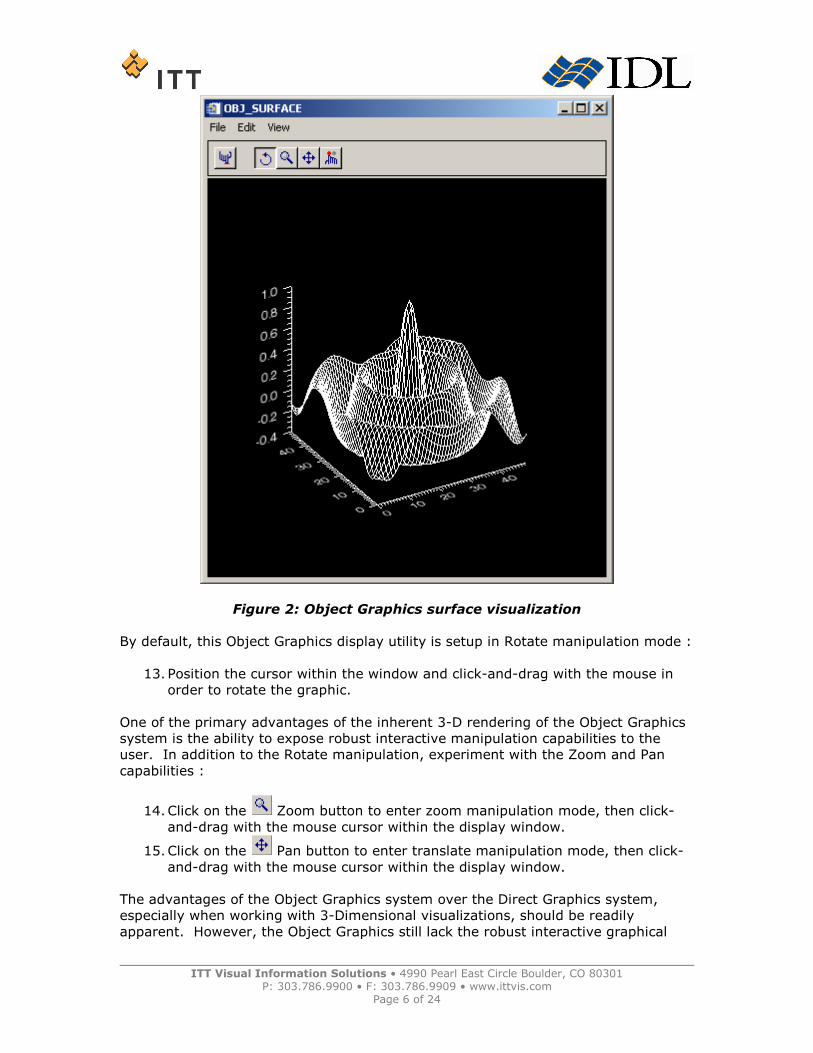
The surface graphic visualization will appear within a window that has a bit more
functionality than the default Direct Graphics display window [Fig. 2]. A series of
bitmap buttons across the toolbar expose manipulation functionality (rotate, zoom,
pan, select, reset), and the menu system allows the user to export the graphic,
print, copy to clipboard, change the background color, etc..
ITT Visual Information Solutions • 4990 Pearl East Circle Boulder, CO 80301 P: 303.786.9900 • F: 303.786.9909 • www.ittvis.com
Page 6 of 24
Figure 2: Object Graphics surface visualization
By default, this Object Graphics display utility is setup in Rotate manipulation mode :
13. Position the cursor within the window and click-and-drag with the mouse in
order to rotate the graphic.
One of the primary advantages of the inherent 3-D rendering of the Object Graphics
system is the ability to expose robust interactive manipulation capabilities to the
user. In addition to the Rotate manipulation, experiment with the Zoom and Pan
capabilities :
14. Click on the Zoom button to enter zoom manipulation mode, then click-
and-drag with the mouse cursor within the display window.
15. Click on the Pan button to enter translate manipulation mode, then click-
and-drag with the mouse cursor within the display window.
The advantages of the Object Graphics system over the Direct Graphics system,
especially when working with 3-Dimensional visualizations, should be readily
apparent. However, the Object Graphics still lack the robust interactive graphical
ITT Visual Information Solutions • 4990 Pearl East Circle Boulder, CO 80301 P: 303.786.9900 • F: 303.786.9909 • www.ittvis.com
Page 7 of 24
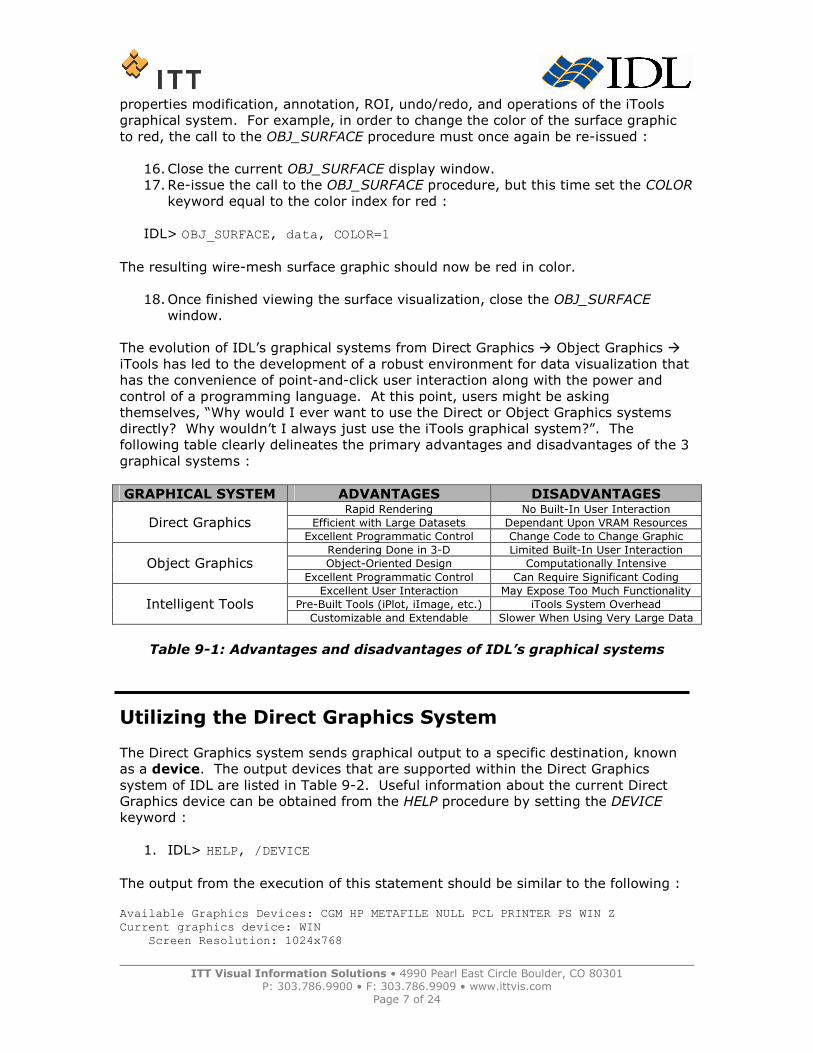
properties modification, annotation, ROI, undo/redo, and operations of the iTools
graphical system. For example, in order to change the color of the surface graphic
to red, the call to the OBJ_SURFACE procedure must once again be re-issued :
16. Close the current OBJ_SURFACE display window.
17. Re-issue the call to the OBJ_SURFACE procedure, but this time set the COLOR
keyword equal to the color index for red :
IDL> OBJ_SURFACE, data, COLOR=1
The resulting wire-mesh surface graphic should now be red in color.
18. Once finished viewing the surface visualization, close the OBJ_SURFACE
window.
The evolution of IDL’s graphical systems from Direct Graphics � Object Graphics �
iTools has led to the development of a robust environment for data visualization that
has the convenience of point-and-click user interaction along with the power and
control of a programming language. At this point, users might be asking
themselves, “Why would I ever want to use the Direct or Object Graphics systems
directly? Why wouldn’t I always just use the iTools graphical system?”. The
following table clearly delineates the primary advantages and disadvantages of the 3
graphical systems :
GRAPHICAL SYSTEM ADVANTAGES DISADVANTAGES Rapid Rendering No Built-In User Interaction
Efficient with Large Datasets Dependant Upon VRAM Resources Direct Graphics Excellent Programmatic Control Change Code to Change Graphic
Rendering Done in 3-D Limited Built-In User Interaction
Object-Oriented Design Computationally Intensive Object Graphics Excellent Programmatic Control Can Require Significant Coding
Excellent User Interaction May Expose Too Much Functionality
Pre-Built Tools (iPlot, iImage, etc.) iTools System Overhead Intelligent Tools Customizable and Extendable Slower When Using Very Large Data
Table 9-1: Advantages and disadvantages of IDL’s graphical systems
Utilizing the Direct Graphics System
The Direct Graphics system sends graphical output to a specific destination, known
as a device. The output devices that are supported within the Direct Graphics
system of IDL are listed in Table 9-2. Useful information about the current Direct
Graphics device can be obtained from the HELP procedure by setting the DEVICE
keyword :
1. IDL> HELP, /DEVICE
The output from the execution of this statement should be similar to the following :
Available Graphics Devices: CGM HP METAFILE NULL PCL PRINTER PS WIN Z Current graphics device: WIN Screen Resolution: 1024x768
ITT Visual Information Solutions • 4990 Pearl East Circle Boulder, CO 80301 P: 303.786.9900 • F: 303.786.9909 • www.ittvis.com
Page 8 of 24
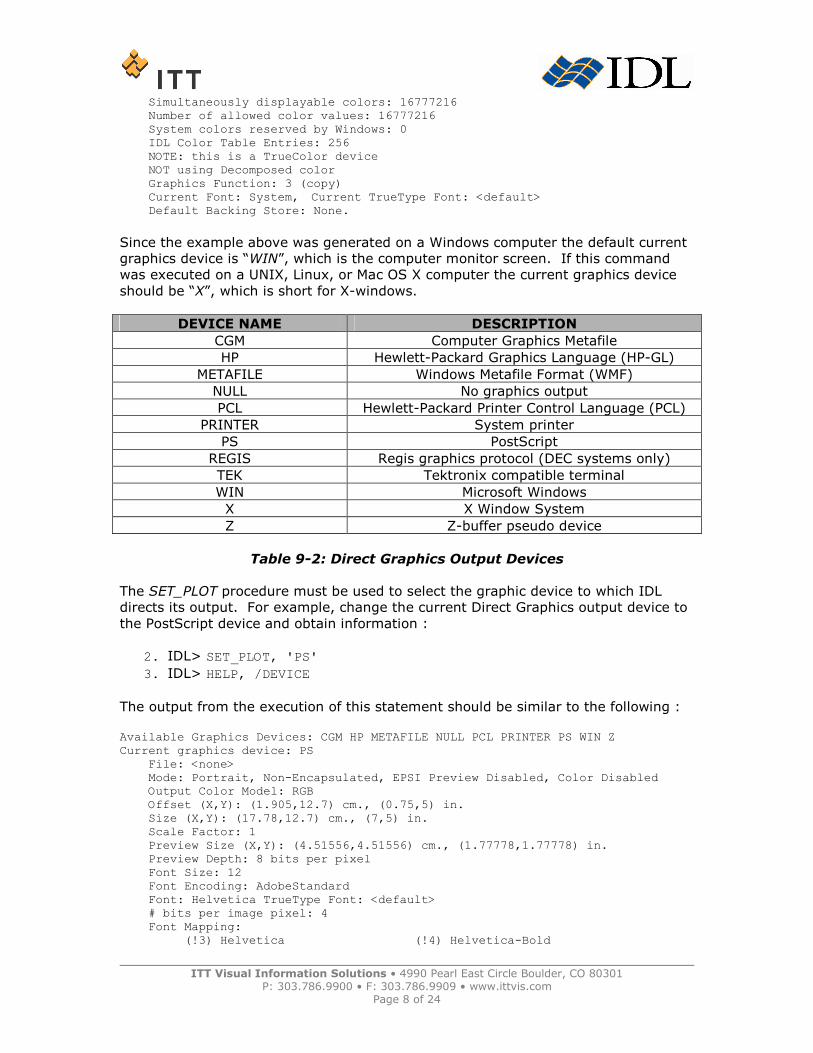
Simultaneously displayable colors: 16777216 Number of allowed color values: 16777216 System colors reserved by Windows: 0 IDL Color Table Entries: 256 NOTE: this is a TrueColor device NOT using Decomposed color Graphics Function: 3 (copy) Current Font: System, Current TrueType Font: <default> Default Backing Store: None.
Since the example above was generated on a Windows computer the default current
graphics device is “WIN”, which is the computer monitor screen. If this command
was executed on a UNIX, Linux, or Mac OS X computer the current graphics device
should be “X”, which is short for X-windows.
DEVICE NAME DESCRIPTION
CGM Computer Graphics Metafile
HP Hewlett-Packard Graphics Language (HP-GL)
METAFILE Windows Metafile Format (WMF)
NULL No graphics output
PCL Hewlett-Packard Printer Control Language (PCL)
PRINTER System printer
PS PostScript
REGIS Regis graphics protocol (DEC systems only)
TEK Tektronix compatible terminal
WIN Microsoft Windows
X X Window System
Z Z-buffer pseudo device
Table 9-2: Direct Graphics Output Devices
The SET_PLOT procedure must be used to select the graphic device to which IDL
directs its output. For example, change the current Direct Graphics output device to
the PostScript device and obtain information :
2. IDL> SET_PLOT, 'PS'
3. IDL> HELP, /DEVICE
The output from the execution of this statement should be similar to the following :
Available Graphics Devices: CGM HP METAFILE NULL PCL PRINTER PS WIN Z Current graphics device: PS File: <none> Mode: Portrait, Non-Encapsulated, EPSI Preview Disabled, Color Disabled Output Color Model: RGB Offset (X,Y): (1.905,12.7) cm., (0.75,5) in. Size (X,Y): (17.78,12.7) cm., (7,5) in. Scale Factor: 1 Preview Size (X,Y): (4.51556,4.51556) cm., (1.77778,1.77778) in. Preview Depth: 8 bits per pixel Font Size: 12 Font Encoding: AdobeStandard Font: Helvetica TrueType Font: <default> # bits per image pixel: 4 Font Mapping: (!3) Helvetica (!4) Helvetica-Bold
ITT Visual Information Solutions • 4990 Pearl East Circle Boulder, CO 80301 P: 303.786.9900 • F: 303.786.9909 • www.ittvis.com
Page 9 of 24
(!5) Helvetica-Narrow (!6) Helvetica-Narrow-BoldOblique (!7) Times-Roman (!8) Times-BoldItalic (!9) Symbol (!10) ZapfDingbats (!11) Courier (!12) Courier-Oblique (!13) Palatino-Roman (!14) Palatino-Italic (!15) Palatino-Bold (!16) Palatino-BoldItalic (!17) AvantGarde-Book (!18) NewCenturySchlbk-Roman (!19) NewCenturySchlbk-Bold (!20) <Undefined-User-Font>
At this point, if the user were to execute a routine from the IDL library that creates
Direct Graphics visualizations the graphical output would actually be directed to this
invisible PostScript device and would not appear on the computer monitor screen.
4. In order to create Direct Graphics visualizations and see them on the display,
change the current graphics device back to its original setting :
• Windows: IDL> SET_PLOT, 'WIN'
• UNIX/Linux: IDL> SET_PLOT, 'X'
• Mac OS X: IDL> SET_PLOT, 'X'
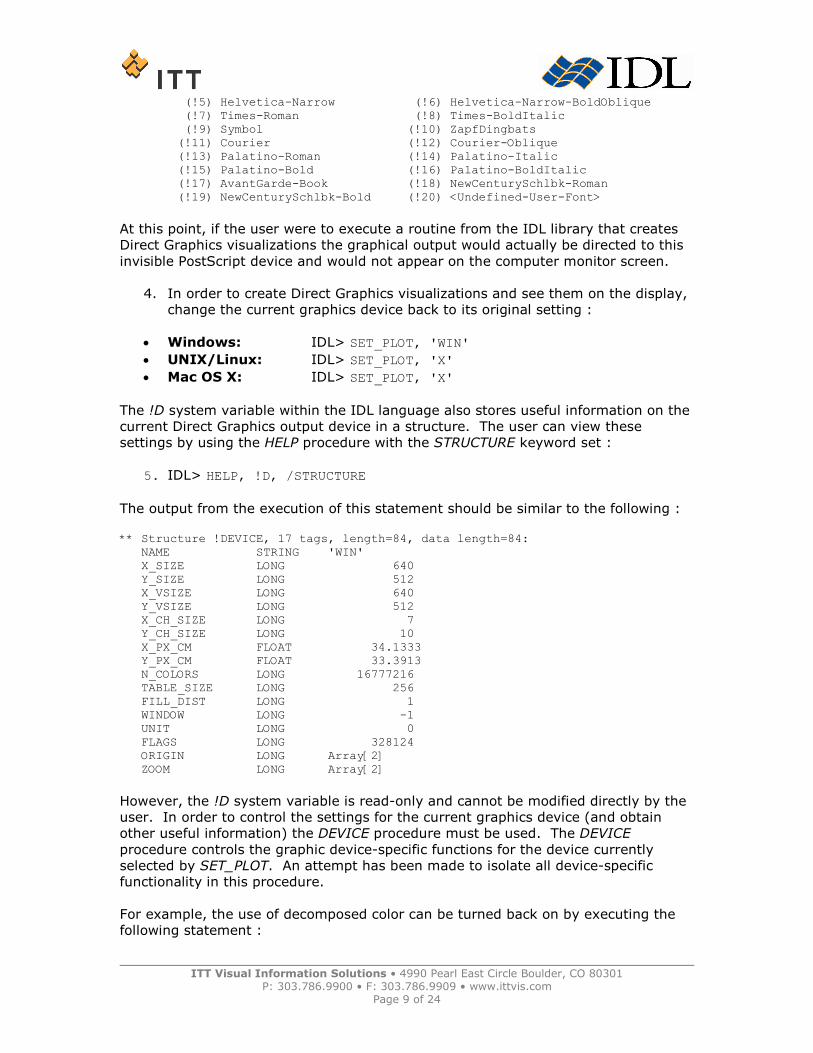
The !D system variable within the IDL language also stores useful information on the
current Direct Graphics output device in a structure. The user can view these
settings by using the HELP procedure with the STRUCTURE keyword set :
5. IDL> HELP, !D, /STRUCTURE
The output from the execution of this statement should be similar to the following :
** Structure !DEVICE, 17 tags, length=84, data length=84: NAME STRING 'WIN' X_SIZE LONG 640 Y_SIZE LONG 512 X_VSIZE LONG 640 Y_VSIZE LONG 512 X_CH_SIZE LONG 7 Y_CH_SIZE LONG 10 X_PX_CM FLOAT 34.1333 Y_PX_CM FLOAT 33.3913 N_COLORS LONG 16777216 TABLE_SIZE LONG 256 FILL_DIST LONG 1 WINDOW LONG -1 UNIT LONG 0 FLAGS LONG 328124 ORIGIN LONG Array[2] ZOOM LONG Array[2]
However, the !D system variable is read-only and cannot be modified directly by the
user. In order to control the settings for the current graphics device (and obtain
other useful information) the DEVICE procedure must be used. The DEVICE
procedure controls the graphic device-specific functions for the device currently
selected by SET_PLOT. An attempt has been made to isolate all device-specific
functionality in this procedure.
For example, the use of decomposed color can be turned back on by executing the
following statement :
ITT Visual Information Solutions • 4990 Pearl East Circle Boulder, CO 80301 P: 303.786.9900 • F: 303.786.9909 • www.ittvis.com
Page 10 of 24
6. IDL> DEVICE, DECOMPOSED=1
Once this is accomplished, executing the command “HELP, /DEVICE” will show that
the current Direct Graphics device is using decomposed (24-bit) color :
7. IDL> HELP, /DEVICE
Available Graphics Devices: CGM HP METAFILE NULL PCL PRINTER PS WIN Z Current graphics device: WIN Screen Resolution: 1024x768 Simultaneously displayable colors: 16777216 Number of allowed color values: 16777216 System colors reserved by Windows: 0 IDL Color Table Entries: 256 NOTE: this is a TrueColor device Using Decomposed color Graphics Function: 3 (copy) Current Font: System, Current TrueType Font: <default> Default Backing Store: None.
The primary advantages of the Direct Graphics system is efficient handling of large
datasets and very rapid rendering. The following exercise illustrates one of these
benefits by executing a small GUI program that utilizes Direct Graphics (and IDL’s
widget toolkit). This program displays an image of a digital elevation model and
allows the user to click on the image and dynamically display X- and Y- line profiles
of the DEM data in a very rapid fashion. The data that is used in this exercise is
stored in the file named “DEM.tif” located in the “data” subfolder.
Start by launching the custom program that is built on top of the Direct Graphics
system :
8. IDL> PROFILE_VIEW
Note: The PROFILE_VIEW routine is a custom program that is included with the distribution materials for this IDL tutorial. This program is basically a wrapper on top of the appropriate Direct Graphics
components. If executing this statement results in the error “% Error opening file.”, then the “lib/”
subfolder included with this tutorial that contains this program file is not included in IDL’s path. To solve this problem simply open the program file into IDL and select "Run > Compile" from the main menu.
A standard native file selection dialog will appear entitled “Select “DEM.tif” file to
open”.
9. Select the file named “DEM.tif” and press the “Open” button.
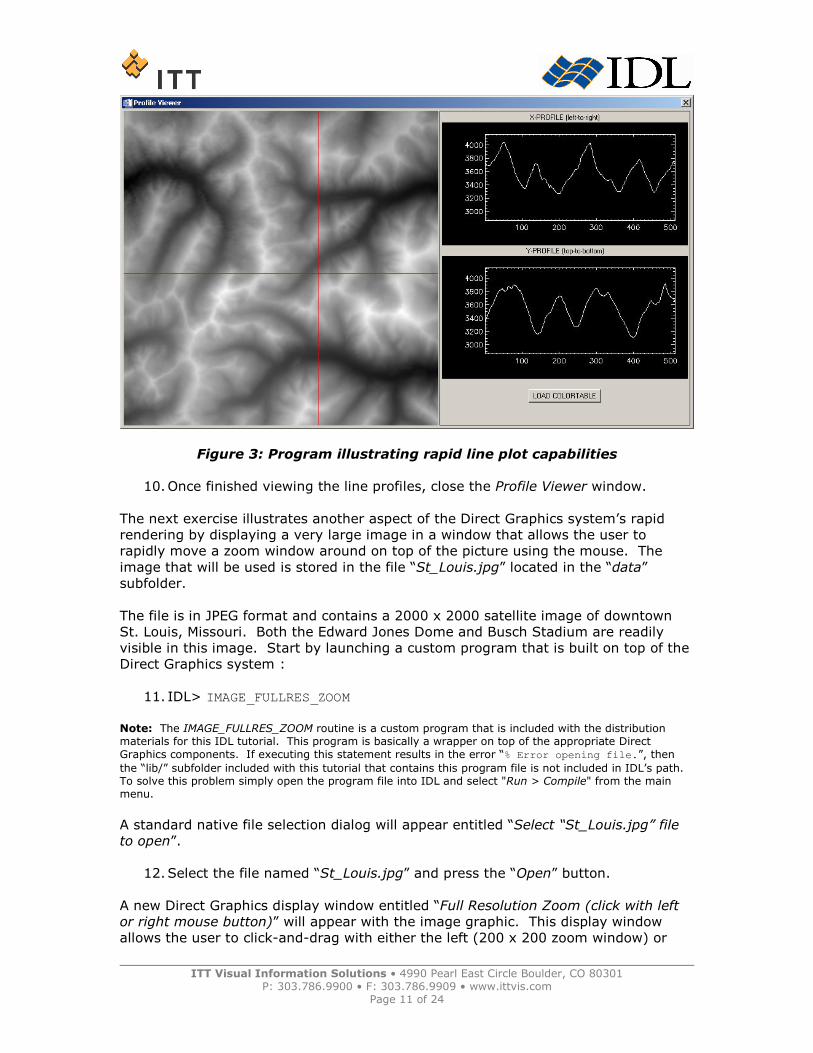
A new Direct Graphics display window entitled “Profile Viewer” will appear with an
image display of the DEM data and two blank plot windows. This program window
allows the user to click-and-drag with the left mouse button on top of the image in
order to display both an X- and Y- line profile for the elevation data according to the
current cursor location [Fig. 3]. Moving the cursor around in the image, the user can
see how rapidly the Direct Graphics system is able to update the line profile plots.
ITT Visual Information Solutions • 4990 Pearl East Circle Boulder, CO 80301 P: 303.786.9900 • F: 303.786.9909 • www.ittvis.com
Page 11 of 24
Figure 3: Program illustrating rapid line plot capabilities
10. Once finished viewing the line profiles, close the Profile Viewer window.
The next exercise illustrates another aspect of the Direct Graphics system’s rapid
rendering by displaying a very large image in a window that allows the user to
rapidly move a zoom window around on top of the picture using the mouse. The
image that will be used is stored in the file “St_Louis.jpg” located in the “data”
subfolder.
The file is in JPEG format and contains a 2000 x 2000 satellite image of downtown
St. Louis, Missouri. Both the Edward Jones Dome and Busch Stadium are readily
visible in this image. Start by launching a custom program that is built on top of the
Direct Graphics system :
11. IDL> IMAGE_FULLRES_ZOOM
Note: The IMAGE_FULLRES_ZOOM routine is a custom program that is included with the distribution materials for this IDL tutorial. This program is basically a wrapper on top of the appropriate Direct
Graphics components. If executing this statement results in the error “% Error opening file.”, then
the “lib/” subfolder included with this tutorial that contains this program file is not included in IDL’s path. To solve this problem simply open the program file into IDL and select "Run > Compile" from the main menu.
A standard native file selection dialog will appear entitled “Select “St_Louis.jpg” file
to open”.
12. Select the file named “St_Louis.jpg” and press the “Open” button.
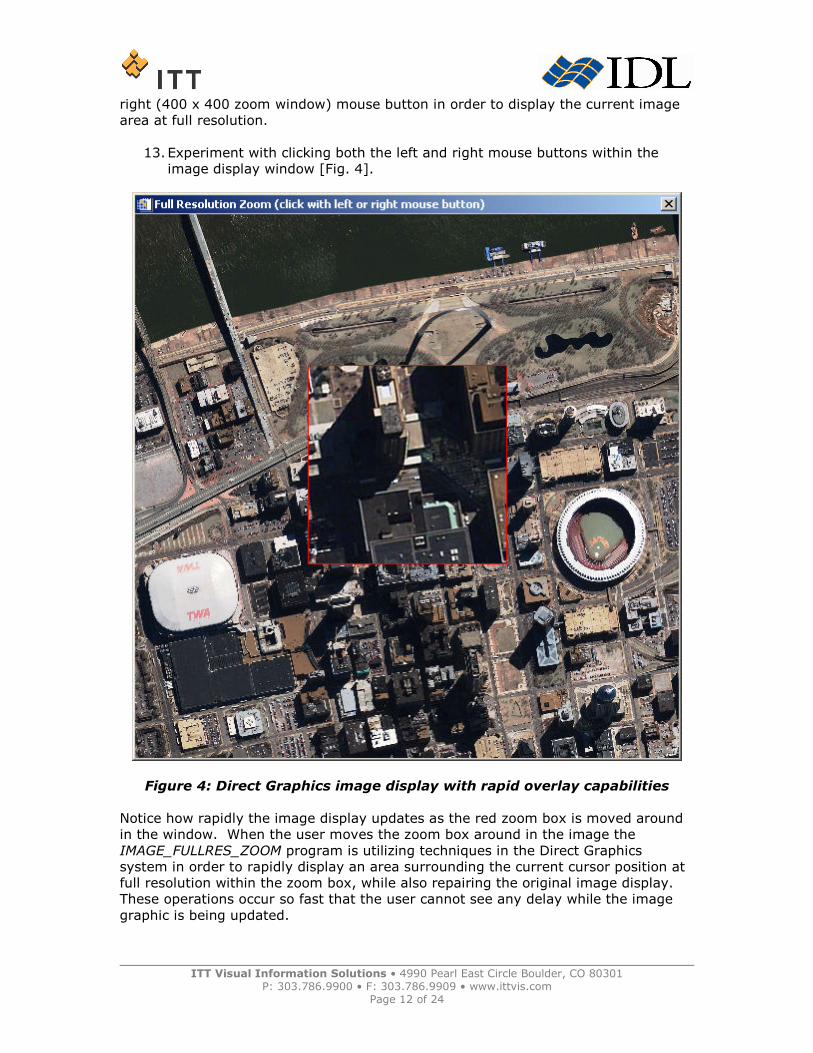
A new Direct Graphics display window entitled “Full Resolution Zoom (click with left
or right mouse button)” will appear with the image graphic. This display window
allows the user to click-and-drag with either the left (200 x 200 zoom window) or
ITT Visual Information Solutions • 4990 Pearl East Circle Boulder, CO 80301 P: 303.786.9900 • F: 303.786.9909 • www.ittvis.com
Page 12 of 24
right (400 x 400 zoom window) mouse button in order to display the current image
area at full resolution.
13. Experiment with clicking both the left and right mouse buttons within the
image display window [Fig. 4].
Figure 4: Direct Graphics image display with rapid overlay capabilities
Notice how rapidly the image display updates as the red zoom box is moved around
in the window. When the user moves the zoom box around in the image the
IMAGE_FULLRES_ZOOM program is utilizing techniques in the Direct Graphics
system in order to rapidly display an area surrounding the current cursor position at
full resolution within the zoom box, while also repairing the original image display.
These operations occur so fast that the user cannot see any delay while the image
graphic is being updated.
ITT Visual Information Solutions • 4990 Pearl East Circle Boulder, CO 80301 P: 303.786.9900 • F: 303.786.9909 • www.ittvis.com
Page 13 of 24
14. Once finished viewing the image of St. Louis, close the Full Resolution Zoom
display window.
The following exercise illustrates another powerful aspect of the Direct Graphics
system by loading a series of images into IDL and displaying each in a sequential
fashion. The delay between the display of each image in the sequence is so short
that the visualization has the appearance of an animation (i.e. movie) to the viewer.
IDL has a pre-built utility that provides an interface and controls for viewing
animations called XINTERANIMATE. This utility utilizes the Direct Graphics system to
display images in a very rapid fashion.
The images that will be loaded as movie frames into this animation utility are located
in the “frames” subfolder of the “data” subfolder.
The individual data files found in this “frames” subfolder are in BMP format. Start by
selecting this folder and inputting the images into the current IDL session. The
DIALOG_PICKFILE function can be used to display the native file selection dialog.
Set the DIRECTORY keyword so the dialog prompts the user to select an entire folder
instead of individual files :
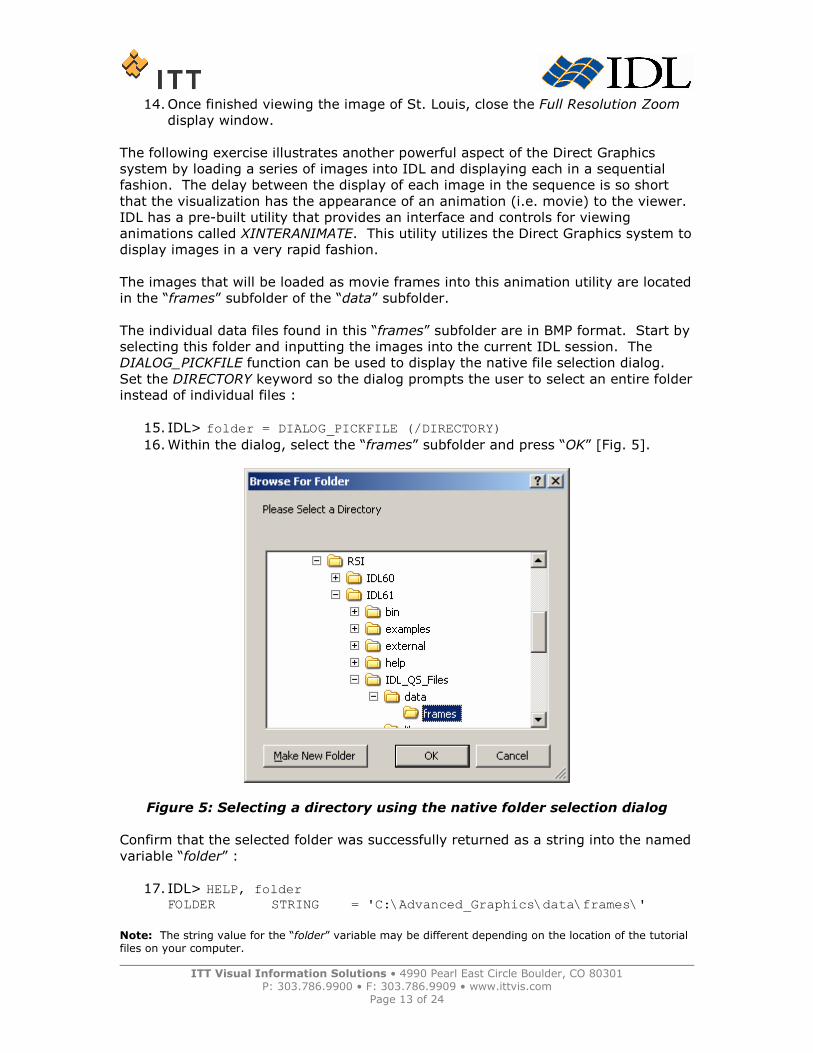
15. IDL> folder = DIALOG_PICKFILE (/DIRECTORY)
16. Within the dialog, select the “frames” subfolder and press “OK” [Fig. 5].
Figure 5: Selecting a directory using the native folder selection dialog
Confirm that the selected folder was successfully returned as a string into the named
variable “folder” :
17. IDL> HELP, folder FOLDER STRING = 'C:\Advanced_Graphics\data\frames\'
Note: The string value for the “folder” variable may be different depending on the location of the tutorial files on your computer.
ITT Visual Information Solutions • 4990 Pearl East Circle Boulder, CO 80301 P: 303.786.9900 • F: 303.786.9909 • www.ittvis.com
Page 14 of 24
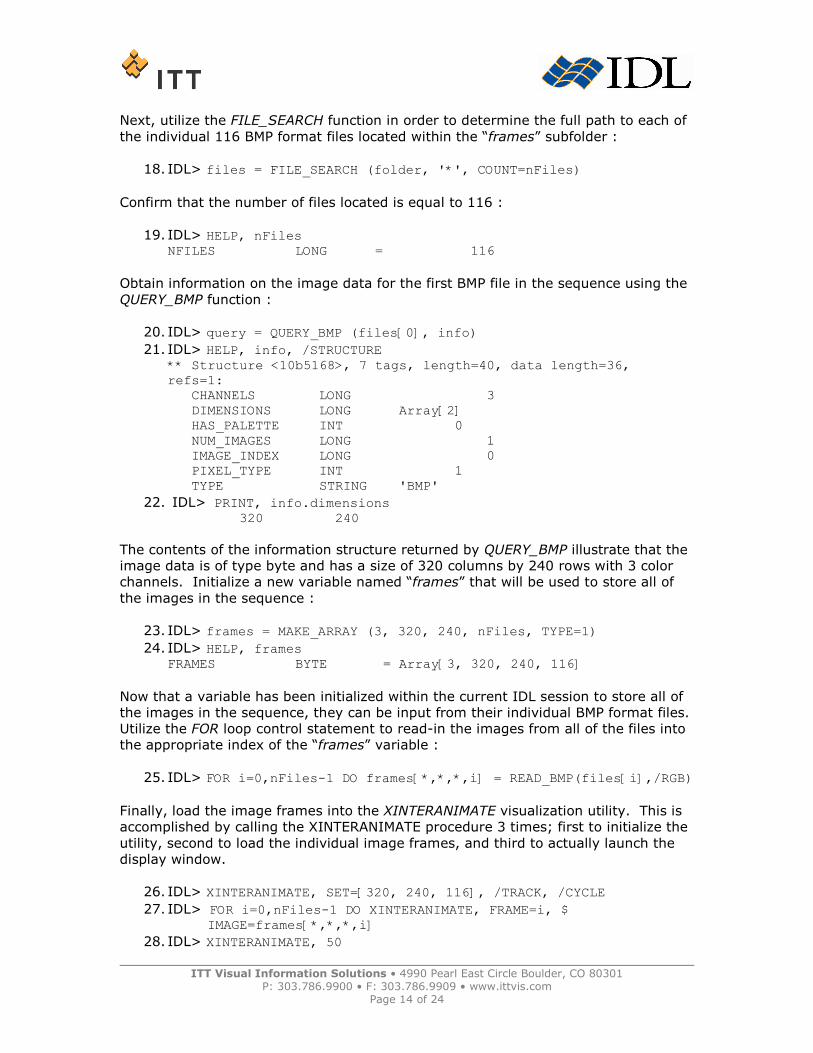
Next, utilize the FILE_SEARCH function in order to determine the full path to each of
the individual 116 BMP format files located within the “frames” subfolder :
18. IDL> files = FILE_SEARCH (folder, '*', COUNT=nFiles)
Confirm that the number of files located is equal to 116 :
19. IDL> HELP, nFiles NFILES LONG = 116
Obtain information on the image data for the first BMP file in the sequence using the
QUERY_BMP function :
20. IDL> query = QUERY_BMP (files[0], info)
21. IDL> HELP, info, /STRUCTURE ** Structure <10b5168>, 7 tags, length=40, data length=36, refs=1: CHANNELS LONG 3 DIMENSIONS LONG Array[2] HAS_PALETTE INT 0 NUM_IMAGES LONG 1 IMAGE_INDEX LONG 0 PIXEL_TYPE INT 1 TYPE STRING 'BMP'
22. IDL> PRINT, info.dimensions 320 240
The contents of the information structure returned by QUERY_BMP illustrate that the
image data is of type byte and has a size of 320 columns by 240 rows with 3 color
channels. Initialize a new variable named “frames” that will be used to store all of
the images in the sequence :
23. IDL> frames = MAKE_ARRAY (3, 320, 240, nFiles, TYPE=1)
24. IDL> HELP, frames FRAMES BYTE = Array[3, 320, 240, 116]
Now that a variable has been initialized within the current IDL session to store all of
the images in the sequence, they can be input from their individual BMP format files.
Utilize the FOR loop control statement to read-in the images from all of the files into
the appropriate index of the “frames” variable :
25. IDL> FOR i=0,nFiles-1 DO frames[*,*,*,i] = READ_BMP(files[i],/RGB)
Finally, load the image frames into the XINTERANIMATE visualization utility. This is
accomplished by calling the XINTERANIMATE procedure 3 times; first to initialize the
utility, second to load the individual image frames, and third to actually launch the
display window.
26. IDL> XINTERANIMATE, SET=[320, 240, 116], /TRACK, /CYCLE
27. IDL> FOR i=0,nFiles-1 DO XINTERANIMATE, FRAME=i, $ IMAGE=frames[*,*,*,i]
28. IDL> XINTERANIMATE, 50
ITT Visual Information Solutions • 4990 Pearl East Circle Boulder, CO 80301 P: 303.786.9900 • F: 303.786.9909 • www.ittvis.com
Page 15 of 24
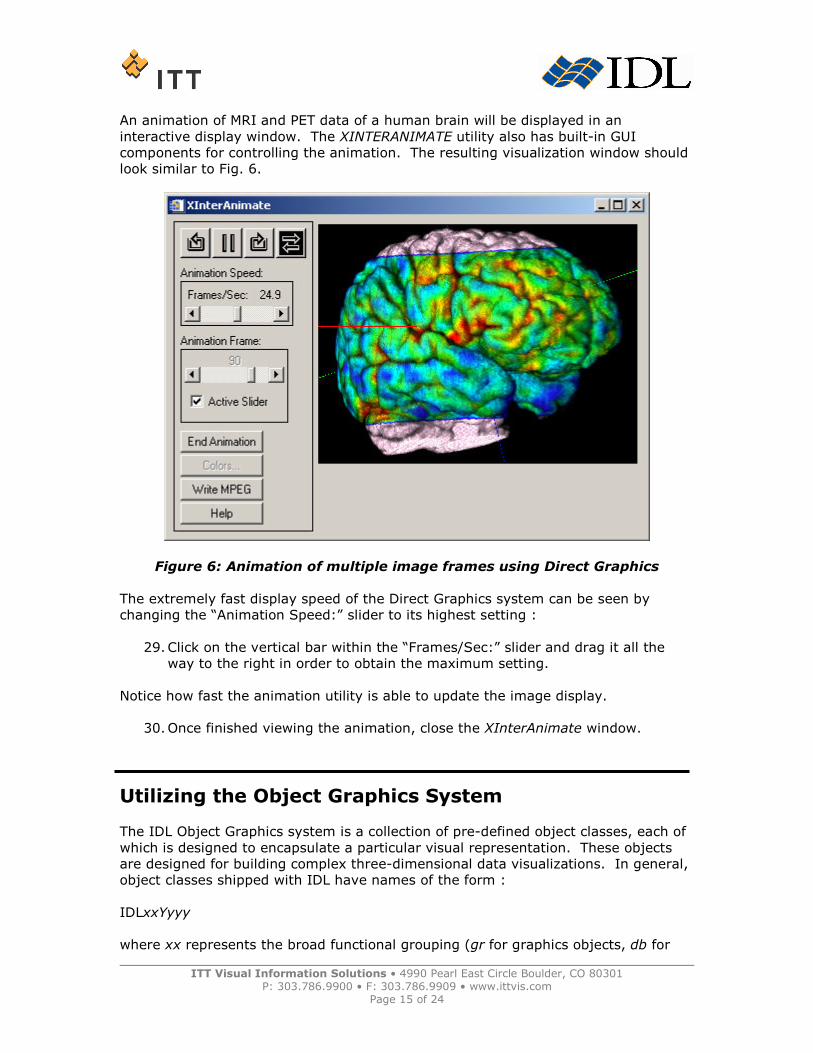
An animation of MRI and PET data of a human brain will be displayed in an
interactive display window. The XINTERANIMATE utility also has built-in GUI
components for controlling the animation. The resulting visualization window should
look similar to Fig. 6.
Figure 6: Animation of multiple image frames using Direct Graphics
The extremely fast display speed of the Direct Graphics system can be seen by
changing the “Animation Speed:” slider to its highest setting :
29. Click on the vertical bar within the “Frames/Sec:” slider and drag it all the
way to the right in order to obtain the maximum setting.
Notice how fast the animation utility is able to update the image display.
30. Once finished viewing the animation, close the XInterAnimate window.
Utilizing the Object Graphics System
The IDL Object Graphics system is a collection of pre-defined object classes, each of
which is designed to encapsulate a particular visual representation. These objects
are designed for building complex three-dimensional data visualizations. In general,
object classes shipped with IDL have names of the form :
IDLxxYyyy
where xx represents the broad functional grouping (gr for graphics objects, db for
ITT Visual Information Solutions • 4990 Pearl East Circle Boulder, CO 80301 P: 303.786.9900 • F: 303.786.9909 • www.ittvis.com
Page 16 of 24
database objects, an for analysis objects, ff for file format objects, etc.). Yyyy is the
class name itself (such as Axis or Surface). For example, the IDLgrAxis object
provides an encapsulation of all of the components associated with a graphical
representation of an axis.
Object Graphics should be thought of as a collection of building blocks. In order to
display something on the screen, the user selects the appropriate set of blocks and
puts them together so that as a group they provide a visual result. In this respect,
Object Graphics are quite different than Direct Graphics. A single line of code is
unlikely to produce a complete visualization. Furthermore, a basic understanding of
the IDL object system is required (for instance, how to create an object, how to call
a method, how to destroy an object, etc.). Because of the level at which these
objects are presented, Object Graphics are aimed at application programmers rather
than command line users. The syntax involved in working with objects in the IDL
language is a bit different than the statements that have been executed thus far in
this tutorial. Consequently, a brief introduction to IDL objects and object-oriented
concepts is necessary.
IDL objects are actually special variables known as heap variables, which means
that they are global in scope and provide explicit user control over their lifetimes.
Object heap variables can only be accessed via object references. In order to
perform an action on an object’s instance data (such as the modification of
attributes), you must call one of the object’s methods. To call a method, you must
use the method invocation operator “->” (the hyphen followed by the greater-than
sign). The syntax is :
ObjRef->Method
where ObjRef is an object reference and Method is a method belonging either to the
object’s class or to one of its superclasses. The method may be specified either
partially (using only the method name) or completely using both the class name and
method name, connected with two colons :
ObjRef->ClassName::MethodName
In order to utilize Object Graphics, the user must build a self-contained hierarchy of
the appropriate objects that is subsequently drawn to a destination object. The 5
primary building blocks of an Object Graphics visualization are :
• Destination object : The device (such as a window, memory buffer, file,
clipboard, or printer) to which the visualization is to be rendered.
• Scene object : A container that can hold multiple views (if necessary).
• View object : The viewport rectangle (within the destination) within which
the rendering is to appear (as well as how data should be projected into that
rectangle).
• Model object : A transformation node.
• Atomic Graphic object : A graphical representation of data (such as an axis,
line plot, or surface mesh, text annotation, etc.).
For example, in the following exercise a hierarchy of objects will be created that
contain a simple line plot visualization, and this hierarchy will be drawn to a display
window destination object :
ITT Visual Information Solutions • 4990 Pearl East Circle Boulder, CO 80301 P: 303.786.9900 • F: 303.786.9909 • www.ittvis.com
Page 17 of 24
1. Create a simple one-dimensional dataset that can be displayed as a line plot
by executing a series of statements at the IDL> command prompt :
IDL> x = FINDGEN (720)
IDL> y = SIN (x * !DTOR) * COS (x * !DTOR / 3)
IDL> x = x / 450 - 0.8
2. Create an instance of the IDLgrPlot object class for this data using the
OBJ_NEW function. The object reference for this line plot is returned into the
variable named “oPlot” :
IDL> oPlot = OBJ_NEW ('IDLgrPlot', x, y)
3. Create an IDLgrModel object and execute the “Add” method in order to add
the line plot object to the model. Once this is accomplished, the model object
will contain the plot object :
IDL> oModel = OBJ_NEW ('IDLgrModel')
IDL> oModel -> Add, oPlot
4. Create an IDLgrView object and add the model to it :
IDL> oView = OBJ_NEW ('IDLgrView')
IDL> oView -> Add, oModel
5. Create an IDLgrWindow destination object, setting the RETAIN keyword equal
to 2 so that IDL is forced to provide backing store :
IDL> oWindow = OBJ_NEW ('IDLgrWindow', RETAIN=2)
6. Once this is accomplished, the entire object hierarchy can be rendered by
executing the Draw method with the top object container :
IDL> oWindow -> Draw, oView
The resulting visualization window should look similar to Fig. 7.
ITT Visual Information Solutions • 4990 Pearl East Circle Boulder, CO 80301 P: 303.786.9900 • F: 303.786.9909 • www.ittvis.com
Page 18 of 24
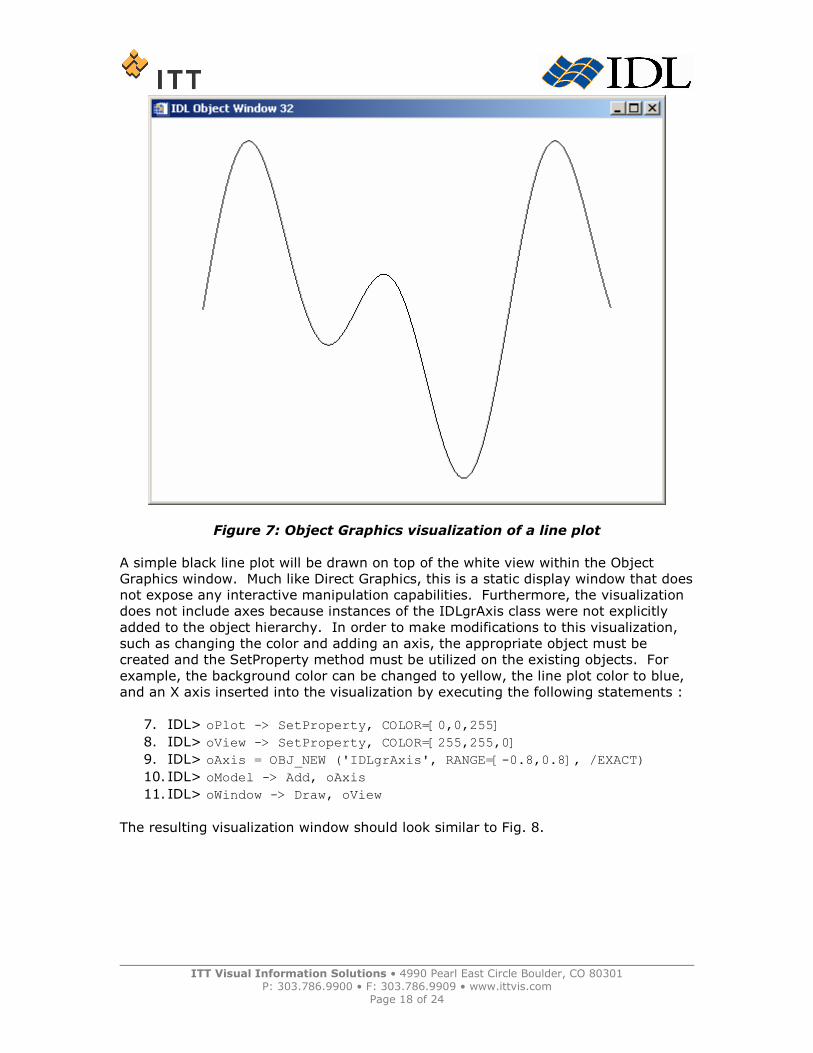
Figure 7: Object Graphics visualization of a line plot
A simple black line plot will be drawn on top of the white view within the Object
Graphics window. Much like Direct Graphics, this is a static display window that does
not expose any interactive manipulation capabilities. Furthermore, the visualization
does not include axes because instances of the IDLgrAxis class were not explicitly
added to the object hierarchy. In order to make modifications to this visualization,
such as changing the color and adding an axis, the appropriate object must be
created and the SetProperty method must be utilized on the existing objects. For
example, the background color can be changed to yellow, the line plot color to blue,
and an X axis inserted into the visualization by executing the following statements :
7. IDL> oPlot -> SetProperty, COLOR=[0,0,255]
8. IDL> oView -> SetProperty, COLOR=[255,255,0]
9. IDL> oAxis = OBJ_NEW ('IDLgrAxis', RANGE=[-0.8,0.8], /EXACT)
10. IDL> oModel -> Add, oAxis
11. IDL> oWindow -> Draw, oView
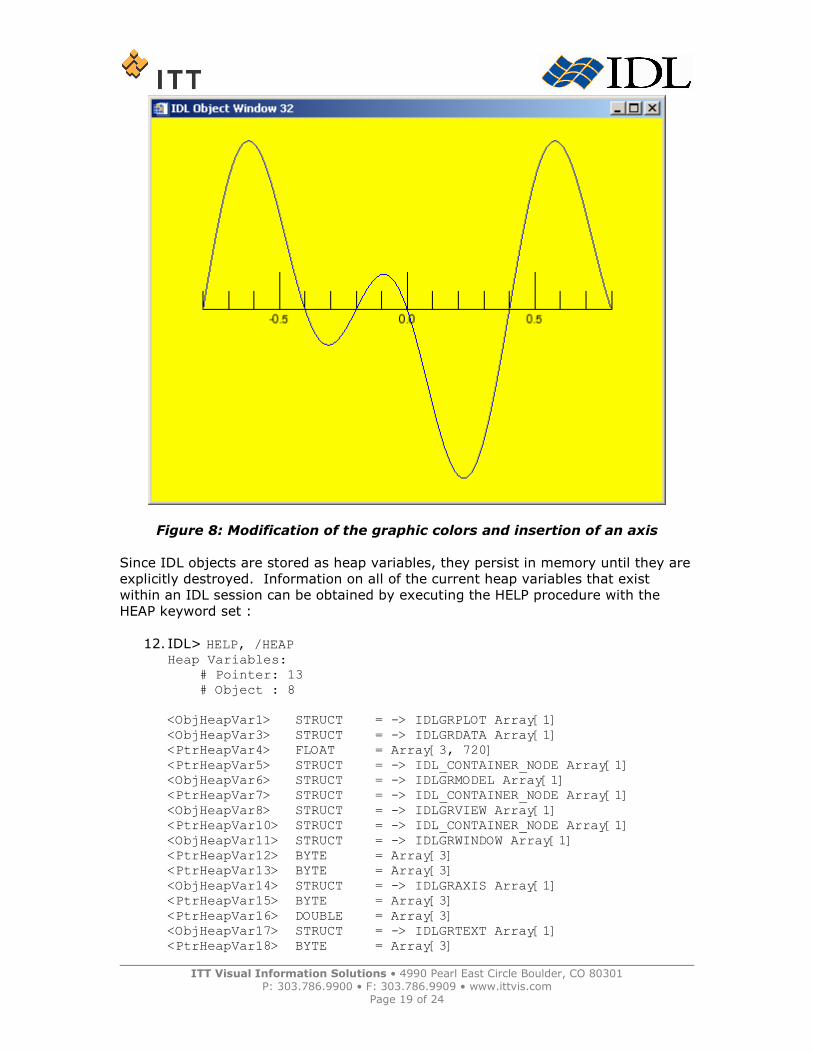
The resulting visualization window should look similar to Fig. 8.
ITT Visual Information Solutions • 4990 Pearl East Circle Boulder, CO 80301 P: 303.786.9900 • F: 303.786.9909 • www.ittvis.com
Page 19 of 24
Figure 8: Modification of the graphic colors and insertion of an axis
Since IDL objects are stored as heap variables, they persist in memory until they are
explicitly destroyed. Information on all of the current heap variables that exist
within an IDL session can be obtained by executing the HELP procedure with the
HEAP keyword set :
12. IDL> HELP, /HEAP Heap Variables: # Pointer: 13 # Object : 8 <ObjHeapVar1> STRUCT = -> IDLGRPLOT Array[1] <ObjHeapVar3> STRUCT = -> IDLGRDATA Array[1] <PtrHeapVar4> FLOAT = Array[3, 720] <PtrHeapVar5> STRUCT = -> IDL_CONTAINER_NODE Array[1] <ObjHeapVar6> STRUCT = -> IDLGRMODEL Array[1] <PtrHeapVar7> STRUCT = -> IDL_CONTAINER_NODE Array[1] <ObjHeapVar8> STRUCT = -> IDLGRVIEW Array[1] <PtrHeapVar10> STRUCT = -> IDL_CONTAINER_NODE Array[1] <ObjHeapVar11> STRUCT = -> IDLGRWINDOW Array[1] <PtrHeapVar12> BYTE = Array[3] <PtrHeapVar13> BYTE = Array[3] <ObjHeapVar14> STRUCT = -> IDLGRAXIS Array[1] <PtrHeapVar15> BYTE = Array[3] <PtrHeapVar16> DOUBLE = Array[3] <ObjHeapVar17> STRUCT = -> IDLGRTEXT Array[1] <PtrHeapVar18> BYTE = Array[3]
ITT Visual Information Solutions • 4990 Pearl East Circle Boulder, CO 80301 P: 303.786.9900 • F: 303.786.9909 • www.ittvis.com
Page 20 of 24
<PtrHeapVar19> STRING = Array[3] <PtrHeapVar20> DOUBLE = Array[3, 3] <PtrHeapVar21> OBJREF = <ObjHeapVar17(IDLGRTEXT)> <ObjHeapVar22> STRUCT = -> IDLGRFONT Array[1] <PtrHeapVar23> STRUCT = -> IDL_CONTAINER_NODE Array[1]
The output from the HELP procedure illustrates that a number of objects and pointers
have been created and are currently using memory within the current IDL session.
In order to destroy all of the heap variables associated with this visualization and
free the memory that is currently being used, the OBJ_DESTROY procedure must be
used in order to complete the object life cycle :
13. IDL> OBJ_DESTROY, oWindow
14. IDL> OBJ_DESTROY, oView
Notice that destroying the top level object in a hierarchy (the view object in this
case) destroys all of the other objects it contains. Once this is accomplished,
another call to the HELP procedure should show that all of the heap variables have
been destroyed (and the memory they were using released) :
15. IDL> HELP, /HEAP Heap Variables: # Pointer: 0 # Object : 0
The number of steps involved in creating an Object Graphics visualization from
scratch clearly demonstrate the need to write programs that create the entire object
hierarchy that is needed in order to display the graphic. Fortunately, there are a
number of pre-built utilities that are included with the IDL software package that
help the user visualize data using Object Graphics.
One of these utilities is called XDXF, and it is used to visualize geometric shapes
stored in AutoCAD DXF format files as 3-Dimensional polygonal objects. Another
more generic utility called XOBJVIEW can be used to quickly and easily visualize and
manipulate Object Graphics on screen. In the following exercise, a geometry from
the example data file “F-14.dxf” will be input into both of these utilities. This
example data file is located in the “data” subfolder.
This dataset contains the vertices and polygonal connectivity to define the three-
dimensional geometry for a F-14 fighter jet. Start by launching the XDXF utility :
16. IDL> XDXF
Since no filename was specified, a native file selection dialog will appear entitled
“Select DXF File to Read”.
17. Select the “F-14.dxf” file and press the “OK” button.
Two separate windows will appear once the data has been input from the DXF file; a
display window entitled “F-14.dxf”, and a window entitled “XDXF Information” that
displays information on the contents of the DXF file. The user can click-and-drag
with the mouse and execute the selected manipulation control on the object within
ITT Visual Information Solutions • 4990 Pearl East Circle Boulder, CO 80301 P: 303.786.9900 • F: 303.786.9909 • www.ittvis.com
Page 21 of 24
the display window. There is also several pieces of functionality exposed in the
menu system built into the F-14.dxf window.
18. Once finished viewing the 3-D geometry visualization, close the XDXF
Information window.
Within the XDXF utility, the geometry object is displayed by default with flat shading
and the vertex colors that are defined by the DXF file (in this case, all white). There
is no way to modify the appearance of the object unless the properties of the
underlying polygonal mesh object itself are modified. In order to give the geometry
object a more genuine appearance similar to that of a real F-14 fighter jet, the
Object Graphics components must be built manually.
In addition to graphical object classes, IDL also contains several file format objects
that are used to read and write data to files on disk. The DXF file format is one that
is handled using an object class in the IDL software package. The object class is
named “IDLffDXF”, and it can be utilized to input the data from the file “F-14.dxf”
file. Start by using the DIALOG_PICKFILE function to display the native file selection
dialog and select the “F-14.dxf” file on the harddrive :
19. IDL> file = DIALOG_PICKFILE (FILTER='F-14.dxf')
20. IDL> PRINT, file C:\Advanced_Graphics\data\F-14.dxf
Note: The string value for the “file” variable may be different depending on the location of the tutorial files on your computer.
Next, create an instance of the IDLffDXF object class and read-in the entity list by
executing the Read method :
21. IDL> oDXF = OBJ_NEW ('IDLffDXF')
22. IDL> status = oDXF -> Read (file)
Obtain the contents of the DXF file and filter the result so it only contains “FACE3D”
entity types by setting the filter argument equal to 10 while executing the
GetContents method :
23. IDL> contents = oDXF -> GetContents (10)
Once the contents have been determined, the actual data can be read-in by
executing the GetEntity method :
24. IDL> data = oDXF -> GetEntity (contents)
Make sure to destroy the object and free the heap memory :
25. IDL> OBJ_DESTROY, oDXF
Once this is accomplished, a new structure named “data” will exist in the current IDL
session :
26. IDL> HELP, data, /STRUCTURE ** Structure IDL_DXF_POLYGON, 13 tags, length=80, data length=78:
ITT Visual Information Solutions • 4990 Pearl East Circle Boulder, CO 80301 P: 303.786.9900 • F: 303.786.9909 • www.ittvis.com
Page 22 of 24
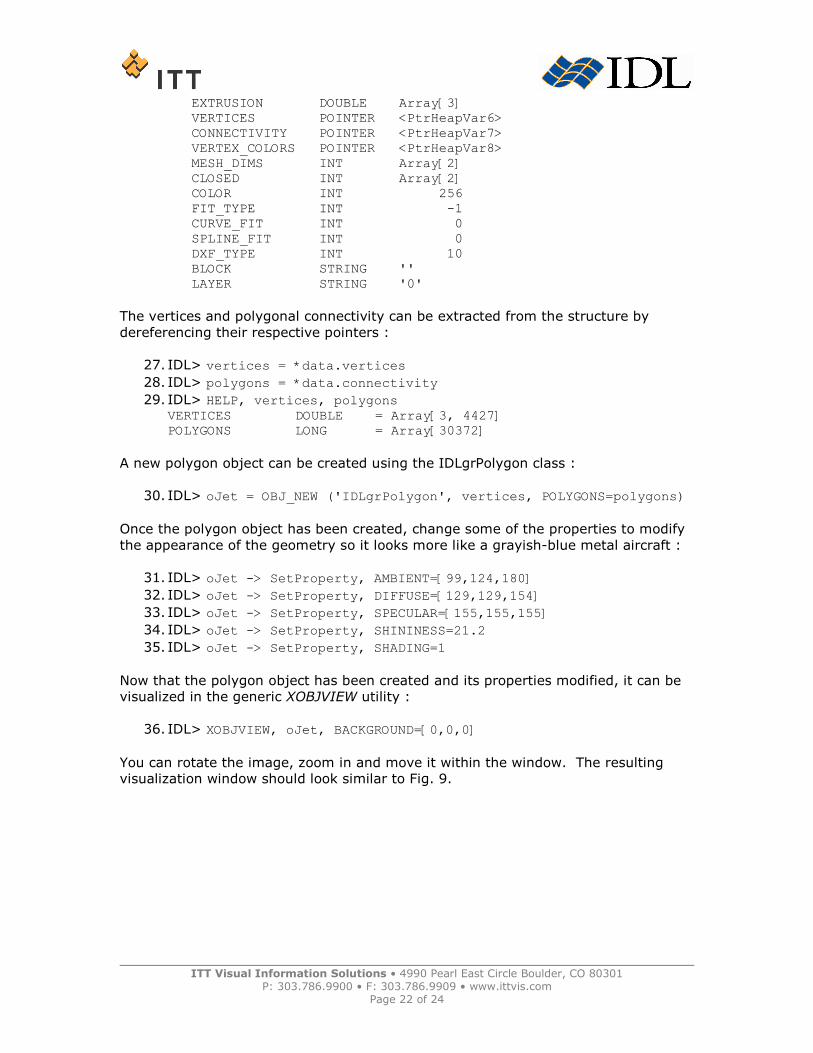
EXTRUSION DOUBLE Array[3] VERTICES POINTER <PtrHeapVar6> CONNECTIVITY POINTER <PtrHeapVar7> VERTEX_COLORS POINTER <PtrHeapVar8> MESH_DIMS INT Array[2] CLOSED INT Array[2] COLOR INT 256 FIT_TYPE INT -1 CURVE_FIT INT 0 SPLINE_FIT INT 0 DXF_TYPE INT 10 BLOCK STRING '' LAYER STRING '0'
The vertices and polygonal connectivity can be extracted from the structure by
dereferencing their respective pointers :
27. IDL> vertices = *data.vertices
28. IDL> polygons = *data.connectivity
29. IDL> HELP, vertices, polygons VERTICES DOUBLE = Array[3, 4427] POLYGONS LONG = Array[30372]
A new polygon object can be created using the IDLgrPolygon class :
30. IDL> oJet = OBJ_NEW ('IDLgrPolygon', vertices, POLYGONS=polygons)
Once the polygon object has been created, change some of the properties to modify
the appearance of the geometry so it looks more like a grayish-blue metal aircraft :
31. IDL> oJet -> SetProperty, AMBIENT=[99,124,180]
32. IDL> oJet -> SetProperty, DIFFUSE=[129,129,154]
33. IDL> oJet -> SetProperty, SPECULAR=[155,155,155]
34. IDL> oJet -> SetProperty, SHININESS=21.2
35. IDL> oJet -> SetProperty, SHADING=1
Now that the polygon object has been created and its properties modified, it can be
visualized in the generic XOBJVIEW utility :
36. IDL> XOBJVIEW, oJet, BACKGROUND=[0,0,0]
You can rotate the image, zoom in and move it within the window. The resulting
visualization window should look similar to Fig. 9.
ITT Visual Information Solutions • 4990 Pearl East Circle Boulder, CO 80301 P: 303.786.9900 • F: 303.786.9909 • www.ittvis.com
Page 23 of 24
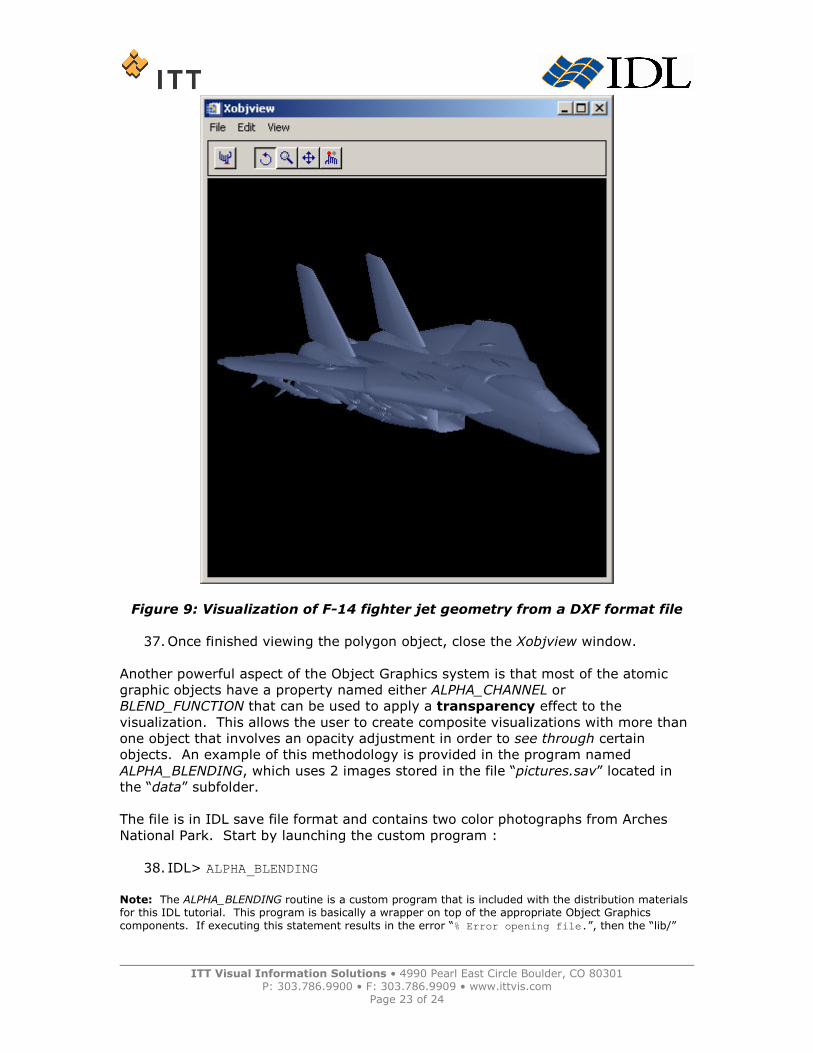
Figure 9: Visualization of F-14 fighter jet geometry from a DXF format file
37. Once finished viewing the polygon object, close the Xobjview window.
Another powerful aspect of the Object Graphics system is that most of the atomic
graphic objects have a property named either ALPHA_CHANNEL or
BLEND_FUNCTION that can be used to apply a transparency effect to the
visualization. This allows the user to create composite visualizations with more than
one object that involves an opacity adjustment in order to see through certain
objects. An example of this methodology is provided in the program named
ALPHA_BLENDING, which uses 2 images stored in the file “pictures.sav” located in
the “data” subfolder.
The file is in IDL save file format and contains two color photographs from Arches
National Park. Start by launching the custom program :
38. IDL> ALPHA_BLENDING
Note: The ALPHA_BLENDING routine is a custom program that is included with the distribution materials for this IDL tutorial. This program is basically a wrapper on top of the appropriate Object Graphics
components. If executing this statement results in the error “% Error opening file.”, then the “lib/”
ITT Visual Information Solutions • 4990 Pearl East Circle Boulder, CO 80301 P: 303.786.9900 • F: 303.786.9909 • www.ittvis.com
Page 24 of 24
subfolder included with this tutorial that contains this program file is not included in IDL’s path. To solve this problem simply open the program file into IDL and select "Run > Compile" from the main menu.
A standard native file selection dialog will appear entitled “Select “pictures.sav” file
to open”.
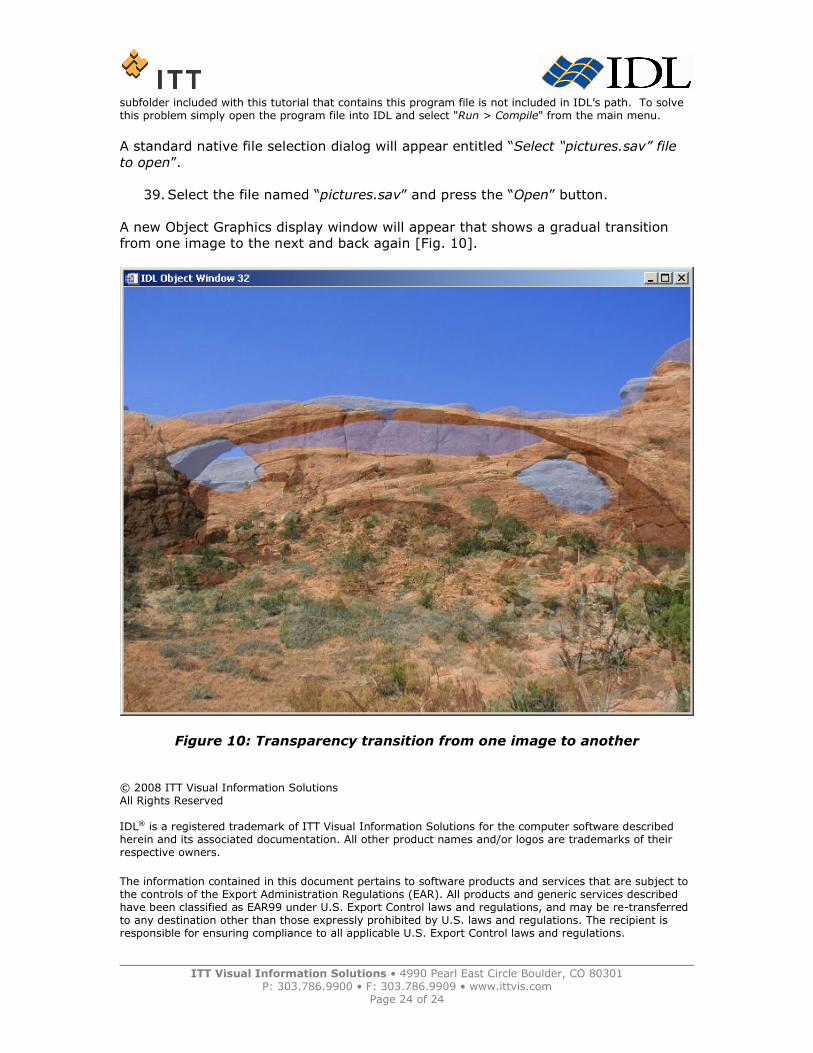
39. Select the file named “pictures.sav” and press the “Open” button.
A new Object Graphics display window will appear that shows a gradual transition
from one image to the next and back again [Fig. 10].
Figure 10: Transparency transition from one image to another
© 2008 ITT Visual Information Solutions All Rights Reserved IDL® is a registered trademark of ITT Visual Information Solutions for the computer software described herein and its associated documentation. All other product names and/or logos are trademarks of their respective owners.
The information contained in this document pertains to software products and services that are subject to the controls of the Export Administration Regulations (EAR). All products and generic services described have been classified as EAR99 under U.S. Export Control laws and regulations, and may be re-transferred to any destination other than those expressly prohibited by U.S. laws and regulations. The recipient is responsible for ensuring compliance to all applicable U.S. Export Control laws and regulations.