Embed Size (px)
Citation preview
World Review of Business Research
Vol. 5. No. 3. September 2015 Issue. Pp. 231 – 246
Idiosyncratic Risk for Technological Entrepreneurship
Iwona Staniec*
The identification of factors that affect the creation of value added is a problem both in theoretical and practical terms. This study shows what impact idiosyncratic risks have on building up of value added in companies pursuing technological entrepreneurship. Williamson (1985) introduced idiosyncratic risk as a kind of specific risk associated only with making decisions. The study sought to answer the following research questions: What factors determine idiosyncratic risk and what influence does idiosyncratic risk have on building a value-added technology entrepreneurship. Based on the 300-element sample (data collected in 2012) and using Pearson’s contingency coefficient, a model was constructed of the impact of idiosyncratic risk on creating value added. In research the company creates added value if within the three-year period tested (covering the years 2009, 2010 and 2011) it makes a profit or after a period of loss it starts making profit. Pearson’s contingency coefficient calculated using SPSS. The results confirm that the creation of added value for the company implementing entrepreneurship technological is significantly affected by situations in which idiosyncratic risks occur in the literature. The perception of decision risk is a very important in companies pursuing technological entrepreneurship.
JEL Codes: G32, D81 and O32
1. Introduction
Technological entrepreneurship in the segment of small and medium-sized companies is characterized by a tendency for innovative operations and high activity in the marketing of new products and by the transfer and adaptation of new technological solutions from scientific and technical sources, as the companies themselves have little potential to make it possible for them to conduct independent research and development activities. Technological entrepreneurship is thus exposed to the specific risks associated with a focus on the use of opportunities emerging in the environment. It combines the transfer of technology with intellectual and academic entrepreneurship, and revolves around the efforts to effectively connect the scientific potential of universities and research and development centers with the market and with business operations (Lachiewicz et al. 2013, pp. 14-15). Stawasz (2007, pp. 266) notes that technological entrepreneurship begins to take on importance as factors of civilizational progress, economic development and the creation of wealth in the modern world. The risk associated with the selection of a partner, conclusion of a contract, and the occurrence of events beyond the control of the partners is an important element of their business and plays an important role in shaping both added value and lasting relationships (Flaszewska and Kłos 2012, pp. 123). *PhD Iwona Staniec, Department of Management, Lodz University of Technology, Poland. Email: [email protected]
Staniec
232
The research of Marsh and Shapira (1987, pp. 1010) and Lachiewicz et al. (2013, pp. 165) show that only a few companies go beyond the stage of incubation and develop themselves. The reason for survival seems to be the specific risks undertaken that are individual for each of them and associated with prior choices of objectives and strategies; thus, an earlier undertaken risk relating to the business environment or to an internal company matter results in later success. Indeed, these earlier decisions constituted a risk to the company's obligations with respect to stakeholders. This paper seeks to show how such risks, understood as idiosyncratic risk, particular to the company and given situation, affects the building up of the value added of the company. But yet, scarcity of research has been conducted in this area. So it is clear that the implications of relationship between a value-added technology entrepreneurship and factors determine idiosyncratic risk, and that a better understanding of the antecedents that influence would be beneficial for stakeholders. The aim of this discussion is to determine the impact of idiosyncratic risk on the development of added value in companies pursuing technological entrepreneurship. The paper developed the following research questions: Q1. What factors determine idiosyncratic risk? Q2. How does idiosyncratic risk influence the building of a value-added technology entrepreneurship? This paper will be divided into 5 main sections. Section 1 introduces the theme of work and contains define research questions. Section 2 shows literature review, the author will analyze the major position about the factors which determine idiosyncratic risk in companies pursuing technological entrepreneurship. Section 3 explains the research methodology and the principle of creating a research model of the impact of idiosyncratic risk on creating value added. Section 4 presents the data analysis and the model of the impact of idiosyncratic risk on the creating value added and the findings in which the arguments of the paper will be holistically answered from research questions. Section 5 - the conclusion- recap the information of the paper and outline opportunities for further research and limitations of the study.
2. Literature Review The first conceptualization of risk in the field of economics is the work by Willett (1901). It defines risk as an objective state of the environment correlated with subjective uncertainty. Later Knight (1921) introduced the concept of measurable and immeasurable uncertainty, interpreting it on the basis of the theory of probability calculus. Neoclassical theory, in accordance with the theory of Smith and Stulz (1995, pp. 391-405) treats risk as a source of cost and in return for its bearing suggests entrepreneurs gain extra profit. It strengthens the concept of a negative perception of risk. Neoclassical theory allows only for probabilistic risk, which is subject to a full valuation (Knight 1921), and it is not part of theories explaining the phenomenon of risk management. The theory of corporate finance is the first one to distinguish risk management in line with the postulates of Modigliani and Miller (1958, pp. 261-297). During this period, Smith and Stulz showed that the value of the company increases as a result of the application of risk management (Smith and Stulz 1995, pp. 391-405). Within the framework of the theory of systems Gadomski (2012) stresses the importance of information, knowledge and preference (e.g. ethics) in decision-making in the context of the risk that it entails. The theory of expected utility introduced by Bernuolli, Neumann & Morgerstern had a high impact on the development of risk theory. New institutional economics, expanding economic analysis by consideration of institutions other
Staniec
233
than the economic ones, offers new opportunities for explanation of risk management. According to it, risk management can become a recognized, common practice among certain groups. Research in the field of risk management was conducted by Markowitz, Tobin and Scholes. Major contributions to the development of the theory of risk management were made by Markowitz, Miller and Sharpe. It is widely recognized that the formula BMS (Black - Merton - Scholes) became the basis for the development of the new field - not only in financial terms - of risk management and also of the concept of ‘neutral in risk perception. Allen et al. (2012, pp. 46 – 58) showed that in a variety of industries, there are different levels of risk perception. Later, risk begins to be interpreted as the variability of the result without the evaluating context. DeLoach (2000, pp. 5) argues that the combination of risk and management yielded a structured process approach, which combines the resources, assessment skills and uncertainty factors faced by the company in the process of shaping its value. Recent years have seen in both global science and, in the practice of management a lot of new concepts and methods of managing organizations, including the concepts and methods of risk management. Turbulent environments, globalization and increased competitiveness pose new challenges to companies and force them to revise existing concepts of action. Modern concepts of risk management developed as a result of a new paradigm of risk management, that recommends a comprehensive risk analysis of all organizational units, directions and activities (Krzakiewicz 2013, pp. 135). The evolution of the concept of risk comprehension has also had a large impact on the development of these concepts. The works of Marsh and Shapira (1987), MacCrimmon and Wehrung (1986), Małkowska-Borowczyk (2012) draw attention to the:
- Negative concept – considering risk only in the context of threats, - Neutral concept – the perception of risk as opportunity and threat, - Positive concept – perception of risk as an opportunity.
The positive concept has been discussed only recently, and its proponents are: Krupski (2012, pp. 3-8), Kuratko and Hodgetts (2004, pp.45-54). In studies by Lachiewicz et al. (2013, pp. 18-21) it was emphasized that the success of the process of technological entrepreneurship largely depends on the awareness of decision makers as well as on responsible risk-taking and risk managing. Still, there is little information in the literature on risk-perception and the conditioning of the decision-making processes undertaken by innovative entrepreneurs. Garnsey (1996) in his deliberations emphasizes that the role of the entrepreneur is crucial in strategic management, and the attitude of the entrepreneur plays a significant role in the search for market opportunities and meeting the needs of customers. Cromie, Callaghan & Jansen (1992) point to the ability to perceive and evaluate risks as the main personality traits of an entrepreneur. The individuality of the entrepreneur's approach to risk leads to different ways of estimating risk (Staniec 2011, pp. 242-258), the subjective perception of opportunity, taking responsibility for decisions and the disposition of a profit. Entrepreneurs perceive risk management as the volatility or precariousness of a future result. People with aversion to risk avoid such volatility and are ready to sacrifice even expected earnings in order to reduce the volatility of the result. In turn, people willing to risk are able to risk the expected profit to increase the volatility of the result (Marsh and Shapira 1987, pp. 1404-1418). The paper by Głodek and Łobacz (2013) shows a simplified model describing the relationship between risk and the entrepreneur's decisions and entrepreneurial activities based on company resources. The authors assume that the value added of risk management is an entrepreneurial pension, treated as a random and occasional value that is highly individually conditioned by an entrepreneur’s behavior. The studies of Busenitz (1999), Eiusenradt and Marin (2000),
Staniec
234
Wiklund and Shepherd (2003) show that a business is not does not base its risk management on a structured approach or on formal calculations. Entrepreneurs use a heuristic approach for this purpose, taking into account their own prejudices and preferences. Very often they deny the existence of a risk, or they accept it claiming that it does not refer directly to them. In the literature there is a lack of research on links between the level of risk and the resources used for specific activities (Urbanowska-Sojkin 2013, pp. 281-354, Zakrzewska-Bielawska 2012, pp. 514-524). As we know, the process of the development of technological entrepreneurship is associated with the implementation of innovative undertakings, and thus poses a high risk. Results of research by Adnan et al. (2011, pp. 61-77) confirmed the 4 dimensions of HRM practices: participation, reward, training and development, and of teamwork practices in Malaysian R&D Companies.
Idiosyncratic risk is the risk specific to the company, which affects individuals in special circumstances associated with some determinants of decision-making. Idiosyncratic risk is therefore not associated with the risk of the overall market. This concept was first introduced by Williamson (1985, pp. 62-72), who noted that this is a highly specialized risk in relation to a given relationship, which prevents or hinders its transfer. To sum up, the creation of idiosyncratic risks is affected by the:
- Qualifications and competence of the personnel and the management, the approach to the control of resources, the ability to create and develop knowledge and the capacity to develop relational resources,
- Interactions between the company and the potential of the external and internal environments, trends and effects of co-opetition.
Watkins and Bazerman (2004, pp. 52-62) perceive idiosyncratic risk as an approach to the flow of information, the perception of the decision-making process and responding to errors. Farjoun (2008, pp. 1010) emphasizes that an increase in risk and uncertainty in the proximal and distal environments of technological entrepreneurship result in the emergence of a new idiosyncratic risk. Ansoff (1985, pp.71) highlights the impact of the inclination to take risk or the lack of it on the goals of the company and on the field of its activity. Yannopoulos (2011, pp. 67- 77) see the following as strongly influential: strategic interdependence and interaction, strategy as the search for competitive advantage, the element of surprise, creating mixed motives for competitors, concentration of force, and the path of least resistance.
3. The Methodology and Model The analyzes used secondary data collected during a survey carried out by employees of the Department of Management, University of Lodz, in the years 2010 - 2013 as part of research project N N115 364839 (Lachiewicz et al. 2013). The study used a random selection of a 300-element sample based on a sampling frame provided by an external company, which was limited to the SME sector and to companies headquarters in the Lodz region. The study used a survey technique in which the survey research tool, in the form of a specially prepared questionnaire, was handed out directly in a given company. In the presented analyzes only the portion of the questionnaire was used that measured idiosyncratic risk. In order to determine the level of influence of idiosyncratic risk on the building of value added, C-Pearson's contingency coefficient was used (Everitt 1977, pp. 134-136) in the presented results as a measure of the value of the relationship between the two traits
Staniec
235
measured on a nominal scale or one trait measured on a nominal scale and the another trait measured on an ordinal scale, and presented in a contingency table. It was calculated from
the formula: n
C
2
2
where 2 - represented the empirical value of statistical
independence– square, n- sample size. It was found that a significant influence is the one for which the significance level is less than 0.05. The following thresholds for the assessment of the strength of significant influence were adopted (King and Minium 2009, pp. 201):
Up to 0.15 – weak (marginal) influence;
From 0.15 to 0.25 – moderate influence;
From 0.25 to 0.4 – significant influence,
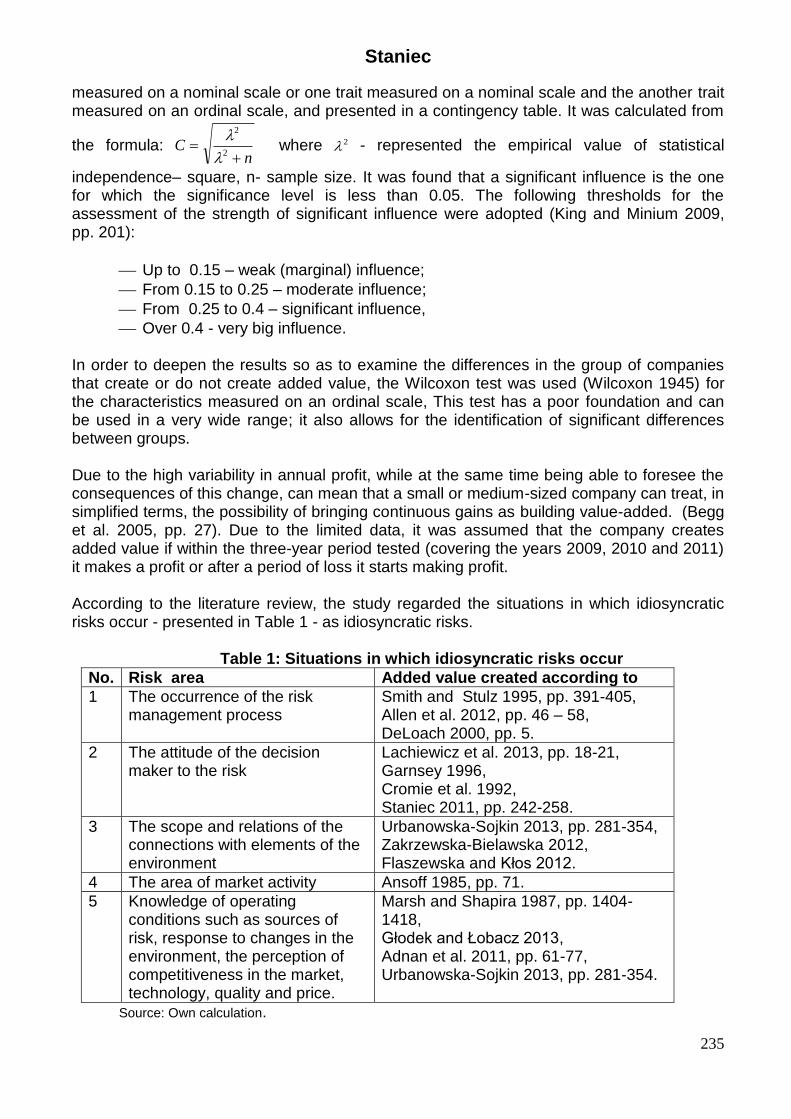
Over 0.4 - very big influence. In order to deepen the results so as to examine the differences in the group of companies that create or do not create added value, the Wilcoxon test was used (Wilcoxon 1945) for the characteristics measured on an ordinal scale, This test has a poor foundation and can be used in a very wide range; it also allows for the identification of significant differences between groups. Due to the high variability in annual profit, while at the same time being able to foresee the consequences of this change, can mean that a small or medium-sized company can treat, in simplified terms, the possibility of bringing continuous gains as building value-added. (Begg et al. 2005, pp. 27). Due to the limited data, it was assumed that the company creates added value if within the three-year period tested (covering the years 2009, 2010 and 2011) it makes a profit or after a period of loss it starts making profit. According to the literature review, the study regarded the situations in which idiosyncratic risks occur - presented in Table 1 - as idiosyncratic risks.
Table 1: Situations in which idiosyncratic risks occur
No. Risk area Added value created according to
1 The occurrence of the risk management process
Smith and Stulz 1995, pp. 391-405, Allen et al. 2012, pp. 46 – 58, DeLoach 2000, pp. 5.
2 The attitude of the decision maker to the risk
Lachiewicz et al. 2013, pp. 18-21, Garnsey 1996, Cromie et al. 1992, Staniec 2011, pp. 242-258.
3 The scope and relations of the connections with elements of the environment
Urbanowska-Sojkin 2013, pp. 281-354, Zakrzewska-Bielawska 2012, Flaszewska and Kłos 2012.
4 The area of market activity Ansoff 1985, pp. 71.
5 Knowledge of operating conditions such as sources of risk, response to changes in the environment, the perception of competitiveness in the market, technology, quality and price.
Marsh and Shapira 1987, pp. 1404-1418, Głodek and Łobacz 2013, Adnan et al. 2011, pp. 61-77, Urbanowska-Sojkin 2013, pp. 281-354.
Source: Own calculation.
Staniec
236
For the purposes of the research, it was examined whether the surveyed companies ran a risk management process. This examination looked for the following six elements: employing a specialist for risk management, keeping records of risk, updating records on an ongoing basis, creating a catalogue of opportunities and threats, taking steps to minimize risks to an acceptable level and conducting performance assessment of risk mitigation. It was assumed in the study, that if even one of these elements occurred, the company had a risk management process, regardless of how mature this process might be, and if none of these elements occurred, the company did not implement the risk management process. One of the manifestations of idiosyncratic risk is the relation of decision-makers to risk expressed in the following three attitudes (Jajuga 2007, pp. 14):
- Aversion to risk – the decision-maker takes a risk when he expects compensation in the form of a risk premium,
- Indifference to risk – when deciding, the size of the risk does not matter to the decision-maker,
- Risk appetite – the decision-maker is willing to incur additional expenses in order to take a decision of a higher risk.
From the point of view of technological entrepreneurship, an understanding of the determinants influencing the perception of the risk of cooperation with stakeholders is all the more important in that the effects of interference emerging from one of cooperators can affect the other side (Flaszewska and Kłos 2012, pp. 123), and also, the more innovative a venture is, the more risky it is. Because of the theoretically big impact of determinants of decision-making on the occurrence of idiosyncratic risk, the studies have included the decision-makers' perception of risk sources, areas of the market, knowledge of the response to changes in the environment, the perception of competitiveness in the market, technology, quality and price. The perception of competitiveness in the tests carried out was evaluated using a three-point Likert scale (Likert 1932). The principal risks perceived by companies implementing technological entrepreneurship for their development are according to Lachiewicz et al. 2013:
- Poor contacts between the company and businesses offering financial services, including insurance;
- Action in a niche market; - Insufficient marketing activities; - Inadequate qualifications of the owners and managers.
The sources of risk were rated on a five-point Likert scale. A limitation of the constructed model would be the simplified perception of the added value of the company and the perception of the idiosyncratic risk as a determinant of the decision-making process.
Staniec
237
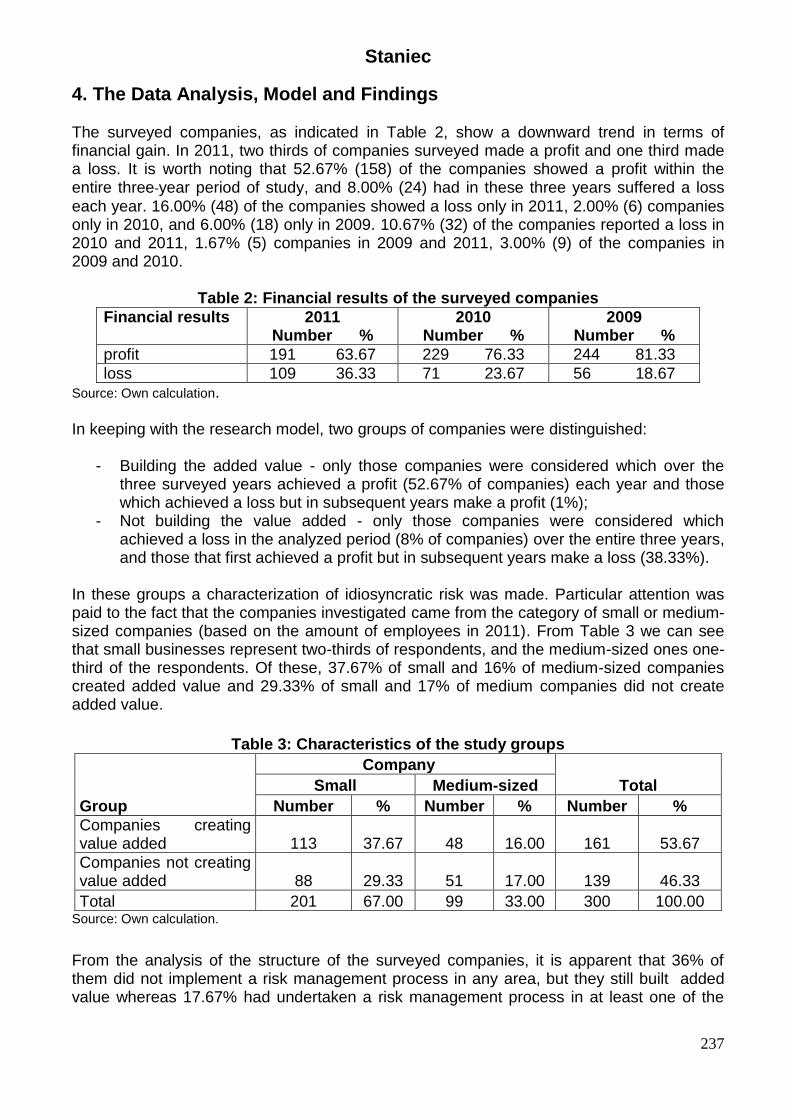
4. The Data Analysis, Model and Findings The surveyed companies, as indicated in Table 2, show a downward trend in terms of financial gain. In 2011, two thirds of companies surveyed made a profit and one third made a loss. It is worth noting that 52.67% (158) of the companies showed a profit within the entire three-year period of study, and 8.00% (24) had in these three years suffered a loss
each year. 16.00% (48) of the companies showed a loss only in 2011, 2.00% (6) companies only in 2010, and 6.00% (18) only in 2009. 10.67% (32) of the companies reported a loss in 2010 and 2011, 1.67% (5) companies in 2009 and 2011, 3.00% (9) of the companies in 2009 and 2010.
Table 2: Financial results of the surveyed companies
Financial results 2011 Number %
2010 Number %
2009 Number %
profit 191 63.67 229 76.33 244 81.33
loss 109 36.33 71 23.67 56 18.67
Source: Own calculation.
In keeping with the research model, two groups of companies were distinguished:
- Building the added value - only those companies were considered which over the three surveyed years achieved a profit (52.67% of companies) each year and those which achieved a loss but in subsequent years make a profit (1%);
- Not building the value added - only those companies were considered which achieved a loss in the analyzed period (8% of companies) over the entire three years, and those that first achieved a profit but in subsequent years make a loss (38.33%).
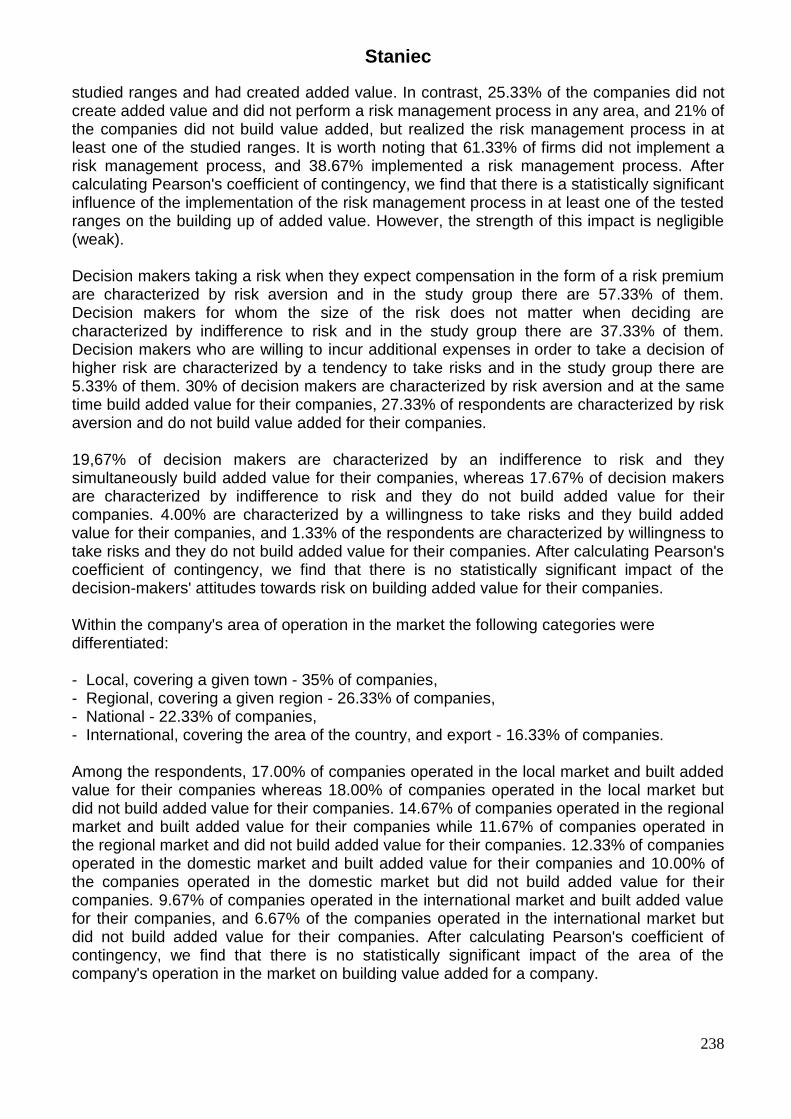
In these groups a characterization of idiosyncratic risk was made. Particular attention was paid to the fact that the companies investigated came from the category of small or medium-sized companies (based on the amount of employees in 2011). From Table 3 we can see that small businesses represent two-thirds of respondents, and the medium-sized ones one-third of the respondents. Of these, 37.67% of small and 16% of medium-sized companies created added value and 29.33% of small and 17% of medium companies did not create added value.
Table 3: Characteristics of the study groups
Group
Company
Total Small Medium-sized
Number % Number % Number %
Companies creating value added 113 37.67 48 16.00 161 53.67
Companies not creating value added 88 29.33 51 17.00 139 46.33
Total 201 67.00 99 33.00 300 100.00 Source: Own calculation.
From the analysis of the structure of the surveyed companies, it is apparent that 36% of them did not implement a risk management process in any area, but they still built added value whereas 17.67% had undertaken a risk management process in at least one of the
Staniec
238
studied ranges and had created added value. In contrast, 25.33% of the companies did not create added value and did not perform a risk management process in any area, and 21% of the companies did not build value added, but realized the risk management process in at least one of the studied ranges. It is worth noting that 61.33% of firms did not implement a risk management process, and 38.67% implemented a risk management process. After calculating Pearson's coefficient of contingency, we find that there is a statistically significant influence of the implementation of the risk management process in at least one of the tested ranges on the building up of added value. However, the strength of this impact is negligible (weak). Decision makers taking a risk when they expect compensation in the form of a risk premium are characterized by risk aversion and in the study group there are 57.33% of them. Decision makers for whom the size of the risk does not matter when deciding are characterized by indifference to risk and in the study group there are 37.33% of them. Decision makers who are willing to incur additional expenses in order to take a decision of higher risk are characterized by a tendency to take risks and in the study group there are 5.33% of them. 30% of decision makers are characterized by risk aversion and at the same time build added value for their companies, 27.33% of respondents are characterized by risk aversion and do not build value added for their companies. 19,67% of decision makers are characterized by an indifference to risk and they simultaneously build added value for their companies, whereas 17.67% of decision makers are characterized by indifference to risk and they do not build added value for their companies. 4.00% are characterized by a willingness to take risks and they build added value for their companies, and 1.33% of the respondents are characterized by willingness to take risks and they do not build added value for their companies. After calculating Pearson's coefficient of contingency, we find that there is no statistically significant impact of the decision-makers' attitudes towards risk on building added value for their companies. Within the company's area of operation in the market the following categories were differentiated: - Local, covering a given town - 35% of companies, - Regional, covering a given region - 26.33% of companies, - National - 22.33% of companies, - International, covering the area of the country, and export - 16.33% of companies. Among the respondents, 17.00% of companies operated in the local market and built added value for their companies whereas 18.00% of companies operated in the local market but did not build added value for their companies. 14.67% of companies operated in the regional market and built added value for their companies while 11.67% of companies operated in the regional market and did not build added value for their companies. 12.33% of companies operated in the domestic market and built added value for their companies and 10.00% of the companies operated in the domestic market but did not build added value for their companies. 9.67% of companies operated in the international market and built added value for their companies, and 6.67% of the companies operated in the international market but did not build added value for their companies. After calculating Pearson's coefficient of contingency, we find that there is no statistically significant impact of the area of the company's operation in the market on building value added for a company.
Staniec
239
In terms of the reaction of the company to changes in the environment the following were distinguished:
- 23.15% of companies responding with a delay to changes in the environment, - 65.77% of companies responding to changes in the environment at a rate
comparable to the changes, - 11.07% of companies responding in advance to the changes in the environment.
It is worth noting that 17.11% of the companies responded slowly to changes in the environment and still managed to build added value, and 6.04% of the companies that responded slowly to changes in the environment did not build value added. Thus, almost three times more companies reacting with a delay to changes in the environment built value for the company in the form of profit. 33.56% of the companies that responded at a comparable rate to that of the changes in the environment built added value, and 32.21% of the companies that responded at a comparable rate to the changes in the environment did not build value added. Thus, the comparable number of companies responding at a comparable rate to the changes in the environment built and did not build added value. 3.02% of the companies that responded in advance to changes in the environment built added value and 8.05% of the companies that responded in advance to changes in the environment did not build value added. Almost three times fewer companies responding in advance to changes in the environment built added value than the companies, which did not build it. After calculating Pearson's coefficient of contingency, we find that there is a statistically significant impact of the company's response to changes in the environment on building value added. The force of this impact is fair (moderate). The competitiveness in technology of 16% of surveyed companies was perceived as poor while 71.33% - as good, and 12.67% of companies - as very good. Three times more companies perceiving their competitiveness in technology as poor did not build added value for the company. A similar number of companies saw their competitiveness in technology as good and built (39.67%) or did not build (31.67%) added value . 10.00% of companies saw their competitiveness in technology as very good and built added value, and only 2.67% saw their competitiveness in technology as very good and did not build added value. After calculating Pearson's coefficient of contingency, we find that there is a statistically significant influence of the perception of competitiveness in technology on the building of value added. The force of this influence is significant. 14.33% of the surveyed companies perceived as poor their competitiveness in terms of quality, while 72.67% as good and 13% as very good. 9.94% of firms saw their competitiveness in terms of quality as poor and built value added whereas 9% saw their competitiveness in terms of quality as poor but did not build value added. 41% of companies saw their competitiveness in terms of quality as good and built value added whereas 31.67% saw their competitiveness in terms of quality as good but did not build value added. 7.33% of firms saw their competitiveness in terms of quality as very good and built added value whereas 5.67% saw their competitiveness in terms of quality as very good but did not build value added. After calculating Pearson's coefficient of contingency, we find that there is no statistically significant influence of the perception of competitiveness in terms of quality on building value added. 10.5% of the surveyed companies perceived as poor their competitiveness in terms of price, while 67.5% as good and 22% as very good. 3.5% of companies saw their competitiveness in terms of price as poor and built value added whereas 7% saw their competitiveness in terms of price as poor but did not build value added. 39% of companies saw their competitiveness in terms of price as good and built value added whereas 28.5% saw their competitiveness in terms of price as good and did not
Staniec
240
build value added. 11% of companies saw their competitiveness in terms of price as very good and built value added whereas 11% saw their competitiveness in terms of price as very good but did not build value added. After calculating Pearson's coefficient of contingency, we find that there is no statistically significant influence of the perception of competitiveness in terms of price on building value added. 7.74% of the surveyed companies perceived as poor their market competitiveness, while 54.21% as good and 38.05% as very good. 4.38% saw their market competitiveness as poor and built added value whereas 3.37% saw their market competitiveness as poor but did not build value added. 34.68% of companies saw their market competitiveness as good and built value added whereas 19.53% saw their competitiveness on the market as good but did not build value added. 14.48% of companies saw their market competitiveness as very good and built value added whereas 23.57% saw their market competitiveness as very good but did not build value added. After calculating Pearson's coefficient of contingency, we find that there is a statistically significant influence of the perception of market competitiveness on building value added. The force of this influence is fair (moderate).
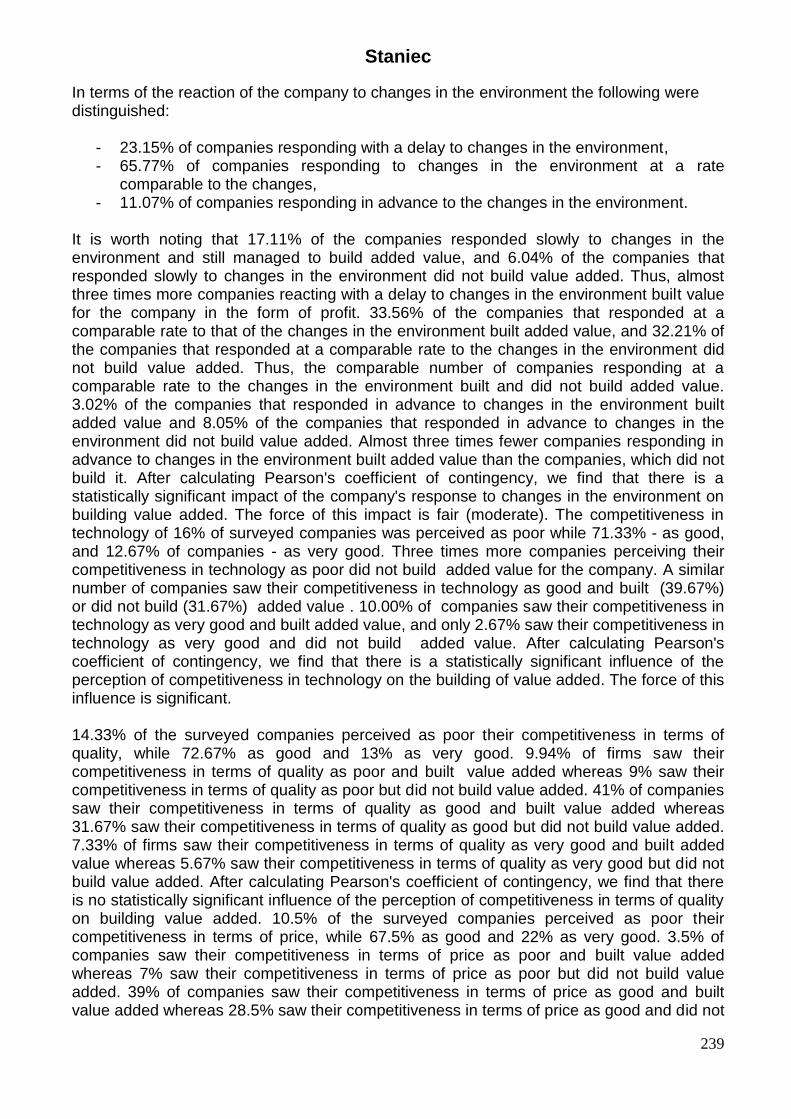
Figure 1: The average levels of risk sources in the studied groups
-
1
2
3
4
5
poor contacts withfinancial services,
including insurance
activity in a niche
market
insufficient marketing
activity
inadequatequalifications of
owners and managers
building value added
not building value added
Source: Own calculation.
Staniec
241
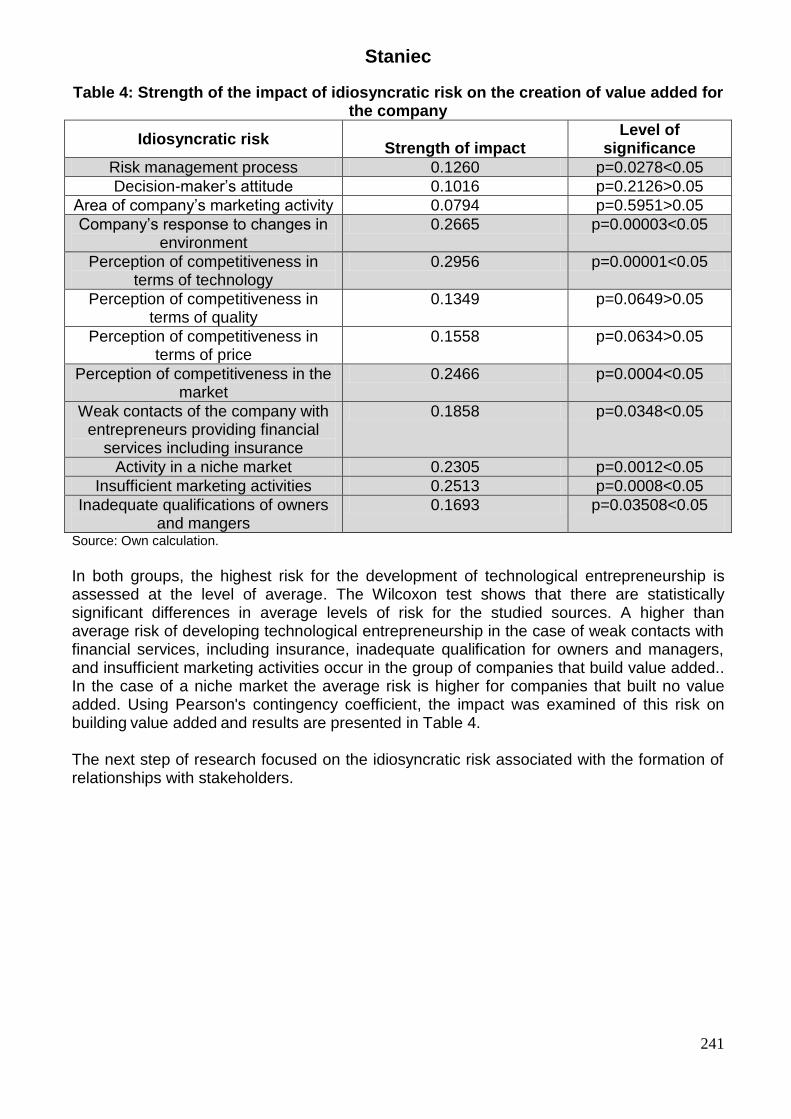
Table 4: Strength of the impact of idiosyncratic risk on the creation of value added for the company
Idiosyncratic risk Strength of impact
Level of significance
Risk management process 0.1260 p=0.0278<0.05
Decision-maker’s attitude 0.1016 p=0.2126>0.05
Area of company’s marketing activity 0.0794 p=0.5951>0.05
Company’s response to changes in environment
0.2665 p=0.00003<0.05
Perception of competitiveness in terms of technology
0.2956 p=0.00001<0.05
Perception of competitiveness in terms of quality
0.1349 p=0.0649>0.05
Perception of competitiveness in terms of price
0.1558 p=0.0634>0.05
Perception of competitiveness in the market
0.2466 p=0.0004<0.05
Weak contacts of the company with entrepreneurs providing financial
services including insurance
0.1858 p=0.0348<0.05
Activity in a niche market 0.2305 p=0.0012<0.05
Insufficient marketing activities 0.2513 p=0.0008<0.05
Inadequate qualifications of owners and mangers
0.1693 p=0.03508<0.05
Source: Own calculation.
In both groups, the highest risk for the development of technological entrepreneurship is assessed at the level of average. The Wilcoxon test shows that there are statistically significant differences in average levels of risk for the studied sources. A higher than average risk of developing technological entrepreneurship in the case of weak contacts with financial services, including insurance, inadequate qualification for owners and managers, and insufficient marketing activities occur in the group of companies that build value added.. In the case of a niche market the average risk is higher for companies that built no value added. Using Pearson's contingency coefficient, the impact was examined of this risk on building value added and results are presented in Table 4. The next step of research focused on the idiosyncratic risk associated with the formation of relationships with stakeholders.
Staniec
242
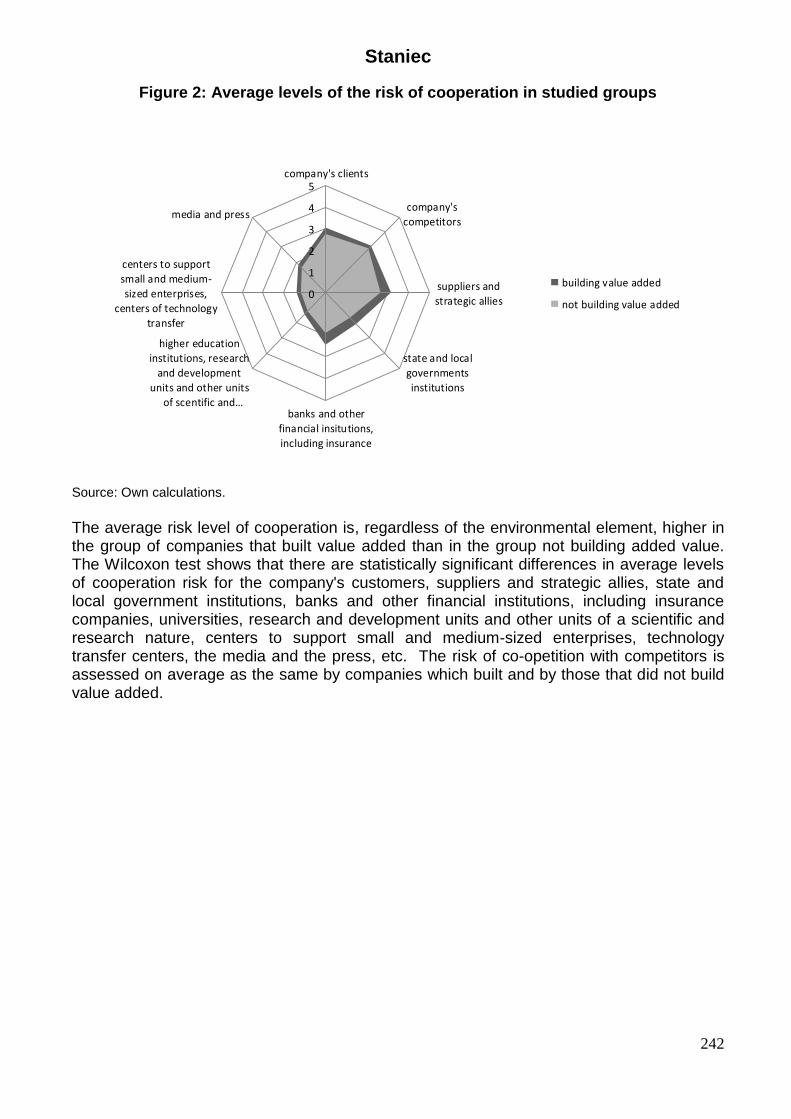
Figure 2: Average levels of the risk of cooperation in studied groups
0
1
2
3
4
5company's clients
company's
competitors
suppliers and
strategic allies
state and local
governments
institutions
banks and other
financial insitutions,
including insurance
higher education
institutions, research
and development
units and other units
of scentific and…
centers to support
small and medium-
sized enterprises,
centers of technology
transfer
media and press
building value added
not building value added
Source: Own calculations.
The average risk level of cooperation is, regardless of the environmental element, higher in the group of companies that built value added than in the group not building added value. The Wilcoxon test shows that there are statistically significant differences in average levels of cooperation risk for the company's customers, suppliers and strategic allies, state and local government institutions, banks and other financial institutions, including insurance companies, universities, research and development units and other units of a scientific and research nature, centers to support small and medium-sized enterprises, technology transfer centers, the media and the press, etc. The risk of co-opetition with competitors is assessed on average as the same by companies which built and by those that did not build value added.
Staniec
243
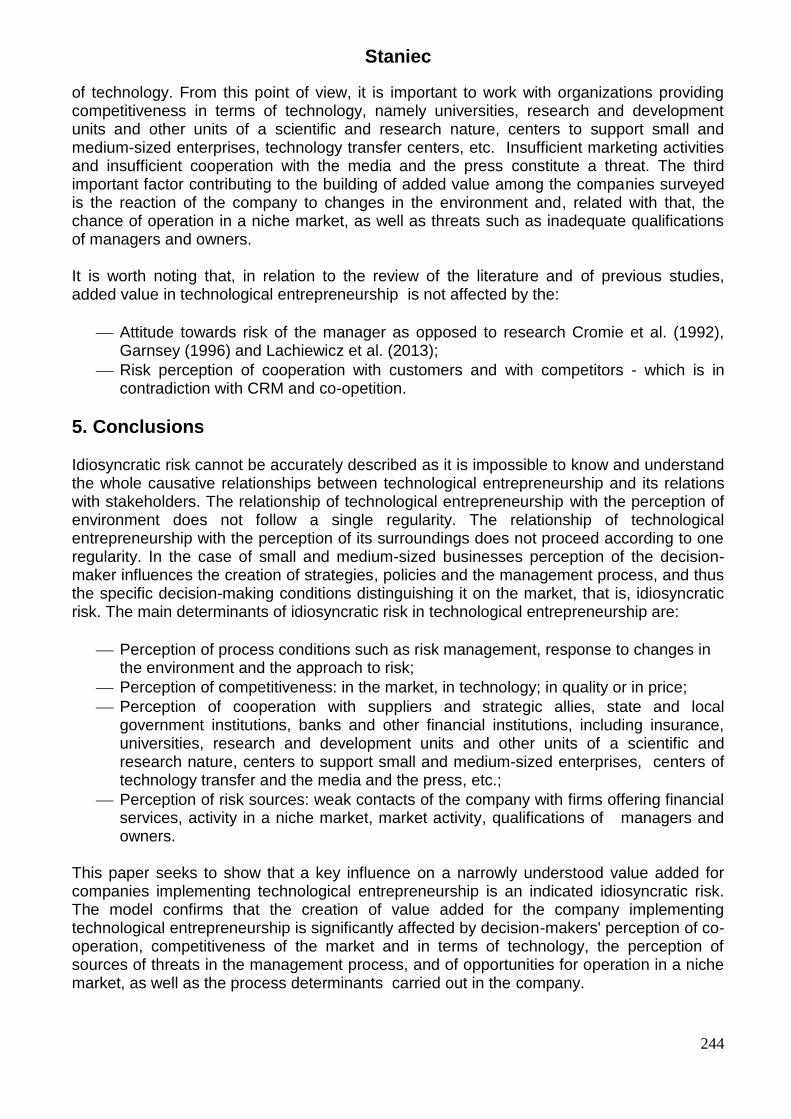
Table 5: Strength of the impact of the level of risk of cooperation with stakeholders on building value added
Element of the environment Strength of the impact
Level of significance
Company’s clients 0.1639 p=0.0891>0.05
Company’s competitors 0.1445 p=0.1801>0.05
Suppliers and strategic allies 0.3352 p=0.0000<0.05
State and local government institutions 0.2749 p=0.0002<0.05
Banks and other financial institutions including insurance
0.3862 p=0.0000<0.05
Universities, research and development units and other units of a scientific and
research nature
0.1803 p=0.0208<0.05
Centers to support small and medium-sized enterprises, centers of technology
transfer, etc.
0.1851 p=0.0164<0.05
The media and the press 0.2077 p=0.0049<0.05 Source: Own calculation.
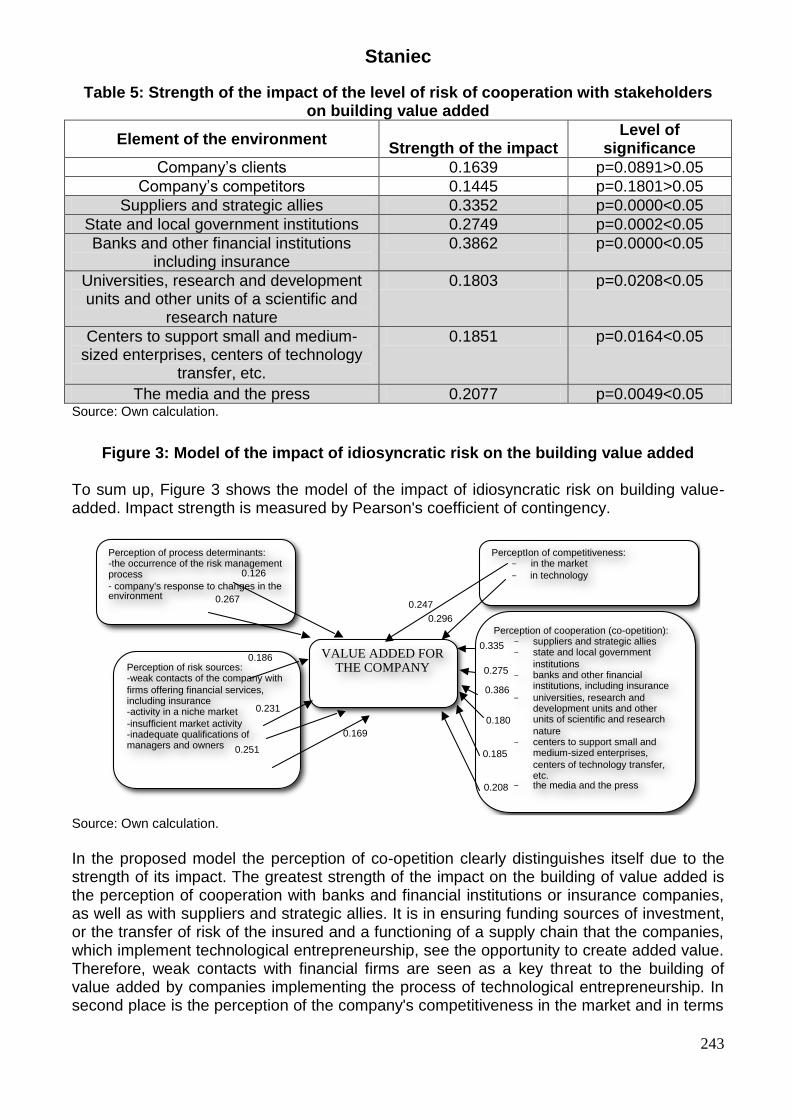
Figure 3: Model of the impact of idiosyncratic risk on the building value added
To sum up, Figure 3 shows the model of the impact of idiosyncratic risk on building value-added. Impact strength is measured by Pearson's coefficient of contingency.
VALUE ADDED FOR THE COMPANY
PerceptIon of competitiveness: - in the market
- in technology
Perception of cooperation (co-opetition): - suppliers and strategic allies - state and local government
institutions - banks and other financial
institutions, including insurance
- universities, research and development units and other units of scientific and research
nature - centers to support small and
medium-sized enterprises,
centers of technology transfer, etc.
- the media and the press
Perception of risk sources: -weak contacts of the company with
firms offering financial services, including insurance -activity in a niche market
-insufficient market activity -inadequate qualifications of managers and owners
Perception of process determinants: -the occurrence of the risk management process
- company's response to changes in the environment
0.126
0.267
0.169
0.251
0.186
0.231
0.247
0.296
0.335
0.275
0.386
0.180
0.185
0.208
Source: Own calculation.
In the proposed model the perception of co-opetition clearly distinguishes itself due to the strength of its impact. The greatest strength of the impact on the building of value added is the perception of cooperation with banks and financial institutions or insurance companies, as well as with suppliers and strategic allies. It is in ensuring funding sources of investment, or the transfer of risk of the insured and a functioning of a supply chain that the companies, which implement technological entrepreneurship, see the opportunity to create added value. Therefore, weak contacts with financial firms are seen as a key threat to the building of value added by companies implementing the process of technological entrepreneurship. In second place is the perception of the company's competitiveness in the market and in terms
Staniec
244
of technology. From this point of view, it is important to work with organizations providing competitiveness in terms of technology, namely universities, research and development units and other units of a scientific and research nature, centers to support small and medium-sized enterprises, technology transfer centers, etc. Insufficient marketing activities and insufficient cooperation with the media and the press constitute a threat. The third important factor contributing to the building of added value among the companies surveyed is the reaction of the company to changes in the environment and, related with that, the chance of operation in a niche market, as well as threats such as inadequate qualifications of managers and owners. It is worth noting that, in relation to the review of the literature and of previous studies, added value in technological entrepreneurship is not affected by the:
Attitude towards risk of the manager as opposed to research Cromie et al. (1992), Garnsey (1996) and Lachiewicz et al. (2013);
Risk perception of cooperation with customers and with competitors - which is in contradiction with CRM and co-opetition.
5. Conclusions Idiosyncratic risk cannot be accurately described as it is impossible to know and understand the whole causative relationships between technological entrepreneurship and its relations with stakeholders. The relationship of technological entrepreneurship with the perception of environment does not follow a single regularity. The relationship of technological entrepreneurship with the perception of its surroundings does not proceed according to one regularity. In the case of small and medium-sized businesses perception of the decision-maker influences the creation of strategies, policies and the management process, and thus the specific decision-making conditions distinguishing it on the market, that is, idiosyncratic risk. The main determinants of idiosyncratic risk in technological entrepreneurship are:
Perception of process conditions such as risk management, response to changes in the environment and the approach to risk;
Perception of competitiveness: in the market, in technology; in quality or in price;
Perception of cooperation with suppliers and strategic allies, state and local government institutions, banks and other financial institutions, including insurance, universities, research and development units and other units of a scientific and research nature, centers to support small and medium-sized enterprises, centers of technology transfer and the media and the press, etc.;
Perception of risk sources: weak contacts of the company with firms offering financial services, activity in a niche market, market activity, qualifications of managers and owners.
This paper seeks to show that a key influence on a narrowly understood value added for companies implementing technological entrepreneurship is an indicated idiosyncratic risk. The model confirms that the creation of value added for the company implementing technological entrepreneurship is significantly affected by decision-makers' perception of co-operation, competitiveness of the market and in terms of technology, the perception of sources of threats in the management process, and of opportunities for operation in a niche market, as well as the process determinants carried out in the company.
Staniec
245
The research presented in this work does not exhaust the issue in its entirety due to the limited perception of the value added of the company and the types of the idiosyncratic risk, which were investigated. In further studies the focus should be placed on deepening the issues associated with the creation of value added not only for the company but also for the customer and cooperator.
Acknowledgments The research paper was funded by National Science Centre in Poland under the project 2014/13/B/HS4/01517 with the funds allocated to science in the years 2015-2017 as the research project.
References Adnan, Z, Abdullah, HS & Ahmad J 2011, ‘Direct Influence of Human Resource
Management Practices on Financial Performance in Malaysian R&D Companies’, World Review of Business Research Vol. 1. No. 3. pp. 61-77.
Allen, DE, Kramadibrata, AR, Powell, RJ & Singh, AK 2012, ‘Identifying European Industries with Extreme Default Risk: Application of CVaR Techniques to Transition Matrices’, World Review of Business Research Vol. 2. No. 6, pp. 46 – 58.
Ansoff, I 1965, Corporate Strategy McGraw Hill, New York. Begg, D, Fischer S & Dornbusch R 2005, Economics, McHill Education New York. Busenitz, L W 1999, ‘Entrepreneurial Risk and Strategic Decision Making’, Journal of
Applied Behavioral Science, vol. 35, pp. 325-340. Cromie, S, Callaghan, I & Jansen, M 1992, ‘The Entrepreneurial Tendencies of Managers: A
Research Note’, British Journal of Management, Vol. 3, No. 1, pp. 1-5. DeLoch, JW 2000, Enterprise - Wide Risk Management – Strategies for Linking Risk and
Opportunity, Financial Time, Ulton. Eisenradt, KM & Marin, MA 2000, ‘Dynamic Capabilities: What Are They?’, Strategic
Management Journal, Vol. 21, No. 10-11, pp. 1504-1513. Everitt, BS 1977, The analysis of contingency tables. London: Chapman & Hall. Farjoun, M 2008 ‘Strategy making. Novelty and Analogical Reasoning’, Forthcoming in
Strategic Management Journal, Vol. 29, Issue 9, pp. 1001–1016. Flaszewska, S & Kłos, M 2012 ‘Ryzyko kooperencji w relacjach dostawca-odbiorca na
przykładzie Przedsiębiorstwa Innowacyjno-Wdrożeniowego Wifama-Prexer Sp. z o.o.’, Studia Ekonomiczne Regionu Łódzkiego, Łódź, pp. 121-136.
Gadomski, AM 2012, Global TOGA Meta-Theory, viewed 12.08.2012, <http://erg4146.casaccia.enea.it/ wwwerg26701/Gad-toga.htm>.
Garnsey, E 1996 A New Theory of the Growth of the Firm, Proceedings of the 41st ICBS World Conference, Stockholm.
Głodek, P & Łobacz K 2013, ‘Model ryzyka w decyzjach strategicznych małych firm innowacyjnych’, in: Urbanowska Sojkin E & Bartkowiak P (ed.) Ryzyko w zarządzaniu strategicznym, Wydawnictwo Uniwersytetu Ekonomicznego w Poznaniu, Poznań, pp. 245-262.
Jajuga, K (ed.) 2007, Zarządzanie ryzykiem, PWN Warszawa. King, B & Minium, E 2002, Statistical Reasoning In Psychology and Education, John Wiley &
Sons New York. Knight, FH 1921, Risk, Uncertainty and Profit, Schaffner & Marx, Boston, viewed 02.2013,
<http://www.econlib.org/library/Knight /knRUP.html>.
Staniec
246
Krupski, R 2012 ‘O okazjach raz jeszcze. Trochę teorii i raportu z badań’, Przegląd organizacji No 11, pp. 3-8.
Krzakiewicz, K 2013, ‘Zintegrowane podejście do zarządzania ryzykiem w zarządzaniu strategicznym’, in: Urbanowska-Sojkin, E & Brzozowski, M (ed.) Ryzyko w zarządzaniu strategicznym. Natura i uwarunkowania, Wydawnictwo Uniwersytetu Ekonomicznego w Poznaniu, Poznań, pp. 135-146.
Kuratko, D & Hodgetts, R 2004, Entrepreneurship. Theory, Process, Practice 6th ed., Thomson South-Western, Mason Ohio.
Lachiewicz, S, Matejun, M & Walecka, A (ed.) 2013 Przedsiębiorczość technologiczna w małych i średnich firmach. Czynniki rozwoju. Warszawa: Wydawnictwo WNT.
Likert, R 1932, ‘A Technique for the Measurement of Attitudes’, Archives of Psychology, Vol. 22, No 140, pp. 1–55.
MacCrimmona, K & Wehrunga DA 1986, Takings Risks. The Management of Uncertainty, Free Press, New York.
Małkowska-Borowczyk, M 2012, ‘Negatywna koncepcja ryzyka w teorii i praktyce zarządzania’, in: Urbanowska–Sojkin, E (ed.) Ryzyko w zarządzaniu strategicznym przedsiębiorstwem. Teoria i praktyka, Zeszyty Naukowe 235, Wydawnictwo Uniwersytetu Ekonomicznego w Poznaniu, Poznań, pp. 9-21.
Marsh, JG & Shapira Z 1987, ‘Managerial Perspectives on Risk and Risk Taking’, Management Science, Vol. 33 No. 11, pp. 1404-1418.
Miller, MH & Modigliani F 1958, ‘The Cost of Capital, Corporation Finance and the Theory of Investment’, American Economic Review, Vol. 48, pp. 261-297.
Smith, C & Stulz, RM 1995, ‘The Determinants of Firm's Hedging Policies’, Journal of Financial and Quantitative Analysis, Vol. 20 (4), pp. 391-405.
Staniec, I 2011, Uwarunkowania skuteczności zarządzania ryzykiem w organizacji, Zeszyty Naukowe nr 1099 Politechniki Łódzkiej, Łódź.
Stawasz, E 2007, ‘Stymulowanie przedsiębiorczości środowiska naukowego w Polsce’, Zeszyty Naukowe Uniwersytetu Szczecińskiego No. 453, Ekonomiczne Problemy Usług No. 8, pp. 265-276.
Urbanowska-Sojkin, E 2013, Ryzyko w wyborach strategicznych w przedsiębiorstwach, PWE Warszawa.
Watkins, MD & Bazerman, MH 2004 ‘Zaskoczeni przez kryzys, który można było przewidzieć’, Harvard Business Review Polska, No 11, pp. 52-62.
Wiklund, J & Shepherd, D 2003 ‘Aspiring for, and Achieving Growth: the Moderating Role of Resources and Opportunities’, Journal of Management Studies, No. 40, pp. 1919-1941.
Wilcoxon, F 1945 ‘Individual comparisons by ranking methods’, Biometrics Bulletin, No. 1, pp. 80–83.
Willett, AH 1901, ‘The Economic Theory of Risk and Insurant’, Studies in Political Science, Columbia University No. 2
Williamson, OE 1985, The Economic Institutions of Capitalism: Firms, Markets and Relational Contracting, The Free Press, A Division of Macmillan, Inc. New York, Collier Macmillan Publishers London.
Yannopoulos, P 2011, ‘Strategic Principles for Low Share Firms’, World Review of Business Research Vol. 1. No. 5, pp.67- 77.
Zakrzewska-Bielawska, A 2012 ‘The strategic dilemmas of innovative enterprises: proposals for high-technology sectors’, R&D Management Vol. 42 Issue: 5, pp. 514-524.