Embed Size (px)
Citation preview

IDF guide for
Diabetes Epidemiology Studies

IDF guide for diabetes epidemiology studies i
Acknowledgements
Authors
Pablo Aschner (chair), Abdul Basit, Asher Fawwad, Leonor Guariguata, Steven James, Suvi Karuranga, Belma Malanda, Jean Claude Mbanya, Simon O’Neill, Graham Ogle, Katherine Ogurtsova, Chris Patterson, Ambady Ramachandran, Pouya Saeedi, Jonathan Shaw, David Simmons, Sarah Wild, Rhys Williams (former chair), Beatriz Yáñez Jiménez
Reviewers
Amanda Adler, Beverly Balkau, Peter Bennett, Edward Boyko, Sanju Gautam, Unjali Gujral, Iram Muhammad, Venkat Narayan, Moritz Pinkepank, Gojka Roglic, Omar Silverman, Hernando Vargas, Pamela Wadende, Lauren Wedekind
Corporate sponsor
IDF would like to express its thanks to Sanofi for supporting this project
More information and resources can be found on the website of the IDF Dia-betes Atlas: www.diabetesatlas.org
IDF guide for diabetes epidemiology studies ii
Table of contentsAcknowledgements � � � � � � � � � � � � � � � � � � � � � � � � � � � � � � � � � � � � � � � � � � � � � � � � � � � � � � � � � � � � � � � � � � � � � � � � � � � � � � � � � � � � � � � � � � i
Table of contents � � � � � � � � � � � � � � � � � � � � � � � � � � � � � � � � � � � � � � � � � � � � � � � � � � � � � � � � � � � � � � � � � � � � � � � � � � � � � � � � � � � � � � � � � � � � ii
Chapter 1: Introduction � � � � � � � � � � � � � � � � � � � � � � � � � � � � � � � � � � � � � � � � � � � � � � � � � � � � � � � � � � � � � � � � � � � � � � � � � � 1
Chapter 2: Principles of conducting prevalence studies � � � � � � � � � � � � � � � � � � � � � � � � � � � � � � � � 3
Chapter 3: Organisation and conduct of the survey � � � � � � � � � � � � � � � � � � � � � � � � � � � � � � � � � � � 14
Chapter 4: Data handling and statistical analysis � � � � � � � � � � � � � � � � � � � � � � � � � � � � � � � � � � � � � � � 20
Chapter 5: Incidence � � � � � � � � � � � � � � � � � � � � � � � � � � � � � � � � � � � � � � � � � � � � � � � � � � � � � � � � � � � � � � � � � � � � � � � � � � � � 26
Chapter 6: Mortality, survival and life expectancy in people with diabetes � � � � � � 32
Chapter 7: Diabetes registries and their role in diabetes epidemiology � � � � � � � � � � �37
Chapter 8�1: Special populations: hyperglycaemia in pregnancy � � � � � � � � � � � � � � � � � � � � � 42
Chapter 8�2: Special populations: children and adolescents � � � � � � � � � � � � � � � � � � � � � � � � � � � 48
Chapter 9: Publication � � � � � � � � � � � � � � � � � � � � � � � � � � � � � � � � � � � � � � � � � � � � � � � � � � � � � � � � � � � � � � � � � � � � � � � � � � 51
Chapter 10: Advocacy � � � � � � � � � � � � � � � � � � � � � � � � � � � � � � � � � � � � � � � � � � � � � � � � � � � � � � � � � � � � � � � � � � � � � � � � � � � � 55
Appendix 1: Example of survey protocol� � � � � � � � � � � � � � � � � � � � � � � � � � � � � � � � � � � � � � � � � � � � � � � � � � � � � 57
Appendix 2: Further details on data handling � � � � � � � � � � � � � � � � � � � � � � � � � � � � � � � � � � � � � � � � � � � � � � 59
Appendix 3: Examples of disease registries � � � � � � � � � � � � � � � � � � � � � � � � � � � � � � � � � � � � � � � � � � � � � � � � � 61
Appendix 4: Example reporting tables on demographic variables � � � � � � � � � � � � � � � � � � � � 65
IDF guide for diabetes epidemiology studies 1
Chapter 1
Introduction
Key point
y Collecting regional and national data on diabetes is useful in informing authorities about the prevalence and incidence of diabetes, for the planning of care and prevention services and to monitor the world-wide epidemic
Diabetes mellitus (DM) has been increasing at an alarming rate since the start of the 21st century, driven by health determinants that are largely related to life-style changes and their consequences, such as obesity and sedentarism. The burden of diabetes has over-whelmed many healthcare systems, particularly those of low and middle-income countries. Reversing the rapid rise in the number of cases, and preventing the onset and evolution of diabetes complications, should be a common goal. This is essential in order to ensure that those who develop diabetes achieve their full life expectancy without compromising their quality of life, while also reducing the economic impact of the con-dition. A prerequisite to achieving this goal is the ability to measure the distribution of the disease (prevalence and incidence) and its determinants (risk factors), as well as its consequences (complications, mortality and health expenditure).
The IDF guide for diabetes epidemiology studies has been developed to create standardised epidemiological methods in diabetes studies. It will enable researchers to conduct high-quality studies that generate robust data, thereby providing the information needed to develop evidence-based strategies for improving care and strengthening healthcare systems.
Since 2000, successive editions of the IDF Diabetes Atlas have included up-to-date epidemiological data on diabetes, where it is available. Unfortunately, not all countries collect high-quality data on diabetes. More positively, the number of countries providing data on diabetes prevalence has increased from 91 in 2009 (when the 4th edition of the Atlas was published) to
138 in 2019 (the 9th edition). However, a third of coun-tries (57 out of 195) still lack high-quality data sources. This data-gap provided the motivation for the IDF Dia-betes Atlas Committee to commission this guide to epidemiological studies.
The IDF Diabetes Atlas rates the quality of its data sources using the analytical hierarchy process (AHP). This is based on characteristics such as how represent-ative the study sample is, the time since the study was conducted and the method of diabetes diagnosis. Pref-erence is given to data sources that are:
y nationally representative y relate to studies that were conducted over the
previous 5 years y were published in peer-reviewed journals y were based on the objective measurement of
diabetes status
Studies are excluded if:
y they are not population-based y they include only people in a specific age group or
they do not include age-stratified data y they use non-standardised glucose thresholds to
define diabetes
In those countries that lack data, prevalence esti-mates and standardised incidence rates are generated by extrapolation using data from countries that are deemed to be similar in terms of ethnicity, language, World Bank-income classification and geograph-ical proximity. While necessary to provide global
Pablo Aschner, Pouya Saeedi, Suvi Karuranga, Belma Malanda
IDF guide for diabetes epidemiology studies 2
coverage, extrapolated estimates are not a substi-tute for high-quality in-country data. Researchers are encouraged to embark on studies based on proto-cols that meet quality criteria such as those mentioned above, and thus to address current gaps in diabetes prevalence information.
We hope this guide will help researchers design, conduct, analyse and publish high-quality diabetes epidemiolog-ical studies that are based on standardised criteria. The target audience for this guide includes clinicians who want to generate local diabetes epidemiology data, and epidemiologists who want to standardise diabetes-re-lated criteria for their studies.
Recommended reading
International Diabetes Federation. IDF Diabetes Atlas. 9th ed. Brussels, Belgium: 2019. https://www.diabetesatlas.org. Accessed October 1, 2020.
Saeedi P, Petersohn I, Salpea P, et al. Global and regional diabetes prevalence estimates for 2019 and projections for 2030 and 2045: Results from the International Diabetes Federation Diabetes Atlas, 9th edition. Diabetes Res Clin Pract. 2019;157:107843. doi:10.1016/j.diabres.2019.107843.
Whiting DR, Guariguata L, Weil C, et al. IDF diabetes atlas: global estimates of the prevalence of diabetes for 2011 and 2030. Diabetes Res Clin Pract. 2011 Dec;94(3):311–21. doi:10.1016/j.diabres.2011.10.029.
IDF guide for diabetes epidemiology studies 3
Chapter 2
Principles of conducting prevalence studies
Key points
y When designing a prevalence study, the pros and cons of different options for choosing the target population and the sample must be considered
y The sample size for a prevalence study depends on the expected prevalence and the desired precision
y Different diagnostic tests for diabetes may produce different prevalence values
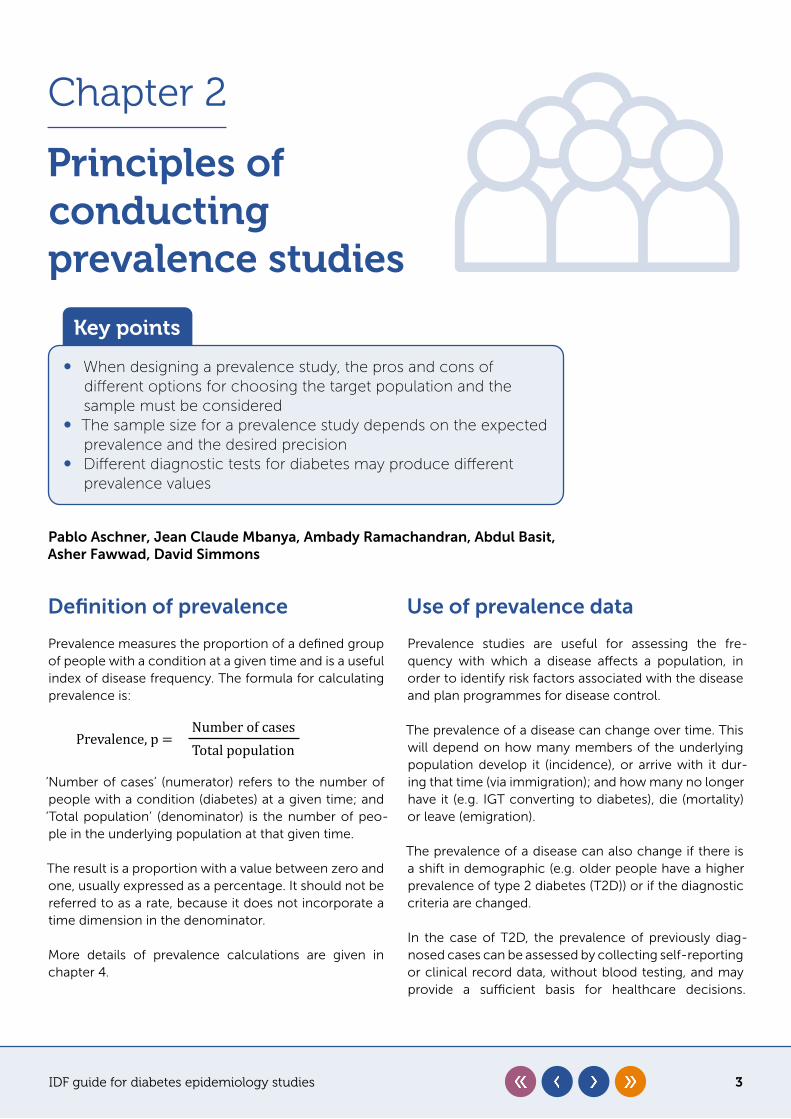
Definition of prevalence
Prevalence measures the proportion of a defined group of people with a condition at a given time and is a useful index of disease frequency. The formula for calculating prevalence is:
‘Number of cases’ (numerator) refers to the number of people with a condition (diabetes) at a given time; and ‘Total population’ (denominator) is the number of peo-ple in the underlying population at that given time.
The result is a proportion with a value between zero and one, usually expressed as a percentage. It should not be referred to as a rate, because it does not incorporate a time dimension in the denominator.
More details of prevalence calculations are given in chapter 4.
Use of prevalence data
Prevalence studies are useful for assessing the fre-quency with which a disease affects a population, in order to identify risk factors associated with the disease and plan programmes for disease control.
The prevalence of a disease can change over time. This will depend on how many members of the underlying population develop it (incidence), or arrive with it dur-ing that time (via immigration); and how many no longer have it (e.g. IGT converting to diabetes), die (mortality) or leave (emigration).
The prevalence of a disease can also change if there is a shift in demographic (e.g. older people have a higher prevalence of type 2 diabetes (T2D)) or if the diagnostic criteria are changed.
In the case of T2D, the prevalence of previously diag-nosed cases can be assessed by collecting self-reporting or clinical record data, without blood testing, and may provide a sufficient basis for healthcare decisions.
Prevalence, p =Number of casesTotal population
Pablo Aschner, Jean Claude Mbanya, Ambady Ramachandran, Abdul Basit, Asher Fawwad, David Simmons
IDF guide for diabetes epidemiology studies 4
However, this approach will underestimate the true prevalence, because in some low and middle-income countries as many as 50% of all cases of diabetes are undiagnosed, and blood testing is needed to detect them. When setting out to identify undiagnosed diabe-tes, it may not be necessary to carry out blood testing for people already known to have the condition unless the diagnosis is not clear, and/or they are not being treated. However, blood tests are often used to both confirm the presence of self-reported diabetes and identify undiag-nosed diabetes.
Methodology
In prevalence studies, the numerator and denominator data should, wherever possible, come from the same source. Sometimes they derive from different sources, in which case it must be ensured that they relate to the same age-group, geographical area and time period. When using surveys to gather data, the most serious errors relate to bias and lack of representation of the background population. The latter affects the external validity of the survey.
The time dimension for prevalence studies typically refers to a specific calendar year, although the study may have been conducted over a shorter period of a few weeks or months. A distinction is sometimes made between point prevalence and period prevalence. The former refers to the proportion of the population that has a given condition at a given point in time. A useful way to think of point prevalence is to imagine taking a snapshot of the population and determining the number of people with diabetes at that moment. It is clear that in practice it is almost never possible to test all study par-ticipants at the same point in time. Period prevalence is based on a ‘given time’, which is a time interval and not an instant in time. For example, it may take 12 months to conduct a prevalence study, with the proportion of the population identified as having diabetes during that 12-month period, including those who already had diabetes at the start, along with some new cases that developed during the period of the study.
Choosing the geographic target
A prevalence study should be population-based, mean-ing that the study population is representative of the general population of the specified geographical setting.
The geographical setting may be broadly categorised as national, regional or local. When the study is carried
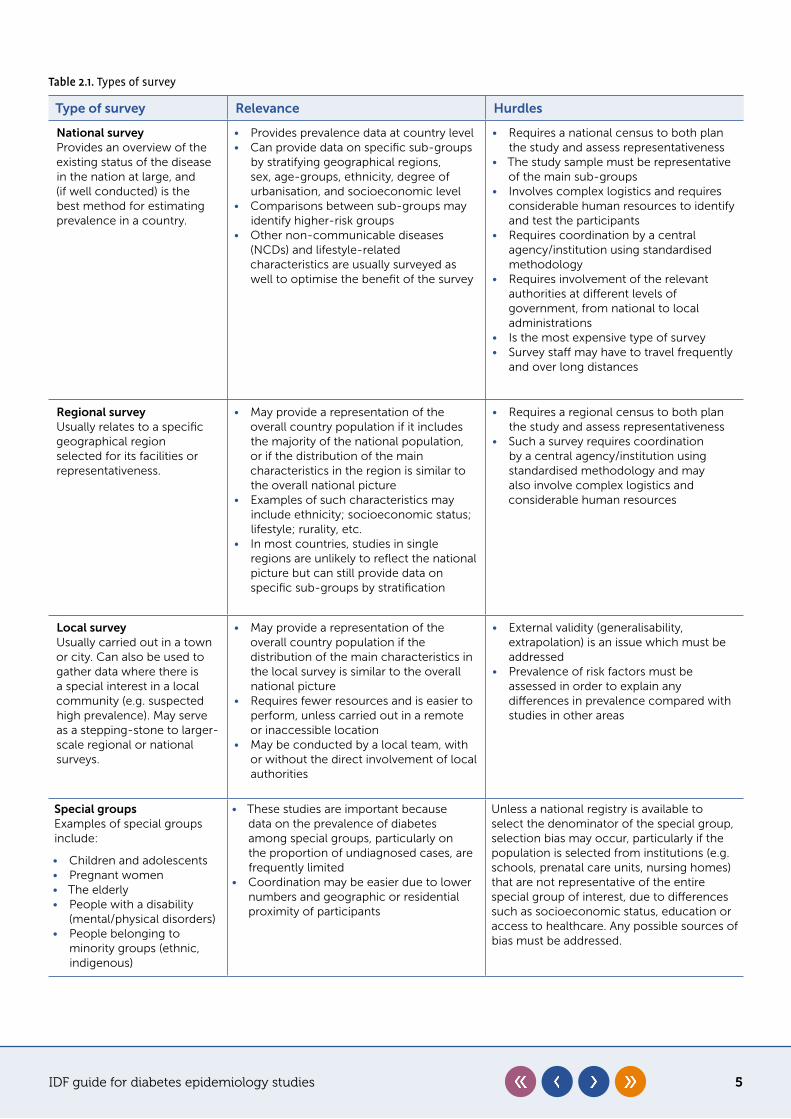
out among specific groups, and/or people are selected based on a specific factor – such as those attending hospital clinics – it is no longer considered popula-tion-based and this should be clearly flagged up in the methods. Table 2.1 describes the relevance of different types of surveys, and the hurdles associated with carry-ing out each type.
Identification of the population
Once the geographic setting has been chosen, it is necessary to identify the members of the population, known as the sampling frame. If time and resources permit, a census can be carried out, but this may be difficult in a national or large regional study. Other resources may be used to identify the population, such as registers, electoral records or maps of dwellings. In the latter example, households are chosen (randomly or systematically, see below), and then either every-one living in each household is surveyed, or specific individuals are selected according to the protocol (for example, adults over 20).
Choosing the sample
Because it is not usually possible to include everyone in the study population, researchers need to select a sample that is representative of the target popula-tion. Ideally, this sample should be selected randomly. If random selection is carried out appropriately, the resulting findings can be reliably generalised to the tar-get population, because the study sample will reflect the characteristics of the population it is drawn from with margins of error that can be estimated using sta-tistical methods. Some large surveys use more complex, multistage probability samples.
While the sample size is statistically determined, the sampling method depends on factors including budget and time constraints, as well as the aims of the study and logistical aspects such as access to the selected sample and human resources.
Sampling methods can be broadly categorised into probability and non-probability approaches. Probabil-ity sampling yields more generalisable results because each member of the target population has a chance of being selected. In non-probability sampling, partic-ipants are not selected at random, which can lead to selection bias and inappropriate statistical inferences because the sample may not be representative of the target population.
IDF guide for diabetes epidemiology studies 5
Table 2.1. Types of survey
Type of survey Relevance Hurdles
National survey Provides an overview of the existing status of the disease in the nation at large, and (if well conducted) is the best method for estimating prevalence in a country.
• Provides prevalence data at country level• Can provide data on specific sub-groups
by stratifying geographical regions, sex, age-groups, ethnicity, degree of urbanisation, and socioeconomic level
• Comparisons between sub-groups may identify higher-risk groups
• Other non-communicable diseases (NCDs) and lifestyle-related characteristics are usually surveyed as well to optimise the benefit of the survey
• Requires a national census to both plan the study and assess representativeness
• The study sample must be representative of the main sub-groups
• Involves complex logistics and requires considerable human resources to identify and test the participants
• Requires coordination by a central agency/institution using standardised methodology
• Requires involvement of the relevant authorities at different levels of government, from national to local administrations
• Is the most expensive type of survey• Survey staff may have to travel frequently
and over long distances
Regional surveyUsually relates to a specific geographical region selected for its facilities or representativeness.
• May provide a representation of the overall country population if it includes the majority of the national population, or if the distribution of the main characteristics in the region is similar to the overall national picture
• Examples of such characteristics may include ethnicity; socioeconomic status; lifestyle; rurality, etc.
• In most countries, studies in single regions are unlikely to reflect the national picture but can still provide data on specific sub-groups by stratification
• Requires a regional census to both plan the study and assess representativeness
• Such a survey requires coordination by a central agency/institution using standardised methodology and may also involve complex logistics and considerable human resources
Local survey Usually carried out in a town or city. Can also be used to gather data where there is a special interest in a local community (e.g. suspected high prevalence). May serve as a stepping-stone to larger-scale regional or national surveys.
• May provide a representation of the overall country population if the distribution of the main characteristics in the local survey is similar to the overall national picture
• Requires fewer resources and is easier to perform, unless carried out in a remote or inaccessible location
• May be conducted by a local team, with or without the direct involvement of local authorities
• External validity (generalisability, extrapolation) is an issue which must be addressed
• Prevalence of risk factors must be assessed in order to explain any differences in prevalence compared with studies in other areas
Special groups Examples of special groups include:
• Children and adolescents• Pregnant women• The elderly• People with a disability
(mental/physical disorders)• People belonging to
minority groups (ethnic, indigenous)
• These studies are important because data on the prevalence of diabetes among special groups, particularly on the proportion of undiagnosed cases, are frequently limited
• Coordination may be easier due to lower numbers and geographic or residential proximity of participants
Unless a national registry is available to select the denominator of the special group, selection bias may occur, particularly if the population is selected from institutions (e.g. schools, prenatal care units, nursing homes) that are not representative of the entire special group of interest, due to differences such as socioeconomic status, education or access to healthcare. Any possible sources of bias must be addressed.
IDF guide for diabetes epidemiology studies 6
Probability sampling
Simple random sampling
In this case, every member of the target population has the same chance of being selected into the sam-ple. Thus, resulting sample estimates should accurately reflect population values. Having access to a sampling frame that contains all individuals/households in the target population (see Choosing the sample) allows a random sample to be generated by a computer pro-gramme. Random sampling is the most rigorous method from a statistical point of view, but is usually impracti-cal, especially in national or regional surveys, because population members and their households may be geo-graphically dispersed, making data collection difficult and expensive. Therefore, when planning a regional or national survey it is important to focus on logistics in order to manage costs and other constraints.
Systematic sampling
Although this method also uses the entire target popu-lation as a sampling frame, it should be avoided as it is susceptible to bias, and has only been included to pro-vide an overview of survey methodology. Systematic sampling involves selecting the sample at fixed intervals, based on factors including the way the sampling frame was identified and the available resources. For example, if a census is available identifying 5,000 eligible people and the calculated sample size is 500 people, individu-als are typically ordered alphabetically, and every tenth person is selected for the survey. If there is no census available, a map of dwellings can be used to define the sample. For example, if 2,000 dwellings are identified and each is estimated to be home to at least two eligible participants, there are 4,000 eligible people. Based on a sample size of 500, 250 dwellings could be selected (e.g. every eighth one) and everyone in each household invited to participate.
Stratified sampling
Stratified sampling usually involves a one-step stratifica-tion, with individuals then sampled at random from each stratum. The community is divided into homogeneous strata based on one or more population characteristics (e.g. geographic location, age-group, ethnicity, socio-economic status, occupation) and the participants from each stratum are then selected by simple ran-dom sampling. This is often done to ensure adequate representation of important population sub-groups. If stratifying by ethnicity, modern methods of classifica-tion like ethnic self-identification can be considered.
Cluster sampling
Cluster sampling is the most common method for general health surveys. In this approach, the selected geographical setting of the population is divided into smaller units or clusters (e.g. villages, town districts or blocks of houses), and a sample of clusters is then randomly selected and all eligible members are invited to participate.
A survey based on cluster sampling is typically easier to conduct (for example it may provide opportunities for participants to be invited to a survey centre within the cluster, rather than being visited in the field). How-ever, inferences to the target population cannot be generalised, and efforts should be made to evaluate as many eligible subjects as possible within the cluster, as well as ensuring that the non-responders do not differ based on any of the factors related to the purpose of the study (see below).
Generally speaking, cluster sampling is likely to decrease how precise the data collected is compared with a simple random sample, due to the tendency for peo-ple within a cluster to share similar characteristics. An approach using cluster sampling will therefore tend to yield results with a larger standard error than a simple random sample of the same size.
To obtain suitable standard errors in surveys using cluster or stratified sampling requires the use of more complex statistical methods. This may not be feasible without access to statistical expertise.
Non-probability sampling
In some cases, sampling frames are not available or accessible. Many studies are conducted using purposive, quota, snowball or convenience sampling, based on the predefined objectives of the study, accessibility of the population and to reduce costs. An example of purpo-sive sampling is the selection of a specific pair of rural and urban areas whose populations are assumed to be typical of each respective area category in the cho-sen geographical setting. Quota sampling refers to the non-random selection of subjects with certain charac-teristics in order to reach a target sample size. Snowball sampling involves study subjects referring acquaint-ances to a survey, who, in turn, refer their acquaintances until a target sample size is reached. Generalisation of inferences made to the target population from these non-probability samples may be limited.
IDF guide for diabetes epidemiology studies 7
Non-response
In all forms of probability sampling, a high response rate is important to help avoid biased estimates, since non-responders will usually differ in their characteris-tics from responders. If the response rate is low (e.g. less than 80%), then a random sample of non-responders should be contacted to determine if they differ in impor-tant characteristics from responders. Every effort should be made to reduce the non-response rate by using all approved means to contact the chosen participants. If non-responders and responders are found to have a different disease risk, then weighting of estimates may be necessary to reduce non-response bias. At a min-imum, the sex and age of non-responders should be compared to responders. Information on age, sex and potentially other characteristics may be available from rosters used to determine subject selection.
Given that a low response rate affects results – even those from a probability sample – it is important to adopt strat-egies to manage non-response bias. While oversampling by a defined percentage to account for non-responses will increase the likelihood that the final study sample size target is achieved (see Calculating the sample size), it will not avoid non-response bias. Social factors, such as belief systems and trust, can affect participation. Invit-ing all participants within a community to participate and using liaisons such as community leaders who can act as a motivators and initiate contact with the participants, are strategies to reduce non-response rates.
Choosing the age range
Traditionally, 30 years of age was chosen as an efficient lower cut-off in diabetes surveys in adults (mainly T2D). Recently, more cases of T2D have been found in younger adult populations, so a lower age cut-off should be con-sidered to capture all such cases. The prevalence of
diabetes increases with age, and longevity is also increas-ing in many countries. Therefore, the choice of an upper age cut-off should be carefully considered, especially in countries with greater longevity. However, the choice of an age range may also be guided by other considerations, such as a desire to produce estimates that are compara-ble with surveys performed previously, or in other regions or countries. For cross-country comparison purposes, the most frequently used age range is 20–79 years. To further assure comparability of estimates, prevalence must be adjusted by age, particularly when comparing data from populations with different age distributions.
Calculating the sample size
The prevalence of diabetes, impaired glucose tolerance and impaired fasting glucose are usually reported as a percentage (the proportion x 100), the precision of which is given by the standard error. The standard error can then be used to calculate a 95% confidence interval (CI) which will include the ‘true’ prevalence of the population. This CI is often described as the limit (or margin) of error.
The sample size calculation for a prevalence study depends on the expected prevalence and the desired precision. The expected prevalence can be obtained from previous reports in the same population, or from neighbouring or similar populations. If in doubt, it is best to underestimate the expected prevalence.
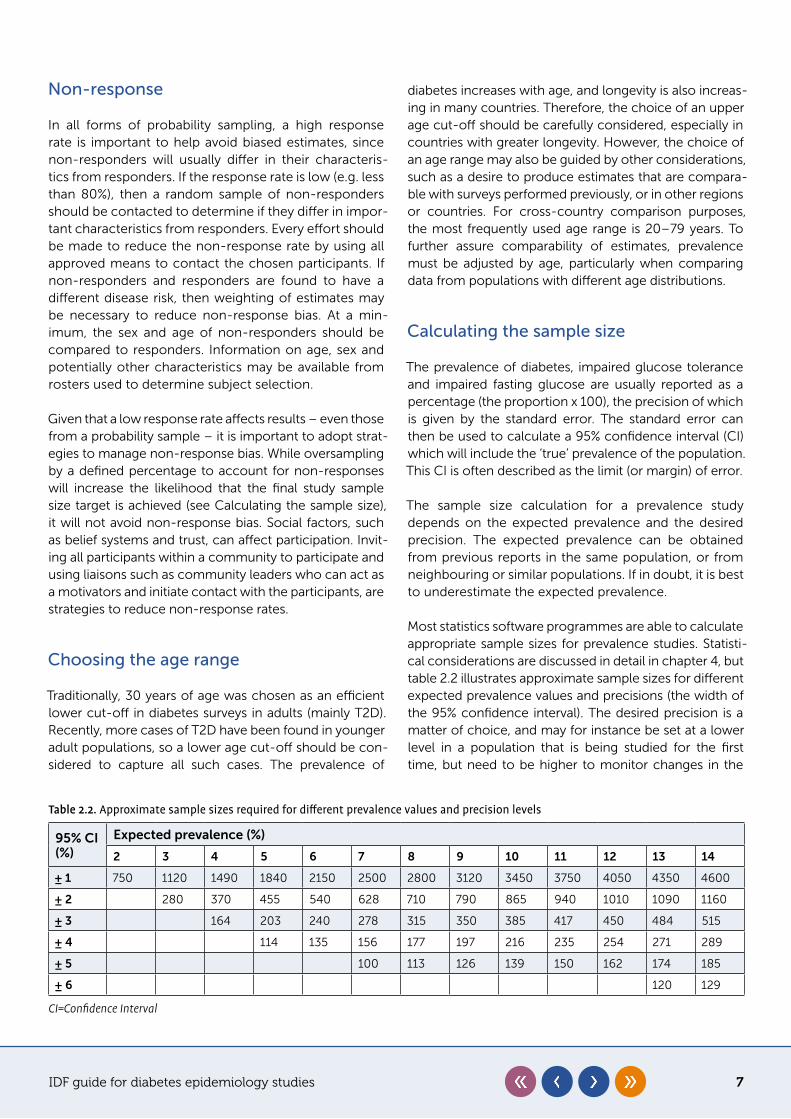
Most statistics software programmes are able to calculate appropriate sample sizes for prevalence studies. Statisti-cal considerations are discussed in detail in chapter 4, but table 2.2 illustrates approximate sample sizes for different expected prevalence values and precisions (the width of the 95% confidence interval). The desired precision is a matter of choice, and may for instance be set at a lower level in a population that is being studied for the first time, but need to be higher to monitor changes in the
Table 2.2. Approximate sample sizes required for different prevalence values and precision levels
95% CI (%)
Expected prevalence (%)
2 3 4 5 6 7 8 9 10 11 12 13 14
± 1 750 1120 1490 1840 2150 2500 2800 3120 3450 3750 4050 4350 4600
± 2 280 370 455 540 628 710 790 865 940 1010 1090 1160
± 3 164 203 240 278 315 350 385 417 450 484 515
± 4 114 135 156 177 197 216 235 254 271 289
± 5 100 113 126 139 150 162 174 185
± 6 120 129
CI=Confidence Interval
IDF guide for diabetes epidemiology studies 8
prevalence over time. For example, if the prevalence is expected to be 7% and the desired precision for the 95% CI is ± 2% (i.e. between 5% and 9% of the expected prev-alence) then the sample size would be 628 participants.
Identifying the cases
The cases, which form the numerator of the prevalence formula, are usually identified using a biomedical test which can differentiate between true positives and true negatives. In the real world, tests also generate false positives and false negatives, so the performance of the test is defined by its sensitivity (true positive rate) and specificity (true negative rate) as determined by com-parison against a reference method (gold standard). For prevalence studies, a screening test may be sufficient to identify cases, as long as it has an acceptable sensitivity and specificity. If a participant is identified as a case and was previously undiagnosed, they should be referred to healthcare services for further evaluation and, if neces-sary, treatment.
Prevalence of previously diagnosed diabetes is calcu-lated based on data from questionnaires or medical records, where the number of individuals diagnosed with diabetes before the survey is divided by the total number of respondents in the sample.
Newly diagnosed diabetes prevalence is calculated using glucose screening results among those who did not
self-report as having diabetes. The number of individuals diagnosed with diabetes during the screening is divided by the total number of respondents in the sample.
Total diabetes prevalence can be obtained by adding the figures for previously diagnosed and newly diag-nosed diabetes and dividing the total by the number of respondents in the sample.
Tests for diabetes
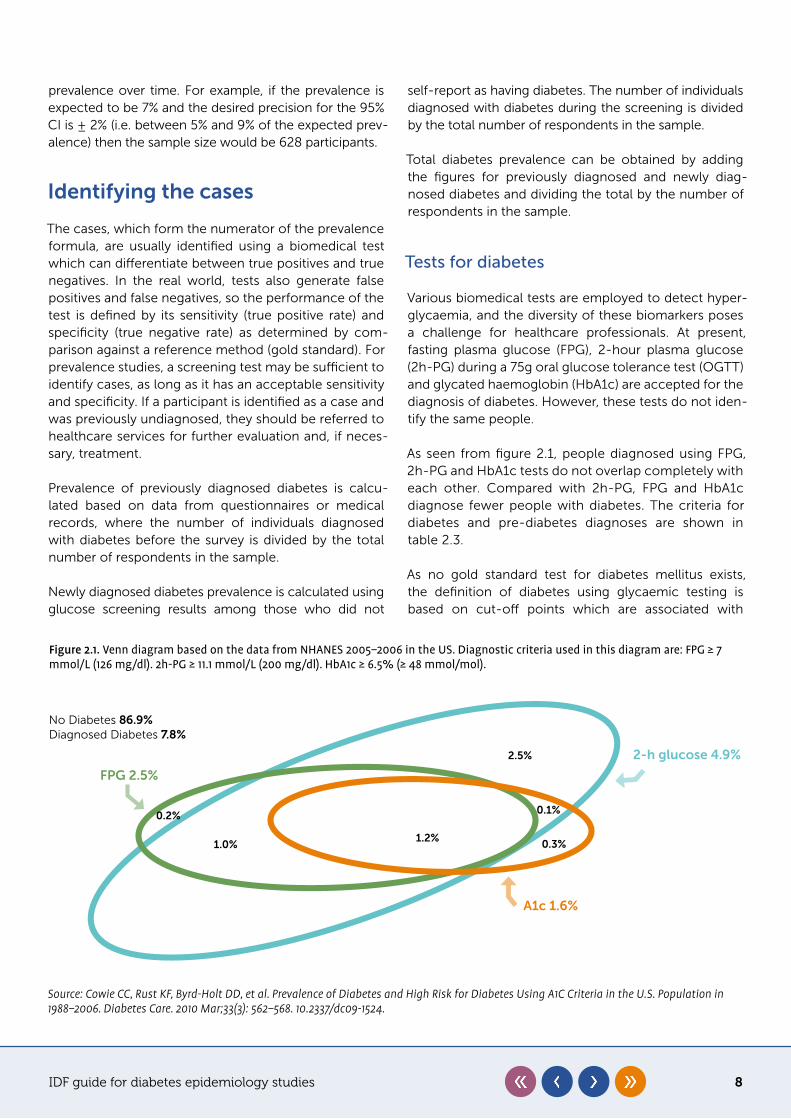
Various biomedical tests are employed to detect hyper-glycaemia, and the diversity of these biomarkers poses a challenge for healthcare professionals. At present, fasting plasma glucose (FPG), 2-hour plasma glucose (2h-PG) during a 75g oral glucose tolerance test (OGTT) and glycated haemoglobin (HbA1c) are accepted for the diagnosis of diabetes. However, these tests do not iden-tify the same people.
As seen from figure 2.1, people diagnosed using FPG, 2h-PG and HbA1c tests do not overlap completely with each other. Compared with 2h-PG, FPG and HbA1c diagnose fewer people with diabetes. The criteria for diabetes and pre-diabetes diagnoses are shown in table 2.3.
As no gold standard test for diabetes mellitus exists, the definition of diabetes using glycaemic testing is based on cut-off points which are associated with
Figure 2.1. Venn diagram based on the data from NHANES 2005–2006 in the US. Diagnostic criteria used in this diagram are: FPG ≥ 7 mmol/L (126 mg/dl). 2h-PG ≥ 11.1 mmol/L (200 mg/dl). HbA1c ≥ 6.5% (≥ 48 mmol/mol).
2.5%
1.2%1.0% 0.3%
0.2% 0.1%
FPG 2.5%
A1c 1.6%
2-h glucose 4.9%
No Diabetes 86�9%Diagnosed Diabetes 7�8%
Source: Cowie CC, Rust KF, Byrd-Holt DD, et al. Prevalence of Diabetes and High Risk for Diabetes Using A1C Criteria in the U.S. Population in 1988–2006. Diabetes Care. 2010 Mar;33(3): 562–568. 10.2337/dc09-1524.
IDF guide for diabetes epidemiology studies 9
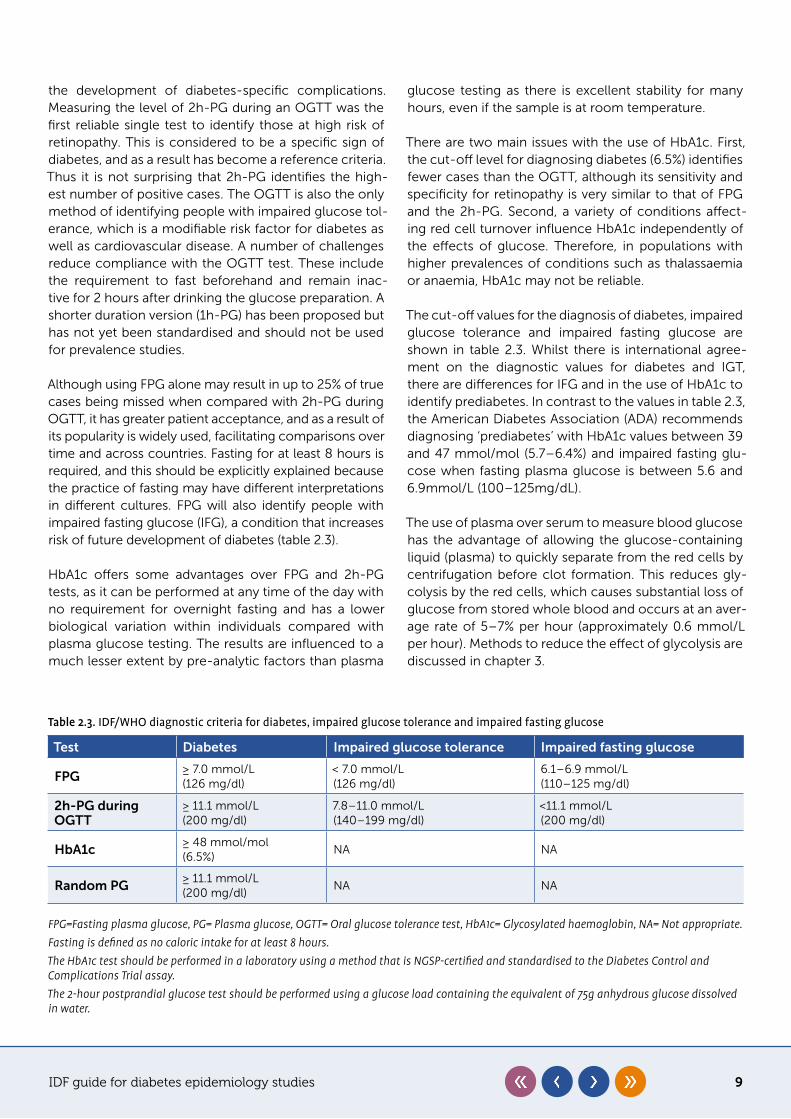
Table 2.3. IDF/WHO diagnostic criteria for diabetes, impaired glucose tolerance and impaired fasting glucose
Test Diabetes Impaired glucose tolerance Impaired fasting glucose
FPG≥ 7.0 mmol/L(126 mg/dl)
< 7.0 mmol/L(126 mg/dl)
6.1–6.9 mmol/L(110–125 mg/dl)
2h-PG during OGTT
≥ 11.1 mmol/L(200 mg/dl)
7.8–11.0 mmol/L(140–199 mg/dl)
<11.1 mmol/L (200 mg/dl)
HbA1c≥ 48 mmol/mol(6.5%)
NA NA
Random PG≥ 11.1 mmol/L(200 mg/dl)
NA NA
FPG=Fasting plasma glucose, PG= Plasma glucose, OGTT= Oral glucose tolerance test, HbA1c= Glycosylated haemoglobin, NA= Not appropriate.Fasting is defined as no caloric intake for at least 8 hours.The HbA1c test should be performed in a laboratory using a method that is NGSP-certified and standardised to the Diabetes Control and Complications Trial assay.The 2-hour postprandial glucose test should be performed using a glucose load containing the equivalent of 75g anhydrous glucose dissolved in water.
the development of diabetes-specific complications. Measuring the level of 2h-PG during an OGTT was the first reliable single test to identify those at high risk of retinopathy. This is considered to be a specific sign of diabetes, and as a result has become a reference criteria. Thus it is not surprising that 2h-PG identifies the high-est number of positive cases. The OGTT is also the only method of identifying people with impaired glucose tol-erance, which is a modifiable risk factor for diabetes as well as cardiovascular disease. A number of challenges reduce compliance with the OGTT test. These include the requirement to fast beforehand and remain inac-tive for 2 hours after drinking the glucose preparation. A shorter duration version (1h-PG) has been proposed but has not yet been standardised and should not be used for prevalence studies.
Although using FPG alone may result in up to 25% of true cases being missed when compared with 2h-PG during OGTT, it has greater patient acceptance, and as a result of its popularity is widely used, facilitating comparisons over time and across countries. Fasting for at least 8 hours is required, and this should be explicitly explained because the practice of fasting may have different interpretations in different cultures. FPG will also identify people with impaired fasting glucose (IFG), a condition that increases risk of future development of diabetes (table 2.3).
HbA1c offers some advantages over FPG and 2h-PG tests, as it can be performed at any time of the day with no requirement for overnight fasting and has a lower biological variation within individuals compared with plasma glucose testing. The results are influenced to a much lesser extent by pre-analytic factors than plasma
glucose testing as there is excellent stability for many hours, even if the sample is at room temperature.
There are two main issues with the use of HbA1c. First, the cut-off level for diagnosing diabetes (6.5%) identifies fewer cases than the OGTT, although its sensitivity and specificity for retinopathy is very similar to that of FPG and the 2h-PG. Second, a variety of conditions affect-ing red cell turnover influence HbA1c independently of the effects of glucose. Therefore, in populations with higher prevalences of conditions such as thalassaemia or anaemia, HbA1c may not be reliable.
The cut-off values for the diagnosis of diabetes, impaired glucose tolerance and impaired fasting glucose are shown in table 2.3. Whilst there is international agree-ment on the diagnostic values for diabetes and IGT, there are differences for IFG and in the use of HbA1c to identify prediabetes. In contrast to the values in table 2.3, the American Diabetes Association (ADA) recommends diagnosing ‘prediabetes’ with HbA1c values between 39 and 47 mmol/mol (5.7–6.4%) and impaired fasting glu-cose when fasting plasma glucose is between 5.6 and 6.9mmol/L (100–125mg/dL).
The use of plasma over serum to measure blood glucose has the advantage of allowing the glucose-containing liquid (plasma) to quickly separate from the red cells by centrifugation before clot formation. This reduces gly-colysis by the red cells, which causes substantial loss of glucose from stored whole blood and occurs at an aver-age rate of 5–7% per hour (approximately 0.6 mmol/L per hour). Methods to reduce the effect of glycolysis are discussed in chapter 3.
IDF guide for diabetes epidemiology studies 10
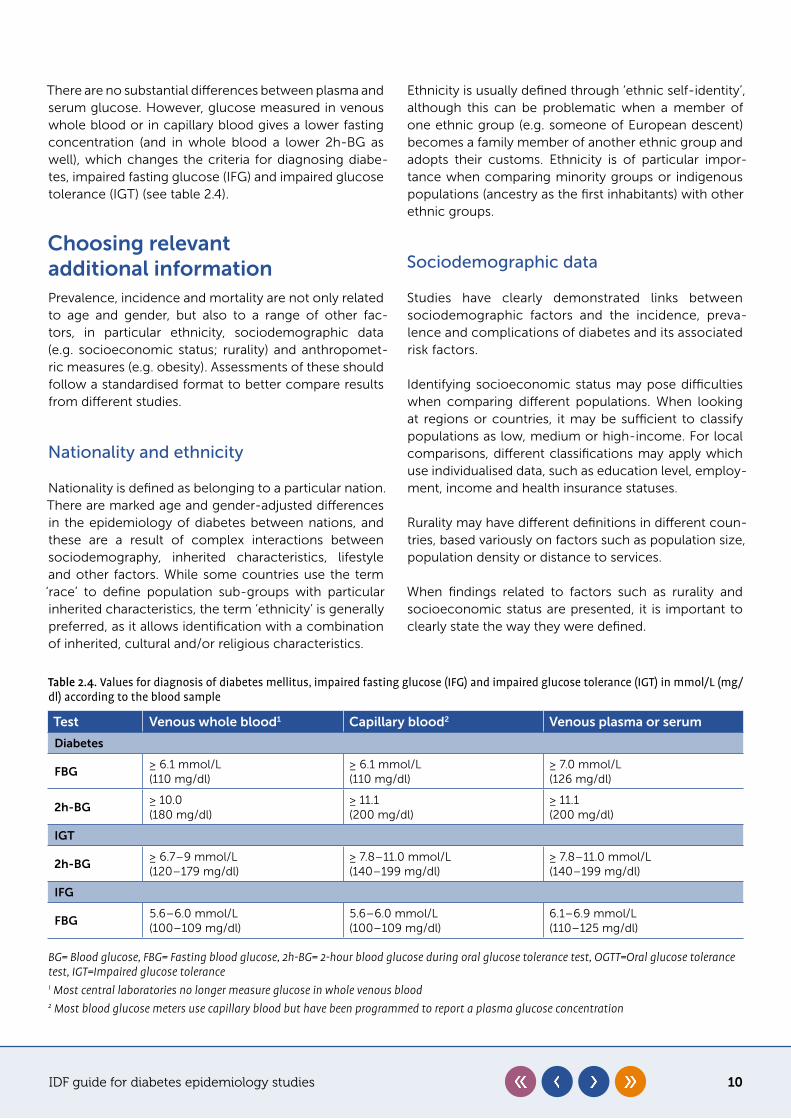
There are no substantial differences between plasma and serum glucose. However, glucose measured in venous whole blood or in capillary blood gives a lower fasting concentration (and in whole blood a lower 2h-BG as well), which changes the criteria for diagnosing diabe-tes, impaired fasting glucose (IFG) and impaired glucose tolerance (IGT) (see table 2.4).
Choosing relevant additional informationPrevalence, incidence and mortality are not only related to age and gender, but also to a range of other fac-tors, in particular ethnicity, sociodemographic data (e.g. socioeconomic status; rurality) and anthropomet-ric measures (e.g. obesity). Assessments of these should follow a standardised format to better compare results from different studies.
Nationality and ethnicity
Nationality is defined as belonging to a particular nation. There are marked age and gender-adjusted differences in the epidemiology of diabetes between nations, and these are a result of complex interactions between sociodemography, inherited characteristics, lifestyle and other factors. While some countries use the term ‘race’ to define population sub-groups with particular inherited characteristics, the term ‘ethnicity’ is generally preferred, as it allows identification with a combination of inherited, cultural and/or religious characteristics.
Ethnicity is usually defined through ‘ethnic self-identity’, although this can be problematic when a member of one ethnic group (e.g. someone of European descent) becomes a family member of another ethnic group and adopts their customs. Ethnicity is of particular impor-tance when comparing minority groups or indigenous populations (ancestry as the first inhabitants) with other ethnic groups.
Sociodemographic data
Studies have clearly demonstrated links between sociodemographic factors and the incidence, preva-lence and complications of diabetes and its associated risk factors.
Identifying socioeconomic status may pose difficulties when comparing different populations. When looking at regions or countries, it may be sufficient to classify populations as low, medium or high-income. For local comparisons, different classifications may apply which use individualised data, such as education level, employ-ment, income and health insurance statuses.
Rurality may have different definitions in different coun-tries, based variously on factors such as population size, population density or distance to services.
When findings related to factors such as rurality and socioeconomic status are presented, it is important to clearly state the way they were defined.
Table 2.4. Values for diagnosis of diabetes mellitus, impaired fasting glucose (IFG) and impaired glucose tolerance (IGT) in mmol/L (mg/dl) according to the blood sample
Test Venous whole blood1 Capillary blood2 Venous plasma or serum
Diabetes
FBG≥ 6.1 mmol/L(110 mg/dl)
≥ 6.1 mmol/L(110 mg/dl)
≥ 7.0 mmol/L(126 mg/dl)
2h-BG≥ 10.0(180 mg/dl)
≥ 11.1(200 mg/dl)
≥ 11.1(200 mg/dl)
IGT
2h-BG≥ 6.7–9 mmol/L(120–179 mg/dl)
≥ 7.8–11.0 mmol/L(140–199 mg/dl)
≥ 7.8–11.0 mmol/L(140–199 mg/dl)
IFG
FBG5.6–6.0 mmol/L(100–109 mg/dl)
5.6–6.0 mmol/L(100–109 mg/dl)
6.1–6.9 mmol/L(110–125 mg/dl)
BG= Blood glucose, FBG= Fasting blood glucose, 2h-BG= 2-hour blood glucose during oral glucose tolerance test, OGTT=Oral glucose tolerance test, IGT=Impaired glucose tolerance1 Most central laboratories no longer measure glucose in whole venous blood2 Most blood glucose meters use capillary blood but have been programmed to report a plasma glucose concentration
IDF guide for diabetes epidemiology studies 11
Anthropometric measurements
It is considered essential to collect anthropometric data as well as carrying out biochemical tests, not only to explore the disease mechanism and its development, but also to evaluate these parameters as risk factors which may become targets for the primary prevention of diabe-tes. Body mass index (BMI) and waist circumference (WC) are the most commonly used anthropometric measures for identifying populations at a higher risk of T2D. Cut-offs for BMI and WC identifying overweight and obesity may differ among ethnicities, e.g. being lower among those of South and East Asian origin.
Associated risk factors
Diabetes, and specifically T2D, is associated with cardiovascular risk factors such as hypertension and dys-lipidemia, and it is useful to include these measurements in a prevalence survey if time and financial resources permit. They can be identified by direct measurements
or by self-reporting, which should include the use of medications for each condition.
People identified with diabetes may already have cardi-ovascular comorbidities, which may be assessed using techniques involving various degrees of complexity. Assessment of coronary artery disease and cerebrovas-cular disease is usually based on self-reported history of myocardial infarction and/or revascularisation and stroke.
Other biochemical data
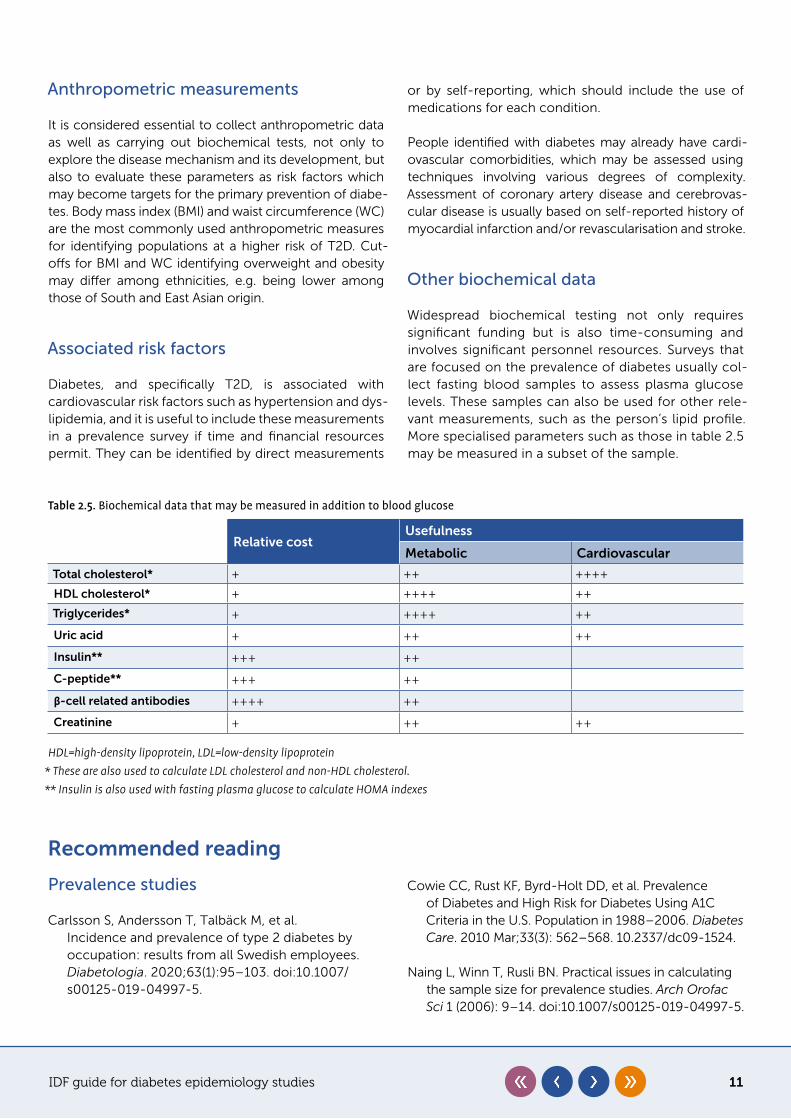
Widespread biochemical testing not only requires significant funding but is also time-consuming and involves significant personnel resources. Surveys that are focused on the prevalence of diabetes usually col-lect fasting blood samples to assess plasma glucose levels. These samples can also be used for other rele-vant measurements, such as the person’s lipid profile. More specialised parameters such as those in table 2.5 may be measured in a subset of the sample.
Table 2.5. Biochemical data that may be measured in addition to blood glucose
Relative costUsefulness
Metabolic Cardiovascular
Total cholesterol* + ++ ++++
HDL cholesterol* + ++++ ++
Triglycerides* + ++++ ++
Uric acid + ++ ++
Insulin** +++ ++
C-peptide** +++ ++
β-cell related antibodies ++++ ++
Creatinine + ++ ++
HDL=high-density lipoprotein, LDL=low-density lipoprotein* These are also used to calculate LDL cholesterol and non-HDL cholesterol.** Insulin is also used with fasting plasma glucose to calculate HOMA indexes
Recommended reading
Prevalence studies
Carlsson S, Andersson T, Talbäck M, et al. Incidence and prevalence of type 2 diabetes by occupation: results from all Swedish employees. Diabetologia. 2020;63(1):95–103. doi:10.1007/s00125-019-04997-5.
Cowie CC, Rust KF, Byrd-Holt DD, et al. Prevalence of Diabetes and High Risk for Diabetes Using A1C Criteria in the U.S. Population in 1988–2006. Diabetes Care. 2010 Mar;33(3): 562–568. 10.2337/dc09-1524.
Naing L, Winn T, Rusli BN. Practical issues in calculating the sample size for prevalence studies. Arch Orofac Sci 1 (2006): 9–14. doi:10.1007/s00125-019-04997-5.
IDF guide for diabetes epidemiology studies 12
Silman AJ, MacFarlane GJ. Epidemiological Studies: A Practical Guide. 2nd ed. Cambridge: Cambridge University Press; 2002.
Yang W, Lu J, Weng J, et al. Prevalence of Diabetes among men and women in China. N Engl J Med. 2010;362(12):1090–1101. doi:10.1056/NEJMoa0908292.
Diagnostic tests
American Diabetes Association. Classification and Diagnosis of Diabetes: Standards of Medical Care in Diabetes—2020. Diabetes Care. 2020; 43 (Supplement 1): S14-S31. doi:10.2337/dc20-S002.
The Expert Committee on the Diagnosis and Classification of Diabetes Mellitus. Report of the expert committee on the diagnosis and classification of diabetes mellitus. Diabetes Care. 1997;20(7):1183–1197. doi:10.2337/diacare.20.7.1183.
Herman WH, Cohen RM. Racial and ethnic differences in the relationship between HbA1c and blood glucose: implications for the diagnosis of diabetes. J Clin Endocrinol Metab. 2012;97(4):1067–1072. doi:10.1210/jc.2011-1894.
Ho-Pham LT, Nguyen UD, Tran TX, et al. Discordance in the diagnosis of diabetes: Comparison between HbA1c and fasting plasma glucose. PloS One. 2017;12(8): e0182192. doi:10.1371/journal.pone.0182192.
International Expert Committee. International Expert Committee report on the role of the A1C assay in the diagnosis of diabetes. Diabetes Care. 2009;32:1327–1334. doi:10.2337/dc09-9033.
Kumar PR, Bhansali A, Ravikiran M, et al. Utility of glycated hemoglobin in diagnosing type 2 diabetes mellitus: a community-based study. J Clin Endocrinol Metab. 2010;95(6):2832–2835. doi:10.1210/jc.2009-2433.
Mohan V, Vijayachandrika V, Gokulakrishnan K, et al. A1c cut points to define various glucose intolerance groups in Asian Indians. Diabetes Care. 2010;33(3):515–519. doi:10.2337/dc09-1694.
Radhakrishna P, Vinod KV, Sujiv A, et al. Comparison of Hemoglobin A1c with fasting and 2-h plasma glucose tests for diagnosis of diabetes and prediabetes among high-risk South Indians. Indian J Endocrinol Metab. 2018;22(1):50–56. doi:10.4103/ijem.IJEM_254_17.
Selvin E, Crainiceanu CM, Brancati FL, et al. Short-term variability in measures of glycemia and implications for the classification of diabetes. Arch Intern Med. 2007;167(14):1545–1551. doi:10.1001/archinte.167.14.1545.
World Health Organization. Definition, Diagnosis and Classification of Diabetes Mellitus and its Complications : Report of a WHO Consultation. https://apps.who.int/iris/handle/10665/66040. Accessed October 4, 2020.
World Health Organization, International Diabetes Federation. Definition and diagnosis of diabetes mellitus and intermediate hyperglycemia: report of a WHO/IDF consultation. Geneva: WHO; 2006. https://www.who.int/diabetes/publications/diagnosis_diabetes2006/en/. Accessed October 4, 2020.
Zhou X, Pang Z, Gao W, et al. Performance of an A1c and fasting capillary blood glucose test for screening newly diagnosed diabetes and pre-diabetes defined by an oral glucose tolerance test in Qingdao, China. Diabetes Care. 2010;33(3):545–550. doi:10.2337/dc09-1410.
Relevant additional data
Bergman M, Manco M, Sesti G, et al. Petition to replace current OGTT criteria for diagnosing prediabetes with the 1-hour post-load plasma glucose ≥ 155 mg/dl (8.6 mmol/L). Diabetes Res Clin Pract. 2018 Dec;146:18–33; doi:10.1016/j.diabres.2018.09.017.
Mitchell AJ, Vancampfort D, Manu P, et al. (2019) Which clinical and biochemical predictors should be used to screen for diabetes in patients with serious mental illness receiving antipsychotic medication? A large observational study. PLoS ONE 14(9): e0210674. doi:10.1371/ journal.pone.0210674.
IDF guide for diabetes epidemiology studies 13
Skogberg N, Laatikainen T, Lundqvist A, et al. Which anthropometric measures best indicate type 2 diabetes among Russian, Somali and Kurdish origin migrants in Finland? A cross-sectional study. BMJ Open 2018;8:e019166. doi: 10.1136/bmjopen-2017-019166.
World Health Organization. Non communicable diseases. 1st June 2018. https://www.who.int/news-room/fact-sheets/detail/noncommunicable-diseases. Accessed October 4, 2020
IDF guide for diabetes epidemiology studies 14
Chapter 3
Organisation and conduct of the survey
Key points
y The study design must take into account the biological, social and cultural determinants of the disease, along with their interactions
y The methodology should be carefully planned to capture the relevant details in a simple questionnaire
y A dynamic leader supported by a trained multidisciplinary team should organise the screening procedures
Ambady Ramachandran, Pablo Aschner
The survey requires careful planning, management and administration in its development and execution. Its organisation should follow a standardised methodology encompassing the components discussed below.
Aim and scope of the survey
y to assess the burden of total diabetes in a defined population (new and known cases)
y to collect background data on the burden of diabetes
The extent of the survey will depend on the targeted area, for instance the population at national or district level; in selected locations (urban or rural areas); or in selected communities or age-groups. The demographic charac-teristics of the sample frame, such as age, gender and sociocultural aspects, should be well defined. Some basic characteristics such as gender and age distribution should be compared with the latest national or regional census to ensure that the selected sample will be similar to the target population, at least regarding those param-eters. If any previous surveys for the target population are available, they will provide guidance on sample selection, and also help assess changes in the prevalence of the disease (for more details see chapter 2).
Study team
Having defined the type and scope of the study, the study team must be formed. Typical roles will include:
y team leader y coordinator(s) y field supervisors y interviewers/surveyors y laboratory personnel y phlebotomists y administrative staff y financial manager (likely to be part-time) y data manager and statistician y technicians (optional) y drivers (optional)
The number of team-members in each category will depend on the size of the survey. Personnel should be trained by the team leader and/or staff with experience in conducting similar studies. A pilot study may also be required to assess a variety of practical aspects, such as the use of the data collection instruments, the inter-view flow, and how anthropometry is performed. This is a good opportunity to make changes before the real data collection starts.
IDF guide for diabetes epidemiology studies 15
To ensure the smooth running of the study, and to min-imise the time required to complete the procedures, staff should be trained to perform multiple tasks. Train-ing sessions to standardise data collection methods must be part of the preparation phase in order to avoid systematic errors in data collection.
The principal investigator should act as team leader. They should have training in public health with expe-rience of conducting field surveys, combined with knowledge of diabetes. They should also demonstrate good management skills, combined with perseverance and an analytical approach.
The coordinators provide the main source of support during the survey. They should preferably be healthcare professionals with experience of carrying out field sur-veys, and/or coordinating clinical trials. They will work in close contact with the field supervisors, who should have experience of conducting field surveys, as well as an ability to create awareness about the importance of the study, motivate people to participate and solve prob-lems on-site.
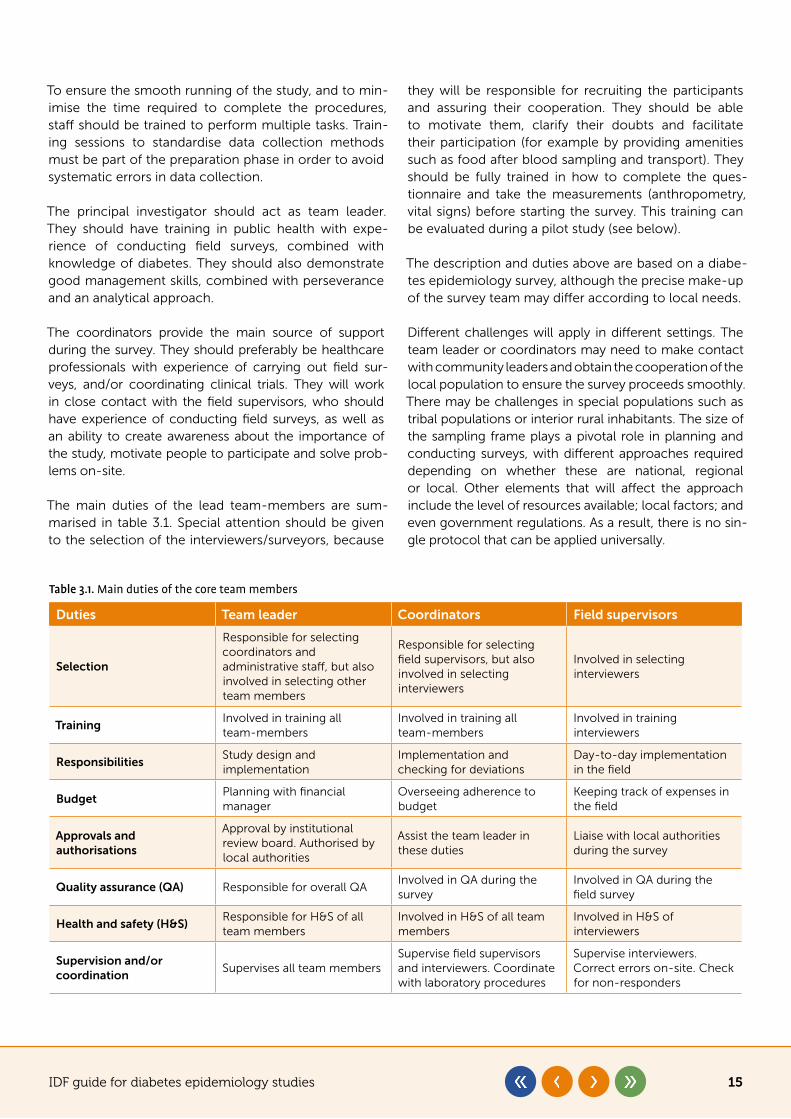
The main duties of the lead team-members are sum-marised in table 3.1. Special attention should be given to the selection of the interviewers/surveyors, because
they will be responsible for recruiting the participants and assuring their cooperation. They should be able to motivate them, clarify their doubts and facilitate their participation (for example by providing amenities such as food after blood sampling and transport). They should be fully trained in how to complete the ques-tionnaire and take the measurements (anthropometry, vital signs) before starting the survey. This training can be evaluated during a pilot study (see below).
The description and duties above are based on a diabe-tes epidemiology survey, although the precise make-up of the survey team may differ according to local needs.
Different challenges will apply in different settings. The team leader or coordinators may need to make contact with community leaders and obtain the cooperation of the local population to ensure the survey proceeds smoothly. There may be challenges in special populations such as tribal populations or interior rural inhabitants. The size of the sampling frame plays a pivotal role in planning and conducting surveys, with different approaches required depending on whether these are national, regional or local. Other elements that will affect the approach include the level of resources available; local factors; and even government regulations. As a result, there is no sin-gle protocol that can be applied universally.
Table 3.1. Main duties of the core team members
Duties Team leader Coordinators Field supervisors
Selection
Responsible for selecting coordinators and administrative staff, but also involved in selecting other team members
Responsible for selecting field supervisors, but also involved in selecting interviewers
Involved in selecting interviewers
TrainingInvolved in training all team-members
Involved in training all team-members
Involved in training interviewers
ResponsibilitiesStudy design and implementation
Implementation and checking for deviations
Day-to-day implementation in the field
BudgetPlanning with financial manager
Overseeing adherence to budget
Keeping track of expenses in the field
Approvals and authorisations
Approval by institutional review board. Authorised by local authorities
Assist the team leader in these duties
Liaise with local authorities during the survey
Quality assurance (QA) Responsible for overall QA Involved in QA during the survey
Involved in QA during the field survey
Health and safety (H&S)Responsible for H&S of all team members
Involved in H&S of all team members
Involved in H&S of interviewers
Supervision and/or coordination
Supervises all team membersSupervise field supervisors and interviewers. Coordinate with laboratory procedures
Supervise interviewers. Correct errors on-site. Check for non-responders
IDF guide for diabetes epidemiology studies 16
Preparing the protocol
A written protocol is required to provide guidance for collaborators and to inform other interested parties, such as funding agencies. It is also mandatory for sub-mission to an ethics committee. The protocol is the roadmap of the study and should include the following:
y description of the main (primary) objective and additional (secondary) objectives
y description of the inclusion criteria, e.g. adults above a certain age living within a certain area
y description of the exclusion criteria, e.g. pregnancy or acute illness
y detailed description of the variables, including how they will be recorded, how they will be analysed and their definitions and cut-off values, e.g. how known diabetes will be assessed. Continuous variables should be registered as such and can subsequently be categorised for analysis. For example, weight, height and calculated BMI should be registered numerically, and then classified as overweight or obese in the analysis for descriptive and association purposes, if needed
y description of the diagnostic methods, such as laboratory tests etc.
y description of the planned statistical analysis y a copy of the survey questionnaire (see Data
collection)
A detailed protocol will also be useful as a reference document that can be consulted throughout the course of the survey, and which will help to avoid deviations or improvised decision-making.
Preparing the budget
Establishing a budget is important, even if there is no external funding source. Salaries should be calculated for all members of the research team and included even if they are ad-honorem. This will reflect the associated time cost (protected time) which is paid indirectly by the institution that employs the team-member. Organ-isations such as local authorities may assign medical or paramedical staff to the survey, which may reduce costs, but if they are not given protected time for the work it may be better to consider hiring staff directly. This may be necessary to guarantee compliance and availability throughout the study, and is particularly rel-evant for surveyors.
Part of the budget should be allocated to raising aware-ness of the survey and highlighting its importance. This
will help maximise participation among the community. If a pre-survey census is not already available, one may need to be funded. The costs of statistical analysis and preparation/publication of the survey report must also be taken into account. Finally, a contingency of at least 10% must be allowed for unexpected costs.
Planning the survey
Sufficient time must be spent planning the logistics of the survey, including discussing aspects that could go wrong and how to avoid these problems.
A pilot survey can be very useful for testing the data collection instruments, assessing the interview flow, evaluating the interviewers and surveyors and checking how anthropometry and other measurements are per-formed. It can help avoid systematic errors in the data collection and is a good opportunity to make changes before the real data gathering starts.
Planning the logistics of the survey will include select-ing a suitable test site, and this may require approval by local health authorities (for phlebotomies, for example). An appropriate method of transport for personnel and laboratory samples must be available and suitably reli-able. The allocation of test groups and organisation of survey materials and personnel are important planning requirements too, especially when the survey will be centralised on one site. Adequate space will be required for blood sampling, anthropometric measurements and data recording. A suitable waiting area must also be pro-vided. Screens can be used if separate rooms are not available. Proper disposal of hazardous waste during blood sampling must be ensured.
Local authorities and other relevant bodies should be contacted to seek authorisation to carry out the sur-vey. It may be useful to recruit prominent members of the community (e.g. religious leaders) to help promote it, and if so, they should be briefed about the protocol. Announcements in newspapers, as well as on radio and television (where appropriate), combined with posters in survey areas, are all potentially useful for helping peo-ple understand the importance of the survey and the benefits of participating.
It can be useful to assign someone as a ‘motivator’ in each survey area to liaise with local organisations and community leaders. Finally, coordination with local healthcare centres is also important, particularly for fol-lowing up with people with diabetes who are identified during the survey.
IDF guide for diabetes epidemiology studies 17
Census
Even if the survey subjects have been selected from a pre-existing register, this will rarely be completely up to date or accurate. As a result, carrying out a census prior to the survey is recommended, and is particularly important in a cluster study. The census should cover the popula-tion that meets the inclusion criteria in the selected area, and be completed shortly before the survey is conducted. It will provide a list of eligible subjects, along with their demographic characteristics and location. The data will enable the sample to be selected; the subjects to be con-tacted; and the non-responders to be identified. It may also provide an opportunity to advertise the survey.
Data collection
All data should be collected in a survey questionnaire (equivalent to a case report form or CRF) which can be physical (paper) or in electronic format (completed on a tablet, for example). The questionnaire should be carefully designed and use simple terms. Resist the temptation to include additional questions which are not relevant to the purpose of the study. Each extra question takes time to complete and has an associated opportunity cost. The questionnaire should incorporate fields or boxes that are designed to record the exact data corresponding to the variables described in the proto-col, including data that will be obtained later, such as laboratory results. It should include instructions for the interviewer/surveyor on how to ask each question and record the response, because as time goes by, misun-derstandings may emerge. For an example of a simple questionnaire, see appendix 1. Once completed, each questionnaire should be stored in a safe place (physical versions) or saved in a computer storage system (elec-tronic) with a suitable backup.
It is important to pretest the survey questionnaire – preferably using a version written in the local language
– before using it to collect data. Pretesting or piloting can help identify potential problems and deficiencies in the questionnaire. It also helps ensure that the items accu-rately address the research question(s). Furthermore, piloting can examine whether the questions are com-prehensible to both the participants and the interviewer. A small sample can be used to pilot the questionnaire.
When piloting a questionnaire, the following points should be assessed in a debriefing session afterwards:
y clarity of the instructions for completing the questionnaire
y clarity of the terms used within the questions y readability of the questions: font used and layout y whether there is enough space in the boxes to
record the data in a readable way y time required to complete the questionnaire y the flow of the questionnaire, in case there are
questions with filters
During the survey, the field supervisors should verify on a daily basis that data collection has been completed satisfactorily. This will avoid recall bias and loss of con-tact with participants. It is essential to keep missing data to a minimum, particularly where it relates to key explanatory variables (individual characteristics known to be risk factors for diabetes) and outcome variables (blood tests, diabetes diagnosis, etc.). To avoid gaps, it is vital to trace individuals whose data is incomplete dur-ing the data collection phase, to implement systems to make sure survey variables are completed and to mini-mise procedural and laboratory errors.
When transferring the data from the questionnaire to the dataset, data cleaning should be carried out with the help of the statistician. All participants should have a unique personal identification number in the dataset which cor-responds to the same number on the questionnaire.
In the case of large numbers of non-responders, find-ing suitable replacements of similar age, sex and social status is a way of reducing non-response bias. Another approach, in theory at least, is to sample non-response and derive a weighted estimate. Neither of these approaches is a substitute for an appropriate response rate, and every effort should be made to achieve this. Responders and non-responders should not differ in the main characteristics that are relevant to the pur-pose of the study, and wherever possible this should be demonstrated by comparing their age and sex, at the very least.
Periodic reports on the progress and quality of data col-lection must be reviewed by an expert committee. Any shortcomings or errors at any site or at any level of the survey should be rectified. A multi-stage stratified sam-pling technique is most suitable for large national or state-level surveys.
Physical examination
Height should be measured without shoes, with the sub-ject standing fully erect on a flat surface. Heels, buttocks and shoulders should be flat against a vertical wall, and the subject should look straight ahead (the line between
IDF guide for diabetes epidemiology studies 18
the angle of the eye and the upper point of attach-ment of the ear should be horizontal). The head stopper should be perpendicular to the wall and the scale (a set square is useful if a stadiometer is not available). Meas-urement should be rounded to the nearest centimetre.
Weight should be measured to the nearest 0.1 kg, and the weighing machine should be calibrated daily using a standard weight that is preferably not lighter than the average weight of participants being examined. Par-ticipants should wear light clothing and remove their footwear when being weighed.
Waist circumference should be measured with a tape around the bare waist in a horizontal plane, midway between the inferior margin of the ribs and the superior border of the iliac crests. Measure twice, selecting the lowest measurement (during exhalation) without tight-ening the tape. If the measures differ by more than 2 cm, measure a third time and take the middle measurement. Tape measure devices with push-button retraction and a pin lock feature facilitate accurate readings.
Blood pressure should be measured after participants have rested in a seated position. Calibrated electronic blood pressure monitors should be used. Two readings taken at a five-minute interval should be recorded on the form, as well as the average of the two (the final value). Garments should be adjusted to properly expose the right arm, which should rest comfortably on the table, elbow level with the heart.
Laboratory measurements
As explained in chapter 2, both 2-hour blood glucose during an OGTT and HbA1c are standard measurements for the identification of previously undiagnosed diabe-tes. Fasting blood glucose may identify impaired fasting glucose (IFG) while a 2-hour blood glucose during an OGTT may identify impaired glucose tolerance (IGT). An OGTT is performed by drinking 75g of glucose dissolved in 250–300 ml of water (a large glass), taken slowly but over no longer than 5 minutes.
The blood concentration of glucose in a sample tube can decrease significantly after the sample has been taken due to glycolysis. This can be attenuated by using a tube containing sodium fluoride (NaF) and optimised by combining this with citrate (NaF/citrate). Shake vial after sample is taken. Placing the tube in a slurry of ice and water immediately after blood collection, then sep-arating the plasma from the cells within 30 minutes, will also avoid early glycolysis.
Another approach to minimising glycolysis is to use a tube with an added coagulation activator, together with a polymer separation gel (widely available in most markets). When the blood is collected, a clot forms almost immediately and the serum can subsequently be separated from the red cells by the polymer using cen-trifugation, avoiding glycolysis.
Once the plasma or serum has been separated from the red cells, blood glucose remains stable for 48 hours at room temperature; for 24 hours at 37°C; and for 3 days at 4–6°C. Over longer periods it must be frozen.
The precision and accuracy of blood glucose meas-urements from blood glucose meters may be an issue. Blood glucose is measured by the hexokinase or glucose oxidase method, and at near normal concen-tration, glucose measurement should have an analytical imprecision (CV) ≤ 2.9%, a bias ≤ 2.2%, and a total error ≤ 6.9% for diagnostic purposes to avoid misclassifica-tion of patients. Recent trials with glucometers have documented CVs of about 2% in the hands of trained workers, but there can still be a significant overesti-mation or underestimation in prevalence studies, and venous sample are preferred wherever possible.
Testing for HbA1c has the advantage of not requir-ing the participant to fast, while also providing stable samples, with lower intra-individual biological varia-tion compared with blood glucose. The sample can be collected in a filter paper then sent for analy-sis. The main disadvantages of testing for HbA1c are cost (compared with blood glucose) and standard-isation of measurement. The certification of HbA1c assays is documented by the National Glycohae-moglobin Standardization Program.1 It will identify whether the method and equipment are reliable, and can also provide information on which methods allow identification of abnormal haemoglobins which may interfere with the results. As such, HbA1c testing may be preferred in settings where these abnormalities are frequent.
Measurement of cholesterol in the different lipoprotein fractions does not require fasting or any previous prepa-ration by the subject. Triglycerides may be altered by food ingestion, and therefore require fasting for 8 hours beforehand, preferably with no alcohol intake the pre-vious evening.
In some cultures, the definition of fasting can include a light snack and/or an infusion. This should be inves-tigated and ascertained during the pilot survey. As participants often report at an early hour for the fasting
IDF guide for diabetes epidemiology studies 19
sample and must wait for the completion of the pro-cedures, it is advisable to provide refreshments at the end of the blood sampling process. Incentives may be given to participants to facilitate a good response rate, for example attractive leaflets with healthy lifestyle tips, recipes or reusable water bottles. During the 2 hours between samples, participants could attend short lec-tures or watch videos on healthy lifestyles or other topics related to diabetes and comorbidities.
Errors can occur in the timing of blood collection, both where fasting is involved and in particular for the 2-hour sample if an OGTT is used. Labelling errors can also occur with participants’ samples. The ID number and the time of blood collection should be recorded in the respective questionnaire. Cards may be given to participants with their corresponding ID number and the time of the next blood collection to encourage prompt reporting.
To ensure prompt action in the case of any emergency related to testing, it is advisable to have medical or sen-ior nursing staff on the team.
It is mandatory to follow the guidelines for safe disposal of waste materials, such as used cotton, syringes and sample collection tubes. This waste material should be segregated and disposed of using the services of a bio-medical waste management agency.
Ethical considerations
Although surveys are observational studies which do not compromise the wellbeing of the subjects (as interven-tion studies may do), they must be approved by the local ethics committee (IRB, or institutional review board) and should include a brief informed consent document explaining the purpose of the study, the implications it may have for the participant’s healthcare, and the risks involved in invasive procedures such as blood sampling. It should emphasise the confidentiality of the data col-lected based on Good Clinical Practice. The consent document must be signed by the participant before any procedure is started and the signature of a witness may be required, unless there is a waiver from the local eth-ics committee (IRB).
References
1� The National Glycohaemoglobin Standardization Program, 2010. Harmonizing Hemoglobin A1c Testing. www.ngsp.org. Accessed October 4, 2020.
Recommended reading
Bonetti A, Carta M, Lapolla A, et al. Correct determination of glycemia in the diagnosis and management of diabetes: Recommendations for the optimization of the pre-analytical phase. Nutr Metab Cardiovasc Dis. 2019;29(1):1–3. doi:10.1016/j.numecd.2018.09.013.
Dowse GK, Zimmet P. A model protocol for a diabetes and other noncommunicable disease field survey. World Health Stat Q. 1992;45(4):360–372. https://apps.who.int/iris/handle/10665/49366. Accessed October 4, 2020.
International Diabetes Federation. A Guide to National Diabetes Programmes. https://www.idf.org/our-activities/advocacy-awareness/resources-and-tools/143:a-guide-to-national-diabetes-programmes.html. Accessed October 4, 2020.
King H, Minjoot-Pereira G. Diabetes and Noncommunicable Disease Risk Factor Surveys: A Field Guide. Geneva: World Health Organization; 1999. https://apps.who.int/iris/handle/10665/65312. Accessed October 4, 2020.
Penttilä I, Penttilä K, Holm P, et al. Methods, units and quality requirements for the analysis of haemoglobin A1c in diabetes mellitus. World J Methodol. 2016;6(2):133–142. doi:10.5662/wjm.v6.i2.133.
Sacks DB, Arnold M, Bakris GL, et al. Guidelines and recommendations for laboratory analysis in the diagnosis and management of diabetes mellitus. Clin. Chem. 2011;57(6)e1–e47. doi:10.1373/clinchem.2010.161596.
World Health Organization. STEPwise approach to noncommunicable disease risk factor surveillance (STEPS). https://www.who.int/ncds/surveillance/steps/riskfactor/en/. Accessed October 4, 2020.
IDF guide for diabetes epidemiology studies 20
Chapter 4
Data handling and statistical analysis
Key points
y A good analysis begins at the planning stage of a study. The analysis plan must include the elements that are necessary to extrapolate findings to the wider population of interest
y Missing data can compromise the study results. Limited options exist for dealing with missing data at the point of analysis
y Presentation of the study results must be clear and consistent
Katherine Ogurtsova, Sarah Wild, Leonor Guariguata, Chris Patterson
The data handling and analysis plan should be described in the study protocol, and should specify appropriate and transparent methods in sufficient detail so that oth-ers can reproduce the analysis and results with access to the data. The first step should be to validate the data collected in the survey.
Validation
Validation of data is defined as the process of checking or assessing the validity or accuracy of a dataset.
Following data collection, a raw dataset should be stored and then verified to see if any values require changes or corrections based on values that are significantly out of the expected range, or if, on comparison with another source of information on these values (such as data entry forms or questionnaires) errors are discovered.
Validation can be conducted during data entry using suitable software controls, for example by limiting acceptable entries to feasible ranges of values, or by alerting the person entering the data that essential var-iables should not be left blank (e.g. age, date, calendar year). A field such as age may be restricted to 18–79 years, and any value outside that range would be con-sidered suspect and require verification. If survey data are collected electronically rather than using paper
questionnaires, similar limits can be placed on varia-bles. The accuracy of the data entered should also be checked. For example, systolic blood pressure must exceed diastolic blood pressure, and a respondent who states that they have never smoked could not be recorded as smoking 20 cigarettes per day. Original data collection documents or raw data sources (i.e. record-ings of interviews) can be reviewed to check implausible entries in individual cases.
Coding and data entry should be quality controlled by selecting a random sample of participants from the dataset and verifying their data against the origi-nal data (whether this is electronic, or on paper forms). Using numerical codes for missing and ‘not applica-ble’ values is recommended, rather than leaving data fields blank.
Computer programmes such as Epi InfoTM can be used for data entry and validation. A list of recommended packages can be found in appendix 2.
All changes to the data should be documented, includ-ing as a minimum the following:
y date of the change y variable identification y original variable value y new variable value
IDF guide for diabetes epidemiology studies 21
y type of mistake/reason for the change y person making the change
Following data validation and correction, the final data-set should be appropriately identified so that it can be distinguished from the raw data file. Recourse to the raw data must be possible at all times for any subse-quent validation.
The completeness of the data should be reported.
Missing data
Even in a well-designed survey, missing data is an issue, particularly in studies that are based on routine data. There are two major risks associated with missing data that can threaten the validity of the results:
y selection bias if participants with specific characteristics do not respond
y reduced statistical precision in estimates, leading to wider confidence intervals as a result of a reduced sample size
It is crucial to assess whether the missing data values are random or systematic. A brief overview of missing data types is given in appendix 2.
Non-response
Not all individuals who are eligible for a survey will agree to participate, and some may refuse to participate in some parts of the data collection process. However, any responses that are available should still be recorded. A survey response rate should be calculated, based on the number of people agreeing to participate divided by the number approached for participation (including refus-als). Analyses should then be restricted to those who consented to the relevant use of their data. If possi-ble, collect the age, sex and other sociodemographic information of individuals who refuse to participate. Comparisons between responders and non-responders should be reported based on these characteristics.
Estimates of overall prevalence and prevalence for population sub-groups should be accompanied by confidence intervals (see below). Alternatively, the infor-mation on the numerators and denominators needed to calculate them should be provided.
Complex sampling methods (e.g. stratified or clus-ter sampling, where eligible respondents have different
probabilities of selection) complicate the estimation of prevalence proportions and their confidence inter-vals. They require the use of special statistical methods to obtain estimates that are unbiased and reported with suitable statistical precision. More information about the methods can be found in Fuller (2011) and Beckett (1992).
Definition of diabetes incidence
The numerator for estimating the incidence of diabetes is the number of new cases of diabetes diagnosed in a specified period of time, often a year, and collected in a follow-up study or a register. The denominator is strictly defined as the number of people in the population at risk of developing diabetes, that is the number without an existing diagnosis of diabetes. When diabetes prevalence is low, for example with type 1 diabetes (T1D), similar inci-dence estimates will be obtained if the total population is used as the denominator, instead of the at-risk population. However, when diabetes prevalence is high, for exam-ple with type 2 diabetes (T2D) among 65-year-old men, using the total population as the denominator instead of the at-risk population will underestimate incidence.
Weighting survey data
The distribution of key factors such as age and sex in the survey sample may differ from that of the popula-tion of interest. This often happens because response rates differ across sub-groups, but in some cases it may reflect the study design. Weighting such data is a com-monly used technique to reduce bias and provide more reliable estimates at the population level. Weighting is not required if a simple random sample is selected and there is a high response rate.
There are two types of survey weights, design weights and post-stratification weights. These can be multiplied to get a single weight for each respondent.
Design weights� Sometimes at the design stage there is deliberate oversampling of minority groups or those living in an area with a large ethnic minority population. If investigators choose, for example, to double the size of the sample from a minority group or area to ensure that more useful results on that minority group can be obtained, then each person in the minority must be assigned a design weight which is half that of partici-pants in the rest of the sample.
Post-stratification weights� Surveys frequently have higher response rates among women than men. This
IDF guide for diabetes epidemiology studies 22
means that women are over-represented in the sam-ple relative to their representation in the population, and their results must be assigned a lower post-stratification weight to compensate for this.
Weighting in survey design and analysis is a complex task and requires advanced knowledge in statistical methods. Further information about weighting can be found in Sakshaug and West (2014).
Statistical methods
Analysis should be completed as soon as possible after the data have been thoroughly cleaned. The finalised, clean dataset should be kept for a minimum of 10 years or in accordance with protocols set out by funders and local data governance bodies.
Calculation of prevalence
There are two ways to calculate prevalence: point and lifetime prevalence (although see also period preva-lence, which is described in chapter 2):
y point prevalence: the proportion of diabetes cases in a population at a given point in time
y lifetime prevalence: the proportion of people in a population that are estimated to develop diabetes at some time during their lives
Epidemiological studies of diabetes usually provide an estimate of point prevalence. Nevertheless, prev-alence studies take place over a period of time, which should be as short as possible to avoid incorporating changes in prevalence over time. The time dimension should be mentioned when the resulting prevalence is reported.
The formula for calculating prevalence is:
‘Number of cases’ (numerator) refers to the number of people with a condition (diabetes) at a given time; and ‘Total population’ (denominator) is the number of people in the underlying population at that given time. Preva-lence can be expressed as a percentage or a proportion.
The same formula is applicable for calculating the prev-alence in sub-groups. Let us assume that there are k sub-groups (for example, based on sex, age-group or
setting). Then the prevalence in the ith sub-group (i = 1,2,…,k) can be obtained as:
Where pi is a prevalence, ni is the number of cases in the ith sub-group, and Ni is the total number of respondents in the ith sub-group.
When calculating the prevalence of a disease in a study, the numerator is always a subset of the denominator. This means that everyone who is counted in the numer-ator is included in the denominator. The denominator is the total group of interest at a given time, whether or not they have the condition of interest.
It is important to consider how numerators and denom-inators may have changed when the results of repeated cross-sectional surveys are compared over time. The numerator will be affected by factors including:
y changes in the definition of diabetes y changes in screening, and hence detection rates,
within the population
The denominator will be affected by factors including:
y emigration and immigration y demographic shifts y changes in administrative boundaries
As diabetes prevalence changes over time, it is impor-tant to clearly specify the year or time period in which data were collected.
Confidence intervals and the role of chance
The inclusion of confidence intervals (CI) provides an indi-cation of the precision of the prevalence estimate. These uncertainty estimates take into account sampling error.
The formula for a CI for prevalence is:
p is the prevalence in the sample, N is the sample size, and z is the appropriate value from the standard nor-mal distribution for the desired confidence level (usually 95%). Table 4.1 shows values of z for various commonly chosen confidence levels.
Prevalence, p =Number of casesTotal population
pi =ni
Ni
p ± z × p (1 – p)
N
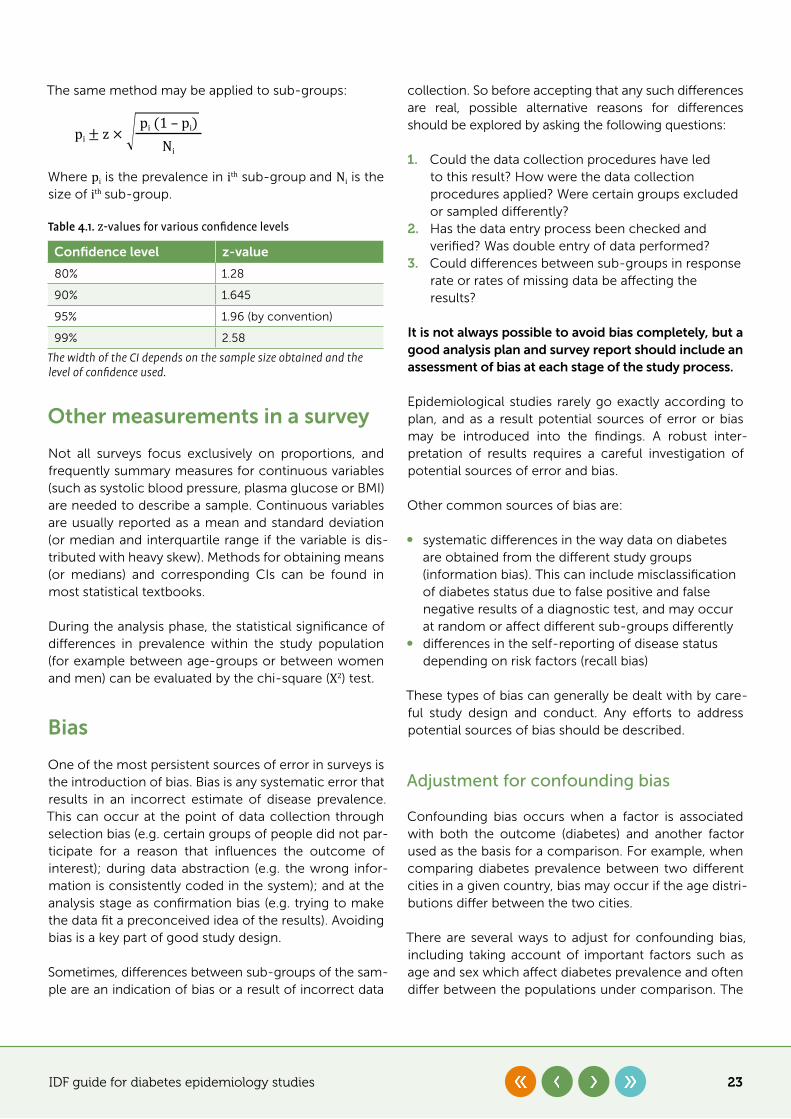
IDF guide for diabetes epidemiology studies 23
The same method may be applied to sub-groups:
Where pi is the prevalence in ith sub-group and Ni is the size of ith sub-group.
Other measurements in a survey
Not all surveys focus exclusively on proportions, and frequently summary measures for continuous variables (such as systolic blood pressure, plasma glucose or BMI) are needed to describe a sample. Continuous variables are usually reported as a mean and standard deviation (or median and interquartile range if the variable is dis-tributed with heavy skew). Methods for obtaining means (or medians) and corresponding CIs can be found in most statistical textbooks.
During the analysis phase, the statistical significance of differences in prevalence within the study population (for example between age-groups or between women and men) can be evaluated by the chi-square (X2) test.
Bias
One of the most persistent sources of error in surveys is the introduction of bias. Bias is any systematic error that results in an incorrect estimate of disease prevalence. This can occur at the point of data collection through selection bias (e.g. certain groups of people did not par-ticipate for a reason that influences the outcome of interest); during data abstraction (e.g. the wrong infor-mation is consistently coded in the system); and at the analysis stage as confirmation bias (e.g. trying to make the data fit a preconceived idea of the results). Avoiding bias is a key part of good study design.
Sometimes, differences between sub-groups of the sam-ple are an indication of bias or a result of incorrect data
collection. So before accepting that any such differences are real, possible alternative reasons for differences should be explored by asking the following questions:
1� Could the data collection procedures have led to this result? How were the data collection procedures applied? Were certain groups excluded or sampled differently?
2� Has the data entry process been checked and verified? Was double entry of data performed?
3� Could differences between sub-groups in response rate or rates of missing data be affecting the results?
It is not always possible to avoid bias completely, but a good analysis plan and survey report should include an assessment of bias at each stage of the study process.
Epidemiological studies rarely go exactly according to plan, and as a result potential sources of error or bias may be introduced into the findings. A robust inter-pretation of results requires a careful investigation of potential sources of error and bias.
Other common sources of bias are:
y systematic differences in the way data on diabetes are obtained from the different study groups (information bias). This can include misclassification of diabetes status due to false positive and false negative results of a diagnostic test, and may occur at random or affect different sub-groups differently
y differences in the self-reporting of disease status depending on risk factors (recall bias)
These types of bias can generally be dealt with by care-ful study design and conduct. Any efforts to address potential sources of bias should be described.
Adjustment for confounding bias
Confounding bias occurs when a factor is associated with both the outcome (diabetes) and another factor used as the basis for a comparison. For example, when comparing diabetes prevalence between two different cities in a given country, bias may occur if the age distri-butions differ between the two cities.
There are several ways to adjust for confounding bias, including taking account of important factors such as age and sex which affect diabetes prevalence and often differ between the populations under comparison. The
pi ± z × pi (1 – pi)
Ni
Table 4.1. z-values for various confidence levels
Confidence level z-value
80% 1.28
90% 1.645
95% 1.96 (by convention)
99% 2.58
The width of the CI depends on the sample size obtained and the level of confidence used.
IDF guide for diabetes epidemiology studies 24
simplest way to make comparisons is to present strati-fied results, for example for men and women separately. Age-specific (or age-stratified) diabetes prevalence is often described, but different studies often use differ-ent age-groups. Ideally all data should be presented in five-year age-groups (e.g. 0–4, 5–9, 10–14, etc.) but many surveys are too small to allow this level of detail. The next best option is to present data in 10-year age-groups (e.g. 0–9, 10–19, 20–29, etc.), but even this level of aggregation may be impractical for small surveys, and 20-year age-groups may be required (e.g. 20–39, 40–59, 60–79 years).
Standardisation is a commonly used approach for pro-viding a single estimate of prevalence that takes into account differences in age structures between popula-tions. Often this is achieved by standardising prevalence in each population to a common standard population. Several standard populations can be used, for example at regional levels for Africa and Europe. The source of a standard population should be referenced in any report-ing. The World Standard Population for 2000–2025, as used to compare age-standardised prevalence between countries in the IDF Diabetes Atlas, is given in appendix 2.
Age standardisation is a way of comparing the prevalence of disease in two populations that have different age struc-tures. It provides a method for answering the question:
If these two populations had the same age structure of the standard population, what would their preva-lences of disease be, and how would they compare?
It is important to note that a standardised prevalence is useful only for comparisons. If the objective is to under-stand the overall prevalence of disease in a country, then the crude prevalence should be used, assuming the sample is representative of the age distribution of the country. Weighting can be used to adjust the preva-lence obtained from a sample with a non-representative age distribution (see above).
In order to provide an estimate of prevalence standardised by age, age-specific data must be available. This means prevalence estimates are required for several age-groups. Typically, 10-year age-groups are necessary, although 5-year age-groups are preferable. The prevalence of dis-ease in each age-group is then applied to the numbers of people in the same age-group from the standard popu-lation in order to calculate the number of cases expected in the standard population. These are then summed over age-groups and divided by the whole of the standard population to get the standardised prevalence.
This can be represented by the following equation:
Where pi is the prevalence of the condition in age-group i in the study population, wi is the proportion of people in the same age-group i in the standard population and n is the number of age-groups.
Other adjustments
As long as relevant standard population estimates are available, prevalence can be standardised for other characteristics, depending on the desired analysis. For instance, prevalence can be standardised for sex; urban or rural location; education level; socioeconomic sta-tus; ethnicity; or other factors. Other adjustments are often made when there is evidence of a difference in distribution of disease based on some of the social determinants of health.
Validity of the analysis
Statistical analyses should ideally be subjected to veri-fication. The underlying data and programmes should be stored in a completely reproducible form. Other researchers in the team should have the opportunity to reproduce analyses. If resources are available, all results should be checked by a qualified person who has not previously been involved in the analyses.
Inconsistencies in the results between original analyses and independent verifications require clarification; con-sistency, on the other hand, attests to the reproducibility of the results.
The results should be checked in terms of two types of validity:
1� Internal validity implies that the observed results are robust and that the roles of chance, bias and confounding factors have been addressed
2� External validity refers to the extent to which the findings from a survey might be relevant to other populations. A high degree of context specificity implies a lack of generalisability. As a result, even if the research design is robust enough to ensure internal validity, the result may only be valid for the population from which the data were derived
Age-standardised prevalence = ∑(i=1) pi * win
IDF guide for diabetes epidemiology studies 25
Recommended reading
Beckett, LA, Scherr, PA, Evans, DA. Population prevalence estimates from complex samples. J Clin Epidemiol. 45(4),393–402. doi:10.1016/0895-4356(92)90040-T.
Fuller, WA. Sampling Statistics. (Wiley Series in Survey Methodology Book 560). Hoboken, NJ: Wiley; 2011.
Little, RJA, Rubin, DB. Statistical Analysis with Missing Data. 3rd ed. Hoboken, NJ: Wiley; 2019.
Sakshaug JW, West BT. Important Considerations When Analyzing Health Survey Data Collected Using a Complex Sample Design. Am J Public Health. 2014 Jan;104(1):15–16.
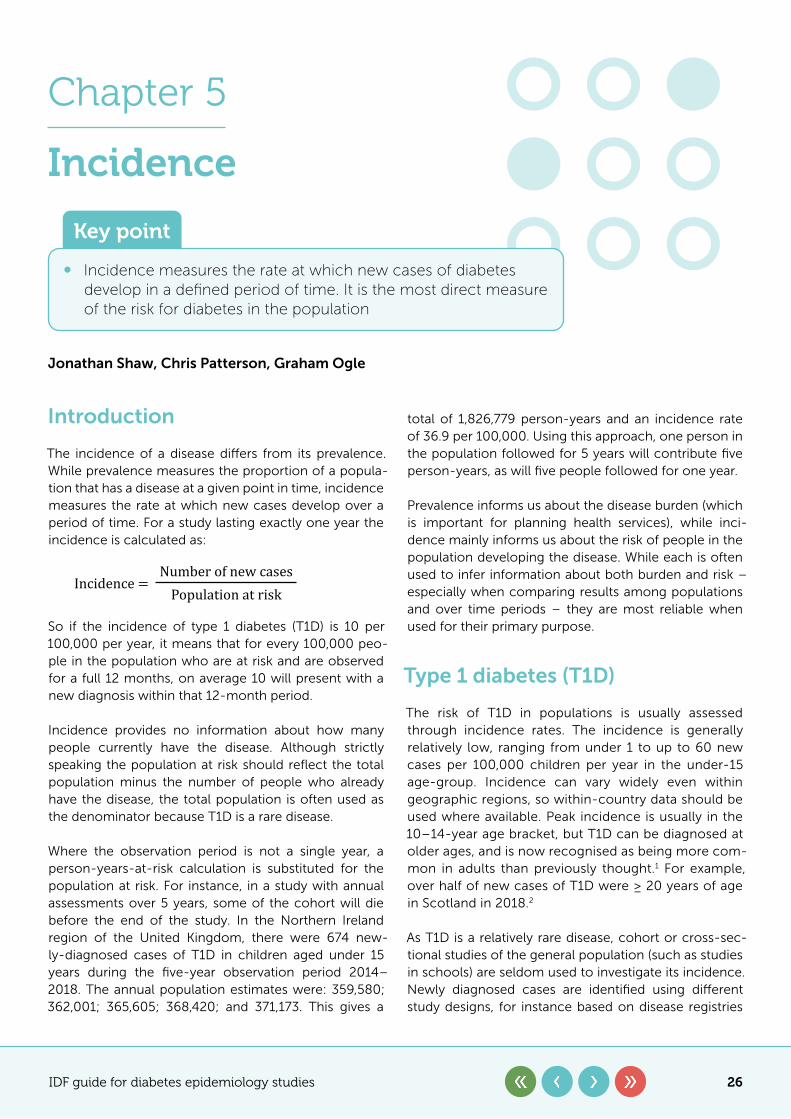
IDF guide for diabetes epidemiology studies 26
Chapter 5
Incidence
Key point
y Incidence measures the rate at which new cases of diabetes develop in a defined period of time. It is the most direct measure of the risk for diabetes in the population
Jonathan Shaw, Chris Patterson, Graham Ogle
Introduction
The incidence of a disease differs from its prevalence. While prevalence measures the proportion of a popula-tion that has a disease at a given point in time, incidence measures the rate at which new cases develop over a period of time. For a study lasting exactly one year the incidence is calculated as:
So if the incidence of type 1 diabetes (T1D) is 10 per 100,000 per year, it means that for every 100,000 peo-ple in the population who are at risk and are observed for a full 12 months, on average 10 will present with a new diagnosis within that 12-month period.
Incidence provides no information about how many people currently have the disease. Although strictly speaking the population at risk should reflect the total population minus the number of people who already have the disease, the total population is often used as the denominator because T1D is a rare disease.
Where the observation period is not a single year, a person-years-at-risk calculation is substituted for the population at risk. For instance, in a study with annual assessments over 5 years, some of the cohort will die before the end of the study. In the Northern Ireland region of the United Kingdom, there were 674 new-ly-diagnosed cases of T1D in children aged under 15 years during the five-year observation period 2014–2018. The annual population estimates were: 359,580; 362,001; 365,605; 368,420; and 371,173. This gives a
total of 1,826,779 person-years and an incidence rate of 36.9 per 100,000. Using this approach, one person in the population followed for 5 years will contribute five person-years, as will five people followed for one year.
Prevalence informs us about the disease burden (which is important for planning health services), while inci-dence mainly informs us about the risk of people in the population developing the disease. While each is often used to infer information about both burden and risk – especially when comparing results among populations and over time periods – they are most reliable when used for their primary purpose.
Type 1 diabetes (T1D)
The risk of T1D in populations is usually assessed through incidence rates. The incidence is generally relatively low, ranging from under 1 to up to 60 new cases per 100,000 children per year in the under-15 age-group. Incidence can vary widely even within geographic regions, so within-country data should be used where available. Peak incidence is usually in the 10–14-year age bracket, but T1D can be diagnosed at older ages, and is now recognised as being more com-mon in adults than previously thought.1 For example, over half of new cases of T1D were ≥ 20 years of age in Scotland in 2018.2
As T1D is a relatively rare disease, cohort or cross-sec-tional studies of the general population (such as studies in schools) are seldom used to investigate its incidence. Newly diagnosed cases are identified using different study designs, for instance based on disease registries
Incidence =Number of new cases
Population at risk
IDF guide for diabetes epidemiology studies 27
or administrative databases. A disease registry collects and maintains records on the new cases of a disease for a defined population. Registries are often specifically set up to identify newly diagnosed cases of a particu-lar condition (in this case T1D), but in some countries they can be created indirectly through linkage of rou-tine databases used in the management or treatment of the condition (e.g. outpatient attendances or insulin prescriptions).
Registry data have confirmed that the incidence of T1D, at least in childhood and adolescence, has increased in recent decades, although some attenuation of this increase has been reported recently in a few high-in-cidence countries. In adults, the changes in incidence over time are less consistent, with some countries reporting increases and others decreases, although information about T1D in adults is less reliable than in children because of diagnostic uncertainty with type 2 diabetes (T2D). No strong environmental risk factors for T1D have been identified, therefore no convincing explanation can be offered for the changes in inci-dence rates.
Diagnosis of T1D
Ideally a uniform definition of T1D should be used in the registry. Diagnosis is often made from a random blood glucose value ≥ 11.1 mmol/L, in the presence of classic symptoms of polyuria, polydipsia, weight loss and fatigue in a child, adolescent or adult, and the con-tinued need for insulin to maintain glycaemic control. However, children presenting with such symptoms in the first nine months of life may have a monogenic form of diabetes (monogenic onset diabetes of the young, MODY). In older children, adolescents and adults, other forms of diabetes should be considered, particularly in some countries and ethnicities. T2D is the most common alternative diagnosis, particularly in the presence of obesity, a strong family history of T2D or acanthosis nigricans (see table 8.2.1 in chapter 8.2). For atypical presentations or courses of disease, other rare types of diabetes such as ketosis-prone/flatbush/malnutrition-related diabetes should be considered.
Although autoantibody and C-peptide testing can increase the diagnostic certainty of T1D, many settings do not use these tests due to limited resources and the lack of perceived need to further confirm the diagno-sis. In adults, the need for insulin therapy – initially to stabilise but thereafter to maintain blood glucose levels
– and early age of onset (e.g., < 30 years) is often taken as adequate confirmation of the differential diagnosis of
T1D. In the absence of the results of antibody tests, most registries and studies define T1D pragmatically using a combination of age at diagnosis and shorter time from diagnosis until insulin therapy commencement than is typical for T2D.
How to register new cases of T1D
T1D incidence studies are usually based on a regis-try. Where possible, multiple sources of ascertainment should be used so that as many cases as possible are identified. These sources can include insulin prescrip-tions; insurance registrations; hospital records; and surveys of paediatric and adult endocrinologists and paediatricians. The capture-recapture method can be used to assess the completeness of ascertainment (see below). Further information on creating and maintaining a registry is included in chapter 7.
The geographical area of the registry
Researchers must clearly define the registry’s geo-graphical area. Additionally, cross-border flow should be investigated so that residents seeking treatment outside the area are included, and non-residents receiving treatment in the area excluded. Ideally, pop-ulation estimates that are broken down by age and sex should be available for the registry area for use as denominator figures in the calculation of incidence rates. Although datasets which include only a subset of individuals within a specific geographical region (e.g. some insurance databases) may provide incidence rate information, they are generally regarded as less repre-sentative of the population.
Registry coverage
The choice of information to record in the regis-try needs careful consideration. Some registries only include basic identifying information such as name, date of birth, sex, address and date of diagnosis (or date of blood glucose determination or first insulin injection as a proxy). In these cases, the inclusion of a unique patient identifier may assist linkage with other sources of information. A geographical identifier, such as a zip or postal code where available, will also assist in examining results in smaller geographical areas. Other registries may record additional clinical information, although this can be expensive and time-consuming. If the registry area is served by a single clinical informa-tion system linked to provision of care for those with
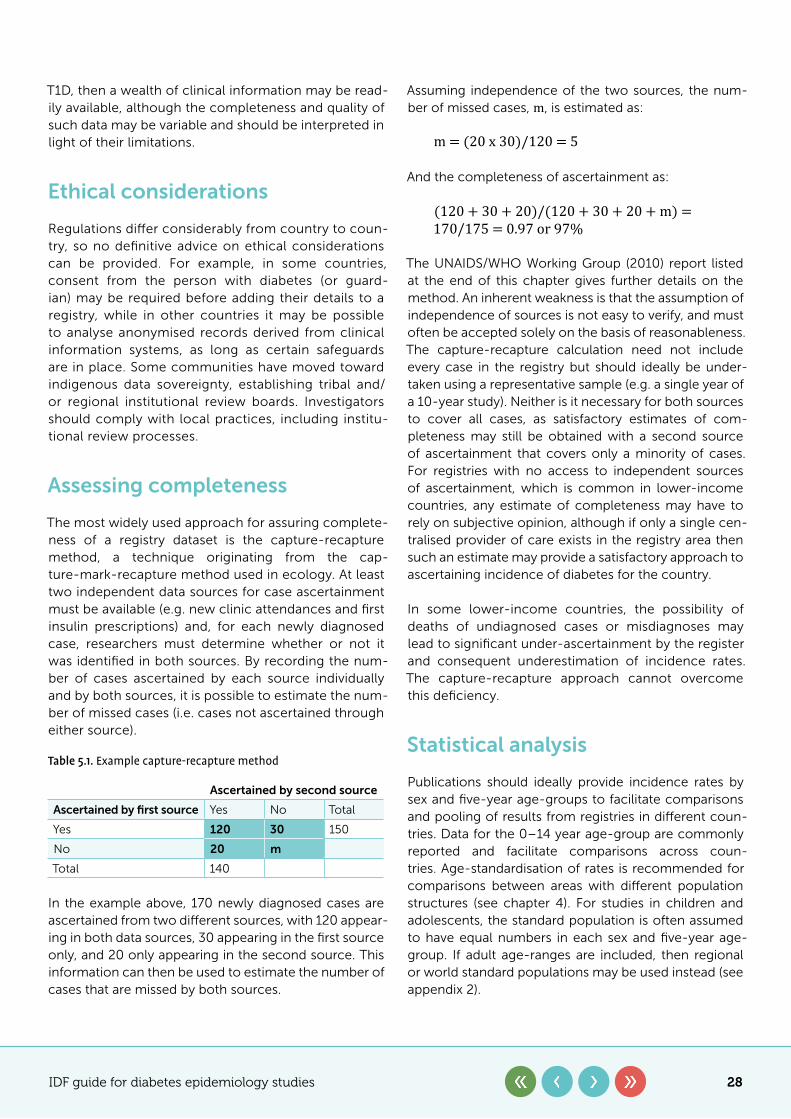
IDF guide for diabetes epidemiology studies 28
T1D, then a wealth of clinical information may be read-ily available, although the completeness and quality of such data may be variable and should be interpreted in light of their limitations.
Ethical considerations
Regulations differ considerably from country to coun-try, so no definitive advice on ethical considerations can be provided. For example, in some countries, consent from the person with diabetes (or guard-ian) may be required before adding their details to a registry, while in other countries it may be possible to analyse anonymised records derived from clinical information systems, as long as certain safeguards are in place. Some communities have moved toward indigenous data sovereignty, establishing tribal and/or regional institutional review boards. Investigators should comply with local practices, including institu-tional review processes.
Assessing completeness
The most widely used approach for assuring complete-ness of a registry dataset is the capture-recapture method, a technique originating from the cap-ture-mark-recapture method used in ecology. At least two independent data sources for case ascertainment must be available (e.g. new clinic attendances and first insulin prescriptions) and, for each newly diagnosed case, researchers must determine whether or not it was identified in both sources. By recording the num-ber of cases ascertained by each source individually and by both sources, it is possible to estimate the num-ber of missed cases (i.e. cases not ascertained through either source).
In the example above, 170 newly diagnosed cases are ascertained from two different sources, with 120 appear-ing in both data sources, 30 appearing in the first source only, and 20 only appearing in the second source. This information can then be used to estimate the number of cases that are missed by both sources.
Assuming independence of the two sources, the num-ber of missed cases, m, is estimated as:
And the completeness of ascertainment as:
The UNAIDS/WHO Working Group (2010) report listed at the end of this chapter gives further details on the method. An inherent weakness is that the assumption of independence of sources is not easy to verify, and must often be accepted solely on the basis of reasonableness. The capture-recapture calculation need not include every case in the registry but should ideally be under-taken using a representative sample (e.g. a single year of a 10-year study). Neither is it necessary for both sources to cover all cases, as satisfactory estimates of com-pleteness may still be obtained with a second source of ascertainment that covers only a minority of cases. For registries with no access to independent sources of ascertainment, which is common in lower-income countries, any estimate of completeness may have to rely on subjective opinion, although if only a single cen-tralised provider of care exists in the registry area then such an estimate may provide a satisfactory approach to ascertaining incidence of diabetes for the country.
In some lower-income countries, the possibility of deaths of undiagnosed cases or misdiagnoses may lead to significant under-ascertainment by the register and consequent underestimation of incidence rates. The capture-recapture approach cannot overcome this deficiency.
Statistical analysis
Publications should ideally provide incidence rates by sex and five-year age-groups to facilitate comparisons and pooling of results from registries in different coun-tries. Data for the 0–14 year age-group are commonly reported and facilitate comparisons across coun-tries. Age-standardisation of rates is recommended for comparisons between areas with different population structures (see chapter 4). For studies in children and adolescents, the standard population is often assumed to have equal numbers in each sex and five-year age-group. If adult age-ranges are included, then regional or world standard populations may be used instead (see appendix 2).
Table 5.1. Example capture-recapture method
Ascertained by second source
Ascertained by first source Yes No Total
Yes 120 30 150
No 20 m
Total 140
m = (20 x 30)/120 = 5
(120 + 30 + 20)/(120 + 30 + 20 + m) = 170/175 = 0.97 or 97%
IDF guide for diabetes epidemiology studies 29
Confidence intervals for rates are usually obtained by assuming that case numbers (or counts) follow a Poisson distribution. The 95% confidence limits for the Poisson count (available from tables or statistical packages) can then be divided by the denominator of the rate to derive the corresponding confidence interval. More complex methods are required for estimating confidence inter-vals for age-standardised rates.
For further information on studies in children and ado-lescents, see chapter 8.2.
Type 2 diabetes (T2D)
The burden of T2D has predominantly been measured and tracked through prevalence surveys. These studies measure the proportion of the population that has dia-betes at a given point in time, and are suitable for some aspects of diabetes surveillance. The rising prevalence and numbers of people with T2D in recent decades have been closely linked to the rising risk of T2D in the pop-ulation. As sedentary lifestyles and unhealthy diets have become more widespread, so the prevalence of T2D has increased.
However, there are important limitations to the inter-pretation of prevalence studies. The prevalence of a condition is dependent on two key factors – the rate at which new cases enter the pool of people with the con-dition (i.e. incidence of diabetes), and the rate at which they leave the pool (mainly mortality among people with diabetes, and less commonly emigration). Alter-ing either of these rates will affect the prevalence. Thus, it is not always the case that rising prevalence of T2D is due to rising risk and incidence in the population, as reductions in mortality can also lead to an increase in prevalence. Similarly, if more people develop diabetes than die among those with the disease, the prevalence will rise, even if both incidence and mortality are stable over time. As mortality rates have now been falling for some time in most high-income countries, changes in the prevalence of T2D cannot readily be attributed to rising incidence.
In order to better understand the population risk of T2D, it is necessary to conduct incidence studies. These are important, as the success or failure of a public health intervention to prevent diabetes should not be judged only by its effect on prevalence. Indeed, there is a risk that an effective national diabetes prevention pro-gramme could reduce the incidence of diabetes, and yet be rejected because of its apparent lack of impact on prevalence.
Types of incidence study
There are several approaches to estimating the inci-dence of T2D. The major ones are outlined below, each with a brief discussion of its strengths and weaknesses. More detail on how to set up these data sources can be found in chapter 2 and chapter 7. Since one of the key aims of assessing incidence is the ability to track how it changes over time, the utility of each method for such trend analyses will also be covered.
Cohort studies
The classic approach to estimating the incidence of T2D is through a population-based cohort study. This involves recruiting a large population (typically several thousand people) which is representative of the back-ground reference population. The baseline study would usually involve both self-reporting of diabetes status and testing of glycaemia (through blood glucose or HbA1c) to confirm self-reported diabetes and to identify undi-agnosed diabetes. In order to measure incidence, the cohort is followed up over a number of years, usually with a repeat of the baseline survey at relevant intervals, and the incidence calculated from the number of new cases of diabetes among those who were initially free of diabetes.
The key strength of this approach is the identification of undiagnosed diabetes, which means that the findings do not only depend on clinically diagnosed diabetes, which is influenced by screening practices outside the study. Other data that can help to understand risk factors and risks in different sub-groups is also typically collected.
The limitations of cohort studies include:
y low response rates at baseline, which are then compounded at follow-up
y the significant challenges of conducting nationally representative cohort studies
y the possibility that people who develop diabetes during follow-up die before the next follow-up visit, and are then misclassified as not having diabetes (although access to medical records can overcome this)
However, the key limitations arise from the desire to track incidence over time. If a cohort is followed up from 2000–2005, for example, its incidence might be representative of the general population, but if a fur-ther follow-up occurred in 2010, the second time period (2005–2010) cannot be interpreted as representative,
IDF guide for diabetes epidemiology studies 30
as the 2005 population is already depleted of those at highest risk. One way of dealing with this last limitation is through an open cohort, in which new participants join the cohort over time. An alternative is to conduct inde-pendent cohort studies starting at different time points.
The other key limitation in regard to estimating trends over time is study size. Annual incidence rates of T2D are typically less than 1% per year. This means that a study of 5,000 people would accrue 250 new cases from 2000–2005, if follow-up was 100%. If a second independent study was conducted from 2005–2010, a reduction in incidence of 10% between the two time periods might be statistically difficult to detect because of the limited num-bers of cases. This may be compounded by differences (e.g. in demographics, or response rates) between the two populations, making direct comparisons hard. Finally, this approach has a detrimental time lag. A cohort study conducted from 2010 to 2015 would probably report data in 2017 at the earliest, and reflects average incidence across the 5 years, not in the last year. This multi-year lag is problematic for determining whether intervention pro-grammes should be continued.
Administrative datasets
Electronic health records, insurance claims databases and disease registries are the key sources of administra-tive and clinical data that can be used to track diabetes. In these data sources, diabetes is defined in a variety of ways, ranging from a clinical diagnosis by a healthcare professional to sophisticated algorithms based on mul-tiple sources of information, such as diagnostic codes, blood test results and medication lists. In any given year, the incident cases of diabetes are defined as those who, for the first time, meet the criteria established for the definition of diabetes.
The strengths of this approach include:
y large size: many such sources have data on more than 100,000 people per year, providing power to detect small changes
y an effective 100% response rate among those who are already part of the data system, as there is no process of volunteering to be factored in
y high degrees of representation of national populations for certain national datasets in countries with universal healthcare coverage
y low cost of data acquisition y an ‘open cohort’ design allowing rapid year-on-year
comparisons to be made
The limitations of this approach include:
y no assessment of undiagnosed diabetes, making it possible that changes in observed incidence are driven by changes in screening practice and population awareness of risk factors and symptoms, rather than by real changes in incidence
y differing ways of defining diabetes both within and between datasets
y rapid movement of individuals in and out of some administrative datasets (e.g. insurance databases that are linked to employment status)
y a lack of availability in many lower and middle-income countries of the data systems needed to establish and support electronic administrative datasets
y for some datasets, particularly those not based in universal healthcare settings, a lack of generalisability to the national population
Cross-sectional surveys
Incidence is not usually estimated from cross-sectional studies as it is a time-based measure. However, if the date that diabetes was clinically diagnosed is collected, it is possible to estimate the incidence of clinically diag-nosed diabetes in a cross-sectional study. An incident case can be defined as anyone who reports having dia-betes which was diagnosed in the previous 12 months. The strengths of this approach include:
y the widespread use of health surveys, even in lower and middle-income countries
y surveys are often undertaken on a regular cycle over time
y since this approach relies on self-reporting rather than blood testing, questionnaires and phone surveys can be used
The limitations include:
y there is no measure of undiagnosed diabetes unless glucose testing is included in the protocol
y the sample size needs to be large to detect changes in incidence over time
y uncertainty may exist over the accuracy of the report regarding the date of previous diagnosis of diabetes
The last point is critical and needs to be investigated in any given survey by validating a sample against medi-cal records.
IDF guide for diabetes epidemiology studies 31
As can be seen from the discussion above, there is no perfect or simple means of estimating the incidence of diabetes. However, the importance of this metric in tracking the diabetes epidemic – and in particular for assessing the impact of population-wide diabetes pre-vention interventions – means that attempts should be made, wherever possible, to estimate incidence. The
different approaches described provide options which can be used in different settings. The limitations of each method should be carefully considered, as there may be ways of mitigating some of them. For example, elec-tronic health records or pathology systems may make it possible to determine whether diabetes screening activity has changed over time.
References
1� Diaz-Valencia PA, Bougnères P, Valleron A-J. Global epidemiology of type 1 diabetes in young adults and adults: A systematic review. BMC Public Health. 2015;15:255. doi:10.1186/s12889-015-1591-y.
2� NHS Scotland 2018. Scottish Diabetes Survey 2018. Scottish Diabetes Data Group. https://www.diabetesinscotland.org.uk/wp-content/uploads/2019/12/Scottish-Diabetes-Survey-2018.pdf. Accessed November 27, 2020.
Recommended reading
Magliano DJ, Islam RM, Barr ELM, et al. Trends in incidence of total or type 2 diabetes: systematic review. BMJ. 2019 Sep 11;366:l5003. doi:10.1136/bmj.l5003.
Mayer-Davis EJ, Kahkoska AR, Jefferies C, et al. ISPAD Clinical Practice Consensus Guidelines 2018: Definition, epidemiology, and classification of diabetes in children and adolescents. Pediatr Diabetes. 2018;19 Suppl 27:7–19. doi:10.1111/pedi.12773.
Patterson CC, Karuranga S, Salpea P, et al. Worldwide estimates of incidence, prevalence and mortality of type 1 Diabetes in children and adolescents: Results from the International Diabetes Federation Diabetes Atlas. Diabetes Res Clin Pract. 2019;157:107842. doi:10.1016/j.diabres.2019.107842.
UNAIDS/WHO Working Group on Global HIV/AIDS and STI Surveillance. Guidelines on estimating the size of populations most at risk to HIV. Geneva: World Health Organization; 2010. https://data.unaids.org/pub/manual/2010/guidelines_popnestimationsize_en.pdf. Accessed October 4, 2020.
IDF guide for diabetes epidemiology studies 32
Chapter 6
Mortality, survival and life expectancy in people with diabetes
Key points
y Mortality, survival and life expectancy provide useful measures of health at a population level
y The completeness and accuracy of the recording of deaths and their causes vary considerably among health systems
y Analyses based solely on mentions of diabetes on death certificates underestimate the influence of diabetes on mortality
y Mortality of people with diabetes is higher than mortality of people without diabetes, and relative risks differ within populations depending on factors including type of diabetes, age and sex
Sarah Wild, Chris Patterson, Jonathan Shaw
Background
Death is a key outcome in assessing health and the severity of different conditions. This chapter describes different ways of assessing the risk of dying among peo-ple with diabetes. The availability of comparable data is limited because the completeness and accuracy with which dates and causes of death are recorded vary from country to country.
The optimal approach for assessing mortality among people with diabetes is to link a complete popula-tion-based register of people with diabetes to reliable population-based death records. However, this option is not often available and, where medical registration of causes of death exists, diabetes-related deaths can be used as the numerator for estimates of mortality. In settings where medical registration of causes of death is not available, information may be available from lay reports of cause of death or from verbal autopsies.
Even in countries with robust systems for register-ing deaths and recording their causes, the validity of cause of death may be questionable. This is because it is frequently difficult to identify a single cause of death, particularly in people who have several health condi-tions. In countries with established death certification systems, causes of death are frequently classified as underlying or primary, and contributory or second-ary. In addition, among countries that use International Classification of Diseases (ICD) rules to code underly-ing and contributory causes of deaths, any changes in nosology and coding procedures over time complicate the interpretation of time trends in mortality. For exam-ple, the change from the ninth to the tenth revision of ICD codes led to a 2.4% increase in numbers of deaths attributed to diabetes in Canada and the UK, but to a much higher increase in Mauritius and Fiji.
Most routine descriptions of cause-specific mortality only relate to the underlying cause of death. Even if
IDF guide for diabetes epidemiology studies 33
all deaths with any mention of diabetes on the death certificate are included, the figures will generally underestimate its impact. This is because diabetes is often not recorded on death certificates and may be omitted even when it played a role in the death. More accurate estimates of death rates in people with dia-betes can be obtained by linking information from a diabetes population to a national death register. These rates can then be compared to death rates in the gen-eral or non-diabetic population.
Mortality
Estimates of mortality can be presented either as sim-ple, descriptive measures of absolute mortality derived from numbers of deaths divided by numbers of people within a population or as comparative measures based on comparisons with different populations. Compari-sons of mortality between populations and descriptions of a single measure of mortality among people with diabetes relative to those without diabetes can be mis-leading. Differing patterns of other factors including age, sex and type of diabetes can make valid comparisons across populations difficult. Approaches to adjusting for age when making comparisons between or within pop-ulations include direct standardisation (often used when comparing absolute mortality rates), indirect standard-isation (used when estimating ratios of mortality) and statistical approaches such as regression modelling (used when estimating relative risks, odds ratios and hazard ratios). Further explanation of these approaches is provided in the following sections.
Descriptive measures of mortality
Number of deaths attributable to diabetes globally have been estimated by combining several sources of information. In 2019, 4.2 million deaths among 20–79 year-old adults were estimated to be attributable to diabetes.1
Proportionate mortality is defined as the proportion of all deaths that are attributed to a specific cause, with diabetes having been estimated to contribute to 11.3% of deaths in the world. The proportion ranges from 6.8% in IDF’s Africa region to 16.2% in the Middle East and North Africa (MENA) region.1
Case fatality is defined as the proportion of people with a specified condition who die over a given time period. For example, a Chinese study reported that the case-fa-tality was 7.3% among 1,102 people with diabetes in an
average of 16 days follow-up, after confirmed COVID-19 infection.2
Mortality rates for a specified period of time are gen-erated by dividing the number of deaths attributed to diabetes by the number of people with diabetes, or by the total number of people in the population. Compar-isons within and between populations should ideally be based on the former (with number of people with dia-betes as the denominator), because the latter approach reflects a combination of diabetes prevalence and mor-tality. Mortality rates are often stratified by sex and are age-standardised, as age and sex are important poten-tial confounders of the associations between diabetes and mortality. If intending to make comparisons, the direct method of age standardisation involves calculat-ing a weighted average of age-specific death rates with weights depending on the age structure of a chosen standard population (see chapter 4 and appendix 2 for further details).
Comparative measures of mortality
Comparisons of death rates for people with and without diabetes in a population or cohort may be obtained in a number of ways:
1� Subtracting absolute death rates (rather than absolute numbers) of people without diabetes (for example 1,125 per 100,000 people in Sweden in 2013), from those of people with diabetes (1,432 per 100,000 people in Sweden, 2013) to obtain estimates of the excess mortality rate (307 per 100,000 people in Sweden, 2013); see https://link.springer.com/article/10.1007/s00125-016-3971-y/tables/4).
2� Dividing death rates among people with diabetes by the rates among those without it in the population of interest to generate estimates of rate ratios (or relative risks), odds ratios or hazard ratios. Regression models are often used to adjust these ratios for confounding factors such as age, sex and socioeconomic factors. Further information about specific types of regression models is given in appendix 3.
3� Poisson regression is used if follow-up data for a cohort can be summarised in the form of numbers of deaths and person-years-at-risk (that is the sum of years of follow-up from the start of the study to the earliest instance of death, emigration, loss to follow-up or end of follow-up) in sub-groups
IDF guide for diabetes epidemiology studies 34
defined by all combinations of age-group, sex, diabetes status and other possible confounding variables. The variable representing diabetes status must be included in the model, which gives an estimate of the rate ratio (with confidence intervals) that may be adjusted for confounding variables by adding them to the model. However, Poisson regression is not available in all statistical packages and may require specialist software.
4� Logistic regression is used if individual data are available for each person in the cohort and the length of potential follow-up for each person is approximately the same. In addition to diabetes status and any confounding variables, a variable representing outcome (i.e. whether or not the person died) is required. The most natural summary is the odds ratio, defined as the odds of death for those in the cohort with diabetes relative to the odds of death in those without diabetes. Again, confidence intervals are provided and adjustment of the odds ratio for confounders is possible by including them in the model.
5� Cox’s proportional hazards model is more flexible than logistic regression and is preferred if the length of follow-up varies markedly in the cohort. Data are presented as a survival time, defined either as the time to the earliest instance of death, emigration, loss to follow-up or end of follow-up. Additionally, an outcome variable is required depending on whether the person had died or not. In the latter case, their survival time is said to be ‘censored’. The hazard rate represents the instantaneous risk of death for a person and can vary as a function of time. The model results are summarised as hazard ratios, representing the risk of death in those in the cohort with diabetes relative to those without diabetes. Again, confidence intervals are provided and adjustment for relevant confounders is possible by including them in the model. Initial graphical analysis using Kaplan-Meier survival plots is recommended to help assess the proportional hazards assumption.
6� Dividing death rates in a cohort of people with diabetes by those for the whole population to obtain mortality ratios. Indirect standardisation may be used to adjust for differences in the distribution of age (and sometimes sex and other factors) to generate a standardised mortality ratio (SMR). This method requires population death rates in specific age-groups, which are often published by national statistical offices. The number of person-years of
follow-up of people in the cohort in each age-group is first calculated. The relevant population age-specific death rate is then multiplied by the person-years in each age-group to estimate the number of deaths expected. These expected deaths are summed over all age-groups to give a total number of expected deaths (E). This value is divided into the total number of observed deaths in the cohort (O) to give the SMR as O/E. Traditionally, the figure is multiplied by 100 and presented without decimal places. So an SMR of 340 shows that the number of deaths in the diabetes cohort was 3.4 times the number of deaths expected if the age-specific death rates observed in the general population had occurred in the cohort. If the cohort follow-up extends over a lengthy period during which population mortality rates change markedly, then population death rates in suitable sub-periods should be used to calculate the expected deaths. Confidence intervals for SMRs are generally calculated by treating the number of observed deaths (O) as a Poisson count. Special tables or computer algorithms provide confidence intervals for O which are then divided by E to give the confidence interval for the SMR. Sampling error in the numbers of expected deaths (E) is ignored. However, this approach may underestimate the impact of diabetes, because the mortality of people with diabetes forms part of whole population mortality rate. This underestimation will be negligible in populations with a low prevalence of diabetes, but will be particularly marked in populations with a high prevalence.
Comparisons of proportionate mortality between pop-ulations can be made using proportional mortality ratios (PMR). For example, the PMR for the MENA versus the Africa regions is the proportion of deaths attributed to diabetes in MENA divided by the proportion of deaths attributed to diabetes in Africa (i.e. 16.2/6.8 = 2.38). As routinely published cause-specific mortality rates gen-erally understate the impact of diabetes, using them to calculate PMR is not recommended. The PMR is often used in occupational epidemiology but has not been widely used in diabetes epidemiology.
SMRs of diabetes mortality tend to be higher for type 1 than type 2 diabetes (T2D), for younger rather than older people and for girls/women than boys/men. A 2015 systematic review and meta-analysis of 26 stud-ies including 15,273 deaths among 214,114 individuals reported that the pooled SMR (95% confidence interval) for all-cause mortality in people with type 1 diabetes (T1D), compared with people without T1D, was 5.80
IDF guide for diabetes epidemiology studies 35
(95% CI, 4.89–6.89) in women and 3.80 (3.42–4.23) in men.2 A 2019 systematic review and meta-analysis of 35 prospective cohort studies of 2,314,292 people, among whom there were 254,038 deaths, reported that pooled hazard ratios for all-cause mortality for people with T2D, relative to comparison populations, was 2.33 (95% CI, 2.02–2.69) in women and 1.91 (95% CI, 1.72–2.12) in men.3 Most of these data come from high-income countries and it is not clear whether it is appropriate to extrapolate the results to lower-income countries.
Measures of survival
Although survival is commonly used to describe can-cer outcomes, often as proportions of people that are alive at specific time-points, such as 5 or 10 years after diagnosis, it is rarely used to describe outcomes of dia-betes. In Sweden, age-adjusted 10-year survival among people with diabetes increased between 1980–1984 and 1995–1999 from 41.4% to 51.5% in men, and from 43.7% to 61.0% in women.4 It is estimated that survival following diagnosis of T1D may be less than a year in settings in which insulin is not reliably available.5
Life expectancy, years of life lost and disability-adjusted life-years
Life expectancy provides a measure of the average number of years a person is expected to live. It is usually calculated from cohort data or from period life tables that provide the probability of dying before the next birthday for each year of age. Cohort life expectancy is estimated using both historical (fixed) and estimated future mortality, and period life expectancy is estimated using historical (fixed) mortality rates alone. Cohort life expectancy tends to be longer than period life expec-tancy, as it takes into account changes in life expectancy over time, and this typically increases.
Years of life lost is a useful and easily understood metric of the effect of an increased mortality risk, and is cal-culated by comparing life expectancy in people with diabetes to that of people without diabetes. It can be estimated from birth or from a specified age, such as 65 years (see reading list for further details).
Disability-adjusted life-years (DALYs) can be estimated by combining quality of life measures and life expec-tancy estimates, and is the approach used by Global Burden of Disease studies. Different disability weights are applied depending on whether or not complications of diabetes are present.
References
1� Saeedi P, Salpea P, Karuranga S, et al. Mortality attributable to diabetes in 20–79 years old adults, 2019 estimates: Results from the International Diabetes Federation Diabetes Atlas, 9th edition. Diabetes Res Clin Pract. 2020;162:108086. doi:10.1016/j.diabres.2020.108086.
2� Chinese Center for Disease Control and Prevention. The Epidemiological Characteristics of an Outbreak of 2019 Novel Coronavirus Diseases (COVID-19)
— China, 2020. CCDC Weekly. 2(8). http://weekly.chinacdc.cn/en/article/id/e53946e2-c6c4-41e9-9a9b-fea8db1a8f51. Accessed October 16, 2020.
3� Huxley RR, Peters SA, Mishra GD, et al. Risk of all-cause mortality and vascular events in women versus men with type 1 diabetes: a systematic review and meta-analysis. Lancet Diabetes Endocrinol. 2015;3(3):198–206. doi:10.1016/S2213-8587(14)70248-7.
4� Xu G, You D, Wong L, et al. Risk of all-cause and CHD mortality in women versus men with type 2 diabetes: a systematic review and meta-analysis. Eur J Endocrinol. 2019;180(4):243–255. doi:10.1530/EJE-18-0792.
5� Eliasson M, Talbäck M, Rosén M. Improved survival in both men and women with diabetes between 1980 and 2004--a cohort study in Sweden. Cardiovasc Diabetol. 2008;7:32. Published 2008 Oct 20. doi:10.1186/1475-2840-7-32.
Recommended reading
Centers for Disease Control and Prevention. Mortality frequency measures in Principles of Epidemiology. https://www.cdc.gov/csels/dsepd/ss1978/lesson3/section3.html. Accessed October 16, 2020.
IDF guide for diabetes epidemiology studies 36
Livingstone SJ, Levin D, Looker HC, et al. Estimated life expectancy in a Scottish cohort with type 1 diabetes, 2008–2010. JAMA. 2015:313:37–44. doi:10.1001/jama.2014.16425.
Naing NN. Easy way to learn standardization : direct and indirect methods. Malays J Med Sci. 2000 Jan;7(1):10–5. PMID: 22844209; PMCID: PMC3406211.
Osei K, Schuster DP, Amoah AG, et al. Pathogenesis of type 1 and type 2 diabetes mellitus in sub-Saharan Africa: implications for transitional populations. J Cardiovasc Risk. 2003 Apr;10(2):85–96. doi:10.1177/174182670301000203.
IDF guide for diabetes epidemiology studies 37
Chapter 7
Diabetes registries and their role in diabetes epidemiology
Key points
y A diabetes registry is a systematic collection or collation of data for a population
y A registry can be used for a variety of purposes, including supporting direct clinical care, for clinical audit, to inform policy and for research
y A key challenge relating to registries is the considerable resources that are required to set them up and maintain high-quality data
Sarah Wild, Abdul Basit, Jonathan Shaw, Asher Fawwad, with acknowledgement of Rhys Williams’ and Simon O’Neill’s contributions to early drafts
This chapter provides practical guidance on estab-lishing and maintaining population and clinic-based registries of people living with diabetes. It also includes options for collating other health data and how to val-idate, present and interpret data from these sources. More detailed information is available from Regis-tries for Evaluating Patient Outcomes: A User’s Guide,1 published by the US Agency for Healthcare Research and Quality.
Definitions and nomenclature
Registries and registers
In the 4th edition of his Dictionary of Epidemiology, Dr John M. Last defines ‘register’ and ‘registry’ as follows:
In epidemiology the term register is applied to the file of data concerning all cases of a particular disease or other health-relevant condition in a defined population such that
the cases can be related to a population base. With this information, incidence rates can be calculated. If the cases are regu-larly followed up, information on remission, exacerbation, prevalence and survival can also be obtained. The register is the actual document, and the registry is the system of ongoing registration.
Many types of register(s) … are not pop-ulation based … Clinic based registers [i.e. those which are not population based] can be used as a source of cases for case-con-trol studies.
Despite these definitions, there is often no distinction made between the use of the terms register and reg-istry. The key factor in classifying these data sources is whether the data collected are:
1� Population-based, in which case a high proportion of all cases can be expected to be identified, and a
IDF guide for diabetes epidemiology studies 38
reasonable estimate of the size of the background population is available
2� Clinic-based, in which case those listed on the register may be only a minority of all cases, and the size of the background population is much less certain
The term ‘registry’ is used for the remainder of this chapter.
Types of registry
Databases may either be established as dedicated disease registries or assembled by extracting adminis-trative and clinical information from other sources. In the latter case, the data sources are often electronic health records such as pharmacy records, laboratory test results and hospital admission data. Some regis-tries allow registrants to contribute data themselves, for example on patient-reported outcome measures, blood glucose, blood pressure and weight. A range of common methodological considerations apply to both types of databases, with some issues only applicable to one or the other.
Planning a registry
The principles of a diabetes registry
The principles applied to rare disease registries described in the EURORDIS-NORD-CORD Joint declaration2 pro-vide a helpful structure for disease registries in general, including registries for diabetes:
1� That establishing registries should be recognised as a global priority
2� That they should encompass the widest geographical scope possible
3� That they should be centred on a disease or group of diseases rather than a therapeutic intervention
4� Registries for different diseases should be designed so that they can be linked, and similar definitions of common variables used in multiple registries should be used
5� A minimum set of common data elements and variable definitions should be consistently used
6� That the data should be linked with corresponding biological data
7� That they should include data directly reported by patients along with data reported by healthcare professionals
8� Public-private partnerships should be encouraged to ensure sustainability
9� Patients should be equally involved with other stakeholders in the governance of these registries
10� Registries should serve as key instruments for building and empowering patient communities
The most important principles when setting up a registry are to create a multidisciplinary registry team; to agree a core minimum dataset; and to ensure that sufficient resources are available to maintain the registry.
Defining the registry’s purpose
If one of the purposes of the registry is to estimate incidence or prevalence, it should be designed so that almost all cases in a defined population can be expected to be included. This would generally exclude hospitals as the primary source, unless almost everyone with the condition attends hospital on a regular basis (for example children with type 1 diabetes (T1D) in some countries). There must also be an effective way of iden-tifying people who have died or have emigrated from the defined population. If the registry is not popula-tion-based, it cannot be used for estimating incidence or prevalence, but may provide the basis for estimates, and can be used as a source of information for health service planning or evaluation and as a source of partic-ipants for involvement in research.
Ideally, the registry should serve multiple purposes, for example:
y identifying people for call and recall to screening examinations or clinical reviews
y monitoring quality of care y producing epidemiological information
Multi-purpose registries will maximise efficiency and value for money.
The need to collect accurate data for clinical purposes will enhance the quality of the epidemiological infor-mation. This is important since clinicians involved in the care of the individual patient are motivated by goals which differ from those of public health practitioners and epidemiologists.
Identifying the registry team
As a minimum, the registry team should include:
IDF guide for diabetes epidemiology studies 39
y people living with diabetes and, particularly in the case of children and young people, their caregivers
y healthcare professionals involved in the care of individual patients
y public health practitioners and epidemiologists y a range of experts in data governance; database
construction, maintenance and linkage; and data management and analysis
Assessing feasibility
A key element in assessing feasibility is the source, availability and sustainability of human and financial resources. The following should be kept in mind:
Scale� A limited registry with accurate data is far supe-rior to an extensive collection of data of variable quality.
Sustainability� Piloting a registry with a limited number of key variables in a small geographical area will help to identify challenges and solutions prior to attempting wider implementation. A smaller registry that is sustain-able can expand its variables and coverage if and when more resources become available.
Commitment� The key stakeholders listed above will only have long-term commitment to the project if they see themselves and the people they care for (individuals or populations) getting a tangible return on their involve-ment. This may take the form of improved processes and outcomes of healthcare for individual patients, or useful and timely epidemiological information.
Establishing a governance and oversight plan
Establishing governance and oversight is crucial in terms of giving the registry credibility with the professionals concerned, as well as with patients and carers. There are several aspects to this:
Transparency� Nothing in the establishment or use of the registry should be hidden from sight.
However, there must be:
Appropriate levels of confidentiality� Access to per-sonally identifiable data should be limited to the person living with diabetes and healthcare professionals with responsibility for individual patient care. Data analysts and researchers need only have access to anonymised or pseudonymised individual-level data, and other
interested parties may only need to see aggregated data. Pseudonymisation (where a copy of identifia-ble information linked to unique identifiers is retained in the healthcare system or by a trusted third party) is preferable to full anonymisation (when all identifiable information is removed and destroyed) where linkage to other data sources is planned and feasible. Where small numbers of cases exist (for example for rare forms of diabetes or small geographic areas) a decision needs to be made as to the minimum number of individuals who can be reported on. This is to avoid the risk of iso-lated individuals in smaller areas and populations being identified. Some agencies may have already devel-oped statistical disclosure protocols, and local advice should be sought about current recommendations. For example, the approach used by the health service in Scotland is available from https://www.isdscotland.org/About-ISD/Confidentiality/disclosure_protocol_v3.pdf.
Security of data� The only people with right of access to data are those deemed from the outset to have a legitimate right to access and, as noted above, there are likely to be different approaches for access to identi-fiable and de-identified data. If the registry data are to be made available on request, processes need to be set up to assess applications for access and to ensure that appropriate data governance arrangements are in place. It is also necessary to address matters such as compli-ance with the General Data Protection Regulation within the European Union and European Economic Area (see https://gdpr-info.eu/).
Backup of data is essential to safeguard against losses resulting from technical problems. Backups should be frequent – daily if possible, but at least weekly – and should be automatic. Backup files should be located in different buildings (preferably in different locations) from the primary source to protect against the rare but devastating possibility of a natural or other disaster lead-ing to the loss of data.
Data governance and consent� Rules for creating reg-istries, such as the need for individual-level consent, differ between settings and appropriate local advice should be sought. This should include whether ethical approval is required for the use of individual-level data for research, even if they are pseudonymised.
As a general principle, oversight of data governance and consent should be the responsibility of a group that is not directly concerned with the day-to-day running of the registry. This oversight group may also function as the gatekeeper for assessing the legitimacy of data access requests.
IDF guide for diabetes epidemiology studies 40
Defining the core dataset
The extent of the core dataset will principally depend on the purpose of the registry and the resources available. There will be a range of basic demographic, anthro-pometric and clinical components, which will take the form of categorical or continuous variables. Examples of categorical variables include sex and type of diabe-tes. Continuous variables include height, weight, blood pressure, HbA1c, date of diagnosis of diabetes, and date of insulin commencement. Although methods now exist for the analysis of free-text data (Natural Language Processing (NLP) using MedGATE, for example) which may be useful for recording the less tangible aspects of diabetes, such as patient satisfaction, such data should not form part of a core dataset.
Although type of diabetes may appear to be a straight-forward clinical assessment, this is often not the case, and good-quality registries collect information that allows analysts to refine the clinical diabetes type. At a minimum, this information includes the following:
y age of diabetes onset y time from diagnosis to initiation of treatment derived
from date of birth, date of diagnosis of diabetes and date of first prescription of insulin or oral medication
Other useful information to assist with the assignment of diabetes type includes the results of antibody testing; body mass index; and use of non-insulin therapies.
Population-based registries can either collect data continuously, or be linked to other data sources fol-lowing registration of diabetes status. While the former is clearly the ideal, the latter can have significant util-ity. For example, an Australian diabetes registry is based on a one-time registration of people with diabetes to a government scheme to support diabetes. While the information collected is not very detailed, this adminis-trative database covers 80–90% of those with diabetes, and through linkage to other databases (e.g. mortality, prescriptions, dialysis registry) can provide important information on incidence, prevalence, mortality, and risks of complications.
A basic principle to bear in mind is to use existing infor-mation in electronic health records as far as possible in order to minimise the burden of data collection. It is therefore important to identify existing data sources and processes for using existing data at an early stage of registry planning.
Implementing the registry
Essential elements of the development of a registry are:
1� The means of case identification2� The methods of data collection and verification3� The methods of validation, particularly of
completeness of coverage
Where feasible, approaches to both case identifi-cation and validation should use multiple sources of data, such as primary care, secondary care and pre-scribing records. Capture-recapture methods can be used to combine different sources of data that do not include all individuals within a population in order to provide estimates of diabetes prevalence, as discussed in chapter 5.
The methods for collecting and recording data on each identified individual should, ideally, be under-taken in routine clinical care where this is feasible. Where possible, the data should then be imported from electronic health records. If this is not possible, then manual data entry will be required, either from electronic or paper records. Periodic verification of the accuracy of data entry should be considered, for example by sample double-entering of data by inde-pendent users.
The scope of the registry should be clearly defined from the outset to ensure resources are used efficiently and to determine the human and financial costs of setting it up and maintaining it. It is helpful to specify levels of data with only the most essential items included in the initial pilot stages. There may then be a next level of more detailed data and, if resources permit, an ‘ideal’ dataset. Clearly a balance has to be struck between the costs and benefits of collecting complete and accu-rate data covering a small number of variables, and attempting to collect information on potential con-founding variables that may not be well recorded in routine healthcare.
Identification of individuals who leave the defined pop-ulation or have died is frequently the most challenging aspect of ongoing data collection. Indeed, if there is uncertainty about the ability to accurately identify everyone who has died, many potential uses of a reg-istry can be invalidated. In some settings reliable data on deaths can be obtained from linkage to routine mortality records. Notification of deaths of people on the registry based on information available from other
IDF guide for diabetes epidemiology studies 41
sources, such as clinics, may however be the only option in some settings.
Notification of emigration from the registry area is much more challenging in most settings, and can lead to mis-leading data for particularly mobile populations, such as young adults. Regular direct contact with the registered individuals, and/or with people nominated by them as contacts (if consent for further contact was collected at the point of registration) may be another option to help maintain an accurate registry. However, seeking con-sent for inclusion in a registry or seeking permission to contact those who have been included may reduce the level of compliance, resulting in less complete ascer-tainment than if consent is not required. As mentioned above, the requirement to seek consent before inclu-sion in a registry (and the effect of this on participation) is likely to differ between countries.
Validation of completeness of registries
A variety of approaches can be used to assess how com-plete and accurate a registry is. The method selected will depend on the setting, as well as other factors such as how diagnoses of diabetes are coded in elec-tronic health records, along with the resources available. Options include the review by independent inspectors of a sample of data against other sources, and popu-lation-level comparisons against records of diabetes diagnoses from hospital inpatient records and diabe-tes medication from prescribing records. Reports from registries should describe approaches to data quality assurance. Appendix 3 includes examples from Regis-tries for Evaluating Patient Outcomes: A User’s Guide (see below for reference), and two examples of disease registries in different settings are also included, one from Pakistan and one from England and Wales.
Recommended reading
EURORDIS. EURORDIS-NORD-CORD: Joint declaration 10 Key Principles of Rare Disease Registries. https://www.eurordis.org/content/eurordis-nord-cord-release-joint-declaration-10-key-principles-rare-disease-patient-registries. Accessed October 4, 2020.
Gliklich RE, Leavy MB, Dreyer NA, editors. Registries for Evaluating Patient Outcomes: A User’s Guide. Agency for Healthcare Research and Quality (AHRQ); 2020 Sep 21; doi:10.23970/ahrqepcregistries4.
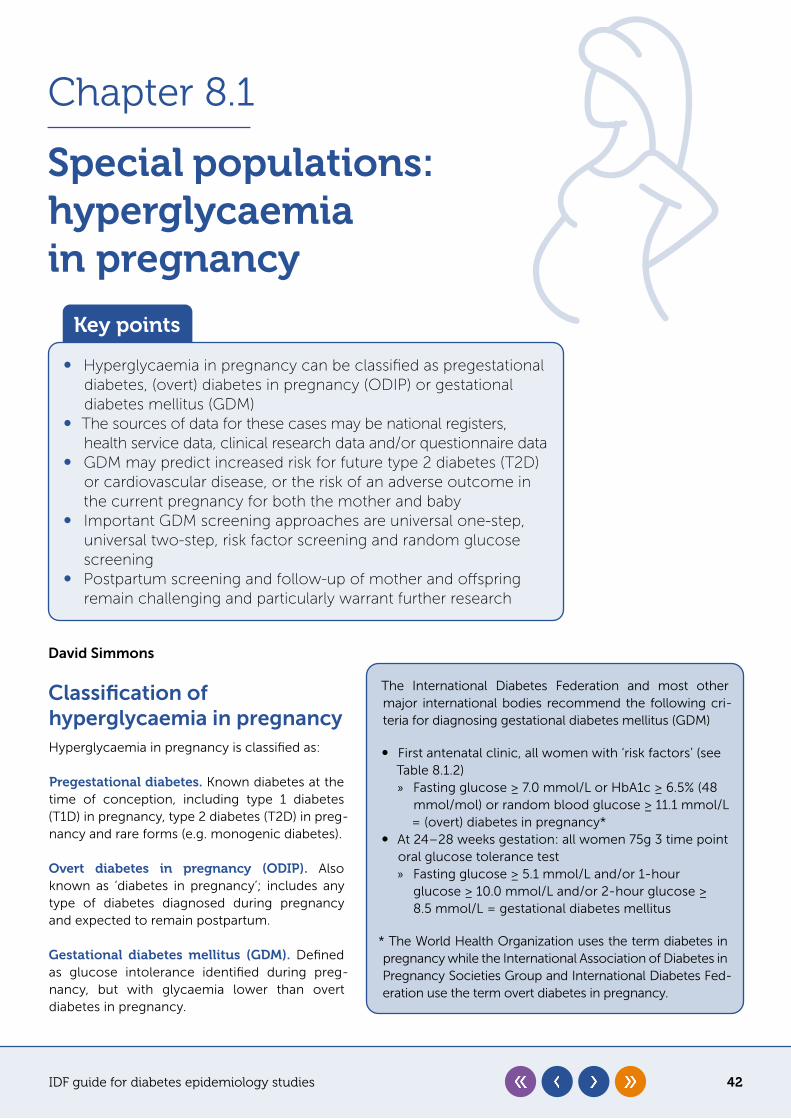
IDF guide for diabetes epidemiology studies 42
Chapter 8�1
Special populations: hyperglycaemia in pregnancy
Key points
y Hyperglycaemia in pregnancy can be classified as pregestational diabetes, (overt) diabetes in pregnancy (ODIP) or gestational diabetes mellitus (GDM)
y The sources of data for these cases may be national registers, health service data, clinical research data and/or questionnaire data
y GDM may predict increased risk for future type 2 diabetes (T2D) or cardiovascular disease, or the risk of an adverse outcome in the current pregnancy for both the mother and baby
y Important GDM screening approaches are universal one-step, universal two-step, risk factor screening and random glucose screening
y Postpartum screening and follow-up of mother and offspring remain challenging and particularly warrant further research
David Simmons
Classification of hyperglycaemia in pregnancyHyperglycaemia in pregnancy is classified as:
Pregestational diabetes� Known diabetes at the time of conception, including type 1 diabetes (T1D) in pregnancy, type 2 diabetes (T2D) in preg-nancy and rare forms (e.g. monogenic diabetes).
Overt diabetes in pregnancy (ODIP)� Also known as ‘diabetes in pregnancy’; includes any type of diabetes diagnosed during pregnancy and expected to remain postpartum.
Gestational diabetes mellitus (GDM)� Defined as glucose intolerance identified during preg-nancy, but with glycaemia lower than overt diabetes in pregnancy.
The International Diabetes Federation and most other major international bodies recommend the following cri-teria for diagnosing gestational diabetes mellitus (GDM)
y First antenatal clinic, all women with ‘risk factors’ (see Table 8.1.2) » Fasting glucose ≥ 7.0 mmol/L or HbA1c ≥ 6.5% (48
mmol/mol) or random blood glucose ≥ 11.1 mmol/L = (overt) diabetes in pregnancy*
y At 24–28 weeks gestation: all women 75g 3 time point oral glucose tolerance test » Fasting glucose ≥ 5.1 mmol/L and/or 1-hour
glucose ≥ 10.0 mmol/L and/or 2-hour glucose ≥ 8.5 mmol/L = gestational diabetes mellitus
* The World Health Organization uses the term diabetes in pregnancy while the International Association of Diabetes in Pregnancy Societies Group and International Diabetes Fed-eration use the term overt diabetes in pregnancy.
IDF guide for diabetes epidemiology studies 43
Table 8.1.1. Sources of hyperglycaemia in pregnancy data
Source Comment
National registers Detailed data at an individual level. They may not include details of the criteria used to ascertain hyperglycaemia in pregnancy. GDM screening processes and criteria can vary within a country. There can be validity issues over the coding for the type of pregestational diabetes, and with differentiation between ODIP and GDM. Data can be missing or contain inaccuracies based on errors and precision.
Health service data
Hospital/clinic data
Detailed data at an individual level. Obtained by individual chart review and may include validation of the diagnosis by a clinician. GDM screening processes and criteria are usually consistent within a hospital/clinic, but this is not always the case. Data can be missing or contain inaccuracies based on errors and precision.
Clinical research data
Detailed data at an individual level. Dependent on the process for recruitment into the clinical research. GDM screening processes and criteria should be consistent. Missing data and errors in accuracy and precision should be limited. There can be substantial sampling bias.
Questionnaire dataData at an individual level, but women may not be aware of the criteria used. Dependent on the recruitment process, there can be substantial sampling bias.
GDM=gestational diabetes mellitus
Data sources
Generally speaking, epidemiological studies of hypergly-caemia in pregnancy involve the use of administrative or clinical data rather than research-focused oral glucose tol-erance tests, as these tests are considered part of clinical care. Those with pregestational diabetes may undertake additional clinical or laboratory tests, or complete a ques-tionnaire as part of a standard study, as covered in other chapters. Changes in practice or policy in screening and diagnostic approaches to GDM, either as part of local or national policy, provide an opportunity to compare prev-alence, risk factors and outcomes before and after the change, although denominator and numerator data will usually still come from administrative or clinical sources.
The denominator for calculating GDM prevalenceThe denominator used is the total number of women with a pregnancy over the same time period in the same cohort as the women with hyperglycaemia in pregnancy. This includes women with miscarriages and termination of pregnancy, data for whom can be difficult to obtain as they may be recorded in a different source to com-pleted pregnancies. Generally, the number of completed pregnancies (including stillbirths) can be obtained for a given facility (e.g. hospital) or geographical area (e.g. dis-trict, region, state, country) through government sources. However, births in the private sector might initially be excluded from government data and may reflect a differ-ent sub-population (e.g. with a different socioeconomic status, and hence potentially with different characteris-tics, prevalence and outcomes).
Twin and multiple pregnancies: same maternal denominator – different numbers of babies
While the denominator for the different types of hyper-glycaemia in pregnancy is the total number of women with a pregnancy, more than one baby may be born from a given pregnancy. Twin, triplet and other mul-tiple births therefore create a different denominator for the babies involved. However, multiple pregnan-cies are themselves associated with a greater risk of adverse pregnancy outcome and the risk to the babies involved are not independent from each other. For this reason, while the denominator for prevalence and inci-dence studies includes all pregnant women, studies of pregnancy outcomes will usually analyse neonatal out-comes from multiple pregnancies separately.
Numerator sources and impact of pre-analytical error
The number of women with hyperglycaemia in preg-nancy, and the type of hyperglycaemia in pregnancy, can be obtained from a variety of sources with different degrees of validity, as per table 8.1.1. All glucose-based tests (e.g. oral glucose tolerance tests or OGTTs) are open to pre-analytical error through delays between sampling and analysis. The use of fluoride as a pre-servative does not inhibit glycolysis for 30–60 minutes. Citrate also inhibits glycolysis but is associated with an increase in measured glucose. This is particularly rel-evant in the diagnosis of GDM, where differences in measured fasting glucose as small as 0.1 mmol/L can increase or decrease prevalence substantially.
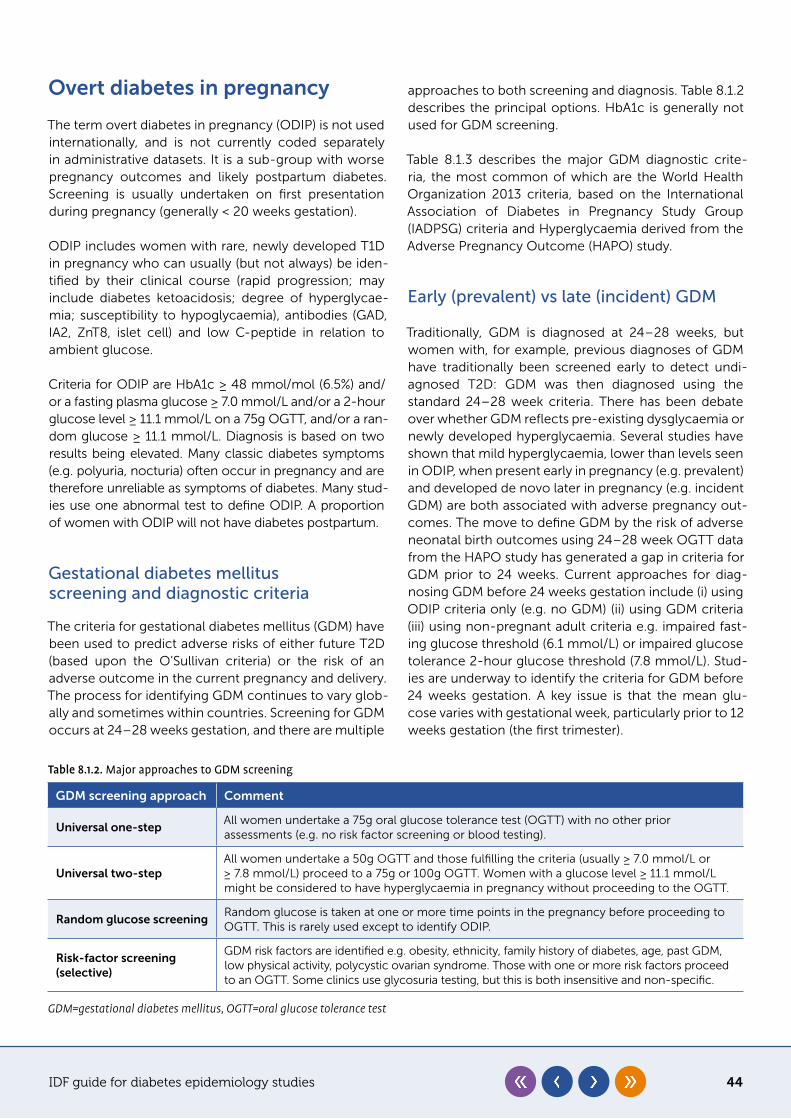
IDF guide for diabetes epidemiology studies 44
Table 8.1.2. Major approaches to GDM screening
GDM screening approach Comment
Universal one-step All women undertake a 75g oral glucose tolerance test (OGTT) with no other prior assessments (e.g. no risk factor screening or blood testing).
Universal two-stepAll women undertake a 50g OGTT and those fulfilling the criteria (usually ≥ 7.0 mmol/L or ≥ 7.8 mmol/L) proceed to a 75g or 100g OGTT. Women with a glucose level ≥ 11.1 mmol/L might be considered to have hyperglycaemia in pregnancy without proceeding to the OGTT.
Random glucose screeningRandom glucose is taken at one or more time points in the pregnancy before proceeding to OGTT. This is rarely used except to identify ODIP.
Risk-factor screening (selective)
GDM risk factors are identified e.g. obesity, ethnicity, family history of diabetes, age, past GDM, low physical activity, polycystic ovarian syndrome. Those with one or more risk factors proceed to an OGTT. Some clinics use glycosuria testing, but this is both insensitive and non-specific.
GDM=gestational diabetes mellitus, OGTT=oral glucose tolerance test
Overt diabetes in pregnancy
The term overt diabetes in pregnancy (ODIP) is not used internationally, and is not currently coded separately in administrative datasets. It is a sub-group with worse pregnancy outcomes and likely postpartum diabetes. Screening is usually undertaken on first presentation during pregnancy (generally < 20 weeks gestation).
ODIP includes women with rare, newly developed T1D in pregnancy who can usually (but not always) be iden-tified by their clinical course (rapid progression; may include diabetes ketoacidosis; degree of hyperglycae-mia; susceptibility to hypoglycaemia), antibodies (GAD, IA2, ZnT8, islet cell) and low C-peptide in relation to ambient glucose.
Criteria for ODIP are HbA1c ≥ 48 mmol/mol (6.5%) and/or a fasting plasma glucose ≥ 7.0 mmol/L and/or a 2-hour glucose level ≥ 11.1 mmol/L on a 75g OGTT, and/or a ran-dom glucose ≥ 11.1 mmol/L. Diagnosis is based on two results being elevated. Many classic diabetes symptoms (e.g. polyuria, nocturia) often occur in pregnancy and are therefore unreliable as symptoms of diabetes. Many stud-ies use one abnormal test to define ODIP. A proportion of women with ODIP will not have diabetes postpartum.
Gestational diabetes mellitus screening and diagnostic criteria
The criteria for gestational diabetes mellitus (GDM) have been used to predict adverse risks of either future T2D (based upon the O’Sullivan criteria) or the risk of an adverse outcome in the current pregnancy and delivery. The process for identifying GDM continues to vary glob-ally and sometimes within countries. Screening for GDM occurs at 24–28 weeks gestation, and there are multiple
approaches to both screening and diagnosis. Table 8.1.2 describes the principal options. HbA1c is generally not used for GDM screening.
Table 8.1.3 describes the major GDM diagnostic crite-ria, the most common of which are the World Health Organization 2013 criteria, based on the International Association of Diabetes in Pregnancy Study Group (IADPSG) criteria and Hyperglycaemia derived from the Adverse Pregnancy Outcome (HAPO) study.
Early (prevalent) vs late (incident) GDM
Traditionally, GDM is diagnosed at 24–28 weeks, but women with, for example, previous diagnoses of GDM have traditionally been screened early to detect undi-agnosed T2D: GDM was then diagnosed using the standard 24–28 week criteria. There has been debate over whether GDM reflects pre-existing dysglycaemia or newly developed hyperglycaemia. Several studies have shown that mild hyperglycaemia, lower than levels seen in ODIP, when present early in pregnancy (e.g. prevalent) and developed de novo later in pregnancy (e.g. incident GDM) are both associated with adverse pregnancy out-comes. The move to define GDM by the risk of adverse neonatal birth outcomes using 24–28 week OGTT data from the HAPO study has generated a gap in criteria for GDM prior to 24 weeks. Current approaches for diag-nosing GDM before 24 weeks gestation include (i) using ODIP criteria only (e.g. no GDM) (ii) using GDM criteria (iii) using non-pregnant adult criteria e.g. impaired fast-ing glucose threshold (6.1 mmol/L) or impaired glucose tolerance 2-hour glucose threshold (7.8 mmol/L). Stud-ies are underway to identify the criteria for GDM before 24 weeks gestation. A key issue is that the mean glu-cose varies with gestational week, particularly prior to 12 weeks gestation (the first trimester).
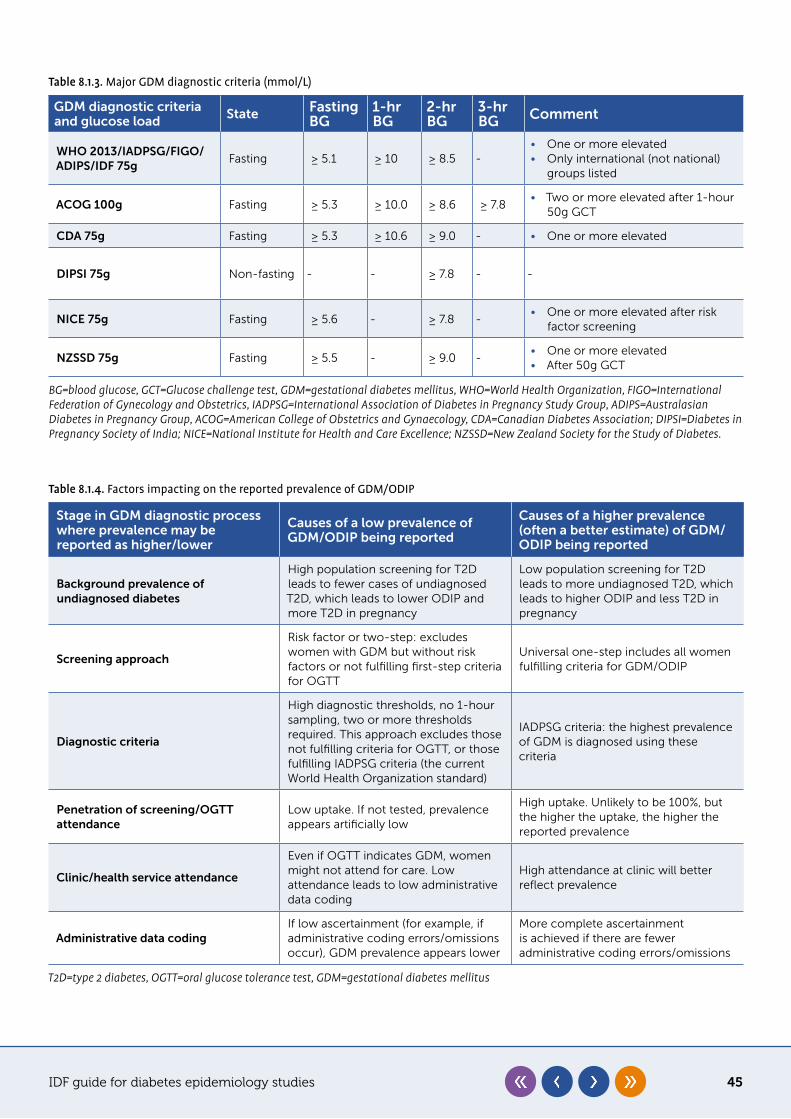
IDF guide for diabetes epidemiology studies 45
Table 8.1.4. Factors impacting on the reported prevalence of GDM/ODIP
Stage in GDM diagnostic process where prevalence may be reported as higher/lower
Causes of a low prevalence of GDM/ODIP being reported
Causes of a higher prevalence (often a better estimate) of GDM/ODIP being reported
Background prevalence of undiagnosed diabetes
High population screening for T2D leads to fewer cases of undiagnosed T2D, which leads to lower ODIP and more T2D in pregnancy
Low population screening for T2D leads to more undiagnosed T2D, which leads to higher ODIP and less T2D in pregnancy
Screening approach
Risk factor or two-step: excludes women with GDM but without risk factors or not fulfilling first-step criteria for OGTT
Universal one-step includes all women fulfilling criteria for GDM/ODIP
Diagnostic criteria
High diagnostic thresholds, no 1-hour sampling, two or more thresholds required. This approach excludes those not fulfilling criteria for OGTT, or those fulfilling IADPSG criteria (the current World Health Organization standard)
IADPSG criteria: the highest prevalence of GDM is diagnosed using these criteria
Penetration of screening/OGTT attendance
Low uptake. If not tested, prevalence appears artificially low
High uptake. Unlikely to be 100%, but the higher the uptake, the higher the reported prevalence
Clinic/health service attendance
Even if OGTT indicates GDM, women might not attend for care. Low attendance leads to low administrative data coding
High attendance at clinic will better reflect prevalence
Administrative data codingIf low ascertainment (for example, if administrative coding errors/omissions occur), GDM prevalence appears lower
More complete ascertainment is achieved if there are fewer administrative coding errors/omissions
T2D=type 2 diabetes, OGTT=oral glucose tolerance test, GDM=gestational diabetes mellitus
Table 8.1.3. Major GDM diagnostic criteria (mmol/L)
GDM diagnostic criteria and glucose load State Fasting
BG1-hr BG
2-hr BG
3-hr BG Comment
WHO 2013/IADPSG/FIGO/ADIPS/IDF 75g
Fasting ≥ 5.1 ≥ 10 ≥ 8.5 -• One or more elevated• Only international (not national)
groups listed
ACOG 100g Fasting ≥ 5.3 ≥ 10.0 ≥ 8.6 ≥ 7.8• Two or more elevated after 1-hour
50g GCT
CDA 75g Fasting ≥ 5.3 ≥ 10.6 ≥ 9.0 - • One or more elevated
DIPSI 75g Non-fasting - - ≥ 7.8 - -
NICE 75g Fasting ≥ 5.6 - ≥ 7.8 -• One or more elevated after risk
factor screening
NZSSD 75g Fasting ≥ 5.5 - ≥ 9.0 -• One or more elevated • After 50g GCT
BG=blood glucose, GCT=Glucose challenge test, GDM=gestational diabetes mellitus, WHO=World Health Organization, FIGO=International Federation of Gynecology and Obstetrics, IADPSG=International Association of Diabetes in Pregnancy Study Group, ADIPS=Australasian Diabetes in Pregnancy Group, ACOG=American College of Obstetrics and Gynaecology, CDA=Canadian Diabetes Association; DIPSI=Diabetes in Pregnancy Society of India; NICE=National Institute for Health and Care Excellence; NZSSD=New Zealand Society for the Study of Diabetes.
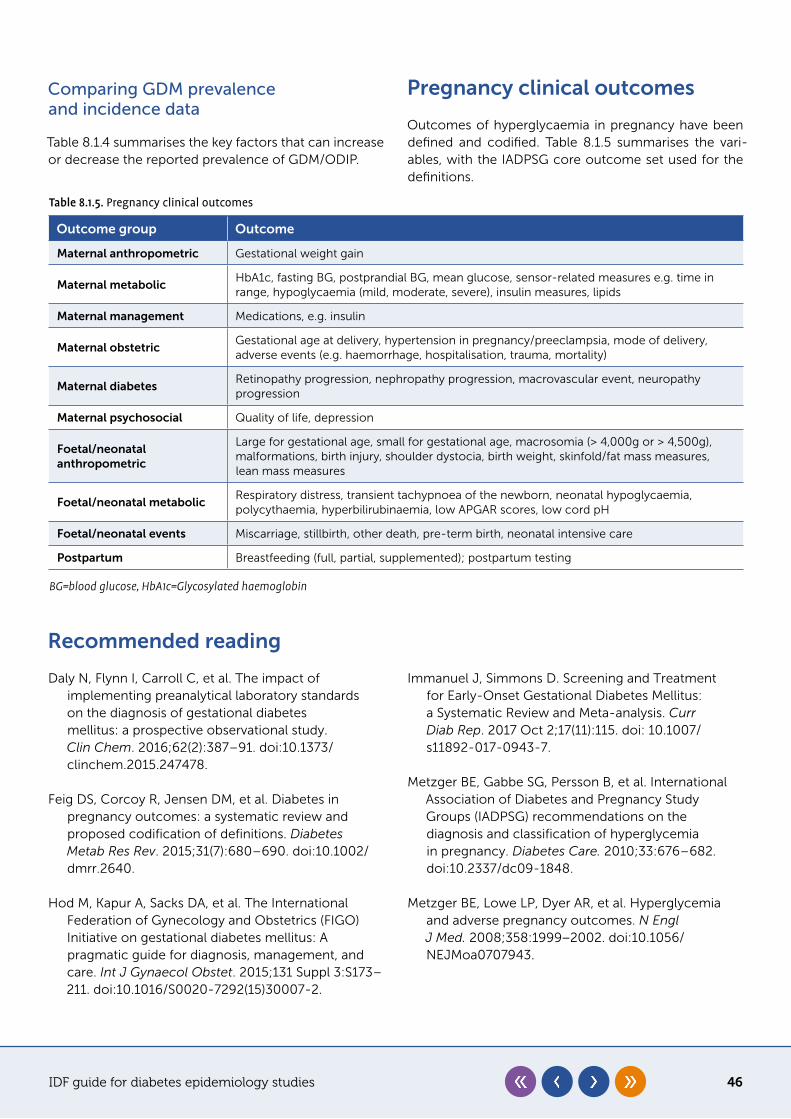
IDF guide for diabetes epidemiology studies 46
Comparing GDM prevalence and incidence data
Table 8.1.4 summarises the key factors that can increase or decrease the reported prevalence of GDM/ODIP.
Pregnancy clinical outcomes
Outcomes of hyperglycaemia in pregnancy have been defined and codified. Table 8.1.5 summarises the vari-ables, with the IADPSG core outcome set used for the definitions.
Table 8.1.5. Pregnancy clinical outcomes
Outcome group Outcome
Maternal anthropometric Gestational weight gain
Maternal metabolicHbA1c, fasting BG, postprandial BG, mean glucose, sensor-related measures e.g. time in range, hypoglycaemia (mild, moderate, severe), insulin measures, lipids
Maternal management Medications, e.g. insulin
Maternal obstetricGestational age at delivery, hypertension in pregnancy/preeclampsia, mode of delivery, adverse events (e.g. haemorrhage, hospitalisation, trauma, mortality)
Maternal diabetesRetinopathy progression, nephropathy progression, macrovascular event, neuropathy progression
Maternal psychosocial Quality of life, depression
Foetal/neonatal anthropometric
Large for gestational age, small for gestational age, macrosomia (> 4,000g or > 4,500g), malformations, birth injury, shoulder dystocia, birth weight, skinfold/fat mass measures, lean mass measures
Foetal/neonatal metabolicRespiratory distress, transient tachypnoea of the newborn, neonatal hypoglycaemia, polycythaemia, hyperbilirubinaemia, low APGAR scores, low cord pH
Foetal/neonatal events Miscarriage, stillbirth, other death, pre-term birth, neonatal intensive care
Postpartum Breastfeeding (full, partial, supplemented); postpartum testing
BG=blood glucose, HbA1c=Glycosylated haemoglobin
Recommended reading
Daly N, Flynn I, Carroll C, et al. The impact of implementing preanalytical laboratory standards on the diagnosis of gestational diabetes mellitus: a prospective observational study. Clin Chem. 2016;62(2):387–91. doi:10.1373/clinchem.2015.247478.
Feig DS, Corcoy R, Jensen DM, et al. Diabetes in pregnancy outcomes: a systematic review and proposed codification of definitions. Diabetes Metab Res Rev. 2015;31(7):680–690. doi:10.1002/dmrr.2640.
Hod M, Kapur A, Sacks DA, et al. The International Federation of Gynecology and Obstetrics (FIGO) Initiative on gestational diabetes mellitus: A pragmatic guide for diagnosis, management, and care. Int J Gynaecol Obstet. 2015;131 Suppl 3:S173–211. doi:10.1016/S0020-7292(15)30007-2.
Immanuel J, Simmons D. Screening and Treatment for Early-Onset Gestational Diabetes Mellitus: a Systematic Review and Meta-analysis. Curr Diab Rep. 2017 Oct 2;17(11):115. doi: 10.1007/s11892-017-0943-7.
Metzger BE, Gabbe SG, Persson B, et al. International Association of Diabetes and Pregnancy Study Groups (IADPSG) recommendations on the diagnosis and classification of hyperglycemia in pregnancy. Diabetes Care. 2010;33:676–682. doi:10.2337/dc09-1848.
Metzger BE, Lowe LP, Dyer AR, et al. Hyperglycemia and adverse pregnancy outcomes. N Engl J Med. 2008;358:1999−2002. doi:10.1056/NEJMoa0707943.
IDF guide for diabetes epidemiology studies 47
Simmons D. Epidemiology of Diabetes in Pregnancy. In: McCance D, Maresh M, eds. Practical management of Diabetes in Pregnancy. 2nd ed. Chichester: Blackwell; 2018: 1–16.
World Health Organization. Diagnostic Criteria and Classification of Hyperglycaemia First Detected in Pregnancy Geneva: World Health Organization; 2013. https://www.who.int/diabetes/publications/Hyperglycaemia_In_Pregnancy/en/. Accessed October 4, 2020.
Yuen L, Saeedi P, Riaz M, et al. Projections of the prevalence of hyperglycaemia in pregnancy in 2019 and beyond: Results from the International Diabetes Federation Diabetes Atlas, 9th edition. Diabetes Res Clin Pract. 2019 Nov;157:107841. doi:10.1016/j.diabres.2019.107841.
IDF guide for diabetes epidemiology studies 48
Chapter 8�2
Special populations: children and adolescents
Key points
y Most countries do not yet have any data on incidence of type 1 diabetes (T1D) among children and adolescents
y Maximisation of case ascertainment is critical y A ‘minimum incidence’ can still provide very useful information
Graham Ogle, Chris Patterson, Jonathan Shaw
Epidemiological studies in children and adolescents should use similar methodologies to those in adult pop-ulations. There are, however, a few specific points to note about this population.
Limited current data
1� Fewer countries have data on type 1 diabetes (T1D) in children and adolescents than on type 2 diabetes (T2D) in adults. In the 2019 edition of the IDF Diabetes Atlas, 94 of 211 countries (45%) had type 1 data, of which 81 (86%) were high-income or upper-middle-income countries. Only three of the 31 low-income countries (10%) had data, resulting, for instance, in data from Rwanda being extrapolated to 29 other countries. Furthermore, much of the Atlas data is relatively old. The most recent year studied was 2010 or earlier in only 53 of 94 countries (56%), and dated to before 2000 in 28 of the countries (30%). The incidence of T1D is rising by 3% or more in many countries, so these older figures are now likely to be marked underestimates (Patterson et al).
2� Far fewer countries have prevalence and mortality data. To accurately determine prevalence, a formal registry is needed with the clinical status (alive, dead, emigrated) recorded for each child or adolescent.
Specific considerations
1� T1D is an uncommon disorder in most countries. Therefore, analyses must be based on a population of sufficient size to include enough cases to yield reliable incidence results that do not have wide confidence intervals.
2� Maximising case ascertainment is critical. Every effort should be made to include all institutions/physicians in the defined study area that see new cases of T1D in young people, with individual centre registries being combined into an accurate register for the area being studied. If part of a proposed study area is close to a major city outside the study region, then that area should be excluded from the study as ascertainment is likely to be incomplete.
3� The gold standard for incidence studies is to have two or more independent but partially overlapping sources of data, so that true incidence can be estimated using the capture-recapture statistical method (see chapter 5 and the UNAIDS reference below for further details). However, multiple ascertainment sources may not be available, particularly in lower-income countries. This should not prevent studies being carried out, but when the results are written up it needs to be stated clearly that the incidence determined is a ‘minimum incidence’.
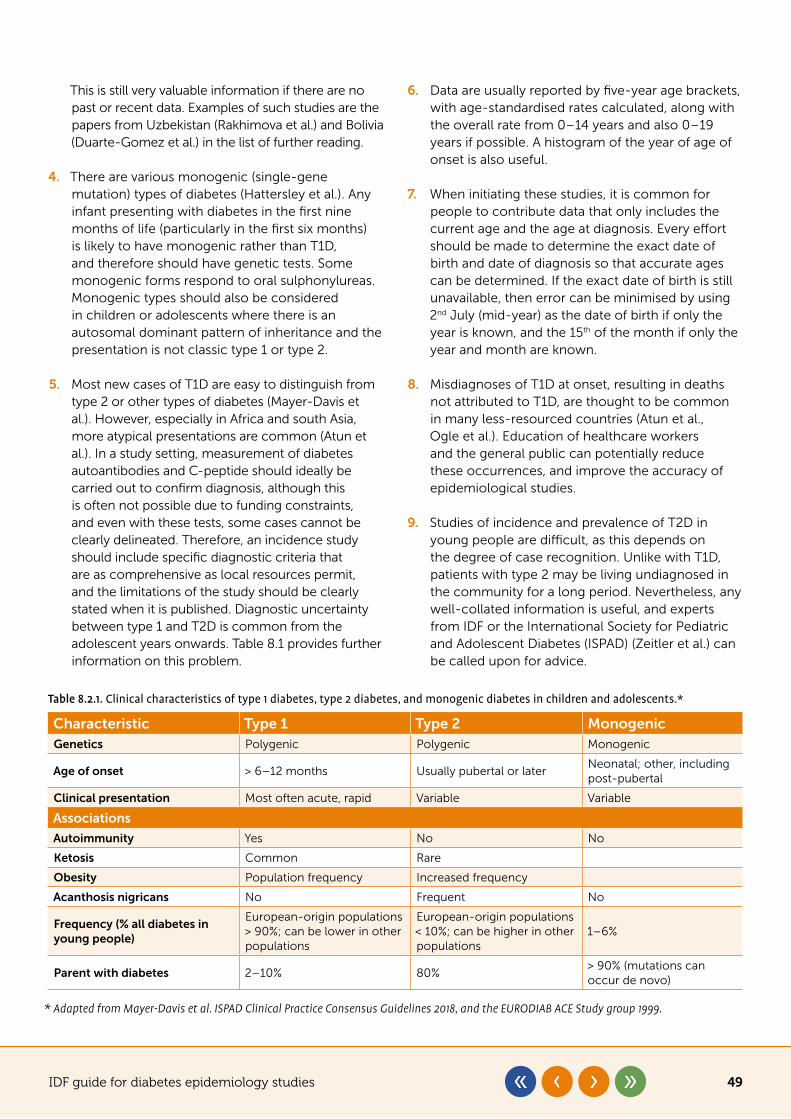
IDF guide for diabetes epidemiology studies 49
This is still very valuable information if there are no past or recent data. Examples of such studies are the papers from Uzbekistan (Rakhimova et al.) and Bolivia (Duarte-Gomez et al.) in the list of further reading.
4� There are various monogenic (single-gene mutation) types of diabetes (Hattersley et al.). Any infant presenting with diabetes in the first nine months of life (particularly in the first six months) is likely to have monogenic rather than T1D, and therefore should have genetic tests. Some monogenic forms respond to oral sulphonylureas. Monogenic types should also be considered in children or adolescents where there is an autosomal dominant pattern of inheritance and the presentation is not classic type 1 or type 2.
5� Most new cases of T1D are easy to distinguish from type 2 or other types of diabetes (Mayer-Davis et al.). However, especially in Africa and south Asia, more atypical presentations are common (Atun et al.). In a study setting, measurement of diabetes autoantibodies and C-peptide should ideally be carried out to confirm diagnosis, although this is often not possible due to funding constraints, and even with these tests, some cases cannot be clearly delineated. Therefore, an incidence study should include specific diagnostic criteria that are as comprehensive as local resources permit, and the limitations of the study should be clearly stated when it is published. Diagnostic uncertainty between type 1 and T2D is common from the adolescent years onwards. Table 8.1 provides further information on this problem.
6� Data are usually reported by five-year age brackets, with age-standardised rates calculated, along with the overall rate from 0–14 years and also 0–19 years if possible. A histogram of the year of age of onset is also useful.
7� When initiating these studies, it is common for people to contribute data that only includes the current age and the age at diagnosis. Every effort should be made to determine the exact date of birth and date of diagnosis so that accurate ages can be determined. If the exact date of birth is still unavailable, then error can be minimised by using 2nd July (mid-year) as the date of birth if only the year is known, and the 15th of the month if only the year and month are known.
8� Misdiagnoses of T1D at onset, resulting in deaths not attributed to T1D, are thought to be common in many less-resourced countries (Atun et al., Ogle et al.). Education of healthcare workers and the general public can potentially reduce these occurrences, and improve the accuracy of epidemiological studies.
9� Studies of incidence and prevalence of T2D in young people are difficult, as this depends on the degree of case recognition. Unlike with T1D, patients with type 2 may be living undiagnosed in the community for a long period. Nevertheless, any well-collated information is useful, and experts from IDF or the International Society for Pediatric and Adolescent Diabetes (ISPAD) (Zeitler et al.) can be called upon for advice.
Table 8.2.1. Clinical characteristics of type 1 diabetes, type 2 diabetes, and monogenic diabetes in children and adolescents.*
Characteristic Type 1 Type 2 MonogenicGenetics Polygenic Polygenic Monogenic
Age of onset > 6–12 months Usually pubertal or laterNeonatal; other, including post-pubertal
Clinical presentation Most often acute, rapid Variable Variable
Associations
Autoimmunity Yes No No
Ketosis Common Rare
Obesity Population frequency Increased frequency
Acanthosis nigricans No Frequent No
Frequency (% all diabetes in young people)
European-origin populations > 90%; can be lower in other populations
European-origin populations < 10%; can be higher in other populations
1–6%
Parent with diabetes 2–10% 80%> 90% (mutations can occur de novo)
* Adapted from Mayer-Davis et al. ISPAD Clinical Practice Consensus Guidelines 2018, and the EURODIAB ACE Study group 1999.
IDF guide for diabetes epidemiology studies 50
Recommended reading
Atun R, Davies JI, Gale EAM, et al. Diabetes in sub-Saharan Africa: from clinical care to health policy. Lancet Diabetes Endocrinol. 2017;5(8):622–667. doi:10.1016/S2213-8587(17)30181-X.
Duarte Gómez E, Gregory GA, Castrati Nostas M, et al. Incidence and mortality rates and clinical characteristics of type 1 diabetes among children and young adults in Cochabamba, Bolivia. J Diabetes Res. 2017;2017:8454757. doi:10.1155/2017/8454757.
EURODIAB ACE Study Group and the EURODIAB ACE Substudy 2 Study Group. Familial risk of type 1 diabetes in European children. Diabetologia 1998;41:1151–1156.
Hattersley AT, Greeley SAW, Polak M, et al. ISPAD Clinical Practice Consensus Guidelines 2018: The diagnosis and management of monogenic diabetes in children and adolescents. Pediatr Diabetes. 2018;19 Suppl 27:47–63. doi:10.1111/pedi.12772.
Mayer-Davis EJ, Kahkoska AR, Jefferies C, et al. ISPAD Clinical Practice Consensus Guidelines 2018: Definition, epidemiology, and classification of diabetes in children and adolescents. Pediatr Diabetes. 2018;19 Suppl 27:7–19. doi:10.1111/pedi.12773.
Ogle GD, Middlehurst AC, Silink M. The IDF Life for a Child Program Index of diabetes care for children and youth. Pediatr Diabetes. 2016:17:374–384. doi:10.1111/pedi.12296.
Patterson CC, Karuranga S, Salpea P, et al. Worldwide estimates of incidence, prevalence and mortality of type 1 Diabetes in children and adolescents: Results from the International Diabetes Federation Diabetes Atlas, 9th edition. Diabetes Res Clin Pract. 2019;157:107842. doi:10.1016/j.diabres.2019.107842.
Rakhimova GN, Alimova NU, Ryaboshtan A, et al. Epidemiological data of type 1 diabetes mellitus in children in Uzbekistan, 1998–2014. Pediatr Diabetes. 2018;19(1):158–165. doi:10.1111/pedi.12495.
UNAIDS/WHO Working Group on Global HIV/AIDS and STI Surveillance. Guidelines on estimating the size of populations most at risk to HIV. Geneva: World Health Organization; 2010. https://apps.who.int/iris/handle/10665/44347. Accessed October 4, 2020.
Zeitler P, Arslanian S, Fu J, et al. ISPAD Clinical Practice Consensus Guidelines 2018: Type 2 diabetes mellitus in youth. Pediatr Diabetes. 2018;19 (Suppl 27):28–46. doi:10.1111/pedi.12719.
IDF guide for diabetes epidemiology studies 51
Chapter 9
Publication
Key points
y When preparing a report for publication, sufficient detail is required in the methods section to ensure trust around study validity and replicability
y The core of the results section comprises text, tables and graphics. Choose the most appropriate format for the message being communicated
y All reports on the prevalence or incidence of undiagnosed diabetes should include findings that are based on fasting plasma glucose alone. This is regardless of any other diagnostic tests that were used, although data should also be provided for these too
Steven James, Jonathan Shaw, Pouya Saeedi, Suvi Karuranga
Reports of studies on the epidemiology and burden of diabetes provide valuable information for the scientific community and healthcare decision-makers. When pre-paring a report, consideration should be given to whether findings would be better communicated through a single paper or, where applicable, a series of reports consider-ing differing topics and with different levels of detail.
This chapter provides an overview of what should be covered in each of the major sections of a report. The use of guidelines (such as the Strengthening the Report-ing of Observational studies in Epidemiology (STROBE) statement: guidelines for reporting observational stud-ies) can be beneficial.1 Each journal will have its own guidelines for authors, and these should be strictly adhered to in order to maximise the chance of success-fully progressing through the peer review process.2
Title, abstract and keywords
A good title contains the fewest words possible, while adequately describing the purpose, subject and scope of the research. Additionally, it uses words that stimu-late the reader’s interest, avoids the use of abbreviations, and does not describe the study conclusion. For
example, ‘Diabetes prevalence in Australia over 20 years’ is preferred over ‘Rising diabetes prevalence in Australia over 20 years’. The abstract should start with a state-ment about the research problem or question, along with background information to provide context. Only key methods and findings should be included, making explicit how they address the problem or question iden-tified. Finally, the overall significance of the research should be described. Appropriate keywords should be chosen to define what the report is about.
All three elements (the title, abstract and keywords) should refer to the type of study (incidence, preva-lence etc.), geographical area (country or region name), type(s) of diabetes involved and sample population (adults, youth etc.). This will help ensure that literature searches identify the report.
Introduction
Regardless of the target audience, a clear, compelling argument summarising the need for the study should appear in the very first paragraph of the main text. This argument should run all the way through the different sections of the report, tying together both theoretical
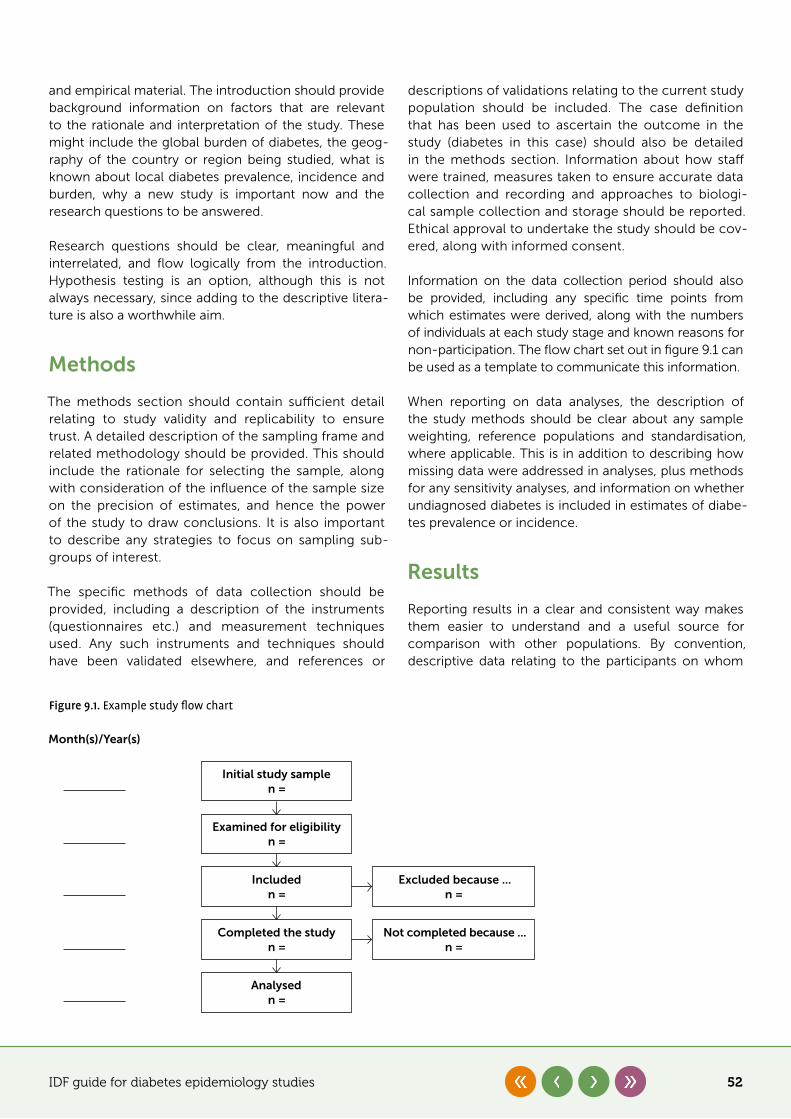
IDF guide for diabetes epidemiology studies 52
and empirical material. The introduction should provide background information on factors that are relevant to the rationale and interpretation of the study. These might include the global burden of diabetes, the geog-raphy of the country or region being studied, what is known about local diabetes prevalence, incidence and burden, why a new study is important now and the research questions to be answered.
Research questions should be clear, meaningful and interrelated, and flow logically from the introduction. Hypothesis testing is an option, although this is not always necessary, since adding to the descriptive litera-ture is also a worthwhile aim.
Methods
The methods section should contain sufficient detail relating to study validity and replicability to ensure trust. A detailed description of the sampling frame and related methodology should be provided. This should include the rationale for selecting the sample, along with consideration of the influence of the sample size on the precision of estimates, and hence the power of the study to draw conclusions. It is also important to describe any strategies to focus on sampling sub-groups of interest.
The specific methods of data collection should be provided, including a description of the instruments (questionnaires etc.) and measurement techniques used. Any such instruments and techniques should have been validated elsewhere, and references or
descriptions of validations relating to the current study population should be included. The case definition that has been used to ascertain the outcome in the study (diabetes in this case) should also be detailed in the methods section. Information about how staff were trained, measures taken to ensure accurate data collection and recording and approaches to biologi-cal sample collection and storage should be reported. Ethical approval to undertake the study should be cov-ered, along with informed consent.
Information on the data collection period should also be provided, including any specific time points from which estimates were derived, along with the numbers of individuals at each study stage and known reasons for non-participation. The flow chart set out in figure 9.1 can be used as a template to communicate this information.
When reporting on data analyses, the description of the study methods should be clear about any sample weighting, reference populations and standardisation, where applicable. This is in addition to describing how missing data were addressed in analyses, plus methods for any sensitivity analyses, and information on whether undiagnosed diabetes is included in estimates of diabe-tes prevalence or incidence.
Results
Reporting results in a clear and consistent way makes them easier to understand and a useful source for comparison with other populations. By convention, descriptive data relating to the participants on whom
Figure 9.1. Example study flow chart
Month(s)/Year(s)
Initial study samplen =
Examined for eligibilityn =
Includedn =
Analysedn =
Completed the studyn =
Excluded because ...n =
Not completed because ...n =
IDF guide for diabetes epidemiology studies 53
data are being presented usually constitute table 1 of the report. This could include, for example, age ranges, sex distribution, ethnicity, socioeconomic parameters, and a comparison of the sample and target population age structures to describe the extent to which the study population reflects the background population. Where applicable, provide both number and percentage, and for continuous variables include either the mean and standard deviation or the median and quartiles. The results provided should answer any research questions identified earlier.
Undiagnosed diabetes can be ascertained through three different tests – fasting plasma glucose, 2-hour plasma glucose and HbA1c – which can be combined in differ-ent ways, leading to significant difficulty in comparing different studies. Since fasting plasma glucose remains the most commonly used single test, every report on the prevalence or incidence of undiagnosed diabetes should include findings according to the fasting plasma glucose alone. This is regardless of whatever other com-binations of tests are being used, for which data should also be provided. This will make comparisons between studies much more robust. For the same reason, data relating to undiagnosed diabetes, previous and newly diagnosed diabetes should be presented separately.
Prevalence should generally be reported as a propor-tion of the total population sampled, and incidence as a fraction of the population at risk of disease devel-opment within a period of time (for example, 26 per 100,000 population per year). The estimates should include the number of cases (numerator), the total population sampled (denominator), the proportion (cases/total sample) and its corresponding confi-dence interval. As age is arguably the most significant non-modifiable risk factor for diabetes, it is essential that any estimate of diabetes prevalence or incidence is reported according to age-groups. Ideally, this will be in at least three age-groups, usually in five-year or ten-year age increments, although depending on the size of the sample population the use of wider age-groups may be appropriate. In addition, as sex and possibly location (urban/rural) can also potentially affect diabe-tes prevalence and incidence, analyses should ideally also be presented for these strata.
Where ethnic groups with potential differences in prev-alence are present, consideration needs to be given as to how these should be reported, e.g. by each major ethnic group, or the majority ethnic group and a com-bination of other ethnic groups. Standardised estimates should be reported in addition to any unadjusted esti-mates. If it is not possible to analyse how the setting
affects the prevalence, it is still useful to present descrip-tive findings. As diabetes is estimated to be associated with 11.3% of global deaths from all causes among adults,3 it is also useful to report diabetes-related mor-tality estimates where possible. Principles relating to use of standardised and unadjusted rates should also be fol-lowed when reporting diabetes-related mortality.
The use of tables to present data is encouraged, since they can display precise numerical values clearly, such as the number of participants with missing data for each variable of interest, thereby facilitating comparison between groups. However, when presented incor-rectly, tables can fail to communicate the intended message. Clarity can be improved by laying out any data that involves dates and timings from left to right, avoiding too many zeros (use scientific notation such as ×105, for example) and using decimal places con-sistently. Decisions about decimal places relate to the precision and clinical relevance of the measure, as well as to convention.
Any presentation of results should, where applicable, be supported by information such as confidence inter-vals and levels of statistical significance. This will enable the reader to draw informed conclusions based on the results provided. Exact p-values should be reported, except when values are less than 0.001 (use p < 0.001). Footnotes can be used to add clarity to data presented, and any symbols or abbreviations used should be stand-ardised across all tables. The example tables in appendix 4 can be used as templates to help relay available infor-mation. However, these may need to be modified pending the data to be presented.
Graphics are also encouraged and can be used to highlight results and emphasise proportions or trends. However, caution needs to be exercised, since graphics can preclude the presentation of precise numerical val-ues, and when presented incorrectly the message can again fail to be communicated as intended. The clarity of data presented in graphical form can be improved by choosing the correct graphic. Categorical data are gen-erally best displayed using a bar chart, and continuous data using histograms or line graphs. Line graphs are also particularly useful to detail data changes over time. It is best to avoid pie charts and 3D graphs. Any charac-ters, symbols or markings in the key need to be clearly detailed, as do the units of measurement used.
Consideration should be given to the inclusion of sup-plemental data which may add value to the content or help bypass any limitations on the number of tables or graphics that can be displayed.
IDF guide for diabetes epidemiology studies 54
Discussion
This section should discuss the study findings, and not introduce any new results. Discussion of study results should always recognise that the precision of the point estimate may be limited, and 95% confidence intervals can be useful in indicating the range of possible estimates.
To aid interpretation of results, supporting or contradic-tory evidence from other studies – ideally both national and international – should be discussed. Strengths and limitations of the research study and its findings should be detailed, including the form of sampling adopted, instruments used, completeness of distribution of case ascertainment, and the direction and magnitude of any other potential bias. The implications and generalisability
of study findings should also be considered, along with any future research needed.
Conclusion
The conclusion details what the study has addressed and the implications for health, clinical practice, health pol-icy and research. Results should not be repeated, and care should be taken not to overstate the evidence pre-sented. For example, findings from a prevalence study involving a small sample of young adults with type 1 diabetes from a single remote area may not be compre-hensive enough to draw conclusions at a national level for all age ranges. Details should be given of any actions required as a result of the findings.
References
1� Equator Network. Enhancing the QUAlity and Transparency Of Health Research. https://www.equator-network.org/reporting-guidelines/strobe. Accessed October 4, 2020.
2� Home, PD. Techniques for ensuring that your next paper is quite unsuitable for publication. J R Coll Physicians Lond. 1988 Jan;22(1):48–50.
3� Saeedi, P, Salpea, P, Karuranga, et al. Mortality attributable to diabetes in 20–79 years old adults, 2019 estimates: Results from the International Diabetes Federation Diabetes Atlas, 9th edition. Diabetes Res Clin Pract. 2020;162:108086. doi:10.1016/j.diabres.2020.108086.
IDF guide for diabetes epidemiology studies 55
Chapter 10
Advocacy
Key points
y Findings from epidemiological research can be used to raise awareness of diabetes and its complications, engage stakeholders in prevention and management, and establish national diabetes plans that are appropriate to local contexts
y When carrying out advocacy, aim to work across disciplines and interests using a holistic, systems approach that will achieve maximum benefit for health outcomes. The evidence-base can help to develop cross- and inter-sectoral strategies that have the greatest chance of success
Steven James, Beatriz Yáñez Jiménez
Effective advocacy at global, national, regional and local levels can help convince those who establish health pri-orities and allocate budgets that reducing the burden of diabetes is both vital and achievable. The epidemiolog-ical profile of a country can be used to raise awareness of diabetes and its complications, engage stakeholders in prevention and management, and establish national diabetes plans that are appropriate to local contexts. It can also help hold decision-makers to account.
Approaches for translating evidence so that it best meets the needs of different target audiences should be considered in the planning and implementation of epi-demiological studies. In most cases, new evidence will not immediately result in changes to health policy or funding, but if used effectively it can help create aware-ness and engagement as part of a larger concerted action. While adding to the broader evidence-base is encouraged, it is important to prioritise areas where the greatest impact can be achieved. Aim to work across disciplines and interests using a holistic, systems approach that will achieve maximum benefit for health outcomes. The evidence-base can help to develop cross- and inter-sectoral strategies that have the great-est chance of success.
IDF’s advocacy guides are practical resources for those seeking to influence decision-making relating to diabetes
care and prevention. They provide suggestions on how to best direct available data towards appropriate target audiences by:
y establishing strategic partnerships with sectors of society that are affected by, or concerned with, the issues
y identifying unified short- and long-term advocacy goals and objectives
y assessing progress against global commitments, and engaging with existing national plans and priorities
y tailoring messages to match different audiences
The target audiences for epidemiological research typically fall into two main categories: primary deci-sion-makers and those who seek to influence them. Primary decision-makers are individuals and organ-isations with the authority to generate change, and include legislators and their aides, local elected and appointed officials, regulatory and funding agen-cies and nongovernmental organisations. Influencers advise and advocate to primary decision-makers, and include opinion and business leaders, public figures, prominent healthcare professionals, news outlets and civil society. The messages used, and their supporting evidence, should be tailored and presented in such a way as to make the information clear and accessible to
IDF guide for diabetes epidemiology studies 56
its respective audience. In some cases, evidence must be simplified into key target messages that are easy to remember and repeat. Evidence for policy often requires high levels of detail with ongoing monitoring and surveillance to assess achievement of targets and future research needs. Despite this, recommendations and expected outcomes should be framed positively, be concise and be delivered in a credible way on a verifiable platform. The expectations of the advocates should be clearly stated.
Personal contact with target audiences is recom-mended to help form and maintain long-term and impactful relationships. If personal connections can be made (especially if the opinions and experiences of people living with diabetes can be included), it is more likely that the messages will be heard and taken seri-ously. Several template documents are available on the IDF advocacy webpage (https://idf.org/our-activities/advocacy-awareness.html) to assist with establishing initial contact. These can be tailored to local contexts and translated into the appropriate languages.
Recommended reading
International Diabetes Federation. IDF Diabetes Atlas. 9th ed. Brussels: Belgium; 2019. https://diabetesatlas.org/en/resources/. Accessed October 1, 2020.
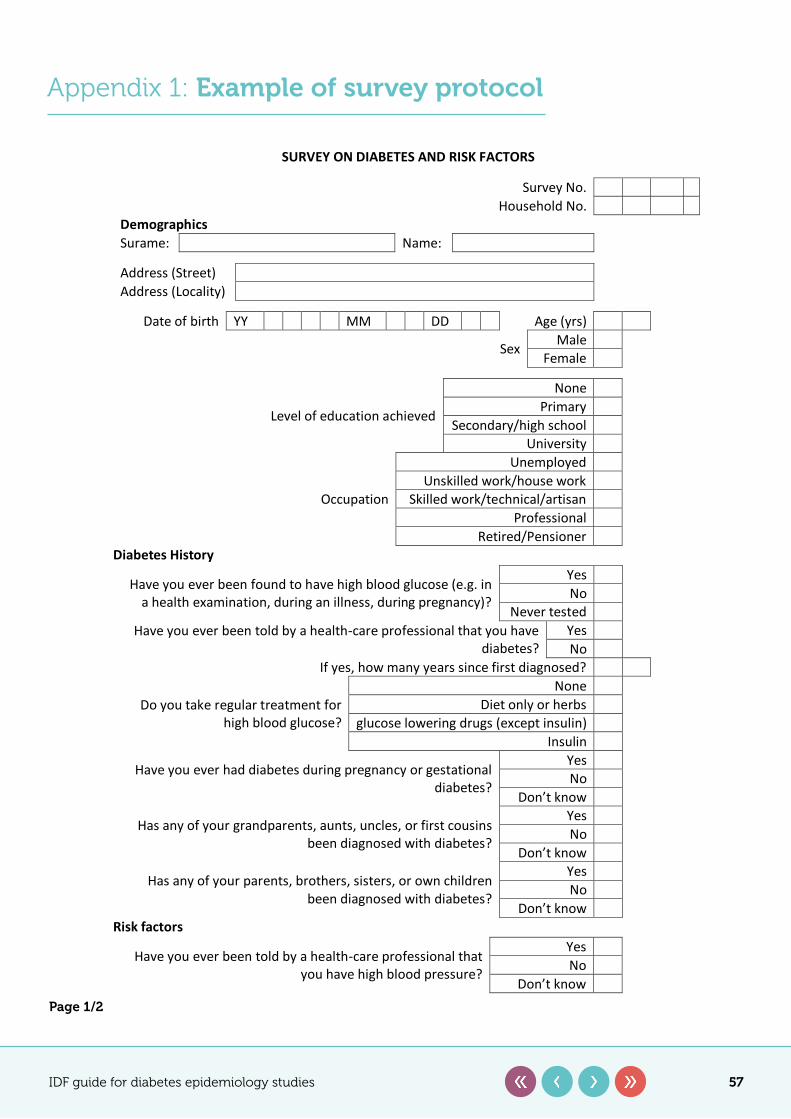
IDF guide for diabetes epidemiology studies 57
Appendix 1: Example of survey protocol
SURVEY ON DIABETES AND RISK FACTORS
Survey No. Household No.
Demographics Surame: Name: Address (Street) Address (Locality)
Date of birth YY MM DD Age (yrs)
Sex Male Female
Level of education achieved
None Primary
Secondary/high school University
Occupation
Unemployed Unskilled work/house work
Skilled work/technical/artisan Professional
Retired/Pensioner Diabetes History
Have you ever been found to have high blood glucose (e.g. in a health examination, during an illness, during pregnancy)?
Yes No
Never tested Have you ever been told by a health-care professional that you have
diabetes? Yes No
If yes, how many years since first diagnosed?
Do you take regular treatment for high blood glucose?
None Diet only or herbs
glucose lowering drugs (except insulin) Insulin
Have you ever had diabetes during pregnancy or gestational diabetes?
Yes No
Don’t know
Has any of your grandparents, aunts, uncles, or first cousins been diagnosed with diabetes?
Yes No
Don’t know
Has any of your parents, brothers, sisters, or own children been diagnosed with diabetes?
Yes No
Don’t know Risk factors
Have you ever been told by a health-care professional that you have high blood pressure?
Yes No
Don’t know Page 1/2
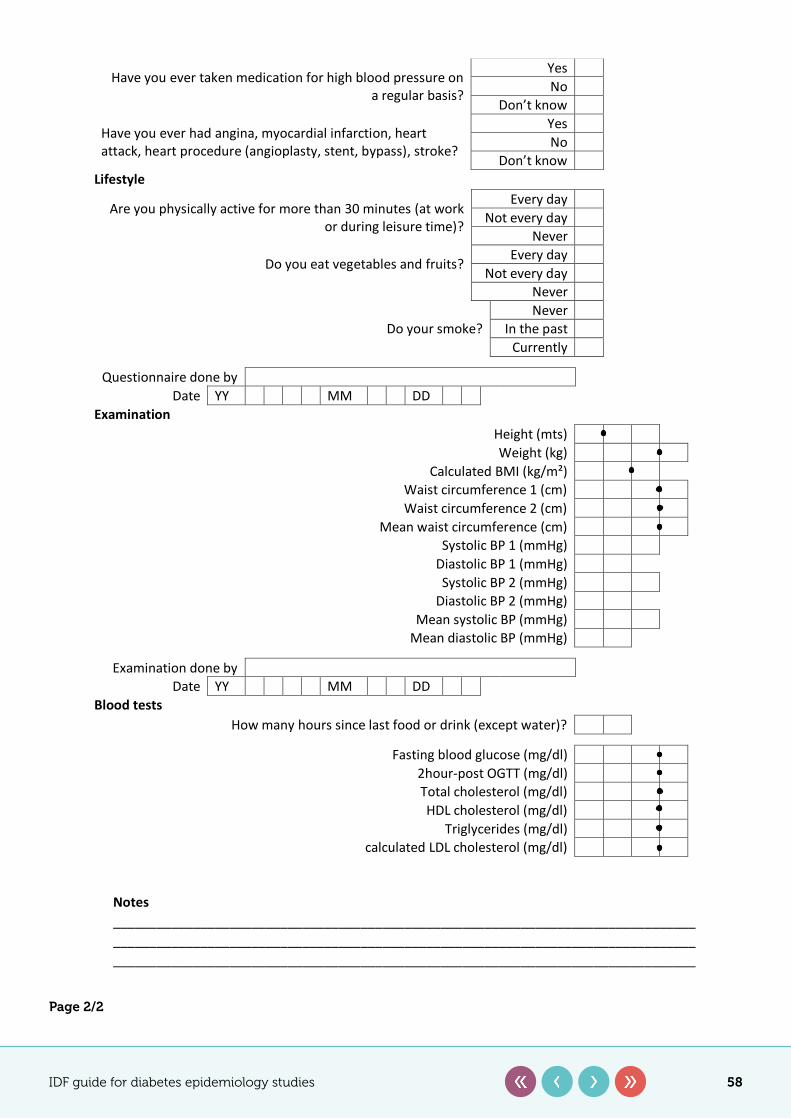
IDF guide for diabetes epidemiology studies 58
Page 2/2
Have you ever taken medication for high blood pressure on a regular basis?
Yes No
Don’t know
Have you ever had angina, myocardial infarction, heart attack, heart procedure (angioplasty, stent, bypass), stroke?
Yes No
Don’t know Lifestyle
Are you physically active for more than 30 minutes (at work or during leisure time)?
Every day Not every day
Never
Do you eat vegetables and fruits? Every day Not every day
Never
Do your smoke? Never
In the past Currently
Questionnaire done by
Date YY MM DD Examination
Height (mts) Weight (kg)
Calculated BMI (kg/m²) Waist circumference 1 (cm) Waist circumference 2 (cm)
Mean waist circumference (cm) Systolic BP 1 (mmHg)
Diastolic BP 1 (mmHg) Systolic BP 2 (mmHg)
Diastolic BP 2 (mmHg) Mean systolic BP (mmHg)
Mean diastolic BP (mmHg)
Examination done by Date YY MM DD
Blood tests How many hours since last food or drink (except water)?
Fasting blood glucose (mg/dl)
2hour-post OGTT (mg/dl) Total cholesterol (mg/dl) HDL cholesterol (mg/dl)
Triglycerides (mg/dl) calculated LDL cholesterol (mg/dl)
Notes ________________________________________________________________________________________________________________________________________________________________ ________________________________________________________________________________
Page 2/2
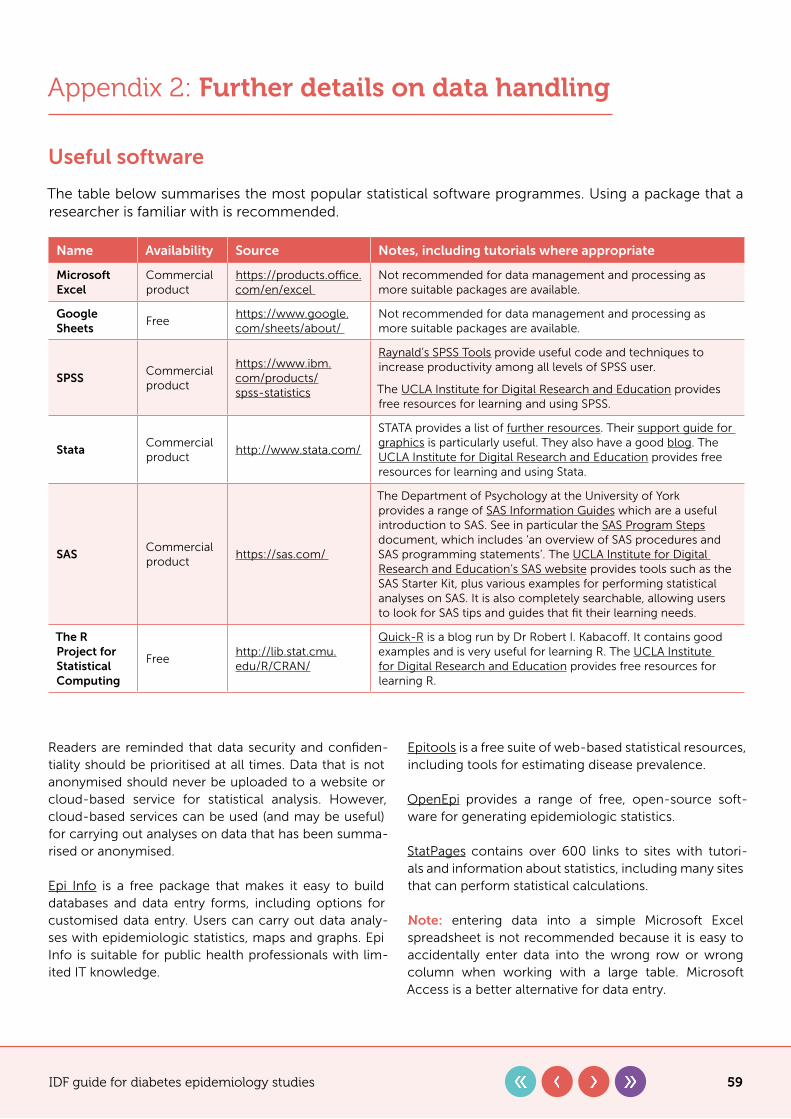
IDF guide for diabetes epidemiology studies 59
Appendix 2: Further details on data handling
Useful software
The table below summarises the most popular statistical software programmes. Using a package that a researcher is familiar with is recommended.
Name Availability Source Notes, including tutorials where appropriate
Microsoft Excel
Commercial product
https://products.office.com/en/excel
Not recommended for data management and processing as more suitable packages are available.
Google Sheets
Freehttps://www.google.com/sheets/about/
Not recommended for data management and processing as more suitable packages are available.
SPSSCommercial product
https://www.ibm.com/products/spss-statistics
Raynald’s SPSS Tools provide useful code and techniques to increase productivity among all levels of SPSS user.
The UCLA Institute for Digital Research and Education provides free resources for learning and using SPSS.
StataCommercial product
http://www.stata.com/
STATA provides a list of further resources. Their support guide for graphics is particularly useful. They also have a good blog. The UCLA Institute for Digital Research and Education provides free resources for learning and using Stata.
SASCommercial product
https://sas.com/
The Department of Psychology at the University of York provides a range of SAS Information Guides which are a useful introduction to SAS. See in particular the SAS Program Steps document, which includes ‘an overview of SAS procedures and SAS programming statements’. The UCLA Institute for Digital Research and Education’s SAS website provides tools such as the SAS Starter Kit, plus various examples for performing statistical analyses on SAS. It is also completely searchable, allowing users to look for SAS tips and guides that fit their learning needs.
The R Project for Statistical Computing
Freehttp://lib.stat.cmu.edu/R/CRAN/
Quick-R is a blog run by Dr Robert I. Kabacoff. It contains good examples and is very useful for learning R. The UCLA Institute for Digital Research and Education provides free resources for learning R.
Readers are reminded that data security and confiden-tiality should be prioritised at all times. Data that is not anonymised should never be uploaded to a website or cloud-based service for statistical analysis. However, cloud-based services can be used (and may be useful) for carrying out analyses on data that has been summa-rised or anonymised.
Epi Info is a free package that makes it easy to build databases and data entry forms, including options for customised data entry. Users can carry out data analy-ses with epidemiologic statistics, maps and graphs. Epi Info is suitable for public health professionals with lim-ited IT knowledge.
Epitools is a free suite of web-based statistical resources, including tools for estimating disease prevalence.
OpenEpi provides a range of free, open-source soft-ware for generating epidemiologic statistics.
StatPages contains over 600 links to sites with tutori-als and information about statistics, including many sites that can perform statistical calculations.
Note: entering data into a simple Microsoft Excel spreadsheet is not recommended because it is easy to accidentally enter data into the wrong row or wrong column when working with a large table. Microsoft Access is a better alternative for data entry.
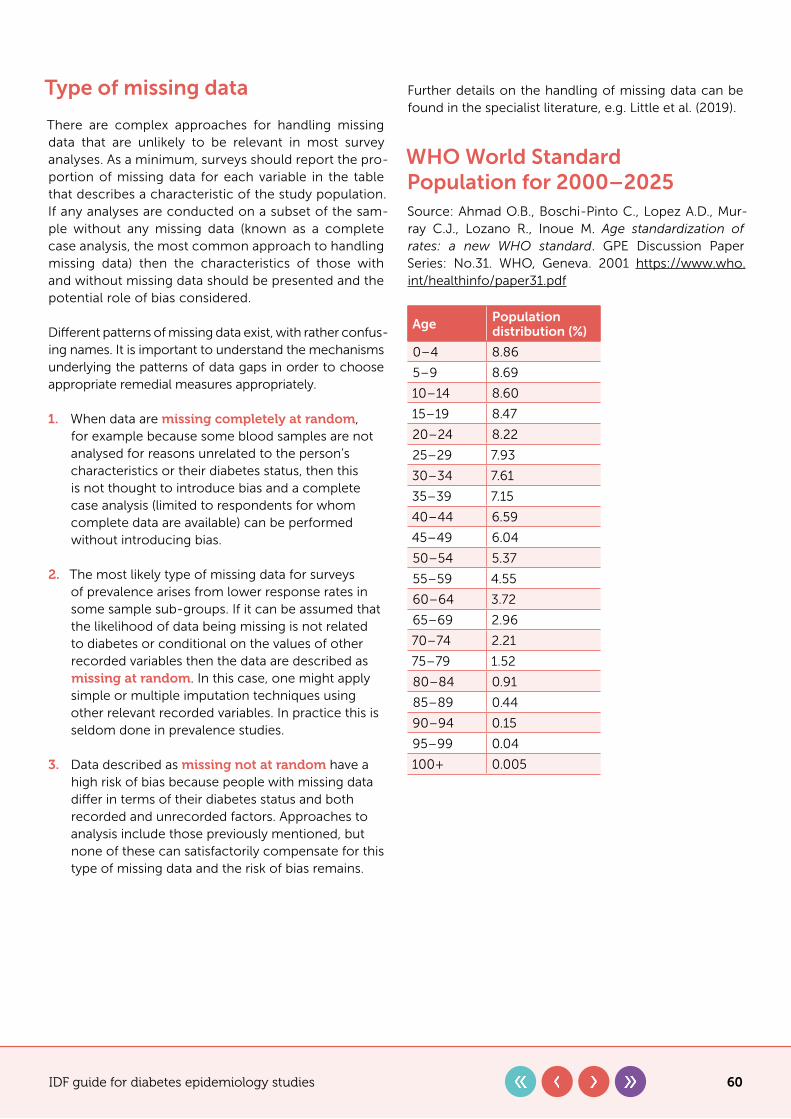
IDF guide for diabetes epidemiology studies 60
Type of missing data
There are complex approaches for handling missing data that are unlikely to be relevant in most survey analyses. As a minimum, surveys should report the pro-portion of missing data for each variable in the table that describes a characteristic of the study population. If any analyses are conducted on a subset of the sam-ple without any missing data (known as a complete case analysis, the most common approach to handling missing data) then the characteristics of those with and without missing data should be presented and the potential role of bias considered.
Different patterns of missing data exist, with rather confus-ing names. It is important to understand the mechanisms underlying the patterns of data gaps in order to choose appropriate remedial measures appropriately.
1� When data are missing completely at random, for example because some blood samples are not analysed for reasons unrelated to the person’s characteristics or their diabetes status, then this is not thought to introduce bias and a complete case analysis (limited to respondents for whom complete data are available) can be performed without introducing bias.
2� The most likely type of missing data for surveys of prevalence arises from lower response rates in some sample sub-groups. If it can be assumed that the likelihood of data being missing is not related to diabetes or conditional on the values of other recorded variables then the data are described as missing at random. In this case, one might apply simple or multiple imputation techniques using other relevant recorded variables. In practice this is seldom done in prevalence studies.
3� Data described as missing not at random have a high risk of bias because people with missing data differ in terms of their diabetes status and both recorded and unrecorded factors. Approaches to analysis include those previously mentioned, but none of these can satisfactorily compensate for this type of missing data and the risk of bias remains.
Further details on the handling of missing data can be found in the specialist literature, e.g. Little et al. (2019).
WHO World Standard Population for 2000–2025Source: Ahmad O.B., Boschi-Pinto C., Lopez A.D., Mur-ray C.J., Lozano R., Inoue M. Age standardization of rates: a new WHO standard. GPE Discussion Paper Series: No.31. WHO, Geneva. 2001 https://www.who.int/healthinfo/paper31.pdf
Age Population distribution (%)
0–4 8.86
5–9 8.69
10–14 8.60
15–19 8.47
20–24 8.22
25–29 7.93
30–34 7.61
35–39 7.15
40–44 6.59
45–49 6.04
50–54 5.37
55–59 4.55
60–64 3.72
65–69 2.96
70–74 2.21
75–79 1.52
80–84 0.91
85–89 0.44
90–94 0.15
95–99 0.04
100+ 0.005
IDF guide for diabetes epidemiology studies 61
Appendix 3: Examples of disease registries
National Diabetes Registry of Pakistan
Background
The Health Research Advisory Board of Pakistan has initiated the development of nationwide disease reg-istries. The Diabetes Registry of Pakistan (DROP) is a voluntary project of the Baqai Institute of Diabetol-ogy and Endocrinology (BIDE), the Health Research Advisory Board (Health RAB), and the Pakistan Health Research Council (PHRC). This is the first diabetes registry in Pakistan, and commenced development in 2016. The eventual aim of DROP is to provide national data on numbers of people with diabetes and their out-comes for use in audit and research, in order to inform national policy-making and guidelines. In future, DROP, with the help of Health RAB, will be linked with other registries in Pakistan.
The long-term objectives of DROP are:
y To register everyone with diabetes in Pakistan y To classify the diabetes burden by type and special
condition(s) (e.g. gestational diabetes, type 1 diabetes (T1D), diabetic foot)
y To develop a hub to plan and execute relevant national and regional research projects and policies
y To deliver comprehensive and uniform diabetes care by following national guidelines
y To enable policymakers to upgrade the existing national guidelines for care and prevention
Data collection
The information in DROP is collected through an elec-tronic portal with login details assigned to healthcare professionals from participating institutes, all of whom sign a memorandum of understanding before being granted access. Mandatory fields are as follows:
y date y unique identifiers in the form of a Computerised
National Identity Card (CNIC) for adults and B-form for children < 18 years of age
y DROP ID (auto-generated) y gender y date of birth y type of diabetes (provided options: type 1, type 2,
GDM, other [includes LADA, MODY etc.])
y year of diagnosis y treatment type (provided options: oral, insulin, both,
GLP, pumps etc.) y height and weight (BMI with auto calculator) y complications status (including hypertension,
dyslipidemia, retinopathy, nephropathy, neuropathy and cardiovascular disease). Clinical definitions are based on Pakistan’s recommendations for optimal management of diabetes from primary to tertiary care level (PROMPT)1, 2
y smoking and tobacco details (provided options: yes, no, ex-smoker)
y ethnicity y glucose and HbA1c levels
The software is made simple and user-friendly through drop-down options where applicable.
Paper questionnaires are used for data collection in remote areas. These are then delivered to the BIDE head office for manual entry into the electronic portal. DROP is currently planning an electronic application for more convenient collection of data.
Challenges
The main hurdle for DROP is a lack of awareness among healthcare providers about the importance of health registries. Moreover, the health infrastructure of Pakistan is not yet sufficiently developed to support registries. Approximately 70% of healthcare takes place in the private sector, and there are limited numbers of specialised diabetes centres, particularly in rural and peripheral urban areas. Pakistan’s minimal health budget is just sufficient for disease management, with no funds available for supporting registries. A DROP short communication was published in the Pakistan Journal of Medical Sciences in 2020.3 The first annual report of DROP was also published and was limited to data for people with T1D (DROP-1).4 Considerable effort and resources will be required to extend cover-age of DROP.
To overcome the challenges of setting up a dia-betes register in Pakistan, a multifaceted approach was used. The Advisory Board for the Care of Dia-betes (ABCD) involves 10–12 tertiary care diabetes
IDF guide for diabetes epidemiology studies 62
services and is contributing to various nation-al-level diabetes projects. Over four hundred diploma doctors trained by BIDE who are practising across the country in primary and secondary care settings have also been approached to help imple-ment DROP. The Insulin My Life project (IML),5 for which the seed money was provided by the World Diabetes Foundation (WDF) and later on Life for a Child (LFAC), joined with BIDE to make this project sustainable. The first stage of DROP was to col-lect data relating to people with T1D in the Sindh province of Pakistan. Through this project a data-set of around 1,600 people with T1D was collected, published and made a part of DROP as DROP-1.4 Later, the content of the DROP was extended, initially by requesting further data from the same centres. The data collection was later extended to include centres from the whole of Pakistan. The Diabetic Association of Pakistan (DAP) and National Association of Diabe-tes Educators (NADEP) have provided full support for the registry. The Ministry of National Health Ser-vices Regulations and Coordination, Government of Pakistan, has also been successfully approached to make it a national registry.
DROP classifications
y DROP-1: Diabetes Registry of Pakistan for people with T1D
y DROP-2: Diabetes Registry of Pakistan for people with T2D
y DROP-F: Diabetes Registry of Pakistan for people with foot ulcers, including peripheral vascular disease
y DROP-G: Diabetes Registry of Pakistan for women with gestational diabetes
Acknowledgement
Prof Basit acknowledges the support of Prof Dr Asher Fawwad, Head of Research Department, Baqai Insti-tute of Diabetology and Endocrinology, Baqai Medical University in the preparation of this document for the Diabetes Registry of Pakistan.
References
1� Shera AS, Basit A, et al. Pakistan’s Recommendations for Optimal Management of diabetes from Primary to Tertiary care level (PROMPT). Pak J Med Sci. 2017;33(5):1279–1283. doi:10.12669/pjms.335.13665.
2� Shera AS, Basit A, et al. Pakistan’s Recommendations for Optimal Management of diabetes from Primary to Tertiary care level (PROMPT) National Association of Diabetes Educators of Pakistan. 2017. http://www.pjms.com.pk/public/site/images/shaukat/BIDE-Prompt-Book.pdf. Accessed Oct 4, 2020.
3� Basit A, Fawwad A, Baqa K. Diabetes Registry of Pakistan. Pak J Med Sci. 2020;36(3):578–580. doi:10.12669/pjms.36.3.1877.
4� Diabetes Registry of Pakistan. First Annual Report of Diabetes Registry of Pakistan (DROP). http://www.healthrab.org/download/Diabetes%20Registry%20Of%20Pakistan%20Brochure.pdf. Accessed October 4, 2020.
5� Baqai Institute of Diabetology and Endocrinology (BIDE). Insulin – My Life. http://www.insulinmylife.com. Accessed October 4, 2020.
National Diabetes Audit for England & Wales (NDA)
Purpose of the database
The NDA helps improve the quality of diabetes care by enabling participating National Health Service (NHS) organisations to:
y assess local practice against National Institute for Health and Care Excellence (NICE) guidelines
y compare their care and outcomes with similar organisations
y identify gaps or shortfalls that are priorities for improvement
y identify and share best practice y provide comprehensive national pictures of diabetes
care and outcomes in England and Wales
Through participation in the audit, local services are able to benchmark their performance, identify where they are performing well, and improve the quality of treat-ment and care they provide.
IDF guide for diabetes epidemiology studies 63
Method(s) of ascertainment
y Primary care� Data are extracted automatically from all general practices in England and Wales via the General Practice Extraction Service (GPES)
y Secondary care/specialist services� Data are submitted by each service via the Clinical Audit Platform (CAP)
The data are analysed by NHS Digital. The NDA does not provide full coverage of data for children with dia-betes, and more extensive coverage is provided by the National Paediatric Diabetes Audit (NPDA). The NDA has several components, including core and additional data for sub-groups such as the National Pregnancy in Dia-betes (NPID) audit and the National Diabetes Foot Audit (NDFA), described in further detail in the table at the end of this section.
Governance and oversight (in terms of anonymity and security, for example)
NHS England has instructed NHS Digital to establish and operate a system for the collection and analysis of the NDA. This type of instruction is commonly known as a Direction. This legal basis for data collection (Direction under section 254 of the Health and Social Care Act 2012) means that GP practices and specialist services are now legally required to supply data for their practice or dia-betes clinic. NHS England is only able to give a Direction where it considers the information that will be collected or analysed to be necessary to provide NHS services.
Core NDA, NPID and NDFA all collect patient identifia-ble data. This allows patient records to be linked across the diabetes audit programme and to other health-care datasets, such as hospital episode statistics (HES), patient episode database for Wales (PEDW) and the Office for National Statistics mortality dataset.
The NDA does not collect patient names. The patient identifiable data collected are:
y NHS number y date of birth y postcode
Linking to other diabetes datasets decreases the burden on services of entering duplicate or sup-plementary data. Demographics such as ethnicity, diabetes type and postcode recorded in Core NDA can be used for patients registered in NDFA or NPID, so do not need to be entered twice. Data linkage to hospital and death records allows us to understand the types of complications people with diabetes can experience. These linkages help to give a better pic-ture of diabetes care, whilst managing the burden on services for data collection.
NHS Digital has strict criteria to make sure patient data is kept safe. All data are held securely on encrypted servers. Access to patient records is restricted to cru-cial personnel. Once the data are received, the datasets are pseudonymised to protect patient identity. This means that:
y data items such as date of birth are converted to age, or year of birth
y postcodes are converted to lower layer super output areas (LSOA)
y NHS numbers are converted to a unique ID for that person
The NDA is commissioned and managed under contract by the Healthcare Quality Improvement Partnership (HQIP) on behalf of NHS England and the Welsh Gov-ernment. It is delivered by NHS Digital in collaboration with Diabetes UK.
The NDA collection process has been assured through the Data Standards Assurance Service (DSAS), with the findings presented to the national Data Coordination Board (DCB). The DCB acts with delegated author-ity from the Digital Delivery Board (DDB) and directly from the Secretary of State as the main governance route through which data and standards requirements are agreed.
As part of this assurance, the data items, collection pro-cess and guidance documentation have been reviewed and assessed to establish the burden on services. The DCB have fully approved the NDA processes, awarding it a certificate of assurance.
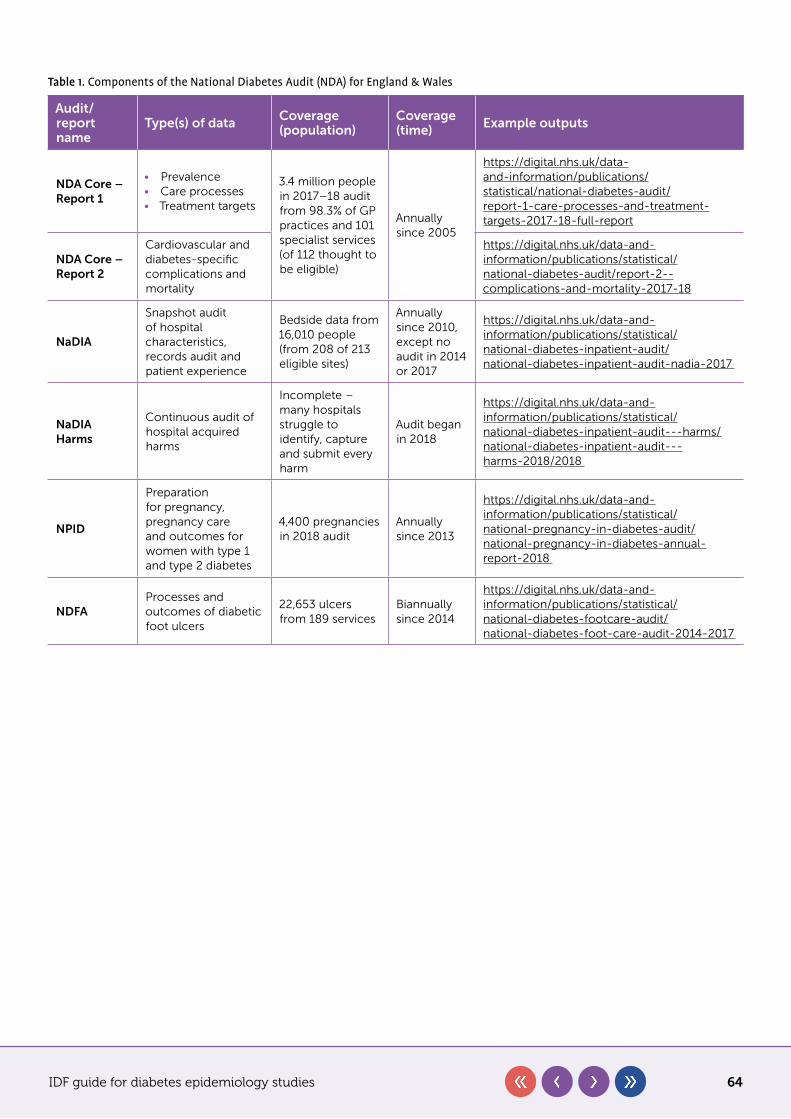
IDF guide for diabetes epidemiology studies 64
Table 1. Components of the National Diabetes Audit (NDA) for England & Wales
Audit/report name
Type(s) of data Coverage (population)
Coverage (time) Example outputs
NDA Core – Report 1
• Prevalence• Care processes• Treatment targets
3.4 million people in 2017–18 audit from 98.3% of GP practices and 101 specialist services (of 112 thought to be eligible)
Annually since 2005
https://digital.nhs.uk/data-and-information/publications/statistical/national-diabetes-audit/report-1-care-processes-and-treatment-targets-2017-18-full-report
NDA Core – Report 2
Cardiovascular and diabetes-specific complications and mortality
https://digital.nhs.uk/data-and-information/publications/statistical/national-diabetes-audit/report-2--complications-and-mortality-2017-18
NaDIA
Snapshot audit of hospital characteristics, records audit and patient experience
Bedside data from 16,010 people (from 208 of 213 eligible sites)
Annually since 2010, except no audit in 2014 or 2017
https://digital.nhs.uk/data-and-information/publications/statistical/national-diabetes-inpatient-audit/national-diabetes-inpatient-audit-nadia-2017
NaDIA Harms
Continuous audit of hospital acquired harms
Incomplete – many hospitals struggle to identify, capture and submit every harm
Audit began in 2018
https://digital.nhs.uk/data-and-information/publications/statistical/national-diabetes-inpatient-audit---harms/national-diabetes-inpatient-audit---harms-2018/2018
NPID
Preparation for pregnancy, pregnancy care and outcomes for women with type 1 and type 2 diabetes
4,400 pregnancies in 2018 audit
Annually since 2013
https://digital.nhs.uk/data-and-information/publications/statistical/national-pregnancy-in-diabetes-audit/national-pregnancy-in-diabetes-annual-report-2018
NDFAProcesses and outcomes of diabetic foot ulcers
22,653 ulcers from 189 services
Biannually since 2014
https://digital.nhs.uk/data-and-information/publications/statistical/national-diabetes-footcare-audit/national-diabetes-foot-care-audit-2014-2017
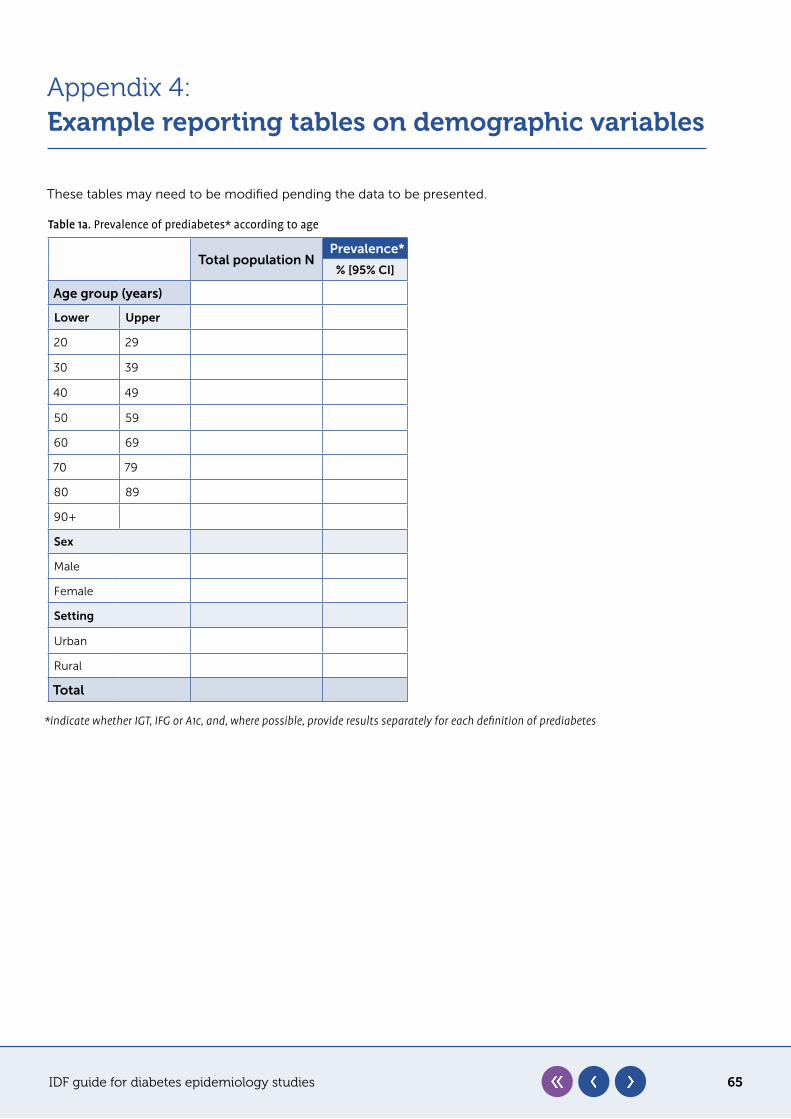
IDF guide for diabetes epidemiology studies 65
Appendix 4:Example reporting tables on demographic variables
These tables may need to be modified pending the data to be presented.
Table 1a. Prevalence of prediabetes* according to age
Total population NPrevalence*
% [95% CI]
Age group (years)
Lower Upper
20 29
30 39
40 49
50 59
60 69
70 79
80 89
90+
Sex
Male
Female
Setting
Urban
Rural
Total
*indicate whether IGT, IFG or A1c, and, where possible, provide results separately for each definition of prediabetes
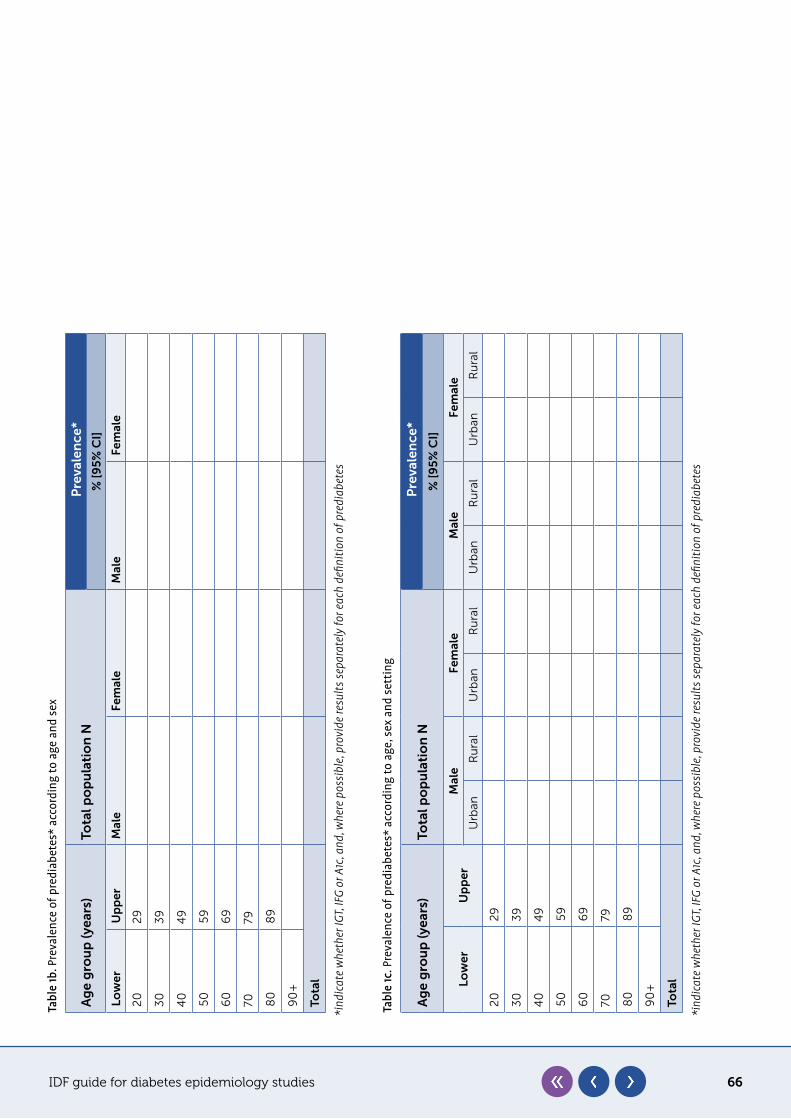
IDF guide for diabetes epidemiology studies 66
Tabl
e 1c
. Pre
vale
nce
of p
redi
abet
es*
acco
rdin
g to
age
, sex
and
set
ting
Ag
e g
rou
p (y
ears
)To
tal p
op
ula
tio
n N
Pre
vale
nce
*
% [
95
% C
I]
Low
erU
pp
erM
ale
Fem
ale
Mal
eFe
mal
e
Urb
an
Ru
ral
Urb
an
Ru
ral
Urb
an
Ru
ral
Urb
an
Ru
ral
20
29
3
03
9
40
49
50
59
60
69
7079
80
89
90
+
Tota
l
*ind
icat
e w
heth
er IG
T, IF
G or
A1c
, and
, whe
re p
ossi
ble,
prov
ide
resu
lts se
para
tely
for e
ach
defin
ition
of p
redi
abet
es
Tabl
e 1b
. Pre
vale
nce
of p
redi
abet
es*
acco
rdin
g to
age
and
sex
Ag
e g
rou
p (y
ears
)To
tal p
op
ula
tio
n N
Pre
vale
nce
*
% [
95
% C
I]
Low
erU
pp
erM
ale
Fem
ale
Mal
eFe
mal
e
20
29
30
39
40
49
50
59
60
69
7079
80
89
90
+
Tota
l
*ind
icat
e w
heth
er IG
T, IF
G or
A1c
, and
, whe
re p
ossi
ble,
prov
ide
resu
lts se
para
tely
for e
ach
defin
ition
of p
redi
abet
es
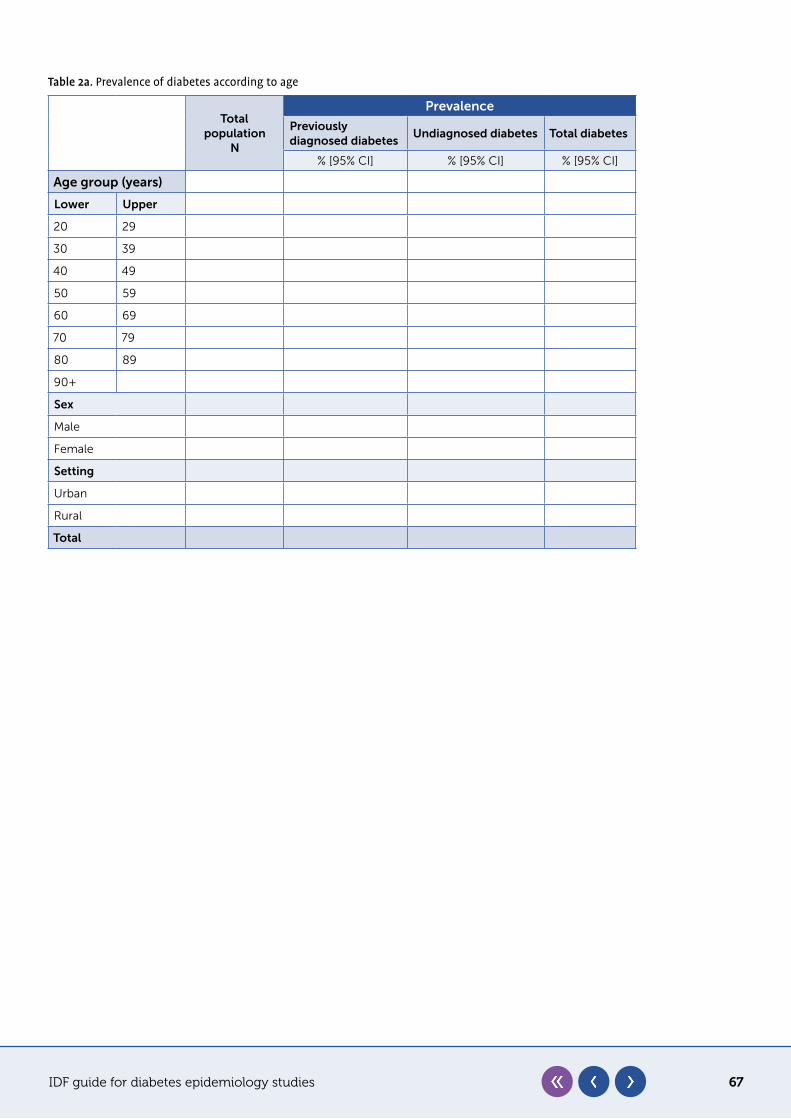
IDF guide for diabetes epidemiology studies 67
Table 2a. Prevalence of diabetes according to age
Total population
N
Prevalence
Previously diagnosed diabetes
Undiagnosed diabetes Total diabetes
% [95% CI] % [95% CI] % [95% CI]
Age group (years)
Lower Upper
20 29
30 39
40 49
50 59
60 69
70 79
80 89
90+
Sex
Male
Female
Setting
Urban
Rural
Total
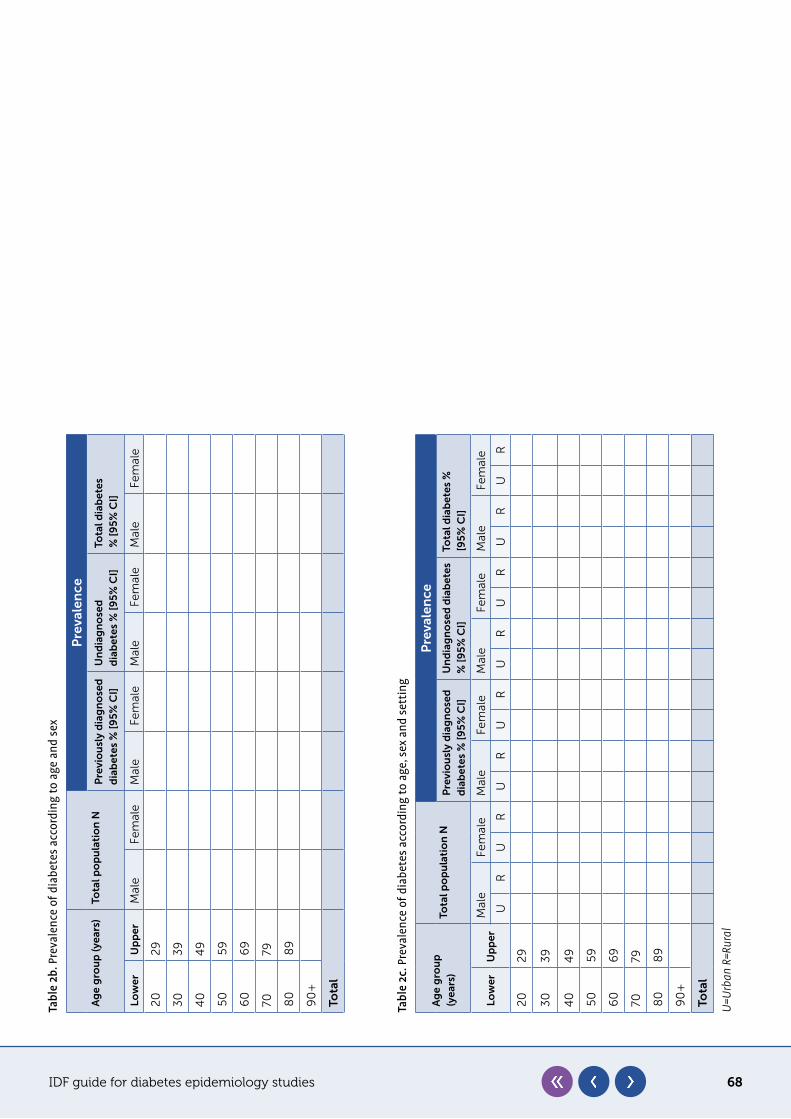
IDF guide for diabetes epidemiology studies 68
Tabl
e 2b
. Pre
vale
nce
of d
iabe
tes
acco
rdin
g to
age
and
sex
Ag
e g
rou
p (y
ears
)To
tal p
op
ula
tio
n N
Pre
vale
nce
Pre
vio
usl
y d
iag
no
sed
d
iab
etes
% [
95
% C
I]U
nd
iag
no
sed
d
iab
etes
% [
95
% C
I]To
tal d
iab
etes
%
[9
5%
CI]
Low
erU
pp
erM
ale
Fem
ale
Mal
eFe
mal
eM
ale
Fem
ale
Mal
eFe
mal
e
20
29
30
39
40
49
50
59
60
69
7079
80
89
90
+
Tota
l
Tabl
e 2c
. Pre
vale
nce
of d
iabe
tes
acco
rdin
g to
age
, sex
and
set
ting
Ag
e g
rou
p
(yea
rs)
Tota
l po
pu
lati
on
N
Pre
vale
nce
Pre
vio
usl
y d
iag
no
sed
d
iab
etes
% [
95
% C
I]U
nd
iag
no
sed
dia
bet
es
% [
95
% C
I]To
tal d
iab
etes
%
[95
% C
I]
Low
erU
pp
erM
ale
Fem
ale
Mal
eFe
mal
eM
ale
Fem
ale
Mal
eFe
mal
e
UR
UR
UR
UR
UR
UR
UR
UR
20
29
30
39
40
49
50
59
60
69
7079
80
89
90
+
Tota
l
U=U
rban
R=R
ural
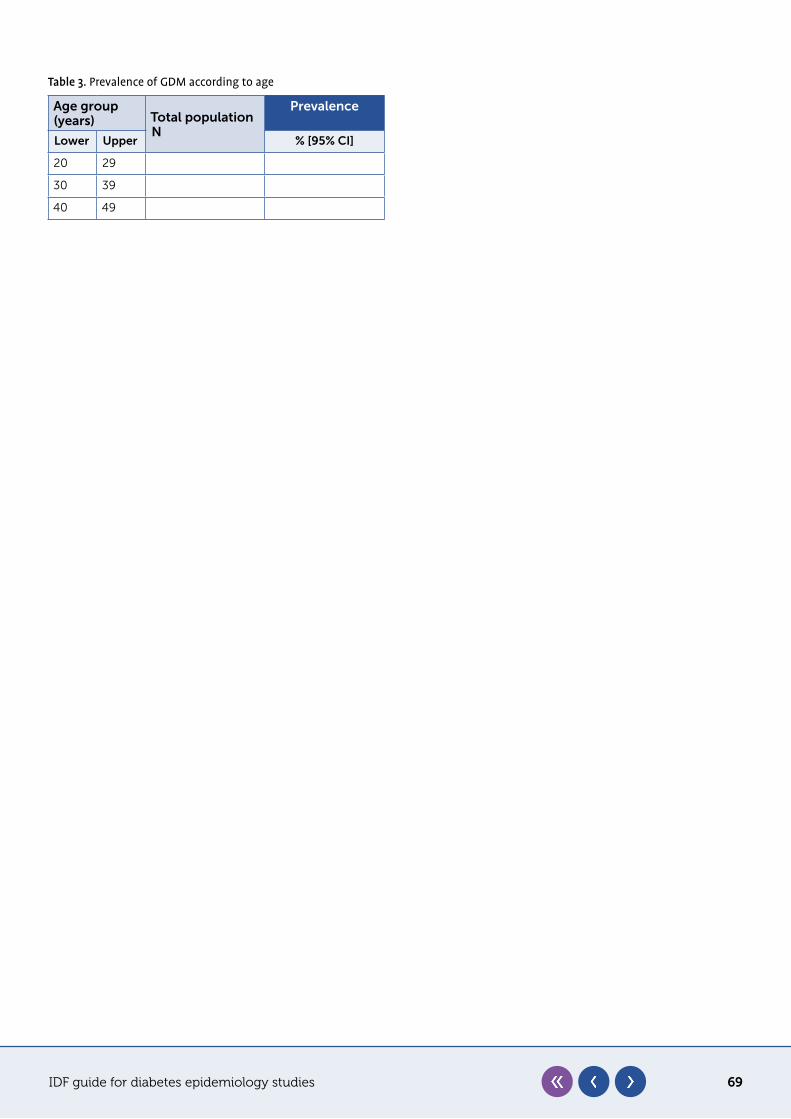
IDF guide for diabetes epidemiology studies 69
Table 3. Prevalence of GDM according to age
Age group (years) Total population
N
Prevalence
Lower Upper % [95% CI]
20 29
30 39
40 49