Embed Size (px)
Citation preview

Identifying the Underlying Factors Related to Placement Stability in Florida
Penelope (Penny) L. Maza, Ph.D.Consultant National Resource Center for Child Welfare Data and [email protected] at: The CFSR Coordinators Call
October 19, 2010
Thank you to the Florida Department of Children and Families which gave permission for the presentation of these data. The analyses and interpretation of these data are solely the responsibility of the author.
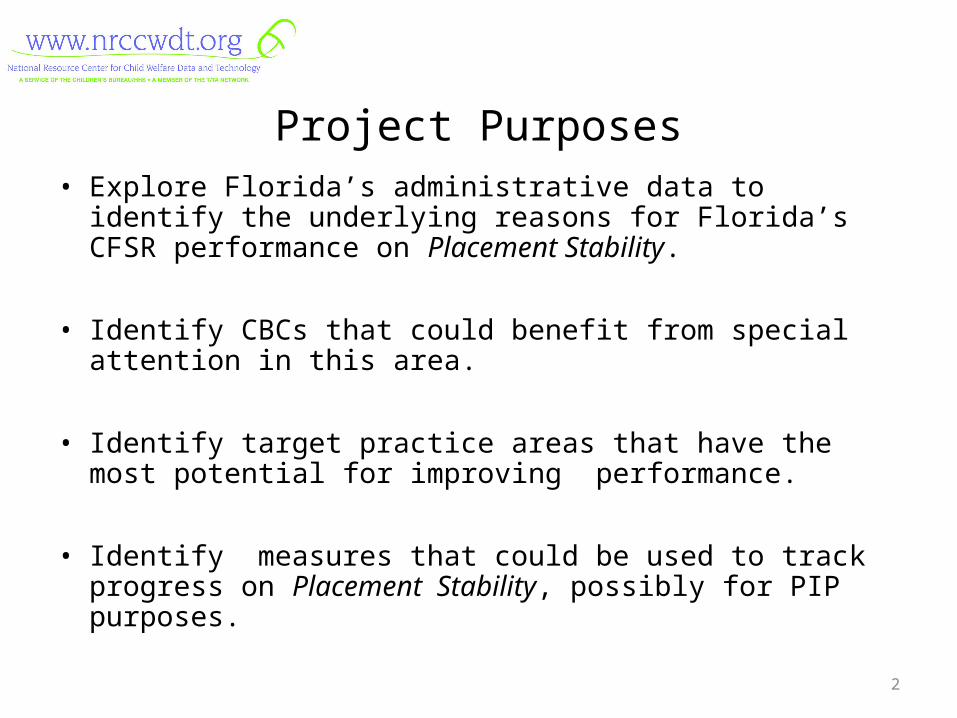
Project Purposes• Explore Florida’s administrative data to identify the
underlying reasons for Florida’s CFSR performance on Placement Stability.
• Identify CBCs that could benefit from special attention in this area.
• Identify target practice areas that have the most potential for improving performance.
• Identify measures that could be used to track progress on Placement Stability, possibly for PIP purposes.
2

– Have data on all children and CBC’s
– Includes factors included in existing research, e.g. type of placement, child demographics, various case characteristics, etc.
– Includes data on timing and trajectory of moves.
Administrative Data: Strengths
3
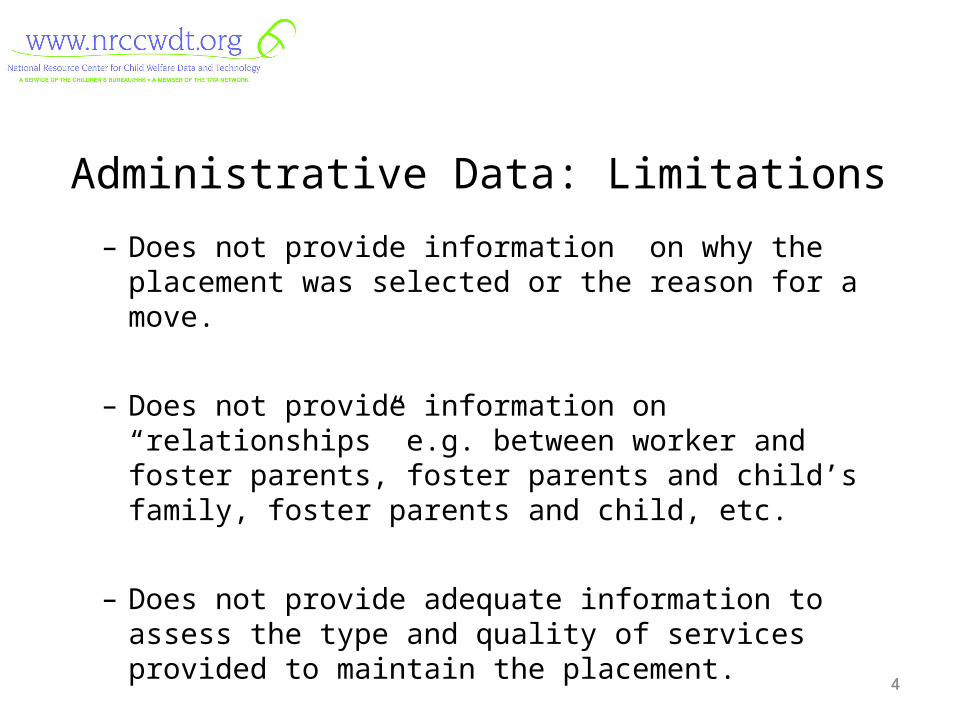
– Does not provide information on why the placement was selected or the reason for a move.
– Does not provide information on “relationships” e.g. between worker and foster parents, foster parents and child’s family, foster parents and child, etc.
– Does not provide adequate information to assess the type and quality of services provided to maintain the placement.
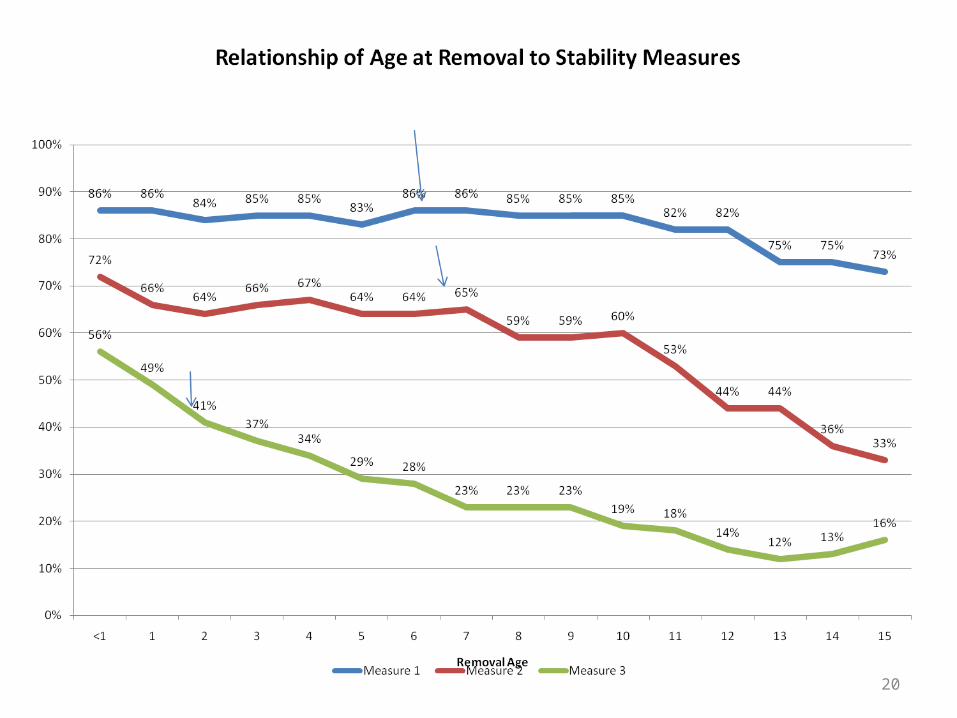
Administrative Data: Limitations
44
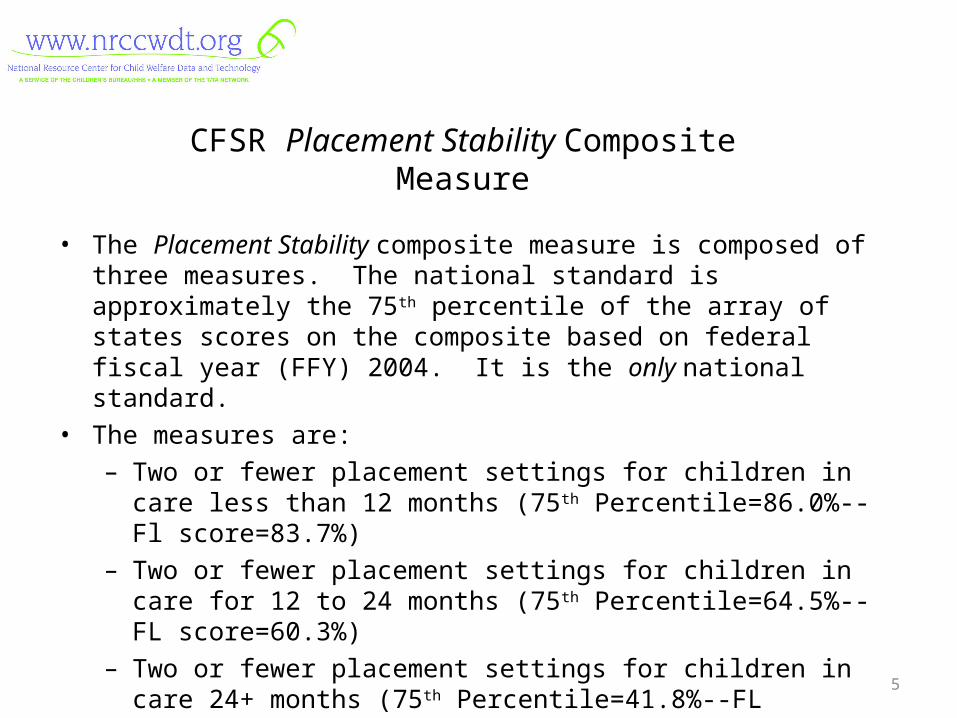
CFSR Placement Stability Composite Measure
• The Placement Stability composite measure is composed of three measures. The national standard is approximately the 75th percentile of the array of states scores on the composite based on federal fiscal year (FFY) 2004. It is the only national standard.
• The measures are:– Two or fewer placement settings for children in care less than 12
months (75th Percentile=86.0%--Fl score=83.7%)– Two or fewer placement settings for children in care for 12 to 24
months (75th Percentile=64.5%--FL score=60.3%)– Two or fewer placement settings for children in care 24+ months (75th
Percentile=41.8%--FL score=31.2%)
5

CFSR Placement Stability Composite Measure(continued)
• The Florida Score is from the July 21, 2009 Data Profile. Florida ranked 29th among the states.
• The 75th Percentile is not a federal standard, but is a benchmark that can be used for comparison.
6
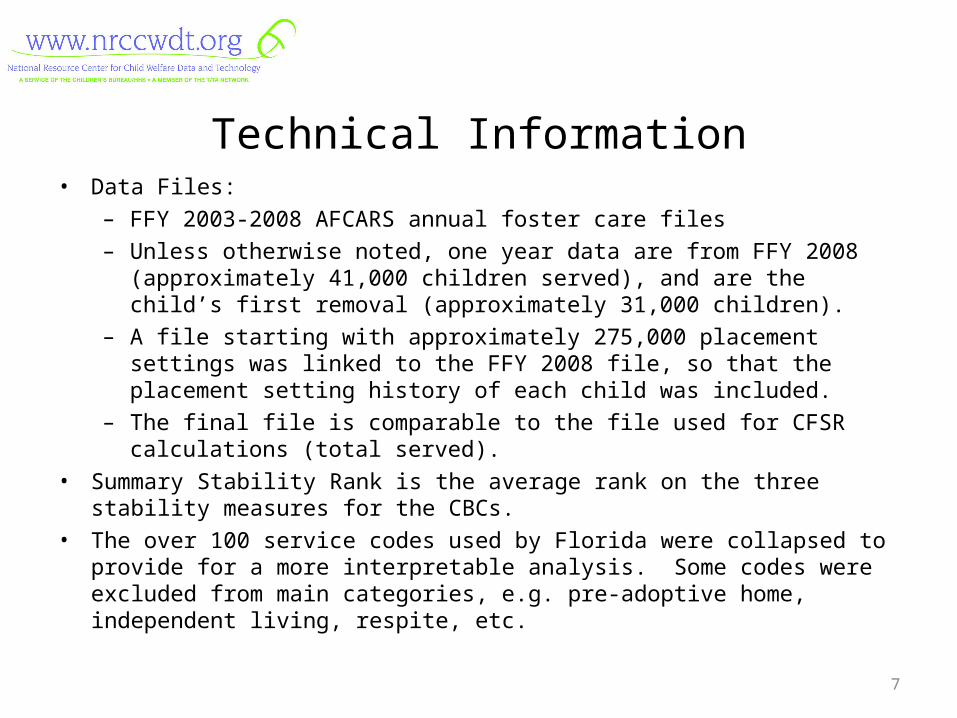
Technical Information• Data Files:
– FFY 2003-2008 AFCARS annual foster care files– Unless otherwise noted, one year data are from FFY 2008 (approximately
41,000 children served), and are the child’s first removal (approximately 31,000 children).
– A file starting with approximately 275,000 placement settings was linked to the FFY 2008 file, so that the placement setting history of each child was included.
– The final file is comparable to the file used for CFSR calculations (total served).• Summary Stability Rank is the average rank on the three stability measures for the
CBCs.• The over 100 service codes used by Florida were collapsed to provide for a more
interpretable analysis. Some codes were excluded from main categories, e.g. pre-adoptive home, independent living, respite, etc.
7
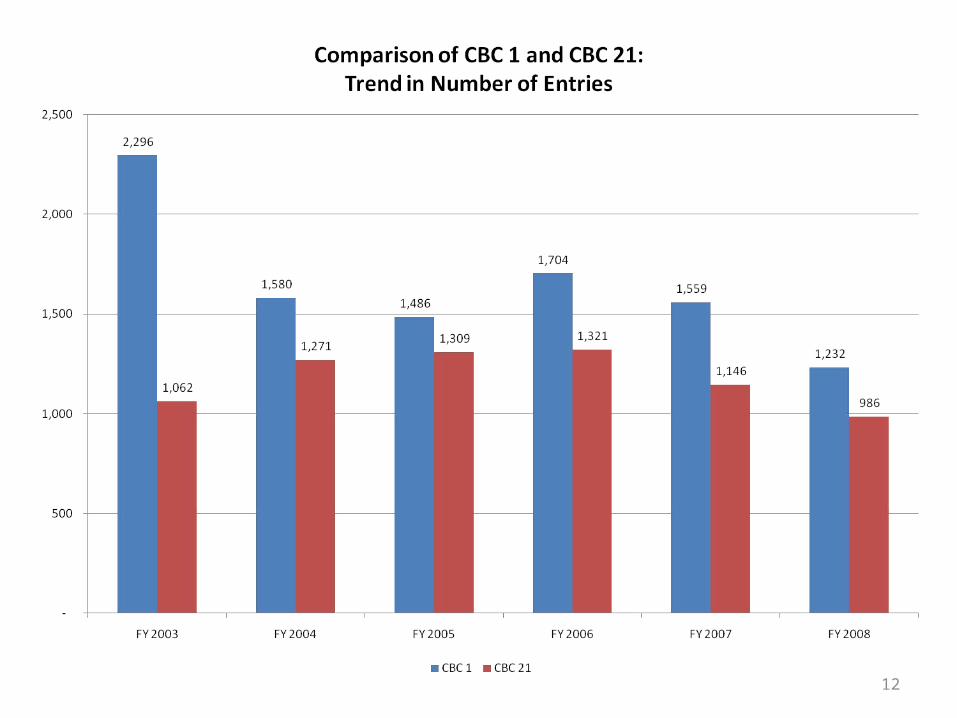
Topics1. Trend in Number of Entries
2. Child Characteristics
3. Case Characteristics
4. Foster Parent Age
5. Movement Timing
6. Movement Origins and Trajectories
8
Trend in Number of Entries
9
10
11
12
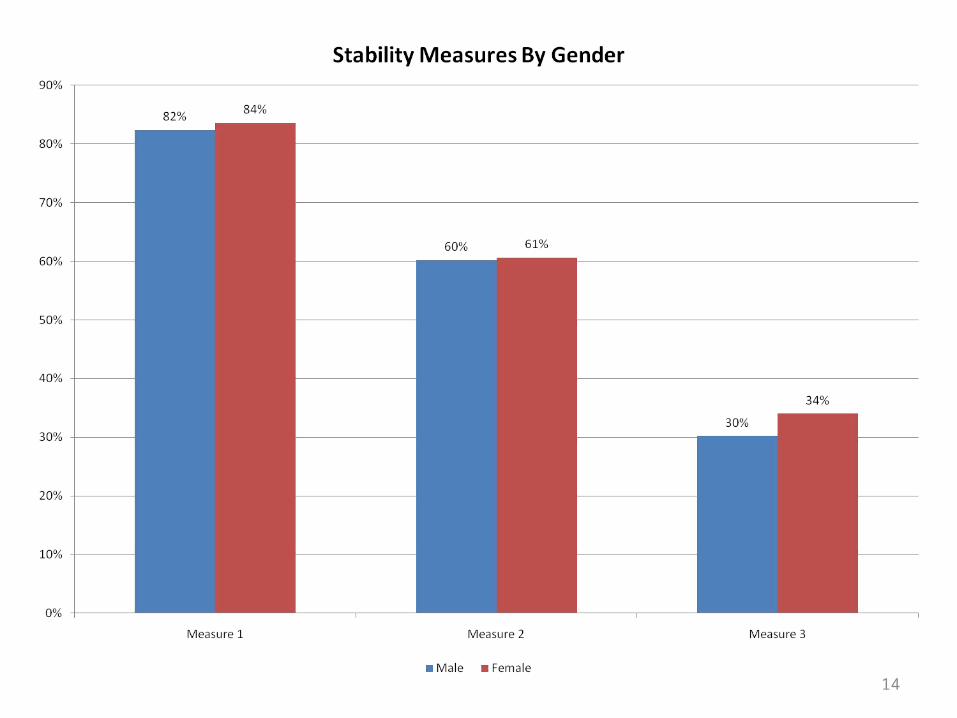
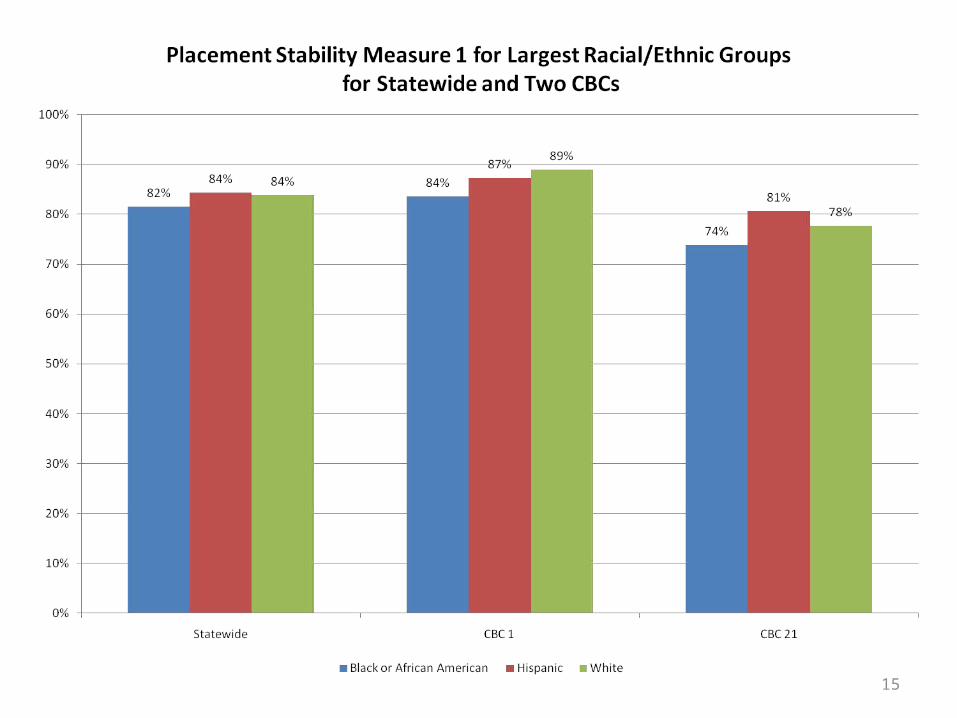
Child Characteristics
13
14
15
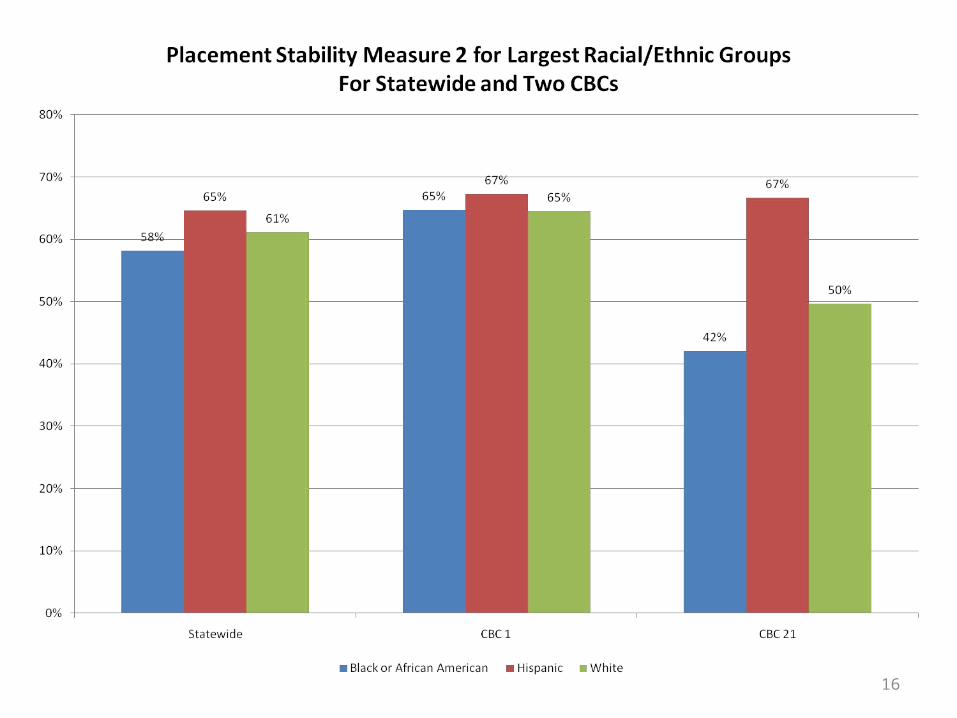
16
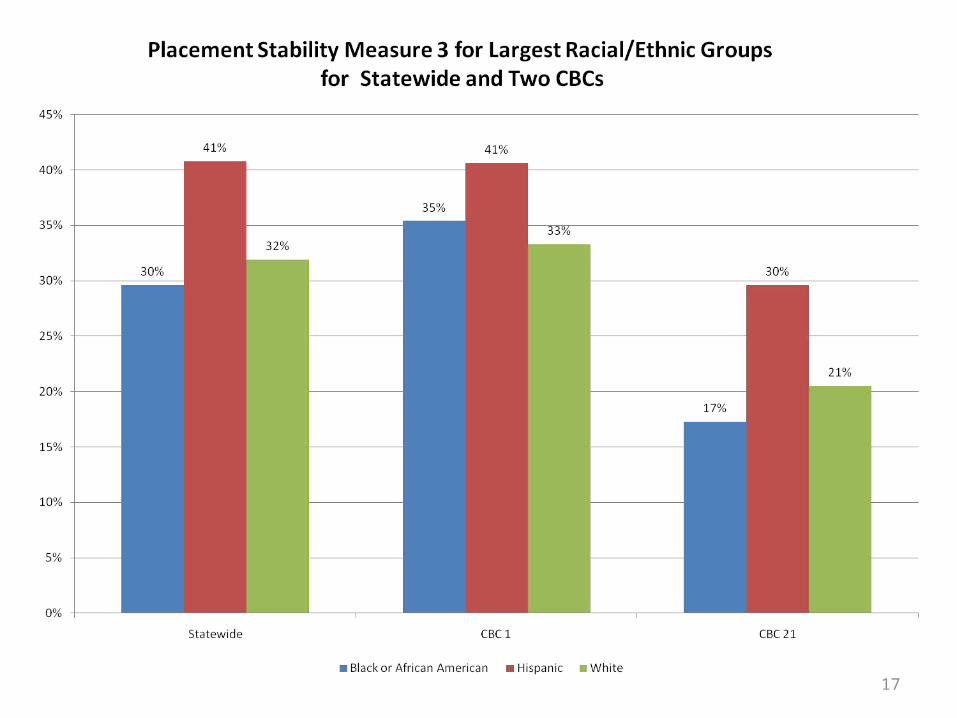
17
18
19
20

Case Characteristics
21

22
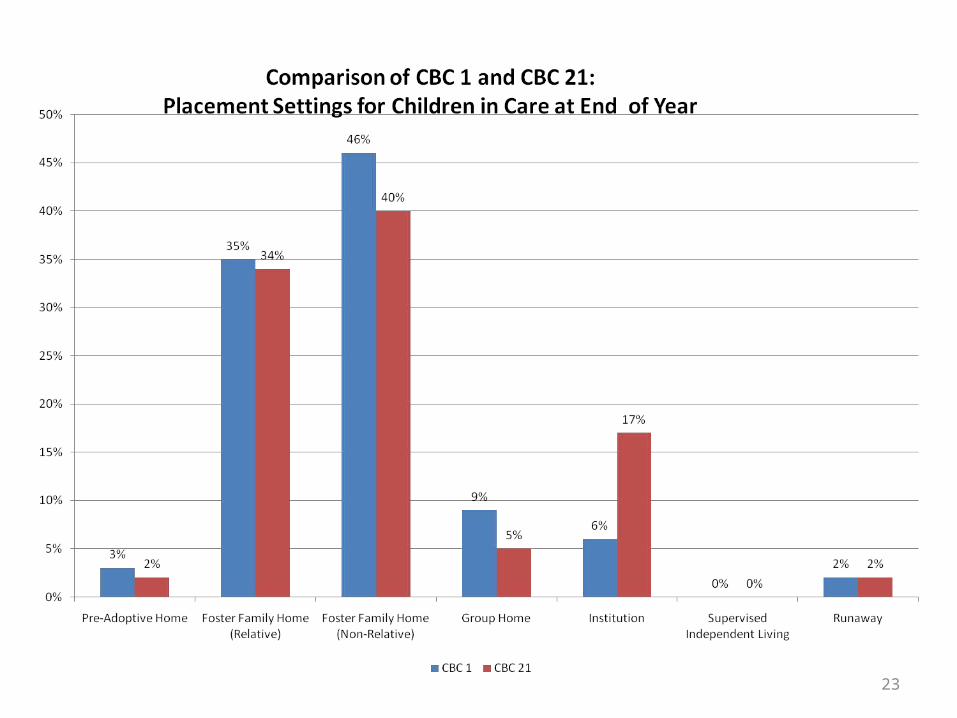
23
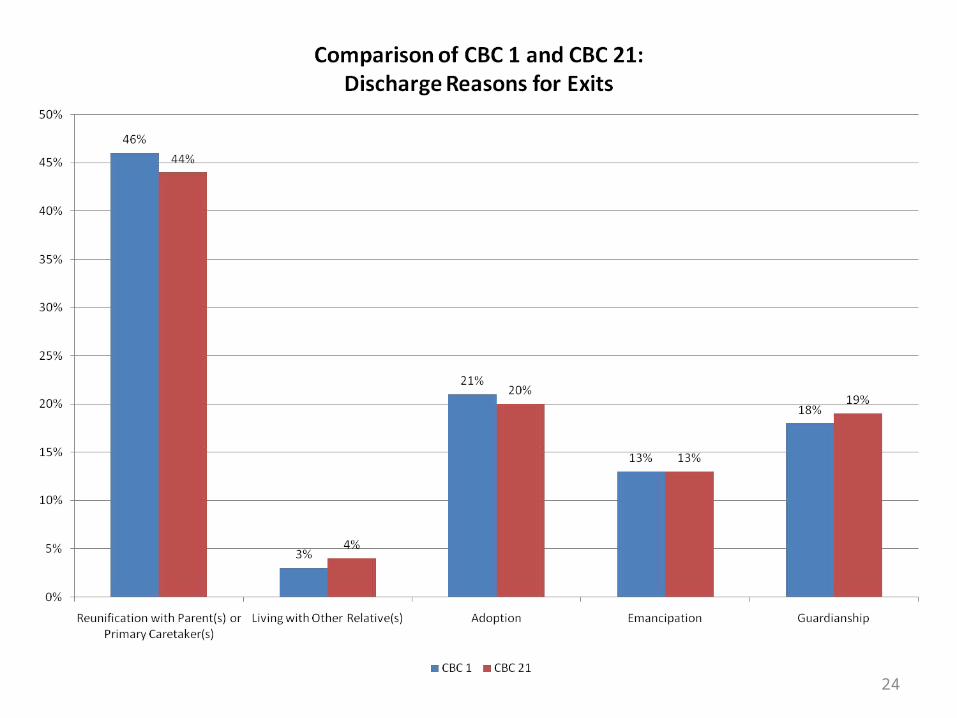
24

Foster Parent Age
25
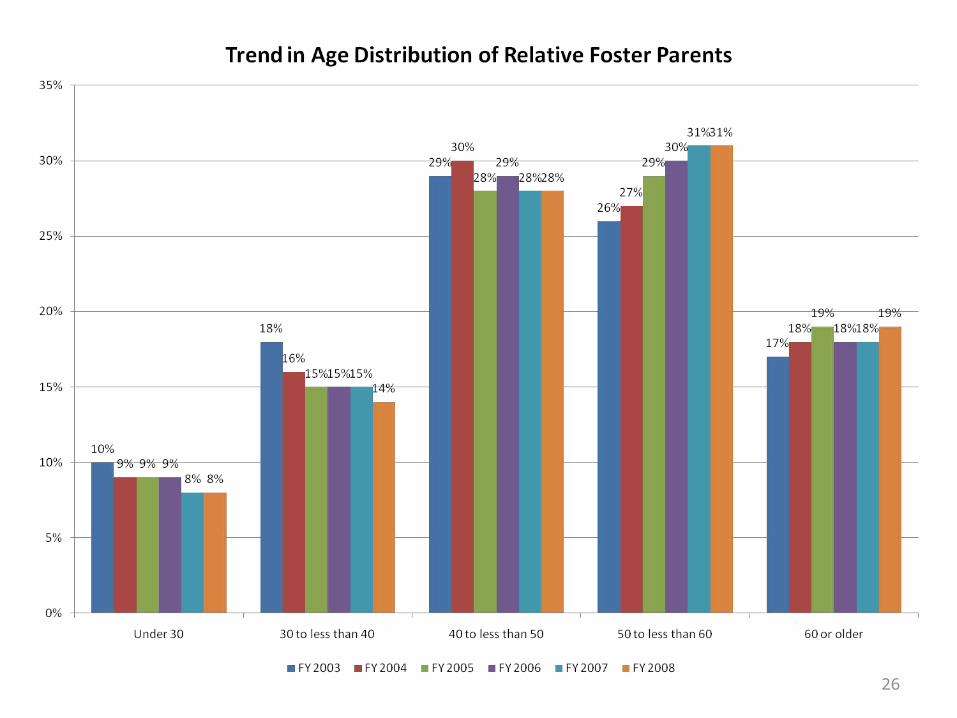
26
Movement Timing
27
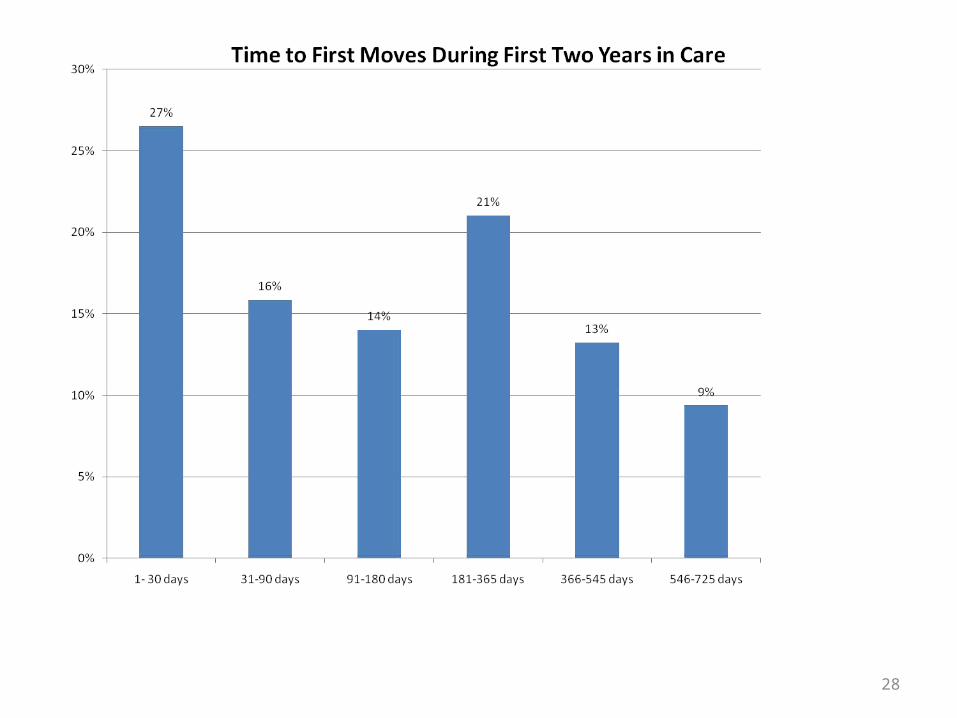
28

29
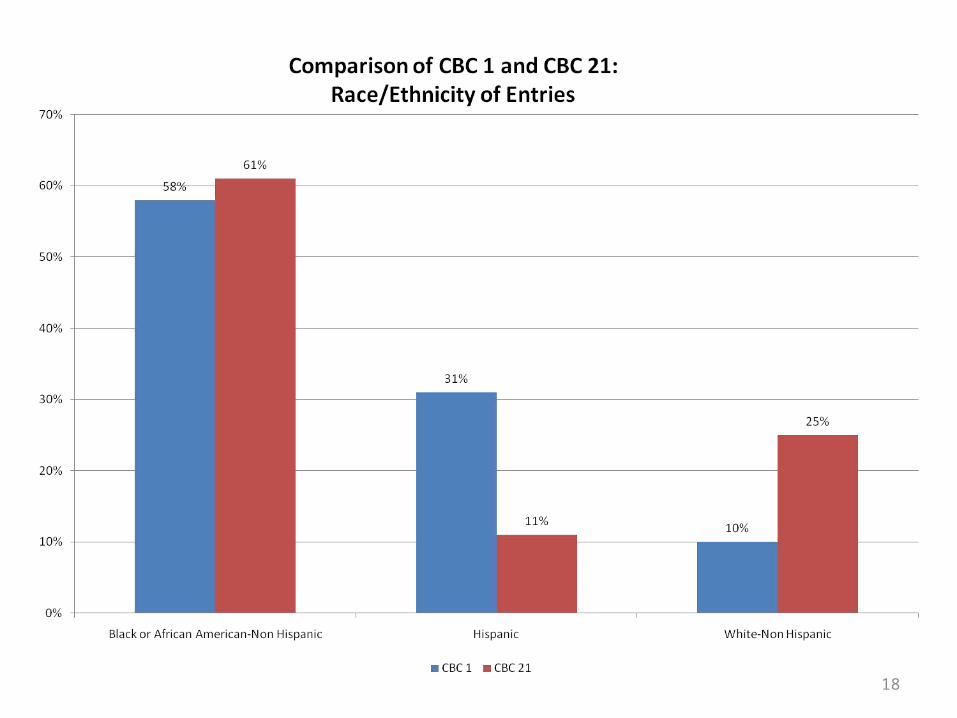
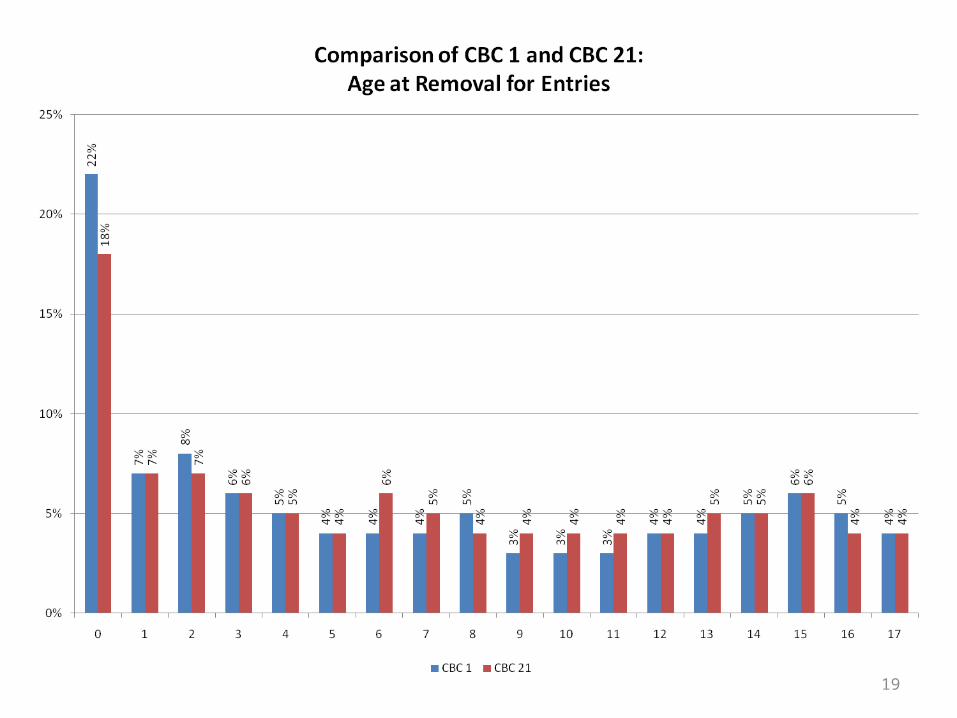
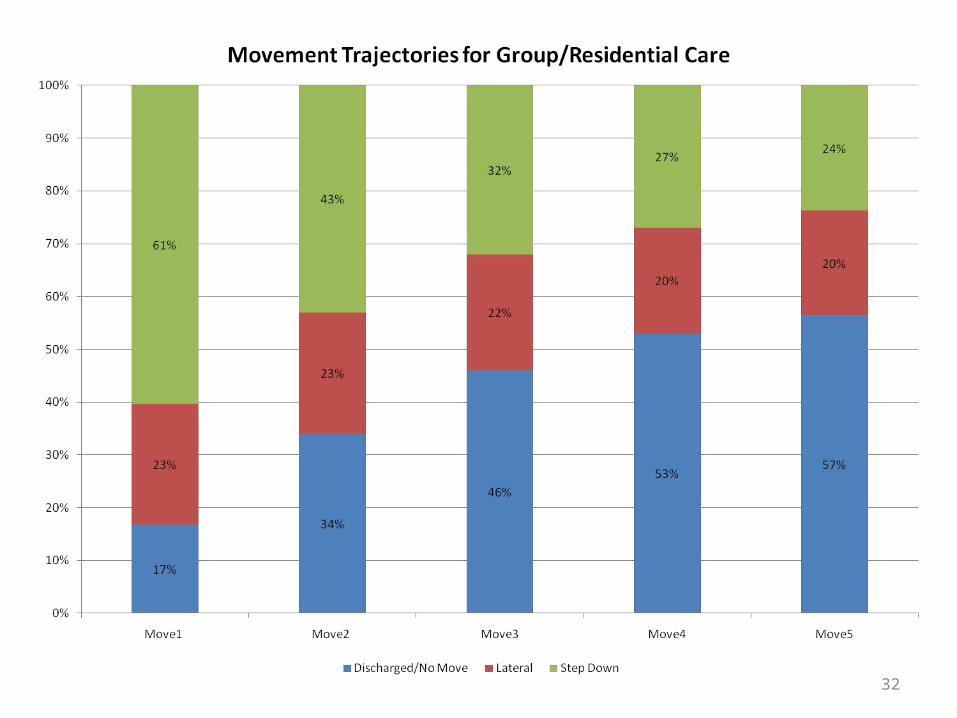
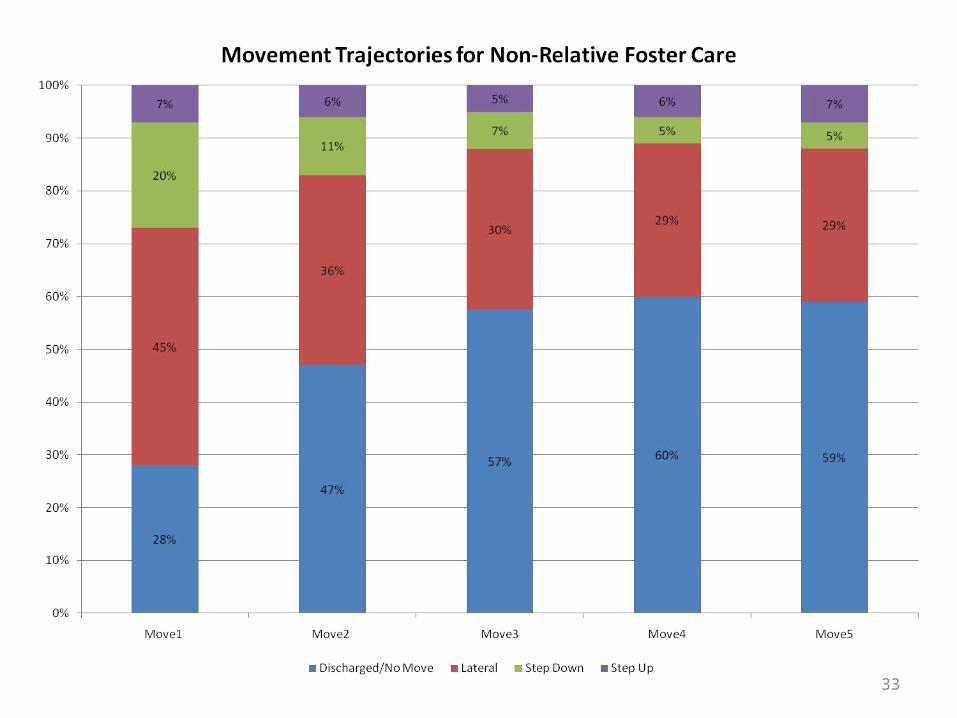
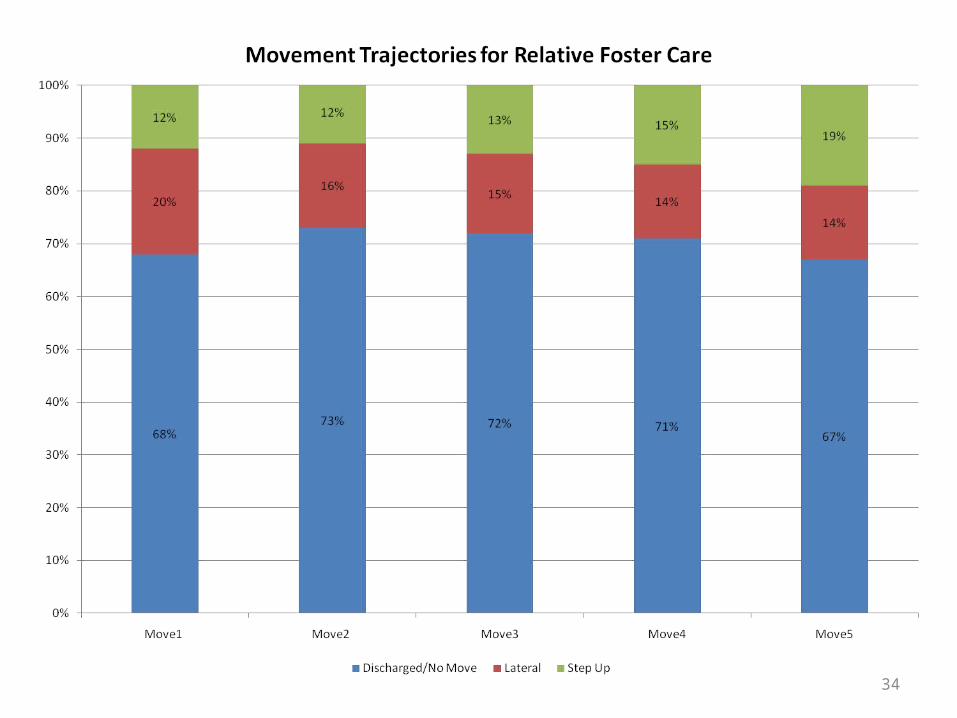
Movement Origins and Trajectoriesfor First Removals
30
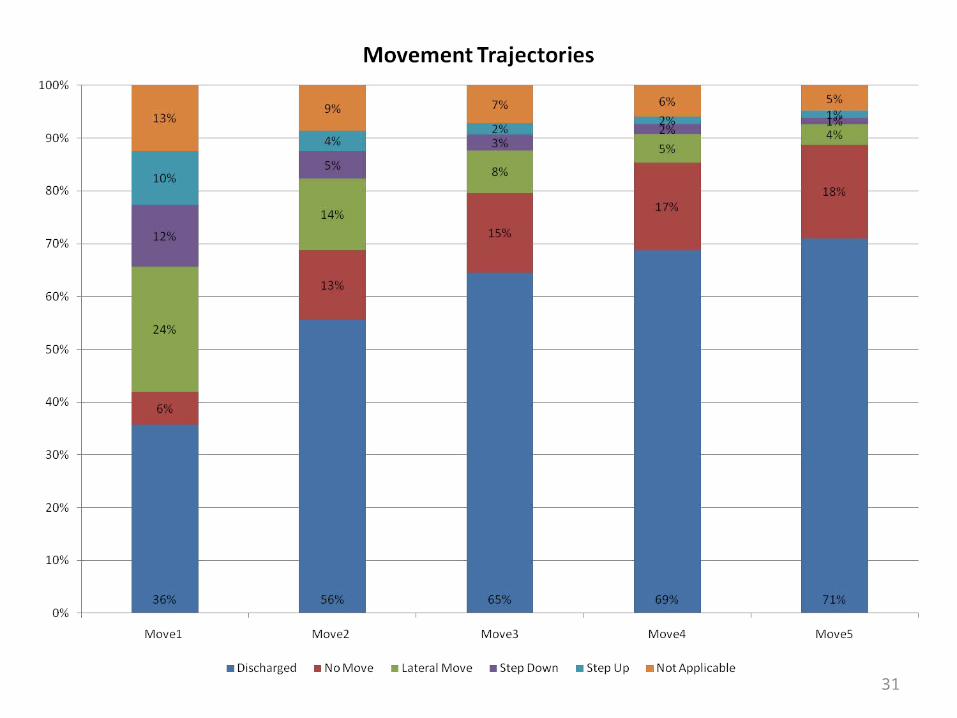
31
32
33
34
Recommendations• Address issues with CBC 21.• Make efforts to increase the removal age for the 75th
percentile for each of the measures by targeting children entering at older ages.
• Decrease the percentage of children with early first moves.• Focus on decreasing non-relative foster care lateral moves.• Increase the percentage of children in non-relative foster
homes in the “no moves” or “discharge “ instead of first moves.
• Potential issue: Aging of relative foster parents.
35