Embed Size (px)
Citation preview

NeuroImage 49 (2010) 3132–3148
Contents lists available at ScienceDirect
NeuroImage
j ourna l homepage: www.e lsev ie r.com/ locate /yn img
Identifying the brain's most globally connected regions
Michael W. Cole a,b,c,⁎, Sudhir Pathak c, Walter Schneider c,d
a Department of Psychology, Washington University in St. Louis, MO 63130, USAb Department of Neuroscience and Center for the Neural Basis of Cognition, University of Pittsburgh, PA 15260, USAc Learning Research and Development Center, University of Pittsburgh, PA 15260, USAd Department of Psychology, University of Pittsburgh, PA 15260, USA
⁎ Corresponding author. Department of Psychology,Louis, MO 63130, USA. Fax: +1 314 935 8790.
E-mail address: [email protected] (M.W. Cole).
1053-8119/$ – see front matter © 2009 Elsevier Inc. Adoi:10.1016/j.neuroimage.2009.11.001
a b s t r a c t
a r t i c l e i n f oArticle history:Received 12 August 2009Revised 7 October 2009Accepted 1 November 2009Available online 10 November 2009
Recent advances in brain connectivity methods have made it possible to identify hubs—the brain's mostglobally connected regions. Such regions are essential for coordinating brain functions due to theirconnectivity with numerous regions with a variety of specializations. Current structural and functionalconnectivity methods generally agree that default mode network (DMN) regions have among the highestglobal brain connectivity (GBC). We developed two novel statistical approaches using resting state functionalconnectivity MRI—weighted and unweighted GBC (wGBC and uGBC)—to test the hypothesis that the highestglobal connectivity also occurs in the cognitive control network (CCN), a network anti-correlated with theDMN across a variety of tasks. High global connectivity was found in both CCN and DMN. The newlydeveloped wGBC approach improves upon existing methods by quantifying inter-subject consistency,quantifying the highest GBC values by percentage, and avoiding arbitrary connection strength thresholding.The uGBC approach is based on graph theory and includes many of these improvements, but still requires anarbitrary connection threshold. We found high GBC in several subcortical regions (e.g., hippocampus, basalganglia) only with wGBC despite the regions' extensive anatomical connectivity. These results demonstratethe complementary utility of wGBC and uGBC analyses for the characterization of the most highly connected,and thus most functionally important, regions of the brain. Additionally, the high connectivity of both theCCN and the DMN demonstrates that brain regions outside primary sensory-motor networks are highlyinvolved in coordinating information throughout the brain.
© 2009 Elsevier Inc. All rights reserved.
Introduction
The brain is thought to have evolved from simple reflex circuits,bestowing flexibility on behavior by integrating specialized brainregions into coordinated networks. Perhaps reflecting our especiallyflexible behavioral repertoire, the human brain is estimated to havehundreds of specialized brain regions (Van Essen, 2004). However, itis unknown how these specialized regions are integrated so behaviorcan be coordinated. Recent research has found that some regions havemuch higher global brain connectivity (GBC) than others, perhapsreflecting their role in integrating brain activity in order to coordinatecognition and behavior (Achard et al., 2006; Buckner et al., 2009;Hagmann et al., 2008; Heuvel et al., 2008; Salvador et al., 2005a;Sporns et al., 2007).
Existing GBC methods, using both anatomical (Hagmann et al.,2008) and functional (Buckner et al., 2009) connectivity, haveidentified regions in the default mode network (DMN) as having thehighest GBC. This high connectivity may reflect connections necessaryto implement the wide variety of cognitive functions the network is
Washington University in St.
ll rights reserved.
involved in. Consistentwith this notion, we hypothesized that anotherlarge-scale network implementing a variety of cognitive function, thecognitive control network (CCN), also has among the highest GBC.
The CCN has been reported in many studies of cognitive controlprocesses, and is likely involved in coordinating networks of brainregions during novel and non-routine tasks (Cole and Schneider, 2007;Dosenbach et al., 2006). TheDMNhas been reported in studies of restingstate activity, suggesting it is active “by default” (Raichle et al., 2001).However, the DMN is engaged bymindwandering (Mason et al., 2007),prospective and retrospective self-reflection (D'Argembeauet al., 2008),andmemory retrieval (Buckner et al., 2005), suggesting that the ‘defaultmode’ involves ongoing processing of information for relevance to theself. The CCN is thought to consist of dorsolateral prefrontal cortex(DLPFC), rostrolateral prefrontal cortex (RLPFC), dorsal–caudal anteriorcingulate cortex (ACC), pre-supplementary motor area (pre-SMA),inferior frontal junction (IFJ), posterior parietal cortex (PPC), pre-motorcortex (PMC), and anterior insula cortex (AIC). The DMN is thought toconsist of posterior cingulate cortex (PCC), rostral anterior cingulatecortex (rACC), anterior temporal lobe (aTL), superior frontal cortex(SFC), and inferior parietal cortex (IPC). Importantly, the CCN and DMNare anti-correlated during task performance and uncorrelated at rest(Fox et al., 2005; Murphy et al., 2008) (Fig. 1A), suggesting they arerelatively independent networks. We predicted, given their

Fig. 1.Hypothesized globally connected circuits. (A) Previous research showed evidence for two large anti-correlated networks in cortex (Fox et al., 2005). Importantly, the functions ofthese networks suggest that theymay have high global brain connectivity (GBC). The cognitive control network (CCN; yellow/red) and default mode network (DMN; blue/green) arethought to be involved in awide variety of cognitive tasks. The depicted number scales are population z-scores (see Fox et al., 2005). Figure adapted fromFox et al. (2005). (B) Extensiveworkwith animalmodels, and somewith humans, has suggested thatmidbrain neurotransmitter systems project widely throughout the brain (Herlenius and Lagercrantz, 2004), andtherefore are likely to have highGBC. Figure adapted fromHerlenius and Lagercrantz (2004) and Squire et al. (2003). (C) Evidence from anatomical studies of basal ganglia (BG) showsthat loops are formed throughout cortex (not just motor cortex (Middleton and Strick, 1994)), suggesting high GBC for the parts of BG looping with high GBC cortical regions.Anatomical loops have also been found between cerebellum and nearly all of cortex (Middleton and Strick, 1994), via the pons and thalamus, suggesting parts of cerebellum have highGBC as well. Figure adapted from Kandel et al. (2000).
3133M.W. Cole et al. / NeuroImage 49 (2010) 3132–3148
involvement in a wide variety of complex cognitive behaviors that theywould both have among the highest GBC in the human brain.
In addition to these two cortical networks, a variety of subcorticalbrain regions have been found in animal models to have high globalconnectivity. We predicted that these regions would also show highglobal connectivity in humans. One such region is amygdala, which isthought to integrate sensory and internal-state information for limbicprocessing (Barbas, 2000; Jolkkonen and Pitkänen, 1998). Similarly,hippocampal cortex (HC) is thought to integrate information from awide variety of sources in order to encode entire episodes (Eichen-baum et al., 2007). Also, several midbrain neurotransmitter (MNT)regions such as locus coeruleus and substantia nigra are thought toproject to a variety of regions throughout the brain (Fig. 1B)(Herlenius and Lagercrantz, 2004) and are thought to play importantroles in motivation and arousal.
Another region, thalamus, includes several nuclei with differingconnectivity profiles (Behrens et al., 2003), suggesting that only parts ofitmighthavehighly extensive connectivity. Similarly, basal ganglia (BG)
and cerebellum connect with cortex via topographic loops (Kelly andStrick, 2003) (Fig. 1C), suggesting that some loops would bestowmorewide-spread connectivity on parts of the structures than others. Forthese reasons, we predicted that amygdala and HC would have highglobal connectivity, aswell as portions of thalamus, BG, and cerebellum.
Functional MRI (fMRI) is an increasingly important method formeasuring functional connectivity non-invasively. Among the func-tional connectivity methods developed with fMRI, the decade-oldmethod of resting state functional connectivity MRI (rs-fcMRI) isunique in its ability to capture functional connectivity largelyindependent of any particular brain state. Evidence for this comesfrom a study of anesthetized monkeys (Vincent et al., 2007) thatshowed rs-fcMRI patterns similar to humans at rest, as well as a studyof rs-fcMRI during both task and rest in humans (Fair et al., 2007).Though further research is necessary, rs-fcMRI is thought to be basedon very infrequent (∼0.01 to 0.1 Hz) bursts of spiking activity in cortexthat drive correlated activity through brain networks (Golanov et al.,1994; Kannurpatti et al., 2008).

3134 M.W. Cole et al. / NeuroImage 49 (2010) 3132–3148
In previous work, we observed that, since the entire brain is anetwork, the term brain network was ill defined. We developed aworking definition of brain network as a set of regions with greaterinternal connectivity than external connectivity (Cole and Schneider,2007). We were able to show using rs-fcMRI that the CCN fits thiscriterion. Importantly, we also found that the CCN is significantlymore globally connected than the rest of the brain on average. Herewe sought to replicate this finding with more refined methods, andalso to determine what other brain regions exhibit high GBC. Asoutlined above, we predicted that the CCN, DMN, and a variety ofsubcortical regions would be among the most highly globallyconnected in the brain, perhaps reflecting their roles in coordinatingcomplex cognitive behaviors.
Recently, another GBC method was developed that combinesgraph theory and rs-fcMRI with a whole-brain (voxel-wise) analysisapproach (Buckner et al., 2009). Unlike the GBCmethod developed byCole and Schneider (2007), the Buckner et al. (2009) method usesbinary connections in an unweighted graph. In order to implementthis unweighted GBC (uGBC) method a connection strength thresholdis necessary which, unlike the weighted GBC (wGBC) method,involves removing connections with lower strength. Since wGBC
Fig. 2. GBC analysis methods. The GBC procedure based on Cole and Schneider (2007) is outright. GBC analysis involves assigning each graymatter voxel with its GBC, consisting either oabove a certain threshold (uGBC).
does not require thresholding of the connection strengths, wepredicted that it might reveal globally connected regions with manylow-strength connections (such as modulatory subcortical regions;e.g., locus coeruleus) that might be removed by uGBC thresholding.
In order to compare the uGBC and wGBC methods, we imple-mented the whole-brain uGBC method (as developed by Buckner etal., 2009) and modified the wGBC method (as developed by Cole andSchneider, 2007) to also include whole-brain maps. We also modifiedboth methods to be more statistically quantitative and accessible to awider variety of researchers. Specifically, we applied widely usedparametric statistical methodology to quantify inter-subject consis-tency, as well as a novel and easily interpretable thresholdingapproach that identifies the top percentages of voxels in terms ofglobal connectivity. Thresholding the maps in terms of top percentageGBC allows comparison of the methods using a common metricdespite differences between them.
Amajormotivation behind the development of thesemethodswasto provide alternatives to graph theory for identifying the brain's mostglobally connected regions. Though graph theory has been quiteproductive in characterizing brain networks thus far (Bullmore andSporns, 2009), as a branch of mathematics it typically does not
lined on the left, while the procedure based on Buckner et al. (2009) is outlined on thef the average correlation with all other gray matter voxels (wGBC) or the count of voxels

3135M.W. Cole et al. / NeuroImage 49 (2010) 3132–3148
quantify the statistical certainty of a given finding (Deuker et al.,2009; Kramer et al., 2009). Here we used statistical methods toquantify between-subject certainty, as well as the degree to whichvoxels are globally connected (in terms of percentages). We see thesenew approaches as complementary to graph theory, with thepotential to increase confidence in brain network findings byacknowledging and quantifying the variability and graded nature ofthe data underlying those findings.
Materials and methods
Participants
We included 14 right-handed subjects (7 male, 7 female), aged 19to 29 (mean age 22) in the study. These subjects were recruited fromthe University of Pittsburgh and surrounding area. Subjects wereexcluded if they had any medical, neurological, or psychiatric illness,
Fig. 3. Top percent wGBC regions. As hypothesized, the entire set of CCN (red) and DMN (bsubcortical regions hypothesized to have high GBC show high wGBC. These regions include am(possibly locus coeruleus or the raphenucleus), lateral thalamus, and themedial dorsal nucleuhighGBC. Finally, a large swath of cerebellum consistentwith cerebellar–prefrontal circuits shis higher than an average correlation of 0 across subjects.
any contraindications for MRI scans, or were left-handed. All subjectsgave informed consent.
MRI data collection
Image acquisition was carried out on a 3T Siemens Trio MRIscanner. Thirty-eight transaxial slices were acquired every 2000 ms(FOV: 205 mm, TE: 29 ms, Flip angle: 90°, voxel dimensions:3.2×3.2×3.2 mm), with a total of 300 echo-planar imaging (EPI)volumes collected per run. Siemens's implementation of generalizedautocalibrating partially parallel acquisition (GRAPPA) was used todouble the image acquisition speed (Griswold et al., 2002). Three-dimensional anatomical MP-RAGE images and T2 structural in-planeimages were collected for each subject. One 10-min resting fMRI runwas collected just after collecting anatomical images and beforesubjects performed any experimental tasks. A static white screen witha black central fixation cross was projected onto a screen visible to
lue) regions are among the most globally connected in the brain. Further, unlike uGBC,ygdala, hippocampal cortex (HC), the pons, a midbrain neurotransmitter (MNT) region
s.Within thebasal ganglia, the caudate andglobuspallidus (extending intoputamen)hadowed highGBC. Themapwas thresholded based on statistical confidence that each voxel

3136 M.W. Cole et al. / NeuroImage 49 (2010) 3132–3148
each subject via a mirror mounted inside the MRI scanner. Subjectswere instructed to keep their eyes open (to avoid known eyes-closedoscillations in visual cortex (Goldman et al., 2002) and to help thesubjects avoid falling asleep) with instructions to stay relaxed witheyes still.
Preprocessing
Freesurfer (Dale et al., 1999; Fischl et al., 2002; Fischl et al., 2004)was used with each subject's MP-RAGE to segment gray matter, whitematter, and ventricle voxels. Following this step, fMRI preprocessing,analysis, and visualization methods as implemented in AFNI andSUMA (Cox, 1996) were used. Activation maps were visualized eitheron a three-dimensional surface (using SUMA), or via slices with theactivation interpolated to the template brain resolution (cubic splineinterpolation; 1 mm3). See Fig. 2 for an outline of the preprocessingsteps.
Slice timing correction and motion correction procedures wereused. Temporal filtering was applied with 0.009b f(Hz) b0.08 in orderto aid removal of nuisance cardiac and respiratory signals. Time serieswere then extracted from white matter and ventricle voxels (withsome distance from the gray matter in order to ensure no overlap),and linear regression was used to remove any correlations betweenthe gray matter voxels and these nuisance covariates (as well as theirderivatives and the motion parameters). For the uGBC maps, theglobal signal was regressed out in order to replicate Buckner et al.(2009), who used global signal regression to remove potentiallyspurious physiological correlations. For the wGBC maps, the globalsignal was not regressed out in order to avoid potentially artifactualanti-correlations (Murphy et al., 2008), and also because this was asignal of interest. Note that both types of maps were qualitativelysimilar whether or not global signal regression was used. At present,there is some controversy regarding whether or not to perform global
Table 1Top 5% wGBC voxel clusters.
Cluster labels Hemisphere Voxels (3.2 mm3) % Gray matter T-statisti
Cerebellum (posterior) Both 904 2.14 7.3819PCC Both 142 0.34 6.9067ACC/pre-SMA Right 118 0.28 7.1707Putamen Left 73 0.17 7.0656MOG Left 46 0.11 6.9984Amygdala Left 37 0.09 7.2606IPL Right 36 0.09 6.8059Caudate Right 32 0.08 6.822rACC Left 32 0.08 6.7971Amygdala Right 27 0.06 6.9174SFC Left 25 0.06 6.9676aTL Right 21 0.05 6.7582Parahippocampus Right 21 0.05 7.0773RLPFC Right 21 0.05 6.8653SMA Right 21 0.05 7.136RLPFC Left 17 0.04 6.6956MTG Left 17 0.04 7.1264Orbitofrontal cortex Right 16 0.04 6.811MOG Right 16 0.04 6.9992IFJ Right 16 0.04 6.6887Orbitofrontal cortex Right 15 0.04 7.1105rACC Left 15 0.04 7.1157RLPFC Right 15 0.04 6.7635Cerebellum (tonsil) Right 14 0.03 7.0111Cerebellum (tonsil) Left 14 0.03 6.8211Inferior frontal gyrus Right 14 0.03 6.8487Cerebellum (dentate) Right 12 0.03 7.0254AIC Right 12 0.03 6.9943IPL Left 12 0.03 6.9457PPC (precuneus) Right 11 0.03 6.6612Cerebellum (culmen) Right 10 0.02 6.7707Fusiform Left 10 0.02 6.7263
Cluster minimum for inclusion in table=10 voxels. The percentage of gray matter included inare in clusters with fewer than 10 voxels).
signal regression (Birn et al., 2006; Fox et al., 2009). We included aGBC method that uses global signal regression (uGBC) and one thatdoes not (wGBC) in order to verify that any findings common to thetwo methods are independent of the methodological choicesregarding global signal regression.
For the wGBC preprocessing, all voxels outside gray matter weremasked out, while this step was not performed for uGBC since non-gray matter voxels (which have low correlations) are thresholded outas the uGBC maps are calculated. Further, including the non-graymatter values in the wGBC map would artificially lower thecorrelation averages, reducing the accuracy of the reported grandmean wGBC value. For similar reasons, spatial smoothing was notperformed during wGBC preprocessing in order to avoid anycontamination of the signals by non-gray matter sources prior towGBC analysis. Smoothing (4 mm3 FWHM) was applied for the uGBCpreprocessing in order to replicate the method used by Buckner et al.(2009). Applying the spatial smoothing before and after uGBCprocessing produced qualitatively similar maps.
Weighted global brain connectivity (wGBC) analysis
See the middle left portion of Fig. 2 for an outline of wGBCanalysis. We developed the wGBC analysis method initially usingMATLAB (The MathWorks, Natick, MA), switching to a moreefficient function (AFNI's 3dTcorrMap) for the findings reportedhere. wGBC analysis involves seed-based correlation of each graymatter voxel with all other gray matter voxels. These values arethen averaged together and the resulting value (i.e., that voxel'swGBC) is assigned to that voxel in a new brain map. Fisher's ztransformation is applied to each (Pearson's r) correlation prior toaveraging, and then converted back to r-values afterward. Thisprocess repeats for all gray matter voxels, resulting in a single brainmap per subject reflecting wGBC.
c Talairach coord: x Talairach coord: y Talairach coord: z Brodmann areas
−4 −62.2 −28.2 –
1.2 −55.3 32.4 31, 7, 238.6 24.5 43.1 32, 24, 6, 8
−25.9 −7.6 13.1 –
−34.6 −81.3 20.7 19, 18−22.4 −6.3 −7.1 –
41 −70.2 32.8 3910.9 9.1 3.1 –
−6.4 40.3 19.4 3225.8 1.1 −10.3 –
26.3 26.2 35.2 8, 943.7 5.7 −24.3 21, 22, 2019.1 −33.8 0.3 2738.2 43.9 7.6 106.8 −9.6 59.6 6
−32.3 49 5.9 10−44.2 −62.3 4.3 37
34.6 31.4 −2.2 47, 1141.6 −76.8 8.4 1947.4 13.2 30 9, 621.9 27.7 −4.7 11, 479.6 51.4 7.5 10, 32
35.5 42.7 21.3 106.9 −42.4 −38.5 –
−3.6 −52.8 −37.8 –
53.7 6 19.2 44, 620.3 −49.6 −26.3 –
37.3 26.8 3.9 13, 45, 47−46.4 −58.4 23.1 39
8.3 −51.3 61.3 79.3 −29.7 −20.1 –
−43.5 −60.4 −13 37
the table equals 4.24%, due to the cluster minimum threshold (i.e., the remaining 0.76%
3137M.W. Cole et al. / NeuroImage 49 (2010) 3132–3148
In order to perform a group analysis, each subject's wGBCmapwasfit to a Talairach (Talairach, 1988) template (AFNI's version of‘colin27’) using a 12 degrees-of-freedom affine transformation.Spatial smoothing (6 mm3 FWHM) was then applied to the GBCmap in order to help account for intersubject variability in the locationand size of functional regions. Potential contamination across hemi-spheres due to spatial smoothing was avoided by applying smoothingto each hemisphere separately. The grand mean wGBC value for eachsubject was determined by averaging all the wGBC values across allgray matter voxels prior to Talairaching and spatial smoothing(reflecting the average wGBC across the brain).
The wGBC statistical model
A non-repeated measures ANOVA (with subjects as a randomeffect) was used to test hypotheses regarding the wGBC maps acrossthe group. This group ANOVA compared each voxel's wGBC to zero,resulting in a statistical map quantifying the probability that there is apositive linear relationship between each voxel and all other voxels onaverage. The assumption made by the ANOVA of an approximatelynormal distribution between subjects was verified using normal Q–Qplots for the grand mean wGBC and the mean wGBC for an exampleregion (PCC). ANOVA p-values for all statistical maps were calculatedusing the false discovery rate (FDR) correction for multiple compar-isons (Genovese et al., 2002), and region identification was aidedusing the Talairach Daemon database (Lancaster et al., 2000) asimplemented in AFNI.
The ‘top percentage’ threshold approach was developed in orderto identify and quantify the voxels with the highest GBC. Thesethresholds were determined by raising the ANOVA threshold untilthe desired percentage (e.g., 5%) of the total gray matter voxels
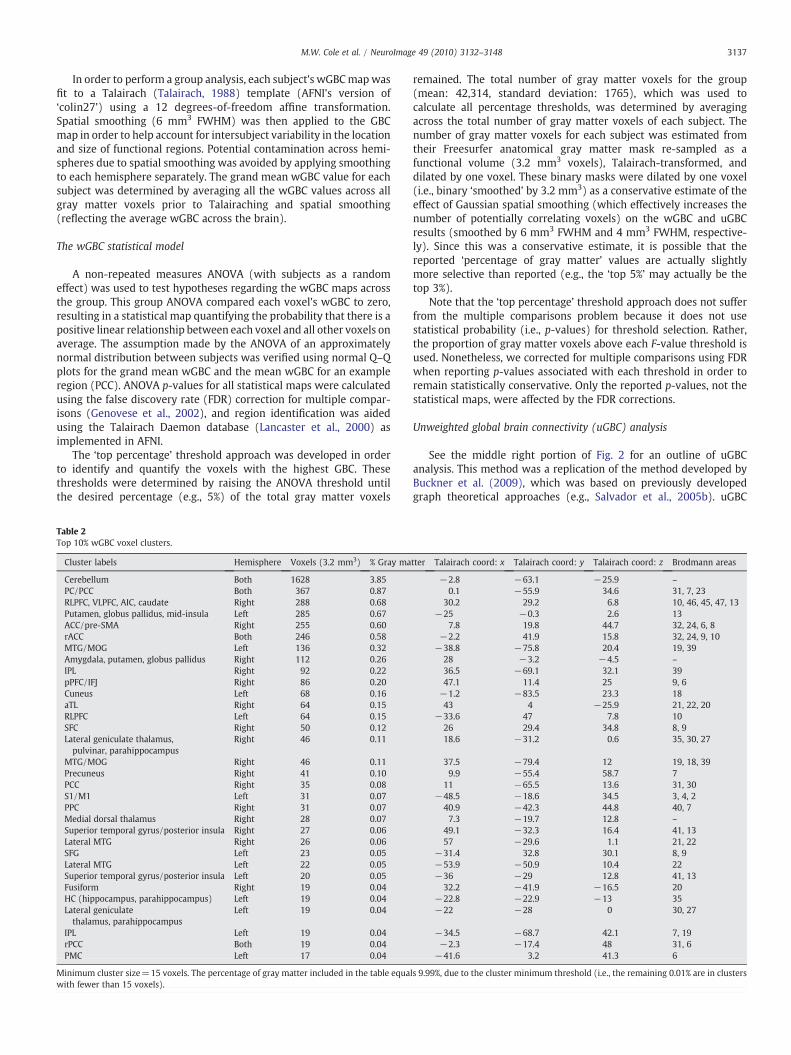
Table 2Top 10% wGBC voxel clusters.
Cluster labels Hemisphere Voxels (3.2 mm3) % Gray ma
Cerebellum Both 1628 3.85PC/PCC Both 367 0.87RLPFC, VLPFC, AIC, caudate Right 288 0.68Putamen, globus pallidus, mid-insula Left 285 0.67ACC/pre-SMA Right 255 0.60rACC Both 246 0.58MTG/MOG Left 136 0.32Amygdala, putamen, globus pallidus Right 112 0.26IPL Right 92 0.22pPFC/IFJ Right 86 0.20Cuneus Left 68 0.16aTL Right 64 0.15RLPFC Left 64 0.15SFC Right 50 0.12Lateral geniculate thalamus,pulvinar, parahippocampus
Right 46 0.11
MTG/MOG Right 46 0.11Precuneus Right 41 0.10PCC Right 35 0.08S1/M1 Left 31 0.07PPC Right 31 0.07Medial dorsal thalamus Right 28 0.07Superior temporal gyrus/posterior insula Right 27 0.06Lateral MTG Right 26 0.06SFG Left 23 0.05Lateral MTG Left 22 0.05Superior temporal gyrus/posterior insula Left 20 0.05Fusiform Right 19 0.04HC (hippocampus, parahippocampus) Left 19 0.04Lateral geniculatethalamus, parahippocampus
Left 19 0.04
IPL Left 19 0.04rPCC Both 19 0.04PMC Left 17 0.04
Minimum cluster size=15 voxels. The percentage of gray matter included in the table equawith fewer than 15 voxels).
remained. The total number of gray matter voxels for the group(mean: 42,314, standard deviation: 1765), which was used tocalculate all percentage thresholds, was determined by averagingacross the total number of gray matter voxels of each subject. Thenumber of gray matter voxels for each subject was estimated fromtheir Freesurfer anatomical gray matter mask re-sampled as afunctional volume (3.2 mm3 voxels), Talairach-transformed, anddilated by one voxel. These binary masks were dilated by one voxel(i.e., binary ‘smoothed’ by 3.2 mm3) as a conservative estimate of theeffect of Gaussian spatial smoothing (which effectively increases thenumber of potentially correlating voxels) on the wGBC and uGBCresults (smoothed by 6 mm3 FWHM and 4 mm3 FWHM, respective-ly). Since this was a conservative estimate, it is possible that thereported ‘percentage of gray matter’ values are actually slightlymore selective than reported (e.g., the ‘top 5%’ may actually be thetop 3%).
Note that the ‘top percentage’ threshold approach does not sufferfrom the multiple comparisons problem because it does not usestatistical probability (i.e., p-values) for threshold selection. Rather,the proportion of gray matter voxels above each F-value threshold isused. Nonetheless, we corrected for multiple comparisons using FDRwhen reporting p-values associated with each threshold in order toremain statistically conservative. Only the reported p-values, not thestatistical maps, were affected by the FDR corrections.
Unweighted global brain connectivity (uGBC) analysis
See the middle right portion of Fig. 2 for an outline of uGBCanalysis. This method was a replication of the method developed byBuckner et al. (2009), which was based on previously developedgraph theoretical approaches (e.g., Salvador et al., 2005b). uGBC
tter Talairach coord: x Talairach coord: y Talairach coord: z Brodmann areas
−2.8 −63.1 −25.9 –
0.1 −55.9 34.6 31, 7, 2330.2 29.2 6.8 10, 46, 45, 47, 13
−25 −0.3 2.6 137.8 19.8 44.7 32, 24, 6, 8
−2.2 41.9 15.8 32, 24, 9, 10−38.8 −75.8 20.4 19, 39
28 −3.2 −4.5 –
36.5 −69.1 32.1 3947.1 11.4 25 9, 6−1.2 −83.5 23.3 1843 4 −25.9 21, 22, 20
−33.6 47 7.8 1026 29.4 34.8 8, 918.6 −31.2 0.6 35, 30, 27
37.5 −79.4 12 19, 18, 399.9 −55.4 58.7 7
11 −65.5 13.6 31, 30−48.5 −18.6 34.5 3, 4, 2
40.9 −42.3 44.8 40, 77.3 −19.7 12.8 –
49.1 −32.3 16.4 41, 1357 −29.6 1.1 21, 22
−31.4 32.8 30.1 8, 9−53.9 −50.9 10.4 22−36 −29 12.8 41, 13
32.2 −41.9 −16.5 20−22.8 −22.9 −13 35−22 −28 0 30, 27
−34.5 −68.7 42.1 7, 19−2.3 −17.4 48 31, 6
−41.6 3.2 41.3 6
ls 9.99%, due to the cluster minimum threshold (i.e., the remaining 0.01% are in clusters

3138 M.W. Cole et al. / NeuroImage 49 (2010) 3132–3148
analysis involves calculating a seed correlation map of each voxel toall other voxels, with each voxel's degree of connectivity (i.e., numberof connections) assigned to that voxel in the resulting map. Each seedcorrelation map is thresholded at a given value (here, as in Buckner etal., 2009, rN0.25) in order to remove low correlations that may bepresent due to noise. One uGBCmap was created per subject, and thatmap was z-normalized in order to account for differences in brainsize. Z-normalization involved subtracting the across-voxel meanfrom each voxel and dividing by the across-voxel standard deviation.The uGBC maps were then fit to a Talairach (Talairach and Tournoux,1988) template (AFNI's version of ‘colin27’) using a 12 degrees-of-freedom affine transformation.
The uGBC statistical model
Unlike Buckner et al. (2009), statistical inference was used toensure reliability across subjects. Specifically, a non-repeated mea-sures ANOVA (with subjects as a random effect) was used to testhypotheses regarding the uGBC maps across the group. This groupANOVA compared each voxel's uGBC to zero (i.e., the mean number ofconnections), resulting in a statistical map quantifying the probabilitythat each voxel has more connections than the average voxel. Theassumption made by the ANOVA of an approximately normaldistribution between subjects was verified using normal quantile–quantile (Q–Q) plots for the grandmean uGBC and the mean uGBC foran example region (PCC). All additional steps were identical to thoseof the wGBC method.
GBC distribution analyses
The group distributions were visualized using histograms andnormal Q–Q plots (using R (R Development Core Team, 2008)) of theGBC values from all gray matter voxels for all subjects. Individualsubject wGBC and uGBC data were z-normalized prior to combiningwith the group data. Data were also plotted from two examplesubjects in order to illustrate the similarity between the groupdistributions and those of the individual subjects.
Results
Grand mean global connectivity strength
The groupmean global connectivity strength across all graymattervoxels (i.e., the group grand mean wGBC) was r=0.035, with astandard deviation (between subjects) of 0.0198. All subjects had low,yet positive grandmeanwGBC, suggesting brain regions are positivelycorrelated on average.
Top percent wGBC
As expected, all CCN and DMN regions were included in the top 5%(pb0.00016, FDR corrected) of wGBC voxels. Additionally, severalsubcortical regions expected to have among the highest GBC arepresent. These subcortical regions include amygdala, HC, medialdorsal thalamus, an MNT region, cerebellum, globus pallidus, caudate,and lateral thalamus. These results are detailed in Fig. 3, and Tables 1and 2.
Top percent uGBC
As expected, themajority of the top uGBC regions were either in theCCN or DMN. The top 5% of voxels were statistically significant withb0.0154 (FDR corrected). These results are detailed in Fig. 4, and Tables 3and 4. All CCN regions were included, while nearly all DMN regions(with the exception of aTL) were included. Additional regions includedmiddle temporal gyrus (MTG), middle occipital gyrus (MOG), and
ventro-lateral prefrontal cortex (VLPFC;whichmay be part of the CCN).Note the absence of any subcortical regions at 5%. The top 10% of uGBCvoxels (Fig. 4; pb0.0328, FDR corrected) are highly consistent with theresults at 5%. Importantly, theDMN regionmissing at 5% (aTL) is presentat 10%, as well as two small regions in cerebellum.
Conjunction of wGBC and uGBC results
A conjunction map was created between the wGBC and uGBCresults at the top 5% and 10% (Fig. 5 and Table 5). For the ‘top 5%’, allvoxels common to wGBC and uGBC in their respective top 5% mapswere included. Similarly, all voxels common to wGBC and uGBC intheir respective top 10% maps were included in the conjoined ‘top10%’ map.
All CCN and DMN regions were included in the conjoined results,with the exception of AIC and aTL. These two regions were present inboth thewGBC and uGBCmaps, but the regions' voxels did not overlapbetween the wGBC and uGBC maps. Other regions in the conjunctionmap include MTG/MOG, VLPFC, right cerebellum, and left M1. Theinclusion of left M1, which was not highlighted in the wGBC and uGBCmaps due to its small size, is consistent with the location of the M1‘hand’ representation andmay reflect high connectivity for right handmotor control for the fourteen right-handed subjects.
wGBC and uGBC distributions
Graph theoretical investigations into complex systems typicallylook at unweighted degree distributions, rather than weighted degreedistributions. Nonetheless, we were interested in the weighteddistribution, since it might reveal something about the organizationof connectivity in the brain. Fig. 6A illustrates the group wGBCdistribution (top), the comparison to the normal distribution(middle), and the wGBC distribution for two example subjects(bottom). These graphs indicate that the weighted global connectivityof the brain is approximately normally distributed.
The uGBC results lend themselves to more typical graph theoryanalysis of the degree (number of connections) distribution. Graphtheoretic results for complex systems (which have both localclusters and long-range connectivity patterns) typically find degreedistributions that are skewed toward high values, while scale-freegraphs tend to follow a power law (Amaral et al., 2000; Bullmoreand Sporns, 2009). Fig. 6B illustrates the group uGBC distribution(top), the comparison to the normal distribution (middle), and theuGBC distribution for two example subjects (bottom). These resultssuggest that the brain's global connectivity follows a power law andis skewed toward high values, in turn suggesting that the brain'sconnectivity is both scale-free and complex. Note, however, that theuGBC threshold of 0.25 (used by Buckner et al., 2009 and also here)is somewhat arbitrary, and that the degree distribution becomesnear-normal as this threshold approaches 0 (Fig. 7). Further researchis necessary to determine if this reflects the actual degree dis-tribution of the brain or instead an increase in the number of falseconnections due to noise (which would be expected to be normallydistributed).
Overall GBC patterns
We created GBC maps summarizing the level of GBC from thetop 10% to the top 90% in order to determine the overall pattern ofGBC throughout the brain. Fig. 8 illustrates the wGBC pattern, whileFig. 9 illustrates the uGBC pattern. The two patterns are quitesimilar, with primary sensory-motor cortices having among thelowest and the CCN and DMN having among the highest GBC inboth cases. Notable differences between the maps include strongerlocal clustering for the uGBC map and more subcortical regions forthe wGBC map.

Table 3Top 5% uGBC voxel clusters.
Cluster labels Hemisphere Voxels (3.2 mm3) % Gray matter T-statistic Talairach coord: x Talairach coord: y Talairach coord: z Brodmann areas
PCC, IPL, PPC, precuneus,MTG/MOG
Both 1393 3.29 4.3092 6.1 −75.2 18.4 23,31,39,7,18
PMC Left 109 0.26 4.4035 −41.2 0.1 39.4 6DLPFC Right 56 0.13 4.0605 39.4 26.7 22.6 46, 9VLPFC, Broca's area Left 48 0.11 3.9498 −52.5 12.2 14.5 44, 45rACC Left 36 0.09 4.0081 −3.6 43.3 5.2 32IFJ Right 25 0.06 3.9852 44.9 −0.6 24.6 6, 9pPFC Right 25 0.06 4.0788 42.2 15.4 39.7 9PMC Right 24 0.06 3.9138 47.1 −2.1 38.1 6RLPFC Left 13 0.03 4.3039 −38.7 45.4 6.9 10SFC Right 12 0.03 3.7321 18.2 37.2 41.2 8Medial frontal cortex Left 8 0.02 3.5197 −2.8 34.6 40 8AIC Right 7 0.02 3.7189 36.8 18.6 9.9 13IPL Right 7 0.02 3.8329 51.4 −46.3 39.1 40PPC, precuneus Right 7 0.02 3.678 5.3 −66.9 49.3 7
Cluster minimum for inclusion in table=7 voxels. Note that some DMN and CCN regions had fewer than seven voxels remaining, and so are not included here. The percentage of graymatter included in the table equals 4.18%, due to the cluster minimum threshold (i.e., the remaining 0.82% are in clusters with fewer than seven voxels).
Fig. 4. Top percent uGBC regions. The GBC method developed by Buckner et al. (2009) was modified to quantify inter-subject consistency and to indicate the top percentages ofvoxels. Unlike the wGBCmethod, the uGBCmethod uses an unweighted graph, such that the voxel values reflect the concept of degree from graph theory. Like the wGBCmethod, theuGBC method indicates that both the DMN and CCN regions are among the top 5% of voxels. The map was thresholded based on statistical confidence that each voxel is higher thanthe grand mean across all voxels.
3139M.W. Cole et al. / NeuroImage 49 (2010) 3132–3148

Table 4Top 10% uGBC voxel clusters.
Cluster labels Hemisphere Voxels (3.2 mm3) % Gray matter T-statistic Talairach coord: x Talairach coord: y Talairach coord: z Brodmann areas
PCC, IPL, PPC, precuneus,MTG/MOG
Both 2514 5.94 3.7715 6.1 −73.6 20 23,31,39,7,18
RLPFC, DLPFC, PMC, AIC,rACC, SFC
Both (Nright) 663 1.57 3.3694 25.6 26.5 25.8 10, 9, 46, 6, 13, 32, 8
PMC, DLPFC, IFJ, VLPFC Left 387 0.91 3.6355 −44.6 8 30.4 6, 46, 9, 44, 45RLPFC Left 36 0.09 3.6065 −38.6 44.6 8.2 10VLPFC Right 18 0.04 3.1405 53.7 7.7 5.2 44Superior temporal gyrus Right 14 0.03 3.1937 48.1 −37.9 3.1 22aTL Left 13 0.03 3.2802 −55 −12.8 −5.1 21, 22Superior temporal gyrus Right 11 0.03 3.245 52.1 −12 11.3 22Superior temporal gyrus Left 10 0.02 3.1232 −48 −17.3 10.3 41Postcentral gyrus Left 9 0.02 3.3967 −49.6 −23.5 19.2 40Cerebellum (Crus 2) Left 8 0.02 3.1085 −30.5 −69.4 −41.9 –
IPL Right 8 0.02 3.3561 61 −32.6 22.3 40aTL Right 7 0.02 3.3695 50 −12.2 −8.4 22, 21RLPFC Left 7 0.02 3.3042 −26.4 56.6 14.2 10
Cluster minimum for inclusion in table=7 voxels. The percentage of gray matter included in the table equals 8.76%, due to the cluster minimum threshold (i.e., the remaining 1.24%are in clusters with fewer than seven voxels).
3140 M.W. Cole et al. / NeuroImage 49 (2010) 3132–3148
The uGBC map (Fig. 4) also showed fewer subcortical regions thanthe wGBC map (Fig. 3) in the top 10%. In order to test the possibilitythat this was due to processing differences between the twoapproaches, we systematically reduced these differences to see ifmore subcortical regions would be present. The differences present inthe wGBCmap were: (1) the inclusion of low values, (2) the inclusionof negative values, (3) smoothing only after wGBC calculation, and (4)no global mean regression. Accordingly, we created a map using anabsolute value of rN0.15 threshold (including low positive andnegative values), smoothing only after uGBC calculation (6 mmFWHM), and no global mean regression.
These four changes produced minimal differences from the mainuGBC map (see Fig. 10). However, uGBC was higher in severalsubcortical regions (though not nearly as many as in the wGBC map).Specifically, amygdala (mostly on the left), dorsal thalamus (mostlyon the left), and cerebellum (same region as in Fig. 4, bilaterally) hadhigher values due to the changes. When these changes were appliedseparately, both the difference in threshold and the different use ofspatial smoothing affected the uGBC values in subcortical regions(especially in left amygdala).
Discussion
The wGBC and uGBC methods developed here converge to showthat brain regions in the CCN and DMN are among the most globallyconnected (Figs. 3, 4, and 5). Several other subcortical regions,including amygdala, HC, BG, an MNT region, and cerebellum alsohave high wGBC (Fig. 3), as expected based on known anatomicalconnectivity. These findings promise to provide novel insights into themechanisms of information integration and coordination in the brain.
The first implementation of wGBC analysis was in the context of aprevious study of the CCN (Cole and Schneider, 2007). In that study,we pointed out that the CCN is involved in a very large variety ofcognitive control tasks and that, given the kinds of complexcoordination necessary to implement cognitive control in thesemany contexts, the CCN is likely to have high global brainconnectivity. We showed that the CCN regions are among the mosthighly globally connected in the brain, which we replicate here (seeFig. 3). However, the previous wGBC analysis method was relativelycrude, since it tested only the CCN regions, was based on many short(60 s) rest periods (as opposed to the continuous 10 min rest periodsused here), and used large (10 mm3) voxels. The wGBC approachdeveloped here rectifies these issues.
In addition to the CCN, we hypothesized that the DMN would alsohave among the highest GBC. The logic here is similar: the DMN isinvolved in a wide variety of domain-general cognitive processes,
which likely require connectivity with a large number of other brainregions. Importantly, the tasks that engage the DMN are typicallydifferent from those that engage the CCN. For instance, the DMN ismore active at rest than during cognitive control tasks (Raichle et al.,2001), ismodulated by long-termmemory tasks (Buckner et al., 2005),is parametrically modulated by mind wandering (Mason et al., 2007),and is associated with self-reflection (D'Argembeau et al., 2008).We confirmed this hypothesis here, as the DMN (as well as the CCN)regions are among the most globally connected regions (top 5%) bothrelative to the average uGBC (i.e., the mean degree of connectivity;Fig. 4) and also relative to a wGBC of zero (i.e., no connectivity withother voxels on average; Fig. 3).
We found that the overall pattern of GBC throughout the brain waslargely consistent across wGBC (see Fig. 8) and uGBC (see Fig. 9)approaches, and also across several analysis parameters (see Fig. 10).For instance, primary sensory-motor cortices (auditory, visual,somatosensory, motor) consistently had among the lowest GBCvalues. Further, in accordance with the ‘top 10%’ maps, even theCCN and DMN voxels below the ‘top 10%’ threshold nonetheless hadamong the highest GBC.
In addition to these similarities, there are also notable differencesbetween the maps. For instance, the wGBC map appears to be lessspatially clustered (in terms of top percentage GBC) than the uGBCmaps. This may reflect the inclusion of more noise by the wGBCmethod (since low correlations were not removed). Anotherdifference is high wGBC relative to uGBC along the medial wall,which may reflect a small number of very high correlation values(adding little to uGBC but much to wGBC) in these voxels. In contrast,there is high uGBC relative to wGBC along the left lateral frontalcortex, likely reflecting a mixture of positive and negative correlations(i.e., excitatory and inhibitory connections) that ‘cancel out’ whenaveraged during the wGBC calculations. Further research is necessaryto fully verify these possibilities.
The differential sensitivities of the wGBC and uGBC methodsoutlined above may also explain why only 14% of the top 10% wGBCand uGBC voxels overlapped (see Fig. 5). For instance, some of thetop 10% wGBC voxels may have a small number of very highcorrelations, making them unlikely to have the large number ofconnections necessary for the uGBC top 10%. In contrast, some of thetop 10% uGBC voxels may have a high number of both positive andnegative correlations, making them unlikely to have the consistentlypositive average connectivity necessary for the wGBC top 10%.Regardless of the reason why many of the ‘top ten percent’ voxels donot overlap, it is nonetheless informative that there is overlap at all,and that it is largely circumscribed to the hypothesized CCN andDMN regions.

Fig. 5. Conjunction of top percent wGBC and uGBC. These regions have both high average connectivity strength (wGBC) and high connectivity count (uGBC). Voxels in both thewGBCand uGBC top percent maps are presented in an axial mosaic (12 slices, skipping every eight 1mm slices), and three sagittal slices. Voxels in both ‘top 5%’maps are included in the top5% here, while voxels in both ‘top 10%’maps are included in the top 10%. For instance, the depicted cerebellum region is in the top 5% wGBC, but only the top 10% uGBC, making it inthe ‘top 10%’ here. In actuality, the overlap between the ‘top 5%’ maps constitutes 1.4% of gray matter. Thus, while most voxels do not overlap between wGBC and uGBC maps, theynonetheless overlap in most of the regions included in the maps. The CCN and DMN regions are labeled, with several additional regions labeled for the purpose of discussion.
3141M.W. Cole et al. / NeuroImage 49 (2010) 3132–3148
The inclusion of subcortical regions known to have extensiveconnectivity (such as amygdala and thalamus) suggests wGBCmay bea more accurate method than uGBC for investigating global connec-tivity. However, it remains unclear why subcortical regions arepresent for wGBC and not uGBC. Buckner et al. (2009) noted thatmoresubcortical voxels (in thalamus) were present in their unweightedmaps as the connection strength threshold was lowered, perhaps
reflecting the possibility that subcortical regions have many weakconnections (relative to the strength of connections in cortex) that areremoved by the conservative connection strength threshold of 0.25. Incontrast, the wGBC method did not remove such weak connections,suggesting the many weak connections in subcortical regions resultedin weighted connectivity values that were quite high on average.Other possibilities for wGBC's success with subcortical regions include

Table 5Conjunction of top percent wGBC and uGBC voxel clusters.
Cluster labels Hemisphere Volume (3.2 mm3) % Gray matter Talairach coord: x Talairach coord: y Talairach coord: z Brodmann areas
PCC Both 100 0.24 −3.3 −58.6 27.5 31, 7MOG/cuneus Both 57 0.13 −3 −84.8 23.1 18, 19IPL Right 52 0.12 42.1 −69.1 32.4 39IPL Left 49 0.12 −41.7 −76.4 22 39rACC Both 44 0.10 −4.7 41.6 10.3 32MOG Left 34 0.08 −30.5 −85.8 14.4 18, 19MOG Right 21 0.05 42.4 −75.3 8.4 18, 19MOG Right 20 0.05 40.1 −72.7 −9.1 18, 19pPFC/IFJ Right 18 0.04 46.6 13.9 29.6 9, 6PMC Left 17 0.04 −41.1 3.2 41.4 6MOG Right 16 0.04 30.7 −84.1 16.6 18, 19DLPFC Right 15 0.04 39.6 29.5 16.2 46, 9RLPFC Left 13 0.03 −37 45.6 5.6 10PPC/precuneus Left 11 0.03 −35 −70.1 41.3 7, 19Lingual gyrus Left 10 0.02 −8.7 −75.3 −9.7 18MTG Left 10 0.02 −46.4 −60 24.4 39RLPFC/DLPFC Right 8 0.02 39.3 41.7 7.9 10, 46MTG Left 7 0.02 −47.3 −67.3 7.7 37RLPFC/DLPFC Right 7 0.02 38.2 40.5 24.2 10, 9SFC Right 6 0.01 29.9 30.5 35.6 8, 9SFC Right 6 0.01 11.2 39.9 43.1 8
Cluster minimum for inclusion in table=6 voxels. The voxels overlapping at the top 10% of wGBC and uGBC maps are included. The percentage of gray matter included in the tableequals 1.23% while the actual overlap between the ‘top 10%’ maps was 1.4% of gray matter (this difference was due to the cluster minimum threshold). Note that while most ‘toppercentage’ voxels do not overlap between the wGBC and uGBC maps, the regions included in the overlap are largely consistent with the set of regions in both the source maps.
3142 M.W. Cole et al. / NeuroImage 49 (2010) 3132–3148
the lack of spatial smoothing during pre-processing (which may havecontaminated subcortical regions with the fMRI signal drop-out innearby air pockets for uGBC), the inclusion of negative (in addition topositive) correlations, and the lack of global mean regression (whichmay remove global signals of interest, possibly including signalscommon to subcortical regions). We verified that these factorsaffected the presence of subcortical regions in the GBC maps (seeFig. 10), though their effect was small and due mostly to the spatialsmoothing and correlation threshold differences. This nonethelessdemonstrates that subcortical regions are likely present in the wGBCmaps due to their low connectivity (likely modulatory) strengths.
RLPFC was not emphasized in previous GBC studies but was foundhere to have among the highest GBC. Human postmortem anatomicalstudies have shown that RLPFC has among the largest dendrites (andassociated spines) of any tested brain region (Jacobs et al., 1997;Jacobs et al., 2001), suggesting that RLPFC has many incominganatomical connections. Such highly convergent connectivity sug-gests RLPFCmay be important for integrating information from acrossthe brain during complex cognitive tasks (Badre, 2008; Botvinick,2008; Fuster, 2004; Wendelken et al., 2008). This is consistent withthe finding that this region has both very high uGBC and very highwGBC (Fig. 5).
The top 5% GBC analyses also revealed several other lateral PFCregions, including DLPFC and pPFC/IFJ (see bottom of Fig. 5). Theseregions are known to have reciprocal connections with a wide varietyof other regions (Bunge et al., 2005; Chafee and Goldman-Rakic, 2000;Fuster et al., 1985), and may serve as intermediates to the moreanterior RLPFC (Ramnani and Owen, 2004). Importantly, evidencefrom non-human primates suggests that these regions are highlyinterconnected viamedial dorsal nucleus in the thalamus (Giguere andGoldman-Rakic, 1988), which was also present in the top 5% wGBCmap (see Fig. 3). These results indicate that a network of regions along
Fig. 6. Distribution of GBC values. (A) The distribution of the average connectivity strengthillustrates that the wGBC values are nearly normally distributed (a perfectly normal distribnearly identical to this group distribution, as the two example subjects illustrate (bottom). Ngrand mean wGBC value across subjects was slightly positive (0.035). (B) The distribution ofall gray matter voxels across 14 individuals (top). The Q–Q plot illustrates that the uGBC vseparately were nearly identical to this group distribution, as the two example subjects illu
lateral prefrontal cortex and including the portion of thalamus mostinterconnected with these regions (medial dorsal nucleus) is highlyinterconnected with regions throughout the brain, possibly support-ing the ability of these regions tomaintain andmanipulate informationfrom across the brain during complex cognitive control tasks.
The dACC/pSMA is a CCN region with controversy surrounding notonly its function but also its exact anatomical location. A recent reviewillustrated the immense anatomical variability of this region, alongwith the possibility that the region is area 32′, an anatomically distinctarea unique to humans (Cole et al., 2009). The dACC/pSMA regionidentified here is located on the left cingulate gyrus (see Figs. 5 and10), which is consistent with area 32′ since this area is typicallylocated on the cingulate gyrus when two cingulate gyri are present,which occurs on the left hemisphere in most individuals (Paus et al.,1996; Vogt et al., 1995). Observing high GBC in what is likely area 32′is important in that it provides more information regarding possiblefunctions of this evolutionarily recent brain area. Specifically, itappears that this region may be involved in coordinating informationacross a wide variety of brain areas (given its high GBC) duringcognitive control tasks (given its involvement in cognitive controlprocesses (Cole and Schneider, 2007)).
Several researchers have characterized the aTL as a semantic hubable to integrate information from multiple modalities to representcomplex objects (Rogers et al., 2006; Rogers et al., 2004; Rogers andPatterson, 2007). Supporting this view, aTL was present in the wGBCmap at the top 5% (Fig. 3) and the uGBC map at the top 10% (Fig. 4).However, this region was not present in the wGBC/uGBC conjunctionmap (Fig. 5). This may reflect lower GBC for this region than otherCCN/DMN regions, or it may reflect lower signal (which results inlower correlations) in the region due to fMRI signal drop-out (seeRogers et al., 2006). Future use of methods that can better image aTLwith minimal signal drop-out (such as positron emission tomography
for all gray matter voxels across 14 individuals (top). The quantile–quantile (Q–Q) plotution would fit the line) (middle). The distributions of all individuals separately wereote that the values were z-normalized in order to aggregate data from all subjects. Thethe degree of connectivity (number of connections with strength greater than 0.25) foralues are clearly not normally distributed (middle). The distributions of all individualsstrate (bottom).

3143M.W. Cole et al. / NeuroImage 49 (2010) 3132–3148

Fig. 7. uGBC distributions across different connection strength thresholds. Since the 0.25 connection strength threshold (used by Buckner et al., 2009 and also here) is somewhatarbitrary, we investigated distributions across several thresholds. As the connection strength threshold is increased, the uGBC distribution is seen to better obey a power law. Incontrast, as the connection strength threshold is decreased, the uGBC distribution is seen to becomemore symmetrical, resembling a normal distribution. This pattern may be due toeither greater accuracy at lower thresholds (i.e., the high thresholds are removing important low-strength connections) or greater accuracy at higher thresholds (i.e., the lowthresholds retain connections that are not real and have non-zero correlation values due to noise). Further research is necessary to distinguish between these two possibilities.
3144 M.W. Cole et al. / NeuroImage 49 (2010) 3132–3148
(PET)) may help resolve this issue. It is also possible that differentportions of aTL are differentially sensitive to wGBC versus uGBC (seeFigs. 3 and 4).
For the most part, primary sensory and motor cortices had lowGBC. A clear exception, however, was left M1 (see Fig. 5). This region'slocation is consistent with the motor representation of the right hand,
Fig. 8. Overall wGBC by top percentages of voxels. Voxels were colored according to their inreflects the wGBC strength and consistency of each voxel relative to 0 wGBC. Note that the
suggesting that the region may have high GBC due to the right-handedness of all 14 subjects. Future research, possibly involving GBCanalysis of both right- and left-handed individuals, is necessary tofully verify if handedness is the product of differentially high GBC (i.e.,high global connectivity for the dominant hand relative to the non-dominant hand).
clusion in the top percentages of voxels. The map is based on group F-statistics and so‘top 90%’ also includes the remaining 10% in order to include all voxels.

Fig. 9. Overall uGBC by top percentages of voxels. Like Fig. 8, voxels were colored according to their inclusion in the top percentages of voxels. The map is based on group F-statisticsand so reflects the uGBC count and consistency of each voxel relative to the mean uGBC value. The values above the 50% threshold reflect statistical significance above the mean,while values below the 50% threshold reflect statistical significance below the mean.
3145M.W. Cole et al. / NeuroImage 49 (2010) 3132–3148
A recent study using rs-fcMRI reported that portions of cerebellumconnect to distinct portions of frontal cortex in humans (Krienen andBuckner, 2009). Specifically, they found that portions of cerebellumthat were connected to motor cortex were distinct from portionsconnected to prefrontal cortex. The wGBCmap includes a large part ofcerebellum as among the most highly connected regions in the brain(top 5%). The uGBCmap includes two small regions in cerebellum (top10%). These wGBC and uGBC cerebellar regions are largely consistentwith the portions of cerebellum Krienen and Buckner (2009) found tobe connected to DLPFC, medial prefrontal cortex, and (to a lesserextent) RLPFC. Notably, very little of the portion connecting to motorcortex was present in the GBC maps. These findings support theconclusion that portions of cerebellum with high GBC have that GBCdue to connectivity with cortical regions with high GBC, such as theprefrontal regions within the CCN and DMN.
In addition to subcortical, CCN, and DMN regions, several visualregions were also among the most globally connected. This mayreflect the privileged placement of visual processing in the humanbrain (Ungerleider and Haxby, 1994). Future research is necessary todetermine if this high GBC is due to the relatively large size of visualcortex (thus comprising a disproportionately large number of voxels)or if it is due to high connectivity with regions outside visual cortex aswell.
Graph theory has been utilized to great effect in recent studies ofbrain connectivity. Overlapping with the graph theory concepts ofhubs and node centrality, the present study uses uGBC and wGBC todetermine the most highly connected brain regions. A recent studyused graph theory in the context of diffusion weighted MRI (DWI) to
investigate global anatomical connectivity (Hagmann et al., 2008).That study's findings largely agree with the present study's findings,showing that RLPFC, PCC, rACC, and IPL have high global connectivity.However, that study showed that PCC (including a portion of theprecuneus) had the highest global connectivity of any region. We alsofound especially high connectivity in this region, suggesting that thefunctional connectivity approach used here reflects underlyinganatomical connectivity to some extent. Note, however, that func-tional connectivity may be more relevant to understanding howregional connections influence brain dynamics and ultimatelybehavior, since it can include strong indirect connections (which arelikely highly relevant to brain dynamics) as well as direct connections.
The lack of an arbitrary threshold during wGBC map creation is apotential advantage of wGBC relative to uGBC. Indeed, while Buckneret al. (2009) demonstrated similar spatial maps at a variety ofstrength thresholds for uGBC, we also found that the uGBCdistribution changes dramatically with different strength thresholds(Fig. 7). This throws some doubt on the appropriateness of anyparticular uGBC strength threshold. Further research is necessary todetermine if the tendency toward symmetry at lower strengththresholds reflects the actual degree distribution of the brain orinstead an increase in the number of false connections due to noise.One possible solution may be to threshold connections in a principledmanner using a recently-developed method for quantifying thestatistical certainty of connectivity (Kramer et al., 2009). Note thatthe uGBC maps are likely informative regarding the regions with thehighest GBC even if a given threshold is not appropriate forcharacterizing the degree distribution of the brain.

Fig. 10. Overall uGBC with fewer processing differences from wGBC. Like Fig. 9, voxels were colored according to their inclusion in the top percentages of voxels. The followingchanges were made when creating this map in order to better approximate the methods used for the wGBC map: (1) low values were included (rN0.15), (2) negative values wereincluded (also, rb -0.15), (3) spatial smoothing was applied only after uGBC calculation, and (4) global mean regression was not used.
3146 M.W. Cole et al. / NeuroImage 49 (2010) 3132–3148
Since there is no a priori reason to assume that the brain'sconnectivity is normally distributed, it is possible that the actualdistribution of uGBC values is a non-normal power law distribution asfound at higher thresholds (see Fig. 7). Indeed, previous estimates ofthe degree distribution of the brain (the graph theory equivalent ofthe uGBC distribution) have also been power law distributions,implying the human brain is ‘scale free’ and forms a small worldnetwork (Bullmore and Sporns, 2009; Heuvel et al., 2008). However,our results illustrate that this may be a premature conclusion, as thethreshold used prior to estimating the degree distribution has asubstantial effect on its shape. This same problem extends toestimates using anatomical connectivity as measured by DWI sincemany smaller fiber connections (e.g., in gray matter) that mayconstitute the lower end of a normal distribution are lost in noise withcurrent DWI methods (Gigandet et al., 2008). Further research isnecessary to reduce noise in these global connectivity approaches inorder to see the true degree distribution of the human brain.
Several forms of noise common to fMRI experiments may haveaffected the results presented here. For instance, fMRI signal drop-outis known to occur near the sinuses and other air pockets, and mayhave reduced correlations in surrounding gray matter. Indeed, therewas a tendency in the results reported here for low GBC inorbitofrontal cortex and inferior temporal lobes, among other regionsnear air pockets (see Figs. 8 and 9). Further research is necessary todetermine the effects of signal drop-out on estimates of GBC. Anotherpotential source of noise was the presence of cardiac and respiratorycorrelations. We tested the effect of such artifactual correlations using
global mean regression, and found that they had little effect on thegroup results. However, several individual subjects showed highwGBC and uGBC values in parts of the brain that typically correlatewith respiratory and cardiac artifacts due to nearby blood vessels(Birn et al., 2006). Further research (possibly involving regression ofnuisance cardiac and respiratory signals) is necessary to determinethe effect of physiological artifacts on GBC estimates.
It is perhaps surprising that the CCN and DMN were both amongthe top 5% of globally connected voxels given that their activities arenot typically correlated with each other (Fox et al., 2005; Murphy etal., 2008). However, they do share one thing in common: theiractivities are not correlated with the external world either. Evidencefor this comes from a study of brain activity during movie watching(Hasson et al., 2004), which found that almost the entire braincorrelated between subjects when watching the same movie, exceptfor many of the CCN and DMN regions. This result, in conjunction withthe present study's results, suggests that the CCN and DMN are able toutilize their extensive connectivity to integrate information fromprimary sensory regions and also between their own regionsinternally to form an internal ‘mental’ world that may characterizethe core of human experience. Future research may reveal the exactconnectivity patterns and neural processes that make the emergentproperties of this internal ‘mental’ world (e.g., selfhood, conscious-ness) possible. Additionally, further research may reveal the similar-ities and differences between the CCN and DMN connectivity patterns,perhaps revealing the mechanism of their differentiation despite bothhaving high global connectivity.

3147M.W. Cole et al. / NeuroImage 49 (2010) 3132–3148
It is also potentially surprising that the CCN and DMN are withinthe top 5% of both the uGBC and wGBC statistics despite the differentdistributions underlying these two approaches (see Fig. 5). The wGBCvalues are normally distributed for both the group and individualsubjects (Fig. 6A), while the uGBC values resemble a power lawdistribution (Fig. 6B). However, both distributions have a high-valuetail that gradually decreases. The similarity of the top GBC valuesusing the two approaches indicates that these high-value tails includemany of the same voxels, solidifying the conclusion that the regionsincluding these voxels are among the most globally connectedportions of the brain.
In summary, we developed two new methods, uGBC and wGBCanalysis, which showed that the brain's most globally interactiveregions can be placed within the context of known large-scalenetworks. These networks include the CCN and DMN, whose regionsare highly internally correlated during both rest and performance of awide variety of tasks (Cole and Schneider, 2007; Fox et al., 2005; Toroet al., 2008). Other networks with high wGBC include amygdala, HC,BG loops with cortex, and cerebellar loops with cortex, among others.The high global connectivity found for these networks impliesimportance in complex cognitive functions that require extensiveinteractive processing across the brain, which is largely consistentwith the putative functions of these networks. A key challenge forfurther research is to characterize exactly how these particularlyimportant networks' connectivity patterns contribute to cognitionand behavior.
Acknowledgments
We thank Bruna Martins for insightful comments and suggestions.We would also like to thank Robert Cox and Kyle Simmons fordeveloping efficient global connectivity software. This research wassupported by DARPA. The findings and opinions contained here arethose of the authors, not DARPA. M.C. was supported by an NSFgraduate research fellowship.
References
Achard, S., Salvador, R., Whitcher, B., Suckling, J., Bullmore, E., 2006. A resilient, low-frequency, small-world human brain functional network with highly connectedassociation cortical hubs. J. Neurosci. 26, 63–72.
Amaral, L.A., Scala, A., Barthelemy, M., Stanley, H.E., 2000. Classes of small-worldnetworks. Proc. Natl. Acad. Sci. U.S.A. 97, 11149–11152.
Badre, D., 2008. Cognitive control, hierarchy, and the rostro-caudal organization of thefrontal lobes. Trends Cogn. Sci. 12, 193–200.
Barbas, H., 2000. Connections underlying the synthesis of cognition, memory, andemotion in primate prefrontal cortices. Brain Res. Bull. 52, 319–330.
Behrens, T.E., Johansen-Berg, H., Woolrich, M.W., Smith, S., Wheeler-Kingshott, C.A.,Boulby, P.A., Barker, G.J., Sillery, E.L., Sheehan, K., Ciccarelli, O., Thompson, A.J.,Brady, J.M., Matthews, P.M., 2003. Non-invasive mapping of connectionsbetween human thalamus and cortex using diffusion imaging. Nat. Neurosci. 6,750–757.
Birn, R.M., Diamond, J.B., Smith, M.A., Bandettini, P.A., 2006. Separating respiratory-variation-related fluctuations from neuronal-activity-related fluctuations in fMRI.NeuroImage 31, 1536–1548.
Botvinick, M.M., 2008. Hierarchical models of behavior and prefrontal function. TrendsCogn. Sci. 12, 201–208.
Buckner, R.L., Snyder, A.Z., Shannon, B.J., LaRossa, G., Sachs, R., Fotenos, A.F., Sheline, Y.I.,Klunk, W.E., Mathis, C.A., Morris, J.C., Mintun, M.A., 2005. Molecular, structural, andfunctional characterization of Alzheimer's disease: evidence for a relationshipbetween default activity, amyloid, and memory. J. Neurosci. 25, 7709–7717.
Buckner, R.L., Sepulcre, J., Talukdar, T., Krienen, F.M., Liu, H., Hedden, T., Andrews-Hanna, J.R., Sperling, R.A., Johnson, K.A., 2009. Cortical hubs revealed by intrinsicfunctional connectivity: mapping, assessment of stability, and relation toAlzheimer's disease. J. Neurosci. 29, 1860–1873.
Bullmore, E., Sporns, O., 2009. Complex brain networks: graph theoretical analysis ofstructural and functional systems. Nat. Rev. Neurosci. 10, 186–198.
Bunge, S.A., Wallis, J.D., Parker, A., Brass, M., Crone, E.A., Hoshi, E., Sakai, K., 2005. Neuralcircuitry underlying rule use in humans and nonhuman primates. J. Neurosci. 25,10347–10350.
Chafee, M.V., Goldman-Rakic, P.S., 2000. Inactivation of parietal and prefrontal cortexreveals interdependence of neural activity during memory-guided saccades. J.Neurophysiol. 83, 1550–1566.
Cole, M.W., Schneider, W., 2007. The cognitive control network: integrated corticalregions with dissociable functions. Neuroimage 37, 343–360.
Cole, M.W., Yeung, N., Freiwald, W.A., Botvinick, M., 2009. Cingulate cortex:diverging data from humans and monkeys. Trends in Neurosciences 32 (11),566–574.
Cox, R.W., 1996. AFNI: software for analysis and visualization of functional magneticresonance neuroimages. Comput. Biomed. Res. 29, 162–173.
D'Argembeau, A., Feyers, D., Majerus, S., Collette, F., Van der Linden, M., Maquet, P.,Salmon, E., 2008. Self-reflection across time: cortical midline structures differen-tiate between present and past selves. Soc. Cogn. Affect. Neurosci. 3, 244–252.
Dale, A.M., Fischl, B.R., Sereno, M.I., 1999. Cortical surface-based analysis: I.Segmentation and surface reconstruction. Neuroimage 9, 179–194.
Deuker, L., Bullmore, E.T., Smith, M., Christensen, S., Nathan, P.J., Rockstroh, B., Bassett,D.S., 2009. Reproducibility of graph metrics of human brain functional networks.Neuroimage 47, 1460–1468.
Dosenbach, N.U.F., Visscher, K.M., Palmer, E.D., Miezin, F.M., 2006. A core system for theimplementation of task sets. Neuron 50 (5), 799–812.
Eichenbaum, H., Yonelinas, A.P., Ranganath, C., 2007. The medial temporal lobe andrecognition memory. Ann. Rev. Neurosci. 30, 123–152.
Fair, D.A., Schlaggar, B.L., Cohen, A.L., Miezin, F.M., Dosenbach, N.U.F., Wenger, K.K., Fox, M.D., Snyder, A., Raichle,M.E., Petersen, S.E., 2007.Amethod for usingblocked andevent-related fMRI data to study “resting state” functional connectivity. Neuroimage 35,396–405.
Fischl, B., Salat, D.H., Busa, E., Albert, M., Dieterich, M., Haselgrove, C., van der Kouwe, A.,Killiany, R., Kennedy, D., Klaveness, S., Montillo, A., Makris, N., Rosen, B., Dale, A.M.,2002. Whole brain segmentation: automated labeling of neuroanatomicalstructures in the human brain. Neuron 33, 341–355.
Fischl, B., Salat, D.H., van der Kouwe, A.J., Makris, N., Ségonne, F., Quinn, B.T., Dale, A.M.,2004. Sequence-independent segmentation of magnetic resonance images.Neuroimage 23 (Suppl. 1), S69–S84.
Fox, M.D., Snyder, A.Z., Vincent, J.L., Corbetta, M., Van Essen, D.C., Raichle, M.E., 2005.The human brain is intrinsically organized into dynamic, anticorrelated functionalnetworks. Proc. Natl. Acad. Sci. U.S.A. 102, 9673–9678.
Fox, M., Zhang, D., Snyder, A., Raichle, M., 2009. The global signal and observedanticorrelated resting state brain networks. J. Neurophysiol. 101, 3270–3283.
Fuster, J.M., 2004. Upper processing stages of the perception–action cycle. Trends. Cogn.Sci. 8, 143–145.
Fuster, J.M., Bauer, R.H., Jervey, J.P., 1985. Functional interactions between inferotem-poral and prefrontal cortex in a cognitive task. Brain Res. 330, 299–307.
Genovese, C.R., Lazar, N.A., Nichols, T., 2002. Thresholding of statistical maps infunctional neuroimaging using the false discovery rate. Neuroimage 15,870–878.
Gigandet, X., Hagmann, P., Kurant, M., Cammoun, L., Meuli, R., Thiran, J.P., 2008.Estimating the confidence level of white matter connections obtained with MRItractography. PLoS ONE 3, e4006.
Giguere, M., Goldman-Rakic, P.S., 1988. Mediodorsal nucleus: areal, laminar, andtangential distribution of afferents and efferents in the frontal lobe of rhesusmonkeys. J. Comp. Neurol. 277, 195–213.
Golanov, E.V., Yamamoto, S., Reis, D.J., 1994. Spontaneous waves of cerebral bloodflow associated with a pattern of electrocortical activity. Am. J. Physiol. Regul. 266(1 Pt 2), R204–R214.
Goldman, R.I., Stern, J.M., Engel, J., Cohen, M.S., 2002. Simultaneous EEG and fMRI of thealpha rhythm. Neuroreport 13, 2487–2492.
Griswold, M.A., Jakob, P.M., Heidemann, R.M., Nittka, M., Jellus, V., Wang, J., Kiefer, B.,Haase, A., 2002. Generalized autocalibrating partially parallel acquisitions (GRAP-PA). Magnetic Reson. Med.: Official J. Soc. Magn. Reson. Med./Soc. Magn. Reson.Med. 47, 1202–1210.
Hagmann, P., Cammoun, L., Gigandet, X., Meuli, R., Honey, C., Wedeen, V., Sporns, O.,Friston, K.J., 2008. Mapping the structural core of human cerebral cortex. Plos Biol.6, e159.
Hasson, U., Nir, Y., Levy, I., Fuhrmann, G., Malach, R., 2004. Intersubject synchronizationof cortical activity during natural vision. Science 303, 1634–1640.
Herlenius, E., Lagercrantz, H., 2004. Development of neurotransmitter systems duringcritical periods. Exp. Neurol. 190 (Suppl. 1), S8–S21.
Heuvel, M.v.d., Stam, C., Boersma, M., Pol, H.H., 2008. Small-world and scale-freeorganization of voxel-based resting-state functional connectivity in the humanbrain. Neuroimage 43, 528–539.
Jacobs, B., Driscoll, L., Schall, M., 1997. Life-span dendritic and spine changes in areas10 and 18 of human cortex: a quantitative Golgi study. J. Comp. Neurol. 386,661–680.
Jacobs, B., Schall, M., Prather, M., Kapler, E., Driscoll, L., Baca, S., Jacobs, J., Ford, K.,Wainwright, M., Treml, M., 2001. Regional dendritic and spine variation in humancerebral cortex: a quantitative Golgi study. Cereb. Cortex 11, 558–571.
Jolkkonen, E., Pitkänen, A., 1998. Intrinsic connections of the rat amygdaloidcomplex: projections originating in the central nucleus. The. J. Comp. Neurol.395, 53–72.
Kannurpatti, S., Biswal, B.B., Kim, Y., Rosen, B.R., 2008. Spatio-temporal characteristicsof low-frequency BOLD signal fluctuations in isoflurane-anesthetized rat brain.Neuroimage 40, 1738–1747.
Kelly, R.M., Strick, P.L., 2003. Cerebellar loops with motor cortex and prefrontal cortexof a nonhuman primate. J. Neurosci. 23, 8432–8444.
Kramer, M., Eden, U., Cash, S., Kolaczyk, E., 2009. Network inference with confidencefrom multivariate time series. Phys. Rev. E. 79, 1–13.
Krienen, F., Buckner, R., 2009. Segregated fronto-cerebellar circuits revealed by intrinsicfunctional connectivity. Cereb. Cortex 1–13.
Lancaster, J.L., Woldorff, M.G., Parsons, L.M., Liotti, M., Freitas, C.S., Rainey, L., Kochunov,P.V., Nickerson, D., Mikiten, S.A., Fox, P.T., 2000. Automated Talairach atlas labels forfunctional brain mapping. Hum. Brain Mapp. 10, 120–131.

3148 M.W. Cole et al. / NeuroImage 49 (2010) 3132–3148
Mason, M., Norton, M., Van Horn, J., Wegner, D., Grafton, S., Macrae, C., 2007.Wanderingminds: the default network and stimulus-independent thought. Science 315,393–395.
Middleton, F.A., Strick, P.L., 1994. Anatomical evidence for cerebellar and basal gangliainvolvement in higher cognitive function. Science 266, 458–461.
Murphy, K., Birn, R., Handwerker, D.A., Jones, T., Bandettini, P.A., 2008. The impact ofglobal signal regression on resting state correlations: are anti-correlated networksintroduced? Neuroimage 44 (3), 893–905.
Paus, T., Tomaiuolo, F., Otaky, N., MacDonald, D., Petrides, M., Atlas, J., Morris, R., Evans,A.C., 1996. Human cingulate and paracingulate sulci: pattern, variability,asymmetry, and probabilistic map. Cereb. Cortex 6, 207–214.
Kandel, E.R., Schwartz, J.H., Jessell, T.M. (Eds.), 2000. Principles of neural science. TheMcGraw-Hill Companies.
Squire, L.R., McConnell, S.K., Zigmond, M.J. (Eds.), 2003. Fundamental neuroscience.Elsevier.
Raichle, M.E., MacLeod, A.M., Snyder, A.Z., Powers, W.J., Gusnard, D.A., Shulman,G.L., 2001. A default mode of brain function. Proc. Natl. Acad. Sci. U.S.A. 98,676–682.
Ramnani, N., Owen, A., 2004. Anterior prefrontal cortex: insights into function fromanatomy and neuroimaging. Nat. Rev. Neurosci. 5, 184–194.
Rogers, T.T., Patterson, K., 2007. Object categorization: reversals and explanations of thebasic-level advantage. J. Exp. Psychol: Gen. 136, 451–469.
Rogers, T.T., Lambon Ralph, M.A., Garrard, P., Bozeat, S., McClelland, J.L., Hodges, J.R.,Patterson, K., 2004. Structure and deterioration of semantic memory: a neuropsy-chological and computational investigation. Psychol. Rev. 111, 205–235.
Rogers, T.T., Hocking, J., Noppeney, U., Mechelli, A., Gorno-Tempini, M.L., Patterson, K.,Price, C.J., 2006. Anterior temporal cortex and semantic memory: reconciling
findings from neuropsychology and functional imaging. Cogn. Affect. Behav.Neurosci. 6, 201–213.
Salvador, R., Suckling, J., Coleman, M.R., Pickard, J.D., Menon, D., Bullmore, E., 2005a.Neurophysiological architecture of functional magnetic resonance images ofhuman brain. Cereb. Cortex 15, 1332–1342.
Salvador, R., Suckling, J., Schwarzbauer, C., Bullmore, E., 2005b. Undirected graphs offrequency-dependent functional connectivity in whole brain networks. Philos.Trans. R. Soc. Lond. B. Biol. Sci. 360, 937–946.
Sporns, O., Honey, C., Kötter, R., Kaiser, M., 2007. Identification and classification of hubsin brain networks. PLoS ONE 2, e1049.
Talairach, J., Tournoux, P., 1988. Co-planar stereotaxic atlas of the human brain. Thieme.R Development Core Team, 2008. R: a language and environment for statistical
computing Vienna, Austria. ISBN 3-900051-07-0, URL http://www.R-project.org.Toro, R., Fox, P., Paus, T., 2008. Functional coactivation map of the human brain. Cereb.
Cortex 18, 2553–2559.Ungerleider, L.G., Haxby, J.V., 1994. ‘What’ and ‘where’ in the human brain. Curr. Opin.
Neurobiol. 4, 157–165.Van Essen, D.C., 2004. Surface-based approaches to spatial localization and registration
in primate cerebral cortex. Neuroimage 23 (Suppl. 1), S97–S107.Vincent, J.L., Patel, G.H., Fox, M.D., Snyder, A., Baker, J.T., Van Essen, D.C., Zempel, J.M.,
Snyder, L.H., Corbetta, M., Raichle, M.E., 2007. Intrinsic functional architecture inthe anaesthetized monkey brain. Nature 447, 83–86.
Vogt, B.A., Nimchinsky, E.A., Vogt, L.J., Hof, P.R., 1995. Human cingulate cortex: surfacefeatures, flat maps, and cytoarchitecture. J. Comp. Neurol. 359, 490–506.
Wendelken, C., Nakhabenko, D., Donohue, S.E., Carter, C.S., Bunge, S.A., 2008. “Brain is tothought as stomach is to ??”: investigating the role of rostrolateral prefrontalcortex in relational reasoning. J. Cogn. Neurosci. 20, 682–693.


![Scientific American - Is the Brain's Mind a Computer Program [Searle 1990]](https://img.pdfslide.us/doc/110x75/5571f7c949795991698bffd8/scientific-american-is-the-brains-mind-a-computer-program-searle-1990.jpg)