Embed Size (px)
Citation preview

PHYSICAL REVIEW B 90, 195405 (2014)
Identifying the absolute orientation of a low-symmetry surface in real space
Stefan Kuhn,1 Markus Kittelmann,1 Yoshiaki Sugimoto,2 Masayuki Abe,3 Angelika Kuhnle,1 and Philipp Rahe4,*
1Johannes Gutenberg-Universitat Mainz, Institut fur Physikalische Chemie, Duesbergweg 10-14, 55099 Mainz, Germany2Graduate School of Engineering, Osaka University, 2-1 Yamada-Oka, Suita, Osaka 565-0871, Japan
3Graduate School of Engineering Science, Osaka University, 1-3 Machikaneyama, Toyonaka, Osaka 560-8531, Japan4Department of Physics and Astronomy, The University of Utah, Salt Lake City, Utah 84112-0830, USA(Received 22 July 2013; revised manuscript received 22 September 2014; published 5 November 2014)
We present atomic-scale force interaction data acquired on an insulating low-symmetry substrate, namely thecalcite(10.4) surface. A pronounced asymmetry of the imaged species is apparent along the vertical axis, whichwill be identified as a tilted band of purely attractive short-range interaction forces. An independent determinationof the absolute surface orientation by an optical method suggests that the observed asymmetry is related to the tiltof the carbonate groups within the surface, which, in turn, is linked to the surface orientation. Thus our noncontactatomic force microscopy based work presents the determination of the absolute orientation for a low-symmetrysurface.
DOI: 10.1103/PhysRevB.90.195405 PACS number(s): 68.35.B−, 68.37.Ps
I. INTRODUCTION
Investigating the properties of metallic or insulating sur-faces at the atomic scale has progressed enormously during thelast decades. Especially with the advent of scanning probe mi-croscopy (SPM) techniques [1,2], studies in real space of baresurface terminations [3–5] or molecular superstructures [6,7]including the study of single molecules [8,9] became possible.Among the long list of relevant surface properties, surfacesymmetry is probably the most decisive parameter. A knowl-edge of this basic surface property is of utmost importancefor understanding key aspects of physicochemical processes,especially for materials relevant in material science or aboundin the natural environment. In this context, a particularlyinteresting crystal is calcite due to its abundance in remarkableorganic/inorganic hybrid materials known as biominerals.
Interestingly, most surfaces studied with noncontact atomicforce microscopy (NC-AFM) so far contain a large numberof surface symmetry elements and the absolute surfaceorientation is commonly directly identified from imaging theunit cell with SPM. To name two examples, the prototypicaldielectric substrates KBr(001) and NaCl(001), which haveroutinely been used for atomic-scale investigations [10–13],molecular adsorption studies [6] or surface patterning [14],belong to the point group Fm3m [15]. In contrast, the absolutesurface orientation can firsthand remain undisclosed in imagesfrom surfaces exhibiting a low symmetry. Especially in theNC-AFM images presented so far from the calcite(10.4)and the related dolomite(10.4) surface [16,17], one surfacedirection remains undetermined.
Here, we unravel this key symmetry property of thecalcite(10.4) surface from short-range force data acquired withNC-AFM. The data reveal the orientation of the symmetrybreaking, tilted carbonate ion CO2−
3 in the calcite(10.4)surface. A macroscopic optical method allows to confirm thisorientation by independent means.
*Current address: School of Physics and Astronomy, TheUniversity of Nottingham, Nottingham NG7 2RD, UK;[email protected]
We will first describe in Sec. II the complex data acqui-sition and analysis methodology. Section III introduces thecalcite(10.4) surface with a special focus on the symmetryproperties. The macroscopic approach to determine the ab-solute orientation is outlined in Sec. IV and followed bythe microscopic observations, namely the tip-sample forceinteractions, including a model for the underlying imagingmechanism (Secs. V and VI).
II. METHODS
Data were acquired under ultrahigh vacuum conditions atroom temperature using a VT AFM 25 (Omicron Nanotech-nology, Taunusstein, Germany) atomic force microscope inbeam-deflection configuration [18] operated in the frequency-modulated [19] noncontact mode. We used Ar+ sputteredSi probes from Nanoworld (Neuchatel, Switzerland) withfrequencies around 300 kHz, excited to an amplitude ofabout 16.9 nm. Experiments were performed in the so-calledforce mapping mode, where the data were systematicallyacquired along the vertical (Z) and horizontal (X or Y ) axes,resulting in high-resolution two-dimensional slices (ZX or ZY
mode) [20].Utmost measurement stability is required and established
at room temperature using a home-built atom-tracking sys-tem [21] for drift measurement and compensation [22]. Acomplex scan protocol of alternating steps of drift compensa-tion and data acquisition is implemented [21] and described inSec. II A.
The total tip-sample interaction force Fz and potentialUtotal are recovered from the frequency shift �f data usingthe Sader-Jarvis formulas [23]. We additionally calculate thelateral forces from Utotal and extract [24] the short-rangeinteraction forces Fz,SR from a careful subtraction of the vander Waals contribution. The employed methodology is outlinedin Secs. II B and II C.
A. 2D force mapping scan protocol
We employ the so-called curve-by-curve force mappingmethod, where single �f (z) curves are recorded on a lateral
1098-0121/2014/90(19)/195405(12) 195405-1 ©2014 American Physical Society

STEFAN KUHN et al. PHYSICAL REVIEW B 90, 195405 (2014)
FIG. 1. (Color online) (a) Scan protocol for the curve-by-curve acquisition mode, where alternating steps of tracking and data acquisitionare used. The total number of �f (z) curves is px for a single slice. The dashed orange line marks the reference tip-sample distance zref given bythe �f setpoint. (b) Timing and Z trajectory of the data acquisition. (c) Exemplary �f (z) curve, showing the frequency shift �f as a functionof tip-sample distance z. (d) Fz(z) curve extracted from the raw �f (z) data in (c) with applied filters (see main text).
grid (along the X and/or Y axes). In this mode, the Z directionis the fast scan direction along which the data are sampled. Wefavor the curve-by-curve method over other strategies suchas a layer-by-layer approach [25] for three reasons. First, tipchanges are easily identified while acquiring the data. Second,if a tip change occurs within the data acquisition, it is possibleto use the data up to the point of the tip change for the forcerecovery. Third, we expect to reduce artifacts caused by creepand hysteresis of the scanning piezos as well as residual driftin the curve-by-curve approach. Especially, we sample themost sensitive data nearby the �f (z) and Fz(z) curve minimawithout vastly repositioning the tip before data acquisition.
Severe drift conditions usually present at room temperaturerender a precise and effective drift compensation strategyindispensable when acquiring dense and high-resolutionforce interaction data. We employ the atom-tracking princi-ple [26,27] in a home-built implementation [21] for the driftmeasurement. This technique pins the scanning tip to a specificsample site by a lock-in detection with subangstrom precision.Based on the resulting drift velocities from following a surfacesite, we compensate for the unwanted movement by a feed-forward routine [22]. Before acquiring the actual 2D slice (ZX
mode), we scanned several images in regular AFM imaging(XY mode) and repeatedly corrected for thermal drift. Thisprocedure not only ensures to reduce the residual drift alreadyto a minimum, but especially decreases scanner creep. Theresidual drift due to the nonlinear contribution was typicallysignificantly below 100 pm/min before starting the ZX dataacquisition.
Figures 1(a) and 1(b) visualize the scan protocol itself. Weuse the atom-tracking technique to center the tip at a referenceposition usually located in the middle of the slice. In this case,the reference position is assigned to a single atomic surface siteand the tip is moved to every lateral position from this site toacquire a single �f (z) curve. The data acquisition requirestacq per curve. After moving the tip back to the referenceposition, the atom tracking compensates for nonlinear driftand creep contributions by precisely re-centering the tip onthe selected feature for time ttrack. In the herein presented data,residual and nonlinear drift contributions were in the order
of approximately 4 pm/min along X and approximately 7pm/min along Z and cause an error in the absolute lateral andvertical tip positioning during the acquisition time tacq of 6s toa maximum deviation along X (Z) of about 0.4 pm (0.7 pm),respectively. This uncertainty is smaller than the grid spacingand, thus, negligible.
Frequency shift versus distance �f (z) curves are recordedby first approaching the tip from the tip-sample distance zref ,as defined by the �f set point, closer to the surface to zmin.The tip is then retracted along Z to a maximum distance zmax
while sampling the frequency shift �f data. The retraction(approach) curve is sampled when moving the tip from zmin tozmax (zmax to zmin), respectively, and the tip is finally movedback to the reference height zref . The resulting Z trajectory isdepicted in Fig. 1(b). The stable point of smallest tip-sampleseparation zmin is highly dependent on the tip configurationand, accordingly, we chose it carefully for each experiment.Exemplary �f (z) and Fz(z) curves are reproduced in Figs. 1(c)and 1(d).
Our scan protocol requires a large number of parametersto be carefully chosen to optimize the data resolution, driftcompensation accuracy, and signal to noise ratio. A list ofparameters used for the data in this work is given in Table I.
B. Force conversion
Two of several force recovery strategies [28,29] haverecently been compared by means of simulated data [30].Based on this analysis, the Sader and Jarvis formalism [23]is expected to yield accurate results with reasonable numericaleffort for the range of amplitudes used herein and is con-sequently employed. They found that the vertical interactionforce Fz,ts is given from an integration of the raw �f data:
Fz,ts(z) = 2k
f0
∫ ∞
z
[(1 +
√A
8√
π (q − z)
)�f (q)
− A32√
2(q − z)
d(�f (q))
dq
]dq. (1)
195405-2

IDENTIFYING THE ABSOLUTE ORIENTATION OF A . . . PHYSICAL REVIEW B 90, 195405 (2014)
TABLE I. Parameter list for the ZX slice data acquisition.
parameter variable value
Grid settings:Number of curves along X px 201Points along Z pz 1000Size along X sx 3.48 nmSize along Z sz 1.17 nmSampling resolution in X resx 17.3 pmSampling resolution in Z resz 1.2 pm
Atom tracking:Dither frequency fdither 20 HzDither amplitude Adither 1.5 ATracking time ttrack 8 sDrift comp. update interval tupdate 15 min
Data acquisition:PLL bandwidth BPLL 400 HzTime/sample along Z tsample 3 msData acquisition time tacq 6 s
Here, k is the cantilever stiffness, f0 is the frequency of thefree oscillating cantilever, A is the oscillation amplitude and z
is the tip-sample distance.Practically, the integration to infinity is replaced by a finite
value ztop. This upper limit has to be chosen carefully by eithera value larger than at least twice the oscillation amplitude A
plus the relevant interaction range, or by a value from whichon �f remains zero to avoid artifacts in the resulting force. Tomaintain the high resolution close to the sample but to avoidunnecessary long measurement times in the long-range regime,we record several �f (z) curves at the end of every experimentwith ztop around 50 nm. These data are combined with thesite-specific, short-range grid curves by interpolating the long-range curves to match the sampling interval of the short-rangedata. Each curve resulting from this data combination spansmore than twice the oscillation amplitude while at the sametime maintaining the raw data across the interaction regime.
The integral in Eq. (1) is improper due to a pole of theintegrand at q = z. The discrete formulation of Eq. (1) shownin Eq. (2) employs correction terms handling the pole assuggested in Ref. [31] (we implemented Eq. (2) in a MATLAB
code):
Fz,ts(zk) = 2k
f0
[�f (zk) �z + 1
√A
4√
π�f (zk)
√�z
− 2A32√
2
�f (zk+1) − �f (zk)√�z
]
+ 2k
f0
N−1∑i=k+1
[1 +
√A
8√
π (zi − zk)�f (zi)
− A32√
2(zi − zk)
�f (zi+1) − �f (zi)
�z
]�z. (2)
We calibrated the oscillation amplitude A using theconstant-γ method described by Heyde et al. [32]. Thedynamic stiffness k of the cantilever was obtained fromthe thermal cantilever noise as analyzed in detail by
TABLE II. Filter parameters used for the force recovery.
parameter variable value
Lanczos differentiator:order nL 5
Savitzky-Golay filter:degree mp 3span nSG 5
(corresponds to 7 pm)
Lubbe et al. [33]. The resonance frequency f0 of the freecantilever was determined by the phase-locked loop (PLL)using a high-quality reference oscillator.
All data were acquired at large PLL bandwidths andlarge pixel numbers. Digital filters are applied afterwardsto reduce the noise in our measurement data. Specifially,Lanczos differentiators are employed for calculating thederivative in Eq. (2) and Savitzky-Golay filters are used forsmoothing the data after the force recovery. For the latter,we use the smooth function implemented in MATLAB. Thisstep allows us to critically check the filters influence anddetect possible artifacts. To assess the quality of the forcerecovery, we use model calculations similar to the work byWelker et al. [30]. We evaluate and optimize the coefficient ofdetermination R2 as well as the deviation of the force minimumposition �zmin and value �Fmin. Data are simulated froma Morse potential superimposed by random noise reflectingthe experimental situation and tip-calcite interaction. Fromextensive simulations we are confident that we found mostsuitable parameters for the present experimental data as wellas the noise level of our system. These parameters are listedin Table II. For these filters, experimental parameters andconditions we obtain an uncertainty in the total force in theorder of 5 pN due to the conversion.
C. Short-range forces
Lateral short-range forces Fy are calculated from the neg-ative derivative of the potential with respect to the horizontaldirection,
Fy = −∂U
∂y. (3)
Due to the data alignment along the [42.1] direction (unit cellvector �b), we denote the lateral coordinate as y. We decreasedthe noise in the lateral force data by using a five-pixel meanfilter along both axes.
The short-range vertical interaction forces Fz,SR are ex-tracted by fitting and subtracting the long-range van der Waalsforces FvdW from our total force Fz data. This procedure is adelicate task [24,34], especially as the herein investigated cal-cite system does not allow for using the reference-curve basedapproach [34,35]. We do not include electrostatic interactionsas we experimentally minimized electrostatic forces using theKelvin probe technique measured at a representative sampleposition before the slice data acquisition [36].
Based on a detailed analysis [24] of ten different van derWaals descriptions, we identified the van der Waals force lawintroduced by Zanette et al. [37] to model the van der Waals
195405-3

STEFAN KUHN et al. PHYSICAL REVIEW B 90, 195405 (2014)
FIG. 2. (Color online) (a) Fit quality expressed as the meansquared error MSE from fitting a van der Waals model to themean experimental curve as a function of the lower fit range zcut.(b) Standard deviation σz of the vertical force Fz. (c) Standarddeviation σy of the lateral force Fy . Resulting cutoff points are markedin both panels. (d) Mean total vertical interaction force Fz (blue), vander Waals interaction force FvdW (red), and resulting mean verticalshort-range force Fz,SR (black) (Ref. [24]).
contribution most reliably for our data. The central challengeof short-range force extraction is to find the cutoff point zcut,which marks the transition from pure long-range and site-unspecific to mixed interaction when bringing the tip closer tothe surface.
Results of our analysis are reproduced in Fig. 2, where panel(a) presents the quality of the fit using the mean squared errorMSE as a function of zcut. The best regression is found whenfitting the data along the z range [zcut,zmax] with zcut = 5.2 A.We introduced two further independent criteria for refining thevalue of zcut [24], namely the standard deviation σ of verticaland lateral forces. In presence of site-specific forces, a clearincrease in σz (σy) of the vertical (lateral) force is expected.The results of this analysis are shown in Figs. 2(b) and 2(c)and allows us to refine zcut to 5.8 A.
The mean total vertical force Fz, the modelled van derWaals interaction FvdW and the resulting mean short-rangeforce Fz,SR using zcut = 5.8 A are depicted blue, red andblack, respectively, in Fig. 2(d). For the full data set, FvdW
is subtracted from every Fz(y) curve. Further details andthe resulting model parameters are given in Appendix B.We find an uncertainty of the force minimum position andmagnitude of about δz = 0.4 A and δF = 60 pN, respectively.Additionally, the position of the Fz,SR zero, i.e., the transition
from attractive to repulsive forces, is subject to an uncertaintyof about δz = 0.4 A.
III. PROPERTIES OF CALCITE
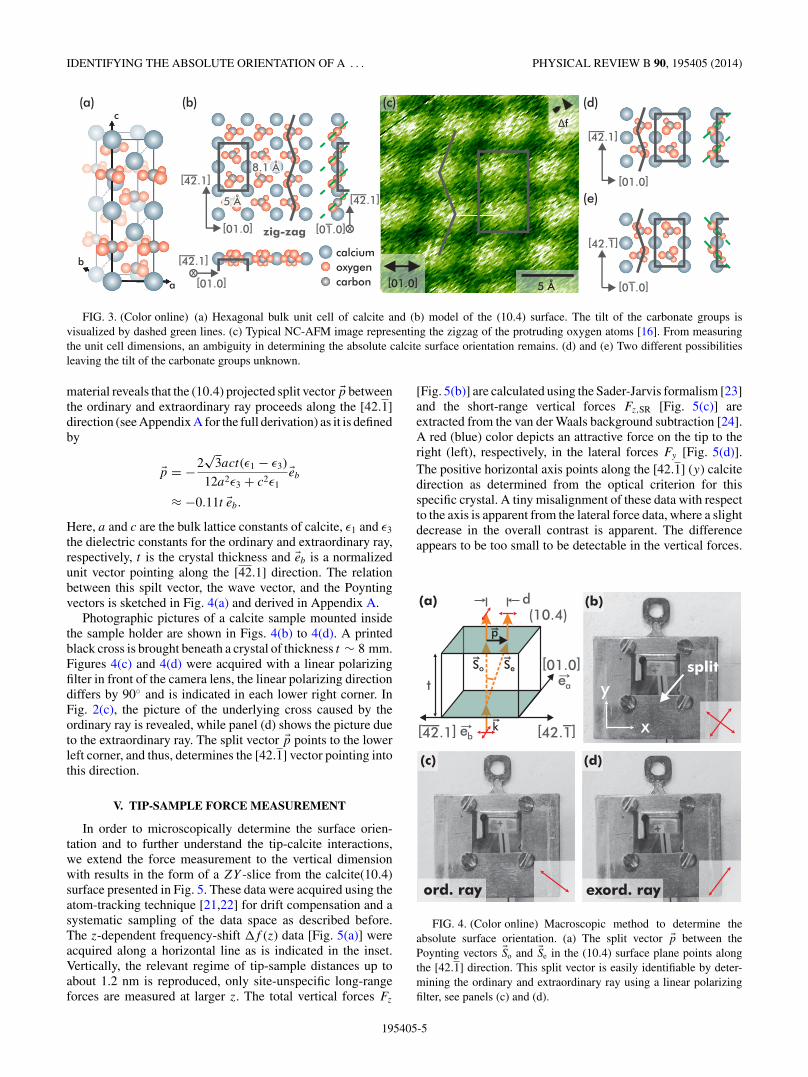
Calcite(10.4) is the energetically most favorable surfaceof the most stable polymorph of calcium carbonate (CaCO3).Calcite crystallizes in a trigonal crystal system described byspace group R3c [38], the hexagonal bulk unit cell is depictedin Fig. 3(a).
The bulk-truncated, unreconstructed surface ofcalcite(10.4) has a rectangular unit cell with dimensions [39]
of 4.99 × 8.10 A2
and with the unit cell vectors �a and�b oriented along the [01.0] and [42.1] crystallographicdirections, respectively. Two calcium ions and two carbonate(CO3) groups are located within every unit cell, the twocarbonate groups being tilted in the bulk by an angle of 44.63◦with respect to the (10.4) planes [see Fig. 3(b)] [15,39].Additionally, these two carbonate groups are rotated withrespect to each other, causing the topmost oxygen atom topoint either to the left or to the right in a zigzag fashion [seeFig. 3(b)].
It is mainly the tilt of the carbonate groups, as visualized bya green dashed line in Fig. 3(b), which reduces the symmetryof the surface and renders it a member of the plane symmetrygroup pg. Only one glide plane reflection with the glideaxis oriented along the [42.1] direction is left as a surfaceisomorphism [40] and, consequently, the [42.1] and [42.1]directions are not equivalent. We note that the undeterminedsurface orientation is fully defined by the tilt direction of thecarbonate groups.
Figure 3(c) presents one prototypical contrast reflectingthe surface unit cell and the zigzag pattern of the topmostoxygen atoms [16]. Two reconstructions, which have beenobserved before and whose existence and origins are stilldiscussed controversially [41–44], are not resolved in thiscontrast mode. We note in this context that numerous differentNC-AFM contrast modes have been observed on calcite(10.4)before [16]. Although the general alignment of the [01.0]and [42.1] surface directions can be obtained in all contrastmodes directly from the unit cell size1 in XY -scanned images,the absolute surface orientation remains, as mentioned above,unknown as the tilt of the carbonate groups is first hand notrevealed within these data [see Figs. 3(d) and 3(e) for the twopossibilities].
IV. OPTICAL IDENTIFICATION
Besides its natural relevance, calcite constitutes a partic-ularly well-suited sample for relating the surface asymmetrymeasured within this work on the microscopic scale to thecrystal directions, as this sample provides an independent wayof easily identifying the surface orientation by macroscopicmeans without the necessity of, i.e., x-ray diffraction exper-iments. An analysis of the optical birefringence of the bulk
1Besides a careful calibration of the microscope, the images arecorrected for thermal drift [54] and scanner creep to accuratelydetermine the unit cell sizes.
195405-4
IDENTIFYING THE ABSOLUTE ORIENTATION OF A . . . PHYSICAL REVIEW B 90, 195405 (2014)
FIG. 3. (Color online) (a) Hexagonal bulk unit cell of calcite and (b) model of the (10.4) surface. The tilt of the carbonate groups isvisualized by dashed green lines. (c) Typical NC-AFM image representing the zigzag of the protruding oxygen atoms [16]. From measuringthe unit cell dimensions, an ambiguity in determining the absolute calcite surface orientation remains. (d) and (e) Two different possibilitiesleaving the tilt of the carbonate groups unknown.
material reveals that the (10.4) projected split vector �p betweenthe ordinary and extraordinary ray proceeds along the [42.1]direction (see Appendix A for the full derivation) as it is definedby
�p = −2√
3act(ε1 − ε3)
12a2ε3 + c2ε1�eb
≈ −0.11t �eb.
Here, a and c are the bulk lattice constants of calcite, ε1 and ε3
the dielectric constants for the ordinary and extraordinary ray,respectively, t is the crystal thickness and �eb is a normalizedunit vector pointing along the [42.1] direction. The relationbetween this spilt vector, the wave vector, and the Poyntingvectors is sketched in Fig. 4(a) and derived in Appendix A.
Photographic pictures of a calcite sample mounted insidethe sample holder are shown in Figs. 4(b) to 4(d). A printedblack cross is brought beneath a crystal of thickness t ∼ 8 mm.Figures 4(c) and 4(d) were acquired with a linear polarizingfilter in front of the camera lens, the linear polarizing directiondiffers by 90◦ and is indicated in each lower right corner. InFig. 2(c), the picture of the underlying cross caused by theordinary ray is revealed, while panel (d) shows the picture dueto the extraordinary ray. The split vector �p points to the lowerleft corner, and thus, determines the [42.1] vector pointing intothis direction.
V. TIP-SAMPLE FORCE MEASUREMENT
In order to microscopically determine the surface orien-tation and to further understand the tip-calcite interactions,we extend the force measurement to the vertical dimensionwith results in the form of a ZY -slice from the calcite(10.4)surface presented in Fig. 5. These data were acquired using theatom-tracking technique [21,22] for drift compensation and asystematic sampling of the data space as described before.The z-dependent frequency-shift �f (z) data [Fig. 5(a)] wereacquired along a horizontal line as is indicated in the inset.Vertically, the relevant regime of tip-sample distances up toabout 1.2 nm is reproduced, only site-unspecific long-rangeforces are measured at larger z. The total vertical forces Fz
[Fig. 5(b)] are calculated using the Sader-Jarvis formalism [23]and the short-range vertical forces Fz,SR [Fig. 5(c)] areextracted from the van der Waals background subtraction [24].A red (blue) color depicts an attractive force on the tip to theright (left), respectively, in the lateral forces Fy [Fig. 5(d)].The positive horizontal axis points along the [42.1] (y) calcitedirection as determined from the optical criterion for thisspecific crystal. A tiny misalignment of these data with respectto the axis is apparent from the lateral force data, where a slightdecrease in the overall contrast is apparent. The differenceappears to be too small to be detectable in the vertical forces.
FIG. 4. (Color online) Macroscopic method to determine theabsolute surface orientation. (a) The split vector �p between thePoynting vectors �So and �Se in the (10.4) surface plane points alongthe [42.1] direction. This split vector is easily identifiable by deter-mining the ordinary and extraordinary ray using a linear polarizingfilter, see panels (c) and (d).
195405-5

STEFAN KUHN et al. PHYSICAL REVIEW B 90, 195405 (2014)
FIG. 5. (Color online) (a) Frequency shift �f data from a ZY
dataset with size 1.17 × 3.48 nm2 (total of 1000 × 201 pixel). Theinset shows the 10 × 6.7 nm2 XY -scanned �f image prior andsubsequent to the 2D data acquisition. The orange arrow indicatesthe position of the ZY measurement, the yellow circle marks a pointdefect. The z position of this inset is marked by a red arrow at thevertical axis of the ZY data set. (b) Total vertical interaction forcesFz calculated from (a). (c) Short-range vertical forces Fz,SR and (d)lateral forces. Unit cell periodicity is marked in all images and thehalf-transparent lines guide the eye to the tilted features. (e) Trueto scale calcite(10.4) surface model aligned according to long-rangeattractive interactions with the CO3 groups.
The total force is overall attractive (negative) throughout thisdata set with the minimum at about −0.6 nN.
The capability of imaging a single defect (marked by dashedyellow circles) indicates the presence of a most sharp AFMtip. The position of the ZY data slice was chosen such that itpartly covers this surface defect. The difference in corrugationwithin each unit cell is ascribed to the zigzag orientation of thecarbonate groups. As is apparent from the model in Fig. 3(b),every second top-most oxygen atom points out of the planemapped in the experiment, while every other points inwards.This modulation is apparent in both, vertical and lateral data.
The most striking observation in Figs. 5(a) to 5(d), however,is a significant asymmetry observed in the raw frequency shift�f and force data sets. When following either a bright or darkregion along the Z axis, a bend of the respective regions uponapproach to the surface becomes apparent in panels (a) to (c).We include a half-transparent guide to the eye for illustrating
this tilt. It manifests a clear asymmetry along the vertical axisin agreement with the surface asymmetry along this directioncaused by the tilt of the carbonate groups.
We critically analyzed the NC-AFM setup and data process-ing (including the relative tip-sample orientation, cantilevertilt, piezo artifacts and force recovery strategy) and found thesame orientation of the tilt in repeated experiments underdifferent tip and sample conditions. Consequently, we areconfident about a physical origin of the observed tilt andidentify two sources: the tilt is supposedly caused by eitheran asymmetry of the investigated surface or of the scanningtip. An asymmetric tip apex can lead to an asymmetry in thetip-sample interaction forces, which might propagate eitherdirectly or via a tip or a surface relaxation into the measureddata. This has been observed before on high-symmetrysurfaces, namely on KBr(001) [10,45], NaCl(001) [11], andgraphite(0001) [46]. Any measured asymmetric tilt of the sur-face species on these substrates is in clear disagreement withthe surface geometry and symmetry properties. Consequently,the data have been explained by either a tip deformation or bya tip-induced sample manipulation upon close approach dueto an asymmetric tip.
VI. DISCUSSION
Foster et al. modeled the calcite surface structure inpresence of a scanning probe tip and found a surface relaxationincluding shifts of all surface species as well as a rotationof the surface carbonate groups [12,47]. Their numericalcalculations have furthermore suggested two possibilities forthe tip-surface interaction [12]: a more attractive force betweenthe AFM tip and either the calcium or the carbonate ion,causing the carbonate group being either pushed into or pulledoutwards from the surface by the atop positioned tip. Ourdata are in agreement with the latter situation, namely alarger attractive interaction between the tip and the carbonateion. First, we observe at small tip-sample distances in XYimages a zigzag structure [see inset Fig. 5(a)] that has beenassociated with the alternating orientation of the protrudingoxygen atoms before [12,48]. Second, the high-symmetriccalcium atoms are unlikely to cause a tilted feature. Third, thisassignment would, in a straightforward electrostatic picture,be in agreement with a positive tip termination. This situationhas been postulated before as one imaging mode for thecalcite(10.4) surface [12,47] and has also been suggested as ageneral property of conducting tips [49].
Following this conclusion, an analysis of the transitionfrom site-unspecific long-range interactions to the site-specificshort-range interaction regime in the total vertical force Fz dataallows for assigning the surface species. Figure 6(a) presentsa line profile from this regime, extracted at z = 4.2 A andaveraged over 0.59 A [see Fig. 6(b)]. A sinusoidal function isfitted to the experimental data (in red) as a guide to the eye.At this tip-sample distance, we expect to measure the surfacestructure mainly undisturbed by the presence of the tip and,thus, can use this region to relate our experimental data to amodel of the surface structure.
If we assume an attractive interaction of the tip with thefull carbonate group as substantiated before, we can assign thepositions of maximum attractive interaction to the positions of
195405-6

IDENTIFYING THE ABSOLUTE ORIENTATION OF A . . . PHYSICAL REVIEW B 90, 195405 (2014)
FIG. 6. (Color online) Onset of total vertical forces Fz employedfor the assignment of surface species in the data set. The line profile in(a) is extracted at the vertical onset of atomic corrugation at z = 4.2 Afrom the Fz data in (b).
the carbonate group centers as depicted in Fig. 6. Interestingly,this assignment is in agreement with the measurement of lateralforces presented later in Fig. 7(b). We find a sector towardswhich the tip feels an attractive force from both the left andthe right sides in the lateral forces. This sector is located in-between the red and blue area. Importantly, these areas of
FIG. 7. (Color online) (a) Vertical short range forces Fz,SR and (b)lateral forces Fy extracted for a single surface unit cell. The heightsof Fz,SR(z) = 0 are marked by red lines. (c) Corresponding model inside- and top-view aligned with the experimental data.
large lateral forces are clearly tilted and this tilt has the sameorientation as observed in the vertical forces before.
Thus, these data are in full agreement with imaging thecarbonate groups attractive and as a single entity at large tip-sample distances (height z1 as indicated in Fig. 7). The surfacestructure in Figs. 5 and 7 are accordingly included.
To further analyze the tip-surface interaction mechanismon the calcite(10.4) surface, we focus on the vertical Fz,SR andlateral Fy short-range forces across a single unit cell extractedfrom the full dataset and reproduced in Figs. 7(a) and 7(b),respectively. The short-range forces Fz,SR describe the specificinteraction of the tip front atoms with each surface species.We determine the tip height for the optimum binding positionfrom the zero of Fz,SR (simultaneously the minimum of theshort-range interaction potential) and mark these heights z3
by a solid red line in Figs. 7(a) and 7(b). At the same height,the lateral forces exhibit a regime of reduced interactions—afinding giving us strong confidence about the validity of ourshort-range force extraction procedure.
Based on this analysis, the tilt is exclusively observed attip-sample distances larger than the force zero, namely, atheights z1 and z2 as marked in Fig. 7. This allows us to concludethat purely attractive short-range interactions between the tipapex and the surface species are responsible for the observedtilt. This tilt constitutes the passage from a short-range forceuninfluenced carbonate group (at tip-sample distances z > z1)to the optimum carbonate binding situation in the combinedtip-sample potential (at tip-sample distance z = z3).
When uniting all findings, we explain the orientation of thetilt in the regime of attractive short-range forces by a transitionbetween two interactions: at large tip-sample distances (aroundheight z1 in Fig. 7) our Fz,SR data suggests the largest attractionbetween the tip and the carbonate group as one entity. Whenreducing the tip-sample distance at z < z1, we explain thetip-surface attraction being dominated by the force betweenthe tip and the protruding oxygen atom only; the proximityto the oxygen atom is understood to outweigh the attractionto the whole group. Both cases are illustrated in Fig. 8. Thisexplanation is further substantiated when inspecting the lateralforce Fy data in Fig. 7(b): a zone (marked by two triangles) towhich the tip is dragged from both the left and the right sidesis clearly apparent. From the surface structure depicted below,we identify the topmost oxygen atom lying centered in thiszone. With this explanation, the observed shift of the tilt to theright originates in the position of the oxygen atom and, thus,in the orientation of the carbonate group and the surface.
FIG. 8. (Color online) (a) The full carbonate group is imagedat large tip-sample distances, while (b) the maximum attractiveinteraction shifts towards the topmost oxygen atom, located at theright.
195405-7

STEFAN KUHN et al. PHYSICAL REVIEW B 90, 195405 (2014)
The trajectory of the tilt in the lateral and vertical force datawithin height ranges z1 and z2 is in good agreement with thesurface geometry. However, relaxation of the surface carbonategroup or secondary interactions with the neighboring surfaceor tip species could lead to an amplification of the observed tilt,especially giving a plausible explanation for the tail observedin the vertical interaction at tip-sample distances z3 and closer.The relaxation of single molecules has very recently beenmeasured for the case of two CO molecules [50], which bendtowards each other in the attractive interaction regime. Theobservation of strikingly similar features in our lateral forcedata leads us to the conclusion that a relaxation of the carbonategroup in the surface might amplify the interaction transition,especially at small tip-sample distances. The repeatability ofobserving the same tilt orientation under different conditions,the identification of pure attractive interactions and ourexplanation gives us strong confidence that the calcite surfaceis the source for the tilt orientation in our data and, thus, allowsfor determining the absolute surface orientation.
VII. CONCLUSIONS
In conclusion, we investigated the tip-sample interactionforces on a low-symmetry substrate, namely the calcite(10.4)surface. We found a pronounced tilt of the measured surfacespecies in our vertical and lateral force data, which we clearlyidentified as pure attractive short-range interaction. We explainthese attractive short-range force data by a transition from thetip interacting with the entire carbonate group to an interactionwith the topmost oxygen atom only at reduced tip-sampledistances. The experimentally observed tilt is related to thesurface structure and symmetry and discloses the absolutesurface orientation—a parameter especially relevant whenstudying physicochemical processes in the context of, i.e.,understanding and mimicking biomineralisation. Thus, theability to directly determine an essential surface property frominteraction force data constitutes another important step in thefield of investigating crystalline surfaces in real space.
ACKNOWLEDGMENTS
This work was supported by the German Research Foun-dation through grant KU 1980/4-1 and by a Grant-in-Aidfor Scientific Research from the Ministry of Education,Culture, Sports, Science and Technology of Japan (26110516,26600015, 26600099, 25106002, 24360016, and 22221006),and Funding Program for Next Generation World-LeadingResearchers. P.R. gratefully acknowledges funding from theAlexander von Humboldt Foundation. We thank Ralf Bech-stein for stimulating discussions and Jurgen Koble (OmicronNanotechnology) for helpful support with the MATE scriptinginterface.
APPENDIX A: MACROSCOPIC IDENTIFICATION OF THEABSOLUTE SURFACE ORIENTATION OF CALCITE
Calcite offers an elegant strategy to determine the absolute(10.4) surface orientation macroscopically by exploiting thebirefringence of the material. This appendix presents thederivation for relating the [42.1] orientation to the split
direction of the ordinary and extraordinary ray in the (10.4)plane for a light ray passing perpendicular through the (10.4)surface.
We first define the matrix M as the transformation matrixbetween the hexagonal Miller indices �rh used in crystallogra-phy for calcite and the cartesian coordinates �r used to describethe optical properties from �r = M �rh as
M =
⎛⎜⎝
a − a2 0
0 a√
32 0
0 0 c
⎞⎟⎠ (A1)
with a and c being the bulk lattice constants of calcite [39].In the following, all coordinates given refer to the cartesiansystem unless noted by a lower index h. The normalized unitcell vectors of the (10.4) surface in a Cartesian coordinatesystem are given by
�ea = M
⎛⎜⎝
0
1
0
⎞⎟⎠
h
= 1
2
⎛⎜⎝
−1√3
0
⎞⎟⎠ (A2)
and
�eb = M
⎛⎜⎝
−4
−2
1
⎞⎟⎠
h
= 1√12a2 + c2
⎛⎜⎝
−3a
−√3a
c
⎞⎟⎠. (A3)
The normalized wave vector �k for a plane wave entering thecalcite crystal perpendicular through any (10.4) plane is givenby
�k = �ea × �eb
|�ea × �eb| = 1
2√
12a2 + c2
⎛⎜⎝
√3c
c
4√
3a
⎞⎟⎠. (A4)
We define θ as the angle between the negative wave vector �kand the z axis �ez. This angle is identical to the well-knownangle of the carbonate group tilt in the (10.4) surface planeand is calculated to
θ = ∠(−�k,�ez) ≈ 44.63◦. (A5)
This equivalency is visualized in Fig. 9 (note that the wavevector �k and the vector �e(10.4) normal to the (10.4) surface areantiparallel).
Calcite is optically uniaxial. The electric permittivity tensorε has in the principal coordinate system following diagonalquadratic form:
ε =⎛⎝ε1 0 0
0 ε1 00 0 ε3
⎞⎠. (A6)
Here, ε1 and ε3 are the electric permittivities for the principalaxes. The relation n = √
ε generally links the indices ofrefraction to the electric permittivities for the optical regimeand we use values from Ref. [51],
ε1 = n2o ≈ 2.749, (A7)
ε3 = n2e ≈ 2.208. (A8)
195405-8

IDENTIFYING THE ABSOLUTE ORIENTATION OF A . . . PHYSICAL REVIEW B 90, 195405 (2014)
FIG. 9. (Color online) Relation between the wave vector �k, theunit cell vector �ez along c, the surface normal vector �e(10.4) and theangle . Note that for simplicity only the projection to the a-c planeis shown.
For our specific case of light rays entering the crystal notalong a principal axis, but perpendicular to the (10.4) surface,we find the refractive index for the extraordinary ray usingformula 6.3-15 from [52]:
1
ne(θ )2= cos(θ )2
n2o
+ sin(θ )2
n2e
, (A9)
ne(θ ) ≈ 1.57, (A10)
where θ is given by Eq. (A5). The refractive index no ≈ 1.66for the ordinary ray remains unchanged irrespective of the rayorientation.
Equation (A9) has been derived for optical uniaxial materi-als using the optical indicatrix as the representation of η = ε−1.This optical indicatrix can be visualized by an ellipsoid asdepicted in Fig. 10(a). The intersection of the (10.4) plane withthis ellipsoid is defined as the index ellipse and is presented inFig. 10(b).
FIG. 10. (Color online) (a) Optical indicatrix for CaCO3 (bluesphere) including the position of the (10.4) surface plane (greenplane). Base vectors of a Cartesian coordinate system (in red) andunit cell vectors of the (10.4) plane (in magenta) are included.(b) Index ellipse for a light ray crossing the (10.4) plane perpendicular.
The semiminor (semimajor) axis in this index ellipsedefines the indices of refraction no (ne) for the ordinary(extraordinary) ray, respectively. We will show later that thesemiminor (semimajor) axis is furthermore oriented along the[01.0] ([42.1]) directions, respectively. The latter statementalso holds for the electric displacement field vector �Do ( �De),respectively.
The normalized Poynting vector for both, the ordinary andextraordinary ray, can be expressed by
�Si =�Ei,0 × (�k × �Ei,0)
| �Ei,0 × (�k × �Ei,0)| , (A11)
where �Ei,0 is the electric field vector and �k is the wave vector.For light rays entering the crystal perpendicular to the (10.4)planes, the wave vector is oriented perpendicular to the (10.4)planes as given by Eq. (A4). In the following, we set i = o(i = e) for the ordinary (extraordinary) ray, respectively.
1. Ordinary ray
The electric displacement vector �Do for the ordinary ray isnormal to the plane defined by the optical axis (here �ez) and thedirection of wave propagation �k [52]. Thus, we can calculate�Do directly from
�Do = �ez × �k|�ez × �k| = 1
2
⎛⎜⎝
−1√3
0
⎞⎟⎠. (A12)
The vector is normalized to one. It is directly apparentthat this vector is identical to the [01.0] unit cell vector �ea
[Eq. (A2)]. We find the according electric field vector �Eo from�Eo = ε−1 �Do and finally calculate the normalized Poyntingvector from Eq. (A11) to
�So = 1
2√
12a2 + c2
⎛⎝
√3c
c
4√
3a
⎞⎠. (A13)
This vector is identical to the wave propagation vector �k.
2. Extraordinary ray
For the extraordinary ray, the electric displacement vector�De is normal to the wave propagation vector �k and lies in the
plane spanned by �k and �ez [52]. These relations are formulatedby
0 = �De · (�k × �ez), (A14)
0 = �De · �k. (A15)
We further normalize �De by | �De| = 1 and ensure its orientationalong the positive z axis from 0 < �De · �ez. The normalizedelectric displacement vector �De is found as the solution ofthese equations to
�De = 1√12a2 + c2
⎛⎜⎝
−3a
−√3a
c
⎞⎟⎠. (A16)
195405-9

STEFAN KUHN et al. PHYSICAL REVIEW B 90, 195405 (2014)
This vector is aligned along the [42.1] direction as it is identicalwith the unit cell vector �eb [Eq. (A3)]. The corresponding elec-tric field vector is calculated from �Ee = ε−1 �De and we finallyfind the normalized Poynting vector for the extraordinary ray:
�Se = 1
2√
12a2ε23 + c2ε2
1
⎛⎜⎝
√3cε1
cε1
4√
3aε3
⎞⎟⎠. (A17)
3. Split vector
The angle α between the two Poynting vectors is given by
α = arccos
( �So · �Se
| �So|| �Se|
)
= arccos
(12a2ε3 + c2ε1√
(12a2 + c2)(12a2ε2
3 + c2ε21
))
, (A18)
where the material constants for this crystal are used in thesecond step. With this angle, the split vector �p defined as thevector pointing from the ordinary to the extraordinary ray inthe (10.4) plane for a crystal of thickness t follows from
�p = t
cos α�Se − t �So. (A19)
This vector �p is aligned along the [42.1] direction as we findonly one negative solution for
�p = d �eb, (A20)
namely,
d = −2√
3act(ε1 − ε3)
12a2ε3 + c2ε1≈ −0.11t (A21)
(ε1 > ε3 for calcite). This length is at the same time the splitdistance between the ordinary and the extraordinary ray inthe (10.4) plane of calcite. The relation between the Poyntingvectors, the calcite crystallographic directions and the splitvector are visualized in the main text, Fig. 4(a). For a crystalof t = 5 mm, we find a split length of about 0.55 mm, whichis visible by the bare eye.
APPENDIX B: SHORT-RANGE VERTICAL FORCES
The van der Waals force law given by Zanette et al. [37]was found to most reliably represent the long-range interactionin our data [24]. It describes the probe as a tip-side truncatedpyramid of infinite height with a spherical cap terminating thetruncated end. The opening angle of the pyramid measured tothe center of each side plane is denoted as θ and the half-sidelength of the blunt pyramid end is L. The cap is a sphericalsegment with height h1 of a virtually full sphere with radius R.We eliminated the fitting parameter L by geometric relationsbetween the quantities [24]. In the course of our analysis, wefurthermore fixed the tip radius to 25 nm, since this parameteris not independent from the other parameters. The shape of theresulting van der Waals force curve is, however, independentover a large regime of R; consequently we found no artifactsintroduced by this approach. The tip-sample distance z ismeasured from the lowest point of the spherical cap to the
TABLE III. Parameters resulting from the optimum fit of Eq. (B1)to the experimental mean curve Fz.
cutoff point zcut 5.8 A
z offset zoff 0.13 nmHamaker constant H 0.61 × 10⁻²⁰ Jtip radius (fixed) R 25 nmhalf-opening angle θ 77.2◦
spherical cap height h1 1.2 nmhalf width of truncated end L 7.56 nm
uncertainty force minimum position δzmin 0.4 Auncertainty force minimum value δFmin 60 pNuncertainty zero force position δzzero 0.4 A
sample surface represented by an infinite plane. We include afit parameter zoff to account for a shift along the z axis withrespect to the short-range interaction. The van der Waals forcelaw is given by [24,37]
FvdW(z; H,R,θ,h1,zoff)
= −H
6
[h2
1(3Rz + (R − z)h1)
z2(z + h1)3+ R2 − (R − h1)2
(z + h1)3
+ 4 tan(θ )(√
R2 − (R − h1)2 + tan(θ )(z + h1))
π (z + h1)2
](B1)
with z = z + zoff . We fit this force law to the experimentalmean curve Fz, which is calculated as the average curve alongthe horizontal y direction:
Fz(z) = 1
M
M∑j=1
Fz(yj ,z). (B2)
The resulting fit parameters are listed in Table III.
APPENDIX C: SUPPLEMENTARY DATAFOR THE 2D FORCE SLICE
All measurement channels for the data presented inFigs. 5–7 are reproduced in Fig. 11. No site-specific contrast isapparent in the amplitude data shown in Fig. 11(c), instead wefind pure white noise with σ ≈ 1.5 pm. With the amplitudeconstant to better than 0.01%, we find that the Sader-Jarvisforce recovery strategy given in Eq. (1) is fully justified.A small site-specific contrast is observed in the dissipation (z) data in Fig. 11(d). These data were converted to unitsof eV/cycle using Eq. (1) in Ref. [53]. In our dataset,the dissipative contribution raises to a maximum of around180 meV/cycle at very close tip-sample distances. We findthe largest dissipation within this data set next to the identifiedpoint defect as indicated in Fig. 5 by a dashed yellow circle. It isnoteworthy to mention that although we measure a dissipativeinteraction, no change in the amplitude is apparent.
195405-10

IDENTIFYING THE ABSOLUTE ORIENTATION OF A . . . PHYSICAL REVIEW B 90, 195405 (2014)
FIG. 11. (Color online) (a) Frequency shift �f , (b) vertical total force interaction Fz, (c) amplitude A, and (d) dissipation data. The dataare represented with a stretched vertical axis for better representation. (e) Frequency shift (dark blue), recovered force (gray) as well as Lanczosand Savitzky-Golay filtered force (red) data extracted from positions marked by dotted vertical lines in the respective slice data.
[1] G. Binnig, H. Rohrer, C. Gerber, and E. Weibel, Phys. Rev. Lett.49, 57 (1982).
[2] G. Binnig, C. F. Quate, and Ch. Gerber, Phys. Rev. Lett. 56, 930(1986).
[3] F. J. Giessibl, Science 267, 68 (1995).[4] G. H. Simon, T. Konig, M. Nilius, H. P. Rust, M. Heyde, and
H.-J. Freund, Phys. Rev. B 78, 113401 (2008).[5] C. Barth and M. Reichling, Nature (London) 414, 54 (2001).[6] P. Rahe, M. Kittelmann, J. L. Neff, M. Nimmrich, M. Reichling,
P. Maass, and A. Kuhnle, Adv. Mater. 25, 3948 (2013).[7] J. V. Barth, G. Costantini, and K. Kern, Nature (London) 437,
671 (2005).[8] L. Gross, F. Mohn, N. Moll, P. Liljeroth, and G. Meyer, Science
325, 1110 (2009).[9] L. Gross, Nat. Chem. 3, 273 (2011).
[10] B. Such, T. Glatzel, S. Kawai, S. Koch, and E. Meyer, J. Vac.Sci. Technol. B 28, C4B1 (2010).
[11] S. Kawai, T. Glatzel, S. Koch, A. Baratoff, and E. Meyer, Phys.Rev. B 83, 035421 (2011).
[12] A. S. Foster, A. L. Shluger, and R. M. Nieminen, Appl. Surf.Sci. 188, 306 (2002).
[13] C. Barth, A. S. Foster, C. R. Henry, and A. L. Shluger, Adv.Mater. 23, 477 (2011).
[14] R. Bennewitz, S. Schar, V. Barwich, O. Pfeiffer, E. Meyer,F. Krok, B. Such, J. Kolodzej, and M. Szymonski, Surf. Sci.474, L197 (2001).
[15] W. A. Deer, R. A. Howie, and J. Zussman, An Introduction to theRock Forming Minerals (Pearson Education Limited, Harlow,England, 1992).
[16] P. Rahe, J. Schutte, and A. Kuhnle, J.f Phys.: Condens. Matter24, 084006 (2012).
[17] S. Kawai, C. M. Pina, A. Bubendorf, G. Fessler, T. Glatzel,E. Gnecco, and E. Meyer, Nanotechnol. 24, 055702 (2013).
[18] G. Meyer and N. M. Amer, Appl. Phys. Lett. 53, 1045(1988).
[19] T. R. Albrecht, P. Grutter, D. Horne, and D. Rugar, J. Appl.Phys. 69, 668 (1991).
[20] Y. Sugimoto, T. Namikawa, K. Miki, M. Abe, and S. Morita,Phys. Rev. B 77, 195424 (2008).
[21] P. Rahe, J. Schutte, W. Schniederberend, M. Reichling, M. Abe,Y. Sugimoto, and A. Kuhnle, Rev. Sci. Instrum. 82, 063704(2011).
[22] M. Abe, Y. Sugimoto, T. Namikawa, K. Morita, N. Oyabu, andS. Morita, Appl. Phys. Lett. 90, 203103 (2007).
[23] J. E. Sader and S. P. Jarvis, Appl. Phys. Lett. 84, 1801(2004).
[24] S. Kuhn and P. Rahe, Phys. Rev. B 89, 235417 (2014).[25] B. J. Albers, T. C. Schwendemann, M. Z. Baykara, N. Pilet, M.
Liebmann, E. I. Altman, and U. D. Schwarz, Nat. Nanotechnol.4, 307 (2009).
[26] D. W. Pohl and R. Moller, Rev.f Sci.ic Instrum. 59, 840(1988).
[27] M. Abe, Y. Sugimoto, O. Custance, and S. Morita, Nanotechnol.16, 3029 (2005).
[28] U. Durig, Appl. Phys. Lett. 75, 433 (1999).[29] F. J. Giessibl, Appl. Phys. Lett. 78, 123 (2001).[30] J. Welker, E. Illek, and F. J. Giessibl, Beilstein J. Nanotechnol.
3, 238 (2012).
195405-11

STEFAN KUHN et al. PHYSICAL REVIEW B 90, 195405 (2014)
[31] J. Sader and S. Jarvis, Determination of force and energy vsseperation from frequency vs seperation data, http://www.nanofunction.org/storage/resources-images/techniques/fm-afm/fmafm_Sader.nb (2004), downloaded 25.09.2011.
[32] G. H. Simon, M. Heyde, and H. P. Rust, Nanotechnol. 18, 255503(2007).
[33] J. Lubbe, M. Temmen, P. Rahe, A. Kuhnle, and M. Reichling,Beilstein J. Nanotechnol. 4, 227 (2013).
[34] A. Sweetman and A. Stannard, Beilstein J. Nanotechnol. 5, 386(2014).
[35] M. A. Lantz, H. J. Hug, R. Hoffmann, P. J. A. van Schendel,P. Kappenberger, S. Martin, A. Baratoff, and H. J. Guntherodt,Science 291, 2580 (2001).
[36] M. Nonnenmacher, M. P. O’Boyle, and H. K. Wickramasinghe,Appl. Phys. Lett. 58, 2921 (1991).
[37] S. I. Zanette, A. O. Caride, V. B. Nunes, G. L. Klim-chitskaya, F. L. Freire, and R. Prioli, Surf. Sci. 453, 75(2000).
[38] Carbonates: Mineralogy and Chemistry, edited by R. J. Reeder,Reviews in Mineralogy Vol. 11 (Mineralogical Society of Amer,Chantilly, VA, 1983).
[39] H. Effenberger, K. Mereiter, and J. Zemann, Zeitschrift FurKristallographie 156, 233 (1981).
[40] R. M. Hazen, T. R. Filley, and G. A. Goodfriend, Proc. Natl.Acad. Sci. USA 98, 5487 (2001).
[41] A. L. Rachlin, G. S. Henderson, and M. C. Goh, Am. Mineral.77, 904 (1992).
[42] P. Rahe, S. Kuhn, and A. Kuhnle, J. Unsolved Quest. 3, 21(2013).
[43] S. L. Stipp and M. F. Hochella, Geochimica Et CosmochimicaActa 55, 1723 (1991).
[44] J. Schutte, P. Rahe, L. Troger, S. Rode, R. Bechstein, M.Reichling, and A. Kuhnle, Langmuir 26, 8295 (2010).
[45] S. Fremy, S. Kawai, R. Pawlak, T. Glatzel, A. Baratoff, andE. Meyer, Nanotechnol. 23, 055401 (2012).
[46] S. Kawai, T. Glatzel, S. Koch, B. Such, A. Baratoff, andE. Meyer, Phys. Rev. B 81, 085420 (2010).
[47] A. S. Foster, A. Y. Gal, Y. J. Lee, A. L. Shluger, and R. M.Nieminen, Appl. Surf. Sci. 210, 146 (2003).
[48] Y. Liang, A. S. Lea, D. R. Baer, and M. H. Engelhard, Surf. Sci.351, 172 (1996).
[49] G. Teobaldi, K. Lammle, T. Trevethan, M. Watkins, A. Schwarz,R. Wiesendanger, and A. L. Shluger, Phys. Rev. Lett. 106,216102 (2011).
[50] A. J. Weymouth, T. Hofmann, and F. Giessibl, Science 343, 1120(2014).
[51] Handbook of Chemistry and Physics, edited by R. Weast andM. E. Astle, 62nd ed. (CRC Press, Bocy Raton, FL, 1981).
[52] B. Saleh and M. Teich, Fundamentals of Photonics, Wiley Seriesin Pure and Applied Optics (Wiley, New York, 2007).
[53] G. Langewisch, W. Kaminski, D. A. Braun, R. Moller, H. Fuchs,A. Schirmeisen, and R. Perez, Small 8, 602 (2012).
[54] P. Rahe, R. Bechstein, and A. Kuhnle, J. Vac. Sci. Technol. B28, C4E31 (2010).
195405-12