Embed Size (px)
Citation preview
Identifying protist consumers of photosyntheticpicoeukaryotes in the surface ocean using stableisotope probing
William D. Orsi,1*†‡ Susanne Wilken,2§
Javier del Campo ,3§ Thierry Heger,3k
Erick James,3 Thomas A. Richards,4
Patrick J. Keeling,3 Alexandra Z. Worden2 and
Alyson E. Santoro1¶**1Horn Point Laboratory, University of Maryland Center
for Environmental Science, Cambridge, MD 21613,
USA.2Monterey Bay Aquarium Research Institute, Moss
Landing, CA 95039, USA.3Department of Botany, University of British Columbia,
Vancouver, British Columbia, Canada.4Department of Biosciences, University of Exeter,
Geoffrey Pope Building, Exeter, EX4 4QD, UK.
Summary
Photosynthetic picoeukaryotes contribute a signifi-
cant fraction of primary production in the upper
ocean. Micromonas pusilla is an ecologically relevant
photosynthetic picoeukaryote, abundantly and widely
distributed in marine waters. Grazing by protists may
control the abundance of picoeukaryotes such as M.
pusilla, but the diversity of the responsible grazers is
poorly understood. To identify protists consuming
photosynthetic picoeukaryotes in a productive North
Pacific Ocean region, we amended seawater with
living 15N, 13C-labelled M. pusilla cells in a 24-h repli-
cated bottle experiment. DNA stable isotope probing,
combined with high-throughput sequencing of V4
hypervariable regions from 18S rRNA gene amplicons
(Tag-SIP), identified 19 operational taxonomic units
(OTUs) of microbial eukaryotes that consumed M.
pusilla. These OTUs were distantly related to cultured
taxa within the dinoflagellates, ciliates, stramenopiles
(MAST-1C and MAST-3 clades) and Telonema flagel-
lates, thus, far known only from their environmental
18S rRNA gene sequences. Our discovery of eukary-
otic prey consumption by MAST cells confirms that
their trophic role in marine microbial food webs
includes grazing upon picoeukaryotes. Our study
provides new experimental evidence directly linking
the genetic identity of diverse uncultivated microbial
eukaryotes to the consumption of picoeukaryotic
phytoplankton in the upper ocean.
Introduction
Picoeukaryotes are single-celled eukaryotes representing
the smallest size class of protists (0.2–2 mm) (Knight-Jones
and Walne, 1951; Butcher, 1952l; Worden and Not, 2008).
Picoeukaryotes are diverse (Not et al., 2009; Massana,
2011) and photosynthetic picoeukaryotes can contribute
an important fraction of primary production in the
photic zone (Agawin et al., 2000; Worden et al., 2015).
Micromonas is an ecologically relevant model taxon for
picoeukaryotic phytoplankton (Worden et al., 2009)
because it is widely distributed in both coastal and oceanic
marine waters (Cuvelier et al., 2008; Treusch et al., 2012;
Lopes Dos Santos et al., 2016; Simmons et al., 2016).
Marine viruses and grazing by protists are considered to
be important factors influencing the population dynamics
of this species (Evans et al., 2003; Lønborg et al., 2013).
Picoeukaryote biomass often represents a significant por-
tion of the microbial ecosystem in upper ocean seawater. In
oligotrophic waters their abundances are often between 500
to 1000 cells ml21 whereas in coastal regions their abun-
dance ranges between approximately 5000 cells ml21 to
upwards of 20 000 cells ml21 (Worden and Not, 2008). Pro-
tist grazing is an important source of mortality for
picoeukaryotes in general (Landry et al., 2011; Pasulka
et al., 2015), but the diversity and identity of mixotrophic
Received 25 July, 2017; revised 26 November, 2017; accepted 26November, 2017. For correspondence. *E-mail [email protected]; Tel. 149 89 2180 6598; Fax 149 89 2180 6601.**E-mail [email protected]; Tel. (805) 893-5318; Fax(805) 893-2985. Present addresses: †Department of Earth andEnvironmental Sciences, Paleontology & Geobiology, Ludwig-Maxi-milians Universit€at M€unchen, Munich 80333, Germany; ‡GeoBio-CenterLMU, Ludwig-Maximilians Universit€at M€unchen, Munich80333, Germany; §Department of Marine Biology and Oceanogra-phy, Institut de Ciencies del Mar (CSIC), Barcelona, Catalonia,Spain; kCHANGINS, Viticulture and Oenology, University of AppliedSciences and Arts Western Switzerland, Nyon 1260, Switzerland;¶Department of Ecology, Evolution, and Marine Biology, Universityof California, Santa Barbara, CA 93106, USA.
VC 2017 Society for Applied Microbiology and John Wiley & Sons Ltd
Environmental Microbiology (2018) 20(2), 815–827 doi:10.1111/1462-2920.14018
and heterotrophic protists responsible for phagotrophic con-
sumption (i.e., grazing) of picoeukaryotes is poorly
understood. For example, the majority of algal production in
the upper ocean is often consumed by protist grazers
(Schmoker et al., 2013; and references therein), but grazing
measurements generally reflect bulk rates without informa-
tion on the specific protistan groups responsible (Worden
et al., 2015).
Because grazing by protists is responsible for rapid
removal of fresh primary production in the surface ocean, it
is important to better understand the taxonomic and func-
tional diversity of protists that underlie this component of the
marine carbon cycle (Strom, 2008). Many phagotrophic pro-
tists are mixotrophs that also can perform photosynthesis
(Sanders et al., 2000; Simon et al., 2015; Stoecker et al.,
2016) and these mixotrophs may play an important role in
the flux of carbon from the surface ocean to the deep sea
on a global scale (Ward and Follows, 2016). Amplicon-
based studies to examine protistan diversity in the ocean
have revealed an enormous diversity of marine microbial
eukaryotes (Epstein and L�opez-Garcıa, 2008; de Vargas
et al., 2015), but the specific trophic roles of many microbial
eukaryotes still remains unclear. DNA and RNA stable iso-
tope probing are cultivation independent methods that can
identify the protists responsible for phagotrophic consump-
tion of a specific prey group, and provide insights into a
putative trophic mode for uncultivated taxa (Lueders et al.,
2004; Frias-Lopez et al., 2009; Glaubitz et al., 2009). For
example, using living 13C-labelled Prochlorococcus and
Synechococcus cells, RNA-SIP identified heterotrophic and
mixotrophic protists consuming these cyanobacteria in the
open ocean at Station ALOHA (Frias-Lopez et al., 2009).
Here, we combined high-throughput sequencing of 18S
rRNA V4 amplicons and DNA-SIP, hereafter referred to as
‘Tag-SIP’ (Morando and Capone, 2016; Orsi et al., 2016)
using live 15N, 13C-labelled M. pusilla as a model for
picoeukaryotic phytoplankton. This allowed us to identify
protist consumers of this important group of the phyto-
plankton. We sampled euphotic zone ocean waters of the
central California Current System (CCS), where M. pusilla
is known to be a resident of the phytoplankton community
(Simmons et al., 2016). Tag-SIP identified 19 OTUs of
uncultivated microbial eukaryotes that were active in the
predation of M. pusilla. Most of these OTUs were related
to protists known only by environmental 18S rRNA gene
sequences, thus, our research provides new experimental
evidence of their ecological roles in the marine microbial
food web.
Results
After a 24 h incubation (T24), DNA from the > 3 mm size
fraction was extracted from seawater that had been incu-
bated with either stable isotope labelled or unlabelled living
M. pusilla CCMP1545 cells (Fig. 1A). Density gradient cen-
trifugation of the bulk DNA shows a clear shift in peak
density of 0.009 g ml21 between labelled and unlabelled
treatments, with minimal variability between replicates
(60.03 g ml21; Fig. 2). In order to identify which protist
taxa were isotopically enriched (and thereby the grazers of
M. pusilla), DNA from 12 density gradient fractions with
buoyant densities spanning 1.685–1.735 g ml21 from each
bottle were selected for barcoded 18S rRNA gene V4
hypervariable region amplicon sequencing on the Illumina
MiSeq platform (Supporting Information Fig. S1).
A total of 2.1 million reads were obtained after amplicon
sequencing from the 48 fractions (4 bottles, 12 fractions
each), as well as the starting (T0) and end (T24) samples
that were not subject to density gradient fractionation
(Fig. 1A). Sequencing depth for samples with the lowest
and highest number of raw sequences were 17 934 and
129 133 respectively. After quality control and rarefaction
analysis to account for uneven sequencing depth
between samples, a total of 8958 reads remained for
each sample. After de novo OTU clustering, a total of 397
OTUs were formed at 95% identity. This number of OTUs
is unusually low for protist diversity in seawater and is
likely due to our selection of only the > 3 mm size fraction,
together with the removal of low abundance OTUs as
a part of the Tag-SIP quality control measures (see
Experimental Procedures).
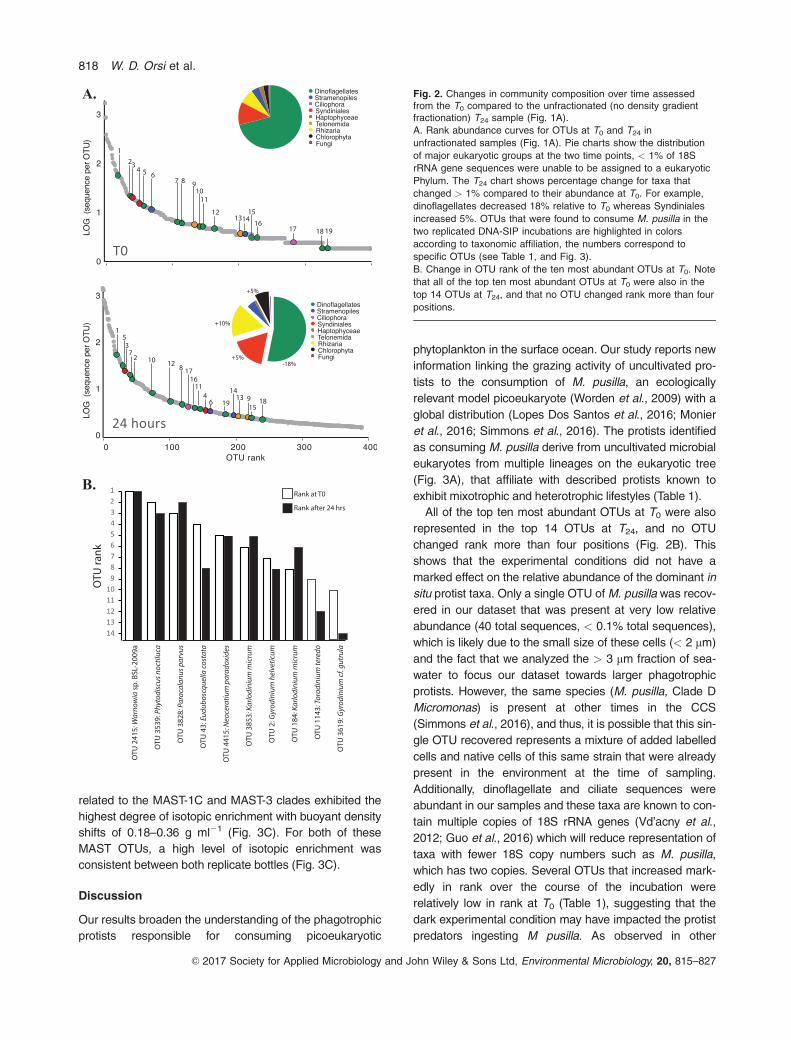
After the 24h incubation, the relative sequence abun-
dance of dinoflagellates decreased 18% compared to T0,
whereas the relative abundance of 18S rRNA gene
sequences affiliated with the Syndiniales, Rhizaria and
Chlorophyta all increased slightly (5%–10% relative to T0)
(Fig. 2A). The 10 OTUs with highest rank (i.e., abundance
relative to other OTUs) at T0 were affiliated mostly with
dinoflagellates (Fig. 2B). With the exception of the 9th and
the 10th most abundant T0 OTUs (OTU1143: Torodinium
teredo, OTU3619: Gyrodinium cf. gutrula), the eight top
ranked OTUs at T0 were still represented within the top
eight after 24 h (Fig. 2B). After 24 h, OTU1143 (top BLAST
hit Dinophyceae; Torodinium teredo) and OTU3619 (top
BLAST hit Dinophyceae;Gyrodinium cf. gutrula) decreased
to the 12th and 14th most abundant OTUs, respectively.
The experimental conditions appear to not have had a
marked effect on the relative abundance of the dominant
taxa because (1) all of the top ten OTUs at T0 were repre-
sented in the top 14 OTUs at T24, and (2) no OTU
changed rank more than four positions (Fig. 2B).
We recovered a single OTU related to M. pusilla
CCMP1545 that displayed a large (0.024 g ml21) increase
in DNA buoyant density, corresponding to our added
labelled prey (Supporting Information Fig. S1). This OTU
was represented by 40 sequences, corresponding to
< 0.1% of the total sequences recovered. Of the 397
OTUs passing our quality control criteria, 19 met our
816 W. D. Orsi et al.
VC 2017 Society for Applied Microbiology and John Wiley & Sons Ltd, Environmental Microbiology, 20, 815–827
criteria for isotopic incorporation (see Experimental Proce-
dures) in both of the replicated experimental incubations
(Table 1). These OTUs displayed an increase in 18S rRNA
gene buoyant density in the labelled bottles relative to the
controls (Supporting Information Fig. S1). Between repli-
cate bottles, there was variability in terms of the amount of
isotopic enrichment observed for each OTU (Supporting
Information Fig. S1, 3C). For example, OTU #9 that was
related to Telonema antarcticum (Fig. 3A) exhibited an
increase in buoyant density of 0.012 g ml21 in replicate 1,
and 0.036 g ml21 in replicate bottle 2 (Fig. 3C). Although
some OTUs consuming M. pusilla exhibited variability in
the degree of isotopic enrichment in the replicate bottles
(Supporting Information Fig. S1 and Fig. 3C), the observa-
tion that all 19 OTUs exhibited a shift in buoyant density
relative to controls in both replicate bottles strongly indi-
cates that these organisms were consuming M. pusilla.
Most (13 out of 19) of the OTUs identified as consumers
of M. pusilla are affiliated with uncultivated eukaryotes
related to heterotrophic and mixotrophic dinoflagellates.
Heterotrophic dinoflagellates include the genera Protoperi-
dinium, Abedinium, Sinophysis, Histioneis and Gyrodinium,
whereas the mixotrophic dinoflagellates identified were
affiliated with species within the genera Brachidinium,
Gymnodinium, Alexandrium, Karenia, Pentapharsodinium,
Warnowia and Gonyaulax (Table 1). Other OTUs that con-
sumed M. pusilla were related to taxa within the
heterotrophic nanoflagellate genus Telonema (2 OTUs)
and MAST (2 OTUs) (Table 1). Additionally, an OTU
related to the mixotrophic ciliate genus Strombidium also
consumed M. pusilla (Table 1). Two OTUs distantly related
(83%–95% 18S rRNA gene identity) to the parasitic
Syndiniales taxa Ichthyodinium and Amoebophyra were
also labelled after the 24 h incubation.
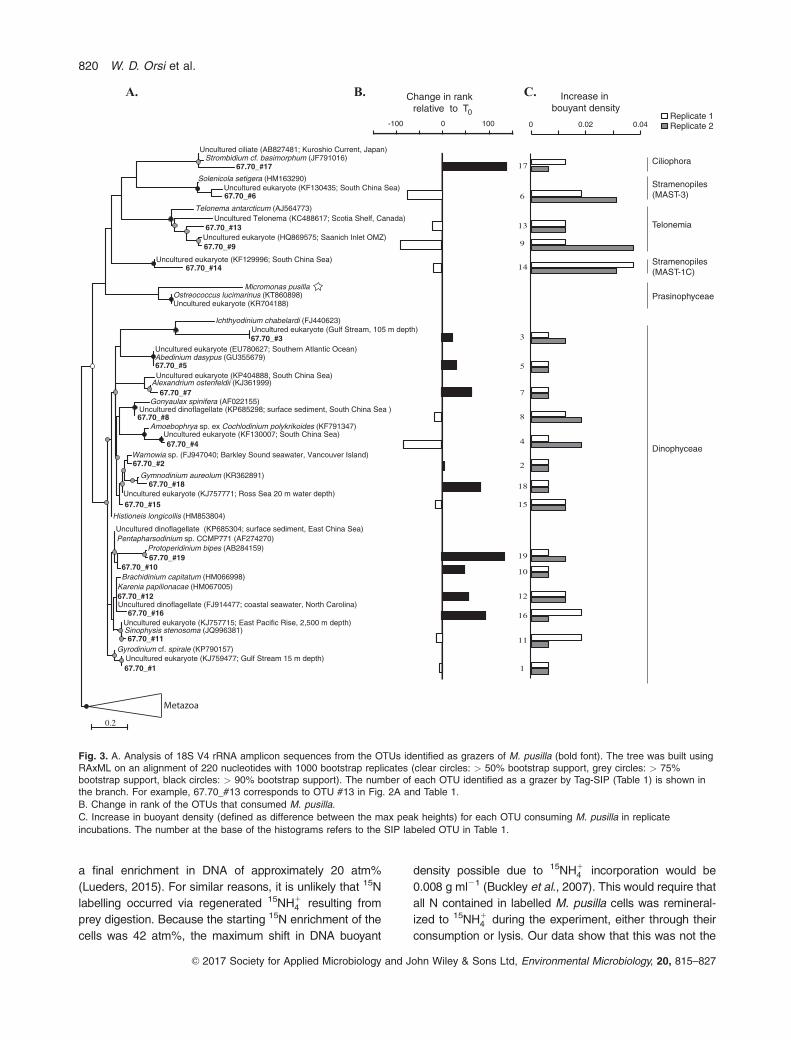
Phylogenetic analysis of the labelled OTUs showed that
most of the consumers of M. pusilla are distantly related to
named taxa (Fig. 3A). Compared to the named taxa, the
labelled OTUs tend to be more closely related to 18S
rRNA gene sequences recovered from environmental sur-
veys of seawater (Fig. 3A). During the incubation most M.
pusilla consumers affiliated with ciliates and dinoflagellates
increased in rank, whereas the MAST and Telonema-
related consumers decreased in rank (Fig. 3B). Out of all
the OTUs that consumed M. pusilla, the two MAST OTUs
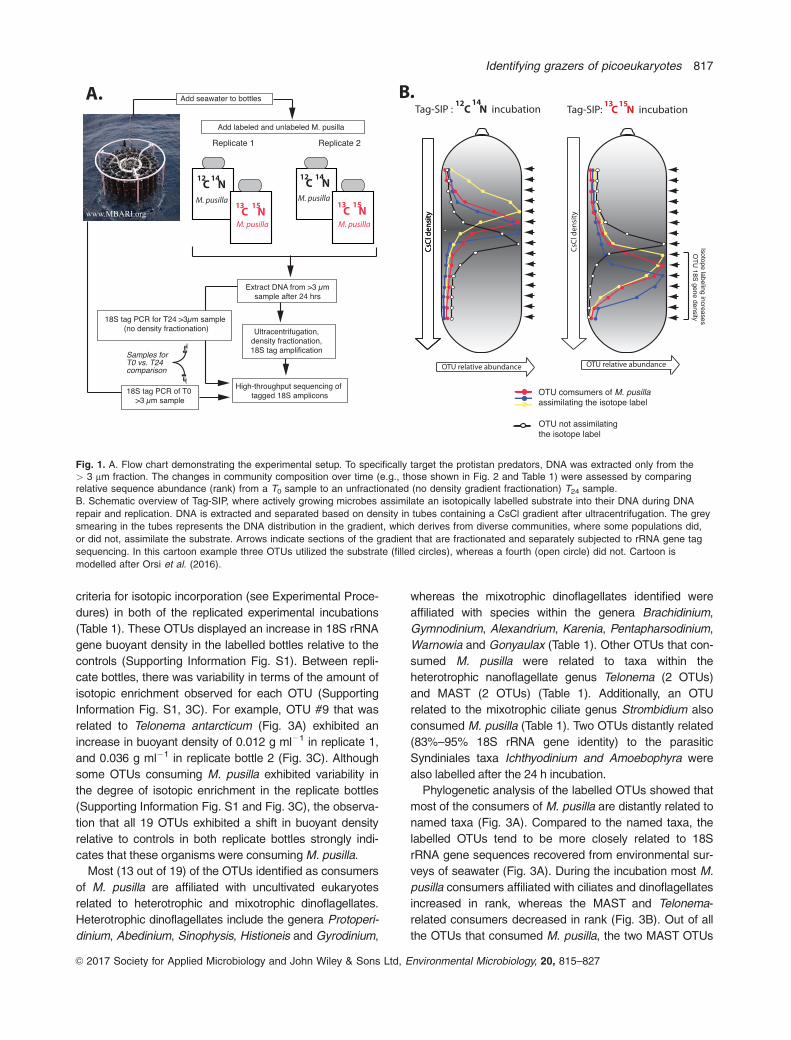
Fig. 1. A. Flow chart demonstrating the experimental setup. To specifically target the protistan predators, DNA was extracted only from the> 3 mm fraction. The changes in community composition over time (e.g., those shown in Fig. 2 and Table 1) were assessed by comparingrelative sequence abundance (rank) from a T0 sample to an unfractionated (no density gradient fractionation) T24 sample.
B. Schematic overview of Tag-SIP, where actively growing microbes assimilate an isotopically labelled substrate into their DNA during DNA
repair and replication. DNA is extracted and separated based on density in tubes containing a CsCl gradient after ultracentrifugation. The grey
smearing in the tubes represents the DNA distribution in the gradient, which derives from diverse communities, where some populations did,
or did not, assimilate the substrate. Arrows indicate sections of the gradient that are fractionated and separately subjected to rRNA gene tag
sequencing. In this cartoon example three OTUs utilized the substrate (filled circles), whereas a fourth (open circle) did not. Cartoon is
modelled after Orsi et al. (2016).
Identifying grazers of picoeukaryotes 817
VC 2017 Society for Applied Microbiology and John Wiley & Sons Ltd, Environmental Microbiology, 20, 815–827
related to the MAST-1C and MAST-3 clades exhibited the
highest degree of isotopic enrichment with buoyant density
shifts of 0.18–0.36 g ml21 (Fig. 3C). For both of these
MAST OTUs, a high level of isotopic enrichment was
consistent between both replicate bottles (Fig. 3C).
Discussion
Our results broaden the understanding of the phagotrophic
protists responsible for consuming picoeukaryotic
phytoplankton in the surface ocean. Our study reports new
information linking the grazing activity of uncultivated pro-
tists to the consumption of M. pusilla, an ecologically
relevant model picoeukaryote (Worden et al., 2009) with a
global distribution (Lopes Dos Santos et al., 2016; Monier
et al., 2016; Simmons et al., 2016). The protists identified
as consuming M. pusilla derive from uncultivated microbial
eukaryotes from multiple lineages on the eukaryotic tree
(Fig. 3A), that affiliate with described protists known to
exhibit mixotrophic and heterotrophic lifestyles (Table 1).
All of the top ten most abundant OTUs at T0 were also
represented in the top 14 OTUs at T24, and no OTU
changed rank more than four positions (Fig. 2B). This
shows that the experimental conditions did not have a
marked effect on the relative abundance of the dominant in
situ protist taxa. Only a single OTU of M. pusilla was recov-
ered in our dataset that was present at very low relative
abundance (40 total sequences, < 0.1% total sequences),
which is likely due to the small size of these cells (< 2 mm)
and the fact that we analyzed the > 3 mm fraction of sea-
water to focus our dataset towards larger phagotrophic
protists. However, the same species (M. pusilla, Clade D
Micromonas) is present at other times in the CCS
(Simmons et al., 2016), and thus, it is possible that this sin-
gle OTU recovered represents a mixture of added labelled
cells and native cells of this same strain that were already
present in the environment at the time of sampling.
Additionally, dinoflagellate and ciliate sequences were
abundant in our samples and these taxa are known to con-
tain multiple copies of 18S rRNA genes (Vd’acny et al.,
2012; Guo et al., 2016) which will reduce representation of
taxa with fewer 18S copy numbers such as M. pusilla,
which has two copies. Several OTUs that increased mark-
edly in rank over the course of the incubation were
relatively low in rank at T0 (Table 1), suggesting that the
dark experimental condition may have impacted the protist
predators ingesting M pusilla. As observed in other
Fig. 2. Changes in community composition over time assessedfrom the T0 compared to the unfractionated (no density gradientfractionation) T24 sample (Fig. 1A).
A. Rank abundance curves for OTUs at T0 and T24 in
unfractionated samples (Fig. 1A). Pie charts show the distribution
of major eukaryotic groups at the two time points, < 1% of 18S
rRNA gene sequences were unable to be assigned to a eukaryotic
Phylum. The T24 chart shows percentage change for taxa that
changed > 1% compared to their abundance at T0. For example,
dinoflagellates decreased 18% relative to T0 whereas Syndiniales
increased 5%. OTUs that were found to consume M. pusilla in the
two replicated DNA-SIP incubations are highlighted in colors
according to taxonomic affiliation, the numbers correspond to
specific OTUs (see Table 1, and Fig. 3).
B. Change in OTU rank of the ten most abundant OTUs at T0. Note
that all of the top ten most abundant OTUs at T0 were also in the
top 14 OTUs at T24, and that no OTU changed rank more than four
positions.
818 W. D. Orsi et al.
VC 2017 Society for Applied Microbiology and John Wiley & Sons Ltd, Environmental Microbiology, 20, 815–827
experiments (Agatha et al., 2005) lack of light may have
affected the grazing rates of mixotrophs in particular, and
hence the rate of label incorporation by these predators.
It is not likely that the labelled OTUs acquired the label
after remineralized C and N passed through an inorganic
dissolved phase (as dissolved inorganic carbon [DIC] or
NO23 ). The d13C of DIC at the end of the experiment was
only enriched 1.1& relative to the controls (3.4 6 0.04 &
vs. 2.5 6 0.06 &). Such a low level of enrichment would be
insufficient to produce detectable labelling, which requires
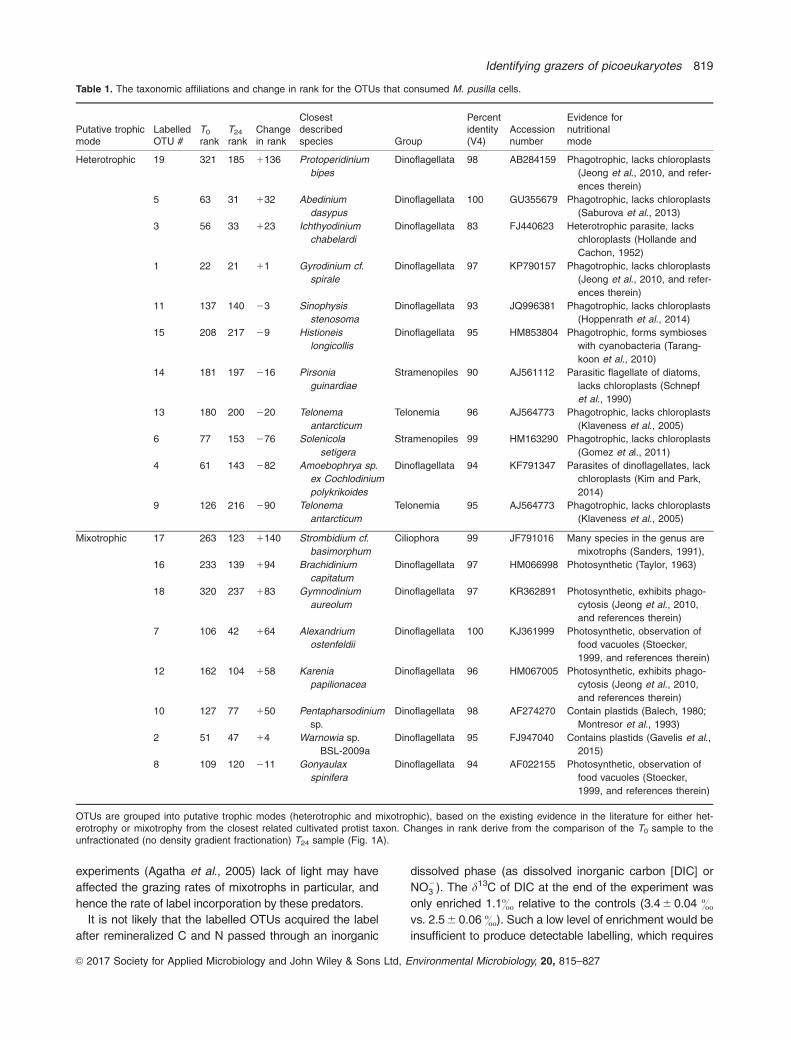
Table 1. The taxonomic affiliations and change in rank for the OTUs that consumed M. pusilla cells.
Putative trophicmode
LabelledOTU #
T0
rankT24
rankChangein rank
Closestdescribedspecies Group
Percentidentity(V4)
Accessionnumber
Evidence fornutritionalmode
Heterotrophic 19 321 185 1136 Protoperidinium
bipes
Dinoflagellata 98 AB284159 Phagotrophic, lacks chloroplasts
(Jeong et al., 2010, and refer-
ences therein)
5 63 31 132 Abedinium
dasypus
Dinoflagellata 100 GU355679 Phagotrophic, lacks chloroplasts
(Saburova et al., 2013)
3 56 33 123 Ichthyodinium
chabelardi
Dinoflagellata 83 FJ440623 Heterotrophic parasite, lacks
chloroplasts (Hollande and
Cachon, 1952)
1 22 21 11 Gyrodinium cf.
spirale
Dinoflagellata 97 KP790157 Phagotrophic, lacks chloroplasts
(Jeong et al., 2010, and refer-
ences therein)
11 137 140 23 Sinophysis
stenosoma
Dinoflagellata 93 JQ996381 Phagotrophic, lacks chloroplasts
(Hoppenrath et al., 2014)
15 208 217 29 Histioneis
longicollis
Dinoflagellata 95 HM853804 Phagotrophic, forms symbioses
with cyanobacteria (Tarang-
koon et al., 2010)
14 181 197 216 Pirsonia
guinardiae
Stramenopiles 90 AJ561112 Parasitic flagellate of diatoms,
lacks chloroplasts (Schnepf
et al., 1990)
13 180 200 220 Telonema
antarcticum
Telonemia 96 AJ564773 Phagotrophic, lacks chloroplasts
(Klaveness et al., 2005)
6 77 153 276 Solenicola
setigera
Stramenopiles 99 HM163290 Phagotrophic, lacks chloroplasts
(Gomez et al., 2011)
4 61 143 282 Amoebophrya sp.
ex Cochlodinium
polykrikoides
Dinoflagellata 94 KF791347 Parasites of dinoflagellates, lack
chloroplasts (Kim and Park,
2014)
9 126 216 290 Telonema
antarcticum
Telonemia 95 AJ564773 Phagotrophic, lacks chloroplasts
(Klaveness et al., 2005)
Mixotrophic 17 263 123 1140 Strombidium cf.
basimorphum
Ciliophora 99 JF791016 Many species in the genus are
mixotrophs (Sanders, 1991),
16 233 139 194 Brachidinium
capitatum
Dinoflagellata 97 HM066998 Photosynthetic (Taylor, 1963)
18 320 237 183 Gymnodinium
aureolum
Dinoflagellata 97 KR362891 Photosynthetic, exhibits phago-
cytosis (Jeong et al., 2010,
and references therein)
7 106 42 164 Alexandrium
ostenfeldii
Dinoflagellata 100 KJ361999 Photosynthetic, observation of
food vacuoles (Stoecker,
1999, and references therein)
12 162 104 158 Karenia
papilionacea
Dinoflagellata 96 HM067005 Photosynthetic, exhibits phago-
cytosis (Jeong et al., 2010,
and references therein)
10 127 77 150 Pentapharsodinium
sp.
Dinoflagellata 98 AF274270 Contain plastids (Balech, 1980;
Montresor et al., 1993)
2 51 47 14 Warnowia sp.
BSL-2009a
Dinoflagellata 95 FJ947040 Contains plastids (Gavelis et al.,
2015)
8 109 120 211 Gonyaulax
spinifera
Dinoflagellata 94 AF022155 Photosynthetic, observation of
food vacuoles (Stoecker,
1999, and references therein)
OTUs are grouped into putative trophic modes (heterotrophic and mixotrophic), based on the existing evidence in the literature for either het-erotrophy or mixotrophy from the closest related cultivated protist taxon. Changes in rank derive from the comparison of the T0 sample to theunfractionated (no density gradient fractionation) T24 sample (Fig. 1A).
Identifying grazers of picoeukaryotes 819
VC 2017 Society for Applied Microbiology and John Wiley & Sons Ltd, Environmental Microbiology, 20, 815–827
a final enrichment in DNA of approximately 20 atm%
(Lueders, 2015). For similar reasons, it is unlikely that 15N
labelling occurred via regenerated 15NH14 resulting from
prey digestion. Because the starting 15N enrichment of the
cells was 42 atm%, the maximum shift in DNA buoyant
density possible due to 15NH14 incorporation would be
0.008 g ml21 (Buckley et al., 2007). This would require that
all N contained in labelled M. pusilla cells was remineral-
ized to 15NH14 during the experiment, either through their
consumption or lysis. Our data show that this was not the
17
19
16
18
7
12
10
5
3
2
1
11
15
8
14
13
6
4
9
Change in rank relative to T
67.70_#17
0.2
Alexandrium ostenfeldii (KJ361999)
Uncultured ciliate (AB827481; Kuroshio Current, Japan)Strombidium cf. basimorphum (JF791016)
Abedinium dasypus (GU355679)Uncultured eukaryote (EU780627; Southern Atlantic Ocean)
Uncultured eukaryote (Gulf Stream, 105 m depth)Ichthyodinium chabelardi (FJ440623)
Protoperidinium bipes (AB284159)Pentapharsodinium sp. CCMP771 (AF274270)
Uncultured eukaryote (KJ757771; Ross Sea 20 m water depth)
Gymnodinium aureolum (KR362891)
Brachidinium capitatum (HM066998)
Uncultured eukaryote (KJ759477; Gulf Stream 15 m depth)
Uncultured dinoflagellate (FJ914477; coastal seawater, North Carolina)
Gyrodinium cf. spirale (KP790157)
Warnowia sp. (FJ947040; Barkley Sound seawater, Vancouver Island)
Histioneis longicollis (HM853804)
Uncultured dinoflagellate (KP685298; surface sediment, South China Sea )Gonyaulax spinifera (AF022155)
Uncultured eukaryote (KJ757715; East Pacific Rise, 2,500 m depth)Sinophysis stenosoma (JQ996381)
Uncultured eukaryote (KF129996; South China Sea)
Uncultured eukaryote (HQ869575; Saanich Inlet OMZ)
Telonema antarcticum (AJ564773)
Uncultured eukaryote (KF130435; South China Sea)Solenicola setigera (HM163290)
Ostreococcus lucimarinus (KT860898)Uncultured eukaryote (KR704188)
Uncultured eukaryote (KF130007; South China Sea)Amoebophrya sp. ex Cochlodinium polykrikoides (KF791347)
67.70_#6
Uncultured Telonema (KC488617; Scotia Shelf, Canada)
67.70_#9
67.70_#13
67.70_#14
67.70_#3
67.70_#5Uncultured eukaryote (KP404888, South China Sea)
67.70_#7
67.70_#8
67.70_#4
67.70_#15
67.70_#2
67.70_#18
Uncultured dinoflagellate (KP685304; surface sediment, East China Sea)
67.70_#1967.70_#10
67.70_#16
67.70_#11
67.70_#1
Ciliophora
Telonemia
Prasinophyceae
Dinophyceae
Micromonas pusilla
Stramenopiles (MAST-3)
67.70_#12Karenia papilionacae (HM067005)
-100
Metazoa
Stramenopiles (MAST-1C)
A. B. C. Increase in bouyant density
Replicate 1Replicate 2
0
0 100 0.040 0.02
Fig. 3. A. Analysis of 18S V4 rRNA amplicon sequences from the OTUs identified as grazers of M. pusilla (bold font). The tree was built usingRAxML on an alignment of 220 nucleotides with 1000 bootstrap replicates (clear circles: > 50% bootstrap support, grey circles: > 75%bootstrap support, black circles: > 90% bootstrap support). The number of each OTU identified as a grazer by Tag-SIP (Table 1) is shown inthe branch. For example, 67.70_#13 corresponds to OTU #13 in Fig. 2A and Table 1.
B. Change in rank of the OTUs that consumed M. pusilla.
C. Increase in buoyant density (defined as difference between the max peak heights) for each OTU consuming M. pusilla in replicate
incubations. The number at the base of the histograms refers to the SIP labeled OTU in Table 1.
820 W. D. Orsi et al.
VC 2017 Society for Applied Microbiology and John Wiley & Sons Ltd, Environmental Microbiology, 20, 815–827
case because isotopically labelled M. pusilla cells were still
recovered at the end of the experiment (Supporting Infor-
mation Fig. S1B), which means that a marked proportion
of the isotopically labelled biomass was not remineralized.
Thus, it is highly unlikely that OTUs were labelled solely
through assimilation of regenerated 15NH14 .
Microbial eukaryotes tend to have multiple copies of the
18S rRNA gene, and this can influence the interpretation
of relative changes in marine protist communities over
time (Orsi et al., 2011; Orsi et al., 2012). For this reason, in
our analysis of change in relative abundance between T0
and T24 we decided against basing the change in OTU rel-
ative abundance on the percent sequence representation
in the entire sample. Instead, to minimize the influence of
variable 18S rRNA gene copies between taxa, rank
changes (e.g., whether the OTU was the first, second,
third, etc., most abundant OTU) between T0 and T24 only
within the same OTUs were used as the proxy for their rel-
ative change in abundance. This approach assumes that
each OTU whose members all share at least 95%
sequence identity of its 18S rRNA genes corresponds to a
taxon with roughly a species level distinction (Caron et al.,
2009), which has minimal variability in its 18S rRNA gene
copy number. Furthermore, the GC content variability,
which is known to influence DNA-SIP results (Buckley
et al., 2007), within genomes encoded by each OTU
should be minimal (Orsi et al., 2016). Because our
Tag-SIP analysis focuses only on specific OTUs, variability
in GC values should not influence the analysis performed
here.
The isotopically labelled OTU exhibiting the greatest
increase in rank over the incubation was related to Strom-
bidium basimorphum (Table 1, Fig. 3A). To our knowledge
mixotrophy by this species has never been experimentally
verified, but most species in the genus Strombidium con-
tain plastids and are mixotrophic (Sanders, 1991). Indeed,
S. biarmatum can be grown for a limited time under dark
conditions on M. pusilla as a sole carbon and energy
source (Agatha et al., 2005). Our results show that
M. pusilla is also a preferred carbon and or nitrogen source
for S. basimorphum in the upper ocean.
While the physiology of MAST groups remains enig-
matic, studies have shown them to be important
heterotrophic bacterial grazers (Massana et al., 2006;
2009; Lin et al., 2012; Piwosz et al., 2013). Here, two
OTUs affiliated with the stramenopile clades MAST-3 and
MAST-1C were found to consume M. pusilla. The only cul-
tivated representative from the MAST-3 clade is a
heterotrophic nanoflagellate (Gomez et al., 2011) which is
consistent with our identification of a new taxon in this
clade that grazed the isotopically labelled picoeukaryotic
prey. MAST-1 cells have also been observed to graze
cyanobacteria (Frias-Lopez et al., 2009), and fluorescent
in situ hybridization (FISH) was used to show previously
that MAST-1C cells ingest Micromonas and Ostreococcus
(Massana et al., 2009). Moreover, single cell genomes of
MAST cells recovered after flow cytometric sorting of sin-
gle cells have been observed to contain genetic material
from Micromonas, further indicating that they graze on
picoeukaryotes (Mangot et al., 2017). Our Tag-SIP data is
confirmatory of this earlier FISH-based study showing that
MAST cells phagocytose eukaryotic prey (Massana et al.,
2009), which should be considered as a part of their func-
tional role in marine food webs.
The two OTUs that were distantly related to Telonema
antarcticum (Table 1) were most closely related to an 18S
rRNA sequence recovered from 10 m water depth off
the Scotia Shelf (Atlantic Canada; NCBI Accession
KC488617) and another from the hypoxic marine water
column of the Saanich Inlet, Vancouver Island
(HQ869575) (Orsi et al., 2012). T. antarcticum is a hetero-
trophic nanoflagellate (Klaveness et al., 2005) with a wide
geographic distribution in marine habitats (Throndsen,
1969; Vørs, 1992; Massana et al., 2004). Heterotrophy is
the dominant trophic mode of the genus Telonema,
although it is affiliated with the predominantly photosyn-
thetic chromalveolate supergroup (Burki et al., 2009). The
close relation of telonemid OTU #9 to the environmental
sequence recovered from the Saanich Inlet oxygen mini-
mum zone (HQ869575) (Orsi et al., 2012) indicates that
this group might also be important for grazing picoplankton
in oxygen depleted marine waters. Despite being heavily
labelled, the MAST and Telonema-affiliated consumers
decreased in rank. Additional experiments are required to
validate these findings and identify possible causes of this
decrease in rank such as dark conditions, increased graz-
ing by predators of MAST cells, or viral lysis.
The majority of labelled OTUs were related to dinoflagel-
lates (Table 1) indicating that these were likely the most
important grazers of M. pusilla over the 24-h incubation.
These OTUs were related to dinoflagellates with known
mixotrophic and heterotrophic lifestyles (Stoecker, 1999;
Jeong et al., 2010; Stoecker et al., 2016). Compared to the
named species, the dinoflagellate consumers of M. pusilla
tend to be more closely related to 18S rRNA gene sequen-
ces recovered from environmental surveys of seawater
from the China Sea (Wu et al., 2014), Ross Sea (Lie et al.,
2014) and North Atlantic Gulf Stream (Lie et al., 2014)
(Fig. 3A). This indicates that the dinoflagellates responsi-
ble for consuming M. pusilla derive from relatively novel
taxa with a wide geographic distribution.
The Syndiniales parasites related to the two labelled
OTUs (Table 1, Fig. 3A) are thought to be important infec-
tive agents of dinoflagellates (Hollande and Cachon, 1952;
Schnepf et al., 1990; Kim and Park, 2014). The labelling of
these parasites thus likely derives from active parasitic
infection of dinoflagellates that had phagocytosed
M. pusilla. Active infection of dinoflagellates by Syndiniales
Identifying grazers of picoeukaryotes 821
VC 2017 Society for Applied Microbiology and John Wiley & Sons Ltd, Environmental Microbiology, 20, 815–827
parasites can also explain the relative decrease in dinofla-
gellate sequences at T24 (–18%), because Syndiniales-
affiliated sequences increased 5% in relative abundance
during the incubation (Fig. 2A). Despite the general trend
of decreasing relative abundance of dinoflagellate sequen-
ces over the 24-h incubation, most of the dinoflagellate
OTUs consuming M. pusilla increased in relative abun-
dance (Fig. 3B). Given the indirect uptake of label by the
Syndiniales parasites, it is possible that some larger graz-
ers (e.g., dinoflagellates or ciliates) acquired the label by
grazing labelled dinoflagellates (that were currently
infected with Syndiniales).
While the phylogenetic analysis of the V4 hypervariable
region (Fig. 3A) is based on a shorter gene fragment com-
pared to full length 18S rRNA gene analyses, it still
resulted in consistent monophyletic grouping of the major
taxonomic groups (Dinophyceae, Ciliophora, Telonema;
Fig. 3A) as expected (Hu et al., 2015). This showed that a
phylogenetic grouping of the OTUs within the existing
framework of protistan taxonomy is possible with our V4
data. In our analysis, it is notable that no haptophytes were
found to have consumed M. pusilla, despite their represen-
tation in the amplicon data (Fig. 2A). Haptophytes were
represented by nine OTUs were affiliated with Chrysochro-
mulina sp. RCC2300 (6 OTUs), C. parva (1 OTU) and
Phaeocystis globosa (2 OTUs). This result is surprising
because haptophytes are known to be important mixotro-
phic grazers of bacterioplankton in the surface ocean
(Unrein et al., 2014), including the cyanobacteria Prochlor-
ococcus and Synechococcus (Frias-Lopez et al., 2009).
From our experiment at a single depth at one location it is
unclear whether the lack of haptophyte consumption of M.
pusilla is a reflection of their feeding habits, or rather an
artefact due to insufficient sample size or the influence of
seasonal and other environmental factors at the time. The
low diversity of haptophytes in our dataset could also be
due to the PCR primers used, which have a bias against
haptophytes (Balzano et al., 2015). The lack of labelled
haptophytes might also be a reflection of a different metab-
olism, for example if they do not recycle food into DNA as
quickly as dinoflagellates or Stramenopiles, or exhibit lower
growth efficiencies. Haptophytes also did not increase in
relative abundance over the incubation (Fig. 2A), and so a
potentially slower growth rate or lower growth efficiency
compared to other protists indeed may explain their lack of
detection with Tag-SIP. It could also be explained by the
dark conditions of our incubation, since mixotrophy in hap-
tophytes is (in addition to nutrient availability) related to
light availability (Unrein et al., 2014). Given these points,
we are unable to reliably rule out haptophytes as grazers
of picoeukaryotes with our data.
Because Tag-SIP gave sufficient labelling after the 24-h
incubation, protist grazers may have been growing rapidly
during the incubation. However, label incorporation could
be due to DNA repair, or be incorporated during DNA repli-
cation prior to cell division, and thus may be due to cell
maintenance processes and not necessarily recently
divided cells. In either case, however, the labelled cells are
metabolically active protists that have ingested labelled
prey. Thus, the Tag-SIP method used here represents an
alternative for researchers as a method that can be applied
to identify active grazers in addition to RNA-SIP (Frias-
Lopez et al., 2009). As with all SIP applications used to
study food webs, we recommend restricting the length of
incubation to as short as necessary in order to avoid cross
feeding and transfer of label into an inorganic dissolved
phase, and careful consideration of potential effects of light
and nutrient availability.
Here, we show that several MAST groups that have pre-
viously been shown to consume bacteria also consume
picoeukaryotic phytoplankton, as do a variety of larger pro-
tists some of which appear to be mixotrophs, at least
based on their phylogenetic relationships to cultured taxa.
Our data suggest that OTUs from uncultivated taxa within
the Ciliophora, Stramenopiles, Telonemia and Dinophy-
ceae consume picoeukaryotic phytoplankton in the
eastern North Pacific. Because these OTUs are similar to
environmental sequences from other ocean regions, it
seems likely that they serve more generally as consumers
of picophytoplankton in surface ocean environments. The
taxa implicated here as predators of M. pusilla could be
confirmed using a microscopy based approach, where
ingestion of prey is unequivocally shown using FISH (Mas-
sana et al. 2009). Our study provides new insight into the
functional ecology of several undescribed marine protistan
taxa by demonstrating that they consume small eukaryotic
algae. The findings expand the number of trophic linkages
for several broadly distributed groups of marine heterotro-
phic flagellates that to date have been considered
bacteriovores.
Experimental procedures
Sampling
Seawater was collected aboard the R/V Western Flyer duringMonterey Bay Aquarium Research Institute cruise CN13ID, 7–17 October 2013, at Station 67–70 of the California Coopera-
tive Fisheries Investigations (CalCOFI) Line 67 (36.748N,122.028W) (Collins et al., 2003; Pennington et al., 2010). Thisstation lies approximately 170 km from shore, within the
coastal transition zone between the coastal upwelling and oli-gotrophic waters offshore (Collins et al., 2003). The site wasselected due to the historic presence of a significant picoeu-
karyote population of Micromonas (Thomsen and Buck, 1998;Simmons et al., 2016). We previously documented interac-tions between organic matter from cultured cells of this
picoeukaryote and marine bacteria and archaea (Orsi et al.,2015; Orsi et al., 2016). The seawater used in these experi-ments was collected from 20 m, the same water depth and at
the same time, as those used in previously published Tag-SIP
822 W. D. Orsi et al.
VC 2017 Society for Applied Microbiology and John Wiley & Sons Ltd, Environmental Microbiology, 20, 815–827
experiments (Orsi et al., 2016). Sampling and hydrographic
profiling were conducted using a conductivity-temperature-
depth (CTD) rosette sampler (Sea-Bird Electronics) equipped
with (12) 10 l Niskin sample bottles. The incubations were
performed immediately after bringing the seawater on board,
and no pre-filtration was applied to the seawater before the
labelled cells were added.
Stable isotope probing incubation
Micromonas pusilla CCMP1545 was grown axenically for 10 d
at 218C under a light: dark cycle of 14h:10h using cool white
light (150 mmol Q m22 s21) in L1 medium (Guillard and
Hargraves, 1993) based on artificial seawater amended with
2.5 mM 99 atm% 13C-labelled sodium bicarbonate and 882
mM 98 atm% 15N-labelled sodium nitrate (Cambridge Isotope
Laboratories). Control cultures were grown under the same
conditions using 12C sodium bicarbonate and 14N nitrate. Cells
were inoculated into the respective medium at 5 3 106 cells/
ml and kept in exponential growth by diluting them back to that
abundance with fresh medium every other day. The growth
rate was 0.47 day21 (SD: 0.09). The isotopic composition of
whole cells were measured at the University of California
Davis Stable Isotope Facility (SIF) using on-line combustion
coupled to a mass spectrometer; with measured values of 16
atm% for 13C and 42 atm% for 15N. The measured value for13C is potentially an underestimate because the labelled cells
were not diluted with unlabelled material prior to isotopic anal-
ysis, which may result in underestimation of the actual atm%
enrichment.
M. pusilla cells were added to 4 l of seawater to a final con-
centration of 1000 cells ml21 in trace metal clean
polycarbonate bottles. Before adding the cells to the bottles,
they were washed with 0.2 mm filtered seawater to remove
any residual 13C present in the media. Bottles were amended
with dual isotope labelled cells (13C and 15N), or unlabelled
cells, in duplicate for each of these two treatments. Bottles
were incubated for 24 h in the dark in coolers plumbed with
flowing surface seawater to maintain in situ temperature. Dark
conditions were chosen to reduce the activity of photoautotro-
phic taxa, which may have affected the grazing rates (and
thus label incorporation). At the end of the incubation 1–2 l of
seawater was filtered sequentially through 3 mm (Pall
Versapor-3000T), 0.8 mm (Pall Supor-800) and 0.2 mm (Pall
Supor-200) filters using a peristaltic pump. Filters were stored
frozen at 2808C until further analysis.
DNA extraction and density gradient fractionation
DNA was extracted from > 3 mm prefiltered seawater as a T0
sample, and > 3 mm prefiltered seawater from the bottles after
24 h as a T24 sample (Fig. 1A). At the 24 h time point, DNA
was extracted for Tag-SIP from the 3 mm prefilters (the size
fraction that should contain larger protistan grazers) collected
from all four bottles (2 control plus 2 isotope labelled cell addi-
tion), according to the method of Santoro et al. (2010). As we
were strictly interested in the protistan predators of M. pusilla,
the < 3 mm fraction was not analyzed for Tag-SIP. In brief, 850
ml of lysis buffer and 100 ml of 10% SDS were added to 2 ml
gasketed bead-beating tubes containing the filters and
0.1 mm sterile glass beads (Biospec). Bead beating was per-
formed for 1 min and samples heated for 2 min at 998C. After
heating, 25 ml of 20 mg ml21 proteinase K was added and
tubes were incubated over night at 558C. DNA was then puri-
fied from the lysate with the DNeasy Blood and Tissue Kit
(Qiagen).
The protocol for density gradient centrifugation and gradient
fractionation followed previously described methods for DNA-
SIP (Neufeld et al., 2007; Dunford and Neufeld, 2010), with
some minor modifications. In brief, density gradient centrifuga-
tion was performed in a TV90 vertical rotor at 208C for 40 h at
177 000 g in an Optima XL-90 ultracentrifuge (Beckman
Coulter). DNA was spun in 4 ml polyallomer Optiseal tubes
(Beckman Coulter) in cesium chloride (CsCl) gradients with an
average density of 1.725 g ml21. Centrifuged gradients were
fractionated into 15 equal fractions via careful manual
pipetting from the top of the polyallomer tube. DNA was pre-
cipitated with 2 volumes of polyethylene glycol for 2 h at room
temperature and pelleted by centrifugation (30 min, 13 000 g).
Pellets were washed once with 70% ethanol, resuspended in
molecular grade water and quantified fluorometrically (Qubit,
Life Technologies).
PCR and amplicon library preparation
18S rRNA genes from each fraction were amplified using the
TAReuk454FWD1 and TAReukREV3 primers targeting the V4
hypervariable region of the eukaryotic small subunit ribosomal
RNA gene (Stoeck et al., 2010). The primers were combined
with Illumina adapter sequences, a pad, a linker as well as 12
bp Golay barcodes on the reverse primers according to the
procedure of Caporaso et al. (2012). The barcoded PCR
approach was similar to the method used previously for identi-
fication of 13C-labelled 16S rRNA genes (Orsi et al., 2016),
where each separate fraction of the CsCl gradient is PCR
amplified using primers with a unique barcode. After high-
throughput sequencing and OTU clustering, this approach
allows for identification of individual OTUs that display a den-
sity shift in the 13C-labelled treatment relative to the unlabelled
treatment (Hungate et al., 2015). PCR reactions were carried
out in 25 ml volumes for using the following thermocycling con-
ditions: 988C for 30 s; 10 cycles of 988C for 10 s, 538C for
30 s, 728C for 30 s; 20 cycles of 988C for 10 s, 488C for 30 s,
728C for 30s; with a final extension at 728C for 5 min. Each
gradient fraction was amplified using a different barcode com-
bination and amplicons were gel extracted (QIAquick Kit,
Qiagen) and pooled in equimolar concentrations prior to high-
throughput paired-end Illumina sequencing (MiSeq, 2 3 250
bp reads) at the Sequencing and Genotyping Core Facility of
the University of California Los Angeles.
Bioinformatic analysis
Processing of the paired-end MiSeq data was performed simi-
lar to Orsi et al. (2016), which combines the preliminary
quality control steps and contig assembly described by Kozich
et al. (Kozich et al., 2013) using MOTHUR version 1.37.0
(Schloss et al., 2009), and later the pair-wise OTU clustering
was performed in QIIME version 1.8 (Caporaso et al., 2010).
A total of 431 857 sequences were obtained that passed
Identifying grazers of picoeukaryotes 823
VC 2017 Society for Applied Microbiology and John Wiley & Sons Ltd, Environmental Microbiology, 20, 815–827
through quality control and sample rarefaction. To obtain pro-
tistan OTUs roughly corresponding to species-level taxa,
sequences were clustered at 95% (Caron et al., 2009)
sequence identity using UCLUST version 1.2 (Edgar, 2010).
OTUs were identified to taxonomic groups through BLASTn
(legacy BLAST version 2.2.22) searches against the GenBank
nr database using the Jaguc software designed for taxonomic
classification of uncultivated microbial eukaryotes from envi-
ronmental samples (Nebel et al., 2010; Orsi et al., 2013). OTU
representative sequences (used for BLAST searches, multiple
sequence alignment and phylogenetic tree) were picked as
centroids (using QIIME), for example, those sequences that
are least dissimilar to all the other sequences within the OTU.
Prior to creating the multiple sequence alignment, the closest
cultivated and uncultivated relative sequences for each of the
19 OTUs (Table 1) was obtained from the NCBI nucleotide
database via BLASTn searches. The V4 region of these
sequences were aligned together with the 19 OTUs (Table 1)
in a multiple sequence alignment using Muscle (Edgar, 2004)
in the SeaView (version 4.2.11) sequence viewer (Gouy et al.
2010). The alignment was manually curated, and the resulting
220 aligned positions were used to construct the phylogenetic
tree in SeaView (Gouy et al. 2010) using RAxML (GTR 1 I
model of evolution) and 1000 bootstrap replicates.
OTU tables were rarified per size fraction, to the sample
with the least number of sequences (8997 sequences). Rari-
fied counts for each OTU in the control and SIP gradients
were normalized to the maximal abundance of that OTU
across density fractions in unlabelled or SIP-labelled bottles
(Hungate et al., 2015; Orsi et al., 2016). Only OTUs with > 10
sequences that were detected in > 50% of the fractions were
used in downstream analysis. Sequence data has been
deposited in the NCBI database under BioProject ID
PRJNA391559.
We defined Tag-SIP isotopic incorporation similar to earlier
studies (Nelson and Carlson, 2012; Hungate et al., 2015;
Morando and Capone, 2016; Orsi et al., 2016), based on a
comparison of the relative distribution of an OTU across the
CsCl density gradient in a control (12C and 14N substrate
added) versus an experimental (13C and 15N substrate added)
incubation. We defined the isotopic labelling of OTUs based
on three criteria. We first screened OTUs that banded with a
similar overall shape in the experimental treatment compared
to the control. Second, using the density with peak OTU abun-
dance in the control as a reference, we selected OTUs that
had peak abundance in the experimental treatment at least
one fraction heavier (0.006 g ml21). As a third requirement,
the OTU relative abundance in the fraction immediately follow-
ing its peak abundance in the experimental treatment also had
to have a greater relative abundance compared to the control.
This second fraction corresponds to an enrichment of 0.012 g
ml21. This criteria, together with the general overlapping sym-
metry between OTU ‘bands’ (i.e., the peak density) between
the label and unlabelled control is considered convincing evi-
dence of OTU isotopic incorporation (Morando and Capone,
2016). Each fraction in our study are separated by 0.006 g
ml21, and thus, a higher relative abundance in two fractions
compared to the control (0.012 g ml21) roughly corresponds
to an atm% enrichment of > 20% 13C, which is generally con-
sidered the threshold for identifying SIP-labelled rRNA genes
(Lueders, 2015). Thus, throughout the manuscript we refer to
OTUs meeting the criteria defined above as those identified
as consumers of M. pusilla.
Acknowledgements
We thank the captain and crew of the R/V Western Flyer, J.
Timothy Pennington, Marguerite Blum, Valeria Jimenez,
Christopher Wahl, Noriko Okamoto, Jason Smith, Jarred
Swalwell and Francisco Chavez for logistical assistance prior
to and during the cruise. This research is funded in part by the
Gordon and Betty Moore Foundation through grant
GBMF3307 to P.J.K., T.A.R., A.Z.W and A.E.S. United States
National Science Foundation award DBI-1318455 to A.E.S,
and the David and Lucile Packard Foundation (to A.Z.W.). The
authors declare no conflict of interest.
References
Agatha, S., Str€uder-Kypke, M.C., Beran, A., and Lynn, D.
(2005) Pelagostrobilidium neptuni (Montagnes and Taylor,
1994) and Strombidium biarmatum nov. spec. (Ciliophora,
Oligotrichea): phylogenetic position inferred from morphol-
ogy, ontogenesis, and gene sequence data. Eur J Protistol
41: 65–83.Agawin, N.S.R., Duarte, C.M., and Agusti, S. (2000) Nutrient
and temperature control of the contribution of picoplankton
to phytoplankton biomass and production. Limnol Oceanogr
45: 591–600.Balech, E. (1980) On thecal morphology of dinoflagellates
with special emphasis on circular and sulcal plates. An
Centro Cienc Del Mar y Limnol Univ Nal Auton Mexico 7:
57–68.Balzano, S., Abs, E., and Leterme, S.C. (2015) Protist diver-
sity along a salinity gradient in a coastal lagoon. Aquat
Microb Ecol 74: 263–277.Buckley, D.H., Huangyutitham, V., Hsu, S.F., and Nelson, T.A.
(2007) Stable isotope probing with 15N achieved by disen-
tangling the effects of genome G1C content and isotope
enrichment on DNA density. Appl Environ Microbiol 73:
3189–3195.
Burki, F., Inagaki, Y., Brate, J., Archibald, J.M., Keeling, P.J.,
Cavalier-Smith, T., et al. (2009) Large-scale phylogenomic
analyses reveal that two enigmatic protist lineages, Telone-
mia and Centroheliozoa, are related to photosynthetic chro-
malveolates. Genome Biol Evol 1: 231–238.Butcher, R.W. (1952) Contribution to our knowledge of the
smaller marine algae. J Mar Biol Assoc UK 31: 175–191.Caporaso, J.G., Kuczynski, J., Stombaugh, J., Bittinger, K.,
Bushman, F.D., Costello, E.K., et al. (2010) QIIME allows
analysis of high-throughput community sequencing data.
Nat Methods 7: 335–336.Caporaso, J.G., Lauber, C.L., Walters, W.A., Berg-Lyons, D.,
Huntley, J., Fierer, N., et al. (2012) Ultra-high-throughput
microbial community analysis on the Illumina HiSeq and
MiSeq platforms. ISME J 6: 1621–1624.Caron, D.A., Countway, P.D., Savai, P., Gast, R.J., Schnetzer,
A., Moorthi, S.D., et al. (2009) Defining DNA-based opera-
tional taxonomic units for microbial-eukaryote ecology. Appl
Environ Microbiol 75: 5797–5808.Collins, C.A., Pennington, J.T., Castro, C.G., Rago, T.A., and
Chavez, F.P. (2003) The California Current system off
824 W. D. Orsi et al.
VC 2017 Society for Applied Microbiology and John Wiley & Sons Ltd, Environmental Microbiology, 20, 815–827
Monterey, California: physical and biological coupling. Deep
Sea Res II 50: 2389–2404.Cuvelier, M.L., Ortiz, A., Kim, E., Moehlig, H., Richardson,
D.E., Heidelberg, J.F., et al. (2008) Widespread distribution
of a unique marine protistan lineage. Environ Microbiol 10:
1621–1634.Dunford, E.A., and Neufeld, J.D. (2010) DNA stable-isotope
probing (DNA-SIP). J Vis Exp 42: pii: 2027.Edgar, R.C. (2004) MUSCLE: a multiple sequence alignment
method with reduced time and space complexity. BMC
Bioinformatics 5: 113.Edgar, R.C. (2010) Search and clustering orders of magnitude
faster than BLAST. Bioinformatics 26: 2460–2461.
Epstein, S., and L�opez-Garcıa, P. (2008) “Missing” protists: a
molecular prospective. Biodivers Conserv Online Early 17:
261–276.Evans, C.A., Archer, S.D., Jacquet, S., and Wilson, W.H.
(2003) Direct estimates of the contribution of viral lysis and
microzooplankton grazing to the decline of a Micromonas
spp. population. Aquat Microb Ecol 30: 207–219.Frias-Lopez, J., Thompson, A., Waldbauer, J., and Chisholm,
S.W. (2009) Use of stable isotope-labelled cells to identify
active grazers of picocyanobacteria in ocean surface
waters. Environ Microbiol 11: 512–525.Gavelis, G.S., Hayakawa, S., White, R.A., III, Gojobori, T.,
Suttle, C.A., Keeling, P.J., and Leander, B.S. (2015) Eye-like
ocelloids are built from different endosymbiotically acquired
components. Nature 523: 204–207.Glaubitz, S., Lueders, T., Abraham, W.R., Jost, G., Jurgens,
K., and Labrenz, M. (2009) isotope analyses reveal that
chemolithoautotrophic Gamma- and Epsilonproteobacteria
feed a microbial food web in a pelagic redoxcline of the
central Baltic Sea. Environ Microbiol 11: 326–337.Gomez, F., Moreira, D., Benzerara, K., and Lopez-Garcia, P.
(2011) Solenicola setigera is the first characterized
member of the abundant and cosmopolitan uncultured
marine stramenopile group MAST-3. Env Microbiol 13:
193–202.Gouy, M., Guindon, S., and Gascuel, O. (2010) SeaView ver-
sion 4: a multiplatform graphical user interface for sequence
alignment and phylogenetic tree building. Mol Biol Evol 27:
221–224.Guillard, R.R.L., and Hargraves, P.E. (1993) Stichochrysis
immobilis is a diatom, not a chrysophyte. Phycologia 32:
234–236.Guo, L., Sui, Z., and Liu, S. (2016) Quantitative analysis of
dinoflagellates and diatoms community via Miseq sequenc-
ing of actin gene and v9 region of 18S rDNA. Sci Rep 6:
34709.Hollande, A., and Cachon, J. (1952) Un parasite des oeufs de
sardine: ichthyodinium chabelardi nov. gen. No. sp. (Peridi-
nien parasite). C R Acad Sci III 235: 967–977.
Hoppenrath, M., Murray, S.A., Chom�erat, N., and Horiguchi,
T. (eds). (2014) Marine Benthic Dinoflagellates – Unveiling
Their Worldwide Biodiversity. Stuttgart, Germany: Schwei-
zerbart. ISBN 978-3-510-61402-8.
Hu, S.K., Liu, Z., Lie, A.A.Y., Countway, P.D., Kim, D.Y., Jones,
A.C., et al. (2015) Estimating protistan diversity using high-
throughput sequencing. J Eukaryot Microbiol 62: 688–693.Hungate, B.A., Mau, R.L., Schwartz, E., Caporaso, J.G.,
Dijkstra, P., van Gestel, N., et al. (2015) Quantitative
microbial ecology through stable isotope probing. Appl Envi-
ron Microbiol 81: 7570–7581.Jeong, H.J., Yoo, Y.D., Kim, J.S., Seong, K.A., Kang, N.S.,
and Kim, T.H. (2010) Growth, feeding and ecological roles
of the mixotrophic and heterotrophic dinoflagellates in
marine planktonic food webs. Ocean Sci J 45: 65–91.Kim, S., and Park, M.G. (2014) Amoebophyra spp. from the
bloom forming dinoflagellate Cochlodinium polykrikoides:
parasites not nested in the “Amoebophrya ceratii complex”.
J Eukaryot Microbiol 61: 173–181.Klaveness, D., Schalchian, T.K., Thomsen, H.A., Elkrem, W.,
and Jakobsen, K.S. (2005) Telonema antarcticum sp. nov.,
a common marine phagotrophic flagellate. Int J Syst Evol
Microbiol 55: 2595–2604.
Knight-Jones, E.W., and Walne, P.R. (1951) Chromulina
pusilla Butcher; a dominant member of the ultraplankton.
Nature 167: 445–446.Kozich, J.J., Westcott, S.L., Baxter, N.T., Highlander, S.K.,
and Schloss, P.D. (2013) Development of a dual-index
sequencing strategy and curation pipeline for analyzing
amplicon sequence data on the MiSeq Illumina sequencing
platform. Appl Environ Microbiol 79: 5112–5120.
Landry, M.R., Selph, K.E., Taylor, A.G., Decima, M., Balch,
W.M., and Bidigare, R. (2011) Phytoplankton growth, graz-
ing and production balances in the HNLC equatorial Pacific.
Deep Sea Res II 58: 524–535.Lie, A.A.Y., Liu, Z., Hu, S.K., Jones, A.C., Kim, D.Y.,
Countway, P.D., et al. (2014) Investigating microbial eukary-
otic diversity from a global census: insights from a compari-
son of pyrotag and full-length sequences of 18S rRNA
genes. Appl Environ Microbiol 80: 4363–4373.
Lin, Y.C., Campbell, T., Chung, C.C., Gong, G.C., Chiang,
K.P., and Worden, A.Z. (2012) Distribution patterns and
phylogeny of marine stramenopiles in the north Pacific
ocean. Appl Environ Microbiol 78: 3387–3399.Lønborg, C., Middelboe, M., and Brussaard, C.P.D. (2013)
Viral lysis of Micromonas pusilla: impacts on dissolved
organic matter production and composition. Biogeochemis-
try 116: 231–240.
Lopes Dos Santos, A., Gourvil, P., Tragin, M., Noel, M.H.,
Decelle, J., Romac, S., and Vaulot, D. (2016) Diversity and
oceanic distribution of prasinophytes clade VII, the domi-
nant group of green algae in oceanic waters. ISME J 11:
512–528.Lueders, T. (2015) DNA- and RNA-based stable isotope prob-
ing of hydrocarbon degraders. In Hydrocarbon and Lipid
Microbiology Protocols. McGenity, T.J. (ed). Berlin Heidel-
berg: Springer-Verlag.Lueders, T., Wagner, B., Claus, P., and Friedrich, M.W. (2004)
Stable isotope probing of rRNA and DNA reveals a dynamic
methylotroph community and trophic interactions with
fungi and protozoa in oxic rice field soil. Environ Microbiol 6:
60–72.Mangot, J.-F., Logares, R., Sanchez, P., Latorre, F.,
Seeleuthner, Y., Mondy, S., et al. (2017) Accessing the
genomic information of unculturable oceanic picoeukar-
yotes by combining multiple single cells. Sci Rep 7: 41498.Massana, R., Balague, V., Guillou, L., and Pedros, A.C.
(2004) Picoeukaryotic diversity in an oligotrohpic coastal
sites studies by molecular and culturing approaches. FEMS
Microbiol Ecol 50: 231–243.
Identifying grazers of picoeukaryotes 825
VC 2017 Society for Applied Microbiology and John Wiley & Sons Ltd, Environmental Microbiology, 20, 815–827
Massana, R., Terrado, R., Forn, I., Lovejoy, C., and Pedros,
A.C. (2006) Distribution and abundance of uncultured het-
erotrophic flagellates in the world oceans. Environ Microbiol
8: 1515–1522.Massana, R., Unrein, F., Rodriguez-Martinez, R., Forn, I.,
Lefort, T., Pinhassi, J., and Not, F. (2009) Grazing rates and
functional diversity of uncultured heterotrophic flagellates.
ISME J 3: 588–596.Massana, R. (2011) Eukaryotic picoplankton in surface
oceans. Annual Review of Microbiology 65: 91–110.Monier, A., Worden, A.Z., and Richards, T.A. (2016) Phyloge-
netic diversity and biogeography of the Mamiellophyceae
lineage of eukaryotic phytoplankton across the oceans.
Environ Microbiol Rep 8: 461–469.Montresor, M., Zingone, A., and Marino, D. (1993) The calcar-
eous resting cyst of Pentapharsodinium tyrrhenicum comb.
nov. (Dinophyceae). J Phycol 29: 223–230.Morando, M., and Capone, D.G. (2016) Intraclade heteroge-
neity in nitrogen utilization by marine prokaryotes revealed
using stable isotope probing coupled with tag sequencing
(Tag-SIP). Front Microbiol 7: 1932.
Nebel, M.E., Wild, S., Holzhauser, M., Huttenberger, L.,
Reitzig, R., Sperber, M., and Stoeck, T. (2010) JAGUC–a
software package for environmental diversity analyses.
J Bioinform Comput Biol 9: 749–773.
Nelson, C.E., and Carlson, C.A. (2012) Tracking differential
incorporation of dissolved organic carbon types among
diverse lineages of Sargasso Sea bacterioplankton. Environ
Microbiol 14: 1500–1516.Neufeld, J.D., Vohra, J., Dumont, M.G., Lueders, T.,
Manefield, M., Friedrich, M.W., and Murrell, J.C. (2007)
DNA stable-isotope probing. Nat Protoc 2: 860–866.Not, F., del Campo, J., Balague, V., de Vargas, C., and
Massana, R. (2009) New insights into the diversity of
marine picoeukaryotes. PLoS ONE 4: e7143.Orsi, W., Edgcomb, V., Jeon, S., Leslin, C., Bunge, J., Taylor,
G.T., et al. (2011) Protistan microbial observatory in the
Cariaco Basin, Caribbean. II. Habitat specialization. ISME J
5: 1357–1373.Orsi, W., Song, Y.C., Hallam, S., and Edgcomb, V. (2012)
Effect of oxygen minimum zone formation on communities
of marine protists. ISME J 6: 1586–15601.Orsi, W., Biddle, J.F., and Edgcomb, V. (2013) Deep sequenc-
ing of subseafloor eukaryotic rRNA reveals active fungi
across marine subsurface provinces. PLoS One 8: e56335.Orsi, W.D., Smith, J.M., Wilcox, H.M., Swalwell, J.E., Carini,
P., Worden, A.Z., and Santoro, A.E. (2015) Ecophysiology
of uncultivated marine euryarchaea is linked to particulate
organic matter. ISME J 9: 1747–1763.Orsi, W.D., Smith, J.M., Liu, S., Liu, Z., Sakamoto, C.M.,
Wilken, S., et al. (2016) Diverse, uncultivated bacteria and
archaea underlying the cycling of dissolved protein in the
ocean. ISME J 10: 2158–2173.Pasulka, A., Samo, T.J., and Landry, M. (2015) Grazer and viral
impacts on microbial growth and mortality in the southern
California Current Ecosystem. J Plankton Res 37: 320–336.Pennington, J.T., Castro, C.G., Collins, C.A., Evans, W.W.I.,
Friederich, G., Michisaki, R.P., and Chavez, F.P. (2010) The
northern and central California coastal upwelling system. In
Carbon and Nutrient Fluxes in Continental Margins. Liu, K.
(ed). Berlin: Springer-Verlag, pp. 29–44.
Piwosz, K., Wiktor, J.M., Niemi, A., Tatarek, A., and Michel, C.
(2013) Mesoscale distribution and functional diversity of
picoeukaryotes in the first-year sea ice of the Canadian
Arctic. ISME J 7: 1461–1471.Saburova, M., Polikarpov, I., and Al-Yamani, F. (2013) First
records of noctilucoid dinoflagellates Abedinium dasypus
and Scaphodinium mirabile (Dinophyceae) from the Indian
Ocean. Mar Biodiversity Rec 6: e46.Sanders, R.W. (1991) Mixotrophic protists in marine and
freshwater ecosystems. J Protozool 38: 76–81.Sanders, R.W., Berninger, U.G., Lim, E.L., Kemp, P.F., and
Caron, D.A. (2000) Heterotrophic and mixotrophic nano-
plankton predation on picoplankton in the Sargasso Sea
and on Georges Bank. Mar Ecol Prog Ser 192: 103–118.Santoro, A.E., Casciotti, K.L., and Francis, C.A. (2010)
Activity, abundance and diversity of nitrifying archaea and
bacteria in the central California Current. Environ Microbiol
12: 1989–2006.
Schloss, P.D., Westcott, S.L., Ryabin, T., Hall, J.R., Hartmann,
M., Hollister, E.B., et al. (2009) Introducing mothur: open-
source, platform-independent, community-supported soft-
ware for describing and comparing microbial communities.
Appl Environ Microbiol 75: 7537–7541.Schmoker, C., Hernandez-Leon, S., and Calbet, A. (2013)
Microzooplankton grazing in the oceans: impacts, data vari-
ability, knowledge gaps and future directions. J Plankton
Res 35: 691–706.Schnepf, E., Drebes, G., and Elbr€achter, M. (1990) Pirsonia gui-
nardiae, gen. et spec. nov.: a parasitic flagellate on the marine
diatom Guinardia flaccida with an unusual mode of food
uptake. Helgol€ander Meeresuntersuchungen 44: 275–293.Simmons, M.P., Sudek, S., Monier, A., Limardo, A.J.,
Jimenez, V., Perle, C.R., et al. (2016) Abundance and bio-
geography of picoprasinophyte ecotypes and other phyto-
plankton in the eastern north Pacific ocean. Appl Environ
Microbiol 82: 1693–1705.Simon, M., Lopez-Garcia, P., Deschamps, P., Moreira, D.,
Restoux, G., Bertolino, P., and Jardillier, L. (2015) Marked
seasonality and high spatial variability of protist communi-
ties in shallow freshwater systems. ISME J 9: 1941–1953.Stoeck, T., Bass, D., Nebel, M., Christe, R., Jones, M.D.H.,
Breiner, H.-W., and Richards, T.A. (2010) Multiple marker
parallel tag environmental DNA sequencing reveals a highly
complex eukaryotic community in marine anoxic water. Mol
Ecol 19: 21–31.Stoecker, D.K. (1999) Mixotrophy among dinoflagellates.
J Eukaryot Microbiol 46: 397–401.Stoecker, D.K., Hansen, P.J., Caron, D.A., and Mitra, A.
(2016) Mixotrophy in the marine plankton. Annu Rev Mar
Sci 9: 2.1–2.15.Strom, S.L. (2008) Microbial ecology of ocean biogeochemis-
try: a community perspective. Science 320: 1043–1045.Tarangkoon, W., Hansen, G., and Hansen, P.J. (2010) Spatial
distribution of symbiont-bearing dinoflagellates in the Indian
Ocean in relation to oceanographic regimes. Aquat Microb
Ecol 58: 197–213.Taylor, F.J.R. (1963) Brachydinium, a new genus of the
Dinococcales from the Indian Ocean. J South Africa Bot 29:
75–78.Thomsen, H.A., and Buck, K.R. (1998) Nanoflagellates of the
central California waters: taxonomy, biogeography and
826 W. D. Orsi et al.
VC 2017 Society for Applied Microbiology and John Wiley & Sons Ltd, Environmental Microbiology, 20, 815–827
abundance of primitive, green flagellates (Pedinophyceae,Prasinophyceae). Deep Sea Res II 45: 1687–1707.
Throndsen, J. (1969) Flagellates of Norwegian coastal waters.
Nytt Magasin Botanikk 16: 161–216.Treusch, A.H., Demir-Hilton, E., Vergin, K., Worden, A.Z.,
Carlson, C., Donatz, M.G., et al. (2012) Phytoplanktondistribution patterns in the northwestern Sargasso Searevealed by small subunit rRNA genes from plastids. ISME
J 6: 481–492.Unrein, F., Gasol, J.M., Not, F., Forn, I., and Massana, R.
(2014) Mixotrophic haptophytes are key bacterial grazers inoligotrophic coastal waters. ISME J 8: 164–176.
de Vargas, C., Audic, S., Henry, N., Decelle, J., Mah�e, F.,
Logares, R., et al. (2015) Ocean plankton. Eukaryotic plank-ton diversity in the sunlit ocean. Science 348: 1261605.
Vd’acny, P., Bourland, W., Orsi, W., Epstein, S.S., andFoissner, W. (2012) Genealogical analyses of multiple lociof litostomatean ciliates (Protista, Ciliophora, Litostomatea).
Mol Phylogenet Evol 65: 397–411.Vørs, N. (1992) Heterotrophic amoebas, flagellates and
heliozoa from arctic marine waters (North-West-Territories,Canada and West Greenland. Polar Biol 13: 113–126.
Ward, B.A., and Follows, M.J. (2016) Marine mixotrophyincreases trophic transfer efficiency, mean organism size,and vertical carbon flux. Proc Natl Acad Sci USA 113:2958–2963.
Worden, A.Z., and Not, F. (2008) Microbial Ecology of the
Oceans. Hoboken, NJ: Wiley, pp. 159–205.Worden, A.Z., Lee, J.-H., Mock, T., Rouz�e, P., Simmons, M.P.,
Aerts, A.L., et al. (2009) Green evolution and dynamic
adaptations revealed by genomes of the marine picoeukar-
yotes Micromonas. Science 324: 268–272.
Worden, A.Z., Follows, M.J., Giovannoni, S.J., Wilken, S.,
Zimmerman, A.E., and Keeling, P.J. (2015) Rethinking the
marine carbon cycle: factoring in the multifarious lifestyles
of microbes. Science 347: 1257594.Wu, W., Huang, B., Liao, Y., and Sun, P. (2014) Picoeukaryotic
diversity and distribution in the subtropical-tropical South
China Sea. FEMS Microb Ecol 89: 563–579.
Supporting information
Additional Supporting Information may be found in the
online version of this article at the publisher’s web-site:
Sup Fig. 1. (A) Distribution of DNA extracted from bottles
after a 24-h incubation with 15N, 13C labelled (solid line) or
unlabelled (dashed line) live M. pusilla. Error bars represent
the ranges in measurements between two replicate bottles.
Shading indicates fractions that were chosen for tag-
amplicon sequencing of 18S rRNA genes. (B) Density gra-
dient distribution of the M. pusilla OTU recovered at 24 h in
the control (dashed line, circles), and isotope labelled
experiment (solid line, triangles) corresponding to the prey
that was added to the bottles at the beginning of the experi-
ment. (C-U) Density gradient distribution of OTUs that con-
sumed M. pusilla (control: dashed lines, labelled incubation:
solid lines).
Identifying grazers of picoeukaryotes 827
VC 2017 Society for Applied Microbiology and John Wiley & Sons Ltd, Environmental Microbiology, 20, 815–827