Embed Size (px)
Citation preview
Identifying Population Demographics of
a Geographical Area that Influence
ATM Usage
Submitted By
Ganga Reddy Papaigari
MBA 2012-14,
IME, IIT Kanpur.
Under the Guidance of
Dr. Raghu Kisore Neelisetti Assistant Professor,
IDRBT, Hyderabad.

INSTITUTE OF DEVELOPMENT AND RESEARCH IN BANKING TECHNOLOGY
(IDRBT)
Road No. 1, Castle Hills, Masab Tank,
Hyderabad-500057
CERTIFICATE
This is to certify that Mr. Ganga Reddy Papaigari, pursuing MBA course in the Department
of Industrial and Management Engineering (IME) at Indian Institute of Technology (IIT),
Kanpur, has undertaken a project as an intern at Institute of Development and Research in
Banking Technology (IDRBT), Hyderabad from May 14, 2013 to July 15, 2013.
He was assigned the project “Identifying Population Demographics of a Geographical Area
that Influence ATM Usage” which he completed successfully under my guidance.
I wish him all the best for all his endeavors.
Dr. Raghu Kisore Neelisetti
(Project Guide)
Assistant Professor
IDRBT, Hyderabad

ACKNOWLEDGEMENT
The successful accomplishment of this project, and the contentment it accounts for would be
incomplete without the mention of people whose ceaseless cooperation made it possible,
whose constant guidance and encouragement crowned all efforts with success.
I would like to express my sincere gratitude to the Institute for Development and Research in
Banking Technology (IDRBT) and particularly Dr. Raghu Kisore Neelisetti, Assistant
Professor, IDRBT who was my guide in this project. I would not hesitate to add that this
short stint in IDRBT has added a different facet to my life as this is a unique organization
being a combination of academics, research, technology, communication services, crucial
applications etc. and at the same time performing roles as an arm of regulation, spread of
technology, facilitator for implementing technology in banking and non-banking system.
I am extremely grateful to Dr. Raghu Kisore Neelisetti for their guidance and useful
critiques of this work.
I am thankful to IME, IIT Kanpur for giving me this opportunity to work in a high-end
research institute like IDRBT.
I would further thank people who participated in the survey, for their cooperation and
suggestions.
Ganga Reddy Papaigari
MBA 2012-14
IME, IIT Kanpur

Contents
Abstract ................................................................................................................................ 6
1. Introduction ....................................................................................................................... 7
1.1 Objective ..................................................................................................................... 7
1.2 Motivation ................................................................................................................... 7
1.3 Related Work ............................................................................................................... 7
1.4 Drawbacks of existing work ......................................................................................... 7
2. Research Framework ...................................................................................................... 8
2.1 Research Questions ...................................................................................................... 8
2.2 Hypotheses .................................................................................................................. 8
2.2.1 Null Hypothesis H1 ............................................................................................... 8
2.2.2 Null Hypothesis H2 ............................................................................................... 8
2.2.3 Null Hypothesis H3 ............................................................................................... 9
2.2.4 Null Hypothesis H4 ............................................................................................... 9
2.3 Collection of Variables ................................................................................................ 9
2.4 Formulation of Research Questions and Hypotheses .................................................... 9
3. Research Method ........................................................................................................... 9
3.1 Sampling Technique .................................................................................................... 9
3.2 Research Design .......................................................................................................... 9
3.2.1 Descriptive Research (Questionnaire in the form of online survey) ........................ 9
3.3 Research Instruments ................................................................................................. 10
3.3.1 Primary Data ....................................................................................................... 10
3.4 Description of questionnaire ...................................................................................... 10
3.5 Procedure................................................................................................................... 10
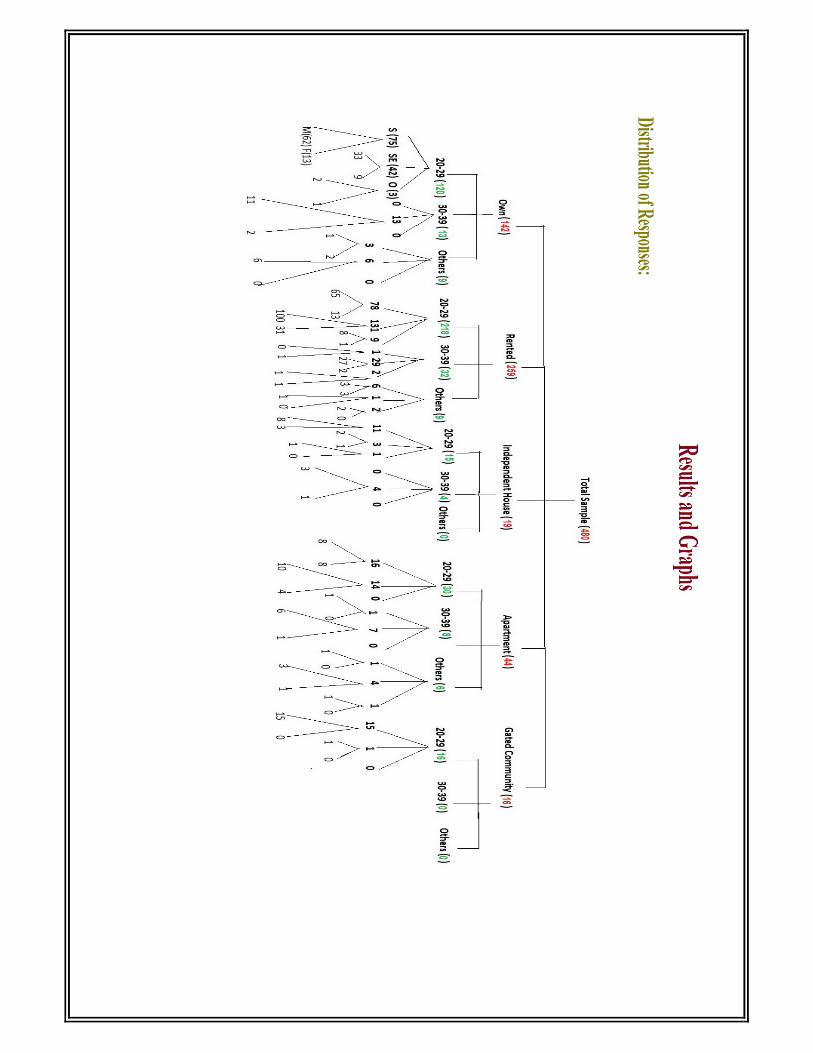
3.5.1 Responses obtained: ............................................................................................ 10
3.6 Data Preparation ........................................................................................................ 11
3.6.1 Questionnaire Checking and Editing .................................................................... 11
3.6.2 Coding ................................................................................................................ 11
3.6.3 Data Transcribing ................................................................................................ 11
3.6.4 Data Cleaning ...................................................................................................... 11
3.7 Data Analysis ............................................................................................................ 11

3.7.1 t-Test and Anova test ........................................................................................... 11
3.7.2 Factor Analysis ................................................................................................... 12
4. Inferences & Findings of the Study .............................................................................. 15
4.1 t-Test and Anova test Analysis ................................................................................... 15
4.2 Factor Analysis .......................................................................................................... 15
5. Conclusions and recommendations of the study ............................................................... 19
5.1 Conclusions ............................................................................................................... 19
5.2 Recommendations for Usage...................................................................................... 19
References .......................................................................................................................... 20
Appendix ............................................................................................................................ 21
Survey Questionnaire ...................................................................................................... 21
ATM Location Survey ................................................................................................. 21

Abstract
ATM has become an essential banking service that is used by banks to provide 24*7 banking
operations. This purpose can be better served if the ATM locations are optimized for better
coverage in a geographical area. The problem of ATM location is further complicated as
customers of one bank can use their debit cards at any other bank ATMs for the first few
transactions in a cycle. Today RBI is contemplating the establishment of white color and
ground level ATMs. These ATMs are in addition to a bank’s own ATM and would be run
and managed by 3rd party agencies.
Given these diverse set of options of ATM running, banks need to have mechanism to
quantitatively measure the benefits of one mechanism over the other. This can only be done
through an appropriate optimizing function. The ability to arrive at such a function can in turn
only be done by knowing the variables that influence ATM usage.
This work aims to identify the parameters that impact a bank ATM location and also identify
relative weights of each of these factors. The parameters that influence ATM usage are
arrived at through an online survey. The online responses were analyzed using Rapid miner
tool. The analysis helped us to qualitatively evaluate people’s preferences for ATM usage.

1. Introduction
1.1 Objective
To identify the population demographics that influence ATM usage at a given location.
1.2 Motivation
Provide banks with a mechanism to quantitatively evaluate the effectiveness of their ATMs.
This is necessary as ATM operation incurs cost in the form of upkeep, security (though
relatively lesser compared to operation of a full-fledged bank) and this cost will become
overburden if underutilized.
1.3 Related Work
Banks keep very detailed customer records, but these records exist in independent business
systems that are organized around products rather than around the customer. In the United
States, business systems are tied together and organized around the customer household in the
Marketing Customer Information File (MCIF). These customer-centric files give banks a
distinct advantage over other business sectors that don't have that data and/or are not as
efficient in the collection of customer data for marketing purposes.
Financial institutions understand the Master Customer Information File (MCIF) contains
valuable information about their customers. Using one of the humblest data elements in
MCIF, the customer's street address, financial service marketers can yield a bonanza of
information. ESRI's Community Tapestry lifestyle data combined with Community Coder
adds the power of lifestyle segmentation to each customer record, essentially telling a bank or
financial institution which consumption category the customer falls within. Summary
demographic reports are included in Community Coder. A bank's own customer databases
enhanced with ESRI's geo-positional technology tells it both where the customers are and
what they "look like." ESRI offers a wide range of enhancement data and automated
reporting that identifies new marketing opportunities and quantifies risk.
1.4 Drawbacks of existing work
In India, there exists no such database for use by banking institutions. Mining for the right
information requires skill and experience that banks may not have.

So we have used an online survey questionnaire to get the customers’ demographic,
geographic, segmentation details and their location preference for the ATM and the
underlying factors.
2. Research Framework
Our research focuses on finding out the individual factors and their significant impact on the
usage of ATM. There are many factors/locations which influence the people to use an ATM
like Multiplexes, Shopping malls, Public transport hubs, etcetera. We have carefully framed
our questionnaire through explorative research and by asking our respondents, the questions
related all these factors.
� Study the population demographics that influence ATM usage at a given location in India.
� Marketing research objective:
a) Factors that influence usage of an ATM
b) Research type: Exploratory &Descriptive
� Research questions and hypothesis
� Research questions and hypothesis
� Data collection:
Online survey among the general public who use ATM.
2.1 Research Questions
In our research we are majorly using two types of questions. One is Objective and another is
Classifying. In classifying questions we are asking gender, age, profession and type of house
he/she currently stays. Through the objective part we are studying their requirement of an
ATM at different places, their attitude towards several attributes (which are important for
ATM usage).
2.2 Hypotheses
2.2.1 Null Hypothesis H1
Age doesn’t have any significant impact on the requirement of ATM by general public.
2.2.2 Null Hypothesis H2
Gender doesn’t have any significant impact on the requirement of ATM by general public.

2.2.3 Null Hypothesis H3
Profession doesn’t have any significant impact on the requirement of ATM by general public.
2.2.4 Null Hypothesis H4
There is no significant difference on the requirement of ATM by different home residents.
2.3 Collection of Variables
Based on general requirement of ATM, we came up with a set of variables. Then, conducting
a test survey based on that and collecting feedbacks from respondents helped us to realize
that some of the variables were correlated. After adjusting for correlation, the number of
variables was reduced down.
2.4 Formulation of Research Questions and Hypotheses
Corresponding to the variables identified in the exploratory research, hypotheses to be tested
were formulated. The hypotheses are discussed in detail later in the report.
3. Research Method
3.1 Sampling Technique
Data was collected by floating the survey online on Facebook and other social networking
sites like Twitter. Also we mailed individuals present in our address book. Non probability
convenience sampling was used.
3.2 Research Design
3.2.1 Descriptive Research (Questionnaire in the form of online survey)
Descriptive research is a type of conclusive research that has major objective of description
of something, usually a market characteristic. It is preplanned and structured. We have used
online survey method to obtain information from the people. The people were asked to fill a
questionnaire depending on their usage requirement of an ATM. Our data collection method
was structured where in formal questionnaire was prepared and questions were asked in
certain order. There was a fixed set of alternatives for each question and they had to make a
choice among those alternatives. Also the purpose of the questionnaire was revealed to the
respondents, so it was a direct method of data collection.

To analyze the responses we have used Factor analysis, t-Test and Anova test. Also Likert
scale is being used for measurement of ATM requirement on scale of 5 (highest) to 1
(lowest).
3.3 Research Instruments
The following research instruments are used for conducting the research:
3.3.1 Primary Data
1. Questionnaire
3.4 Description of questionnaire
In our research we are majorly using two types of questions. One is Objective and another is
Classifying. In classifying questions we are asking gender, age, profession and type of house
he/she currently stays. Through the objective part we are studying their requirement of an
ATM at different places, their attitude towards several attributes (which are important for
ATM usage).
3.5 Procedure
We have designed an online questionnaire through Google Forms.
https://docs.google.com/forms/d/1tGXIzablhigBbE4lSJBko87gxCwURG9CR7pLmh4vAK8/
viewform
Alternate URL:
https://qtrial.qualtrics.com/SE/?SID=SV_9YqVGPDteOO0Tm5
We have floated the link of that through e-mails and sent the link through social networking
sites. The responses were stored in Google docs and Qualtrics. After collecting and
consolidating the required data, we proceeded into analysis part. Then, we have analyzed the
data and drawn conclusion.
3.5.1 Responses obtained: 480

3.6 Data Preparation
3.6.1 Questionnaire Checking and Editing
While doing the test survey, we found that few questions were being left blank initially
because of the inability to comprehend the questions. So we had to revisit the questionnaire
and make appropriate modifications. Some questions were rephrased to give a better
understanding of the questions.
3.6.2 Coding
We have assigned proper codes or number specific to each of the responses for a question.
For example Highest Priority gets 5, Lowest Priority gets 1.
3.6.3 Data Transcribing
As the survey was done online, online form helped in preparing the spread sheet of the
responses at the back end. Then we had to consolidate the responses from Qualtrics (alternate
survey URL).
3.6.4 Data Cleaning
In this process we tried to analyze the reason for the responses which were left unanswered in
the beginning. For example - in the beginning few respondents did not mention their age
group (after which the response was made mandatory in the online form).
3.7 Data Analysis
The data obtained was then prepared in order to make it suitable for analysis using the
software tools like Rapidminer and R. The following tests have been applied to the prepared
data:
3.7.1 t-Test and Anova test
t-Test and Anova test are to find out whether the ATM usage depends on the age of the
individual, gender of the individual, profession of the individual or type of the house the
person stays in.

3.7.2 Factor Analysis
It is used when we have variables that show interdependence. Through this we have reduced
the number of variables to a few factors where each factor contains a set of related variables.


4. Inferences & Findings of the Study
4.1 t-Test and Anova test Analysis
In our project, we have tested the possibility of any relationship between the ATM usage and
age, gender, profession and type of residence.
We found that ATM usage is independent of gender and profession. In both cases, we
obtained P-value to be 0.9007 and 0.8874 respectively. Both the values are greater than 0.05
(5% significance level). Thus the null hypothesis in both these cases cannot be rejected. This
means ATM usage is independent of gender and profession.
But there is significant difference between the responses of different age groups with respect
to ATM usage at the 5% (0.05) significance level. P-value obtained in this case is 0.0006
which is less than 0.05(5% significance level). Thus the null hypothesis in this case can be
rejected. This means that ATM usage is influenced by the age of the individuals.
We noticed that ATM usage is indifferent to the type house the individual stays in. From
Anova test, the P-values obtained in this case for most of the variables is greater than 0.05
(5% significance level). Thus the null hypothesis in this case cannot be rejected. This means
ATM usage is independent of type of residence the individual stays in.
4.2 Factor Analysis
Through explorative research, we identified 23 variables and included them in our
questionnaire. But many of these variables were highly correlated and thus it became
essential to reduce the number of variables to a manageable number. Thus we went for the
factor analysis to identify a new smaller set of uncorrelated factors or dimension, from the
original set of variables.
Step-1
Through Factor analysis we first obtained a correlation matrix and noticed that the variables
are quite correlated and hence factor analysis is a good approach.
Step-2
The method of principle component analysis was followed to get the factors. Thus it provided
us with 19 factors (sufficient to explain 95% of the variance) from Rapidminer.

Component
Standard
Deviation
Proportion of
Variance
Cumulative
Variance
PC 1 3.61 0.373 0.373
PC 2 2.058 0.121 0.495
PC 3 1.437 0.059 0.554
PC 4 1.283 0.047 0.601
PC 5 1.235 0.044 0.645
PC 6 1.138 0.037 0.682
PC 7 1.079 0.033 0.715
PC 8 0.985 0.028 0.743
PC 9 0.97 0.027 0.77
PC 10 0.957 0.026 0.796
PC 11 0.928 0.025 0.821
PC 12 0.901 0.023 0.844
PC 13 0.834 0.02 0.864
PC 14 0.818 0.019 0.883
PC 15 0.776 0.017 0.9
PC 16 0.751 0.016 0.916
PC 17 0.728 0.015 0.932
PC 18 0.713 0.015 0.946
PC 19 0.69 0.014 0.96
PC 20 0.651 0.012 0.972
PC 21 0.637 0.012 0.984
PC 22 0.611 0.011 0.994
PC 23 0.444 0.006 1
Step-3
Determination of factors: We have set an Eigen value of 1. This means only those factors
whose Eigen values are greater than one was retained and remaining were left out as
insignificant factors. Thus only 13 factors were extracted.

This can also be interpreted from the Scree plot where after component number #13 the slope
of the curve became increasingly flatter.
Step-4
Interpretation of factor matrix: Rapidminer then provided us the factor matrix on the basis of
which communalities of the 25 variables were calculated. As for example now from factor
matrix we got -
V1=F1*a1+F2*a2+F3*a3+F4*a4+F5*a5+F6*a6+F7*a7+F8*a8+F9*a9+F10*a10+F11*a
11+F12*a12+F13*a13 where F1…13 are individual factors and a1…13 are the respective factor
loadings. This means correlation between F8 and V1 is a8.
Now sum of the squares of the factor loadings will give us the communality or the total
variance in the variable that is explained by all the 13 factors.
0.9985
0.999
0.9995
1
1.0005
1.001
1.0015
0 1 2 3 4 5 6 7 8 9 10 11 12 13 14 15 16 17 18 19 20 21 22 23 24 25
Eigenvalues
Eigenvalues

Since we could not get a clear distinction between the factors and variables, we went for
rotating the factor matrix. Thus by rotating the factors we obtained neat nonzero significant
loadings for only some of the variables which made the interpretation simple as now we can
clearly categorize all variables under certain specific factors or groups. Varimax rotational
method has been used.
Factors Variables
1 Bus Stations, Railway Stations, Airports
2 Gaming zones, Bar/Clubs/Pubs
3 Shopping Malls, Multiplexes
4 At workplace, At Residence
5 Govt. offices, E-seva Centres
6 Temples
7 Vending Machines
8 Market Places where card payment is not accepted
9 Gated Communities
10 Gas Stations
11 Popular Highway Halts, Tourist Spots
12 Hotels
13 Stadiums
14
The shops where transaction charges are levied on card
payment
15 Hospitals
16 Convenience Stores
Thus from our result we can identify that factor 1 or ‘Public transport hubs’ is by far the most
important factor that can alone explain 11.9% of variation.

5. Conclusions and recommendations of the study
5.1 Conclusions
From the above analysis we can conclude the following:
We started with 23 location variables as points of interest and got a reduced subset of
13-19 factors thru different tests like PCA, Scree test and EFA.
Number of factors with Eigen values greater than 1 is 13.
Number of factors from Scree test is 19.
Number of factors sufficient to explain 95% of the variance (thru Rapidminer) is 19.
We see that the locations like public transport hubs, Shopping Malls/Multiplexes,
Hospitals, Market places where card payment is not accepted, near residential
area/workplace are the places where people highly likely to use the ATM.
This preference varies with the segmentation of the people based on important
demographic and socioeconomic characteristics.
5.2 Recommendations for Usage
The factors identified are indicative and depend on the population demographics in a
given area. Care must be taken by making use of appropriate weight factors so as to
account to variances in the population demographics.
This model doesn't take into possible future growth potential of a given business area.

References
1. H. F. Oliveira, M. B. Gonçalves, E. Souza de Cursi and A. G. Novaes, “A Model
Based On Voronoi Diagrams to Find the best Bus-stop Spacing to Minimize Total
Travel Time of the travelers,” in Proc. Of Eng. Opt., Rio de Janeiro, 2008.
2. W. F. Yushimito, M. Jaller, and S. Ukkusuri, “A Voronoi-Based Heuristic Algorithm
for Locating Distribution Centers in Disasters,” in journal of Netw. Spat. Econ., vol.
12, no. 1, pp. 21-39.
3. A. A. Khanban, A. Edalat, and A. Lieutier, “Computability of partial Delaunay
triangulation and Voronoi diagram,” In Electronic Notes in Theoretical Computer
Science, volume 66. Elsevier, 2002. 4. P. Iamtrakul, K. Teknomo, and K. Hokao, “Evaluation of Public Park Location Using
Voronoi Diagram,” In 9th International Student Seminar on Transport Research
(ISSOT 2003), pp. 146-155, 2003.
5. M. Abellanas, F. Hurtado, C. Icking, R. Klein, E. Langetepe, L. Ma, B. Palop, and V.
Sacrist´an, “Voronoi diagram for services neighboring a highway,” Information
Processing Letters, vol. 86, pp. 283–288, 2003. 6. R. Cheng, Xike Xie, Man Lung Yiu, Jinchuan Chen and Liwen Sun, "UV-diagram: A
Voronoi diagram for uncertain data," In Proc. of IEEE 26th International Conference
on Data Engineering, pp.796-807, 2010.
7. A.B. Mendes and I.H. Themido, "Multi-outlet retail site location assessment," In
International Transactions in Operational Research, vol. 11, no. 1, pp. 1–18, 2004.
8. Antonio G. N. Novaes, J. E. Souza de Cursi, Arinei C. L. da Silva, and C. Souza,
"Solving continuous location-districting problems with Voronoi diagrams," In
Computers and Operation Research, vol. 36, no. 1, pp. 40-59, 2009.
9. Oswin Aichholzer, Franz Aurenhammer, and Belén Palop, "Quickest paths, straight
skeletons, and the city Voronoi diagram," In Proceedings of the eighteenth annual
symposium on Computational geometry, pp. 151-159, 2002.
10. M. Karavelas and M. Yvinec, "Dynamic additively weighted Voronoi diagrams in
2D," In Lecture Notes in Comput. Sci., vol. 2461, Springer, Berlin, 2002, pp. 586–
598. 11. Sunil Arya, Theocharis Malamatos, and David M. Mount, "Space-time tradeoffs for
approximate nearest neighbor searching," In Journal of the ACM, vol. 57, no. 1, 2009. 12. C. M. Gold, P. R. Remmele and T. Roos, "Voronoi methods in GIS," In Algorithmic
Foundations of Geographic Information Systems Lecture Notes in Computer Science, vol. 1340, pp 21-35, 1997.
13. C. Gold, P. Remmele and T. Roos, "Fully Dynamic and Kinematic Voronoi Diagrams in GIS", Algorithmica, 1998.

Appendix
Survey Questionnaire
ATM Location Survey
This survey has been designed to evaluate 'the best location for ATM' and 'the factors considered while choosing an ATM' as part of an
internship undertaken by a student from IIT Kanpur. Please fill the survey and stand a chance to win prize money/item worth Rs.500. The
survey contains 11 questions and it takes approximately 5 min.
* Required
What is your name? (Optional)
What are your contact details? (Optional - This information is only if you want to
participate in the lucky dip for prize money/item worth Rs.500/-)
Email ID
Contact Number
What is your age? *
Are you male or female? *
o Male
o Female
Where do you live in? *
City

*Locality
What is the type of house you live in? *
o Own
o Rented
o Independent house
o Apartment
o Gated Community
What is your Profession? *
What is the nature of your job? *
Rate the below places according to your requirement of an ATM (5 being the highest
and 1 being the lowest). *
1 2 3 4 5
At Workplace
Near Home/Residential Area
Gated Communities
Shopping Malls
Market Places where card

1 2 3 4 5
payment is not accepted
Multiplexes
Hospitals
Bus Stations
Railway Stations
Airports
Government Offices
E-seva Centers
Popular Highway Halts
Gas Stations
Temples
Stadiums
Hotels
Gaming Zones

1 2 3 4 5
Tourist Spots
Bar/Clubs/Pubs
Convenience Stores
Vending Machines
The shops where transaction
charges are levied on card
payment
Rate the factors that you look for in an ATM (5 being the highest and 1 being the
lowest). *
1 2 3 4 5
Proximity
ATM in which you have an
account
History of Bank/ATM
User friendly interface/software
Security
AC

1 2 3 4 5
Low Traffic
Past Experience
Ease of Use
Balance Enquiry
Cash Withdrawal
Quick Cash
Cash Deposit
Change Pin
Change Contact Number
Option to select/skip different
denominations(100,500,1000)
Fixed and Recurring Deposits
Credit Card bill Payment
Utility Services

1 2 3 4 5
Money Transfer
Prepaid mobile recharge
Why do you prefer CASH payment over card payment at POS terminal/Shopping? *
o To avoid surcharges if any
o Concern over security features of the machine
o I prefer card payment
o Other:
Submit