Embed Size (px)
Citation preview

Identifying Optimization Opportunities within KernelExecution in GPU Architectures
Directed Research Project
Robert LimUniversity of Oregon
Eugene, OR [email protected]
Abstract
Tuning codes for GPGPU architectures is challenging because few performancetools can pinpoint the exact causes of execution bottlenecks. While profiling applica-tions can reveal execution behavior with a particular architecture, the abundance ofcollected information can also overwhelm the user. Moreover, performance countersprovide cumulative values but does not attribute events to code regions, which makesidentifying performance hot spots difficult. This research focuses on characterizing thebehavior of GPU application kernels and its performance at the node level by provid-ing a visualization and metrics display that indicates the behavior of the applicationwith respect to the underlying architecture. We demonstrate the effectiveness of ourtechniques with LAMMPS and LULESH application case studies on a variety of GPUarchitectures. By sampling instruction mixes for kernel execution runs, we reveal a va-riety of intrinsic program characteristics relating to computation, memory and controlflow.
1 Introduction
Scientific computing has been accelerated in part due to heterogeneous architectures, suchas GPUs and integrated manycore devices. Parallelizing applications for heterogeneous ar-chitectures can lead to potential speedups, based on dense processor cores, large memoriesand improved power efficiency. The increasing use of such GPU-accelerated systems has mo-tivated researchers to develop new techniques to analyze the performance of these systems.Characterizing the behavior of kernels executed on the GPU hardware can provide feedbackfor further code enhancements and support informed decisions for compiler optimizations.
Tuning a workload for a particular architecture requires in-depth knowledge of the charac-teristics of the application [11]. Workload characterization for general-purpose architecturesusually entails profiling benchmarks with hardware performance counters and deriving per-formance metrics such as instructions per cycle, cache miss rates, and branch mispredictionrates. This approach is limited because hardware constraints such as memory sizes andmultiprocessor cores are not accounted for and can strongly impact the workload character-ization. Moreover, the current profiling methods provide an overview of the behaviors of theapplication in a summarized manner without exposing sufficient low-level details.
1

Time0.0
0.2
0.4
0.6
0.8
1.0
1.2
1.4
1.6
Coun
ts
1e9 LULESH - K40instructionscycles
TimeISTISE
AF1CHGCFBAF2CANAABCVNCPNCKECLE
CMGCMQAMPEEECE1CPECE2CE3CE4EE2CSSUVECCCCHC
Kern
els
LULESH - K40
Figure 1: Sampled hardware counters of instructions executed and active cycles (left) andindividual kernel executions (right), both for LULESH.
Performance tools that monitor GPU kernel execution are complicated by the limitedhardware support of fine-grained kernel measurement and the asynchronous concurrencythat exists between the CPU and GPU. With so many GPUs available, identifying whichapplications will run best on which architectures is not straightforward. Applications thatrun on GPU accelerators are treated like a black box, where measurements can only beread at the start and stop points of kernel launches. Moreover, the difficulty of tracking anddistinguishing which activities are on the CPU versus the GPU makes debugging applicationsa very complicated task. Thus, analyzing static and dynamic instruction mixes can helpidentify potential performance bottlenecks in heterogeneous architectures.
In Figure 1, we show a time series of hardware counters sampled in the GPU, a capabilitywe’ve added in TAU (Section 3.2.2), and kernels that were executed for the LULESH appli-cation. The plot reveals spikes in the hardware samples for the application. However, onecannot correlate those spikes to the dense regions of activities in source code. If timestampswere used to merge GPU events with CPU events for purposes of performance tracing, thetimes will need to be synchronized between host and device [5], as the GPU device has adifferent internal clock frequency than the host. Using timestamps to merge profiles maynot be sufficient, or even correct. Thus, optimizing and tuning the code would require a bestguess effort of where to begin. This motivates our exploration of the use of instruction typemixes in aiding the analysis of potential performance bottlenecks.
1.1 Contributions
In our work, we perform static analysis on CUDA binaries to map source text regions andgenerate instruction mixes based on the CUDA binaries. This feature is integrated withTAU to sample region runs on the GPU. We also provide visualization and analysis toidentify GPU hotspots and optimization opportunities. This helps the user better understandthe application’s runtime behavior. In addition, we repeatedly sample instructions as theapplication executes. To the knowledge of the authors, this work is the first attempt atgaining insight on the behavior of kernel applications on GPUs in real time. With ourmethodology, we can also identify whether an application is compute-bound, memory-bound,or relatively balanced.
2

Figure 2: TAU CUPTI tools framework.
2 Background
This section provides an overview of CUDA-related semantics and events with respect toTAU.
2.1 TAU Performance System
The TAU Parallel Performance Framework [1] provides scalable profile and trace measure-ment and analysis for high-performance parallel applications. TAU provides tools for sourceinstrumentation, compiler instrumentation, and library wrapping that allows CPU eventsto be observed. TAU also offers parallel profiling for GPU-based heterogeneous programs,by providing library wrappings of the CUDA runtime/driver API and preloading of thewrapped library prior to execution (Figure 2). Each call made to a runtime or driver routineis intercepted by TAU for measurement before and after calling the actual CUDA routine.
2.1.1 TAU CUPTI Measurements
TAU collects performance events for CUDA GPU codes asynchronously by tracing an appli-cation’s CPU and GPU activity [10]. An activity record is created, which logs CPU and GPUactivities. Each event kind (e.g. CUpti ActivityMemcpy) represents a particular activity.
CUDA Performance Tool Interface (CUPTI) provides two APIs, the Callback API andthe Event API, which enables the creation of profiling and tracing tools that target CUDAapplications. The CUPTI Callback API registers a callback in TAU and is invoked wheneveran application being profiled calls a CUDA runtime or driver function, or when certain eventsoccur in the CUDA driver. CUPTI fills activity buffers with activity records as correspondingactivities occur on the CPU and GPU. The CUPTI Event API allows the tool to query,configure, start, stop, and read the event counters on a CUDA enabled device.
CUPTI registers callbacks in the following steps. Tau Cupti Subscribe() is invoked,which calls cuptiActivityRegisterCallbacks(). The callback registration creates an ac-tivity buffer, if one has not been created, and registers synchronous events for listening.Within the synchronous event handler, CUPTI activities are declared and parameters areset accordingly. For instance, monitoring a memory copy event would require setting the typeof memory copy (host-to-device, device-to-host, device-to-device, etc.), as well its allocationtype (pinned, paged, device or host).
3

Figure 3: CUPTI callback.
The synchronous event handlers are invoked at synchronous points in the program, whereactivity buffers are read and written. For each activity task that executes, CUPTI logsactivity records at synchronization points that contains the task start and end times. Forthe memory copy example, the amount of bytes transferred, which kernel transferred thosebytes, and start and end timestamps are provided in its activity record.
Callback Method and Asynchronous Buffering The CUPTI Callback API registersa callback in TAU and is invoked whenever an application being profiled calls a CUDAruntime or driver function, or when certain events occur in the CUDA driver (Figure 3).The callback method is a mechanism in the device layer that triggers callbacks on the hostfor registered actions, such as the beginning and ending of a kernel execution. The callbackdomain is grouped into four domains (runtime functions, driver functions, resource tracking,synchronization notification) to make it easier to associate callback functions with groupsof related CUDA functions or events. The subscriber associates each callback function withone or more CUDA API functions and at most one subscriber cuptiSubscribe() at a time,which requires finalizing with cuptiUnsubscribe() before initializing another subscriber.
Asynchronous buffering registers two callbacks, where one is invoked whenever CUPTIneeds an empty activity buffer, and the other is called to deliver a buffer containing oneor more activity records to TAU. CUPTI fills activity buffers with activity records as cor-responding activities that occur on the CPU and GPU. The CUPTI client within TAUprovides empty buffers to ensure that no records are dropped. Enabling a CUPTI activityforces initialization of the activity API, whereas flushing a CUPTI activity forces CUPTIto deliver activity buffers with completed activity records. Reading and writing attributesare handled via cuptiActivityGetAttribute and cuptiActivitySetAttribute calls, re-spectively, which controls how buffering API behaves. activity trace async uses activitybuffer API to collect traces of CPU/GPU activity.
3 Methodology
Our approach to enabling new types of insight into the performance characteristics of GPUkernels includes both static and dynamic measurement and analysis.
4

Figure 4: Overview of our proposed methodology.
IST
ISE
AF1CHG
CFB AF2CAN
AABCVN
CPN CKE CLECM
GCM
QAM
PEE
ECE1 CPE CE2 CE3 CE4 EE
2CSS UVE
CCCCHC
0
500000
1000000
1500000
2000000
2500000
Inst
ruct
ions
LULESH
compute
move
memory
branch
misc
BKNBF PK PV
CBPA
CSK CRK FII
CPC FFI
PBC
AVLAVC
BSL APB UPB0
50000
100000
150000
200000
250000
300000
350000
400000
450000
Inst
ruct
ions
LAMMPScompute
move
memory
branch
misc
Figure 5: Instruction breakdown for M2090, K80, and M6000 for individual kernels inLULESH and LAMMPS applications.
3.1 Static Analysis
Each CUDA code is compiled with CUDA 7.0 v.7.0.17, and the “-g -lineinfo” flags, whichenables tracking of source code location activity within TAU. Each of the generated codefrom nvcc is fed into cuobjdump and nvdisasm to statically analyze the code for instructionmixes and source line information. The generated code is then monitored with TAU, whichcollects performance measurements and dynamically analyzes the code variants.
3.1.1 Binary Utilities
CUDA binaries are disassembled with the binary utilities provided by the NVIDIA SDK. ACUDA binary (cubin) file is an ELF-formatted file, or executable and linkable format, whichis a common standard file format for representing executables, object code, shared librariesand core dumps. By default, the CUDA compiler driver nvcc embeds cubin files into thehost executable file. The objdump command is typically used to obtain disassembled binarymachine code from an executable file, compiled object, or shared library.
cuobjdump extracts information from CUDA binary files (both standalone and thoseembedded in host binaries). The output of cuobjdump includes CUDA assembly code foreach kernel, CUDA ELF section headers, string tables, relocators and other CUDA specificsections. It also extracts embedded PTX text from host binaries. The cubin file is then
5

Category Opcodes
Floating Point FADD, FCHK, FCMP, FFMM, FMNMX, FMUL,FSET, FSETP, FSWZADD, MUFU, RRO, DADD,DFMA, DMNMX, DMUL, DSET, DSETP
Integer BFE, BFI, FLO, IADD, IADD3, ICMP, IMAD,IMADSP, IMNMX, IMUL, ISCADD, ISET, ISETP,LEA, LOP, LOP3, POPC, SHF, SHL, SHR, XMAD
Conversion F2F, F2I, I2F, I2I
Movement MOV, PRMT, SEL, SHFL
Predicate/CC CSET, CSETP, PSET, PSETP, P2R, R2P
Texture TEX, TLD, TLD4, TxQ, TEXS, TLD4S, TLD5
Load/Store LD, LDC, LDG, LDL, LDS, ST, STG, STL, STS,ATOM, ATOMS, RED, CCTL, CCTLL, MEMBAR,CCTLT
Surface Memory SUATOM, SULD, SURED, SUST
Control BRA, BRX, JMP, JMX, SSY, CAL, JCAL, PRET,RET, BRK, PBK, CONT, PCNT, EXIT, BPT
Miscellaneous NOP, CS2R, S2R, B2R, BAR, R2B, VOTE
Table 1: Instruction mixes broken down according to categories.
fed to nvidsasm, which outputs assembly code for each kernel, listings of ELF data sections,and other CUDA-specific sections. Instruction mixes such as floating-point operations andload/store operations are extracted from the assembly code, along with source line informa-tion.
3.1.2 Instruction Breakdown
We start the analysis by categorizing the executed instructions from the disassembled binaryoutput. Table 1 displays the opcodes from nvcc-generated binaries, categorized according toinstruction types.
Figure 5 displays the instruction breakdown for individual kernels in LULESH andLAMMPS applications for M2090, K80 and M6000 architectures (one per generation). ForLAMMPS, the PK kernel shows more computational operations, whereas FII and PBCshows more move operations. For the LULESH kernels CKE, CMG, and CE2 we observemore compute-intensive operations, as well as branches, and moves. One thing to note isthat the Maxwell architectures (M6000) in general shows more compute operations for allkernels in LULESH, whereas the M2090 makes use of more operations in LAMMPS.
3.2 Dynamic Analysis
The TAU Parallel Performance System monitors various CUDA activities, such as memorytransfers and concurrent kernels executed. TAU also tracks source code locator activities, asdescribed below. Hardware counter sampling for CUPTI is also implemented in TAU andis enabled by passing the “ebs” flag to the tau exec command line [4]. In addition, theenvironment variable TAU METRICS is set with events to sample. TAU lists CUPTI eventsavailable for a particular GPU with the tau cupti avail command. For our experiments,we monitored instructions executed and active cycles, since those events are available across
6

all GPUs.For each of the sampled regions from the source locator activity, the instruction mixes and
line information that was collected from the static analyzer is attributed to those locations.This gives precise information on what instructions are being executed in real time.
3.2.1 Source Code Locator Activity
Source code locator information is an activity within the CUPTI runtime environment thatmakes possible logging of CUPTI activity. Instructions are sampled at a fixed rate of 20 ms.Within each sample, the following events are collected: threads executed, instructions exe-cuted, source line information, kernels launched, timestamps, and program counter offsets.Our research utilizes the information collected from the source code locator and instructionexecution activities. The activity records are collected as profiles and written out to disk forfurther analysis.
3.2.2 Hardware counter sampling
Hardware counter sampling provides a mechanism to periodically read CUPTI counters,where the event API samples event values while kernels are executing. Hardware countersampling is integrated in TAU and builds upon previous event-based measurement efforts[4]. The event collection mode is set to “continuous” so that event counters run continuously.Two threads are used in event sampling, where one thread schedules the kernels and memorytransfers that perform the computation, while another thread wakes up periodically to samplean event counter. When sampling hardware counters, there is no correlation of the eventsamples with what is happening on the GPU. GPU timestamps provide coarse correlationat the time of the sample and also at other points of interest in the application.
The CUPTI Event API provides a means to query, configure, start, stop, and read theevent counters on a CUDA-enabled device. An event is a countable activity, action, oroccurrence on a device, which is assigned a unique identifier. A named event represents thesame activity, action, or occurrence on all device types. Each event is placed in one of thecategories defined by CUpti EventCategory, which describes the general type of activity,action, or occurrence measured by the event. A device exposes one or more event domains,where each event domain represents a group of related events that are managed togetherand must belong to the same domain. The number and type of events that can be added toan event group are subject to device-specific limits.
3.2.3 Runtime Mapping of Instruction Mixes to Source Code Location
Using the source locator activity discussed in Section 3.2.1, we statically collect instructionmixes and source code locations from generated code and map the instruction mixes to thesource locator activity as the program is being run. The static analysis of CUDA bina-ries produces an objdump file, which provides assembly information, including instructionoperations, program counter offsets, and line information. We attribute the static analysisfrom the objdump file to the profiles collected from the source code activity to provide run-time characterization of the GPU as it is being executed on the architecture. This mappingof static and dynamic profiles provides a rich understanding of the behavior of the kernelapplication with respect to the underlying architecture.
7

3.3 Instruction Operation Metrics
We define several instruction operation metrics derived from our methodology as follows.These are examples of metrics that can be used to relate the instruction mix of a kernelwith a potential performance bottleneck. Let opj represent the different types of operations,timeexec equal the time duration for one kernel execution (ms), and callsn represent thenumber of unique kernel launches for that particular kernel.
Efficiency metric describes flops per second, or how well the floating point units areeffectively utilized:
efficiency =opfp + opint + opsimd + opconv
timeexec· callsn (1)
Impact metric describes the performance contribution of a particular kernel with respectto the overall application:
impact =
∑j∈J opj∑
i∈I∑
j∈J opi,j· callsn (2)
Individual metrics for computational intensity, memory intensity and control intensitycan be calculated as follows:
FLOPS =opfp + opint + opsimd + opconv∑
j∈J opj· callsn (3)
MemOPS =opldst + optex + opsurf∑
j∈J opj· callsn (4)
CtrlOPS =opctrl + opmove + oppred∑
j∈J opj· callsn (5)
4 Analysis
We use the LAMMPS and LULESH applications to demonstrate the new static and dynamicmeasurement and analysis capabilities.
4.1 Applications
4.1.1 LAMMPS
The Large-scale Atomic/Molecular Massively Parallel Simulator [12] is a molecular dynamicsapplication that integrates Newton’s equations of motion for collections of atoms, molecules,and macroscopic particles. Developed by Sandia National Laboratories, LAMMPS simulatesshort- or long-range forces with a variety of initial and/or boundary conditions. For compu-tational efficiency LAMMPS uses neighbor lists to keep track of nearby particles, which areoptimized for systems with particles that are repulsive at short distances so that the localdensity of particles never become too large. On parallel machines, LAMMPS uses spatial-decomposition techniques to partition the simulation domain into small 3D sub-domains,where each sub-domain is assigned to a processor. LAMMPS-CUDA offloads neighbor andforce computations to GPUs while performing time integration on CPUs. In this work, wefocus on the Lennard-Jones (LJ) benchmark, which approximates the interatomic potentialbetween a pair of neutral atoms or molecules.
8
4.1.2 LULESH
The Livermore Unstructured Lagrange Explicit Shock Hydrodynamics (LULESH) [13] is ahighly simplified application that solves a Sedov blast problem, which represents numericalalgorithms, data motion, and programming styles typical in scientific applications. Devel-oped by Lawrence Livermore National Laboratory as part of DARPA’s Ubiquitous High-Performance Computing Program, LULESH approximates the hydrodynamics equation dis-cretely by partitioning the spatial problem domain into a collection of volumetric elementsdefined by a mesh. Modeling hydrodynamics describes the motion of materials relative toeach other when subject to forces. LULESH is built on the concept of an unstructured hexmesh, where a node represents a point where mesh lines intersect. In this paper, we studythe LULESH-GPU implementation with TAU.
4.2 Methodology
We profile LULESH and LAMMPS applications on seven different GPUs (listed in [3]) withthe TAU Parallel Performance System. Next, we calculate the performance of the kernelfor one pass. Then, we apply the metrics from Section 3.3 to identify potentially poorlyperforming kernels that can be optimized. Note that callsn, which represents the number oftimes a particular routine is called, can easily be collected with TAU profiling. The overheadassociated with running the static analysis of our tool is equivalent to compiling the codeand running the objdump results through a parser.
4.3 Results
Figure 7 shows statically analyzed heatmap representations for LAMMPS and LULESH onvarious architectures. The x-axis represents the kernel name (listed in Appendix of [3]),while the y-axis lists the type of instruction mix. For LAMMPS, overall similarities existwithin each architecture generation (Tesla vs. Maxwell), where Maxwell makes greater useof the control and floating-point operations, while Tesla makes greater use of the conversionoperations. The GTX980 makes use of predicate instructions, as indicated in top row of thebottom-middle plot. For LULESH, more use of predicate and conversion operations showup in Fermi and Tesla architectures, versus Maxwell which utilizes SIMD instructions forboth AF1 and AF2 kernels. Load/store instructions are particularly heavy in M2090 andthe GTX480 for the CKE kernel.
Figure 6 displays results for individual metrics for FLOPS, memory operations and con-trol operations for the top five poor performing kernels for each architecture. Poor per-forming kernels were determined using the impact metric. FLOPS and branch instructionswere higher in general for LULESH on the Maxwell architectures, when compared to Tesla.The M2090 architecture showed higher memory operations for the CKE kernel and for allLAMMPS kernels. The M2090 has a smaller global memory compared to Tesla (5 GB vs11.5 GB), and a smaller L2 cache compared to Maxwell (0.8 MB vs. 3.1 MB), which explainsits poor memory performance.
Figure 8 compares divergent branches over total instructions in GPU codes using hard-ware counters and instruction mix sampling for the top twelve kernels in LULESH, calculatedwith the CtrlOPS metric. The dotted line separates the different approaches, indicatingthat in all cases the instruction mix method was able to detect divergent paths. The kernelsthat are closest to the y-axis represent divergent paths that weren’t detected with hardware
9
CKE CMGCE2 CFB CCC
0.00.51.01.52.02.5
FLOP
S
1e9 LULESH - FLOPS
CKE CMGCE2 CFB CCC
0.00.20.40.60.81.01.2
Cont
rol
1e9 LULESH - Branch
CKE CHG ISE CFB CCC0.00.51.01.52.02.5
Mem
ory
1e8 LULESH - Memory
PK CPC FII PVC BK
LAMMPS - FLOPS
PK CPC FII PVC
PBC
LAMMPS - Branch
PK CPC FII PVC
NBF
LAMMPS - Memory
k20xk40k80m2090gtx980m6000
Figure 6: Floating point, control and memory intensity for top five individual kernels inLULESH and LAMMPS applications.
counters (about 33%), which further affirms the counter’s inconsistencies in providing accu-rate measurements. Our methodology was able to precisely detect divergent branches forkernels that exhibited that behavior.
Figure 9 shows the correlation of computation intensity with memory intensity (nor-malized) for all seven architectures for the LAMMPS application. For static, input-size-independent analysis (left), differences in code generated are displayed for different archi-tectures. However, the figure in the right shows the instruction mixes for runtime data andreflects that there isn’t much of a difference in terms of performance across architectures.Nevertheless, by using our static analysis tool, we were able to identify four of the top fivetime-consuming kernels based only on instruction mix data.
5 Related Work
There have been attempts to assess the kernel-level performance of GPUs. However, notmuch has been done to provide an in-depth analysis of activities that occur inside the GPU.
Distributed with CUDA SDK releases, NVIDIA’s Visual Profiler (NVP) [7] has a suiteof performance monitoring tools that focuses on CUDA codes. NVP traces the execution ofeach GPU task, recording method name, start and end times, launch parameters, and GPUhardware counter values, among other information. NVP also makes use of the source codelocator activity by displaying source code alongside PTX assembly code. However, NVPdoesn’t quantify the use of instruction mixes which differs from our work.
G-HPCToolkit [14] characterizes kernel behavior by looking at idleness analysis viablame-shifting and stall analysis for performance degradation. In this work, the authorsquantify CPU code regions that execute when a GPU is idle, or GPU tasks that executewhen a CPU thread is idle, and accumulate blame to the executing task proportional to the
10

ISTISEAF1CHGCFBAF2CAN
AABCVN
CPNCKECLECMG
CMQAMP
EEECE1CPECE2CE3CE4EE
2CSSUVE
CCCCHC
fpsurf
convctrlint
ldstmovemisc
texsimdpred
gtx480
ISTISEAF1CHGCFBAF2CAN
AABCVN
CPNCKECLECMG
CMQAMP
EEECE1CPECE2CE3CE4EE
2CSSUVE
CCCCHC
k40
ISTISEAF1CHGCFBAF2CAN
AABCVN
CPNCKECLECMG
CMQAMP
EEECE1CPECE2CE3CE4EE
2CSSUVE
CCCCHC
k80
ISTISEAF1CHGCFBAF2CAN
AABCVN
CPNCKECLECMG
CMQAMP
EEECE1CPECE2CE3CE4EE
2CSSUVE
CCCCHC
fpsurf
convctrlint
ldstmovemisc
texsimdpred
m2090
ISTISEAF1CHGCFBAF2CAN
AABCVN
CPNCKECLECMG
CMQAMP
EEECE1CPECE2CE3CE4EE
2CSSUVE
CCCCHC
gtx980
ISTISEAF1CHGCFBAF2CAN
AABCVN
CPNCKECLECMG
CMQAMP
EEECE1CPECE2CE3CE4EE
2CSSUVE
CCCCHC
m6000
LULESH
BKNBF PK PV
CBPA CSK CRK FII CPC FF
IPB
CAVL
AVCBSL APB UPB
fpsurf
convctrlint
ldstmovemisc
texsimdpred
gtx480
BKNBF PK PV
CBPA CSK CRK FII CPC FF
IPB
CAVL
AVCBSL APB UPB
k40
BKNBF PK PV
CBPA CSK CRK FII CPC FF
IPB
CAVL
AVCBSL APB UPB
k80
BKNBF PK PV
CBPA CSK CRK FII CPC FF
IPB
CAVL
AVCBSL APB UPB
fpsurf
convctrlint
ldstmovemisc
texsimdpred
m2090
BKNBF PK PV
CBPA CSK CRK FII CPC FF
IPB
CAVL
AVCBSL APB UPB
gtx980
BKNBF PK PV
CBPA CSK CRK FII CPC FF
IPB
CAVL
AVCBSL APB UPB
m6000
LAMMPS
Figure 7: Heatmap for micro operations for LULESH and LAMMPS benchmarks on variousGPU architectures.
11

GTX480 K20x K40 K80 M2090 GTX980 M6000
CUDA Capability 2 3.5 3.5 3.7 2 5.2 5.2Global Memory (MB) 1156 5760 11520 11520 5375 4096 12288
Multiprocessors 15 14 15 13 16 16 24CUDA Cores per MP 32 192 192 192 32 128 128
CUDA Cores 480 2688 2880 2496 512 2048 3072GPU Clock Rate (MHz) 1400 732 745 824 1301 1216 1114
Memory Clock Rate (MHz) 1848 2600 3004 2505 1848 3505 3305L2 Cache Size (MB) 0.786 1.572 1.572 1.572 0.786 2.097 3.146
Constant Memory (bytes) 65536 65536 65536 65536 65536 65536 65536Shared Memory (bytes) 49152 49152 49152 49152 49152 49152 49152
Registers per Block 32768 65536 65536 65536 32768 65536 65536Warp Size 32 32 32 32 32 32 32
Max Threads per MP 1536 2048 2048 2048 1536 2048 2048Max Threads per Block 1024 1024 1024 1024 1024 1024 1024
Architecture Family Fermi Tesla Tesla Tesla Tesla Maxwell Maxwell
Table 2: Graphic processors used in this experiment.
0.000 0.001 0.002 0.003 0.004 0.005 0.006
Hardware Counter Rate
0.000
0.005
0.010
0.015
0.020
0.025
0.030
0.035
0.040
Inst
ruct
ion M
ix R
ate
Divergent/Instructions Metric (LULESH)
M6000
M2090
GTX480
GTX980
0 1000000 2000000 3000000 4000000 5000000
Average Time
ISTISE
AF1CHGCFBAF2CANAABCVNCPNCKECLE
CMGCMQAMPEEECE1CPECE2CE3CE4EE2CSSUVECCCCHC
LULESH
gtx480
k40
k80
m2090
gtx980
m6000
Figure 8: Two approaches to measuring divergent branches: instruction mix sampling, andhardware counters. Average execution times for individual kernels, both for LULESH appli-cations.
12

Figure 9: Static (left) and dynamic (right) analyses for various architectures showing per-formance of individual kernels in LAMMPS.
idling task. Vampir [8] also does performance measurements for GPUs. They look at thetrace execution at the start and stop times and provide a detailed execution of timing ofkernel execution, but do not provide activities that behave inside the kernel. The authors[16] have characterized PTX kernels by creating an internal representation of a program andrunning it on an emulator, which determines the memory, control flow and parallelism ofthe application. This work closely resembles ours, but differs in that we perform workloadcharacterization on actual hardware during execution.
Other attempts at modeling performance execution on GPUs can be seen in [19] and [20].These analytical models provide a tractable solution to calculate GPU performance whengiven input sizes and hardware constraints. Our work is complementary to those efforts, inthat we identify performance execution of kernels using instruction mixes.
6 Conclusion and Future Work
Monitoring performance on accelerators is difficult because of the lack of visibility in GPUexecution and the asynchronous behavior between the CPU and GPU. Sampling instruc-tion mixes in real time can help characterize the application behavior with respect to theunderlying architecture, as well as identify the best tuning parameters for kernel execution.
In this research, we provide insight on activities that occur inside the GPU. In partic-ular, we characterize the performance of execution at the kernel level based on sampledinstruction mixes. In future work, we want to address the divergent branch problem, aknown performance bottleneck on accelerators, by building control flow graphs that modelexecution behavior. In addition, we plan to use the sampled instruction mixes to predictperformance parameters and execution time for the Orio code generation framework [9]. Thegoal is to substantially reduce the number of empirical tests for kernels, which will result inrapid identification of best performance tuning configurations.
13

7 Acknowledgements
We want to thank Duncan Poole and J-C Vasnier of NVIDIA for providing early access toCUDA 7.0 and to the PSG Clusters. This work is supported by the Department of Energy(Award #DE-SC0005360) for the project “Vancouver 2: Improving Programmability ofContemporary Heterogeneous Architectures.”
References
[1] S. Shende, and A. Malony. The TAU parallel performance system. International Journalof High Performance Computing Applications, 2006.
[2] S. Browne, J. Dongarra, N. Garner, G. Ho, and P. Mucci. A Portable ProgrammingInterface for Performance Evaluation on Modern Processors,” International Journal ofHigh Performance Computing Applications, June 2000.
[3] R. Lim. Identifying Optimization Opportunities within Kernel Launches in GPU Archi-tectures University of Oregon, CIS Department, Technical Report.
[4] A. Morris, A. Malony, S. Shende, and K. Huck. Design and implementation of a hy-brid parallel performance measurement system. International Conference on ParallelProcessing (ICPP), IEEE, 2010.
[5] R. Dietrich, T. Ilsche, and G. Juckeland . Non-intrusive Performance Analysis of ParallelHardware Accelerated Applications on Hybrid Architectures First International Work-shop on Parallel Software Tools and Tool Infrastructures (PSTI 2010), IEEE ComputerSociety, 2010.
[6] Intel VTune Amplifier. https://software.intel.com/en-us/intel-vtune-amplifier-xe
[7] NVIDIA Visual Profiler. https://developer.nvidia.com/nvidia-visual-profiler
[8] A. Knpfer, H. Brunst, J. Doleschal, M. Jurenz, M. Lieber, H. Mickler, M. Mller, andW. Nagel. ”The VAMPIR performance analysis tool-set.” In Tools for High PerformanceComputing, pp. 139-155. Springer Berlin Heidelberg, 2008.
[9] A. Hartono, B. Norris, and P. Sadayappan. Annotation-based empirical performance tun-ing using Orio. International Symposium on Parallel & Distributed Processing (IPDPS).IEEE, 2009.
[10] A. Malony, S. Biersdorff, S. Shende, H. Jagode, S. Tomov, G. Juckeland, R. Dietrich,D. Poole, and C. Lamb. Parallel performance measurement of heterogeneous parallelsystems with GPUs. IEEE International Conference on Parallel Processing (ICPP),2011.
[11] Y. Shao, and D. Brooks. “ISA-independent workload characterization and its implica-tions for specialized architectures.” IEEE International Symposium Performance Anal-ysis of Systems and Software (ISPASS), 2013.
[12] S. Plimpton. Fast parallel algorithms for short-range molecular dynamics. Journal ofComputational Physics 117, no. 1 (1995): 1-19.
14

[13] I. Karlin, A. Bhatele, B. Chamberlain, J. Cohen, Z. Devito, M. Gokhale, R. Haque etal. Lulesh programming model and performance ports overview Lawrence LivermoreNational Laboratory (LLNL), Livermore, CA, Tech. Rep (2012).
[14] M. Chabbi, K. Murthy, M. Fagan, and J. Mellor-Crummey. Effective sampling-drivenperformance tools for GPU-accelerated supercomputers. International Conference forHigh Performance Computing, Networking, Storage and Analysis (SC). IEEE, 2013.
[15] N. Farooqui, A. Kerr, G. Eisenhauer, K. Schwan, and S. Yalamanchili. Lynx: A dy-namic instrumentation system for data-parallel applications on GPGPU architectures.International Symposium on Performance Analysis of Systems and Software (ISPASS),IEEE, 2012.
[16] A. Kerr, G. Andrew, and S. Yalamanchili. A characterization and analysis of ptx kernels.International Symposium on Workload Characterization (IISWC), IEEE 2009.
[17] V. Weaver, D. Terpstra and S. Moore Non-Determinism and Overcount on ModernHardware Performance Counter Implementations. ISPASS Workshop, April 2013.
[18] R. Lim, D. Carrillo-Cisneros, W. Alkowaileet, and I. Scherson Computationally EfficientMultiplexing of Events on Hardware Counters. Linux Symposium, July 2014
[19] S. Hong, and H. Kim. An analytical model for a GPU architecture with memory-leveland thread-level parallelism awareness. ACM SIGARCH Computer Architecture News,ACM, 2009.
[20] H. Kim, R. Vuduc, S. Baghsorkhi, J. Choi, and W. Hwu Performance Analysis andTuning for General Purpose Graphics Processing Units (GPGPU). Morgan & ClaypoolPublishers, 2012.
8 Appendix
8.1 Applications
15
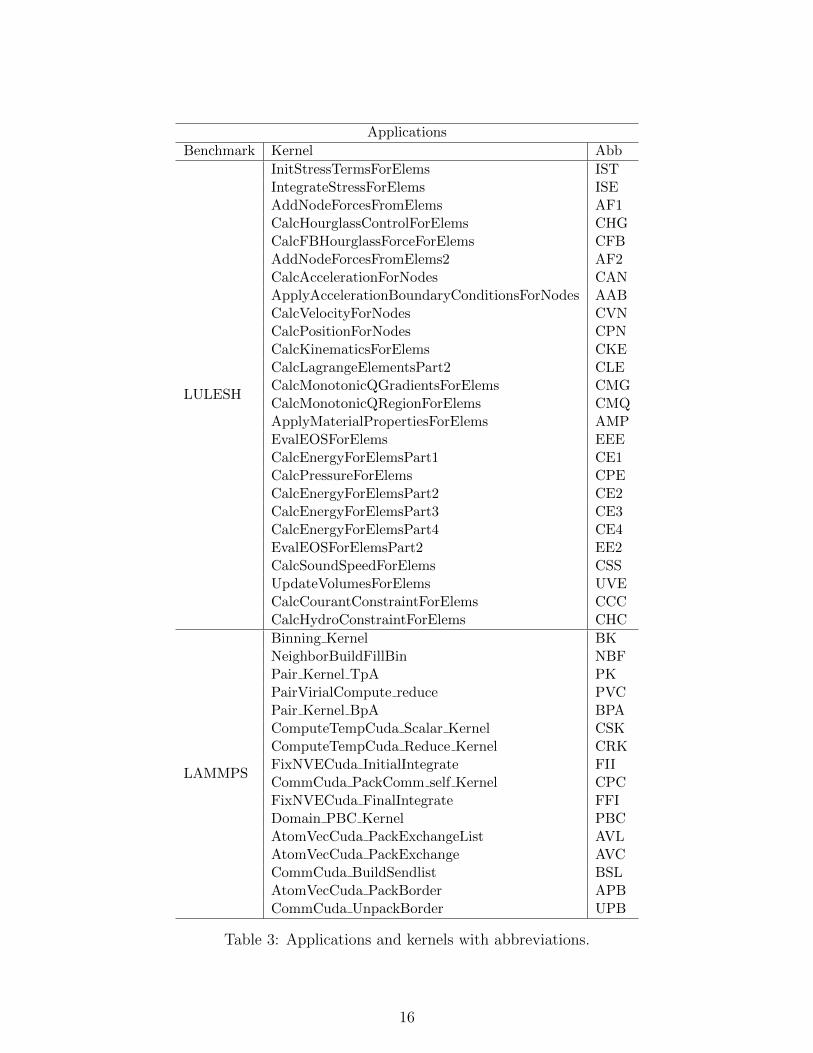
Applications
Benchmark Kernel Abb
LULESH
InitStressTermsForElems ISTIntegrateStressForElems ISEAddNodeForcesFromElems AF1CalcHourglassControlForElems CHGCalcFBHourglassForceForElems CFBAddNodeForcesFromElems2 AF2CalcAccelerationForNodes CANApplyAccelerationBoundaryConditionsForNodes AABCalcVelocityForNodes CVNCalcPositionForNodes CPNCalcKinematicsForElems CKECalcLagrangeElementsPart2 CLECalcMonotonicQGradientsForElems CMGCalcMonotonicQRegionForElems CMQApplyMaterialPropertiesForElems AMPEvalEOSForElems EEECalcEnergyForElemsPart1 CE1CalcPressureForElems CPECalcEnergyForElemsPart2 CE2CalcEnergyForElemsPart3 CE3CalcEnergyForElemsPart4 CE4EvalEOSForElemsPart2 EE2CalcSoundSpeedForElems CSSUpdateVolumesForElems UVECalcCourantConstraintForElems CCCCalcHydroConstraintForElems CHC
LAMMPS
Binning Kernel BKNeighborBuildFillBin NBFPair Kernel TpA PKPairVirialCompute reduce PVCPair Kernel BpA BPAComputeTempCuda Scalar Kernel CSKComputeTempCuda Reduce Kernel CRKFixNVECuda InitialIntegrate FIICommCuda PackComm self Kernel CPCFixNVECuda FinalIntegrate FFIDomain PBC Kernel PBCAtomVecCuda PackExchangeList AVLAtomVecCuda PackExchange AVCCommCuda BuildSendlist BSLAtomVecCuda PackBorder APBCommCuda UnpackBorder UPB
Table 3: Applications and kernels with abbreviations.
16